
Microscopic dynamic observation of adhesion hysteresis ...
16
Friction 9(4): 758–773 (2021) ISSN 2223-7690 https://doi.org/10.1007/s40544-020-0372-5 CN 10-1237/TH RESEARCH ARTICLE Microscopic dynamic observation of adhesion hysteresis friction and exploration of the influence of different pressures on friction transmission Cun-ao FENG 1,2 , De-kun ZHANG 3,* Kai CHEN 3 1 School of Mechatronic Engineering, China University of Mining and Technology, Xuzhou 221116, China 2 Department of Mechanical Engineering, University of British Columbia, Vancouver V6T1Z4, Canada 3 School of Materials Science and Engineering, China University of Mining and Technology, Xuzhou 221116, China Received: 23 April 2019 / Revised: 05 September 2019 / Accepted: 12 February 2020 © The author(s) 2020. Abstract: The mechanism of adhesive friction between viscoelastic materials is a key question. In this study, the friction process of the adhesive interface between a friction lining and a wire rope is dynamically observed in real time to analyze the adhesion hysteresis friction intuitively and quantitatively. The adhesion is determined by the state of motion, while the relative displacement of the wire rope and lining is used to find the magnitude of the adhesive friction. The hysteresis friction is reflected by the internal deformation of the lining. The magnitude of the hysteresis friction is determined by the displacement difference (Δx) in the sliding direction of two marked points at different distances from the contact surface. The results show that the adhesion friction is proportional to the loss modulus and the hysteresis friction is proportional to the ratio of the loss modulus to the square of the storage modulus (E"/(E' 2 )). The frictional vibration first decreases and then increases with the increase in pressure. The K25 lining has the highest adhesion hysteresis friction and minimal frictional vibration. The result provides a simple and intuitive method for research into the friction transmission and vibration of viscoelastic materials. Keywords: adhesion hysteresis friction; viscoelasticity; frictional vibration; dynamic monitoring 1 Introduction China is paying increasing attention to the long-term safety and mechanization of coal mining. Mining is also being modernized, and the application of multi-rope friction hoist is becoming widespread [1, 2]. The multi-rope friction hoist mainly relies on the friction between the friction lining on the friction wheel and the wire rope. Friction is the key factor in ensuring safety. The friction lining is a viscoelastic material, meaning there is adhesion hysteresis friction between the friction lining and the wire rope. During the friction process, the lining will continuously adhere, deform, and break, generating vibration [3, 4]. Moreover, the wire rope is a flexible body, and elastoplastic deformation occurs after being stressed. The trans- mission of vibration through the flexible wire rope will also continue to increase. Therefore, once a slight vibration generated at the friction pair, the transmission in a kilometer-long flexible wire rope results in a large vibration shake to the lifting container. The vibration is a great hazard to the entire lifting system [5]. Therefore, it is very important to explore the mechanism of adhesion hysteresis friction and its influencing factors in the process of friction transmission. Adhesive friction is the force at which adhesion occurs at the interface to hinder sliding. Hysteresis friction is a repetitive periodic deformation of a * Corresponding author: De-kun ZHANG, E-mail: [email protected]
Transcript of Microscopic dynamic observation of adhesion hysteresis ...

Friction 9(4): 758–773 (2021) ISSN 2223-7690 https://doi.org/10.1007/s40544-020-0372-5 CN 10-1237/TH
RESEARCH ARTICLE
Microscopic dynamic observation of adhesion hysteresis friction and exploration of the influence of different pressures on friction transmission
Cun-ao FENG1,2, De-kun ZHANG3,* Kai CHEN3 1 School of Mechatronic Engineering, China University of Mining and Technology, Xuzhou 221116, China 2 Department of Mechanical Engineering, University of British Columbia, Vancouver V6T1Z4, Canada 3 School of Materials Science and Engineering, China University of Mining and Technology, Xuzhou 221116, China
Received: 23 April 2019 / Revised: 05 September 2019 / Accepted: 12 February 2020
© The author(s) 2020.
Abstract: The mechanism of adhesive friction between viscoelastic materials is a key question. In this study, the
friction process of the adhesive interface between a friction lining and a wire rope is dynamically observed in
real time to analyze the adhesion hysteresis friction intuitively and quantitatively. The adhesion is determined
by the state of motion, while the relative displacement of the wire rope and lining is used to find the magnitude
of the adhesive friction. The hysteresis friction is reflected by the internal deformation of the lining. The
magnitude of the hysteresis friction is determined by the displacement difference (Δx) in the sliding direction
of two marked points at different distances from the contact surface. The results show that the adhesion friction
is proportional to the loss modulus and the hysteresis friction is proportional to the ratio of the loss modulus to
the square of the storage modulus (E"/(E'2)). The frictional vibration first decreases and then increases with the
increase in pressure. The K25 lining has the highest adhesion hysteresis friction and minimal frictional vibration.
The result provides a simple and intuitive method for research into the friction transmission and vibration of
viscoelastic materials.
Keywords: adhesion hysteresis friction; viscoelasticity; frictional vibration; dynamic monitoring
1 Introduction
China is paying increasing attention to the long-term
safety and mechanization of coal mining. Mining is also
being modernized, and the application of multi-rope
friction hoist is becoming widespread [1, 2]. The
multi-rope friction hoist mainly relies on the friction
between the friction lining on the friction wheel and
the wire rope. Friction is the key factor in ensuring
safety. The friction lining is a viscoelastic material,
meaning there is adhesion hysteresis friction between
the friction lining and the wire rope. During the
friction process, the lining will continuously adhere,
deform, and break, generating vibration [3, 4]. Moreover,
the wire rope is a flexible body, and elastoplastic
deformation occurs after being stressed. The trans-
mission of vibration through the flexible wire rope
will also continue to increase. Therefore, once a slight
vibration generated at the friction pair, the transmission
in a kilometer-long flexible wire rope results in a large
vibration shake to the lifting container. The vibration
is a great hazard to the entire lifting system [5].
Therefore, it is very important to explore the mechanism
of adhesion hysteresis friction and its influencing
factors in the process of friction transmission.
Adhesive friction is the force at which adhesion
occurs at the interface to hinder sliding. Hysteresis
friction is a repetitive periodic deformation of a
* Corresponding author: De-kun ZHANG, E-mail: [email protected]
Friction 9(4): 758–773 (2021) 759
∣www.Springer.com/journal/40544 | Friction
http://friction.tsinghuajournals.com
viscoelastic material due to compression and sliding,
resulting in a lag in the horizontal component (hysteresis
friction) that hinders sliding. In the research of the
adhesion hysteresis friction mechanism of viscoelastic
materials, Lü and Li [6] found the friction coefficient
(COF) and wear of nitrile rubber decreased with
increasing load, showing hysteresis friction at lower
loads and adhesion friction at higher loads. At lower
sliding speeds, the change in load produced a simple
molecular mechanical fracture. Wang et al. [7] found
the friction factor between a tire and a road surface
included two parts of adhesion and hysteresis. The
adhesion COF was the average COF, which could be
used to describe the elastic and friction characteristics
of the tire when sliding completely or slipping. Tong
et al. [8] used the multi-scale method of molecular
dynamics and finite element coupling to find that the
larger the radius of the indenter was, the larger the
surface friction. The friction increased as the depth of
depression of the indenter increased, and adhesion
hysteresis occurred at low speeds. Jrad et al. [9–11]
combined the rheological and friction properties of
viscoelastic materials and pointed out the friction
characteristics of the materials were closely related to
energy loss. A rheological model considering the
relationship between torque and angular displacement
(rotation) was established. Tambe et al. [12, 13] found
the scale of the COF depended on the surface roughness
and scan size of the sample. For larger scan sizes, the
sliding interface encountered larger micro-protrusions
and the friction was large. Lafaye et al. [14] found the
apparent friction and true local friction peak were
related to the loss factor. The peak of the ploughing
friction was related to the contact asymmetry. Moreover,
the root of the contact asymmetry was the viscoelasticity
or plasticity, and the adhesion hysteresis was the real
cause of the local friction.
The above researches are based on the results of the
occurrence and the theoretical knowledge to reversely
deduce the process of adhesion hysteresis friction. No
occurrence and evolution of the adhesion hysteresis
friction were observed. With the rapid development
of the dynamic capture system of cameras, it has
become a useful tool for detecting the dynamic
evolution process of inquiry [15]. Chen et al. [16, 17]
used a high-speed micro-camera to observe the contact
friction interface of the GM-3 friction lining in real
time, and the actual contact area of the contact interface
was calculated. Chromik et al. [18] used optical
microscopy and Raman spectroscopy to observe the
sliding behavior of the sapphire and coating interface,
the friction and wear behavior, and the structural
chemical changes of the subsurface. Krick et al. [19]
designed an in-situ observation test machine to study
the actual contact area of nitrile rubber and transparent
glass under different working conditions. During the
loading and unloading process, the contact area had
a significant hysteresis. Czchos [20] summarized the
interfacial friction phenomenon from the macroscopic
scale to the microscale and the nanoscale. The
wear mechanism was studied by scanning electron
microscopy to further observe the real-time generation
process of abrasive particles. Korres et al. [21] used
an immersion holographic microscope to observe the
smooth sliding copper surface and determined the
evolution process of the wear trajectory. The production
of flaky wear particles was mainly studied. De Beer
et al. [22] found that the dissipated energy of polymer
brushes affect the frictional response to relative motion.
Regarding the research on the friction drive and
vibration of a hoist, Gao et al. [23] found the COF was
reduced owing to the humid working environment
of the hoist. The tension of the main rope was
alternating to cause self-excited vibration. Wang et al.
[24] found the dynamic contact state included viscous,
slip, and mixed states during the lifting process. An
increase in the lifting weight led to an increase in the
possibility of overall slippage. The stress concen-
tration increased and the wear between the contacts
accelerated. Kaczmarczyk and Ostachowicz [25] found
the vibrations include external resonance, parametric
resonance, and self-resonance resonance. When the
winding speed changed, the resonant position shifted.
Yao and Xiao [26] performed a dynamic analysis of
the vertical hoisting wire rope. It was found that at
the second-order excitation frequency, when the
hoisting load was in the range of 0–5,000 kg, a large
lateral amplitude difference generated. This caused
the adjacent two cascades to collide and accelerated
the breakage of the wire rope.

760 Friction 9(4): 758–773 (2021)
| https://mc03.manuscriptcentral.com/friction
The previous studies have focused only on the
overall friction drive of the system and have not paid
attention to the fact that adhesion friction is the driving
force for lifting. This means the effect of adhesive
friction on the overall friction drive and vibration has
been ignored. Therefore, the adhesive hysteresis
friction is tracked and quantified by real-time dynamic
observation in this study to explore the adhesion
hysteresis friction mechanism. The influence of different
pressures on adhesion hysteresis friction and frictional
vibration is explored. The motion state is determined
by the displacement of the interface, and the adhesion
is determined by the state of motion. The relative
displacement of a wire rope and a lining is used to
reflect the magnitude of the adhesive deformation and
adhesive friction force. The hysteresis friction force
is reflected by the size of the internal deformation
of the lining. The frictional vibration is measured
by monitoring the deformation displacement in the
vibration direction.
2 Experimental
2.1 Experimental materials
Three types of friction linings commonly used in
Chinese coal mining are selected for testing: K25, G30,
and GM-3. The friction lining is made of a composite
material, and the high-strength heat-resistant resin
and rubber are compounded and modified as a matrix
material. The fillers are montmorillonite, CaCO3, and
other space fillers. Meanwhile, the functional additives
are rubber additives, including cross-linkers, plas-
ticizers, accelerators, and antioxidant agents. The basic
performance parameters are included in Refs. [16, 17].
Fig. 1 Patterns of the XRD analysis related to friction lining.

Friction 9(4): 758–773 (2021) 761
∣www.Springer.com/journal/40544 | Friction
http://friction.tsinghuajournals.com
The results of the X-ray diffraction (XRD) test are
shown in Fig. 1. The shore hardness (D) of the K25, G30,
and GM-3 linings was 63.5, 76.5, and 70.5, respectively.
The friction linings samples were ground and polished
before the test, and their roughness (Ra) was 0.4 μm.
The material of the wire rope was carbon steel.
2.2 Experimental methods
The self-developed test platform simulates the arc-
surface contact and friction condition of the friction
lining and wire rope during the actual lifting process.
The test platform and a schematic of the experiment
are presented in Fig. 2. The loading force is generated
by tightening the wire rope with an electric cylinder.
This causes the wire rope to press against the friction
lining to the predetermined pressure (T1, T2). The
motor drives the reciprocating micro-slip motion of
the friction lining to simulate the friction of the lifting
process. The lens of a high-speed micro-camera
(VW9000) is aligned with the contact interface to
monitor the viscoelastic contact and friction between
the friction lining and wire rope. The observation area
is shown in the red dotted frame in Fig. 2. The COF is
calculated by monitoring the dynamic change of the
tension at both ends of the wire rope (μ = (1/α) ×
ln(T1/T2), where T1 and T2 denote the tension on both
sides of the wire rope and α is the arc length of the
lining (α = 21° in this experiment)) [4]. The frame rate
of the high-speed camera is 200 fps, the resolution
of each pixel is 640 × 480, and the shutter speed is
1/2,000 s.
Points were respectively marked on the wire rope
and friction lining. The tracking system was used to
record the movement trajectory of the two-dimensional
space during the friction process, as shown in Fig. 3.
For accuracy, our dynamic observation experiment
Fig. 2 Schematic of the experiment.
Fig. 3 Tracking the displacement of the marked points: (a) Initial position and (b) sliding process.

762 Friction 9(4): 758–773 (2021)
| https://mc03.manuscriptcentral.com/friction
took one data point every 0.004 s. The displacements
of the friction lining and wire rope in the sliding
direction (the X-direction) and in the vibration
direction (the Y-direction) during the whole friction
process were obtained. The changes in the adhesion
friction (sliding direction) and vibration during the
friction were analyzed. The measurement accuracy
was 0.0001 mm.
To further explore the hysteresis friction phenomenon
in the friction process, a point was marked at 1 mm
from the contact surface on the friction lining, and
another point was marked at 3 mm directly, as shown
in Fig. 4. The displacements of the two points in the
sliding direction were recorded. Because of the
adhesion on the contact surface and the driving force
on the friction lining, tensile deformation occurred
inside the friction lining, and hysteresis friction
occurred. Thus, the sliding displacement of point 2
was ahead of the displacement of point 1, as shown
in Fig. 4(b). Figure 4(c) shows the displacement in the
sliding direction of the marked points 1 and 2. It can
also be observed that the displacement of point 2 is
ahead of that of point 1, and the displacement has a
jump, because elastic recovery occurs after the tensile
deformation. This type of response is relatively small
relative to the overall sliding distance, which is not
obvious in Fig. 4(c). Therefore, to better analyze the
displacement of the two marked points in the sliding
directions, the displacement of the two marked points
is subtracted to obtain the displacement difference
(Δx). Δx is the change in tensile deformation in the
sliding direction. It can reflect the change in hysteresis
friction.
In the experiment, 6 × 19 + IWS point contact wire
rope with a diameter of 12 mm was used. Before the
test, the surface of the friction lining and the wire rope
should be pretreated following the Chinese standard
JB/T 10347-2002 and the coal industry standards MT/
T248-1991. The experiment requires the surface of the
friction lining and wire rope should be free of water,
grease, and other impurities, and the wire rope should
not be embroidered. The experimental parameters are
listed in Table 1. The projection pressure of the friction
hoist during use was 1–3 MPa. The creep speed of the
friction lining during the lifting process was generally
less than 8 mm/s. Therefore, the selected pressure
range was 1–3 MPa and the sliding speed was 4 mm/s.
The pressure in the experiment is the projection
pressure.
Fig. 4 Tracking the displacement of marked points 1 and 2 in the friction process: (a) Initial position, (b) sliding process, and (c) displacement of marked points 1 and 2 in the sliding direction.

Friction 9(4): 758–773 (2021) 763
∣www.Springer.com/journal/40544 | Friction
http://friction.tsinghuajournals.com
Table 1 Experimental parameters.
Parameter Value
Pressure (MPa) 1, 1.5, 2, 2.5, 3
Sliding speed (mm/s) 4
Sliding distance (mm) 6
Time (min) 10
Temperature (℃) 25
Lubrication condition Dry friction
3 Results
3.1 Dynamic observation of adhesive friction under
different pressure conditions
Figure 5 shows the displacement of the K25 lining
and wire rope in the sliding direction under different
pressure conditions. In Fig. 5(a), at the beginning of
the experiment, the K25 lining adhered to the wire
rope, and the change rule was the same. After 0.2 s,
the displacement of the lining increased rapidly, and
the displacement of the wire rope fluctuated slightly.
The increase rate of both is different, which indicates
that a relative slip occurred between the lining and
the wire rope. At 0.5 s, the displacement of the lining
reached the maximum value. Then, it changed in the
reverse direction. It still adhered first, then slipped,
and changed periodically. The variation law under
different pressure conditions is consistent. Therefore,
the friction process can be divided into two phases:
the adhesion and sliding stages [5]. Comparing
Figs. 5(a)–5(e), it can be observed as the pressure
increases, the time of the adhesive stage becomes
longer, but the adhesion is unstable. The fluctuations
become larger, the sliding time becomes shorter, and
the displacement of the lining in the sliding direction
decreases. As the pressure increases, the displacement
of the adhesive stage is tilted, causing the boundary
line to become blurred, especially at 3 MPa in Fig. 5(e).
In Fig. 5, the displacements of the friction lining
and wire rope in the adhesive and sliding stages
have simultaneously small fluctuations of the same
amplitude. This indicates that there is an adhesive
motion (the contact interface adhesion causes the
friction lining to move together with the wire rope).
The fluctuation indicates a tendency to move during
the adhesive stage and a re-adhesion during the sliding
stage. The type of fluctuation is a form of adhesion–
destruction. The time of occurrence is also short,
which can be defined as stick-slip fluctuation. As the
pressure increases, the stick-slip fluctuation of the K25
lining becomes larger, especially at 3 MPa in Fig. 5(e).
Fig. 5 Displacement of the K25 lining and wire rope in the sliding direction at: (a) 1, (b) 1.5, (c) 2, (d) 2.5, and (e) 3 MPa.

764 Friction 9(4): 758–773 (2021)
| https://mc03.manuscriptcentral.com/friction
Therefore, the boundary between the adhesion and
sliding stages becomes blurred at 3 MPa.
Figure 6 shows the displacement of the G30 lining
and the wire rope in the sliding direction under
different pressure conditions. In Fig. 6, the display-
cement change of the G30 lining in the sliding direction
is similar to that of the K25 lining. It also adhered
first and then slipped, and it can be divided into the
adhesion and sliding stages. As the pressure increases,
the displacement of the G30 lining in the sliding
direction also decreases, and the time of the adhesive
stage becomes longer. At low pressures (1 and 1.5 MPa),
the stick-slip fluctuation is small. At high pressures,
the stick-slip fluctuation is more obvious, especially
at 3 MPa in Fig. 6(e).
Figure 7 shows the displacement of the GM-3 lining
and wire rope in the sliding direction under different
pressure conditions. The adhesive and sliding stages
are divided as shown in Fig. 7. The displacement of
the GM-3 lining in the sliding direction also decreases
as the pressure increases, and the time of the adhesive
stage becomes longer. At pressures of 1.5 and 2 MPa,
the stick-slip fluctuation is small. When the pressure
is large, the stick-slip fluctuation is more obvious,
especially at 3 MPa in Fig. 7(e).The stick-slip fluctuation
of the GM-3 lining first reduces and then gradually
increases with pressure increasing.
For a clearer comparison of the relationship between
the adhesion sliding distance and the pressure, the
displacements of the friction lining and wire rope
in the sliding direction are subtracted. In Fig. 8, the
relative sliding distances of the friction lining decrease
as the pressure increases. The relative sliding distance
of the K25 lining is the smallest. As the pressure
increases, the relative sliding distance decreases, and
the amount of decrease is smaller. The relative sliding
distance of the G30 lining is large. As the pressure
increases, it decreases rapidly, and then decreases
slowly. This shows that the relative sliding distance
has a greater influence on the lower pressure. The
relative sliding distance of the GM-3 lining is also
large. As the pressure increases, it decreases slowly,
decreases rapidly at pressures of 2 and 2.5 MPa, and
then slowly decreases. This indicates the critical point
is at a pressure of 2.5 MPa.
To quantify the maximum relative sliding distance
and adhesive time of the friction lining under different
pressures more effectively (the adhesion friction is
Fig. 6 Displacement of the G30 lining and wire rope in the sliding direction at: (a) 1, (b) 1.5, (c) 2, (d) 2.5, and (e) 3 MPa.

Friction 9(4): 758–773 (2021) 765
∣www.Springer.com/journal/40544 | Friction
http://friction.tsinghuajournals.com
related to the maximum relative sliding distance and
the adhesive time), and in accordance with the above
results of the adhesion and sliding stages, the average
values of the adhesive stage time and the maximum
relative sliding distance were obtained. The results are
shown in Fig. 9. The pressure increases, the maximum
relative sliding distance decreases, the adhesive time
increases rapidly first, and then tends to be stable. The
maximum relative sliding distance of the K25 lining
is the smallest under different pressure conditions.
The adhesive time is longer than that of the GM-3
lining at the pressures of 1.5 and 2 MPa. At the
pressures of 2.5 and 3 MPa, although the maximum
relative sliding distance is much smaller than that of
the G30 and GM-3 linings, the adhesive time is almost
the same. Therefore, the adhesion friction of the K25
lining is the largest. The relative sliding distance of
the G30 lining is medium. The adhesive time is the
longest. Therefore, the adhesion friction is small. The
maximum relative sliding distance of the GM-3 lining
is the largest and the adhesive time is also the shortest.
Thus, the adhesion friction is small.
3.2 Dynamic observation of hysteresis friction under
different pressure conditions
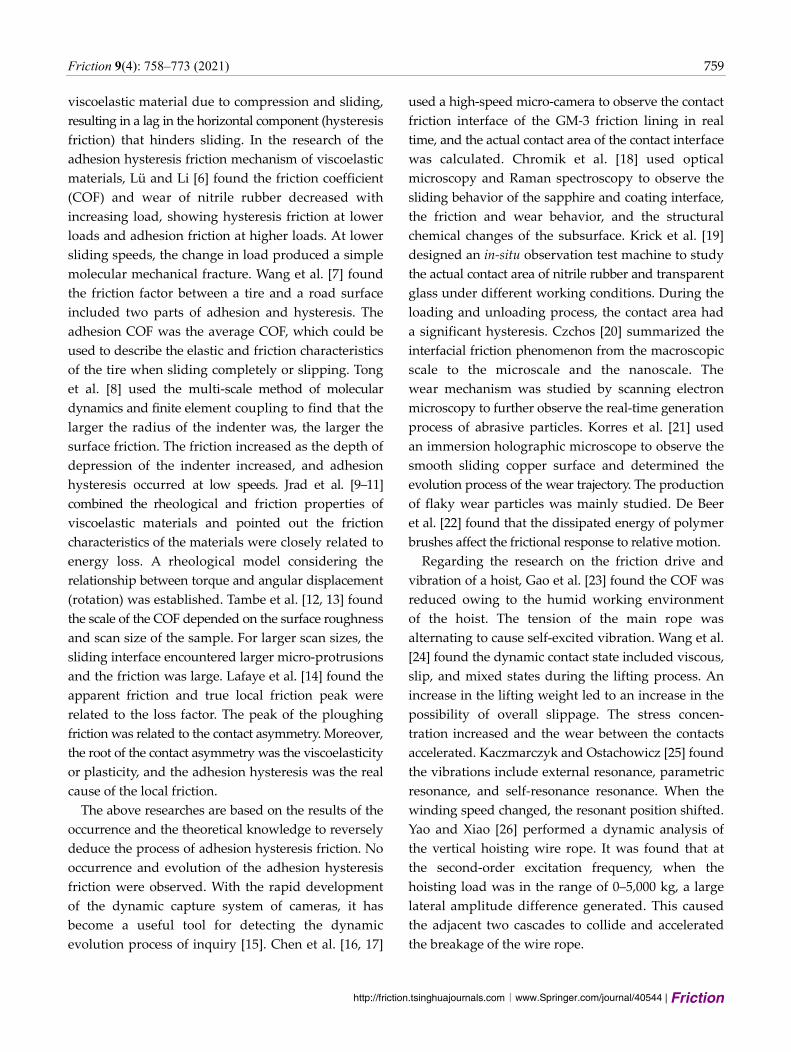
Figure 10 shows the Δx in the sliding direction of two
Fig. 7 Displacement of the G30 lining and wire rope in the sliding direction at: (a) 1, (b) 1.5, (c) 2, (d) 2.5, and (e) 3 MPa.
Fig. 8 Relative sliding distance of the friction lining in the sliding direction: (a) K25 lining, (b) G30 lining, and (c) GM-3 lining.
766 Friction 9(4): 758–773 (2021)
| https://mc03.manuscriptcentral.com/friction
marked points at different distances from the contact
surface during the friction process. The tensile defor-
mation (hysteresis friction) inside the friction lining is
reflected. In Fig. 10(a), when the friction started, the
tensile deformation inside the friction lining started to
increase, and then fluctuated continuously. This shows
the adhesion-recovery continuously happened. Then,
the Δx changed in reverse. As the pressure increases,
the Δx of the K25 lining first decreases and then
increases, and the fluctuation at 1.5 MPa is small. The
Δx of the G30 lining under different pressures are
small. This reveals that the internal stretch of the G30
lining is small. The Δx of the GM-3 lining is also first
decreased as the pressure increases, and the fluctuation
is minimized at 2.5 MPa. Comparing Figs. 10(a)–10(c),
the Δx of the K25 lining is the largest showing the
internal stretch of the K25 lining is the largest.
3.3 Dynamic observation of vibration in the
Y-direction under different pressure conditions
The displacement in the Y-direction is the vibration
amplitude. Figure 11 shows the amplitude of the friction
lining in the Y-direction during the friction process
under different pressure conditions. In Fig. 11(a), the
amplitude of the K25 lining in the Y-direction increased
first and then increased with the increase in pressure,
and the smallest amplitude is at 2.5 MPa. The amplitude
of the G30 lining also first decreased and then increased
with the increase in pressure. The frictional vibration
is minimized at 2.5 MPa in Fig. 11(b). The frictional
vibration of the GM-3 lining at 2 MPa is the smallest
in Fig. 11(c). Comparing Figs. 11(a)–11(c), the frictional
vibration of the K25 lining is the lowest showing the
friction stability of the K25 lining is the best.
Fig. 9 Maximum relative sliding distance and adhesive time of the friction lining under different pressures: (a) Maximum relative slidingdistance and (b) adhesive time.
Fig. 10 Δx of the friction lining in the sliding direction: (a) K25 lining, (b) G30 lining, and (c) GM-3 lining.
Friction 9(4): 758–773 (2021) 767
∣www.Springer.com/journal/40544 | Friction
http://friction.tsinghuajournals.com
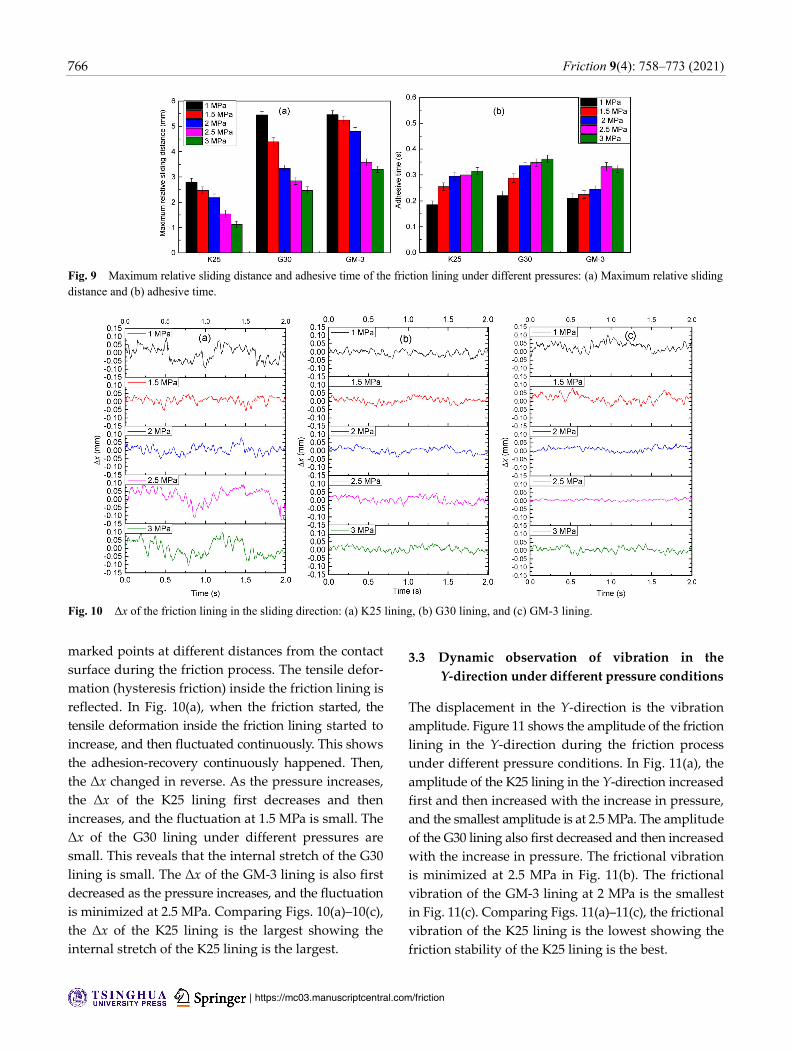
3.4 Frictional behaviors of the friction lining
The friction force and COF are an intuitive reflection
of the adhesion hysteresis friction. Figure 12 shows
the friction force and the average COF of the friction
lining under different pressure conditions. In Figs.
12(a)–12(c), when the friction started, it was in the
adhesive stage, and the friction force increased
continuously. After increasing to the maximum value,
there was a small decrease, and then it remained
unchanged, indicating that it entered the sliding
stage. After the end of the sliding, the friction force
reduced rapidly and entered in the adhesive stage.
Subsequently, it was a reverse change, which was still
adhesion–sliding–adhesion. The friction of the K25
lining is the highest and that of the GM-3 lining is the
Fig. 11 Amplitude of the friction lining in the Y-direction: (a) K25 lining, (b) G30 lining, and (c) GM-3 lining.
Fig. 12 Friction force and average COF of the friction lining under different pressures: (a) K25 lining, (b) G30 lining, (c) GM-3 lining,and (d) average COF.

768 Friction 9(4): 758–773 (2021)
| https://mc03.manuscriptcentral.com/friction
smallest. In view of the average COF in Fig. 12(d), the
COF of the K25 lining is also the largest and that
of the GM-3 lining is the smallest. Moreover, the
COF decreases as the pressure increases. However,
at 3 MPa, the COF increases. This is because the
adhesion time of the GM-3 lining becomes shorter
and the adhesion friction decreases, but the hysteresis
friction increases, and the friction vibration amplitude
is large. According to Moore’s adhesion friction theory
[26, 27], the COF is equal to the sum of adhesion
COF and the hysteresis COF. When the increase in the
hysteresis COF is larger than the decrease in the
adhesion COF, the COF will increase. Therefore, the
COF increases at 3 MPa.
4 Discussion
According to Moore’s adhesion friction theory, the
friction of viscoelastic materials mainly comes from
adhesive friction and hysteresis friction [27, 28], and
the COF (μ) can be expressed by Eq. (1):
a h (1)
where μa is the adhesive COF and μh is the hysteresis
COF.
μa can be expressed by Eq. (2):
a a 0.21μ K E
p¢¢= (2)
where Ka is a constant (related to the properties of the
material), p is the contact positive pressure, and E" is
the loss modulus.
μh can be expressed by Eq. (3):
( )h h 2
Eμ K pE¢¢
=¢
(3)
where Kh is a constant, p is a contact positive pressure,
and E' is a storage modulus.
Adhesive friction occurs on the frictional contact
surface and the subsurface, as shown in Fig. 13(a). The
contact and adhesion points of the micro-protrusions
are continuously formed and destroyed. The adhesion
area is enlarged, and the adhesion friction mechanism
is mainly divided into three stages. In the first stage,
adhesion occurred at the contact peak, and as the
relative motion progressed, the internal molecular
chain was stretched and deformed. In the second stage,
the adhesion point was broken after the stretching
reaches a certain value. The molecular chain relaxed
and released energy. In the third stage, new adhesions
were formed at a new location. Due to the repeated
mode of the adhesion–stretch–fracture–adhesion, the
energy is lost and released in the form of heat,
Fig. 13 Adhesion friction mechanism: (a) Diagram of adhesive friction and (b) the relationship between loss modulus and maximum relative sliding distance.
Friction 9(4): 758–773 (2021) 769
∣www.Springer.com/journal/40544 | Friction
http://friction.tsinghuajournals.com
producing frictional heat [29]. Figure 13(b) shows
the relationship between the loss modulus and the
maximum relative sliding distance of the friction lining.
In Fig. 13(b), the adhesion friction is proportional to
the loss modulus. The loss modulus of the K25 lining
is large [16, 17]. Thus, the adhesion friction is large,
and the maximum relative sliding distance is small.
According to Refs. [30, 31], the COF is inversely
proportional to the elasticity of the material and
proportional to the viscosity. The relative pressure
increases for stronger adhesion [32]. The adhesion
friction is proportional to the loss modulus. The loss
modulus of the G30 lining is smaller than that of the
K25 lining. Therefore, the adhesion friction of G30 is
smaller than that of K25. The loss modulus of the GM-3
lining is the smallest. Hence, the adhesion friction of
GM-3 lining is the smallest and the maximum relative
sliding distance is the largest.
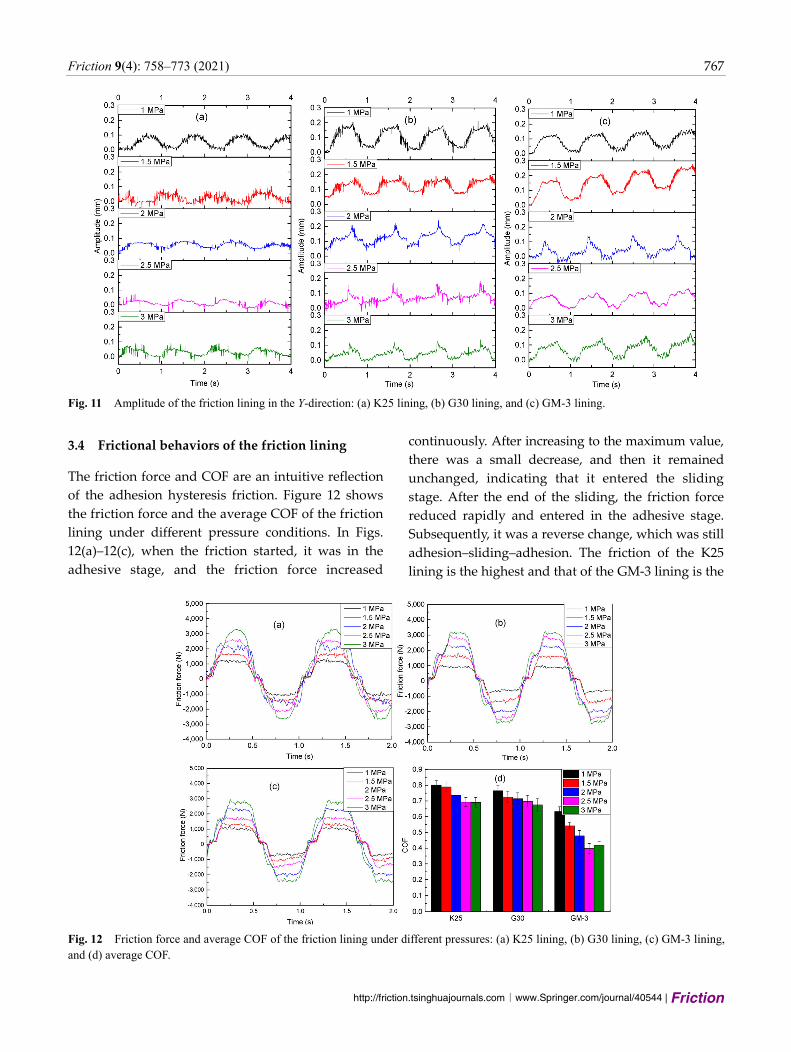
Figure 14 presents a schematic of the hysteresis
friction mechanism. Hysteresis friction is a repetitive
periodic deformation of a viscoelastic material due to
compression and sliding, resulting in a lag in the
horizontal component (hysteresis friction) that hinders
sliding and causes energy consumption during relative
sliding. In this study, the hysteresis friction is well
quantified by the Δx in the sliding direction of the
marked points 1 and 2. The hysteresis friction is pro-
portional to the loss modulus and inversely proportional
to the storage modulus [30, 31]. The larger the storage
modulus is, the greater the elasticity of the material,
and thus, the elastic deformation is smaller under the
same load conditions and the hysteresis friction is
smaller. The larger the loss modulus is, the greater the
viscosity of the material, and the greater the friction
inside the material, and thus, the hysteresis friction is
greater. Figure 15 shows the relationship between
hysteresis friction and the ratio of the loss modulus
to the square of the storage modulus (E"/(E'2)). It can
be observed that the K25 lining has the largest value
of E"/(E'2); hence, the hysteresis friction is the largest.
The GM-3 lining has the smallest value of E"/(E'2),
and thus, the hysteresis friction is the smallest. The
hysteresis friction is proportional to the ratio of the
loss modulus to the square of the storage modulus
(E”/(E'2)).
Figure 16 shows the relationship between the
adhesion time, hysteresis friction, and frictional
vibration amplitude of the friction lining with pressure
increasing. It shows that as the pressure increases,
the adhesion time increases, and the adhesion friction
increases; the hysteresis friction first decreases and
then increases. From the results of the friction and
average COF with the increase in pressure, it is known
that the hysteresis friction is dominant at low pressures,
and the adhesion friction is dominant at high pressures.
According to Ref. [29], the adhesion hysteresis friction
of the polymer–polymer is dependent on the dynamic
rearrangement of the outermost layer of the polymer
at the shear interface. When the pressure increases, the
contact area increases, the adhesion point increases,
the adhesive contact area becomes larger, and the
adhesion friction increases. When the pressure is
smaller, the elastic deformation decreases as the
pressure increases, the plastic deformation increases,
the dynamic rearrangement of the material decreases,
and the hysteresis friction decreases. After the pressure
reaches a certain value, the internal molecular chain
of the material is entangled, the damping is increased,
and the hysteresis friction is aggravated.
Fig. 14 Schematics of the hysteresis friction mechanism.

770 Friction 9(4): 758–773 (2021)
| https://mc03.manuscriptcentral.com/friction
Fig. 15 Relationship between hysteresis friction and the ratio of the loss modulus to the square of the storage modulus (E"/(E' 2)).
The amplitude of the frictional vibration reflects the
instability of the frictional interface, i.e., the severity
of the damage. It can be observed in Fig. 16 that as
the pressure increases, the amplitude of the frictional
vibration decreases first and then increases, and the
amplitude of the frictional vibration is the smallest at
2.5 MPa. The vibration amplitude of the K25 lining is
the smallest. At low pressures, as the pressure increases,
the adhesive time increases, whereas the hysteresis
friction and frictional vibration amplitude decrease.
Mainly because of the increase in pressure, the adhesive
contact area becomes larger, and the adhesion friction
is intensified. At the same time, the hysteresis defor-
mation reduced and the friction surface is relatively
stable. Therefore, the vibration reduced. However,
when the pressure is sufficiently large, the hysteresis
friction is intensified. This leads to an increase in
friction and an unstable friction surface. Therefore,
the vibration is slightly increased.
5 Conclusions
1) Through dynamic monitoring, the displacement
changes of the friction lining and wire rope in the
friction process under different pressure conditions
were analyzed, and the adhesion and sliding stages
were distinguished. The adhesion friction was analyzed
by the relative sliding distance and the adhesive time.
It was found that the adhesion friction is proportional
to the loss modulus. The hysteresis friction is quantified
by dynamically monitoring the difference in dis-
placement of the friction lining in the sliding direction
during the friction process. The hysteresis friction
Fig. 16 Relationship between frictional vibration amplitude, adhesive time, and hysteresis friction: (a) K25 lining, (b) G30 lining, and (c) GM-3 lining.
Friction 9(4): 758–773 (2021) 771
∣www.Springer.com/journal/40544 | Friction
http://friction.tsinghuajournals.com
is proportional to the ratio of the loss modulus to
the square of the storage modulus (E"/(E'2)), and the
hysteresis friction of the K25 lining is the largest.
2) The adhesion friction increases as the pressure
increases. The hysteresis friction decreases first and
then increases with the increase in pressure. The
friction force and the average COF decrease as the
pressure increases. This shows that hysteresis friction
dominates at low pressures and adhesion friction
dominates at high pressurses.
3) With the increase in pressure, the frictional
vibration amplitude first decreases and then increases,
and the frictional vibration is the smallest at 2.5 MPa.
The vibration amplitude of the K25 lining is the
smallest. At low pressures, as the pressure increases,
the adhesive time increases, whereas the hysteresis
friction and frictional vibration amplitude decrease.
Mainly because of the increase in pressure, the adhesive
contact area becomes larger, and the adhesion friction
is intensified. At the same time, the hysteresis defor-
mation reduced, and the friction surface is relatively
stable. Therefore, the vibration reduced. However,
when the pressure is sufficiently large, the hysteresis
friction is intensified. This leads to an increase in
friction and an unstable friction surface.
In this study, the adhesion hysteresis friction between
interfaces was intuitively and quantitatively analyzed.
The influence of different pressures on adhesion
hysteresis friction and frictional vibration was analyzed.
The result provides a simple and intuitive method for
the research on friction transmission and vibration
of viscoelastic materials, and provides a theoretical
basis for determining the friction drive reliability of
friction hoists.
Acknowledgements
This study is supported by the joint Ph.D. program of
“double first rate” construction disciplines of China
University of Mining and Technology (CUMT).
Open Access This article is licensed under a Creative
Commons Attribution 4.0 International License, which
permits use, sharing, adaptation, distribution and
reproduction in any medium or format, as long as
you give appropriate credit to the original author(s)
and the source, provide a link to the Creative Commons
licence, and indicate if changes were made.
The images or other third party material in this
article are included in the article’s Creative Commons
licence, unless indicated otherwise in a credit line to
the material. If material is not included in the article’s
Creative Commons licence and your intended use is
not permitted by statutory regulation or exceeds the
permitted use, you will need to obtain permission
directly from the copyright holder.
To view a copy of this licence, visit http://creativecommons.org/licenses/by/4.0/.
References
[1] Ge S R. The friction coefficients between the steel rope and
polymer lining in frictional hoisting. Wear 152(1): 21–29
(1992)
[2] Wu Y Q, Chen M M, Wang K, Fu G. A dynamic information
platform for underground coal mine safety based on internet
of things. Saf Sci 113: 9–18 (2019)
[3] Guo Y B, Zhang D K, Chen K, Feng C A, Ge S R.
Longitudinal dynamic characteristics of steel wire rope in a
friction hoisting system and its coupling effect with friction
transmission. Tribol Int 119: 731–743 (2018)
[4] Feng C A, Zhang D K, Chen K, Guo Y B. Study on
viscoelastic friction and wear between friction linings and
wire rope. Int J Mech Sci 142–143: 140–152 (2018)
[5] Yao J N, Xiao X M, Peng A H, Jiang Y Q, Ma C. Assessment
of safety for axial fluctuations of head sheaves in mine hoist
based on coupled dynamic model. Eng Fail Anal 51: 98–107
(2015)
[6] Lü R G, Li T S. Effect of load on tribological behavior of
NBR. (in Chinese). Lubricat Eng 26(6): 29–30 (2001)
[7] Wang J Z, Gu S F, Song N X. Friction and adhesion between
tire and road surface. (in Chinese). Tire Ind 22(2): 67–70 (2002)
[8] Tong R T, Liu G, Liu L, Yu C J. Multiscale analysis on
micro/nano scale adhesive sliding contacts. (in Chinese).
Chin J Comput Mech 28(3): 400–405 (2011)
[9] Jrad H, Dion J L, Renaud F, Tawfiq I, Haddar M.
Experimental characterization, modeling and parametric
identification of the non linear dynamic behavior of
viscoelastic components. Eur J Mech A Solids 42: 176–187
(2013)
[10] Jrad H, Renaud F, Dion J L, Tawfiq I, Haddar M. Experimental
characterization, modeling and parametric identification of
the hysteretic friction behavior of viscoelastic joints. Int J
Appl Mech 5(2): 1350018 (2013)

772 Friction 9(4): 758–773 (2021)
| https://mc03.manuscriptcentral.com/friction
[11] Jrad H, Dion J L, Renaud F, Tawfiq I, Haddar M. Experimental
and numerical investigation of energy dissipation in elastomeric
rotational joint under harmonic loading. Mech Time-Depend
Mater 21(2): 177–198 (2017)
[12] Tambe N S, Bhushan B. Scale dependence of micro/nano-
friction and adhesion of MEMS/NEMS materials, coatings
and lubricants. Nanotechnology 15(11): 1561–1570 (2004)
[13] Bhushan B, Burton Z. Adhesion and friction properties of
polymers in microfluidic devices. Nanotechnology 16(4):
467–478 (2005)
[14] Lafaye S, Gauthier C, Schirrer R. Analysis of the apparent
friction of polymeric surfaces. J Mater Sci 41(19): 6441–6452
(2006)
[15] Sawyer W G, Wahl K J. Accessing inaccessible interfaces:
in situ approaches to materials tribology. MRS Bull 33(12):
1145–1150 (2008)
[16] Chen K, Zhang D K, Zhang X J. Effects of viscoelastic
properties of friction lining materials on their friction
coefficients. J Tribol 139(3): 034502 (2017)
[17] Feng C A, Zhang D K, Chen K, Guo Y B, Hao T Q. Research
on in-situ microscopic observation of dynamic contact and
reciprocating sliding friction of GM-3 lining interface.
Tribol Int 115: 179–190 (2017)
[18] Chromik R R, Strauss H W, Scharf T W. Materials phenomena
revealed by in situ tribometry. JOM 64(1): 35–43 (2012)
[19] Krick B A, Vail J R, Persson B N J, Sawyer W G. Optical
in situ micro tribometer for analysis of real contact area for
contact mechanics, adhesion, and sliding experiments. Tribol
Lett 45(1): 185–194 (2012)
[20] Czichos H. Tribology and its many facets: from macroscopic
to microscopic and nano-scale phenomena. Meccanica 36(6):
605–615 (2001)
[21] Korres S, Feser T, Dienwiebel M. In situ observation of
wear particle formation on lubricated sliding surfaces. Acta
Mater 60(1): 420–429 (2012)
[22] de Beer S, KENMOÉ G D, MÜSER M H. On the friction
and adhesion hysteresis between polymer brushes attached
to curved surfaces: Rate and solvation effects. Friction, 3(2):
148–160 (2015)
[23] Gao L H, Wan C, Zhao J W, Yang Y, Chai Y D. Test and
diagnosis for self-excitation of mine hoist. (in Chinese). Min
Process Equip 35(8): 95–97 (2007)
[24] Wang D G, Li X W, Wang X R, Shi G Y, Mao X B, Wang
D A. Effects of hoisting parameters on dynamic contact
characteristics between the rope and friction lining in a deep
coal mine. Tribol Int 96: 31–42 (2016)
[25] Kaczmarczyk S, Ostachowicz W. Transient vibration
phenomena in deep mine hoisting cables. Part 1: Mathematical
model. J Sound Vibrat 262(2): 219–244 (2003)
[26] Yao J N, Xiao X M. Effect of hoisting load on transverse
vibrations of hoisting catenaries in floor type multirope
friction mine hoists. Shock Vibrat 2016: 8598749 (2016)
[27] Moore D F, Geyer W. A review of adhesion theories for
elastomers. Wear 22(2): 113–141 (1972)
[28] Moore D F. Friction and wear in rubbers and tyres. Wear
61(2): 273–282 (1980)
[29] Maeda N, Chen N H, Tirrell M, Israelachvili J N. Adhesion
and friction mechanisms of polymer-on-polymer surfaces.
Science 297(5580): 379–382 (2002)
[30] Li Q, Popov M, Dimaki A, Filippov A E, Kürschner S,
Popov V L. Friction between a viscoelastic body and a rigid
surface with random self-affine roughness. Phys Rev Lett
111(3): 034301 (2013)
[31] Zhao W F, Li Y, Lu Z P, Zhang T, Lu Z. The friction and
wear behavior of polyethersulfone composites reinforced
with carbon fiber. Tribology 20(6): 421-426 (2000)
[32] MALEKAN A, ROUHANI S. Model of contact friction
based on extreme value statistics. Friction 7(4): 327–339
(2019)
Cun-ao FENG. He is a Ph.D.
candidate at China University of
Mining and Technology. He was a
joint Ph.D. student at the University
of British Columbia (UBC) from
2018 to 2019. He has published 9 journal papers. His
current research interests cover tribology of soft
materials, friction reliability of mining machinery,
viscoelastic materials, and wear-resistant materials.

Friction 9(4): 758–773 (2021) 773
∣www.Springer.com/journal/40544 | Friction
http://friction.tsinghuajournals.com
De-kun ZHANG. He received his
Ph.D. degree from China University
of Mining and Technology in 2003.
He is a professor at China University
of Mining and Technology since
2008. His current research interests
cover fretting, friction reliability of
mining machinery, bio-tribology of artificial joints,
bionic design of functional materials, and wear-resistant
materials, etc. He has published 2 monographs, more
than 180 papers, of which over 100 publications are
included in SCI, and he has also obtained more than
30 patents for invention. His main academic part-time
jobs include the deputy chairman of the Tribological
Branch of the Chinese Mechanical Engineering Society,
the chairman of the Tribological Branch of the Jiangsu
Mechanical Engineering Society, and so on.
Kai CHEN. He received his Ph.D.
degree from China University of
Mining and Technology in 2015. He
is currently an associate professor
at China University of Mining and
Technology. He has published over 50 journal papers.
His current research interests cover the bionic design
of functional materials, tribology of soft materials,
and bio-tribology of artificial joints.


![C i v il E nv iro mental Journal of Civil & …...major components: adhesion and hysteresis [2]. Adhesion, which is proportional to aggregates micro-texture, is computed by multiplying](https://static.fdocuments.in/doc/165x107/5f74c356deb32b540545b03e/c-i-v-il-e-nv-iro-mental-journal-of-civil-major-components-adhesion-and.jpg)
