Microplastics on the Menu: Plastics Pollute Indonesian ...
21
ORIGINAL RESEARCH published: 19 November 2019 doi: 10.3389/fmars.2019.00679 Edited by: Julia Reisser, The University of Western Australia, Australia Reviewed by: Monica F. Costa, Federal University of Pernambuco, Brazil Rodrigo Riera, Catholic University of the Most Holy Conception, Chile *Correspondence: Elitza S. Germanov [email protected] Specialty section: This article was submitted to Marine Pollution, a section of the journal Frontiers in Marine Science Received: 02 August 2019 Accepted: 18 October 2019 Published: 19 November 2019 Citation: Germanov ES, Marshall AD, Hendrawan IG, Admiraal R, Rohner CA, Argeswara J, Wulandari R, Himawan MR and Loneragan NR (2019) Microplastics on the Menu: Plastics Pollute Indonesian Manta Ray and Whale Shark Feeding Grounds. Front. Mar. Sci. 6:679. doi: 10.3389/fmars.2019.00679 Microplastics on the Menu: Plastics Pollute Indonesian Manta Ray and Whale Shark Feeding Grounds Elitza S. Germanov 1,2,3 * , Andrea D. Marshall 2 , I. Gede Hendrawan 4 , Ryan Admiraal 5,6 , Christoph A. Rohner 2 , Janis Argeswara 4 , Raka Wulandari 4 , Mahardika R. Himawan 7 and Neil R. Loneragan 1,3,8 1 Environmental and Conservation Sciences, Murdoch University, Perth, WA, Australia, 2 Marine Megafauna Foundation, Truckee, CA, United States, 3 Aquatic Megafauna Research Unit, Centre for Sustainable Aquatic Ecosystems, Harry Butler Institute, Murdoch University, Perth, WA, Australia, 4 Department of Marine Science, Faculty of Marine Sciences and Fisheries, Udayana University, Denpasar, Indonesia, 5 School of Mathematics and Statistics, Victoria University of Wellington, Wellington, New Zealand, 6 Department of Mathematics and Statistics, Murdoch University, Perth, WA, Australia, 7 Fisheries and Marine Science Department, Faculty of Agriculture, Mataram University, Mataram, Indonesia, 8 Faculty of Fisheries and Marine Science, Bogor Agricultural University, Bogor, Indonesia The implications of plastic pollution, including microplastics, on marine ecosystems and species are increasingly seen as an environmental disaster. Yet few reports focus on filter-feeding megafauna in regions heavily impacted by plastic pollution, such as Indonesia in the Coral Triangle, a global marine biodiversity hotspot. Here, we evaluate plastic abundance and characterize debris from feeding grounds for manta rays Mobula alfredi and whale sharks Rhincodon typus in three coastal locations in Indonesia: Nusa Penida Marine Protected Area, Komodo National Park, and Pantai Bentar, East Java. A 200 μm plankton net was used to sample the top 0.5 m of the water column (‘trawl survey’) and floating plastics were assessed along ∼440 m long transects (‘visual survey’) during the Indonesian north-west (wet) and south-east (dry) monsoon seasons during 2016–2018. Microplastics were identified visually, measured and categorized from trawl samples, and larger floating plastics were counted and categorized visually from boats. Plastic abundance ranged widely from 0.04 to 0.90 pieces m -3 (trawl survey) and 210 to 40,844 pieces km -2 (visual survey). Results from linear models showed significant seasonal and location differences in estimated plastic abundance for trawl and visual surveys in Nusa Penida and Komodo. Plastic abundance was up to ∼ 44 times higher in the wet than the dry season, with the largest seasonal effect observed in Nusa Penida. Overall, small pieces < 5 mm (≥ 78%), films and fragments (> 50% combined) were the most prevalent plastics. Theoretical plastic ingestion rates were calculated using estimated filtration volumes of manta rays and whale sharks and the mean plastic abundance in their feeding grounds. Upper plastic ingestion estimates for manta rays were ∼63 and 25 pieces h -1 for Nusa Penida and Komodo locations, respectively, and ∼137 pieces h -1 for whale sharks in Java. Analysis of manta Frontiers in Marine Science | www.frontiersin.org 1 November 2019 | Volume 6 | Article 679
Transcript of Microplastics on the Menu: Plastics Pollute Indonesian ...
fmars-06-00679 November 8, 2019 Time: 14:46 # 1
ORIGINAL RESEARCHpublished: 19 November 2019
doi: 10.3389/fmars.2019.00679
Edited by:Julia Reisser,
The University of Western Australia,Australia
Reviewed by:Monica F. Costa,
Federal University of Pernambuco,Brazil
Rodrigo Riera,Catholic University of the Most Holy
Conception, Chile
*Correspondence:Elitza S. Germanov
Specialty section:This article was submitted to
Marine Pollution,a section of the journal
Frontiers in Marine Science
Received: 02 August 2019Accepted: 18 October 2019
Published: 19 November 2019
Citation:Germanov ES, Marshall AD,Hendrawan IG, Admiraal R,
Rohner CA, Argeswara J,Wulandari R, Himawan MR and
Loneragan NR (2019) Microplasticson the Menu: Plastics Pollute
Indonesian Manta Ray and WhaleShark Feeding Grounds.
Front. Mar. Sci. 6:679.doi: 10.3389/fmars.2019.00679
Microplastics on the Menu: PlasticsPollute Indonesian Manta Ray andWhale Shark Feeding GroundsElitza S. Germanov1,2,3* , Andrea D. Marshall2, I. Gede Hendrawan4, Ryan Admiraal5,6,Christoph A. Rohner2, Janis Argeswara4, Raka Wulandari4, Mahardika R. Himawan7 andNeil R. Loneragan1,3,8
1 Environmental and Conservation Sciences, Murdoch University, Perth, WA, Australia, 2 Marine Megafauna Foundation,Truckee, CA, United States, 3 Aquatic Megafauna Research Unit, Centre for Sustainable Aquatic Ecosystems, Harry ButlerInstitute, Murdoch University, Perth, WA, Australia, 4 Department of Marine Science, Faculty of Marine Sciencesand Fisheries, Udayana University, Denpasar, Indonesia, 5 School of Mathematics and Statistics, Victoria Universityof Wellington, Wellington, New Zealand, 6 Department of Mathematics and Statistics, Murdoch University, Perth, WA,Australia, 7 Fisheries and Marine Science Department, Faculty of Agriculture, Mataram University, Mataram, Indonesia,8 Faculty of Fisheries and Marine Science, Bogor Agricultural University, Bogor, Indonesia
The implications of plastic pollution, including microplastics, on marine ecosystemsand species are increasingly seen as an environmental disaster. Yet few reports focuson filter-feeding megafauna in regions heavily impacted by plastic pollution, such asIndonesia in the Coral Triangle, a global marine biodiversity hotspot. Here, we evaluateplastic abundance and characterize debris from feeding grounds for manta rays Mobulaalfredi and whale sharks Rhincodon typus in three coastal locations in Indonesia: NusaPenida Marine Protected Area, Komodo National Park, and Pantai Bentar, East Java.A 200 µm plankton net was used to sample the top 0.5 m of the water column(‘trawl survey’) and floating plastics were assessed along ∼440 m long transects (‘visualsurvey’) during the Indonesian north-west (wet) and south-east (dry) monsoon seasonsduring 2016–2018. Microplastics were identified visually, measured and categorizedfrom trawl samples, and larger floating plastics were counted and categorized visuallyfrom boats. Plastic abundance ranged widely from 0.04 to 0.90 pieces m−3 (trawlsurvey) and 210 to 40,844 pieces km−2 (visual survey). Results from linear modelsshowed significant seasonal and location differences in estimated plastic abundancefor trawl and visual surveys in Nusa Penida and Komodo. Plastic abundance was upto ∼ 44 times higher in the wet than the dry season, with the largest seasonal effectobserved in Nusa Penida. Overall, small pieces < 5 mm (≥ 78%), films and fragments(> 50% combined) were the most prevalent plastics. Theoretical plastic ingestion rateswere calculated using estimated filtration volumes of manta rays and whale sharksand the mean plastic abundance in their feeding grounds. Upper plastic ingestionestimates for manta rays were ∼63 and 25 pieces h−1 for Nusa Penida and Komodolocations, respectively, and ∼137 pieces h−1 for whale sharks in Java. Analysis of manta
Frontiers in Marine Science | www.frontiersin.org 1 November 2019 | Volume 6 | Article 679

fmars-06-00679 November 8, 2019 Time: 14:46 # 2
Germanov et al. Microplastics in Indonesian Megafauna Habitats
ray egested material confirmed plastic ingestion, the consequences of which mightinclude exposure to toxic plastic additives and adhered persistent organic pollutants.Communicating this information to communities who stand to benefit from healthymegafauna populations might help local governments as they work toward reducingplastics in the marine environment.
Keywords: Mobula alfredi, Rhincodon typus, marine debris, conservation ecology, flagship species, base-line,seasonal, coastal survey
INTRODUCTION
The rising level of plastic debris in our oceans is a large-scale environmental problem with wide ranging impacts (vanSebille et al., 2015; Worm et al., 2017; Germanov et al.,2018). Perhaps most significantly, this form of pollution wreakshavoc on marine life (Gall and Thompson, 2015; Wilcoxet al., 2015, 2018; Worm et al., 2017). While large debrisalso impacts marine organisms (e.g., turtles, birds, sharks, andmammals), once broken down to microscopic sizes throughenvironmental exposure, microplastics are of growing concernas they easily enter food webs (Andrady, 2011; Worm et al.,2017). Microplastics, generally referred to as plastics < 5 mmin diameter (Andrady, 2011), are comparable in size to, orsmaller than zooplankton, an integral component in marineecosystems and the primary food for planktivores. These smallplastic particles are ingested by a range of organisms, includingzooplankton themselves (Cole et al., 2013; Setälä et al., 2014),small planktivorous fishes (Boerger et al., 2010) and filter-feedingmegafauna (Besseling et al., 2015).
In addition to the more obvious issues associated with theingestion of foreign, potentially indigestible objects – such asdigestive tract obstruction and perforation, dietary dilution andstarvation – plastics, are significant carriers of toxic additives suchas bisphenol A, phthalates, and flame retardants (Andrady, 2011;Worm et al., 2017; Germanov et al., 2018). Microplastic ingestionis proposed to impact gut biomes of host organisms, potentiallyleading to gut dysbiosis (reviewed by Fackelmann and Sommer,2019). Further, the hydrophobic nature of some plastics and theincreased surface area of microplastics, through pitting processes,create an ideal sink for persistent organic pollutants (POPs), suchas dichloro-diphenyl-trichloroethanes (DDTs), polychlorinatedbiphenyls (PCBs), polycyclic aromatic hydrocarbons (PAHs)(Rios et al., 2007, 2010; Ogata et al., 2009; Cole et al., 2011) andheavy metals (Ashton et al., 2010). Pollutants are concentratedup to a million-fold in microplastics compared to surroundingseawater (Mato et al., 2001). Upon plastic ingestion, these toxicchemicals can leach into organisms (Teuten et al., 2009) and maynegatively affect the physiology (Browne et al., 2013; Rochmanet al., 2013), development (Anselmo et al., 2011) and endocrinefunctions (Rochman et al., 2014) of marine organisms (reviewedin Browne et al., 2015; Worm et al., 2017), even if the plasticpieces eventually pass through the digestive system. Long-livedspecies may bioaccumulate these pollutants over decades toconcentrations that lead to altered reproductive fitness (Reddyet al., 2001), which may further impact their young through
maternal offloading (e.g., Lyons et al., 2013a,b, 2014; Genov et al.,2019) leading to population level impacts (Worm et al., 2017).
Owing to their feeding strategies, filter-feeding megafaunaare particularly susceptible to microplastic ingestion (Germanovet al., 2018), while their longevity (Stevens, 2016; Stewart et al.,2018) increases the risks of pollutant bioaccumulation. In anumber of studies on filter-feeding megafauna, Fossi et al. (2014,2016, 2017) documented trace levels of phthalates and POPs inthe muscle of basking sharks Cetorhinus maximus, the blubberof fin whales Balaenoptera physalus and the skin of whale sharksRhincodon typus. For phthalates, a plastic additive and chemicaltracer, and probably with POPs, these chemicals are likely to havebeen acquired through plastic ingestion.
Filter-feeding reef and giant manta rays (Mobula alfredi, andM. birostris, respectively) and whale sharks are likely to feed ina variety of habitats, including deep and pelagic environments(Couturier et al., 2013), and they are commonly observedfeeding near the surface in shallow coastal waters (Jaine et al.,2012; Rohner et al., 2015; Armstrong et al., 2016; Germanovet al., 2019). Several types of plastic polymers are buoyant inseawater and accumulate in the surface layer of the water column(Andrady, 2011). Additionally, microplastics might be acquiredindirectly through ingestion of plankton that have ingestedmicroplastics (Cole et al., 2013; Setälä et al., 2014). Habitat rangesfor many filter feeding megafauna also overlap with areas of heavyplastic pollution such as the Coral Triangle (Maximenko et al.,2012; Eriksen et al., 2014; van Sebille et al., 2015; reviewed byGermanov et al., 2018).
Indonesia is situated within the Coral Triangle, a significantregion for global marine biodiversity (Gray, 1997; Worm andBranch, 2012; Worm et al., 2017). It is home to many endemicand threatened marine species and boasts globally significantpopulations of manta rays (Germanov and Marshall, 2014;Germanov et al., 2019) and whale sharks (Norman et al., 2017).Currently, Indonesia is also ranked as the world’s second largestplastic marine debris emitter (Jambeck et al., 2015). In a sampleof fishes sold for human consumption from the Makassar fishmarket, Indonesia, over a quarter of the fishes, including over halfof the species sampled, contained plastic debris in their digestivetracts (Rochman et al., 2015). The impacts of plastic pollutionon megafauna in Indonesia and neighboring countries are alsonow being documented. Three recent examples of deceasedmarine mammals that have ingested substantial amounts ofplastic have been documented and have prompted concern forother species that live and feed in these polluted waters: asperm whale Physeter microcephalus in Indonesia (Victor, 2018);
Frontiers in Marine Science | www.frontiersin.org 2 November 2019 | Volume 6 | Article 679
fmars-06-00679 November 8, 2019 Time: 14:46 # 3
Germanov et al. Microplastics in Indonesian Megafauna Habitats
a pilot whale Globicephala macrorhynchus in southern Thailand(Zachos, 2018); and a juvenile Cuvier’s beaked whale Ziphiuscavirostris in the Philippines (British Broadcasting Corporation[BBC], 2019). In Australia, sea turtles, well-established to be atrisk of plastic ingestion, were recently evaluated to have a 50%risk of mortality upon ingesting as little as 14 pieces of plastic(Wilcox et al., 2018).
In Indonesia, among the megafauna most likely impacted byplastic pollution are manta rays and whale sharks (Germanovet al., 2019). They are globally threatened (Pierce andNorman, 2016; Marshall et al., 2018a,b) with the main threatscoming from direct and indirect fisheries. Protecting thesespecies can be an economic benefit, as they are importantdrawcards for marine tourism in Indonesia (Gallagher andHammerschlag, 2011; O’Malley et al., 2013). In Indonesia,despite directed fisheries being formally outlawed throughoutthe entire Exclusive Economic Zone in 2014 (Ministry ofMarine Affairs and Fisheries, 2014), these species are stillexposed to other anthropogenic threats including boat strikes,and habitat destruction and disturbance, and the rising levelsof plastic pollution in coastal waters, particularly at feedinghabitats. In these plastic pollution hotspots, filter feederswould be at an elevated risk of ingesting microplastics andtainted zooplankton, and would be exposed to plastic associatedpollutants (Germanov et al., 2018).
To gain insight into the level of threat plastic debrisposes to Indonesia’s manta rays and whale sharks, it isimportant to quantify the abundance of plastic debris in feedinggrounds. While microplastic levels have been modeled globally(Maximenko et al., 2012; Eriksen et al., 2014; van Sebille et al.,2015), abundance estimates for microplastic pollution within theCoral Triangle and Indonesia vary considerably between models(van Sebille et al., 2015). Further, with a few exceptions (Manaluet al., 2017; Syakti et al., 2017), empirical data on microplasticsare lacking for coastal areas in Indonesia. Plastic abundance andtheoretical ingestion rates have been calculated for whale sharksfeeding in La Paz, Mexico (Fossi et al., 2017). However, to ourknowledge, no plastic abundance estimates for manta ray andwhale shark feeding grounds currently exist for Indonesia orthe greater Coral Triangle. Furthermore, while there is empiricalevidence that whale sharks ingest plastic (Haetrakul et al., 2009;Sampaio et al., 2018; Abreo et al., 2019; Donati et al., 2019),confirmation that manta rays ingest plastics is yet unavailable.Plastic ingestion by manta rays might be confirmed fromopportunistic stomach contents analysis of stranded individuals(e.g., Haetrakul et al., 2009; Besseling et al., 2015; Sampaioet al., 2018; Abreo et al., 2019) and could potentially alsobe assessed through non-invasive analysis of egested material(Donati et al., 2019).
Our primary aim of the study was to quantify the surfaceplastic abundance in coastal feeding grounds for manta rays andwhale sharks in Indonesia, within the Coral Triangle region,and establish if reef manta rays, hereafter ‘manta rays’ ingestplastics. The study region has a high but spatially variablehuman population density, is oceanographically complex, andhas strong seasonal weather patterns that influence regional riverpollution emissions (Lebreton et al., 2017). To that end, we
examined whether geographic and seasonal variations in plasticdebris abundance were evident. Based on these plastic abundanceestimates, we have provided theoretical plastic ingestion rates formanta rays and whale sharks in the region. Egested material frommanta rays was also analyzed for plastic content. By highlightingthe implications of plastic pollution to manta rays and whalesharks, we are effectively employing a flagship approach toconservation (Bowen-Jones and Entwistle, 2002; Barua, 2011;Verissimo et al., 2011) in the hopes of creating flow-on effectsfrom these iconic species to positively enhance the stewardship ofIndonesia’s marine ecosystems.
MATERIALS AND METHODS
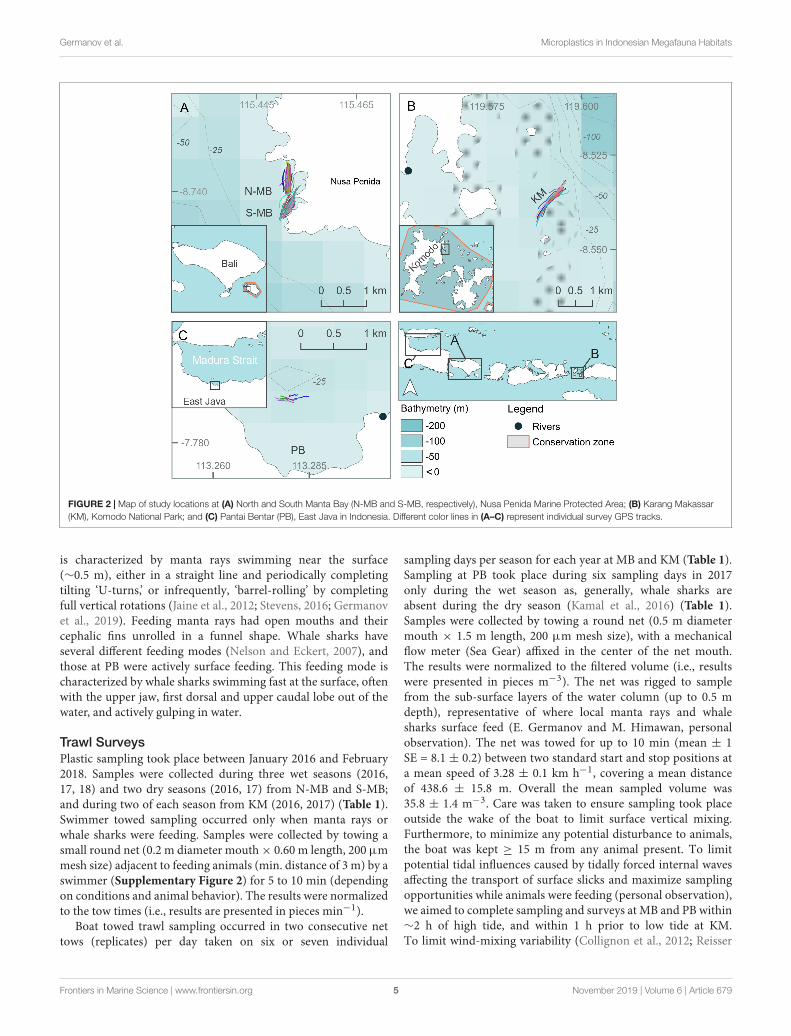
Study Locations and OceanographicConditionsThree separate locations within Java and the Lesser Sunda Islandchain of Indonesia that are frequented by feeding manta rays andwhale sharks (see below) were chosen as study sites (Figures 1, 2,created using QGIS Development Team, 2016; Table 1). MantaBay (MB), within the Nusa Penida Marine Protected Area(MPA) located to the south east of Bali Island (Figure 2A); andKarang Makassar (KM), in the central region of the KomodoNational Park (NP), Flores (Figure 2B) are year-round mantaray feeding grounds (Dewar et al., 2008; Germanov and Marshall,2014; Germanov et al., 2019). Pantai Bentar (PB), southeast ofProbolinggo, East Java (Figure 2C) is a seasonal (December–March) whale shark feeding ground (Kamal et al., 2016). The sitesconsist of: a shallow (5–20 m deep), steep cliff-lined bay withmixed sand, rock and reef substrate in the north-west sectionof Nusa Penida Island, referred to here as North and SouthMB (N-MB and S-MB); a shallow rubble and reef slope (6–20 m deep) east of Komodo Island (KM); and a large, shallow(0–20 m) mangrove fringed bay affected by river runoff andheavy sedimentation (E. Germanov, personal observation) nearPB beach. Nusa Penida MPA and Komodo NP, located along anisland chain, are situated on a shallow (< 200 m) continentalshelf with deep water basins (> 1,000 m) > 20 km offshore. TheMadura Strait, East Java, including PB, is entirely < 100 m indepth (Figure 1).
Oceanography in the RegionThe region has complex oceanography and the strong seasonalconditions that influence oceanographic conditions and rainfallthat varies between the study locations (Figure 3). Thus, weanticipated that there would be regional and seasonal differencesin plastic abundance between the study sites and tested for thesevariations. Generally, the region experiences substantial influencefrom the Indonesian Throughflow (ITF) (Tillinger, 2011) via theMakassar Current, estimated to transport up to 50% of the ITFvolume (Mayer and Damm, 2012). The majority of the MakassarCurrent flows southward through the Makassar Strait and passesthrough the Lombok Strait between the Islands of Lombok andBali and the eastern side of Nusa Penida as a surface current(Mayer and Damm, 2012). A portion of the Makassar currentalso enters the Flores Sea, north of Komodo NP, as a subsurface
Frontiers in Marine Science | www.frontiersin.org 3 November 2019 | Volume 6 | Article 679

fmars-06-00679 November 8, 2019 Time: 14:46 # 4
Germanov et al. Microplastics in Indonesian Megafauna Habitats
FIGURE 1 | Regional oceanographic details, river emission points and population density adjacent to study areas. Bathymetry information was available fromGEBCO_2014 Grid, version 20150318; www.gebco.net. River emission points available from Lebreton and Reisser (2018). Population information in15 min × 15 min grids (∼760 km2) using 2025 population projections available from Yetman et al. (2004).
current (Mayer and Damm, 2012). East of Bali, the ITF pathwayknown as the Karimata Strait, located between the islands ofKalimantan and Sumatra and Java, connects the South ChinaSea to the Java Sea. This pathway serves to bring less salinewater eastward toward the Flores Sea and into the MakassarStrait during the north-west monsoon season (Mayer and Damm,2012). The prevailing winds of the north-west and south-eastmonsoons generally act to decelerate the Makassar Current flow(Mayer and Damm, 2012), leading to seasonal differences inintensity, with it being greatest during the south-east monsoon(Sprintall et al., 2009). Further oceanographic influences onthe region come from the Indian Ocean (Ningsih et al., 2013;Hendrawan and Asai, 2011) and tidal currents that move north tosouth and vice versa through the straits surrounding the KomodoNP (Mehta-Erdmann, 2004).
The regional oceanic productivity, that sustains thefeeding grounds for megafauna (e.g., Dewar et al., 2008;Mayer and Damm, 2012; Thys et al., 2016), is owed to the
warmer (Tillinger, 2011) and nutrient rich Pacific waters (Ayerset al., 2014) carried by the ITF mixing with Indian Ocean waters.The area is further enriched by deep water upwelling to the southof the island chain, especially during the south-east monsoon(Ningsih et al., 2013). The two alternating monsoon seasons alsovary the amount of precipitation that falls on the region, whichis higher during the north-west monsoon (November–April),hereafter ‘wet’ season, compared to the south-east monsoon(May – October), hereafter ‘dry’ season (Chang et al., 2005).
Surveys and Sample AnalysisFeeding Behavior ObservationsFeeding behavior was assessed by observing manta rays andwhale sharks both from a boat and directly from underwater.Manta rays display different feeding behaviors (Stevens, 2016)and we observed surface feeding in our study (for a descriptionof manta ray behaviors see Germanov et al., 2019). This behavior
Frontiers in Marine Science | www.frontiersin.org 4 November 2019 | Volume 6 | Article 679
fmars-06-00679 November 8, 2019 Time: 14:46 # 5
Germanov et al. Microplastics in Indonesian Megafauna Habitats
FIGURE 2 | Map of study locations at (A) North and South Manta Bay (N-MB and S-MB, respectively), Nusa Penida Marine Protected Area; (B) Karang Makassar(KM), Komodo National Park; and (C) Pantai Bentar (PB), East Java in Indonesia. Different color lines in (A–C) represent individual survey GPS tracks.
is characterized by manta rays swimming near the surface(∼0.5 m), either in a straight line and periodically completingtilting ‘U-turns,’ or infrequently, ‘barrel-rolling’ by completingfull vertical rotations (Jaine et al., 2012; Stevens, 2016; Germanovet al., 2019). Feeding manta rays had open mouths and theircephalic fins unrolled in a funnel shape. Whale sharks haveseveral different feeding modes (Nelson and Eckert, 2007), andthose at PB were actively surface feeding. This feeding mode ischaracterized by whale sharks swimming fast at the surface, oftenwith the upper jaw, first dorsal and upper caudal lobe out of thewater, and actively gulping in water.
Trawl SurveysPlastic sampling took place between January 2016 and February2018. Samples were collected during three wet seasons (2016,17, 18) and two dry seasons (2016, 17) from N-MB and S-MB;and during two of each season from KM (2016, 2017) (Table 1).Swimmer towed sampling occurred only when manta rays orwhale sharks were feeding. Samples were collected by towing asmall round net (0.2 m diameter mouth × 0.60 m length, 200 µmmesh size) adjacent to feeding animals (min. distance of 3 m) by aswimmer (Supplementary Figure 2) for 5 to 10 min (dependingon conditions and animal behavior). The results were normalizedto the tow times (i.e., results are presented in pieces min−1).
Boat towed trawl sampling occurred in two consecutive nettows (replicates) per day taken on six or seven individual
sampling days per season for each year at MB and KM (Table 1).Sampling at PB took place during six sampling days in 2017only during the wet season as, generally, whale sharks areabsent during the dry season (Kamal et al., 2016) (Table 1).Samples were collected by towing a round net (0.5 m diametermouth × 1.5 m length, 200 µm mesh size), with a mechanicalflow meter (Sea Gear) affixed in the center of the net mouth.The results were normalized to the filtered volume (i.e., resultswere presented in pieces m−3). The net was rigged to samplefrom the sub-surface layers of the water column (up to 0.5 mdepth), representative of where local manta rays and whalesharks surface feed (E. Germanov and M. Himawan, personalobservation). The net was towed for up to 10 min (mean ± 1SE = 8.1 ± 0.2) between two standard start and stop positions ata mean speed of 3.28 ± 0.1 km h−1, covering a mean distanceof 438.6 ± 15.8 m. Overall the mean sampled volume was35.8 ± 1.4 m−3. Care was taken to ensure sampling took placeoutside the wake of the boat to limit surface vertical mixing.Furthermore, to minimize any potential disturbance to animals,the boat was kept ≥ 15 m from any animal present. To limitpotential tidal influences caused by tidally forced internal wavesaffecting the transport of surface slicks and maximize samplingopportunities while animals were feeding (personal observation),we aimed to complete sampling and surveys at MB and PB within∼2 h of high tide, and within 1 h prior to low tide at KM.To limit wind-mixing variability (Collignon et al., 2012; Reisser
Frontiers in Marine Science | www.frontiersin.org 5 November 2019 | Volume 6 | Article 679

fmars-06-00679 November 8, 2019 Time: 14:46 # 6
Germanov et al. Microplastics in Indonesian Megafauna Habitats
TABLE 1 | Research locations, sampling seasons and times, and the numbers of (A) feeding, (B) sub-surface, and (C) surface samples, (D) the sampling times inIndonesia from January, 2016 to February, 2018, and (E) egested material samples collected from 2016 to 2018.
Locations N-MB days/samples S-MB days/samples KM days/samples PB days/samples
Year Season
(A) Feeding (swimmer trawl)
2016 Wet1 1/1 2/2 2/2 −
Dry2 2/2 3/3 1/1 −
2017 Wet1 2/3 3/3 6/12 6/12
Dry2 2/2 3/3 1/1 −
2018 Wet1 3/6 3/5 − −
Dry2− − − −
Total wet 6/10 8/10 8/14 6/12
Total dry 4/4 6/6 2/2 −
Grand total 10/14 14/16 10/16 6/12
(B) Sub-surface (boat trawl)
2016 Wet1 6/12 6/12 6/12 −
Dry2 6/12 6/12 6/12 −
2017 Wet1 6/12 6/12 7/14 6/12
Dry2 6/12 6/12 7/14 −
2018 Wet1 6/12 6/12 − −
Dry2− − − −
Total wet 18/36 18/36 13/26 6/12
Total dry 12/24 12/24 13/26 −
Grand total 30/60 30/60 26/52 6/12
(C) Surface (visual survey)
2016 Wet1 6/18 6/18 6/12 −
Dry2 6/12 6/12 6/12 −
2017 Wet1 6/12 6/12 7/14 6/12
Dry2 6/12 6/12 7/14 −
2018 Wet1 6/12 6/12 − −
Dry2− − − −
Total wet 18/42 18/42 13/26 6/12
Total dry 12/24 12/24 13/26 −
Grand total 30/66 30/66 26/52 6/12
(D) Sampling times
1 January–March January–March April–May February2 August–October August–October August–October n/a
(E) Egested material
Type Location Samples
Fecal Nusa Penida MPA 21
Vomit Nusa Penida MPA 1
N-MB, North Manta Bay (−8.735, 115.451); S-MB, South Manta Bay (−8.742, 115.451); Nusa Penida MPA; KM, Karang Makassar (−8.535, 119.593), Komodo NP;PB, Pantai Bentar (−7.774, 113.281), East Java; “-” indicates no samples were available for this time.
et al., 2013), surveys were completed under Beaufort wind scaleconditions of ≤ 4.
Our trawl methodology is appropriate for manta ray andwhale shark feeding ecology studies (Couturier et al., 2013;Rohner et al., 2015), but differs from the standard microplasticmethodology using neuston or ‘manta’ nets (Reisser et al., 2013;
Eriksen et al., 2014 and reviewed by Hidalgo-Ruz et al., 2012).Neuston or ‘manta’ nets, rigged to sample from the surface-water interface will sample proportionally sample more fromthe surface than a similarly rigged net with a round opening,as the rectangular mouth opening of the net would sampleequally from the surface-water interface as below the surface (see
Frontiers in Marine Science | www.frontiersin.org 6 November 2019 | Volume 6 | Article 679
fmars-06-00679 November 8, 2019 Time: 14:46 # 7
Germanov et al. Microplastics in Indonesian Megafauna Habitats
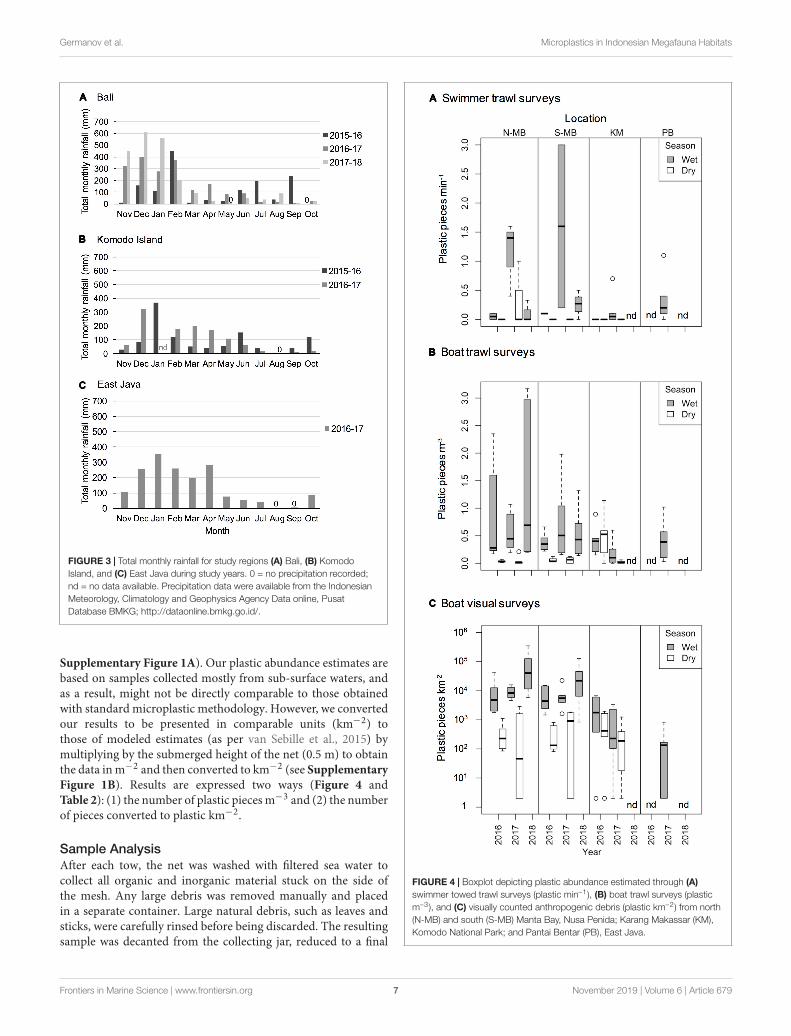
FIGURE 3 | Total monthly rainfall for study regions (A) Bali, (B) KomodoIsland, and (C) East Java during study years. 0 = no precipitation recorded;nd = no data available. Precipitation data were available from the IndonesianMeteorology, Climatology and Geophysics Agency Data online, PusatDatabase BMKG; http://dataonline.bmkg.go.id/.
Supplementary Figure 1A). Our plastic abundance estimates arebased on samples collected mostly from sub-surface waters, andas a result, might not be directly comparable to those obtainedwith standard microplastic methodology. However, we convertedour results to be presented in comparable units (km−2) tothose of modeled estimates (as per van Sebille et al., 2015) bymultiplying by the submerged height of the net (0.5 m) to obtainthe data in m−2 and then converted to km−2 (see SupplementaryFigure 1B). Results are expressed two ways (Figure 4 andTable 2): (1) the number of plastic pieces m−3 and (2) the numberof pieces converted to plastic km−2.
Sample AnalysisAfter each tow, the net was washed with filtered sea water tocollect all organic and inorganic material stuck on the side ofthe mesh. Any large debris was removed manually and placedin a separate container. Large natural debris, such as leaves andsticks, were carefully rinsed before being discarded. The resultingsample was decanted from the collecting jar, reduced to a final
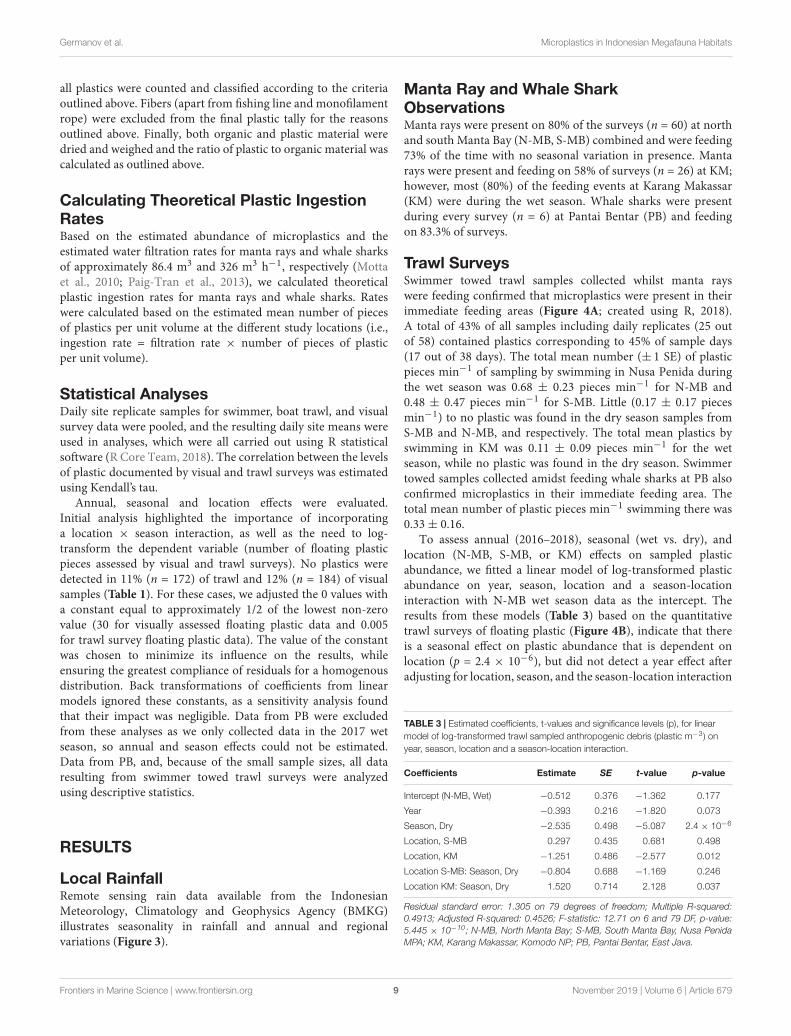
FIGURE 4 | Boxplot depicting plastic abundance estimated through (A)swimmer towed trawl surveys (plastic min–1), (B) boat trawl surveys (plasticm–3), and (C) visually counted anthropogenic debris (plastic km–2) from north(N-MB) and south (S-MB) Manta Bay, Nusa Penida; Karang Makassar (KM),Komodo National Park; and Pantai Bentar (PB), East Java.
Frontiers in Marine Science | www.frontiersin.org 7 November 2019 | Volume 6 | Article 679

fmars-06-00679 November 8, 2019 Time: 14:46 # 8
Germanov et al. Microplastics in Indonesian Megafauna Habitats
TABLE 2 | Floating plastic debris abundance estimates for each sampling location and season and pooled across years.
Trawl survey Visual survey
Location Season Plastic m−3
Mean ± SEPlastic m−3
MedianPlastic km−2
Mean ± SEPlastic km−2
MedianPlastic (g) km−2
Mean ± SEPlastic:
plankton (g)Plastic km−2
Mean ± SEPlastic km−2
Median
Nusa Penida
N-MB Wet 0.56 ± 0.12 0.35 275,210 ± 57,504 175,000 399 ± 130 0.11:1 17,520 ± 7,093 6,565
S-MB Wet 0.90 ± 0.23 0.41 449,381 ± 115,545 202,500 22,190 ± 17,997 0.98:1 40,844 ± 19,909 11,606
N-MB Dry 0.06 ± 0.01 0.05 28,261 ± 6,270 22,500 7 ± 5 0:1 608 ± 190 401
S-MB Dry 0.04 ± 0.02 0.02 20,200 ± 8,243 10,000 4 ± 4 0:1 649 ± 254 228
Komodo
KM Wet 0.29 ± 0.07 0.21 144,073 ± 36,383 105,000 4 ± 3 0:1 2,004 ± 647 851
KM Dry 0.24 ± 0.10 0.05 119,275 ± 48,994 25,000 2 ± 2 0:1 559 ± 182 262
East Java
PB Wet 0.42 ± 0.15 0.39 207,806 ± 74,217 192,500 0 ± 0 0:1 210 ± 126 135
N-MB, North Manta Bay; S-MB, South Manta Bay; Nusa Penida MPA; KM, Karang Makassar, Komodo NP; PB, Pantai Bentar, East Java.
volume of 50 or 100 ml (depending on the density of plankton)and preserved in a 5% formaldehyde-seawater buffered solution.Samples were stored in the 5% formaldehyde solution or weretransferred to 70% ethanol for storage prior to analysis.
The plastics were separated from the organic materialgravimetrically (Collignon et al., 2012) in filtered sea waterfor 10–16 h (overnight) in 1 L graduated cylinders (organicmatter settled on the bottom of the cylinders while plasticsfloated). Visible pieces of plastic were separated from the solutionusing forceps and the top water layer containing microplasticswas siphoned, transferred to filter paper (Whatman No.1) anddried at room temperature. The organic layer was thoroughlychecked for any remaining plastics, which were added to thefilter paper. Once dry, the filter paper was examined for plasticusing a dissecting microscope. Plastics were counted, measured(length = longest side), and sorted by size class (< 1, 1.01–5, 5.01–200, and > 200 mm; Eriksen et al., 2014), and type (‘film,’ ‘foam,’‘fragment,’ ‘line,’ and ‘other’; Rochman et al., 2015). Plastic piecesas small as 0.1 mm were considered with no upper size limit.For this study, we considered all plastics that were collected inour trawls and going forward we use the term ‘microplastics’ todistinguish plastic pieces < 5 mm as is the commonly accepteddefinition (e.g., Andrady, 2011). A plastic particle was consideredto be ‘film’ if it was thin and bent easily; ‘foam’ if it was thickerand compressed under light pressure; ‘fragment’ if it was hard,often brittle under light pressure; ‘line” if it had an elongated,cylindrical shape, bent easily, but was hard under light pressure;and ‘other’ included paint fragments, which were opaque, thinpieces that fragmented easily under light pressure, and tar, whichwas black in color and viscous. Fibers, apart from fishing lineand monofilament rope, were excluded from the results, as wecould not guarantee that samples were free from airborne fibercontamination during sample analysis (Rochman et al., 2015).When it was unsure if a particle was composed of plastic itwas touched with a hot needle point, and particles that meltedwere confirmed as plastic (Vandermeersch et al., 2015; Roch andBrinker, 2017; Shim et al., 2017). Plastic and biological materialwere dried (24 h at 60◦C) and weighed separately to calculate theweight ratio of plastic to plankton for each sample.
Visual SurveysVisual survey transects of floating plastic debris were carried outsimultaneously with the net tows. Additionally, during the 2016wet season in MB a third daily replicate of the visual surveyswas recorded (Table 1). Dedicated observers stood on the bowof the small motorized boats and noted debris items within 5 mof either side of the boats during timed observation periods, withGPS points taken for the start and end positions of each transect.These positions were used to denote the length of the transect andcalculate the area surveyed (Eriksen et al., 2014). The results areexpressed in number of plastic pieces km−2. Debris observationswere broken down into five categories: plastic ‘films’ (i.e., bagsand wrappers), plastic ‘fragments’ (i.e., hard plastic), ‘foam’ (i.e.,foamed polystyrene), ‘bottle’ (i.e., beverage bottles and single useplastic cups) and ‘other’ items such as plastic drinking straws,cigarette butts, sandals and ropes, representing commonly founditems and plastic polymer types found in the marine environment(Andrady, 2011).
Manta Ray Egested Material Collectionand AnalysisManta ray fecal matter or vomit (i.e., egested material) wascollected opportunistically during recreational dives by diveprofessionals in the local dive community. Once egested materialwas released into the open water column by the manta ray, anydensely packed matter was immediately collected into 50 mlconical polypropylene containers with a screw cap, keeping thematerial as intact as possible. Overall, a total of 22 samples ofegested material (21 fecal and one vomit sample) were collectedfrom within the Nusa Penida MPA.
Samples were stored at −20◦C until analysis. Prior to analysis,the samples were thawed at 4◦C before examining the contentscarefully at 40X magnification in a glass Petri dish using astereomicroscope. Plastic pieces were removed using forcepsand placed on filter paper. The remaining organic material wasseparated gravimetrically and floating plastic was separated asoutlined above. Subsequently, the remaining biological materialand debris transferred to filter paper were carefully examined and
Frontiers in Marine Science | www.frontiersin.org 8 November 2019 | Volume 6 | Article 679
fmars-06-00679 November 8, 2019 Time: 14:46 # 9
Germanov et al. Microplastics in Indonesian Megafauna Habitats
all plastics were counted and classified according to the criteriaoutlined above. Fibers (apart from fishing line and monofilamentrope) were excluded from the final plastic tally for the reasonsoutlined above. Finally, both organic and plastic material weredried and weighed and the ratio of plastic to organic material wascalculated as outlined above.
Calculating Theoretical Plastic IngestionRatesBased on the estimated abundance of microplastics and theestimated water filtration rates for manta rays and whale sharksof approximately 86.4 m3 and 326 m3 h−1, respectively (Mottaet al., 2010; Paig-Tran et al., 2013), we calculated theoreticalplastic ingestion rates for manta rays and whale sharks. Rateswere calculated based on the estimated mean number of piecesof plastics per unit volume at the different study locations (i.e.,ingestion rate = filtration rate × number of pieces of plasticper unit volume).
Statistical AnalysesDaily site replicate samples for swimmer, boat trawl, and visualsurvey data were pooled, and the resulting daily site means wereused in analyses, which were all carried out using R statisticalsoftware (R Core Team, 2018). The correlation between the levelsof plastic documented by visual and trawl surveys was estimatedusing Kendall’s tau.
Annual, seasonal and location effects were evaluated.Initial analysis highlighted the importance of incorporatinga location × season interaction, as well as the need to log-transform the dependent variable (number of floating plasticpieces assessed by visual and trawl surveys). No plastics weredetected in 11% (n = 172) of trawl and 12% (n = 184) of visualsamples (Table 1). For these cases, we adjusted the 0 values witha constant equal to approximately 1/2 of the lowest non-zerovalue (30 for visually assessed floating plastic data and 0.005for trawl survey floating plastic data). The value of the constantwas chosen to minimize its influence on the results, whileensuring the greatest compliance of residuals for a homogenousdistribution. Back transformations of coefficients from linearmodels ignored these constants, as a sensitivity analysis foundthat their impact was negligible. Data from PB were excludedfrom these analyses as we only collected data in the 2017 wetseason, so annual and season effects could not be estimated.Data from PB, and, because of the small sample sizes, all dataresulting from swimmer towed trawl surveys were analyzedusing descriptive statistics.
RESULTS
Local RainfallRemote sensing rain data available from the IndonesianMeteorology, Climatology and Geophysics Agency (BMKG)illustrates seasonality in rainfall and annual and regionalvariations (Figure 3).
Manta Ray and Whale SharkObservationsManta rays were present on 80% of the surveys (n = 60) at northand south Manta Bay (N-MB, S-MB) combined and were feeding73% of the time with no seasonal variation in presence. Mantarays were present and feeding on 58% of surveys (n = 26) at KM;however, most (80%) of the feeding events at Karang Makassar(KM) were during the wet season. Whale sharks were presentduring every survey (n = 6) at Pantai Bentar (PB) and feedingon 83.3% of surveys.
Trawl SurveysSwimmer towed trawl samples collected whilst manta rayswere feeding confirmed that microplastics were present in theirimmediate feeding areas (Figure 4A; created using R, 2018).A total of 43% of all samples including daily replicates (25 outof 58) contained plastics corresponding to 45% of sample days(17 out of 38 days). The total mean number (± 1 SE) of plasticpieces min−1 of sampling by swimming in Nusa Penida duringthe wet season was 0.68 ± 0.23 pieces min−1 for N-MB and0.48 ± 0.47 pieces min−1 for S-MB. Little (0.17 ± 0.17 piecesmin−1) to no plastic was found in the dry season samples fromS-MB and N-MB, and respectively. The total mean plastics byswimming in KM was 0.11 ± 0.09 pieces min−1 for the wetseason, while no plastic was found in the dry season. Swimmertowed samples collected amidst feeding whale sharks at PB alsoconfirmed microplastics in their immediate feeding area. Thetotal mean number of plastic pieces min−1 swimming there was0.33 ± 0.16.
To assess annual (2016–2018), seasonal (wet vs. dry), andlocation (N-MB, S-MB, or KM) effects on sampled plasticabundance, we fitted a linear model of log-transformed plasticabundance on year, season, location and a season-locationinteraction with N-MB wet season data as the intercept. Theresults from these models (Table 3) based on the quantitativetrawl surveys of floating plastic (Figure 4B), indicate that thereis a seasonal effect on plastic abundance that is dependent onlocation (p = 2.4 × 10⁻⁶), but did not detect a year effect afteradjusting for location, season, and the season-location interaction
TABLE 3 | Estimated coefficients, t-values and significance levels (p), for linearmodel of log-transformed trawl sampled anthropogenic debris (plastic m−3) onyear, season, location and a season-location interaction.
Coefficients Estimate SE t-value p-value
Intercept (N-MB, Wet) −0.512 0.376 −1.362 0.177
Year −0.393 0.216 −1.820 0.073
Season, Dry −2.535 0.498 −5.087 2.4 × 10⁻⁶
Location, S-MB 0.297 0.435 0.681 0.498
Location, KM −1.251 0.486 −2.577 0.012
Location S-MB: Season, Dry −0.804 0.688 −1.169 0.246
Location KM: Season, Dry 1.520 0.714 2.128 0.037
Residual standard error: 1.305 on 79 degrees of freedom; Multiple R-squared:0.4913; Adjusted R-squared: 0.4526; F-statistic: 12.71 on 6 and 79 DF, p-value:5.445 × 10⁻¹⁰; N-MB, North Manta Bay; S-MB, South Manta Bay, Nusa PenidaMPA; KM, Karang Makassar, Komodo NP; PB, Pantai Bentar, East Java.
Frontiers in Marine Science | www.frontiersin.org 9 November 2019 | Volume 6 | Article 679

fmars-06-00679 November 8, 2019 Time: 14:46 # 10
Germanov et al. Microplastics in Indonesian Megafauna Habitats
(p = 0.073) (Table 3). Plastic at N-MB was 12.62 times moreabundant (p = 2.4 × 10⁻⁶) during the wet season than the dryseason for a given year (Table 3). Plastic abundance at S-MB inthe wet season is estimated to be 28.2 times more abundant atS-MB than plastic abundance in the dry season for a given year;however, this seasonal effect was not significantly different fromthe seasonal effect for N-MB (p = 0.246). The seasonal effect wasalso significant at KM (p = 0.037), but the size of the effect wassmaller than at MB – plastic was 2.8 times more abundant duringthe wet season than the dry season for a given year (Table 3).Plastic abundance was similar for nearby N-MB and S-MB duringthe wet season (p = 0.498), but 3.5 times greater (p = 0.012) atN-MB than at KM during the wet season (Table 3), indicatinggeographic differences in plastic abundance between these twolocations over 450 km apart. Testing for location effects excludedPB due to the availability of a single season of data (the 2017wet season only). However, the mean and median abundanceof plastic during the 2017 wet season at PB (207,806 ± 74,217)was similar in magnitude to those for MB and KM during thewet season (range of means: 144,073–449,381; see Figure 4Band Table 2).
Visual SurveysSimilar to trawl surveys, the linear model (Table 4) for visualsurveys of floating plastics (Figure 4C) identified a strongseasonal effect of plastic abundance that is dependent on locationbut failed to find an annual temporal effect (p = 0.131). Plasticwas an estimated 23 times more abundant (p = 7.83 × 10⁻⁷)during the wet season than the dry season at N-MB for a givenyear. Plastic abundance at S-MB in the wet season is estimatedto be 44.5 times greater than plastic abundance during the dryseason. Although this seasonal effect for S-MB was significant, itwas not significantly different than the seasonal effect for N-MB(p = 0.417), in line with what was observed with the trawl survey.In comparison to N-MB, a lesser (p = 0.008) seasonal effect wasobserved for KM with plastic abundance in the wet season anestimated 2.4 times greater than in the dry season for a given year(Table 4). Like trawl sampled plastic abundance, visually assessedplastic abundance during the wet season differed between N-MBand KM (p = 9.83 × 10⁻⁵) but not between S-MB and N-MB
TABLE 4 | Estimated coefficients, t-values and significance levels (p), for linearmodel of log-transformed visually counted anthropogenic debris (plastic km−2) onyear, location, season, and a location-season interaction.
Coefficients Estimate SE t-value p-value
Intercept (N-MB, Wet) 8.551 0.441 19.386 <2 × 10⁻¹⁶
Year 0.386 0.254 1.523 0.132
Season, Dry −3.137 0.585 −5.366 7.83 × 10⁻⁷
Location, S-MB 0.518 0.510 1.016 0.313
Location, KM −2.337 0.569 −4.104 9.83 × 10⁻⁵
Location S-MB: Season, Dry −0.658 0.807 −0.815 0.417
Location KM: Season, Dry 2.272 0.838 2.711 0.008
Residual standard error: 1.531 on 79 degrees of freedom; Multiple R-squared:0.5847; Adjusted R-squared: 0.5531; F-statistic: 18.54 on 6 and 79 DF, p-value:2.512 × 10⁻¹³.
(p = 0.313) (Table 4), further indicating a geographic effect onplastic abundance. Moreover, the amounts of visually assessedand trawl sampled plastic were dependent and concordant(Kendall’s tau coefficient = 0.42, z = 5.83, p = 5.60 × 10⁻⁹,n = 184) for all locations (including PB), indicating that visuallymonitoring plastic abundance might be sufficient to capture thebroader seasonal and geographic trends. However, the meanabundance of visually observed floating plastic at PB during thewet season (210 ± 126 plastic km−2) appears lower than that ofN-MB, S-MB, and KM during the same season (range of means:2,004–40,844, see Figure 4C and Table 2).
Characterization of DebrisMost (range: 78–98%) trawl sampled plastic pieces were < 5 mmlong in all study locations (Figure 5A). The majority ofplastic pieces at N-MB, S-MB, and KM were in the secondsmallest category (1–5 mm; 53–66%), while the smallest category(<1 mm) dominated at PB (53%). Larger plastic debris > 5 mm
FIGURE 5 | The size (A) and type (B) of anthropogenic debris recordedthrough trawl and visual (C) surveys from South (MB-S) and North (MB-N)Manta Bay, Nusa Penida, Karang Makassar (KM), Komodo National Park andPantai Bentar (PB), East Java pooled across years and presented as a fractionof the total amount.
Frontiers in Marine Science | www.frontiersin.org 10 November 2019 | Volume 6 | Article 679
fmars-06-00679 November 8, 2019 Time: 14:46 # 11
Germanov et al. Microplastics in Indonesian Megafauna Habitats
long was present at all locations, but its contribution to the totalplastics was generally small and varied among locations (2–22%).
Overall, the trawl sampled debris was mostly composed ofplastic ‘films’ (range: 28–55%), with the exception of the dryseason in KM (13%), and plastic ‘fragments’ (range: 20–65%)(Figure 5B). At N-MB and S-MB, 35–55% of debris were plastic‘films’ and 20–43% were plastic ‘fragments.’ At KM, plastic‘fragments’ were most common (63–65%) during both seasons;whereas, during the wet season, 28% of debris were plastic ‘films’compared to 13% in the dry season (Figure 5B). Plastic debris atPB during the wet season was approximately equally composed of‘films’ (33%), ‘fragments’ (35%) and ‘other’ debris (32%), whichwas mostly paint fragments. Debris classified as ‘other’ (range:1–25%) included paint fragments and tar for N-MB, S-MB, andKM. A total of 458 fibers were found in all samples and wereexcluded from debris counts. The types of debris found in theswimmer towed samples amidst feeding manta rays from MBand the number of pieces (in parentheses) included films (9),fragments (5), foam (1), lines (2) and other items, including paintfragments and tar (3). The types of debris collected by swimmertowed samples from KM included fragments (3) and tar (1).The types of debris found in swimmer towed samples from PBwere films (2), fragments (3) and other items (6), including paintfragments and tar. Fibers were found in 43% (25) of all samplesbut were excluded from plastic calculations.
The visually counted plastic debris was mostly plastic‘films’ (range: 45–87%) and plastic ‘fragments’ (range: 13–24%;Figure 5C) corresponding to the most common types of trawlsampled debris (Figure 5B). Foamed polystyrene was commonlyobserved at N-MB, S-MB, and KM making up 3–13% of debris.Whole bottles and single use cups (counted as ‘bottle’) were alsocommonly observed at the sites in Nusa Penida, regardless ofseason, and in Komodo during the dry season, making up 9–18% of floating debris. Items classified as ‘other’ in visual surveysincluded plastic straws, cigarette butts, ropes, sandals, shoe soles,and other rubber items.
Plastic IngestionIn MB, based on mean plastic abundance estimates for the northand south sections of the bay combined, the estimated plasticingestion by manta rays was 62.7 pieces h−1 during the wetseason and 4.4 pieces h−1 during the dry season (Table 5). Thesevalues compare with estimated ingestion rates for KM of 25.1pieces h−1 during the wet season and 20.7 pieces h−1 during thedry season. In PB, the estimated wet season plastic ingestion bywhale sharks was ∼136.9 pieces h−1. Based on the ratio of plasticto plankton by weight (Table 3), in the wet season, manta rays inMB might be ingesting between 110 and 980 g of plastic for everykg of plankton. However, unlike plastic, plankton abundanceby weight did not appear to vary seasonally for MB and KM(Supplementary Figure 3).
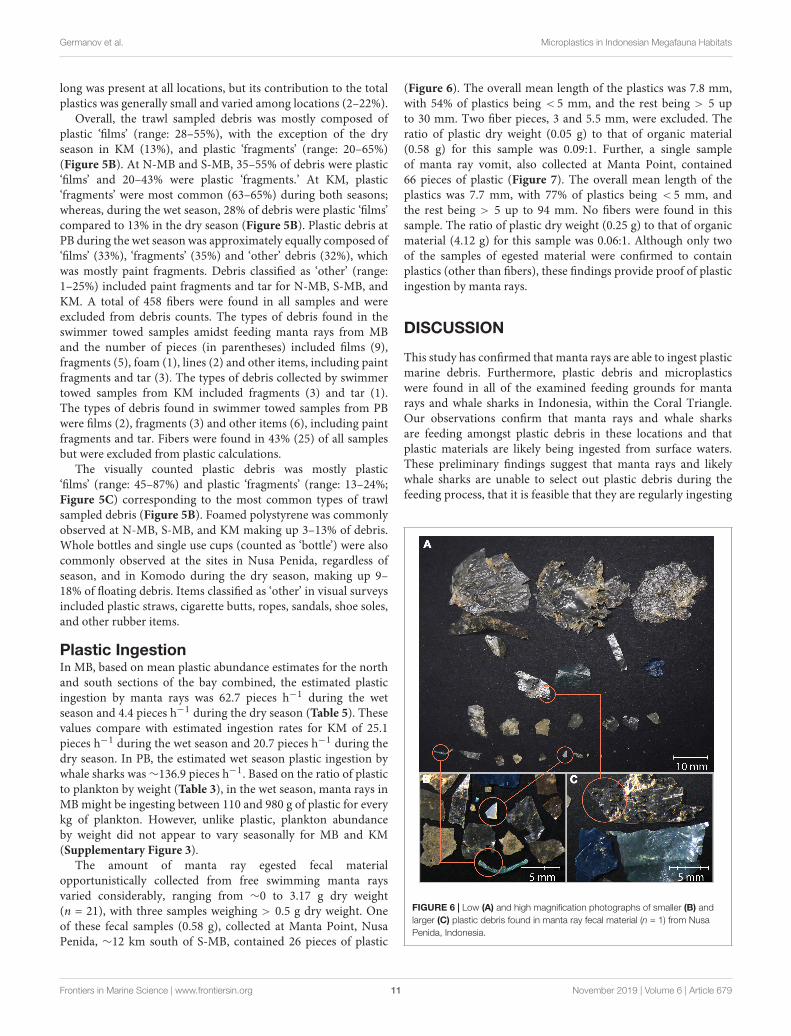
The amount of manta ray egested fecal materialopportunistically collected from free swimming manta raysvaried considerably, ranging from ∼0 to 3.17 g dry weight(n = 21), with three samples weighing > 0.5 g dry weight. Oneof these fecal samples (0.58 g), collected at Manta Point, NusaPenida, ∼12 km south of S-MB, contained 26 pieces of plastic
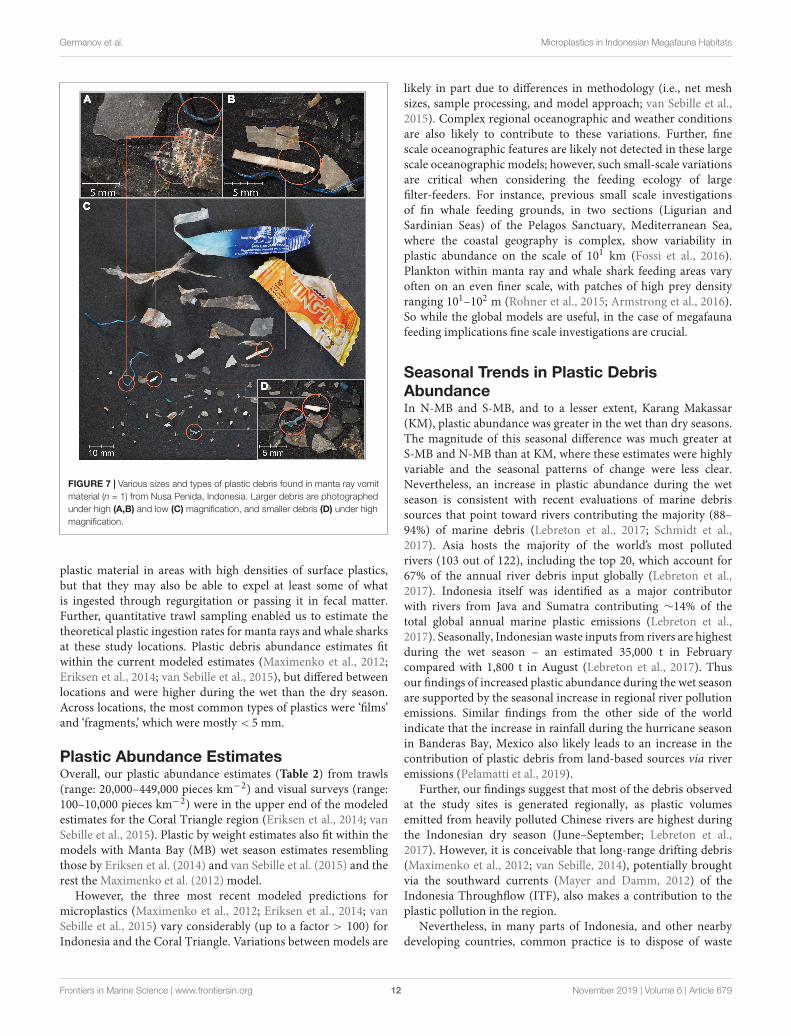
(Figure 6). The overall mean length of the plastics was 7.8 mm,with 54% of plastics being < 5 mm, and the rest being > 5 upto 30 mm. Two fiber pieces, 3 and 5.5 mm, were excluded. Theratio of plastic dry weight (0.05 g) to that of organic material(0.58 g) for this sample was 0.09:1. Further, a single sampleof manta ray vomit, also collected at Manta Point, contained66 pieces of plastic (Figure 7). The overall mean length of theplastics was 7.7 mm, with 77% of plastics being < 5 mm, andthe rest being > 5 up to 94 mm. No fibers were found in thissample. The ratio of plastic dry weight (0.25 g) to that of organicmaterial (4.12 g) for this sample was 0.06:1. Although only twoof the samples of egested material were confirmed to containplastics (other than fibers), these findings provide proof of plasticingestion by manta rays.
DISCUSSION
This study has confirmed that manta rays are able to ingest plasticmarine debris. Furthermore, plastic debris and microplasticswere found in all of the examined feeding grounds for mantarays and whale sharks in Indonesia, within the Coral Triangle.Our observations confirm that manta rays and whale sharksare feeding amongst plastic debris in these locations and thatplastic materials are likely being ingested from surface waters.These preliminary findings suggest that manta rays and likelywhale sharks are unable to select out plastic debris during thefeeding process, that it is feasible that they are regularly ingesting
FIGURE 6 | Low (A) and high magnification photographs of smaller (B) andlarger (C) plastic debris found in manta ray fecal material (n = 1) from NusaPenida, Indonesia.
Frontiers in Marine Science | www.frontiersin.org 11 November 2019 | Volume 6 | Article 679
fmars-06-00679 November 8, 2019 Time: 14:46 # 12
Germanov et al. Microplastics in Indonesian Megafauna Habitats
FIGURE 7 | Various sizes and types of plastic debris found in manta ray vomitmaterial (n = 1) from Nusa Penida, Indonesia. Larger debris are photographedunder high (A,B) and low (C) magnification, and smaller debris (D) under highmagnification.
plastic material in areas with high densities of surface plastics,but that they may also be able to expel at least some of whatis ingested through regurgitation or passing it in fecal matter.Further, quantitative trawl sampling enabled us to estimate thetheoretical plastic ingestion rates for manta rays and whale sharksat these study locations. Plastic debris abundance estimates fitwithin the current modeled estimates (Maximenko et al., 2012;Eriksen et al., 2014; van Sebille et al., 2015), but differed betweenlocations and were higher during the wet than the dry season.Across locations, the most common types of plastics were ‘films’and ‘fragments,’ which were mostly < 5 mm.
Plastic Abundance EstimatesOverall, our plastic abundance estimates (Table 2) from trawls(range: 20,000–449,000 pieces km−2) and visual surveys (range:100–10,000 pieces km−2) were in the upper end of the modeledestimates for the Coral Triangle region (Eriksen et al., 2014; vanSebille et al., 2015). Plastic by weight estimates also fit within themodels with Manta Bay (MB) wet season estimates resemblingthose by Eriksen et al. (2014) and van Sebille et al. (2015) and therest the Maximenko et al. (2012) model.
However, the three most recent modeled predictions formicroplastics (Maximenko et al., 2012; Eriksen et al., 2014; vanSebille et al., 2015) vary considerably (up to a factor > 100) forIndonesia and the Coral Triangle. Variations between models are
likely in part due to differences in methodology (i.e., net meshsizes, sample processing, and model approach; van Sebille et al.,2015). Complex regional oceanographic and weather conditionsare also likely to contribute to these variations. Further, finescale oceanographic features are likely not detected in these largescale oceanographic models; however, such small-scale variationsare critical when considering the feeding ecology of largefilter-feeders. For instance, previous small scale investigationsof fin whale feeding grounds, in two sections (Ligurian andSardinian Seas) of the Pelagos Sanctuary, Mediterranean Sea,where the coastal geography is complex, show variability inplastic abundance on the scale of 101 km (Fossi et al., 2016).Plankton within manta ray and whale shark feeding areas varyoften on an even finer scale, with patches of high prey densityranging 101–102 m (Rohner et al., 2015; Armstrong et al., 2016).So while the global models are useful, in the case of megafaunafeeding implications fine scale investigations are crucial.
Seasonal Trends in Plastic DebrisAbundanceIn N-MB and S-MB, and to a lesser extent, Karang Makassar(KM), plastic abundance was greater in the wet than dry seasons.The magnitude of this seasonal difference was much greater atS-MB and N-MB than at KM, where these estimates were highlyvariable and the seasonal patterns of change were less clear.Nevertheless, an increase in plastic abundance during the wetseason is consistent with recent evaluations of marine debrissources that point toward rivers contributing the majority (88–94%) of marine debris (Lebreton et al., 2017; Schmidt et al.,2017). Asia hosts the majority of the world’s most pollutedrivers (103 out of 122), including the top 20, which account for67% of the annual river debris input globally (Lebreton et al.,2017). Indonesia itself was identified as a major contributorwith rivers from Java and Sumatra contributing ∼14% of thetotal global annual marine plastic emissions (Lebreton et al.,2017). Seasonally, Indonesian waste inputs from rivers are highestduring the wet season – an estimated 35,000 t in Februarycompared with 1,800 t in August (Lebreton et al., 2017). Thusour findings of increased plastic abundance during the wet seasonare supported by the seasonal increase in regional river pollutionemissions. Similar findings from the other side of the worldindicate that the increase in rainfall during the hurricane seasonin Banderas Bay, Mexico also likely leads to an increase in thecontribution of plastic debris from land-based sources via riveremissions (Pelamatti et al., 2019).
Further, our findings suggest that most of the debris observedat the study sites is generated regionally, as plastic volumesemitted from heavily polluted Chinese rivers are highest duringthe Indonesian dry season (June–September; Lebreton et al.,2017). However, it is conceivable that long-range drifting debris(Maximenko et al., 2012; van Sebille, 2014), potentially broughtvia the southward currents (Mayer and Damm, 2012) of theIndonesia Throughflow (ITF), also makes a contribution to theplastic pollution in the region.
Nevertheless, in many parts of Indonesia, and other nearbydeveloping countries, common practice is to dispose of waste
Frontiers in Marine Science | www.frontiersin.org 12 November 2019 | Volume 6 | Article 679

fmars-06-00679 November 8, 2019 Time: 14:46 # 13
Germanov et al. Microplastics in Indonesian Megafauna Habitats
in open dumping grounds close to river beds (Hoornweg andBhada-Tata, 2012). With the onset of the wet season, river bedsswell to accommodate the increased water volume and in theprocess deliver debris to the marine environment. Thus wastemanagement efforts should be focused on preventing wastefrom entering the marine environment prior to the start ofwet season. Such intervention could be in the form of riverbed cleanups, prohibition and enforcing a moratorium on wastedisposal nearby water sources. In addition, the introduction ofcontained waste disposal facilities, located away from rivers andcoastlines is needed throughout Indonesia and other developingcountries, especially in more remote and rural areas that currentlylack access to any waste disposal facilities.
Geographic Differences in Abundanceand Characteristics of PlasticsBoth trawl sampled and visually assessed plastic abundanceestimates were greater at MB than at KM, which is likelya factor of the distance of these locations from denselypopulated areas (Pedrotti et al., 2016) and rivers with substantialplastic emissions (Lebreton et al., 2017). Nusa Penida andthe MB sites, for instance, are in close proximity to someof Indonesia’s most populous islands, including Java, Bali andLombok, while Komodo NP is surrounded by the relativelysparsely populated islands of Sumbawa, Flores, and Sumba(Gaffin et al., 2004; Yetman et al., 2004). The study locationsadjacent to densely populated areas are likely to have a higherabundance of plastic debris (Pedrotti et al., 2016); however, localoceanographic conditions are likely to strongly influence thetrajectories of drifting plastic and thus the local abundance. Fine-scale oceanographic conditions in this region, such as extremetidal currents (Field and Gordon, 1996), complex shorelines(Sugimoto, 1975) and bathymetry could generate local gyres andtraps/sinks for plastics.
The higher percentage of smaller sized microplastics sampledin KM compared to those sampled from MB, suggest that theplastic pieces are either traveling from further locations andundergoing additional degradation through ultra-violet radiationand other environmental influences, or entering the marineenvironment at more advanced stages of fragmentation. Theremoteness of Komodo from major urban centers and large,plastic-emitting rivers suggests that plastic size is more likely tobe related to the distance and extended time for degradation thansize at entrance to the marine environment.
Plastic and anthropogenic debris abundance estimated fromtrawl surveys at Pantai Bentar (PB) during the 2017 wet seasonwas comparable to those estimated for MB and KM during thewet season, as well as for the a Cilacap coast of Java (0.27–0.54pieces m−3), Indonesia, adjacent to the emission points of theDonan and Serayu rivers (Syakti et al., 2017). Interestingly, theamount of visually observed floating plastics at PB was markedlylower and more similar to levels detected in MB and KM duringthe dry season. Further, microplastics sampled from PB hadthe highest percentage of particles < 1 mm compared to theother study locations. Given the proximity of PB to denselypopulated areas (e.g., Surabaya city with ∼3,457,00 people as of
2015; Indonesia Population, 2019) and river emission points, itis surprising that the larger debris size classes did not comprisea greater portion of the total plastic debris. Generally, there aremore river outflows on the east Java and Bali coastlines thanfurther east, like those adjacent to the Komodo NP. Thus wewould expect to find higher or comparable levels of plastic atPB and MB, to those at KM during the wet season. However,while the overall rainfall patterns are generally similar forthe three study sites during our study period (see Figure 3),regional variations and inter-annual differences (Hendrawanet al., 2019) likely influence the strength of river flows and thuspotentially plastic inputs.
A striking difference between the study locations was the waterclarity (E. Germanov, personal observation), with PB having highlevels of algae and sediment in the water, which could contributeto faster sinking of marine debris (i.e., vertical migration) andthus reduced detection at the surface. A faster vertical decent ofdebris might occur due to biofouling of larger buoyant items,such as plastic bags (i.e., film plastic) (reviewed in Cole et al.,2011; Lobelle and Cunliffe, 2011; Bond et al., 2018), as wellas the attachment of foreign particles such as clay minerals(Kowalski et al., 2016), which both would decrease the buoyancyof plastics. Further, the inflow of less saline water via the KarimataStrait (Mayer and Damm, 2012) and nearby rivers emissionsmight decrease the buoyancy of larger plastics and acceleratetheir migration into the sediments (Cole et al., 2011). Follow-up investigation of plastic abundance in the bottom sediments atPB is warranted.
The most abundant types of debris by both trawl samplingand visual observation, as well as those present in the mantaray egestion material, were plastic films. This category of plasticscorresponds to items commonly composed of Polyethylene (PE)polymers that have a lower density than sea water and arethus buoyant (Andrady, 2011). This observation coincides withPE being the most abundant plastic polymer in the marineenvironment (reviewed in Hidalgo-Ruz et al., 2012; Bond et al.,2018). Further, this is likely a reflection of the high level ofpackaging on consumer goods and single-use items, including‘sachets’ that are commonly used in Indonesia (Merkl et al.,2015). Film plastics are considered low value plastics for salesinto recycling and are rarely salvaged from waste streams (Merklet al., 2015). Although more valuable and readily recycled (Merklet al., 2015), other single use plastics commonly encounteredin our surveys were plastic bottles. Plastic bottles, composedof polyethylene terephthalate (PET), will eventually break upto plastic fragments, but are much more durable than PE(Muthukumar et al., 2011; Bond et al., 2018) and thus persistlonger and disperse further into the marine environment. Thedurability of plastic items, and the distance and time taken to‘arrive’ at the sampling locations, as well as the rates of verticalmigrations through biofouling, might explain the differencesin the plastic ‘signatures’ of the different locations that weinvestigated (e.g., more hard plastic fragments in KM than MB).Follow-up studies characterizing the polymers types present inthe microplastics can help link the plastic debris to consumergoods and help to identify their origin (Rios et al., 2010;Reisser et al., 2013; Pedrotti et al., 2016; Pelamatti et al., 2019).
Frontiers in Marine Science | www.frontiersin.org 13 November 2019 | Volume 6 | Article 679

fmars-06-00679 November 8, 2019 Time: 14:46 # 14
Germanov et al. Microplastics in Indonesian Megafauna Habitats
Further, as different polymers have different affinity properties(Bond et al., 2018), and contain different additives with variabletoxicity (Endo et al., 2005; Teuten et al., 2009), understanding thechemical composition of microplastics in this region will allow usto better evaluate the potential implications of plastic ingestionon manta rays, whale sharks and other filter-feeding megafauna(Germanov et al., 2018).
Theoretical Plastic Ingestion RatesThe plastic to plankton weight ratios estimated for manta rayand whale shark feeding grounds in the current study, apartfrom S-MB, were lower than the 0.5:1 ratio estimated for theMediterranean Sea (Collignon et al., 2012). As well as an indicatorof the high pollution levels in the Mediterranean Sea, perhapsthe lower ratios we observed are also a function of the regionalproductivity and the high plankton abundance in megafaunafeeding hotspots (Putra et al., 2016). Manta rays and whalesharks feed in high density prey patches to attain a positiveenergy balance, as feeding behavior is energetically costly (e.g.,Motta et al., 2010; Rohner et al., 2015; Armstrong et al., 2016).The necessity for high density plankton in areas where mantarays and whale sharks feed renders the plankton to plasticratio less informative than in other less productive regions. Theamount of plastic in Indonesian feeding grounds during the wetseason was comparable to the levels found in fin whale feedinggrounds within the Pelagos Sanctuary, Mediterranean Sea (≤0.62items m−3; Fossi et al., 2014, 2016) and higher than those inwhale shark feeding habitats within La Paz Bay, Sea of Cortez(≤0.14 items m−3; Fossi et al., 2017).
The estimated plastic ingestion rates for manta rays (∼63items h−1 in the wet season, ∼4 items h−1 in the dry seasonat MB; ≤ 25 items h−1 at KM) and the ratio of plastic toplankton indicate that in some locations during times of thehighest plastic abundance (wet season), manta rays might beingesting up to 980 g of plastic per kg of plankton. The ratiosof plastics to plankton noted from the egested material samplesare 10–16-fold lower, but nevertheless considerable. Further, weestimated that the whale sharks (∼137 items h−1) feeding at PBare ingesting up to sixfold higher amounts of plastic than thethose feeding in La Paz Bay (see Table 5; Fossi et al., 2017). Evenwith these higher estimates, we are likely to be underestimatingthe amount of plastic intake, as our abundance estimates arelimited to free-floating plastics and do not include any plasticsingested by plankton (Cole et al., 2013; Setälä et al., 2014). Plasticlevels have not been characterized in many other manta ray(Pelamatti et al., 2019) and whale shark feeding grounds, butdespite this general lack of comparisons, we think that large filter-feeders in Indonesia are likely to be feeding in more heavilypolluted waters than most other locations throughout their range(Germanov et al., 2018).
Information on the total daily time that individual whalesharks and manta rays spend feeding at PB and MB/KM,respectively, is not currently available. However, manta raysdisplay a high degree of residency to MB, especially immaturemanta rays, and are most commonly observed feeding year-round (Germanov et al., 2019). Further, high levels of habitatuse are documented for KM, with median individual visitations
lasting 2 h (Dewar et al., 2008). Returning to the same pollutedarea to feed for several hours each day would put these mantarays at high risk of ingesting substantial quantities of plastic.Interestingly, a sample of vomit containing plastics was collectedfrom a manta ray that had not been sighted at MB since 2015,which might indicate that feeding in other polluted areas isoccurring. Manta rays are likely feeding in other sites within thegreater region other than MB and KM (E. Germanov, personalobservation), and at depth (Couturier et al., 2013). Particularlyfor KM, seasonality appears to have an effect on feeding behaviorwith less feeding behavior observed at KM during the dry season,suggesting that manta rays are preferring to feed elsewhere at thistime. However, based on the weight of plankton collected at bothMB and KM, which was similar for both wet and dry seasons, wewere unable to relate plankton availability with plastic abundance.
To fully grasp the level of threat from plastic ingestion itis necessary to gain a greater understanding of feeding ecologyfor manta rays and the variety of locations used in the region.Plastic abundance is yet to be evaluated in other known feedinggrounds within the region (e.g., Raja Ampat, Setyawan et al.,2018; Perryman et al., 2019), and at different water depths wherefeeding might also occur. Tagging studies using transmitters withdepth and acceleration sensors (e.g., daily diary tags, Wilson et al.,2008; Gleiss et al., 2013) would enable studies of fine scale mantaray habitat use, visitation lengths, and behavior (e.g., feeding atthe surface, at depth vs. cleaning), thus improving estimates ofplastic exposure.
Implications of Plastic IngestionPlastic pieces in two samples of manta ray egested materialcollected within the Nusa Penida MPA confirm that plasticingestion by manta rays, including plastic > 5 mm, is feasible.Observing plastic in a fecal sample from a manta ray indicatesthat this manta ray has ingested plastic and that at least someof this plastic has passed through the entirety of its digestivetract and was excreted. Observing plastic in a vomit sample froma manta ray indicates that while plastic was ingested, it is alsopossible for manta rays to regurgitate plastic before it passesthrough the digestive system. It is not surprising that mantarays cannot selectively exclude microplastics from zooplanktonin their filter-feeding process, but empirical evidence until nowhas been lacking. Whale sharks are also confirmed to ingestplastics ranging from 15 to 200 mm in length, as shown fromnecropsies performed in Brazil (Sampaio et al., 2018), Thailand(Haetrakul et al., 2009), Philippines (Abreo et al., 2019), andMalaysia (Lee, 2019), by direct observations by Fossi et al. (2017)in La Paz Bay, Sea of Cortez, and analyzed from fecal samples(Donati et al., 2019). Ingestion of large plastic pieces is a concern,as the accumulation of plastic in the digestive system is morelikely. Plastic accumulation in the digestive tracts of marinemammals (Jacobsen et al., 2010; de Stephanis et al., 2013) andsea turtles (Stamper et al., 2009; Santos et al., 2015) is linkedto mortality and/or morbidity (either through dietary dilution,blockage or mechanical damage of intestinal tracts). While thelevels of plastic debris found in the stranded and deceased whalesharks mentioned above were not as high as those reported forsome stranded whales (e.g., 73.6 kg; Jacobsen et al., 2010), internal
Frontiers in Marine Science | www.frontiersin.org 14 November 2019 | Volume 6 | Article 679

fmars-06-00679
Novem
ber8,2019Tim
e:14:46#
15
Germ
anovetal.
Microplastics
inIndonesian
Megafauna
Habitats
TABLE 5 | A comparison of plastic abundance estimates in filter feeding megafauna foraging grounds, theoretical ingestion estimates and plastic associated pollutant levels (when available).
Location Region Species Season Plasticpieces(m−3)
Ingestionrate
(m3h−1
or ∗d−1)
Theoreticalplastic
ingestion(h−1 or ∗d−1)
MEHP (ng/g) HCB (ng/g) PCB (ng/g) DDT (ng/g) PBDE (ng/g) OCs (ng/g) References
MB, NusaPenida
CT Mobulaalfredi
Wet 0.55–0.90 86.4 h−1 62.7 h−1 / / / / / / Present study
MB, NusaPenida
CT Mobulaalfredi
Dry 0.04–0.06 86.4 h−1 4.4 h−1 / / / / / / Present study
KM, KomodoNP
CT Mobulaalfredi
Wet 0.29 86.4 h−1 25.1 h−1 / / / / / / Present study
KM, KomodoNP
CT Mobulaalfredi
Dry 0.24 86.4 h−1 20.7 h−1 / / / / / / Present study
PB, East Java CT Rhincodontypus
Wet 0.42 326 h−1 136.9 h−1 / / / / / / Present study
La Paz Bay SoC Rhincodontypus
January–February
0.0–0.14 326 h−1 22.8 h−1
171d−1∗#/ 0.19 ± 0.19a 11.4 ± 8.6a 1.3 ± 1.8a 0.29 ± 0.32a / Fossi et al.,
2017
La Paz Bay SoC Balaenopteraphysalus
/ 0.0–0.14 5,893 d−1∗ 825d−1∗ 40.0 ± 23.2b 38.5 ± 33.6c 8,754 ± 6543c 3,110 ± 2246c / 11,897 ± 6763c Fossi et al.,2014, 2016
PelagosSanctuary
Med Balaenopteraphysalus
June–September
0.62/0.31 5,893 d−1∗ 1,827/3,654d−1∗
54.8 ± 27.7b 29.9 ± 12.0c 13,327 ± 8548c 10,477 ± 7477c / 23,835 ± 15,057c Fossi et al.,2014, 2016
PelagosSanctuary
Med Cetorhinusmaximus
/ 0.62 881 h−1 540 h−1,13,110 d−1∗
/ 20.6c 1,483c 1,668c / / Fossi et al.,2014
CT, Coral Triangle; SoC, Sea of Cortez; Med, Mediterranean Sea. Wet = November–April; Dry = May–October ∗ daily ingestion estimate; # based on 7.5 h of feeding; (a) ng/g wet weight; (b) ng/g frozen weight; (c) ng/g lipidbasis. Abundance ± Standard Error. Pollutant concentrations ± Standard Deviation. MEHP, monoethylhexyl phthalic acid; HCB, hexachlorobenzene; PCB, polychlorinated biphenyl; DDT, dichlorodiphenyltrichloroethane;PBDEs, polybrominated diphenyl ethers; OCs, organochlorines.
Frontiersin
Marine
Science
|ww
w.frontiersin.org
15N
ovember
2019|Volum
e6
|Article
679

fmars-06-00679 November 8, 2019 Time: 14:46 # 16
Germanov et al. Microplastics in Indonesian Megafauna Habitats
perforations from what appeared to be a single hardened plasticstraw are believed to have caused the death of at least one whaleshark (Haetrakul et al., 2009).
The ability of manta rays and whale sharks (Donati et al., 2019)to regurgitate ingested plastic or pass it through their digestivesystems and eventually expel it is a positive finding. However,even if eventually expelled, while plastic is within the body ithas the potential to disrupt regular gut functioning (Fackelmannand Sommer, 2019) and to leach and desorb associated toxicchemicals, such as POPs and heavy metals (Teuten et al., 2009;Rochman et al., 2013, 2014; Tanaka et al., 2013), allowingthese chemicals to be absorbed by the organisms. Polyethylene(PE), the key component of films and fragments, is particularlyadsorbent for POPs (Teuten et al., 2009; Bond et al., 2018).Smaller particles, because of increased surface area, harbor higherlevels of POPs (Mato et al., 2001; Cole et al., 2011). Thusfinding that the majority of plastics in feeding grounds are small(< 5 mm) indicates an increased risk of pollutant exposure forfilter feeding megafauna feeding at these sites.
Plastic associated pollutants, including phthalates andbrominated flame retardants [e.g., polybrominated diphenylethers (PBDEs)] and POPs (DDTs, PCBs, and otherorganochlorine compounds) were detected in biopsy sampledskin from whale sharks feeding in La Paz Bay and blubber fromfin whales feeding in La Paz Bay and the Mediterranean Sea(Fossi et al., 2016, 2017). Microplastic abundance estimatesin PB and the theoretical estimates of plastic ingestion bywhale sharks at this location are markedly greater than thosefor La Paz Bay (Table 5). However, whether whale sharks,manta rays and other large filter feeders are exposed tocomparable or higher levels of POPs as those reported forLa Paz Bay and the Mediterranean is less certain. Based ona 2009 global assessment of POPs in coastal waters via theanalysis of PE pellets collected from beaches (Ogata et al.,2009), pollution levels of PCBs and DDTs were markedlylower in Jakarta Bay, Indonesia than those in the AmericanWest Coast and the Mediterranean Sea. However, more recentpellet analyses indicate that Indonesian pollution levels haveincreased (International Pellet Watch, 2019). Heavy metalcontamination of mobulids, including manta rays, has beenconfirmed (Essumang, 2010; Ooi et al., 2015); however, thiscontamination is yet to be linked to heavy metal exposure viaplastic ingestion.
An understanding of the implications of microplasticingestion on the population level, requires knowledge of thephysiological response of individuals, and how likely it isto influence their reproduction. As filter-feeders are likely tofeed from several locations, and plastic abundance is likelyto vary along these planes, quantifying the exposure of filter-feeders to pollutants that serve as a proxy for plastic exposure(Fossi et al., 2014, 2017), might better capture the level ofrisk to individuals and populations. Thus, future investigationsshould focus on quantifying the plastic associated pollutantcontamination levels of manta rays, whale sharks, and otherfilter-feeding megafauna within Indonesia and the greater CoralTriangle (see Germanov et al., 2018; Stewart et al., 2018for recent discussions on future direction recommendations).
Further, monitoring individual health might be achieved throughthe analysis of biomarker responses (Dove et al., 2012; Fossiet al., 2017). For example, some serum metabolites have beenassociated with the health of whale sharks in aquaria providinga starting point for assessing the health of wild individualsand populations (Dove et al., 2012). The first investigationusing CYP1A-like protein responses in whale sharks in thewild shows a positive correlation with some common plasticadditives (i.e., brominated flame retardants), suggesting thatinduction of this biomarker may serves as a warning indicatorof pollutant exposure in this species (Fossi et al., 2017). Long-term monitoring of health indexes for high risk populations willprovide insight into the implications of microplastic ingestionand exposure to associated pollutants, while broad regionalstudies will assist in identifying pollution hotspots, necessaryfor effective management of these threatened species. Focusingfurther research on these species is warranted, particularly aslarge filter-feeders are widely considered important sentinels forthe implications of plastic pollution in marine environments(Germanov et al., 2018; Nelms et al., 2019).
Efforts to Stem the Plastic TideIn 2017, in response to being ranked as the world’s secondlargest plastic marine debris emitter (Jambeck et al., 2015), mostlythrough river emissions (Lebreton et al., 2017), the Indonesiangovernment pledged 1 billion USD per annum toward reducingplastic marine debris in their waters by 70% before 2025(Langenheim, 2017). Recently, in December 2018, several majorIndonesian cites, including those in the Bali Province (Aqil,2018), enacted bans on frequently used single-use plastics suchas bags, straws and polystyrene containers, demonstrating thecommitment of government to addressing the plastic issue. Tothis end, our multi-year dataset can serve as a baseline formonitoring the plastic pollution in these coastal environmentswithin Bali Province and important habitats for threatenedspecies. Continuing to monitor these coastal environments andgaining an understanding of how local oceanography contributesto the accumulation of plastic debris along coastlines will becrucial as Indonesia’s government works to curb this threat.
CONCLUSION
We estimated plastic marine debris abundance and characterizedthe debris in three feeding grounds for manta rays andwhale sharks in Indonesia, thus providing the first empiricalestimates of plastics in megafauna feeding grounds for theregion. Our plastic abundance estimates are consistent withoverall modeled microplastic abundance estimates for thegreater region. Estimated pollution emission from regional riverssupport the relatively higher plastic abundance we observedduring the Indonesian wet season (November–April). Regionaldifferences in plastic abundance, prevalent plastic sizes and typesindicate that factors in addition to season, such as populationdensity and local oceanographic processes, influence localplastic debris abundance. Nevertheless, the seasonal variation inplastic abundance highlights that concentrating marine debris
Frontiers in Marine Science | www.frontiersin.org 16 November 2019 | Volume 6 | Article 679
fmars-06-00679 November 8, 2019 Time: 14:46 # 17
Germanov et al. Microplastics in Indonesian Megafauna Habitats
intervention and prevention measures from land-based sources,such as rivers, prior to the onset of the wet season wouldmaximize efforts to reduce plastic levels at the source.
This is the first study to provide theoretical estimatesof plastic marine debris ingestion for manta rays, as wellas for whale sharks in the Coral Triangle. Although, theextent of the impacts on individuals and populations remainunknown, manta rays ingested plastic marine debris, and itis likely that whale sharks also ingest plastics in this region.The urgency to reduce marine plastic pollution has becomea prominent environmental issue, and many countries arejoining global initiatives (e.g., Clean Seas Campaign, 2019)to reduce plastic waste and marine pollution. Incorporatingthe information gleaned from this study into educationalcampaigns that bring awareness about the potential impactsof plastic marine debris to flagship species, like manta rays,whale sharks and other charismatic megafauna (Bowen-Jonesand Entwistle, 2002; Germanov et al., 2018; Panti et al., 2019),might assist local governments as they attempt to socializeincreasing regulations on plastic usage and disposal. Theseefforts could have a positive effect in regions with significantmarine tourism industries, such as the Nusa Penida MPAand Komodo NP. Gaining the support of the public andcoastal communities will be key in tackling plastic marinedebris in the region, one of Indonesia’s, and the wholeof the Coral Triangle’s, biggest challenges in protecting itsmarine environments.
DATA AVAILABILITY STATEMENT
The raw data supporting the conclusions of this manuscript willbe made available by the authors, without undue reservation, toany qualified researcher.
ETHICS STATEMENT
This study was conducted under permits issued by the IndonesianMinistry of Research and Technology (Permit #458/SIP/FRP/E5/Dit. KI/XII/2015; Permit Extension#11/TKPIPA/E5/Dit.KI/XI/2016 and #86/EXT/SIP/FRP/E5/Dit.KI/XI/2017), theKomodo National Park (#SI.1432/BTNK-1/2016) and followingprotocols approved by the Murdoch University Animal EthicsCommittee (#R2781/15).
AUTHOR CONTRIBUTIONS
EG and AM conceived the study. EG, JA, RW, andMH collected the data. EG, JA, and RW analyzed thedata with the guidance from RA, CR, GH, and NL. EGwrote the manuscript with contribution to figures, drafting,critical review, and editorial input from AM, RA, CR, GH,and NL. All authors critically reviewed the manuscriptwith final proofs.
FUNDING
EG is supported by an Australian Postgraduate Award andMurdoch International Top Up (32608315), supported herdoctoral studies; CR was supported by two private trusts, Aqua-Firma and Waterlust; Ocean Park Conservation Foundation(FH04_1516) has funded a large portion of the fieldwork,logistics, and capacity building programs; Foundation Fortunasupported field work, laboratory analysis, logistics, and capacitybuilding programs; Idea Wild donated field sampling equipment;Mantahari Oceancare funded manta ray research capacitybuilding programs; PADI Foundation (14668) supportedfield work and logistics; and private donors, supported fieldwork and logistics. This research was generously supported byR. Horner and private donors; and through in-kind donations byArenui Boutique Liveaboard, Current Junkies Liveaboard, HappyDays yacht, Scuba Junkie Komodo, Manta Rhei Dive Center, andWunderpus Liveaboard.
ACKNOWLEDGMENTS
We are grateful for the study permit from the IndonesianMinistry of Research (Ristek Dikti). We are grateful for theassistance of students from Udayana University: R. A. Saraswati,S. Risuana, D. Damayanti, B. Gustavina, and A. Swarry;volunteers from the Marine Megafauna Foundation, especiallyL. Ellevog, L. Auditore, S. Mathews, G. Barford, S. Al Rashid,D. Whittle, and S. Kalucza; and to I. K. Riadiyasa, N. Lynch,and the local dive communities for their logistical help. Wethank Captains Diasa and Edy for assisting at Manta Bay; thecaptains and crew of the Busy Girl and Happy Days yachts,and the Komodo National Park staff and rangers A. Kefi,Y. Hamzan and D. Indriasari for assisting at the KomodoNational Park; and the local boat captains and representativesfor assisting at Pantai Bentar. We thank C. Parfitt, R. Horner,and P. Coulson for providing microscopy tools and/or assistance.We thank the members of Faculty of Marine Sciences andFisheries, Universitas Udayana, Bali, Indonesia and C. O.Lafuente for assisting in creating Figures 1, 2. Bathymetryinformation used in creating Figures 1, 2 was availablefrom: GEBCO_2014 Grid, version 20150318; www.gebco.net.River emission points for creating Figure 1 were availablefrom Lebreton and Reisser (2018). Population information in15 min × 15 min grids (∼ 760 km2) using 2025 populationprojections available from Yetman et al. (2004). We thank B.Wirayawan for assisting in access to precipitation data usedin creating Figure 3 (available from: Indonesian Meteorology,Climatology and Geophysics Agency Data online, Pusat DatabaseBMKG; http://dataonline.bmkg.go.id/).
SUPPLEMENTARY MATERIAL
The Supplementary Material for this article can be foundonline at: https://www.frontiersin.org/articles/10.3389/fmars.2019.00679/full#supplementary-material
Frontiers in Marine Science | www.frontiersin.org 17 November 2019 | Volume 6 | Article 679

fmars-06-00679 November 8, 2019 Time: 14:46 # 18
Germanov et al. Microplastics in Indonesian Megafauna Habitats
REFERENCESAbreo, N. A. S., Blatchley, D., and Superio, M. D. (2019). Stranded whale
shark (Rhincodon typus) reveals vulnerability of filter-feeding elasmobranchsto marine litter in the Philippines. Mar. Pollut. Bull. 141, 79–83. doi: 10.1016/j.marpolbul.2019.02.030
Andrady, A. L. (2011). Microplastics in the marine environment. Mar. Pollut. Bull.62, 1596–1605. doi: 10.1016/j.marpolbul.2019.02.030
Anselmo, H. M., Koerting, L., Devito, S., van den Berg, J. H., Johannes, H. J., andDubbeldam, M. (2011). Early life developmental effects of marine persistentorganic pollutants on the sea urchin Psammechinus miliaris. Ecotoxicol.Environ. Saf. 74, 2182–2192. doi: 10.1016/j.ecoenv.2011.07.037
Aqil, A. M. I. (2018). Ban Against Single-Use Plastic Bags, Half-Hearted Effort?Jakarta Post. Available at: https://www.thejakartapost.com/news/2018/12/28/ban-against-single-use-plastic-bags-half-hearted-effort.html (accessed March20, 2019).
Armstrong, A. O., Armstrong, A. J., Jaine, F. R., Couturier, L. I., Fiora, K., Uribe-Palomino, J., et al. (2016). Prey density threshold and tidal influence on reefmanta ray foraging at an aggregation site on the great barrier reef. PLoS One115:e0153393. doi: 10.1371/journal.pone.0153393
Ashton, K., Holmes, L., and Turner, A. (2010). Association of metals with plasticproduction pellets in the marine environment. Mar. Pollut. Bull. 60, 2050–2055.doi: 10.1016/j.marpolbul.2010.07.014
Ayers, J. M., Strutton, P. G., Coles, V. J., Hood, R. R., and Matear, R. J. (2014).Indonesian throughflow nutrient fluxes and their potential impact on Indianocean productivity. Geophys. Res. Lett. 41, 5060–5067.
Barua, M. (2011). Mobilizing metaphors: the popular use of keystone, flagship andumbrella species concepts. Biodivers. Conserv. 20:1427. doi: 10.1007/s10531-011-0035-y
Besseling, E., Foekema, E., Van Franeker, J., Leopold, M. F., Kühn, S., Rebolledo,E. B., et al. (2015). Microplastic in a macro filter feeder: humpback whaleMegaptera novaeangliae. Mar. Pollut. Bull. 95, 248–252. doi: 10.1016/j.marpolbul.2015.04.007
Boerger, C. M., Lattin, G. L., Moore, S. L., and Moore, C. J. (2010). Plastic ingestionby planktivorous fishes in the North Pacific Central Gyre. Mar. Pollut. Bull.6012, 2275–2278. doi: 10.1016/j.marpolbul.2010.08.007
Bond, T., Ferrandiz-Mas, V., Felipe-Sotelo, M., and van Sebille, E. (2018).The occurrence and degradation of aquatic plastic litter based on polymerphysicochemical properties: a review. Crit. Rev. Environ. Sci. Technol. 48, 1–38.doi: 10.1080/10643389.2018.1483155
Bowen-Jones, E., and Entwistle, A. (2002). Identifying appropriate flagship species:the importance of culture and local contexts. Oryx 36, 189–195. doi: 10.1017/S0030605302000261
British Broadcasting Corporation [BBC], (2019). Dead Whale ‘Had 40kg of PlasticIn Its Stomach’. London: BBC.
Browne, M. A., Niven, S. J., Galloway, T. S., Rowland, S. J., and Thompson,R. C. (2013). Microplastic moves pollutants and additives to worms, reducingfunctions linked to health and biodiversity. Curr. Biol. 23, 2388–2392. doi:10.1016/j.cub.2013.10.012
Browne, M. A., Underwood, A. J., Chapman, M. G., Williams, R., Thompson,R. C., and van Franeker, J. A. (2015). Linking effects of anthropogenic debristo ecological impacts. Proc. Biol. Sci. 282:20142929. doi: 10.1098/rspb.2014.2929
Chang, C., Wang, Z., McBride, J., and Liu, C. (2005). Annual cycle of SoutheastAsia-maritime continent rainfall and the asymmetric monsoon transition.J. Clim. 18, 287–301. doi: 10.1175/JCLI-3257.1
Clean Seas Campaign, (2019). Tide Turners. United Nations Environment. Availableat: https://www.cleanseas.org/tide-turners#governments (accessed April 17,2019).
Cole, M., Lindeque, P., Fileman, E., Halsband, C., Goodhead, R., Moger, J.,et al. (2013). Microplastic ingestion by zooplankton. Environ. Sci. Technol. 47,6646–6655. doi: 10.1021/es400663f
Cole, M., Lindeque, P., Halsband, C., and Galloway, T. S. (2011). Microplasticsas contaminants in the marine environment: a review. Mar. Pollut. Bull. 62,2588–2597. doi: 10.1016/j.marpolbul.2011.09.025
Collignon, A., Hecq, J., Glagani, F., Voisin, P., Collard, F., and Goffart, A. (2012).Neustonic microplastic and zooplankton in the North Western Mediterranean
Sea. Mar. Pollut. Bull. 64, 861–864. doi: 10.1016/j.marpolbul.2012.01.011
Couturier, L. I., Rohner, C. A., Richardson, A. J., Marshall, A. D., Jaine, F., Bennett,M. B., et al. (2013). Stable isotope and signature fatty acid analyses suggest reefmanta rays feed on demersal zooplankton. PLoS One 81:e77152. doi: 10.1371/journal.pone.0077152
de Stephanis, R., Giménez, J., Carpinelli, E., Gutierrez-Exposito, C., and Cañadas,A. (2013). As main meal for sperm whales: plastics debris. Mar. Pollut. Bull. 691,206–214. doi: 10.1016/j.marpolbul.2013.01.033
Dewar, H., Mous, P., Domeier, M., Muljadi, A., Pet, J., and Whitty, J. V. (2008).Movements and site fidelity of the giant manta ray, manta birostris, in theKomodo Marine Park, Indonesia. Mar. Biol. 155, 121–133. doi: 10.1007/s00227-008-0988-x
Donati, G. F. A., Shameel, I., Hindle, K., Zareer, I., and Wieczorek, A. M. (2019).“Microplastics a macro-disaster: a threat to the largest fish of our 2008 seas?,”in Proceedings of the 5th International Whale Shark Conference (IWSC5),Ningaloo, WA.
Dove, A. D., Leisen, J., Zhou, M., Byrne, J. J., Lim-Hing, K., Webb, H. D., et al.(2012). Biomarkers of whale shark health: a metabolomic approach. PLoS One7:e49379. doi: 10.1371/journal.pone.0049379
Endo, S., Takizawa, R., Okuda, K., Takada, H., Chiba, K., Kanehiro, H., et al. (2005).Concentration of polychlorinated biphenyls (PCBs) in beached resin pellets:variability among individual particles and regional differences. Mar. Pollut. Bull.50, 1103–1114. doi: 10.1016/j.marpolbul.2005.04.030
Eriksen, M., Lebreton, L. C., Carson, H. S., Thiel, M., Moore, C. J., Borerro,J. C., et al. (2014). Plastic pollution in the world’s oceans: more than 5 trillionplastic pieces weighing over 250,000 tons afloat at sea. PloS One 9:e111913.doi: 10.1371/journal.pone.0111913
Essumang, D. K. (2010). First determination of the levels of platinum groupmetals in manta birostris (manta ray) caught along the ghanaian coastline.Bull. Environ. Contam. Toxicol. 84, 720–725. doi: 10.1007/s00128-010-0019-8
Fackelmann, G., and Sommer, S. (2019). Microplastics and the gut microbiome:how chronically exposed species may suffer from gut dysbiosis. Mar. Pollut.Bull. 143, 193–203. doi: 10.1016/j.marpolbul.2019.04.030
Field, A., and Gordon, A. L. (1996). Tidal mixing signatures in theIndonesian SeasJ. Phys. Oceanogr. 26, 1924–1937. doi:10.1175/1520-0485(1996)026
Fossi, M. C., Baini, M., Panti, C., Galli, M., Jiménez, B., Muñoz-Arnanz, J., et al.(2017). Are whale sharks exposed to persistent organic pollutants and plasticpollution in the Gulf of California (Mexico)? first ecotoxicological investigationusing skin biopsies. Comp. Biochem. Physiol. C Toxicol. Pharmacol. 199, 48–58.doi: 10.1016/j.cbpc.2017.03.002
Fossi, M. C., Coppola, D., Baini, M., Giannetti, M., Guerranti, C., Marsili, L., et al.(2014). Large filter feeding marine organisms as indicators of microplastic inthe pelagic environment: the case studies of the mediterranean basking shark(Cetorhinus maximus) and fin whale (Balaenoptera physalus). Mar. Environ.Res. 100, 17–24. doi: 10.1016/j.marenvres.2014.02.002
Fossi, M. C., Marsili, L., Baini, M., Giannetti, M., Coppola, D., Guerranti, C., et al.(2016). Fin whales and microplastics: the mediterranean Sea and the Sea ofCortez scenarios. Environ. Poll. 209, 68–78. doi: 10.1016/j.envpol.2015.11.022
Gaffin, S., Rosenzweig, C., Xing, X., and Yetman, G. (2004). Downscaling and geo-spatial gridding of socio-economic projections from the IPCC special report onemissions scenarios (SRES). Glob. Environ. Chang. 14, 105–123.
Gall, S. C., and Thompson, R. C. (2015). The impact of debris on marine life. Mar.Pollut. Bull. 92, 170–179. doi: 10.1016/j.marpolbul.2014.12.041
Gallagher, A. J., and Hammerschlag, N. (2011). Global shark currency: thedistribution, frequency, and economic value of shark ecotourism. Curr. IssuesTour. 14, 797–812. doi: 10.1080/13683500.2011.585227
Genov, T., Jepson, P. D., Barber, J. L., Hace, A., Gaspari, S., Centrih, T., et al. (2019).Linking organochlorine contaminants with demographic parameters in free-ranging common bottlenose dolphins from the northern Adriatic Sea. Sci. TotalEnviron. 657, 200–212. doi: 10.1016/j.scitotenv.2018.12.025
Germanov, E. S., Bejder, L., Chabanne, D. B. H., Dharmadi, D., Hendrawan, I. G.,Marshall, A. D., et al. (2019). Contrasting habitat use and population dynamicsof reef manta rays within the Nusa Penida marine protected area, Indonesia.Front. Mar. Sci. 6:215. doi: 10.3389/fmars.2019.00215
Frontiers in Marine Science | www.frontiersin.org 18 November 2019 | Volume 6 | Article 679

fmars-06-00679 November 8, 2019 Time: 14:46 # 19
Germanov et al. Microplastics in Indonesian Megafauna Habitats
Germanov, E. S., and Marshall, A. D. (2014). Running the gauntlet:regional movement patterns of manta alfredi through a complex ofparks and fisheries. PLoS One 9:e110071. doi: 10.1371/journal.pone.0110071
Germanov, E. S., Marshall, A. D., Bejder, L., Fossi, M. C., and Loneragan, N. R.(2018). Microplastics: no small problem for filter-feeding megafauna. TrendsEcol. Evol. 334, 227–232. doi: 10.1016/j.tree.2018.01.005
Gleiss, A. C., Wright, S., Liebsch, N., Wilson, R. P., and Norman, B. (2013).Contrasting diel patterns in vertical movement and locomotor activity of whalesharks at Ningaloo reef. Mar. Biol. 160, 2981–2992. doi: 10.1007/s00227-013-2288-3
Gray, J. S. (1997). Marine biodiversity: patterns, threats and conservation needs.Biodivers. Conserv. 6, 153–175. doi: 10.1023/A:1018335901847
Haetrakul, T., Munanansup, S., Assawawongkasem, N., and Chansue, N. (2009).A Case Report: Stomach Foreign Object in Whale Shark (Rhincodon typus)Stranded in Thailand. Kyoto University. Available at: https://repository.kulib.kyoto-u.ac.jp/dspace/bitstream/2433/71015/1/8thSEASTAR_83.pdf (accessedMarch 1, 2019).
Hendrawan, I. G., Asai, K., Triwahyuni, A., and Lestari, D. V. (2019). Theinteranual rainfall variability in Indonesia corresponding to El Niño Southernoscillation and Indian Ocean Dipole. AOS 38, 57–66. doi: 10.1007/s13131-019-1457-1
Hendrawan, I. G., and Asai, K. (2011). “Numerical Study of tidal upwelling overthe sill in the Lombok Strait (Indonesia),” in Proceedings of the Twenty-firstInternational Offshore and Polar Engineering Conference, Maui, e24.2011.
Hidalgo-Ruz, V., Gutow, L., Thompson, R. C., and Thiel, M. (2012). Microplasticsin the marine environment: a review of the methods used for identificationand quantification. Environ. Sci. Technol. 46, 3060–3075. doi: 10.1021/es2031505
Hoornweg, D., and Bhada-Tata, P. (2012). What a Waste: A Global Review of SolidWaste Management. Washington, DC: World Bank.
Indonesia Population (2019). Available at: http://worldpopulationreview.com/countries/indonesia (accessed May 12, 2019).
International Pellet Watch (2019). Google Pollution Map: Google Map.International Pellet Watch. Available at: www.pelletwatch.org (accessedFebruary 13, 2019).
Jacobsen, J. K., Massey, L., and Gulland, F. (2010). Fatal ingestion of floating netdebris by two sperm whales (Physeter macrocephalus). Mar. Pollut. Bull. 60,765–767. doi: 10.1016/j.marpolbul.2010.03.008
Jaine, F. R. A., Couturier, L. I. E., Weeks, S. J., Townsend, K. A.,Bennett, M. B., Fiora, K., et al. (2012). When giants turn up: sightingtrends, environmental influences and habitat use of the manta ray mantaalfredi at a coral reef. PLoS One 7:e4610. doi: 10.1371/journal.pone.0046170
Jambeck, J. R., Geyer, R., Wilcox, C., Siegler, T. R., Perryman, M., Andrady, A., et al.(2015). Marine pollution. Plastic waste inputs from land into the ocean. Science347, 768–771. doi: 10.1126/science.1260352
Kamal, M. M., Wardiatno, Y., and Noviyanti, N. S. (2016). “Habitat conditions andpotential food items during the appearance of whale sharks (rhincodon typus)in probolinggo waters, madura strait, indonesia,” in Proceedings of the QScienceProceedings, The 4th International Whale Shark Conference, Qatar.
Kowalski, N., Reichardt, A. M., and Waniek, J. J. (2016). Sinking rates ofmicroplastics and potential implications of their alteration by physical,biological, and chemical factors. Mar. Pollut. Bull. 109, 310–319. doi: 10.1016/j.marpolbul.2016.05.064
Langenheim, J. (2017). Indonesia Pledges $1bn a Year to Curb Ocean Waste. TheGuardian. Available at: https://www.theguardian.com/environment/the-coral-triangle/2017/mar/02/indonesia-pledges-us1-billion-a-year-to-curb-ocean-waste (accessed March 20, 2019).
Lebreton, L. C. M., and Reisser, J. (2018). Supplementary data for ‘River plasticemissions to the world’s oceans’. Figshare Fileset. 12:15. doi: 10.6084/m9.figshare.4725541.v5
Lebreton, L. C. M., van der Zwet, J., Damsteeg, J. W., Slat, B., Andrady, A., andReisser, J. (2017). River plastic emissions to the world’s oceans. Nat. Commun.8:15611. doi: 10.1038/ncomms15611
Lee, S. (2019). Plastic Bag Causes Death Of Whale Shark In Sabah. Star Online.Available at: https://www.thestar.com.my/news/nation/2019/02/08/plastic-bag-causes-death-of-whale-shark-in-sabah/ (accessed March 20, 2019).
Lobelle, D., and Cunliffe, M. (2011). Early microbial biofilm formation on marineplastic debris. Mar. Pollut. Bull. 62, 197–200. doi: 10.1016/j.marpolbul.2010.10.013
Lyons, K., Carlisle, A., Preti, A., Mull, C., Blasius, M., O’Sullivan, J., et al. (2013a).Effects of trophic ecology and habitat use on maternal transfer of contaminantsin four species of young of the year lamniform sharks. Mar. Environ. Res. 90,27–38. doi: 10.1016/j.marenvres.2013.05.009
Lyons, K., Lowe, C. G., and Gillanders, B. (2013b). Mechanisms of maternaltransfer of organochlorine contaminants and mercury in the common threshershark (Alopias vulpinus). Can. J. Fish. Aquat. Sci. 70, 1667–1672. doi: 10.1139/cjfas-2013-0222-2222
Lyons, K., Lavado, R., Schlenk, D., and Lowe, C. G. (2014). Bioaccumulationof organochlorine contaminants and ethoxyresorufin-o-deethylase activity insouthern California round stingrays (Urobatis halleri) exposed to planararomatic compounds. Environ. Toxicol. Chem. 33, 1380–1390. doi: 10.1002/etc.2564
Manalu, A. A., Hariyadi, S., and Wardiatno, Y. (2017). Microplastics abundance incoastal sediments of Jakarta Bay, Indonesia. Aqua. Aquar. Conserv. Legisl. 10,1164–1173.
Marshall, A., Bennett, M. B., Kodja, G., Hinojosa-Alvarez, S., Galvan-Magana,F., Harding, M., et al. (2018a). Mobula Birostris (Amended Versionof 2011 Assessment). The IUCN Red List of Threatened Species 2018:e.T198921A126669349. Available at: http://dx.doi.org/10.2305/IUCN.UK.2018-1.RLTS.T198921A126669349.en. (accessed March 2, 2019).
Marshall, A., Kashiwagi, T., Bennett, M. B., Deakos, M., Stevens, G., McGregor,F., et al. (2018b). Mobula Alfredi (Amended Version of 2011 Assessment). TheIUCN Red List of Threatened Species 2018: e.T195459A126665723. Availableat: http://dx.doi.org/10.2305/IUCN.UK.2011-2.RLTS.T195459A126665723.en.(accessed March 2, 2019).
Mato, Y., Isobe, T., Takada, H., Kanehiro, H., Ohtake, C., and Kaminuma, T.(2001). Plastic resin pellets as a transport medium for toxic chemicals in themarine environment. Environ. Sci. Technol. 35, 318–324. doi: 10.1021/es0010498
Maximenko, N., Hafner, J., and Niiler, P. (2012). Pathways of marine debris derivedfrom trajectories of Lagrangian drifters. Mar. Pollut. Bull. 65, 51–62. doi: 10.1016/j.marpolbul.2011.04.016
Mayer, B., and Damm, P. (2012). The makassar strait throughflow and its jet.J. Geophys. Res. 117, C7. doi: 10.1029/2011JC007809
Mehta-Erdmann, A. (2004). A Natural History Guide to Komodo National Park:Marine. Samarinda: TNC.
Merkl, A., Stuchtey, M., Russel, S., Crow, A., Simon, E., Wooster, J., et al. (2015).Stemming the Tide: Land-based Strategies for a Plastic-Free Ocean. OceanConservancy and McKinsey Center for Business and Environment. Availableat: https://www.mckinsey.com/business-functions/sustainability/our-insights/stemming-the-tide-land-based-strategies-for-a-plastic-free-ocean (accessedDecember, 2015).
Ministry of Marine Affairs and Fisheries (2014). Keputusan Menteri Kelautan danPerikanan Republik Indonesia No4/Kepmen-KP/2014 Tentang Penetapan StatusPerindungan Penuh Ikan Pari Manta. Jakarta: Ministry of Marine Affairs andFisheries.
Motta, P. J., Maslanka, M., Hueter, R. E., Davis, R. L., De la Parra, R., Mulvany,S. L., et al. (2010). Feeding anatomy, filter-feeding rate, and diet of whale sharksRhincodon typus during surface ram filter feeding off the Yucatan Peninsula,Mexico. Zoology 113, 199–212. doi: 10.1016/j.zool.2009.12.001
Muthukumar, T., Aravinthan, A., Lakshmi, K., Venkatesan, R., Vedaprakash, L.,and Doble, M. (2011). Fouling and stability of polymers and composites inmarine environmentInt. Biodeterior. Biodegrad. 65, 276–284. doi: 10.1016/j.ibiod.2010.11.012
Nelms, S. E., Barnett, J., Brownlow, A., Davison, N. J., Deaville, R., Galloway, T. S.,et al. (2019). Microplastics in marine mammals stranded around the Britishcoast: ubiquitous but transitory? Nat. Sci. Rep. 9:1075. doi: 10.1038/s41598-018-37428-37423
Nelson, J. D., and Eckert, S. A. (2007). Foraging ecology of whale sharks (Rhincodontypus) within bahía de los angeles, baja California Norte, Mexico. Fish. Res. 84,47–64. doi: 10.1016/j.fishres.2006.11.013
Ningsih, N. S., Rakhmaputeri, N., and Harto, A. B. (2013). Upwelling variabilityalong the southern coast of bali and in Nusa Tenggara waters. Ocean Sci. J. 48,49–57. doi: 10.1007/s12601-013-0004-3
Frontiers in Marine Science | www.frontiersin.org 19 November 2019 | Volume 6 | Article 679

fmars-06-00679 November 8, 2019 Time: 14:46 # 20
Germanov et al. Microplastics in Indonesian Megafauna Habitats
Norman, B. M., Holmberg, J. A., Arzoumanian, Z., Reynolds, S. D., Wilson,R. P., Rob, D., et al. (2017). Undersea constellations: the global biology of anendangered marine megavertebrate further informed through citizen science.Bioscience 67, 1029–1043. doi: 10.1093/biosci/bix127
Ogata, Y., Takada, H., Mizukawa, K., Hirai, H., Iwasa, S., Endo, S., et al. (2009).International pellet watch: global monitoring of persistent organic pollutants(POPs) in coastal waters. 1. Initial phase data on PCBs, DDTs, and HCHs. Mar.Pollut. Bull. 58, 1437–1446. doi: 10.1016/j.marpolbul.2009.06.014
O’Malley, M. P., Lee-Brooks, K., and Medd, H. B. (2013). The Global economicimpact of manta ray watching tourism. PLoS One 8:e65051. doi: 10.1371/journal.pone.0065051
Ooi, M. S., Townsend, K. A., Bennett, M. B., Richardson, A. J., Fernando, D.,Villa, C. A., et al. (2015). Levels of arsenic, cadmium, lead and mercury inthe branchial plate and muscle tissue of mobulid rays. Mar. Pollut. Bull. 94,251–259. doi: 10.1016/j.marpolbul.2015.02.005
Paig-Tran, E., Kleinteich, T., and Summers, A. P. (2013). The filter pads andfiltration mechanisms of the devil rays: variation at macro and microscopicscales. J. Morphol. 274, 1026–1043. doi: 10.1002/jmor.20160
Panti, C., Baini, M., Lusher, A., Hernandez-Milan, G., Rebolledo, E. L. B., Unger,B., et al. (2019). Marine litter: One of the major threats for marine mammals.outcomes from the European cetacean society workshop. Environ. Pollut. 247,72–79. doi: 10.1016/j.envpol.2019.01.029
Pedrotti, M. L., Petit, S., Elineau, A., Bruzaud, S., Crebassa, J., Dumontet, B., et al.(2016). Changes in the floating plastic pollution of the Mediterranean Sea inrelation to the distance to land. PLoS One 11:e0161581. doi: 10.1371/journal.pone.0161581
Pelamatti, T., Fonseca-Ponce, I. A., Rios-Mendoza, L. M., Stewart, J. D., Marín-Enríquez, E., Marmolejo-Rodriguez, A. J., et al. (2019). Seasonal variation inthe abundance of marine plastic debris in Banderas Bay. Mexico. Mar. Pollut.Bull. 145, 604–610. doi: 10.1016/j.marpolbul.2019.06.062
Perryman, R. J., Venables, S. K., Tapilatu, R. F., Marshall, A. D., Brown, C., andFranks, D. W. (2019). Social preferences and network structure in a populationof reef manta rays. Behav. Ecol. Sociobiol. 73:114. doi: 10.1007/s00265-019-2720-x
Pierce, S. J., and Norman, B. (2016). Rhincodon typus. The IUCN Red List ofThreatened Species 2016: e.T19488A2365291. Available at: http://dx.doi.org/10.2305/IUCN.UK.2016-1.RLTS.T19488A2365291.en. (accessed March 20, 2019).
Putra, M., Lewis, S., Kurniasih, E., Prabuning, D., and Faiqoh, E. (2016). “Planktonbiomass models based on GIS and remote sensing technique for predictingmarine megafauna hotspots in the Solor waters,” in Proceedings of the 2ndInternational Conference of Indonesian Society for Remote Sensing (ICOIRS),(Jogyakarta: Earth and Environmental Science).
QGIS Development Team, (2016). QGIS (Version 2.18) [Computer Software].R Core Team, (2018). R: A Language and Environment for Statistical Computing.
Vienna: R Foundation for Statistical Computing.Reddy, M. L., Reif, J., Bachand, A., and Ridgway, S. (2001). Opportunities for
using Navy marine mammals to explore associations between organochlorinecontaminants and unfavorable effects on reproduction. Sci. Total Environ. 2741,171–182. doi: 10.1016/S0048-9697(01)00741-0
Reisser, J., Shaw, J., Wilcox, C., Hardesty, B. D., Proietti, M., Thums, M., et al.(2013). Marine plastic pollution in waters around Australia: characteristics,concentrations, and pathways. PLoS One 8:e80466. doi: 10.1371/journal.pone.0080466
Rios, L. M., Jones, P. R., Moore, C., and Narayan, U. V. (2010). Quantitationof persistent organic pollutants adsorbed on plastic debris from the NorthernPacific Gyre’s “eastern garbage patch”. J. Environ. Monit. 12, 2226–2236. doi:10.1039/c0em00239a
Rios, L. M., Moore, C., and Jones, P. R. (2007). Persistent organic pollutantscarried by synthetic polymers in the ocean environment. Mar. Pollut. Bull. 54,1230–1237. doi: 10.1016/j.marpolbul.2007.03.022
Roch, S., and Brinker, A. (2017). Rapid and efficient method for the detectionof microplastic in the gastrointestinal tract of fishes. Environ. Sci. Tech. 51,4522–4530. doi: 10.1021/acs.est.7b00364
Rochman, C. M., Hoh, E., Kurobe, T., and Teh, S. J. (2013). Ingested plastictransfers hazardous chemicals to fish and induces hepatic stress. Nat. Sci. Rep.3:3263. doi: 10.1038/srep03263
Rochman, C. M., Kurobe, T., Flores, I., and Teh, S. J. (2014). Earlywarning signs of endocrine disruption in adult fish from the ingestion of
polyethylene with and without sorbed chemical pollutants from the marineenvironment. Sci. Total Environ. 493, 656–661. doi: 10.1016/j.scitotenv.2014.06.051
Rochman, C. M., Tahir, A., Williams, S. M., Baxa, D. V., Lam, R., Miller, J. T., et al.(2015). Anthropogenic debris in seafood: plastic debris and fibres from textilesin fish and bivalves sold for human consumption. Nature Sci. Rep. 5:14340.doi: 10.1038/srep14340
Rohner, C. A., Armstrong, A. J., Pierce, S. J., Prebble, C. E., Cagua, E. F.,Cochran, J. E., et al. (2015). Whale sharks target dense prey patches ofsergestid shrimp off Tanzania. J. Plankton Res. 37:fbv010. doi: 10.1093/plankt/fbv010
Sampaio, C. L., Leite, L., Reis-Filho, J. A., Loiola, M., Miranda, R. J., José deAnchieta, C., et al. (2018). New insights into whale shark Rhincodon typus dietin Brazil: an observation of ram filter-feeding on crab larvae and analysis ofstomach contents from the first stranding in Bahia state. Environ. Biol. Fish.101, 1285–1293. doi: 10.1007/s10641-018-0775-6
Santos, R. G., Andrades, R., Boldrini, M. A., and Martins, A. S. (2015). Debrisingestion by juvenile marine turtles: an underestimated problem. Mar. Pollut.Bull. 931, 37–43. doi: 10.1016/j.marpolbul.2015.02.022
Schmidt, C., Krauth, T., and Wagner, S. (2017). Export of plastic debris byrivers into the sea. Environ. Sci. Technol. 51, 12246–12253. doi: 10.1021/acs.est.7b02368
Setälä, O., Fleming-Lehtinen, V., and Lehtiniemi, M. (2014). Ingestion and transferof microplastics in the planktonic food web. Environ. Pollut. 185, 77–83. doi:10.1016/j.envpol.2013.10.013
Setyawan, E., Sianipar, A. B., Erdmann, M. V., Fischer, A. M., Haddy, J. A., Beale,C. S., et al. (2018). Site fidelity and movement patterns of reef manta rays(Mobula alfredi): mobulidae using passive acoustic telemetry in northern RajaAmpat, Indonesia. Nat. Conserv. Res. 3, 1–15. doi: 10.24189/ncr.2018.043
Shim, W. J., Hong, S. H., and Eo, S. E. (2017). Identification methods inmicroplastic analysis: a review. Anal. Methods 9, 1384–1391. doi: 10.1039/C6AY02558G
Sprintall, J., Wijels, S. E., Molcard, R., and Jaya, I. (2009). Direct estimates of theIndonesian throughflow entering the Indian Ocean: 2004–2006. J. Geophys. Res.114:C07001. doi: 10.1029/2008JC005257
Stamper, M. A., Spicer, C. W., Neiffer, D. L., Mathews, K. S., and Fleming, G. J.(2009). Morbidity in a juvenile green sea turtle (Chelonia mydas) due toocean-borne plastic. JZWM 40, 196–198. doi: 10.1638/2007-0101.1
Stevens, G. M. W. (2016). Conservation and Population Ecology of Manta Rays inthe Maldives. Heslington: University of York.
Stewart, J. D., Jaine, F. R., Armstrong, A. J., Armstrong, A. O., Bennett, M. B.,Burgess, K. B., et al. (2018). Research priorities to support effective manta anddevil ray conservation. Front. Mar. Sci. 5:314. doi: 10.3389/fmars.2018.00314
Sugimoto, T. (1975). Effect of boundary geometries on tidal currents andtidal mixing. J. Oceanogr. Soc. Japan 31, 1–14. doi: 10.1007/BF02108214
Syakti, A. D., Bouhroum, R., Hidayati, N. V., Koenawan, C. J., Boulkamh,A., Sulistyo, I., et al. (2017). Beach macro-litter monitoring and floatingmicroplastic in a coastal area of Indonesia. Mar. Pollut. Bull. 122, 217–225.doi: 10.1016/j.marpolbul.2017.06.046
Tanaka, K., Takada, H., Yamashita, R., Mizukawa, K., Fukuwaka, M., andWatanuki, Y. (2013). Accumulation of plastic-derived chemicals in tissues ofseabirds ingesting marine plasticsMar. Pollut. Bull. 691, 219–222. doi: 10.1016/j.marpolbul.2012.12.010
Teuten, E. L., Saquing, J. M., Knappe, D. R., Barlaz, M. A., Jonsson, S., Bjorn,A., et al. (2009). Transport and release of chemicals from plastics to theenvironment and to wildlife. Philos. Trans. R. Soc. Lond. B. Biol. Sci. 364,2027–2045. doi: 10.1098/rstb.2008.0284
Thys, T., Ryan, J. P., Weng, K. C., Erdmann, M., and Tresnati, J. (2016). Trackinga marine ecotourism star: movements of the short ocean sunfish Mola ramsayiin Nusa Penida, Bali, Indonesia. J. Mar. Biol. 2016:8750193. doi: 10.1155/2016/8750193
Tillinger, D. (2011). Physical oceanography of the present day IndonesianThroughflow. J. Geol. Soc. Lond. Special Public. 355, 267–281. doi: 10.1144/SP355.13
van Sebille, E. (2014). Adrift.org.au—A free, quick and easy tool to quantitativelystudy planktonic surface drift in the global ocean. J.Exp. Mar. Biol. Ecol. 461,317–322. doi: 10.1016/j.jembe.2014.09.002
Frontiers in Marine Science | www.frontiersin.org 20 November 2019 | Volume 6 | Article 679
fmars-06-00679 November 8, 2019 Time: 14:46 # 21
Germanov et al. Microplastics in Indonesian Megafauna Habitats
van Sebille, E., Wilcox, C., Lebreton, L., Maximenko, N., Hardesty, B. D., VanFraneker, J. A., et al. (2015). A global inventory of small floating plastic debris.Environ. Res. Lett. 10:124006. doi: 10.1088/1748-9326/10/12/124006
Vandermeersch, G., Van Cauwenberghe, L., Janssen, C. R., Marques, A., Granby, K.,Fait, G., et al. (2015). A critical view on microplastic quantification in aquaticorganisms. Environ. Res. 143, 46–55. doi: 10.1016/j.envres.2015.07.016
Verissimo, D., MacMillan, D. C., and Smith, R. J. (2011). Toward a systematicapproach for identifying conservation flagships. Conserv. Lett. 4, 1–8. doi: 10.1111/j.1755-263X.2010.00151.x
Victor, D. (2018). 1,000 Pieces of Plastic Found Inside Dead Whale in Indonesia. NYTimes. Available at: https://www.nytimes.com/2018/11/21/world/asia/whale-plastics-indonesia.html (accessed March 20, 2019).
Wilcox, C., Puckridge, M., Schuyler, Q. A., Townsend, K., and Hardesty, B. D.(2018). A quantitative analysis linking sea turtle mortality and plastic debrisingestion. Nat. Sci. Rep. 81:12536. doi: 10.1038/s41598-018-30038-z
Wilcox, C., Van Sebille, E., and Hardesty, B. D. (2015). Threat of plastic pollutionto seabirds is global, pervasive, and increasing. PNAS 112, 11899–11904. doi:10.1073/pnas.1502108112
Wilson, R. P., Shepard, E. L. C., and Liebsch, N. (2008). Prying into the intimatedetails of animal lives: use of a daily diary on animals. Endanger. Species Res. 41,123–137. doi: 10.3354/esr00064
Worm, B., and Branch, T. A. (2012). The future of fish. Trends Ecol. Evol. 27,594–599. doi: 10.1016/j.tree.2012.07.005
Worm, B., Lotze, H. K., Jubinville, I., Wilcox, C., and Jambeck,J. (2017). Plastic as a persistent marine pollutant. Annu. Rev.Environ. Resour. 42, 1–26. doi: 10.1146/annurev-environ-102016-060700
Yetman, G., Gaffin, S., and Xing, X. (2004). Global 15 × 15 Minute Gridsof the Downscaled Population Based on the SRES B2 Scenario, 1990 and2025. Washington, DC: NASA Socioeconomic Data and Applications Center(SEDAC). doi: 10.7927/H4HQ3WTH
Zachos, E. (2018). How This Whale Got Nearly 20 Pounds of Plastic in itsStomach. Available at: https://news.nationalgeographic.com/2018/06/whale-dead-plastic-bags-thailand-animals/ (accessed March 20, 2019).
Conflict of Interest: The authors declare that the research was conducted in theabsence of any commercial or financial relationships that could be construed as apotential conflict of interest.
Copyright © 2019 Germanov, Marshall, Hendrawan, Admiraal, Rohner, Argeswara,Wulandari, Himawan and Loneragan. This is an open-access article distributedunder the terms of the Creative Commons Attribution License (CC BY). The use,distribution or reproduction in other forums is permitted, provided the originalauthor(s) and the copyright owner(s) are credited and that the original publicationin this journal is cited, in accordance with accepted academic practice. No use,distribution or reproduction is permitted which does not comply with these terms.
Frontiers in Marine Science | www.frontiersin.org 21 November 2019 | Volume 6 | Article 679