Micromechanics Fatigue Damage Analysis Modeling for Fabric ... · Micromechanics Fatigue Damage...
28
J.B. Min Glenn Research Center, Cleveland, Ohio D. Xue and Y. Shi Analytical Services & Materials, Inc., Hampton, Virginia Micromechanics Fatigue Damage Analysis Modeling for Fabric Reinforced Ceramic Matrix Composites NASA/TM—2013-217870 May 2013 https://ntrs.nasa.gov/search.jsp?R=20130014831 2020-02-18T08:12:53+00:00Z
Transcript of Micromechanics Fatigue Damage Analysis Modeling for Fabric ... · Micromechanics Fatigue Damage...
J.B. MinGlenn Research Center, Cleveland, Ohio
D. Xue and Y. Shi Analytical Services & Materials, Inc., Hampton, Virginia
Micromechanics Fatigue Damage Analysis Modeling for Fabric Reinforced Ceramic Matrix Composites
NASA/TM—2013-217870
May 2013
https://ntrs.nasa.gov/search.jsp?R=20130014831 2020-02-18T08:12:53+00:00Z
NASA STI Program . . . in Profile
Since its founding, NASA has been dedicated to the advancement of aeronautics and space science. The NASA Scientific and Technical Information (STI) program plays a key part in helping NASA maintain this important role.
The NASA STI Program operates under the auspices of the Agency Chief Information Officer. It collects, organizes, provides for archiving, and disseminates NASA’s STI. The NASA STI program provides access to the NASA Aeronautics and Space Database and its public interface, the NASA Technical Reports Server, thus providing one of the largest collections of aeronautical and space science STI in the world. Results are published in both non-NASA channels and by NASA in the NASA STI Report Series, which includes the following report types: • TECHNICAL PUBLICATION. Reports of
completed research or a major significant phase of research that present the results of NASA programs and include extensive data or theoretical analysis. Includes compilations of significant scientific and technical data and information deemed to be of continuing reference value. NASA counterpart of peer-reviewed formal professional papers but has less stringent limitations on manuscript length and extent of graphic presentations.
• TECHNICAL MEMORANDUM. Scientific
and technical findings that are preliminary or of specialized interest, e.g., quick release reports, working papers, and bibliographies that contain minimal annotation. Does not contain extensive analysis.
• CONTRACTOR REPORT. Scientific and
technical findings by NASA-sponsored contractors and grantees.
• CONFERENCE PUBLICATION. Collected papers from scientific and technical conferences, symposia, seminars, or other meetings sponsored or cosponsored by NASA.
• SPECIAL PUBLICATION. Scientific,
technical, or historical information from NASA programs, projects, and missions, often concerned with subjects having substantial public interest.
• TECHNICAL TRANSLATION. English-
language translations of foreign scientific and technical material pertinent to NASA’s mission.
Specialized services also include creating custom thesauri, building customized databases, organizing and publishing research results.
For more information about the NASA STI program, see the following:
• Access the NASA STI program home page at http://www.sti.nasa.gov
• E-mail your question to [email protected] • Fax your question to the NASA STI
Information Desk at 443–757–5803 • Phone the NASA STI Information Desk at 443–757–5802 • Write to:
STI Information Desk NASA Center for AeroSpace Information 7115 Standard Drive Hanover, MD 21076–1320
J.B. MinGlenn Research Center, Cleveland, Ohio
D. Xue and Y. Shi Analytical Services & Materials, Inc., Hampton, Virginia
Micromechanics Fatigue Damage Analysis Modeling for Fabric Reinforced Ceramic Matrix Composites
NASA/TM—2013-217870
May 2013
National Aeronautics andSpace Administration
Glenn Research Center Cleveland, Ohio 44135
Prepared for the54th Structures, Structural Dynamics, and Materials Conference (SDM)cosponsored by the AIAA, ASME, ASCE, AHS, and ASCBoston, Massachusetts, April 8–13, 2013
Acknowledgments
The first author gratefully acknowledges the support by NASA Fundamental Aeronautics Research Fixed Wing Project for permitting time to prepare this paper.
Available from
NASA Center for Aerospace Information7115 Standard DriveHanover, MD 21076–1320
National Technical Information Service5301 Shawnee Road
Alexandria, VA 22312
Available electronically at http://www.sti.nasa.gov
This work was sponsored by the Fundamental Aeronautics Program at the NASA Glenn Research Center.
Level of Review: This material has been technically reviewed by technical management.
NASA/TM—2013-217870 1
Micromechanics Fatigue Damage Analysis Modeling for Fabric Reinforced Ceramic Matrix Composites
J.B. Min
National Aeronautics and Space Administration Glenn Research Center Cleveland, Ohio 44135
D. Xue* and Y. Shi*
Analytical Services & Materials, Inc. Hampton, Virginia 23666
Abstract A micromechanics analysis modeling method was developed to analyze the damage progression and
fatigue failure of fabric reinforced composite structures, especially for the brittle ceramic matrix material composites. A repeating unit cell concept of fabric reinforced composites was used to represent the global composite structure. The thermal and mechanical properties of the repeating unit cell were considered as the same as those of the global composite structure. The three-phase micromechanics, the shear-lag, and the continuum fracture mechanics models were integrated with a statistical model in the repeating unit cell to predict the progressive damages and fatigue life of the composite structures. The global structure failure was defined as the loss of loading capability of the repeating unit cell, which depends on the stiffness reduction due to material slice failures and nonlinear material properties in the repeating unit cell. The present methodology is demonstrated with the analysis results evaluated through the experimental test performed with carbon fiber reinforced silicon carbide matrix plain weave composite specimens.
1.0 Introduction Historically, advances in aerospace engine performance and durability have been linked to
improvements in materials. Recent developments in high performance aerospace turbomachinery engines have led to increased interest in ceramic matrix composites (CMC) to achieve revolutionary gains in engine performance. The use of CMC promises many advantages in turbine development. The most beneficial aspects of CMC are the material’s ability to maintain its strength to over 2400 °F, the internal material damping, and the relatively low density. While CMC reinforced with woven and braided fabric preforms are being considered for potential candidates in the NASA’s next-generation aerospace turbomachinery engine applications (Refs. 1 and 2), one of challenge areas in the development of highly efficient and lighter aircraft engines is high performance rotating blades subject to high cycle fatigue (HCF) limitations as a result of high vibratory stresses (Ref. 3).
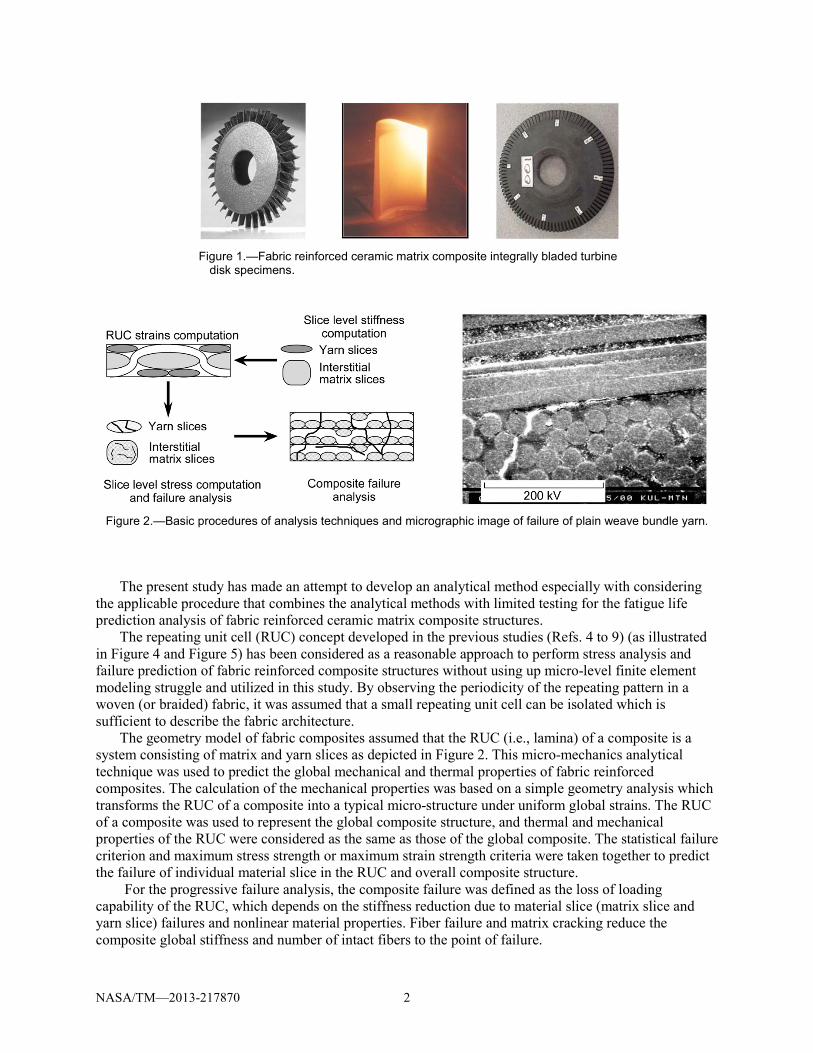
While fabric reinforced composites have considerable attention as alternative to conventional laminate composites consisting of stacked unidirectional plies, the architecture of a fabric reinforced composite is very complex and, therefore, the parameters controlling its strength properties are numerous. Considerable advancement has been reported in the analytical methods for static properties of fabric reinforced composites (Refs. 4 to 13), reliable analytical capability to analyze the component’s fatigue strength and life prediction are still very limited and evolving. This necessitates the development of the effective approach with a feasible analysis procedure to design the fabric reinforced composite structures such as integrally bladed turbine disk (Figure 1). * Formerly Analytical Services & Materials, Inc.
NASA/TM—2013-217870 2
Figure 1.—Fabric reinforced ceramic matrix composite integrally bladed turbine
disk specimens.
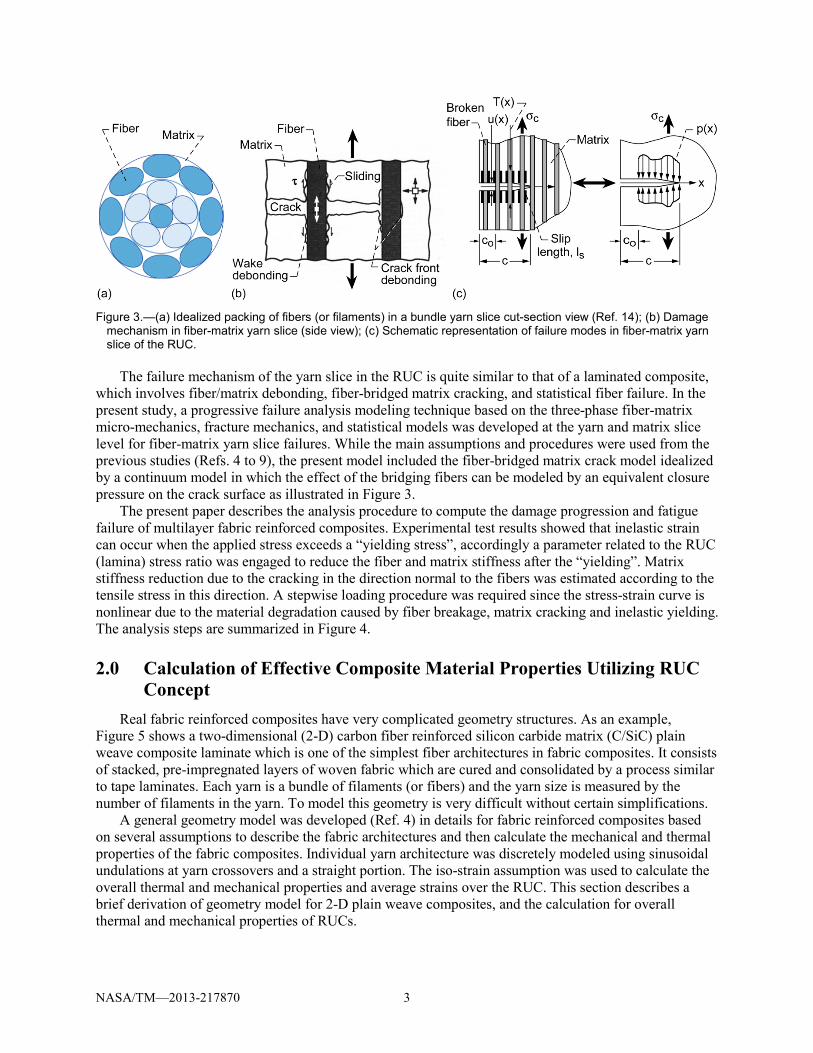
Figure 2.—Basic procedures of analysis techniques and micrographic image of failure of plain weave bundle yarn.
The present study has made an attempt to develop an analytical method especially with considering the applicable procedure that combines the analytical methods with limited testing for the fatigue life prediction analysis of fabric reinforced ceramic matrix composite structures.
The repeating unit cell (RUC) concept developed in the previous studies (Refs. 4 to 9) (as illustrated in Figure 4 and Figure 5) has been considered as a reasonable approach to perform stress analysis and failure prediction of fabric reinforced composite structures without using up micro-level finite element modeling struggle and utilized in this study. By observing the periodicity of the repeating pattern in a woven (or braided) fabric, it was assumed that a small repeating unit cell can be isolated which is sufficient to describe the fabric architecture.
The geometry model of fabric composites assumed that the RUC (i.e., lamina) of a composite is a system consisting of matrix and yarn slices as depicted in Figure 2. This micro-mechanics analytical technique was used to predict the global mechanical and thermal properties of fabric reinforced composites. The calculation of the mechanical properties was based on a simple geometry analysis which transforms the RUC of a composite into a typical micro-structure under uniform global strains. The RUC of a composite was used to represent the global composite structure, and thermal and mechanical properties of the RUC were considered as the same as those of the global composite. The statistical failure criterion and maximum stress strength or maximum strain strength criteria were taken together to predict the failure of individual material slice in the RUC and overall composite structure.
For the progressive failure analysis, the composite failure was defined as the loss of loading capability of the RUC, which depends on the stiffness reduction due to material slice (matrix slice and yarn slice) failures and nonlinear material properties. Fiber failure and matrix cracking reduce the composite global stiffness and number of intact fibers to the point of failure.
NASA/TM—2013-217870 3
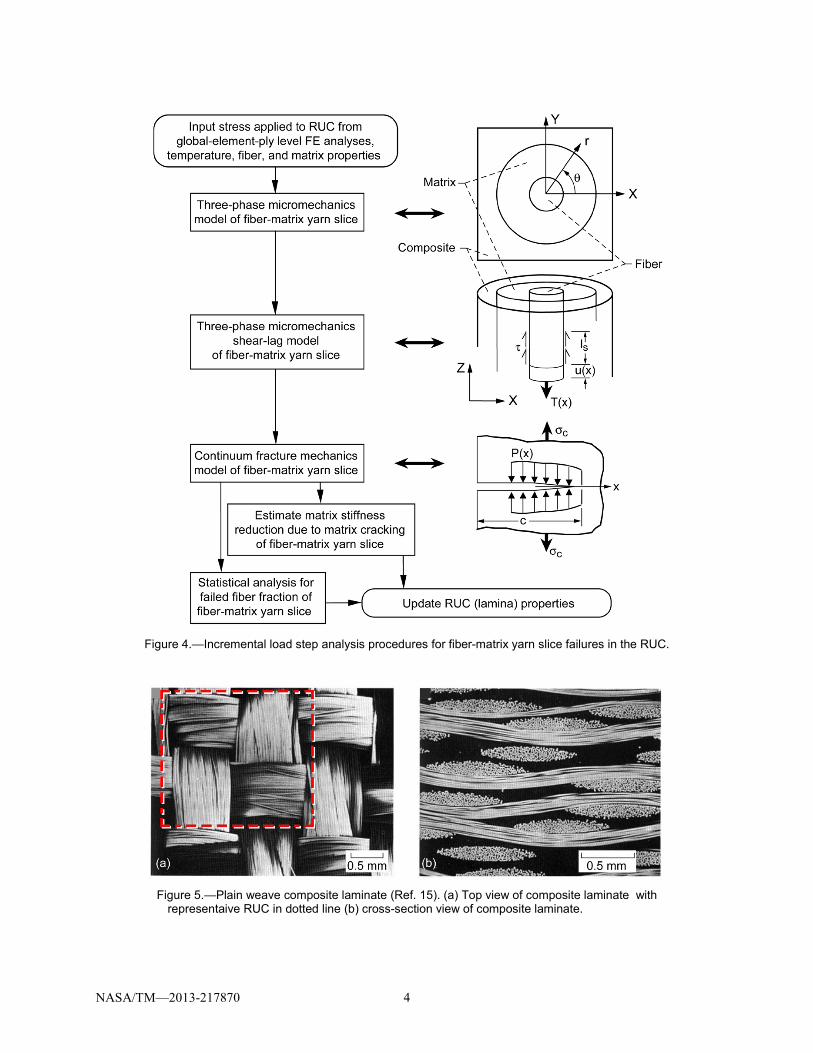
Figure 3.—(a) Idealized packing of fibers (or filaments) in a bundle yarn slice cut-section view (Ref. 14); (b) Damage
mechanism in fiber-matrix yarn slice (side view); (c) Schematic representation of failure modes in fiber-matrix yarn slice of the RUC.
The failure mechanism of the yarn slice in the RUC is quite similar to that of a laminated composite,
which involves fiber/matrix debonding, fiber-bridged matrix cracking, and statistical fiber failure. In the present study, a progressive failure analysis modeling technique based on the three-phase fiber-matrix micro-mechanics, fracture mechanics, and statistical models was developed at the yarn and matrix slice level for fiber-matrix yarn slice failures. While the main assumptions and procedures were used from the previous studies (Refs. 4 to 9), the present model included the fiber-bridged matrix crack model idealized by a continuum model in which the effect of the bridging fibers can be modeled by an equivalent closure pressure on the crack surface as illustrated in Figure 3.
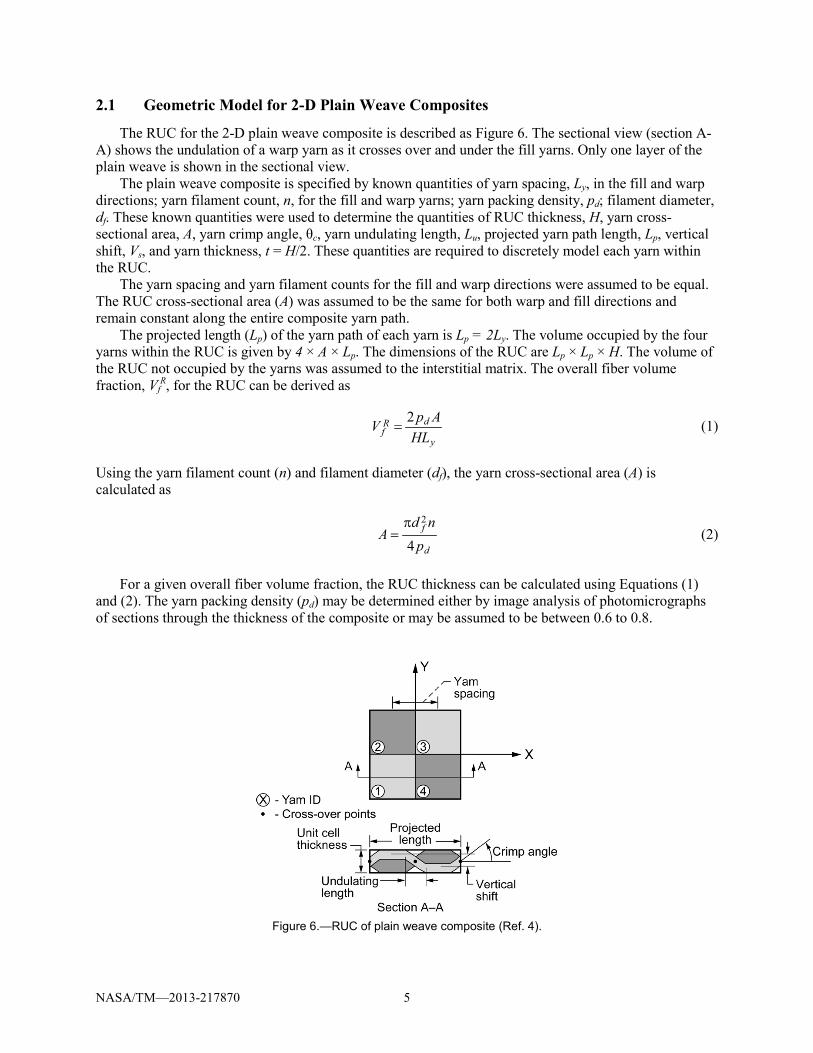
The present paper describes the analysis procedure to compute the damage progression and fatigue failure of multilayer fabric reinforced composites. Experimental test results showed that inelastic strain can occur when the applied stress exceeds a “yielding stress”, accordingly a parameter related to the RUC (lamina) stress ratio was engaged to reduce the fiber and matrix stiffness after the “yielding”. Matrix stiffness reduction due to the cracking in the direction normal to the fibers was estimated according to the tensile stress in this direction. A stepwise loading procedure was required since the stress-strain curve is nonlinear due to the material degradation caused by fiber breakage, matrix cracking and inelastic yielding. The analysis steps are summarized in Figure 4.
2.0 Calculation of Effective Composite Material Properties Utilizing RUC Concept
Real fabric reinforced composites have very complicated geometry structures. As an example, Figure 5 shows a two-dimensional (2-D) carbon fiber reinforced silicon carbide matrix (C/SiC) plain weave composite laminate which is one of the simplest fiber architectures in fabric composites. It consists of stacked, pre-impregnated layers of woven fabric which are cured and consolidated by a process similar to tape laminates. Each yarn is a bundle of filaments (or fibers) and the yarn size is measured by the number of filaments in the yarn. To model this geometry is very difficult without certain simplifications.
A general geometry model was developed (Ref. 4) in details for fabric reinforced composites based on several assumptions to describe the fabric architectures and then calculate the mechanical and thermal properties of the fabric composites. Individual yarn architecture was discretely modeled using sinusoidal undulations at yarn crossovers and a straight portion. The iso-strain assumption was used to calculate the overall thermal and mechanical properties and average strains over the RUC. This section describes a brief derivation of geometry model for 2-D plain weave composites, and the calculation for overall thermal and mechanical properties of RUCs.
NASA/TM—2013-217870 4
Figure 4.—Incremental load step analysis procedures for fiber-matrix yarn slice failures in the RUC.
Figure 5.—Plain weave composite laminate (Ref. 15). (a) Top view of composite laminate with
representaive RUC in dotted line (b) cross-section view of composite laminate.
NASA/TM—2013-217870 5
2.1 Geometric Model for 2-D Plain Weave Composites
The RUC for the 2-D plain weave composite is described as Figure 6. The sectional view (section A-A) shows the undulation of a warp yarn as it crosses over and under the fill yarns. Only one layer of the plain weave is shown in the sectional view.
The plain weave composite is specified by known quantities of yarn spacing, Ly, in the fill and warp directions; yarn filament count, n, for the fill and warp yarns; yarn packing density, pd; filament diameter, df. These known quantities were used to determine the quantities of RUC thickness, H, yarn cross-sectional area, A, yarn crimp angle, θc, yarn undulating length, Lu, projected yarn path length, Lp, vertical shift, Vs, and yarn thickness, t = H/2. These quantities are required to discretely model each yarn within the RUC.
The yarn spacing and yarn filament counts for the fill and warp directions were assumed to be equal. The RUC cross-sectional area (A) was assumed to be the same for both warp and fill directions and remain constant along the entire composite yarn path.
The projected length (Lp) of the yarn path of each yarn is Lp = 2Ly. The volume occupied by the four yarns within the RUC is given by 4 × A × Lp. The dimensions of the RUC are Lp × Lp × H. The volume of the RUC not occupied by the yarns was assumed to the interstitial matrix. The overall fiber volume fraction, Vf
R, for the RUC can be derived as
y
dRf HL
ApV 2= (1)
Using the yarn filament count (n) and filament diameter (df), the yarn cross-sectional area (A) is calculated as
d
f
pnd
A4
2π= (2)
For a given overall fiber volume fraction, the RUC thickness can be calculated using Equations (1) and (2). The yarn packing density (pd) may be determined either by image analysis of photomicrographs of sections through the thickness of the composite or may be assumed to be between 0.6 to 0.8.
Figure 6.—RUC of plain weave composite (Ref. 4).
NASA/TM—2013-217870 6
The yarn path in the RUC consists of two straight portions and three undulating portions. The yarns path was assumed to follow a sinusoidal path. The sine function used to describe the yarn centerline path has its origin at the cross-over points (COP) which was determined by the vertical shift (Vs) and the undulating length (Lu). For a warp yarn, the yarn centerline path, Zc, can be expressed as
π±=
u
ccc L
XHXZ sin4
)( (3)
where Xc is the quantity measured from the corresponding COP along the warp yarn direction. A negative sign in Equation (3) describes the undulation at the central COP and a positive sign describes the undulations at the edge COPs to describe three undulating portions of a yarn. Only a half sine wave was used for the centerline paths of both edges. The centerline path for other warp yarns in the RUC can be described in a similar manner with appropriate sign and sine wave portion at each COP. The undulations in the fill yarns can also be described along the fill yarn direction (i.e., Y-axis).
The undulating length, Lu, can be determined by the cross-sectional shape of the yarn consisting of a central straight portion of thickness, t, and two sinusoidal lenticular end portions assumed by the sinusoidal function of Equation (3). Also, the length of the sinusoidal end portions is equal to Lu/2. The cross-sectional area, A, can also be expressed as,
π−−=
21tLtLA uy
(4)
The undulating length, Lu, can now be calculated using Equations (2) and (4). The total length of the straight portions, Lst, can be expressed as,
uyst LLL 22 −= (5)
Equations (1) to (5) were used to determine all the required geometry parameters of the RUC, which includes yarn cross-sectional area and overall fiber volume fraction. Equation (4) is valid for Ly ≥ Lu.
The undulation in the yarn is described by its “crimp angle” defined as positive angle between the tangent to the sinusoidal yarn centerline path and the X-Y plane at a COP. The crimp angle, θc, can be expressed as,
0
)tan(=
=θ
cXc
cc dX
dZ (6)
Generally, θmin ≤ θc ≤ (π/2) where θmin is minimum θc determined by the constraint Ly ≥ Lu for a given plain weave architecture.
2.2 Effective Mechanical and Thermal Properties of RUC
All the analysis in this study is assumed to apply to the RUC. All the thermal and mechanical properties computed with the RUC can be considered as the same of the whole specimen. The overall composite properties are determined by discretizing all the yarns within the RUC. The straight portions of each yarn path are modeled as a single yarn slice length, Lst. Along an undulating portion, the yarn is divided into q, equal, piecewise straight slices made perpendicular to its in-plane direction and normal to the X-Y plane (Figure 5). Thus, the sinusoidal yarn undulating portion is approximated by q interconnected straight yarn slices. The volume of each yarn slice of the undulating portion is computed as (A.Lu)/q.
NASA/TM—2013-217870 7
The RUC of a textile composite was treated as a system consists of a set of spatially oriented yarn slices and an interstitial matrix material slice (Ref. 4). Thus, each yarn within the RUC was approximated by straight yarn slices known volumes and orientation angles. The total volume occupied by all the yarn slices was subtracted from the volume of the RUC to compute the volume occupied by the interstitial matrix pockets in the RUC. The matrix is assumed to be isotropic, while the yarn slices transversely isotropic (Ref. 16). The three-dimensional thermoelastic stress-strain relations in global XYZ coordinates for the RUC were defined using effective material properties to relate the average values of the stress-strain state variables. The average stress technique (Ref. 12) based on an iso-strain assumption within the RUC was used to compute overall composite properties as follows.
For the mth material slice (yarn or matrix), the three-dimensional 6×6 stiffness matrix [ ]mE′ can be formed from given material constants (Young’s modulus and Poisson’s ratios). The five independent material constants (E11, E22, G12, ν12, and ν23; subscript 1 corresponds to the axial fiber direction) are required to define [ ]mE ' matrix for the yarn slice. Assuming the strains are uniform inside RUC, the stress-strain relation becomes
{ } [ ]{ }ε=σ E (7)
where the 6×6 matrix [ ]E is the overall stiffness matrix of RUC, which can be expressed as a summation over all the q yarn and matrix slices in terms of the materials slices stiffness matrix:
[ ] [ ] [ ] [ ]( )∑=
=q
mmm
Tmm TETVE
1
' (8)
where Vm is the fiber volume fraction of the mth material slice, matrix [ ]mT is the transformation between the global coordinates and the local coordinates of the mth material slice, and superscript T indicates transpose. With a given loading, the average strains in a RUC which is also the strains of each material slice can be calculated from Equation (7). The stress components in global coordinates of each material slice can be obtained and transformed to the local material coordinates as
{ } [ ] [ ] [ ]( ){ }ε=σ Tmmmm TET ' (9)
Thermal properties are also calculated based on the iso-strain assumption. For the mth material slice, thermal residual stresses, σth, are given by
{ } [ ] [ ] { } { }{ }mTmmmth TET α′−α′∆=σ (10)
where ∆T is the change in temperature from the stress free state, { }mα′ is the coefficients of thermal expansion (CTE) of the mth material slice and { }α is assumed to be the overall CTE for the RUC, given as
{ } [ ] [ ] [ ] { }( )∑=
− α′′=αq
mmm
Tmm ETVE
1
1 (11)
This formulation enables the calculation of stresses and strains of each material slice when the thermal or mechanical loads are given. This forms the foundation for the damage analysis and failure analysis of fabric reinforced composites.
NASA/TM—2013-217870 8
2.3 Nonlinear Material Response
The material nonlinearity was approximated to represent the nonlinear material response of both interstitial matrix material slice and yarn material slice (Ref. 7).
( )
β
+−β
ασσ
+=
11
1iult
oi EE (12)
where Eo represents the initial Young’s modulus or shear modulus of the matrix and yarn material, σ is the corresponding stress level, σult is the ultimate strength, and α and β are the empirical constants. Equation (12) was used to compute the instantaneous moduli for each material slice (matrix and yarn) in the RUC during incremental load step i. Thus, the overall stiffness for the RUC was computed at each incremental step. The Full Newton-Raphson Method (Ref. 17) was used for the incremental analysis. The incremental stresses in each yarn slice within the RUC were calculated as
{ } [ ] [ ]{ }iii TE ε∆′=σ∆ −1 (13)
where the 6×6 stiffness matrix [E′]i–1 defines the three-dimensional stress-strain relationship for the yarn slice and transformation matrix [T] defined in Reference 4. The [E′]i–1 matrix includes the effect of nonlinear response in Equation (12) and also the effects of damage accumulation from material slice failure. The cumulative stresses in each yarn slice were used together with appropriate failure criteria described in the following section to predict failure at each incremental step.
3.0 Micro-Mechanics Modeling For Composite Progressive Failure Criteria The geometry model of textile composites assumes that the RUC of a textile composite is a system
consisting of matrix and yarn slices. For the matrix slice, since the matrix material is assumed to be isotropic, only the volume of one matrix slice is necessary for the geometry modeling, while for a yarn slice other information like orientation and fiber volume fraction is also important. The overall stiffness and coefficients of thermal expansion of the RUC are calculated as a summation of all the material slices. The damage properties of the RUC, i.e., the stiffness reduction and strength of the RUC were also calculated based on each individual material slice. A failure criterion of yarn slices under tension based on micro-mechanics analysis and a statistical model is introduced. For the failure analysis, the failure criterion based on the fiber pullout concept of laminated composites was employed. The global composite structure failure was defined as the loss of loading capability of the RUC, which depends on the stiffness reduction due to material slice (matrix slice and yarn slice) failures and nonlinear material properties. The failure mechanism of the yarn slice in a fabric reinforced composite is quite similar to that of a laminated composite, which involves fiber/matrix debonding, fiber-bridged matrix cracking, and statistical fiber failure. In the present study, the fiber-bridged matrix crack was idealized by a continuum model in which the effect of the bridging fibers was modeled by an equivalent closure pressure on the crack surface. A shear-lag model was used to evaluate the closure pressure distribution along the crack surface and to compute the shear stress transfer along the debonded, frictional sliding fiber/matrix interface.
In this study, the three-phase micromechanics, the shear-lag (fiber pullout), and the continuum fracture mechanics models were integrated with a statistical model in the bundle yarn slices, as shown in Figure 3. At an increment of loading, σc , the matrix displacements, u(x), the fiber bridging tractions, T(x), and the interface shear stress, τi(z), using a shear-lag model (Ref. 18 to 19) were used in the continuum fracture mechanics analysis in which the bridging tractions were replaced by an effective crack closure pressure, p(x). The effective stress intensity factor, Ktip, at the fiber-bridged matrix crack tip was then used
NASA/TM—2013-217870 9
along with a fracture criterion to predict matrix crack growth. Fiber failure along the slip regions, ls, in the wake of the crack was predicted using a Weibull statistical model (Ref. 20). The effect of failed fibers, predicted by the statistical analysis, was integrated into the shear-lag and fracture mechanics analyses by accounting for the local redistribution of the fiber loading and the reduction in material slice modulus at each incremental step to account for the accumulation of damage in each material slice within the RUC. Nonlinear material properties for both matrix and fiber were included in addition to the statistical failure progress of material slices to calculate the three-dimensional effective stiffness reduction of the RUC. The failure of fabric reinforced composites was predicted based on the overall stiffness calculation of RUC. The following sections briefly describe each of the analytical models used in the present method.
3.1 Three-Phase Micromechanics Model
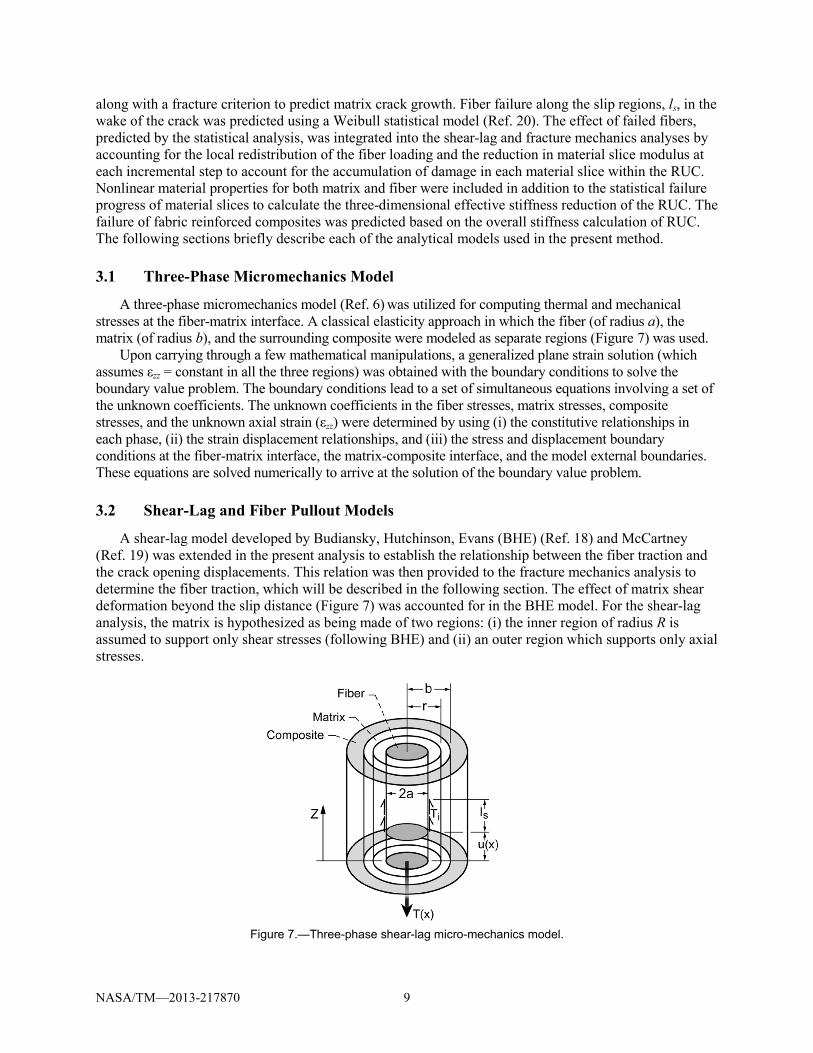
A three-phase micromechanics model (Ref. 6) was utilized for computing thermal and mechanical stresses at the fiber-matrix interface. A classical elasticity approach in which the fiber (of radius a), the matrix (of radius b), and the surrounding composite were modeled as separate regions (Figure 7) was used.
Upon carrying through a few mathematical manipulations, a generalized plane strain solution (which assumes εzz = constant in all the three regions) was obtained with the boundary conditions to solve the boundary value problem. The boundary conditions lead to a set of simultaneous equations involving a set of the unknown coefficients. The unknown coefficients in the fiber stresses, matrix stresses, composite stresses, and the unknown axial strain (εzz) were determined by using (i) the constitutive relationships in each phase, (ii) the strain displacement relationships, and (iii) the stress and displacement boundary conditions at the fiber-matrix interface, the matrix-composite interface, and the model external boundaries. These equations are solved numerically to arrive at the solution of the boundary value problem.
3.2 Shear-Lag and Fiber Pullout Models
A shear-lag model developed by Budiansky, Hutchinson, Evans (BHE) (Ref. 18) and McCartney (Ref. 19) was extended in the present analysis to establish the relationship between the fiber traction and the crack opening displacements. This relation was then provided to the fracture mechanics analysis to determine the fiber traction, which will be described in the following section. The effect of matrix shear deformation beyond the slip distance (Figure 7) was accounted for in the BHE model. For the shear-lag analysis, the matrix is hypothesized as being made of two regions: (i) the inner region of radius R is assumed to support only shear stresses (following BHE) and (ii) an outer region which supports only axial stresses.
Figure 7.—Three-phase shear-lag micro-mechanics model.
NASA/TM—2013-217870 10
Along the slip length, ls, the interfacial shear stress, τi, is given by
arrri =σ⋅µ=τ (14)
where µ is the coefficient of friction and the radial stress σrr at the fiber-matrix interface. Since σrr calculated from the generalized plane strain analysis in the previous Section 3.1 does not vary along the z direction, the interfacial shear stress, τi, calculated from the Coulomb law will also be uniform along the length of the slip region. Note that the interfacial shear stress, τi, in the present development is a function of fiber radius, fiber volume fraction, thermal stresses, and applied load level in the yarn slice. The variation of the interfacial shear stress corresponding with applied load necessitates an incremental solution approach for the present analysis. For a given load level, however, the interfacial shear stress, τi, is constant and the solution to the shear-lag problem, at each load increment, can proceed in the same manner as was done in the BHE analysis.
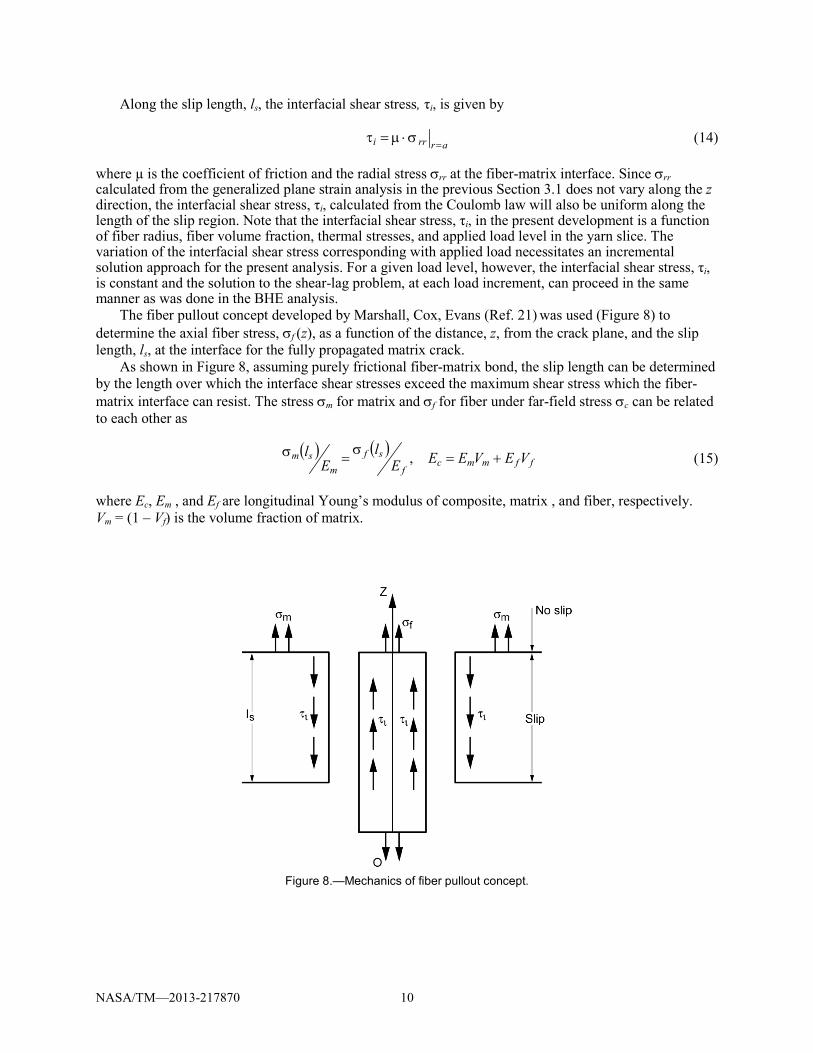
The fiber pullout concept developed by Marshall, Cox, Evans (Ref. 21) was used (Figure 8) to determine the axial fiber stress, σf (z), as a function of the distance, z, from the crack plane, and the slip length, ls, at the interface for the fully propagated matrix crack.
As shown in Figure 8, assuming purely frictional fiber-matrix bond, the slip length can be determined by the length over which the interface shear stresses exceed the maximum shear stress which the fiber-matrix interface can resist. The stress σm for matrix and σf for fiber under far-field stress σc can be related to each other as
( ) ( )ffmmc
fsf
msm VEVEEE
lE
l +=σ=σ , (15)
where Ec, Em , and Ef are longitudinal Young’s modulus of composite, matrix , and fiber, respectively. Vm = (1 – Vf) is the volume fraction of matrix.
Figure 8.—Mechanics of fiber pullout concept.
NASA/TM—2013-217870 11
Assuming the extension due to stress σc is δ(x) for matrix, the extension for fiber will be u(x) + δ(x). By following the procedure in Reference 21 and considering the equilibrium of the matrix and fiber separately, a set of equations can be written as
( ) imm azAz τπ=σ 2 (16)
( ) ffif AzRzAxT σ+τπ= 2)( (17)
( ) ( ) ( )
∫∫σ
=+δσ
=δss l
ff
fl
mm
m dzEAz
xuxdzEAzx
00
)()(,)( (18)
where a is the radius of the fiber, Af is the fiber cross-section area, Am is the area of matrix per fiber, or Af/(Af + Am) = Vf is the fiber volume faction. Notice that when the shear stress on the fiber-matrix interface reaches its maximum value associated with the coefficient of friction µ and the radial stress σrr at the fiber-matrix interface (which can also be a material constant for each bundle yarn by testing), Equation (18) becomes
( )f
is
f
s
mm
is
aEl
ElxTxux
EAalx τ
−=+δτπ
=δ22 )()()(,)( (19)
This set of equations yielded the relation between the crack opening displacement and fiber traction as
( )
2)(4
1)( xT
EEVaE
xuicf
fm
τ−
= (20)
The slip length ls can also be expressed as
fc
fmcis
VEVE
al )1(2 −σ
=τ
(21)
and the fiber stress within the slip region as
( )a
zV
z i
f
cf
τ−
σ=σ
2 (22)
3.3 3.2 Continuum Fracture Mechanics Model for Matrix Cracking
The fracture mechanics analysis for the continuum solution to the problem of a crack is required to provide the relationship between the unknown crack opening displacement u(x) and fiber bridging traction T(x), where x represents the position on the crack surface. Both the matrix and fibers of the composite (yarn) were assumed to deform as linear elastic solids having Young’s moduli Em and Ef respectively. It was also assumed that both matrix and fibers have the same Poisson’s ratio so that the modulus of the yarn Ec in the direction of the fibers is given by Ec = Ef Vf + Em Vm .
As illustrated in Figure 3, considering a crack under far-field applied stress, σc, and a crack closure pressure, p(x), the crack opening displacement (Ref. 22) u(x),where X = x/c, can be written for a crack in an orthotropic material as
NASA/TM—2013-217870 12
( ) ( ) dtXtXttp
EcXu
s
cc
c22
221
0 1111ln12+−+
−+−
σ
−πσ
= ∫ (23)
where Ec is the longitudinal Young’s modulus of the composite (i.e., yarn), c is the half crack length. The fiber bridging pressure (i.e., crack closure pressure), p(X), and the fiber bridging traction T(X) is related by the fiber volume fraction, Vf, as
( ) ( )XTVXp f= (24)
The nonlinear governing integral equation can be derived using Equations (20), (23), and (24) as
( ) ( ) ( )
+−+
−+−σ
−−ππσ
=τ
−∫s
dtXtXttT
VX
EcXT
EEVaE
c
f
c
c
icf
fm1
022
2222
1111ln12
41
(25)
Hence, the fiber bridging traction T(X) can be solved using iterative procedures developed by Marshall, Cox, and Evans (Ref. 21). By obtaining the crack closure pressure, the stress intensity factor for yarn material, K, at the fiber-bridged crack can be calculated as
( )( )dXX
XpcKs
c∫ −
−σπ
=1
021
2 (26)
The matrix stress intensity factor, tipmK )( , can also be related to the yarn stress intensity factor K as
( ) cf
mtipm EV
EKK−
=1
)( (27)
where Em is the matrix Young’s modulus. With a specified critical stress intensity toughness of matrix, KIc, matrix crack propagation is predicted when
Ictipm KK ≥)( (28)
This fracture mechanics approach was integrated with the three-phase micromechanics and shear-lag models for the prediction of matrix crack propagation. An incremental scheme as described in Section 2.3 was used to calculate the matrix stress intensity factor at each load increment. When the criterion in Equations (28) was satisfied, the matrix crack was incremented by a small amount (for instance, 1/50 of the initial crack size), or a given crack growth rate (dc/dt) along with the numerical convergence where t is time (i.e., loading increments), and the stress intensity was recalculated at the corresponding load level.
3.4 Statistical Fiber Failure Model
The results from the combined micromechanics and fracture mechanics analysis indicate that under longitudinal tension loading, a unidirectional brittle fiber-matrix yarn system undergoes unstable matrix crack propagation soon after crack initiation. In sequence, predominantly a fiber-bridged matrix crack propagates through the width of the yarn. The applied load is then carried by the bridging fibers. A shear-lag model was used to model each fiber along the fully propagated matrix crack and the slipping region at the fiber-matrix interface.
The axial fiber stress, σf (z), as a function of the distance, z, from the crack plane was derived from the shear-lag and fiber pullout models in Section 3.1 and is given by Equations (22). This equation was used
NASA/TM—2013-217870 13
to determine the probability of fiber failure in the slip region in the vicinity of the matrix crack plane where the fiber stress was a maximum.
The tensile strength of a brittle material under uniform loading was assumed to be governed by the Weibull distribution (Ref. 20) to describe the probability of fiber failure as
σ
σπ−−= ∫
−
s
s
l
l
M
o
ff dzaP 2exp1 (29)
where Pf denotes the fraction of the fibers that have already failed due to the stress distribution given in Equations (22), M is the Weibull modulus that is a measure of the scatter in the strength data. The practical ranges of M values are 2 < M < 60. Large scatter in the strength data accompanies low values of M. σo is the mean fiber strength. Substituting Equations (21) and (22) into Equations (29), the probability of fiber failure can be expressed as
( )( ) ( )
−+−
−−
στ+σπ
−=++
+
+ 11
1
12 11
11
1exp1
M
c
fmM
c
fmMf
Moi
Mc
f EVE
EVE
VMaP (30)
The fiber volume fraction of the yarn at any given load level i, Vfi, was given by
( )ffif PVV −= 10 (31)
where Vfo was the initial fiber volume fraction of the undamaged yarn, i is the incremental load step as
described in Section 2.3. The yarn was assumed to have failed for Vfi = 0.2 when the fiber failures would
become unstable.
3.5 Failure Criteria for Repeating Unit Cell and Overall Composite Structures
The statistical failure criterion and maximum stress strength or maximum strain strength criteria were combined together to predict the failure of individual material slice in the RUC and overall composite structure. Yarn material slices failures are divided into matrix dominated failure and fiber dominated failure. The failure criterion of Equations (31) was used to predict the tensile failure of fibers in a yarn slice. A matrix crack failure criterion of Equations (28) was used for the transverse tensile failure (on the crack surface) for matrix crack propagation in a yarn slice. In other words, two additional criteria were combined with maximum stress strength or maximum strain strength criteria to test for yarn slice failure in the RUC: (1) Vf i = Vf
critical (e.g., 0.2) for fiber failure, or (2) Km ≥ KIc for matrix failure, where the critical stress intensity factor KIc is a material constant specified. If either condition was met, the yarn slice was assumed to have failed.
The stiffness reduction due to the material slice failure in the RUC was used for the damage accumulation in the RUC under tension loads. When a material slice is failed based on the failure criteria mentioned above, the Young’s modulus and shear modulus are reduced accordingly as described in Sections 2.2 and 2.3.
Global composite structure failure is reached when the RUC stiffness corresponding to each load step is less than a critical value specified, for example, 10 percent of the original value E0 in Equations (12).
4.0 Fatigue Failure Prediction Model For Composite Structure The progressive failure prediction method described in Sections 2.0 and 3.0 was extended to develop
a fatigue damage prediction model based on the stiffness reduction due to the material slice failure in the RUC and the observation of experimental test results performed using 2-D plain weave carbon/silicon
NASA/TM—2013-217870 14
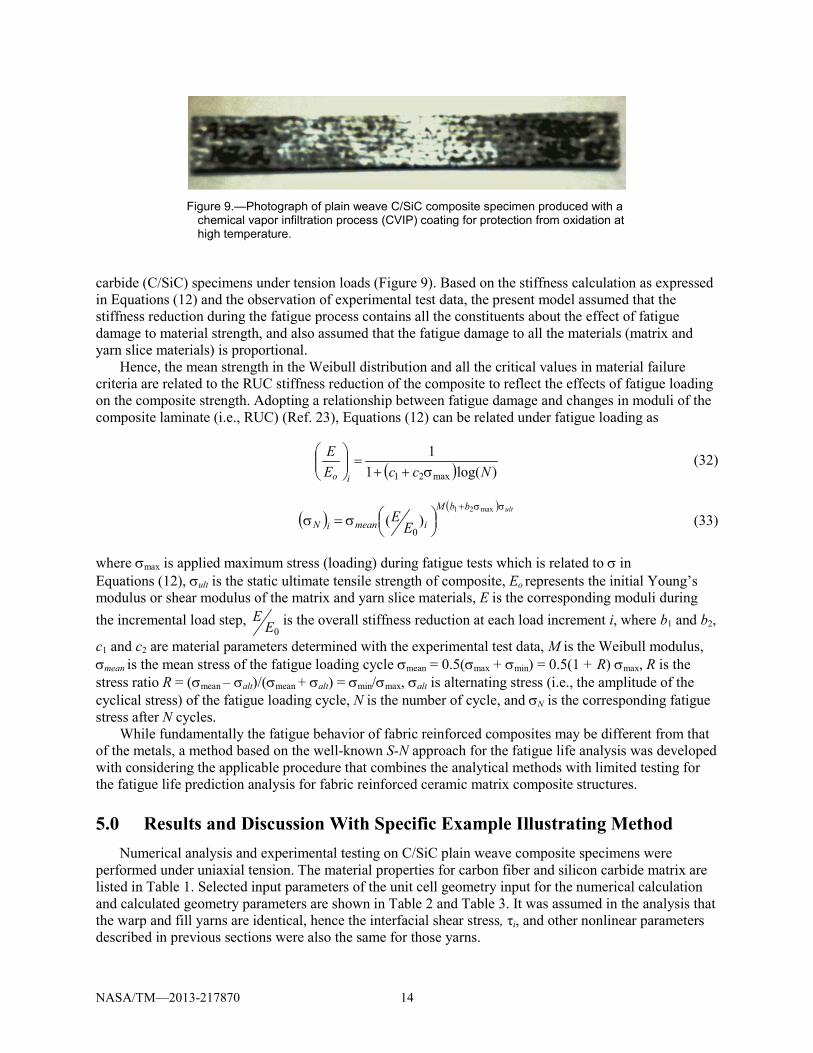
Figure 9.—Photograph of plain weave C/SiC composite specimen produced with a
chemical vapor infiltration process (CVIP) coating for protection from oxidation at high temperature.
carbide (C/SiC) specimens under tension loads (Figure 9). Based on the stiffness calculation as expressed in Equations (12) and the observation of experimental test data, the present model assumed that the stiffness reduction during the fatigue process contains all the constituents about the effect of fatigue damage to material strength, and also assumed that the fatigue damage to all the materials (matrix and yarn slice materials) is proportional.
Hence, the mean strength in the Weibull distribution and all the critical values in material failure criteria are related to the RUC stiffness reduction of the composite to reflect the effects of fatigue loading on the composite strength. Adopting a relationship between fatigue damage and changes in moduli of the composite laminate (i.e., RUC) (Ref. 23), Equations (12) can be related under fatigue loading as
( ) )log(11max21 NccE
E
io σ++=
(32)
( )( ) ultbbM
imeaniN EE
σσ+
σ=σ
max21
)(0
(33)
where σmax is applied maximum stress (loading) during fatigue tests which is related to σ in Equations (12), σult is the static ultimate tensile strength of composite, Eo represents the initial Young’s modulus or shear modulus of the matrix and yarn slice materials, E is the corresponding moduli during the incremental load step,
0EE is the overall stiffness reduction at each load increment i, where b1 and b2,
c1 and c2 are material parameters determined with the experimental test data, M is the Weibull modulus, σmean is the mean stress of the fatigue loading cycle σmean = 0.5(σmax + σmin) = 0.5(1 + R) σmax, R is the stress ratio R = (σmean – σalt)/(σmean + σalt) = σmin/σmax, σalt is alternating stress (i.e., the amplitude of the cyclical stress) of the fatigue loading cycle, N is the number of cycle, and σN is the corresponding fatigue stress after N cycles.
While fundamentally the fatigue behavior of fabric reinforced composites may be different from that of the metals, a method based on the well-known S-N approach for the fatigue life analysis was developed with considering the applicable procedure that combines the analytical methods with limited testing for the fatigue life prediction analysis for fabric reinforced ceramic matrix composite structures.
5.0 Results and Discussion With Specific Example Illustrating Method Numerical analysis and experimental testing on C/SiC plain weave composite specimens were
performed under uniaxial tension. The material properties for carbon fiber and silicon carbide matrix are listed in Table 1. Selected input parameters of the unit cell geometry input for the numerical calculation and calculated geometry parameters are shown in Table 2 and Table 3. It was assumed in the analysis that the warp and fill yarns are identical, hence the interfacial shear stress, τi, and other nonlinear parameters described in previous sections were also the same for those yarns.
NASA/TM—2013-217870 15
TABLE 1.—FIBER AND MATRIX PROPERTIES USED FOR C/SiC PLAIN WEAVE UNIT CELL
Material Young’s Modulus, GPa
Possion’s ratio
Fiber 231.0 0.20 Matrix 3.51 0.20
TABLE 2.—GEOMETRY PARAMETERS OF C/SiC PLAIN WEAVE UNIT CELL FOR NUMERICAL MODEL INPUT
Yarn size (K), n
Weave angle Yarn spacing, Ly
Yarn packing density, pd
Unit cell thickness, H
1 90.0 3.22 mm 0.6 0.60 mm
TABLE 3.—GEOMETRY PARAMETERS OF C/SIC PLAIN WEAVE UNIT CELL CALCULATED BY NUMERICAL MODEL
Yarn thickness, t
Crimp angle, θc
Yarn length, Lu+ Lst
Unit cell volume fraction, Vf
R 0.30 mm 2.26 6.40 mm 0.40
In the analysis, the coefficient of friction µ= 0.4 for interfacial shear stress parameter, c0 = 0.01 mm
for the initial crack length, critical stress intensity factor of KIc = 0.2 MPa√m, Weibull modulus M = 10, the mean fiber strength σo = 502 MPa, and 1.0 and 10.0 for material nonlinear parameter α and β were used, respectively.
An experimental investigation was performed to determine the fatigue and static behavior of the C/SiC specimens. The specimens were loaded in static tension and in tension-tension fatigue under isothermal fixed-frequency conditions. The room temperature level and a range of stress levels for fatigue were used to assess performance. The tests were conducted at 23 °C. Measurements were made of modulus and cycles to failure several times during the test.
The experimental investigation was divided into two parts to develop an understanding of the fatigue performance of the material. The first part consisted of an investigation to determine the static properties of the material and determine how the modulus of the material changes as a function of maximum applied static strain. The second portion of the testing consisted of an investigation of the high cycle fatigue behavior of the material. The specimens were tested to failure or 1,000,000 cycles.
Tests were performed on a C/SiC composite material system with a CVIP coating. The coating provided protection from oxidation at high temperature. This composite specimen system consisted of 2-D plain weave carbon fibers in a silicon carbide matrix produced in 18 ply symmetric lay-ups. The test specimens were machined into 6 in. length specimens by approximately 0.50 in. wide gage section with a nominal thickness of 0.12 in. after manufacture.
The static test used on the C/SiC was performed in load control at a loading rate of 5,000 lb/min on a 50 kip servo-hydraulic test stand equipped with an automated data acquisition system. Load and strain were recorded at half-second intervals during all of the tests. Property calculations consisted of ultimate strength and modulus. Ultimate stress was calculated using the highest load carried by the laminate. Modulus was calculated using a least squares fit to the unloading segments of data during static tests.
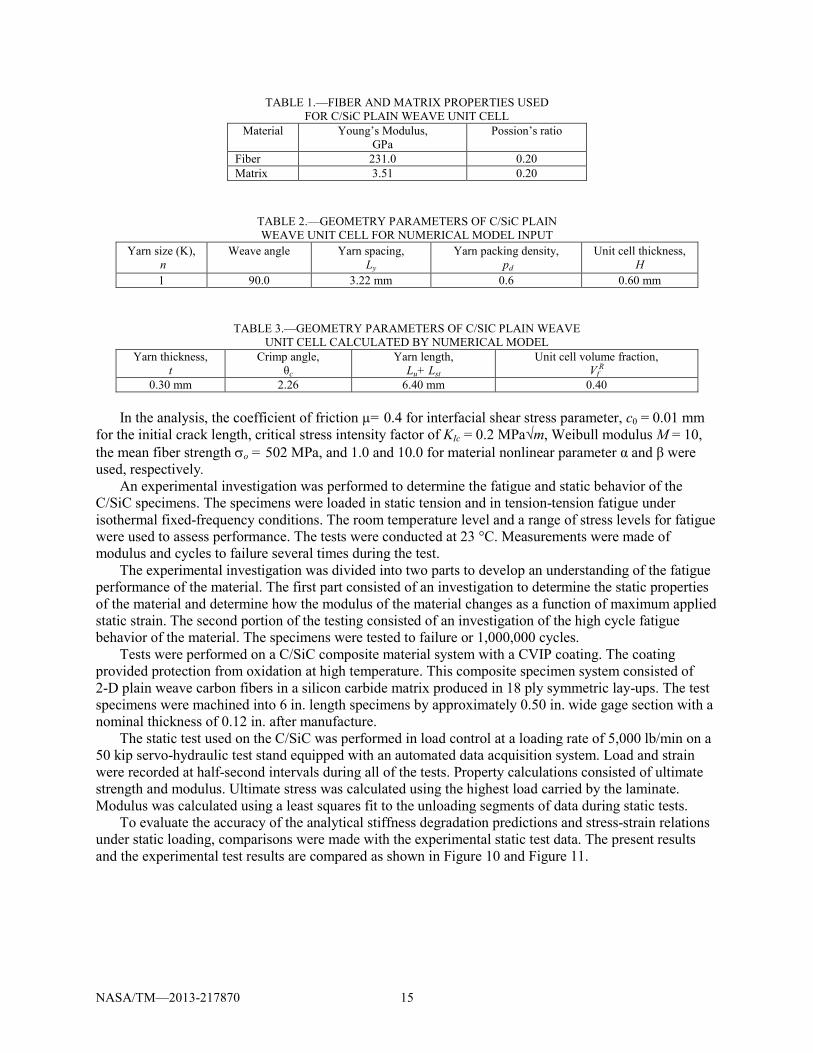
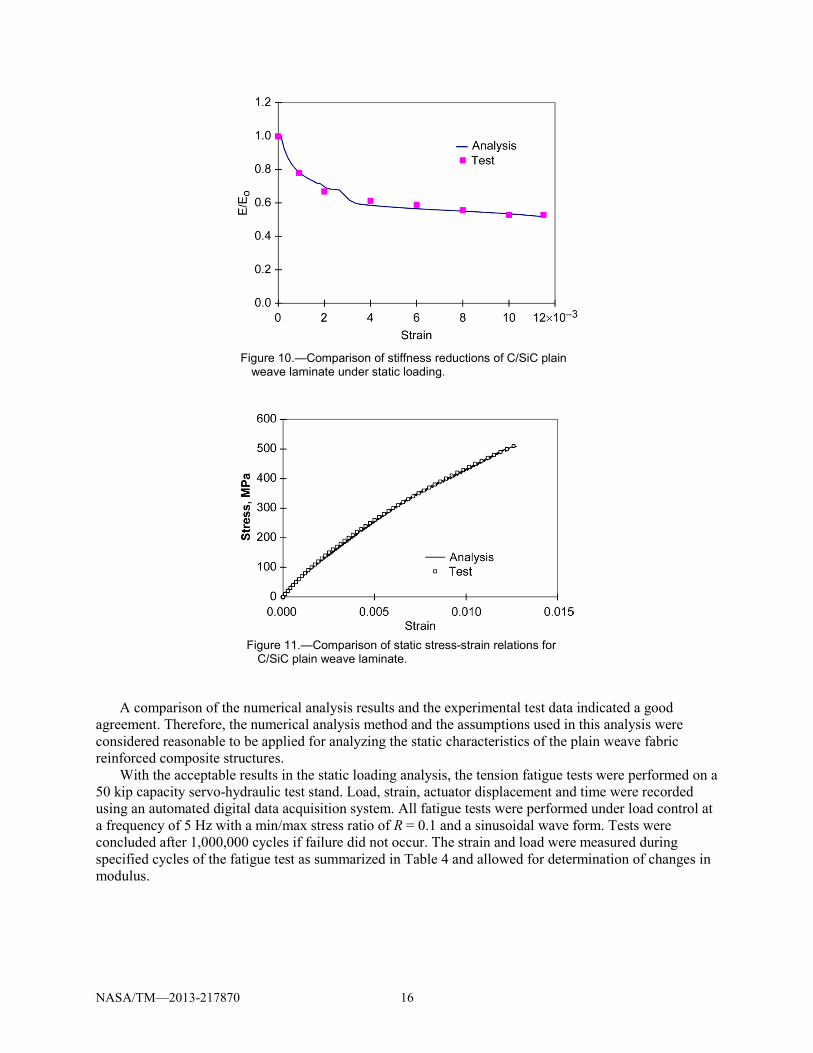
To evaluate the accuracy of the analytical stiffness degradation predictions and stress-strain relations under static loading, comparisons were made with the experimental static test data. The present results and the experimental test results are compared as shown in Figure 10 and Figure 11.
NASA/TM—2013-217870 16
Figure 10.—Comparison of stiffness reductions of C/SiC plain
weave laminate under static loading.
Figure 11.—Comparison of static stress-strain relations for
C/SiC plain weave laminate.
A comparison of the numerical analysis results and the experimental test data indicated a good
agreement. Therefore, the numerical analysis method and the assumptions used in this analysis were considered reasonable to be applied for analyzing the static characteristics of the plain weave fabric reinforced composite structures.
With the acceptable results in the static loading analysis, the tension fatigue tests were performed on a 50 kip capacity servo-hydraulic test stand. Load, strain, actuator displacement and time were recorded using an automated digital data acquisition system. All fatigue tests were performed under load control at a frequency of 5 Hz with a min/max stress ratio of R = 0.1 and a sinusoidal wave form. Tests were concluded after 1,000,000 cycles if failure did not occur. The strain and load were measured during specified cycles of the fatigue test as summarized in Table 4 and allowed for determination of changes in modulus.
NASA/TM—2013-217870 17
TABLE 4.—SPECIFIED CYCLES FOR FATIGUE DATA MEASURED IN C/SiC FATIGUE TESTS
Cycle count range Reading interval 1 to 10 1 cycle
10 to 50 5 cycles 50 to 100 10 cycles
100 to 500 50 cycles 500 to 1,000 100 cycles
1,000 to 5,000 500 cycles 5,000 to 10,000 1,000 cycles
10,000 to 100,000 5,000 cycles 100,000 to 1,000,000 10,000 cycles
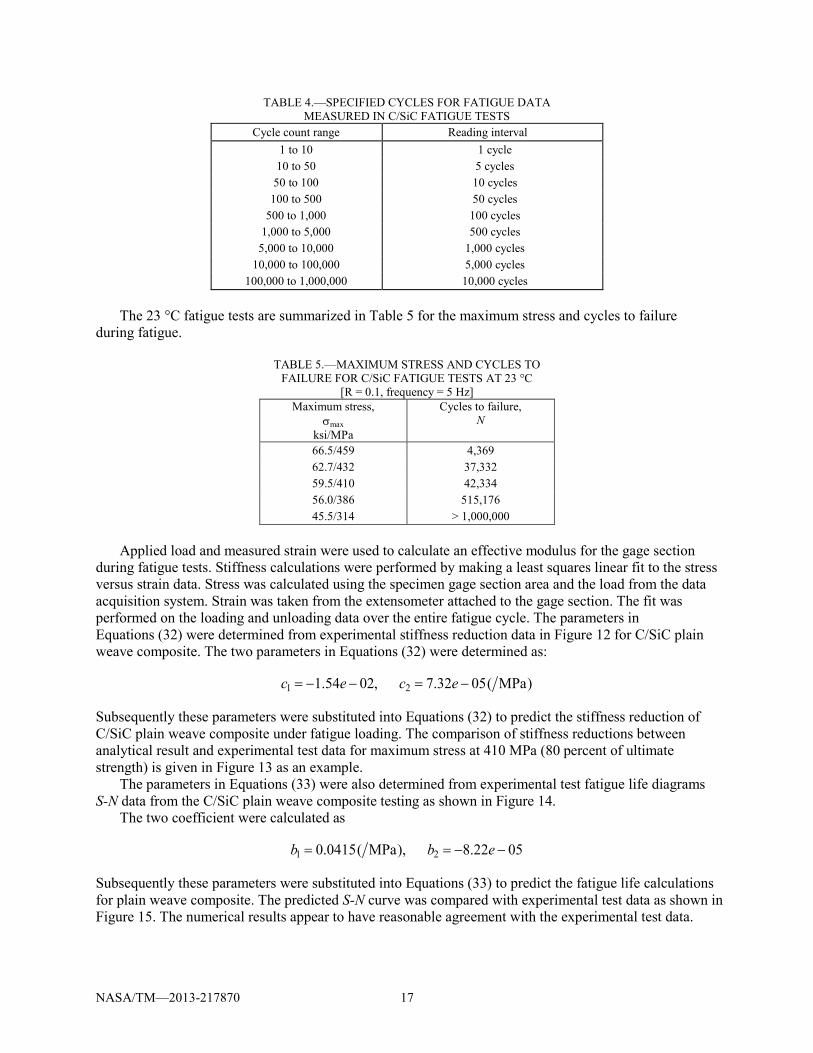
The 23 °C fatigue tests are summarized in Table 5 for the maximum stress and cycles to failure
during fatigue.
TABLE 5.—MAXIMUM STRESS AND CYCLES TO FAILURE FOR C/SiC FATIGUE TESTS AT 23 °C
[R = 0.1, frequency = 5 Hz] Maximum stress,
σmax ksi/MPa
Cycles to failure, N
66.5/459 4,369 62.7/432 37,332 59.5/410 42,334 56.0/386 515,176 45.5/314 > 1,000,000
Applied load and measured strain were used to calculate an effective modulus for the gage section
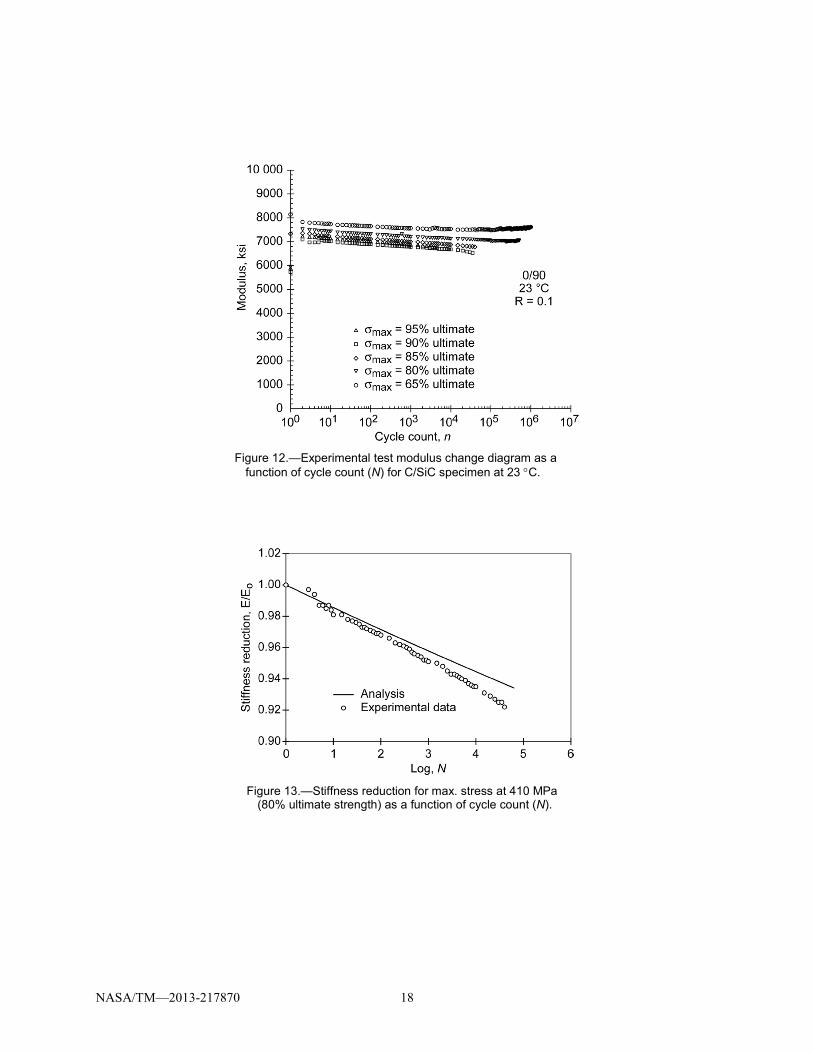
during fatigue tests. Stiffness calculations were performed by making a least squares linear fit to the stress versus strain data. Stress was calculated using the specimen gage section area and the load from the data acquisition system. Strain was taken from the extensometer attached to the gage section. The fit was performed on the loading and unloading data over the entire fatigue cycle. The parameters in Equations (32) were determined from experimental stiffness reduction data in Figure 12 for C/SiC plain weave composite. The two parameters in Equations (32) were determined as:
)MPa(0532.7,0254.1 21 −=−−= ecec
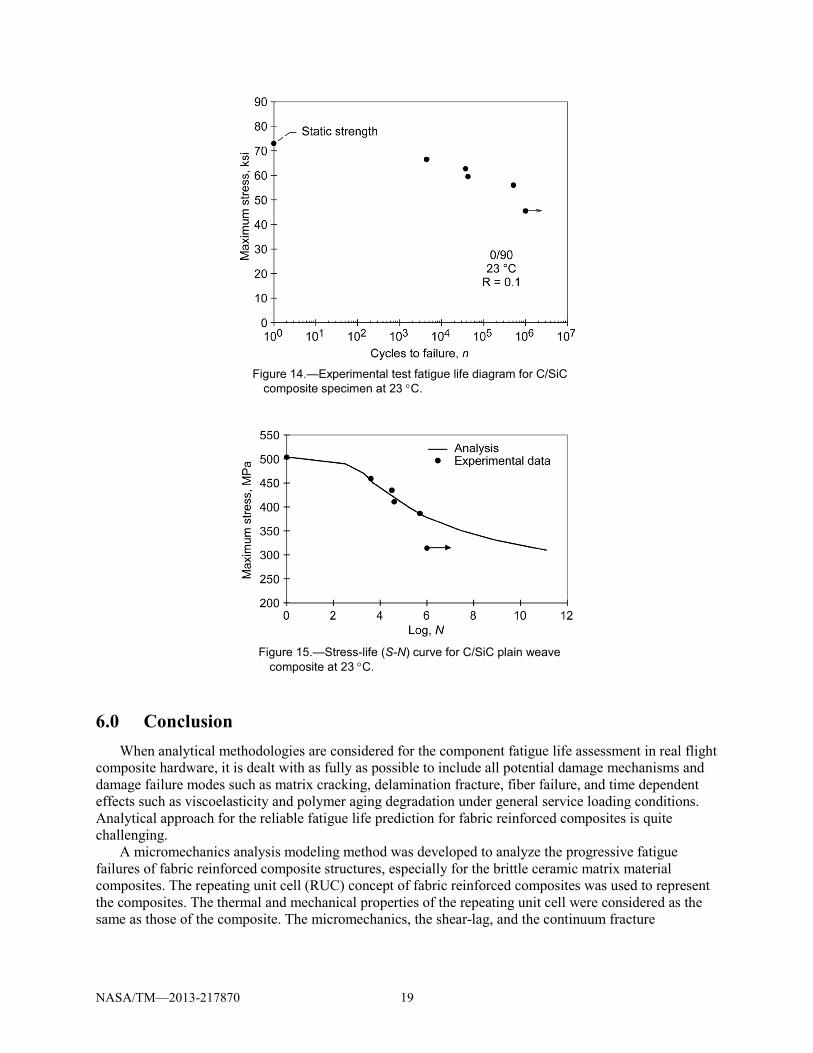
Subsequently these parameters were substituted into Equations (32) to predict the stiffness reduction of C/SiC plain weave composite under fatigue loading. The comparison of stiffness reductions between analytical result and experimental test data for maximum stress at 410 MPa (80 percent of ultimate strength) is given in Figure 13 as an example.
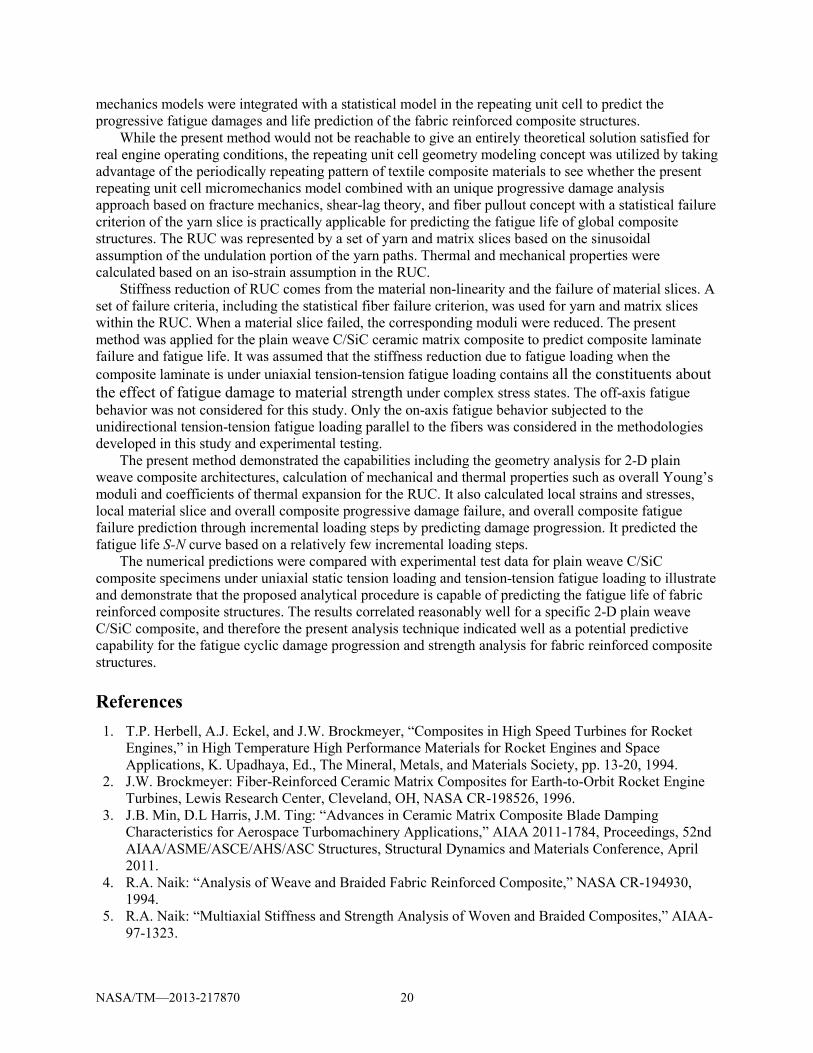
The parameters in Equations (33) were also determined from experimental test fatigue life diagrams S-N data from the C/SiC plain weave composite testing as shown in Figure 14.
The two coefficient were calculated as
0522.8),MPa(0415.0 21 −−== ebb
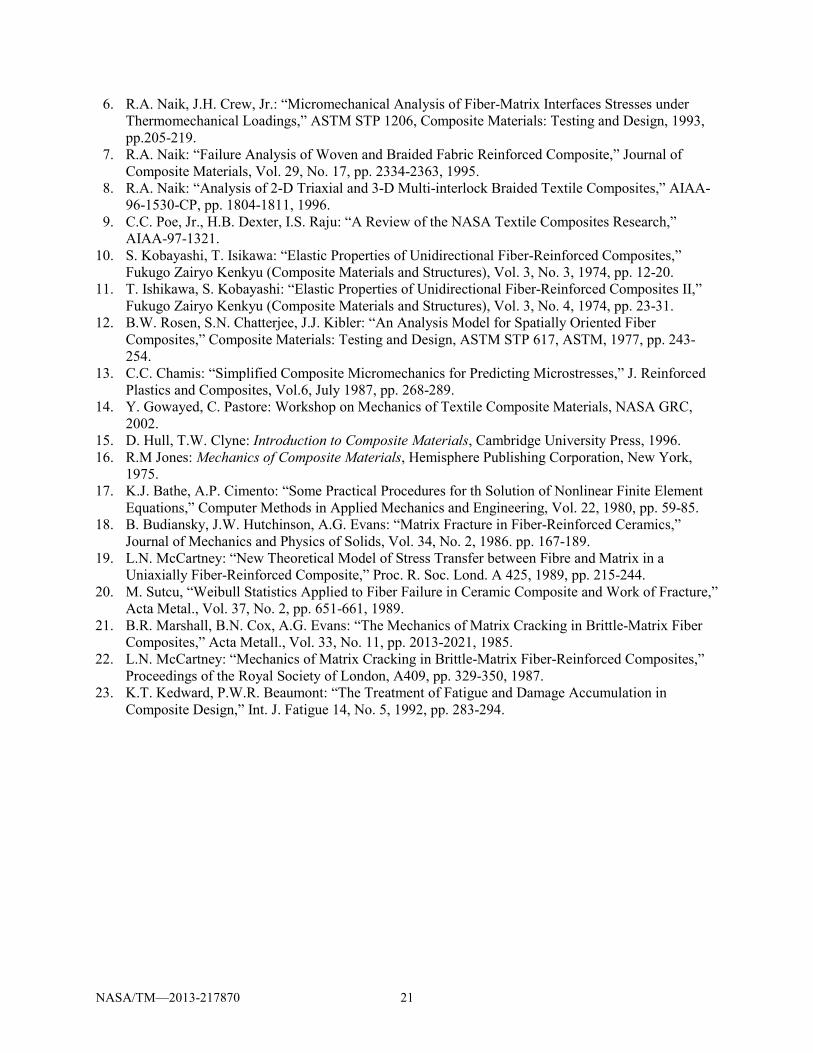
Subsequently these parameters were substituted into Equations (33) to predict the fatigue life calculations for plain weave composite. The predicted S-N curve was compared with experimental test data as shown in Figure 15. The numerical results appear to have reasonable agreement with the experimental test data.
NASA/TM—2013-217870 18
Figure 12.—Experimental test modulus change diagram as a
function of cycle count (N) for C/SiC specimen at 23 °C.
Figure 13.—Stiffness reduction for max. stress at 410 MPa
(80% ultimate strength) as a function of cycle count (N).
NASA/TM—2013-217870 19
Figure 14.—Experimental test fatigue life diagram for C/SiC
composite specimen at 23 °C.
Figure 15.—Stress-life (S-N) curve for C/SiC plain weave
composite at 23 °C.
6.0 Conclusion When analytical methodologies are considered for the component fatigue life assessment in real flight
composite hardware, it is dealt with as fully as possible to include all potential damage mechanisms and damage failure modes such as matrix cracking, delamination fracture, fiber failure, and time dependent effects such as viscoelasticity and polymer aging degradation under general service loading conditions. Analytical approach for the reliable fatigue life prediction for fabric reinforced composites is quite challenging.
A micromechanics analysis modeling method was developed to analyze the progressive fatigue failures of fabric reinforced composite structures, especially for the brittle ceramic matrix material composites. The repeating unit cell (RUC) concept of fabric reinforced composites was used to represent the composites. The thermal and mechanical properties of the repeating unit cell were considered as the same as those of the composite. The micromechanics, the shear-lag, and the continuum fracture
NASA/TM—2013-217870 20
mechanics models were integrated with a statistical model in the repeating unit cell to predict the progressive fatigue damages and life prediction of the fabric reinforced composite structures.
While the present method would not be reachable to give an entirely theoretical solution satisfied for real engine operating conditions, the repeating unit cell geometry modeling concept was utilized by taking advantage of the periodically repeating pattern of textile composite materials to see whether the present repeating unit cell micromechanics model combined with an unique progressive damage analysis approach based on fracture mechanics, shear-lag theory, and fiber pullout concept with a statistical failure criterion of the yarn slice is practically applicable for predicting the fatigue life of global composite structures. The RUC was represented by a set of yarn and matrix slices based on the sinusoidal assumption of the undulation portion of the yarn paths. Thermal and mechanical properties were calculated based on an iso-strain assumption in the RUC.
Stiffness reduction of RUC comes from the material non-linearity and the failure of material slices. A set of failure criteria, including the statistical fiber failure criterion, was used for yarn and matrix slices within the RUC. When a material slice failed, the corresponding moduli were reduced. The present method was applied for the plain weave C/SiC ceramic matrix composite to predict composite laminate failure and fatigue life. It was assumed that the stiffness reduction due to fatigue loading when the composite laminate is under uniaxial tension-tension fatigue loading contains all the constituents about the effect of fatigue damage to material strength under complex stress states. The off-axis fatigue behavior was not considered for this study. Only the on-axis fatigue behavior subjected to the unidirectional tension-tension fatigue loading parallel to the fibers was considered in the methodologies developed in this study and experimental testing.
The present method demonstrated the capabilities including the geometry analysis for 2-D plain weave composite architectures, calculation of mechanical and thermal properties such as overall Young’s moduli and coefficients of thermal expansion for the RUC. It also calculated local strains and stresses, local material slice and overall composite progressive damage failure, and overall composite fatigue failure prediction through incremental loading steps by predicting damage progression. It predicted the fatigue life S-N curve based on a relatively few incremental loading steps.
The numerical predictions were compared with experimental test data for plain weave C/SiC composite specimens under uniaxial static tension loading and tension-tension fatigue loading to illustrate and demonstrate that the proposed analytical procedure is capable of predicting the fatigue life of fabric reinforced composite structures. The results correlated reasonably well for a specific 2-D plain weave C/SiC composite, and therefore the present analysis technique indicated well as a potential predictive capability for the fatigue cyclic damage progression and strength analysis for fabric reinforced composite structures.
References 1. T.P. Herbell, A.J. Eckel, and J.W. Brockmeyer, “Composites in High Speed Turbines for Rocket
Engines,” in High Temperature High Performance Materials for Rocket Engines and Space Applications, K. Upadhaya, Ed., The Mineral, Metals, and Materials Society, pp. 13-20, 1994.
2. J.W. Brockmeyer: Fiber-Reinforced Ceramic Matrix Composites for Earth-to-Orbit Rocket Engine Turbines, Lewis Research Center, Cleveland, OH, NASA CR-198526, 1996.
3. J.B. Min, D.L Harris, J.M. Ting: “Advances in Ceramic Matrix Composite Blade Damping Characteristics for Aerospace Turbomachinery Applications,” AIAA 2011-1784, Proceedings, 52nd AIAA/ASME/ASCE/AHS/ASC Structures, Structural Dynamics and Materials Conference, April 2011.
4. R.A. Naik: “Analysis of Weave and Braided Fabric Reinforced Composite,” NASA CR-194930, 1994.
5. R.A. Naik: “Multiaxial Stiffness and Strength Analysis of Woven and Braided Composites,” AIAA-97-1323.
NASA/TM—2013-217870 21
6. R.A. Naik, J.H. Crew, Jr.: “Micromechanical Analysis of Fiber-Matrix Interfaces Stresses under Thermomechanical Loadings,” ASTM STP 1206, Composite Materials: Testing and Design, 1993, pp.205-219.
7. R.A. Naik: “Failure Analysis of Woven and Braided Fabric Reinforced Composite,” Journal of Composite Materials, Vol. 29, No. 17, pp. 2334-2363, 1995.
8. R.A. Naik: “Analysis of 2-D Triaxial and 3-D Multi-interlock Braided Textile Composites,” AIAA-96-1530-CP, pp. 1804-1811, 1996.
9. C.C. Poe, Jr., H.B. Dexter, I.S. Raju: “A Review of the NASA Textile Composites Research,” AIAA-97-1321.
10. S. Kobayashi, T. Isikawa: “Elastic Properties of Unidirectional Fiber-Reinforced Composites,” Fukugo Zairyo Kenkyu (Composite Materials and Structures), Vol. 3, No. 3, 1974, pp. 12-20.
11. T. Ishikawa, S. Kobayashi: “Elastic Properties of Unidirectional Fiber-Reinforced Composites II,” Fukugo Zairyo Kenkyu (Composite Materials and Structures), Vol. 3, No. 4, 1974, pp. 23-31.
12. B.W. Rosen, S.N. Chatterjee, J.J. Kibler: “An Analysis Model for Spatially Oriented Fiber Composites,” Composite Materials: Testing and Design, ASTM STP 617, ASTM, 1977, pp. 243-254.
13. C.C. Chamis: “Simplified Composite Micromechanics for Predicting Microstresses,” J. Reinforced Plastics and Composites, Vol.6, July 1987, pp. 268-289.
14. Y. Gowayed, C. Pastore: Workshop on Mechanics of Textile Composite Materials, NASA GRC, 2002.
15. D. Hull, T.W. Clyne: Introduction to Composite Materials, Cambridge University Press, 1996. 16. R.M Jones: Mechanics of Composite Materials, Hemisphere Publishing Corporation, New York,
1975. 17. K.J. Bathe, A.P. Cimento: “Some Practical Procedures for th Solution of Nonlinear Finite Element
Equations,” Computer Methods in Applied Mechanics and Engineering, Vol. 22, 1980, pp. 59-85. 18. B. Budiansky, J.W. Hutchinson, A.G. Evans: “Matrix Fracture in Fiber-Reinforced Ceramics,”
Journal of Mechanics and Physics of Solids, Vol. 34, No. 2, 1986. pp. 167-189. 19. L.N. McCartney: “New Theoretical Model of Stress Transfer between Fibre and Matrix in a
Uniaxially Fiber-Reinforced Composite,” Proc. R. Soc. Lond. A 425, 1989, pp. 215-244. 20. M. Sutcu, “Weibull Statistics Applied to Fiber Failure in Ceramic Composite and Work of Fracture,”
Acta Metal., Vol. 37, No. 2, pp. 651-661, 1989. 21. B.R. Marshall, B.N. Cox, A.G. Evans: “The Mechanics of Matrix Cracking in Brittle-Matrix Fiber
Composites,” Acta Metall., Vol. 33, No. 11, pp. 2013-2021, 1985. 22. L.N. McCartney: “Mechanics of Matrix Cracking in Brittle-Matrix Fiber-Reinforced Composites,”
Proceedings of the Royal Society of London, A409, pp. 329-350, 1987. 23. K.T. Kedward, P.W.R. Beaumont: “The Treatment of Fatigue and Damage Accumulation in
Composite Design,” Int. J. Fatigue 14, No. 5, 1992, pp. 283-294.
REPORT DOCUMENTATION PAGE Form Approved OMB No. 0704-0188
The public reporting burden for this collection of information is estimated to average 1 hour per response, including the time for reviewing instructions, searching existing data sources, gathering and maintaining the data needed, and completing and reviewing the collection of information. Send comments regarding this burden estimate or any other aspect of this collection of information, including suggestions for reducing this burden, to Department of Defense, Washington Headquarters Services, Directorate for Information Operations and Reports (0704-0188), 1215 Jefferson Davis Highway, Suite 1204, Arlington, VA 22202-4302. Respondents should be aware that notwithstanding any other provision of law, no person shall be subject to any penalty for failing to comply with a collection of information if it does not display a currently valid OMB control number. PLEASE DO NOT RETURN YOUR FORM TO THE ABOVE ADDRESS.
1. REPORT DATE (DD-MM-YYYY) 01-05-2013
2. REPORT TYPE Technical Memorandum
3. DATES COVERED (From - To)
4. TITLE AND SUBTITLE Micromechanics Fatigue Damage Analysis Modeling for Fabric Reinforced Ceramic Matrix Composites
5a. CONTRACT NUMBER
5b. GRANT NUMBER
5c. PROGRAM ELEMENT NUMBER
6. AUTHOR(S) Min, J., B.; Xue, D.; Shi, Y.
5d. PROJECT NUMBER
5e. TASK NUMBER
5f. WORK UNIT NUMBER WBS 473452.02.03.05.06.02.01; 699549.01.04
7. PERFORMING ORGANIZATION NAME(S) AND ADDRESS(ES) National Aeronautics and Space Administration John H. Glenn Research Center at Lewis Field Cleveland, Ohio 44135-3191
8. PERFORMING ORGANIZATION REPORT NUMBER E-18663
9. SPONSORING/MONITORING AGENCY NAME(S) AND ADDRESS(ES) National Aeronautics and Space Administration Washington, DC 20546-0001
10. SPONSORING/MONITOR'S ACRONYM(S) NASA
11. SPONSORING/MONITORING REPORT NUMBER NASA/TM-2013-217870
12. DISTRIBUTION/AVAILABILITY STATEMENT Unclassified-Unlimited Subject Categories: 05, 16, and 39 Available electronically at http://www.sti.nasa.gov This publication is available from the NASA Center for AeroSpace Information, 443-757-5802
13. SUPPLEMENTARY NOTES
14. ABSTRACT A micromechanics analysis modeling method was developed to analyze the damage progression and fatigue failure of fabric reinforced composite structures, especially for the brittle ceramic matrix material composites. A repeating unit cell concept of fabric reinforced composites was used to represent the global composite structure. The thermal and mechanical properties of the repeating unit cell were considered as the same as those of the global composite structure. The three-phase micromechanics, the shear-lag, and the continuum fracture mechanics models were integrated with a statistical model in the repeating unit cell to predict the progressive damages and fatigue life of the composite structures. The global structure failure was defined as the loss of loading capability of the repeating unit cell, which depends on the stiffness reduction due to material slice failures and nonlinear material properties in the repeating unit cell. The present methodology is demonstrated with the analysis results evaluated through the experimental test performed with carbon fiber reinforced silicon carbide matrix plain weave composite specimens.15. SUBJECT TERMS Micromechanics; Repeating unit cell; Fatigue damage prediction; Aerospace engine blade; Finite element; Vibration; Damping; Composites
16. SECURITY CLASSIFICATION OF: 17. LIMITATION OF ABSTRACT UU
18. NUMBER OF PAGES
28
19a. NAME OF RESPONSIBLE PERSON STI Help Desk (email:[email protected])
a. REPORT U
b. ABSTRACT U
c. THIS PAGE U
19b. TELEPHONE NUMBER (include area code) 443-757-5802
Standard Form 298 (Rev. 8-98)Prescribed by ANSI Std. Z39-18