Microgrid Testbeds & Controller Procurement · NREL is seeking a microgrid control technology for...
30
Testing and Comparing Microgrid Controllers Performance Aspects Using Hardware-in-the-Loop Simulations Microgrid Testbeds & Controller Procurement
Transcript of Microgrid Testbeds & Controller Procurement · NREL is seeking a microgrid control technology for...

Testing and Comparing Microgrid Controllers Performance Aspects Using Hardware-in-the-Loop Simulations
Microgrid Testbeds & Controller Procurement
Agenda ESIF-NREL intro
Microgrid Controller Procurement 2017
Microgrid testbed
Model validation
Test sequences
Controllers evaluation criteria
Example results
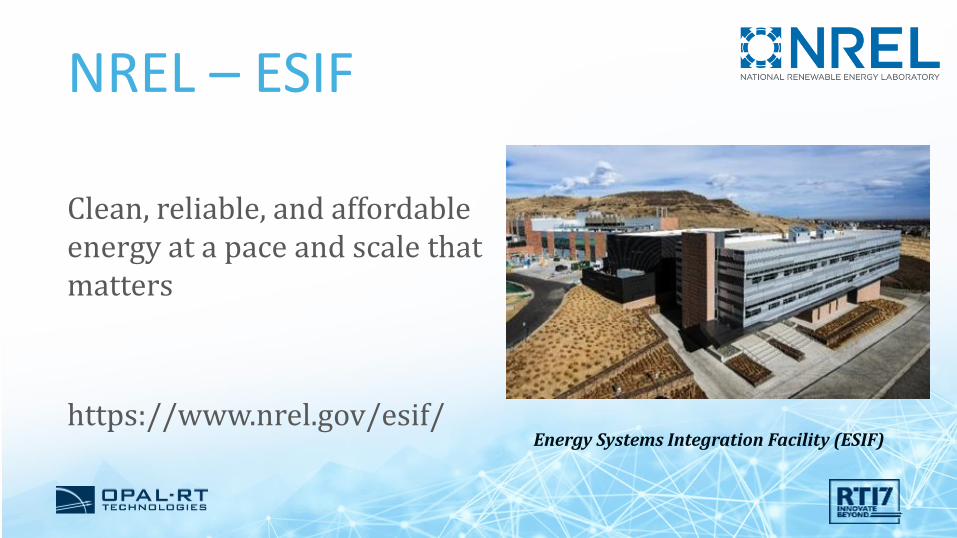
NREL – ESIF
Energy Systems Integration Facility (ESIF)
Clean, reliable, and affordable energy at a pace and scale that matters
https://www.nrel.gov/esif/
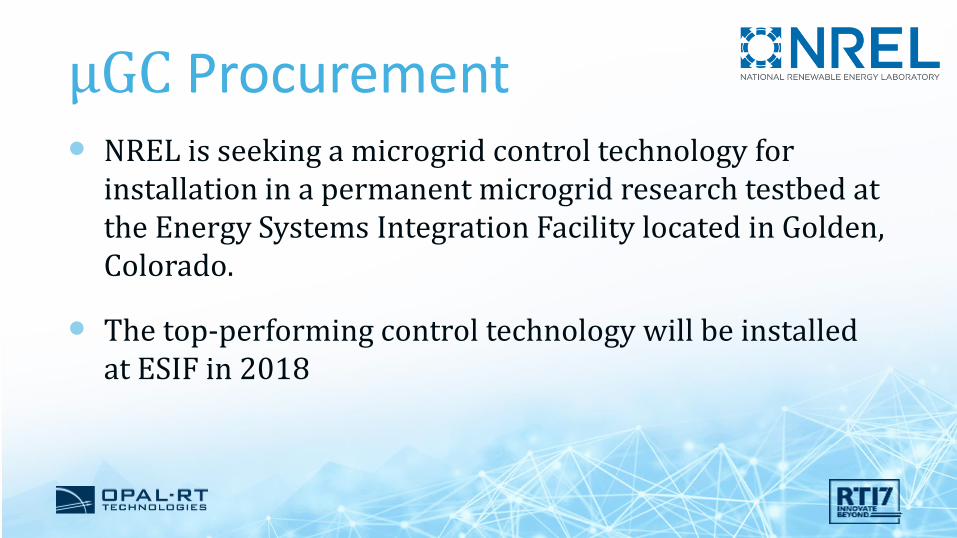
μGC Procurement NREL is seeking a microgrid control technology for
installation in a permanent microgrid research testbed at the Energy Systems Integration Facility located in Golden, Colorado.
The top-performing control technology will be installed at ESIF in 2018
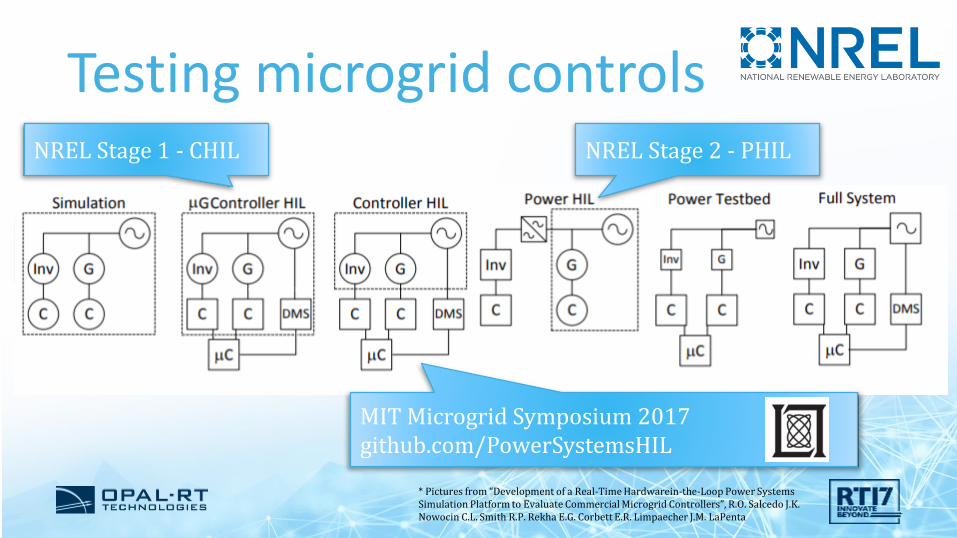
Testing microgrid controls
* Pictures from “Development of a Real-Time Hardwarein-the-Loop Power Systems Simulation Platform to Evaluate Commercial Microgrid Controllers”, R.O. Salcedo J.K. Nowocin C.L. Smith R.P. Rekha E.G. Corbett E.R. Limpaecher J.M. LaPenta
MIT Microgrid Symposium 2017github.com/PowerSystemsHIL
NREL Stage 1 - CHIL NREL Stage 2 - PHIL
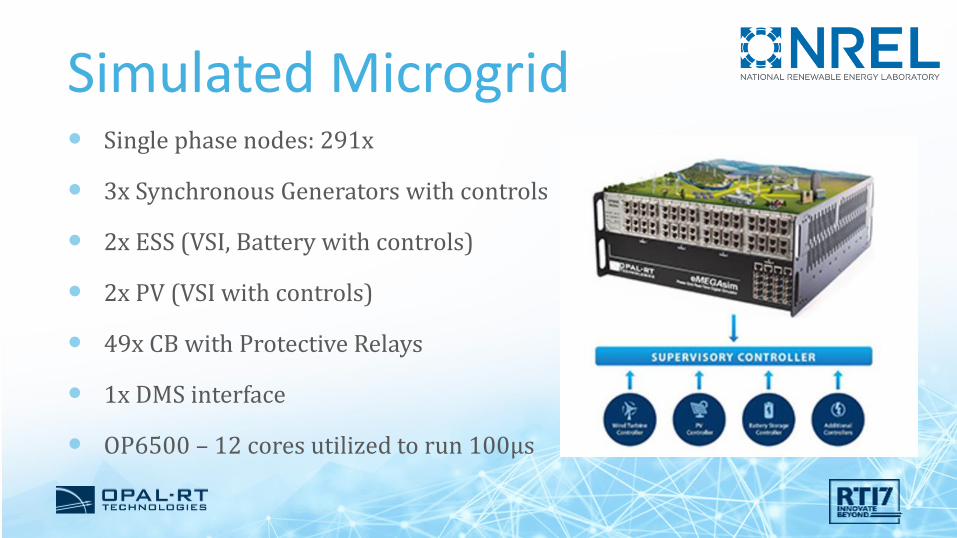
Simulated Microgrid Single phase nodes: 291x
3x Synchronous Generators with controls
2x ESS (VSI, Battery with controls)
2x PV (VSI with controls)
49x CB with Protective Relays
1x DMS interface
OP6500 – 12 cores utilized to run 100μs
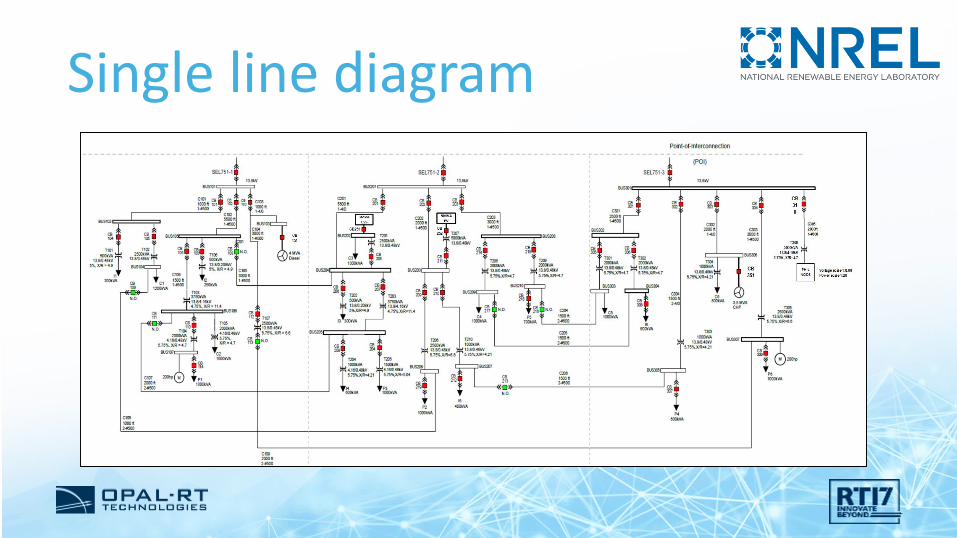
Single line diagram
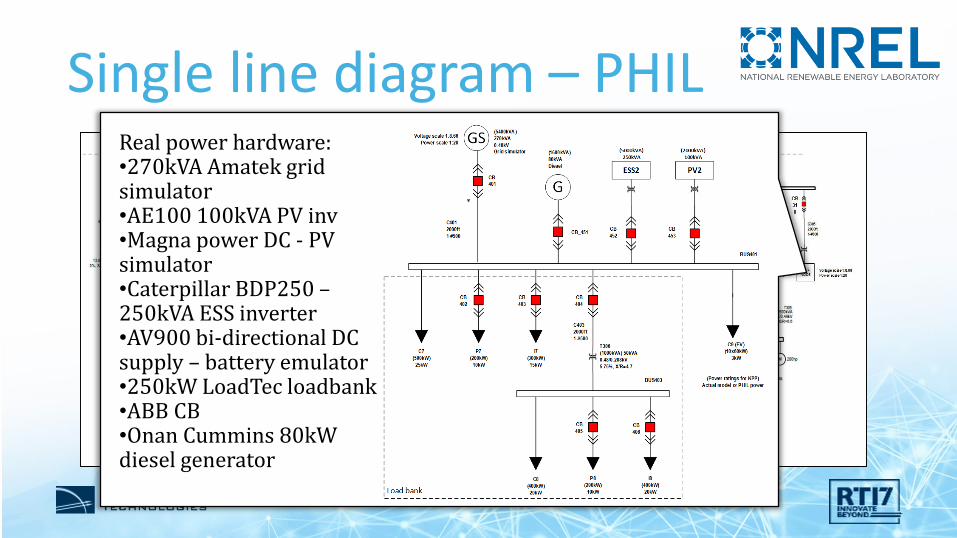
Single line diagram – PHILReal power hardware:•270kVA Amatek grid simulator•AE100 100kVA PV inv•Magna power DC - PV simulator•Caterpillar BDP250 –250kVA ESS inverter•AV900 bi-directional DC supply – battery emulator•250kW LoadTec loadbank•ABB CB•Onan Cummins 80kW diesel generator
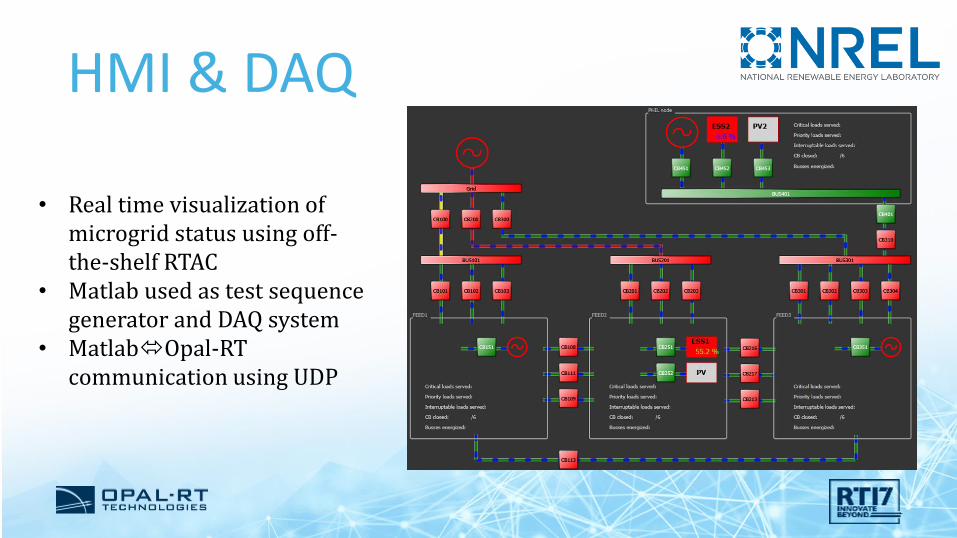
HMI & DAQ
• Real time visualization of microgrid status using off-the-shelf RTAC
• Matlab used as test sequence generator and DAQ system
• MatlabOpal-RTcommunication using UDP
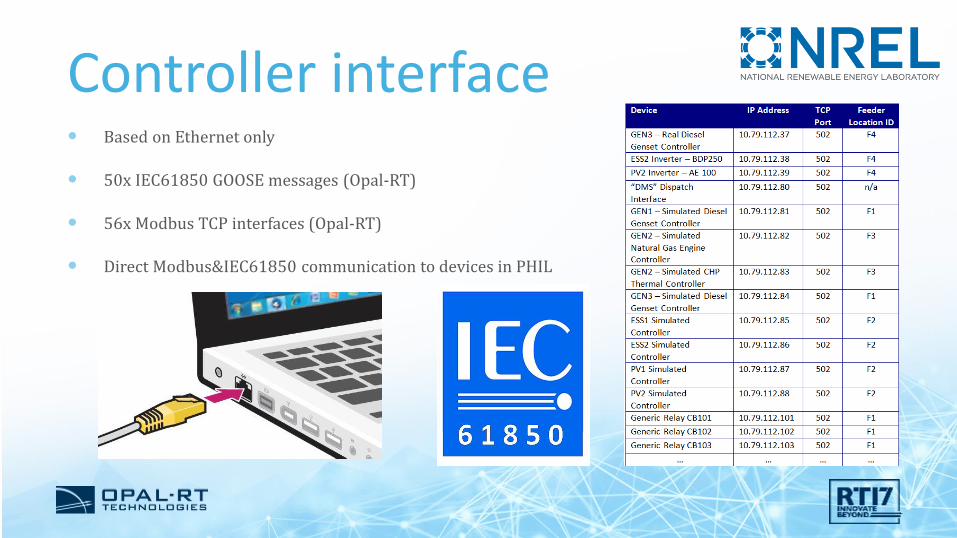
Controller interface Based on Ethernet only
50x IEC61850 GOOSE messages (Opal-RT)
56x Modbus TCP interfaces (Opal-RT)
Direct Modbus&IEC61850 communication to devices in PHIL
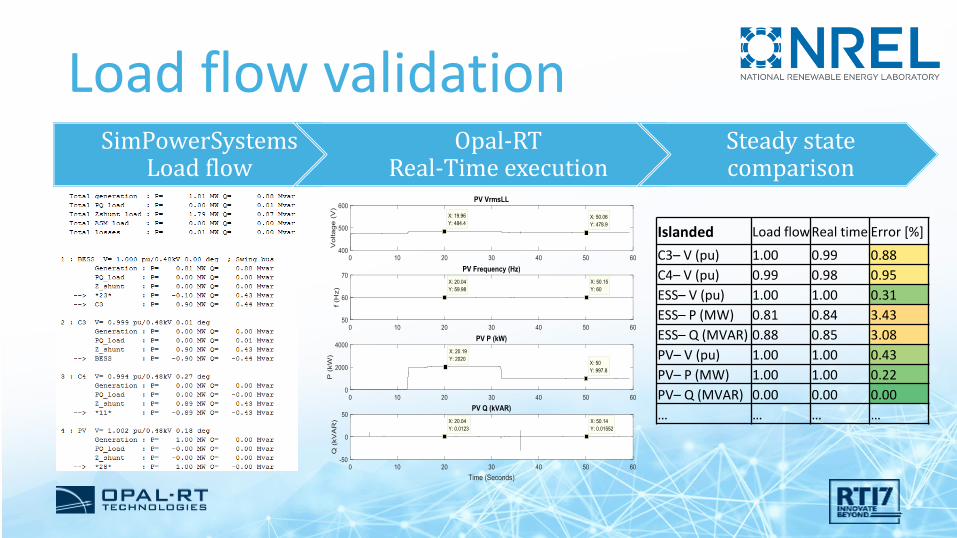
Load flow validation
Islanded Load flowReal time Error [%]
C3– V (pu) 1.00 0.99 0.88
C4– V (pu) 0.99 0.98 0.95
ESS– V (pu) 1.00 1.00 0.31
ESS– P (MW) 0.81 0.84 3.43
ESS– Q (MVAR) 0.88 0.85 3.08
PV– V (pu) 1.00 1.00 0.43
PV– P (MW) 1.00 1.00 0.22
PV– Q (MVAR) 0.00 0.00 0.00
… … … …
SimPowerSystemsLoad flow
Opal-RTReal-Time execution
Steady state comparison
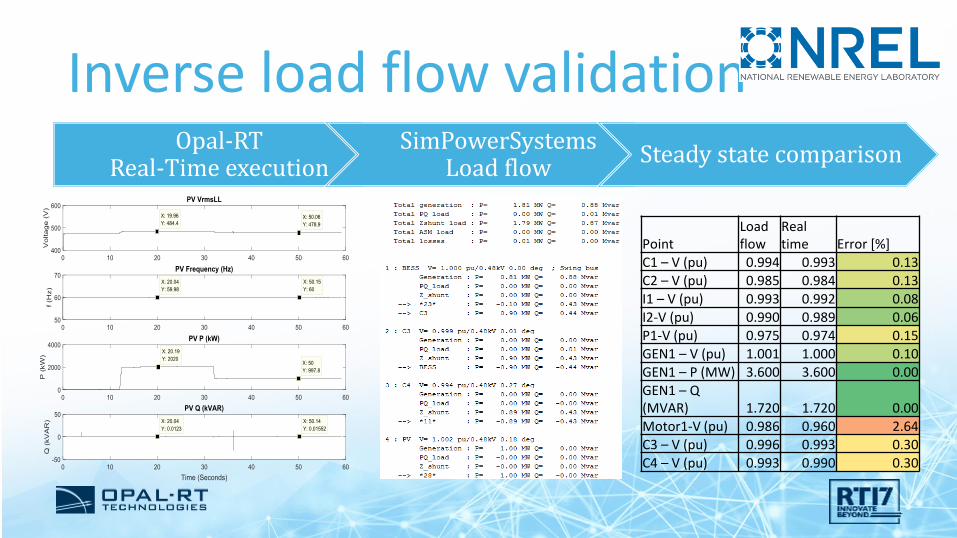
Inverse load flow validationOpal-RT
Real-Time executionSimPowerSystems
Load flowSteady state comparison
PointLoad flow
Real time Error [%]
C1 – V (pu) 0.994 0.993 0.13C2 – V (pu) 0.985 0.984 0.13I1 – V (pu) 0.993 0.992 0.08I2-V (pu) 0.990 0.989 0.06P1-V (pu) 0.975 0.974 0.15GEN1 – V (pu) 1.001 1.000 0.10GEN1 – P (MW) 3.600 3.600 0.00GEN1 – Q (MVAR) 1.720 1.720 0.00Motor1-V (pu) 0.986 0.960 2.64C3 – V (pu) 0.996 0.993 0.30C4 – V (pu) 0.993 0.990 0.30
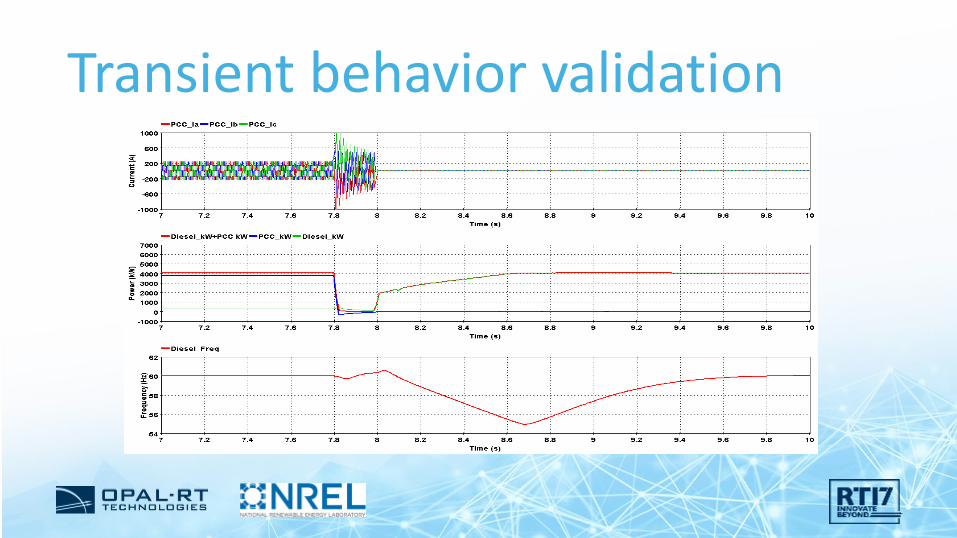
Transient behavior validation
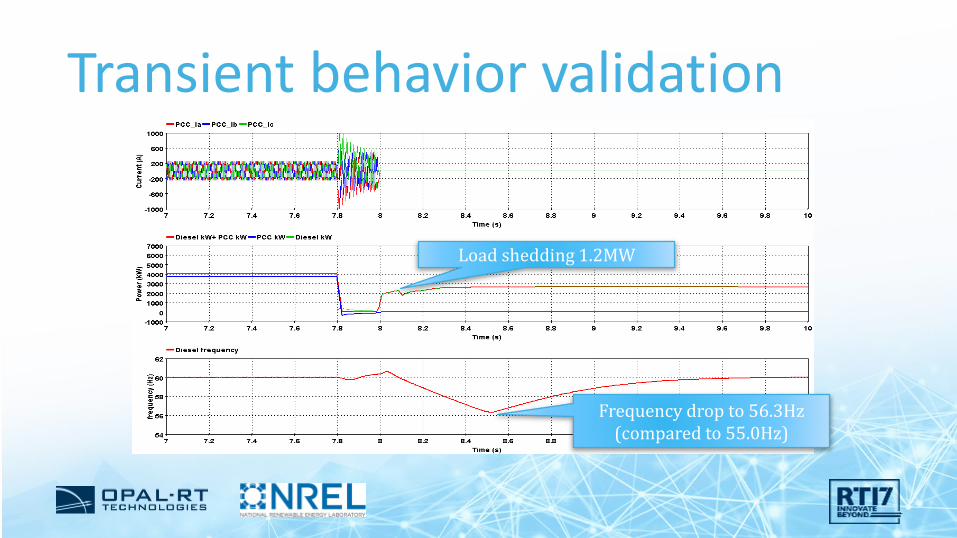
Transient behavior validation
Load shedding 1.2MW
Frequency drop to 56.3Hz (compared to 55.0Hz)
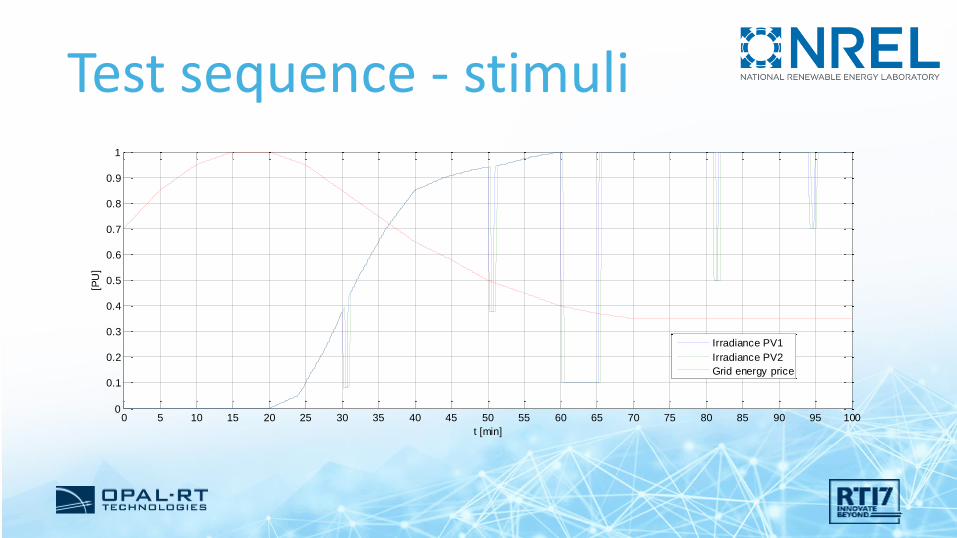
Test sequence - stimuli
0 5 10 15 20 25 30 35 40 45 50 55 60 65 70 75 80 85 90 95 1000
0.1
0.2
0.3
0.4
0.5
0.6
0.7
0.8
0.9
1
t [min]
[PU
]
Irradiance PV1
Irradiance PV2
Grid energy price
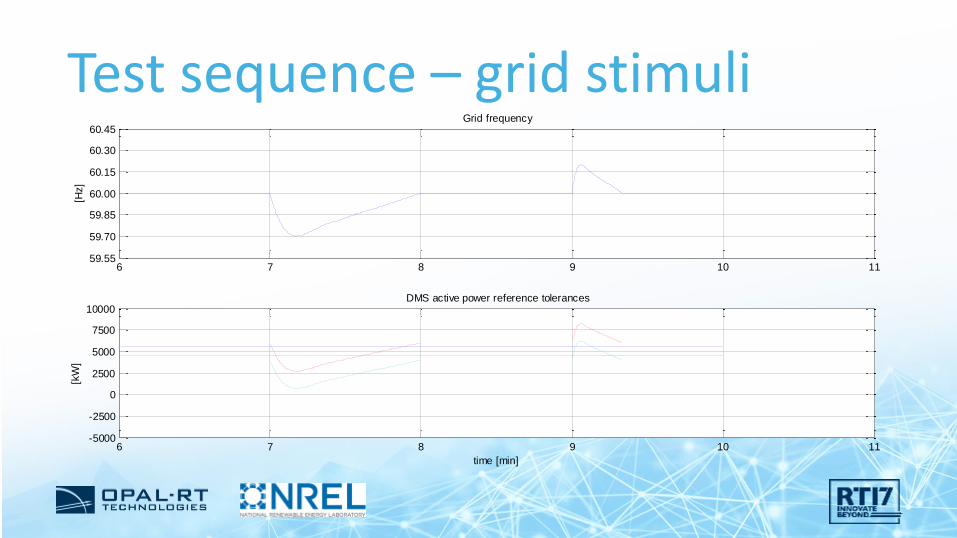
Test sequence – grid stimuli
6 7 8 9 10 1159.55
59.70
59.85
60.00
60.15
60.30
60.45Grid frequency
[Hz]
6 7 8 9 10 11-5000
-2500
0
2500
5000
7500
10000DMS active power reference tolerances
[kW
]
time [min]
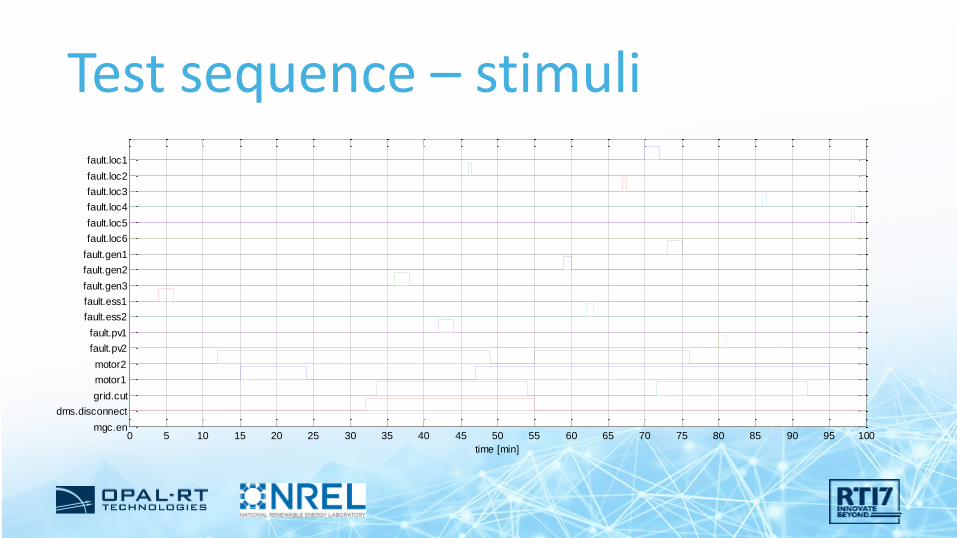
Test sequence – stimuli
0 5 10 15 20 25 30 35 40 45 50 55 60 65 70 75 80 85 90 95 100mgc.en
dms.disconnect
grid.cut
motor1
motor2
fault.pv2
fault.pv1
fault.ess2
fault.ess1
fault.gen3
fault.gen2
fault.gen1
fault.loc6
fault.loc5
fault.loc4
fault.loc3
fault.loc2
fault.loc1
time [min]
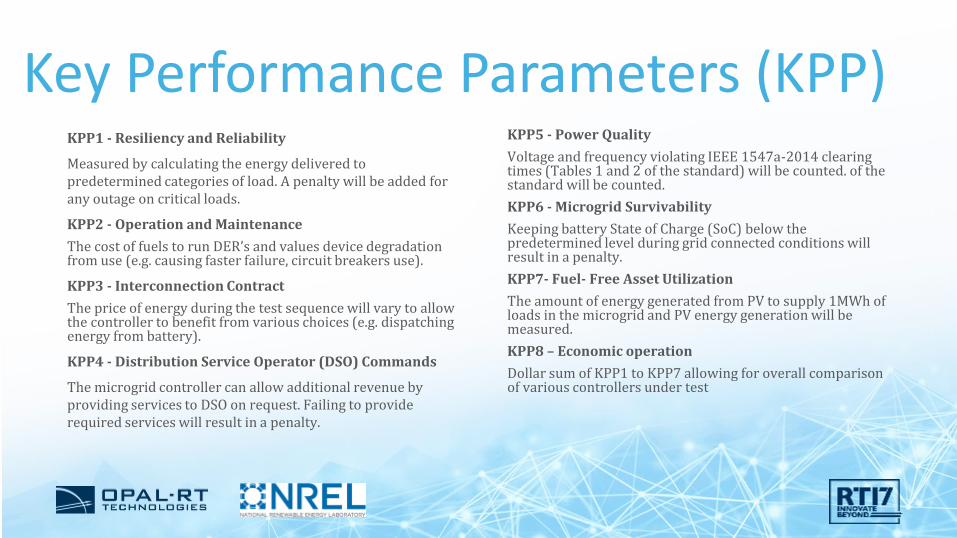
Key Performance Parameters (KPP)KPP1 - Resiliency and Reliability
Measured by calculating the energy delivered to predetermined categories of load. A penalty will be added for any outage on critical loads.
KPP2 - Operation and Maintenance
The cost of fuels to run DER’s and values device degradation from use (e.g. causing faster failure, circuit breakers use).
KPP3 - Interconnection Contract
The price of energy during the test sequence will vary to allow the controller to benefit from various choices (e.g. dispatching energy from battery).
KPP4 - Distribution Service Operator (DSO) Commands
The microgrid controller can allow additional revenue by providing services to DSO on request. Failing to provide required services will result in a penalty.
KPP5 - Power Quality
Voltage and frequency violating IEEE 1547a-2014 clearing times (Tables 1 and 2 of the standard) will be counted. of the standard will be counted.
KPP6 - Microgrid Survivability
Keeping battery State of Charge (SoC) below the predetermined level during grid connected conditions will result in a penalty.
KPP7- Fuel- Free Asset Utilization
The amount of energy generated from PV to supply 1MWh of loads in the microgrid and PV energy generation will be measured.
KPP8 – Economic operation
Dollar sum of KPP1 to KPP7 allowing for overall comparison of various controllers under test
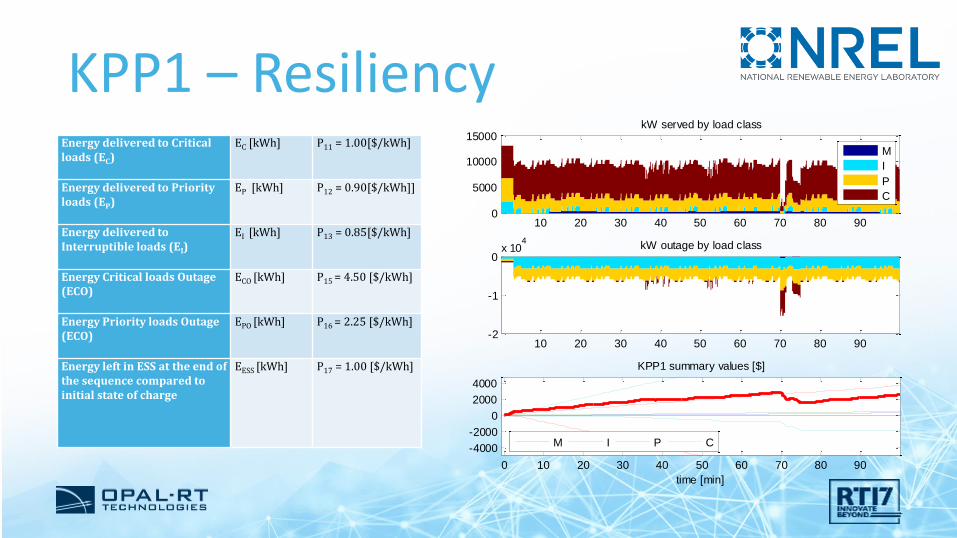
KPP1 – Resiliency Energy delivered to Critical loads (EC)
EC [kWh] P11 = 1.00[$/kWh]
Energy delivered to Priority loads (EP)
EP [kWh] P12 = 0.90[$/kWh]]
Energy delivered to Interruptible loads (EI)
EI [kWh] P13 = 0.85[$/kWh]
Energy Critical loads Outage (ECO)
ECO [kWh] P15 = 4.50 [$/kWh]
Energy Priority loads Outage (ECO)
EPO [kWh] P16 = 2.25 [$/kWh]
Energy left in ESS at the end of the sequence compared to initial state of charge
EESS [kWh] P17 = 1.00 [$/kWh]
10 20 30 40 50 60 70 80 900
5000
10000
15000kW served by load class
M
I
P
C
10 20 30 40 50 60 70 80 90-2
-1
0x 10
4kW outage by load class
0 10 20 30 40 50 60 70 80 90
-4000
-2000
0
2000
4000
time [min]
KPP1 summary values [$]
M I P C
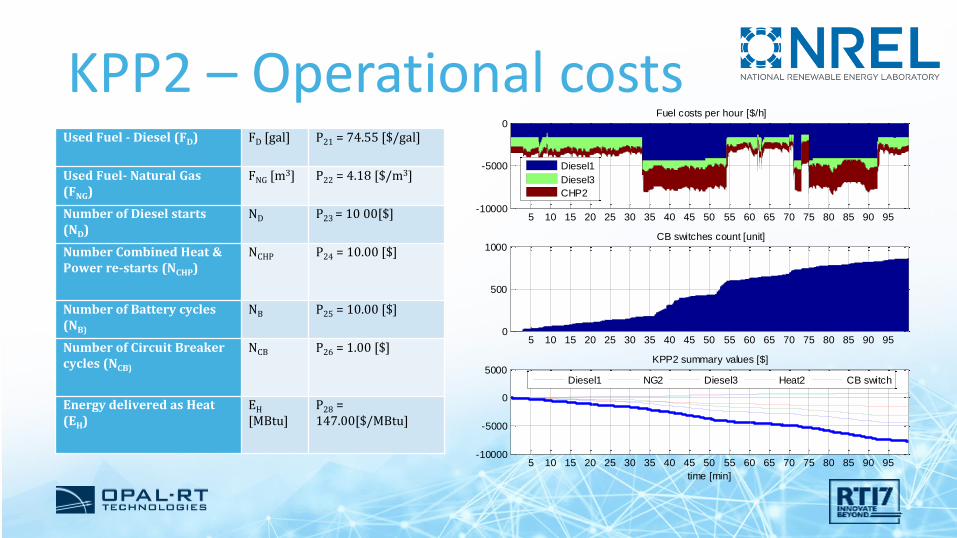
KPP2 – Operational costsUsed Fuel - Diesel (FD) FD [gal] P21 = 74.55 [$/gal]
Used Fuel- Natural Gas (FNG)
FNG [m3] P22 = 4.18 [$/m3]
Number of Diesel starts (ND)
ND P23 = 10 00[$]
Number Combined Heat & Power re-starts (NCHP)
NCHP P24 = 10.00 [$]
Number of Battery cycles (NB)
NB P25 = 10.00 [$]
Number of Circuit Breaker cycles (NCB)
NCB P26 = 1.00 [$]
Energy delivered as Heat (EH)
EH
[MBtu]P28 = 147.00[$/MBtu]
5 10 15 20 25 30 35 40 45 50 55 60 65 70 75 80 85 90 95-10000
-5000
0Fuel costs per hour [$/h]
Diesel1
Diesel3
CHP2
5 10 15 20 25 30 35 40 45 50 55 60 65 70 75 80 85 90 950
500
1000CB switches count [unit]
5 10 15 20 25 30 35 40 45 50 55 60 65 70 75 80 85 90 95-10000
-5000
0
5000KPP2 summary values [$]
time [min]
Diesel1 NG2 Diesel3 Heat2 CB switch
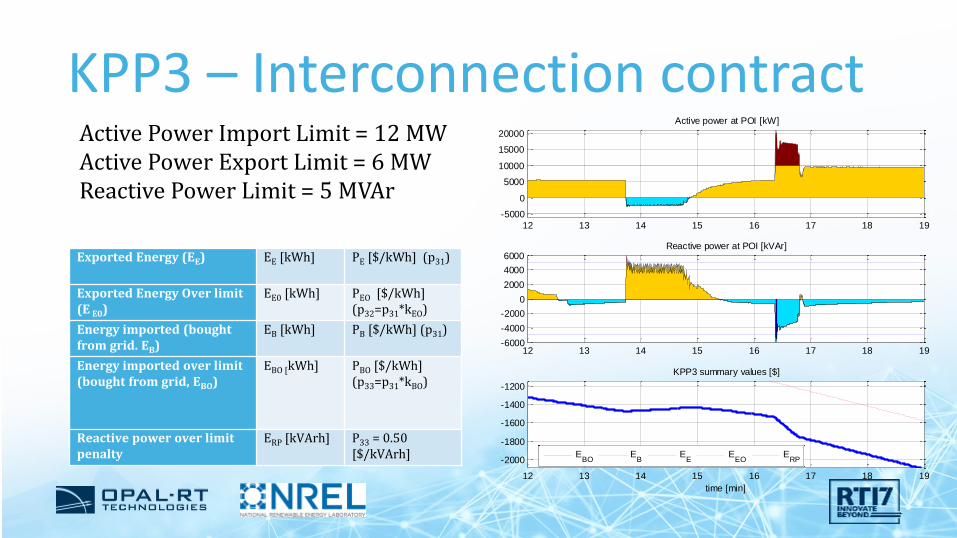
KPP3 – Interconnection contract
Exported Energy (EE) EE [kWh] PE [$/kWh] (p31)
Exported Energy Over limit (E E0)
EE0 [kWh] PEO [$/kWh] (p32=p31*kEO)
Energy imported (bought from grid. EB)
EB [kWh] PB [$/kWh] (p31)
Energy imported over limit (bought from grid, EBO)
EBO [kWh] PBO [$/kWh](p33=p31*kBO)
Reactive power over limit penalty
ERP [kVArh] P33 = 0.50 [$/kVArh]
12 13 14 15 16 17 18 19
-5000
0
5000
10000
15000
20000
Active power at POI [kW]
12 13 14 15 16 17 18 19-6000
-4000
-2000
0
2000
4000
6000Reactive power at POI [kVAr]
12 13 14 15 16 17 18 19
-2000
-1800
-1600
-1400
-1200
KPP3 summary values [$]
time [min]
EBO
EB
EE
EEO
ERP
Active Power Import Limit = 12 MWActive Power Export Limit = 6 MWReactive Power Limit = 5 MVAr
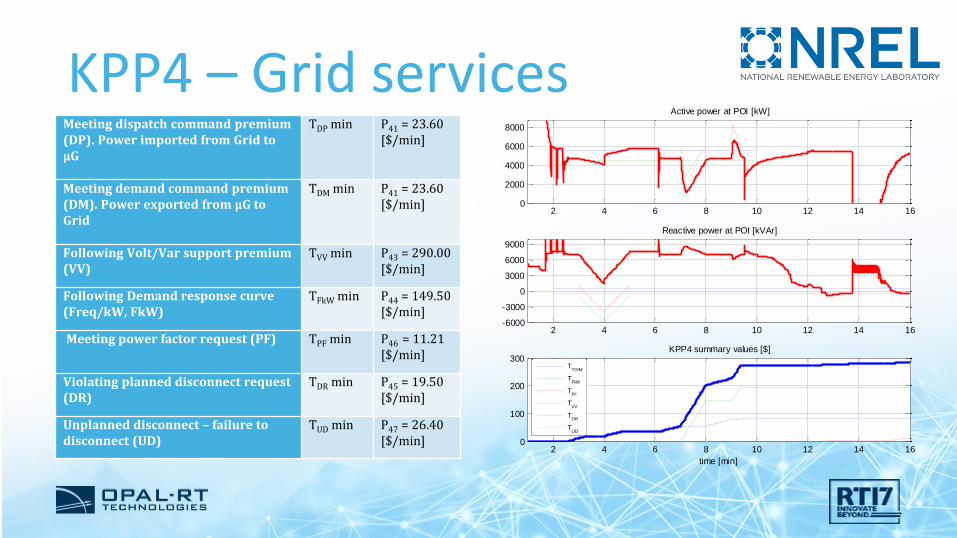
KPP4 – Grid servicesMeeting dispatch command premium (DP). Power imported from Grid to μG
TDP min P41 = 23.60 [$/min]
Meeting demand command premium (DM). Power exported from μG to Grid
TDM min P41 = 23.60 [$/min]
Following Volt/Var support premium (VV)
TVV min P43 = 290.00 [$/min]
Following Demand response curve (Freq/kW, FkW)
TFkW min P44 = 149.50 [$/min]
Meeting power factor request (PF) TPF min P46 = 11.21 [$/min]
Violating planned disconnect request (DR)
TDR min P45 = 19.50 [$/min]
Unplanned disconnect – failure to disconnect (UD)
TUD min P47 = 26.40 [$/min]
2 4 6 8 10 12 14 160
2000
4000
6000
8000
Active power at POI [kW]
2 4 6 8 10 12 14 16-6000
-3000
0
3000
6000
9000
Reactive power at POI [kVAr]
2 4 6 8 10 12 14 160
100
200
300KPP4 summary values [$]
time [min]
T
TD/M
TFkW
TPF
TVV
TDR
TUD
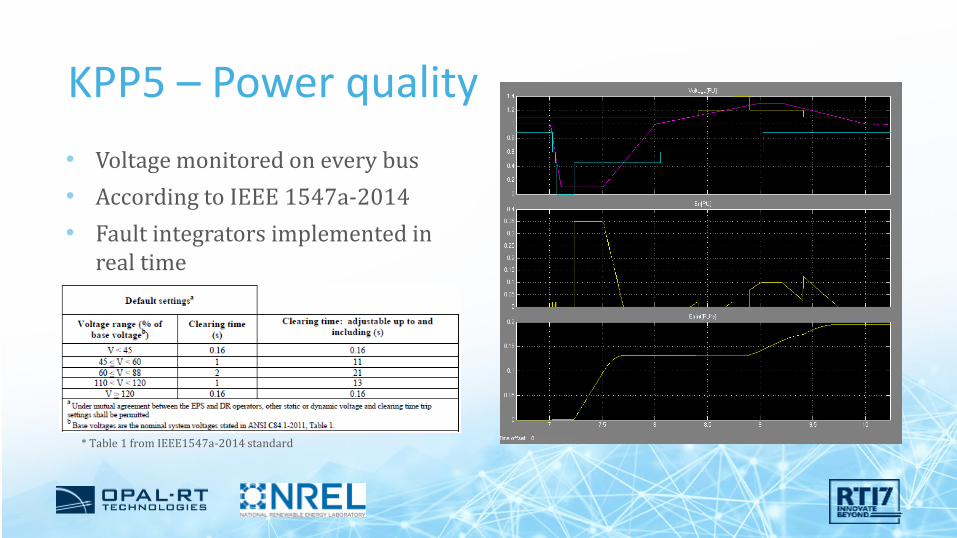
KPP5 – Power quality
• Voltage monitored on every bus
• According to IEEE 1547a-2014
• Fault integrators implemented in real time
* Table 1 from IEEE1547a-2014 standard
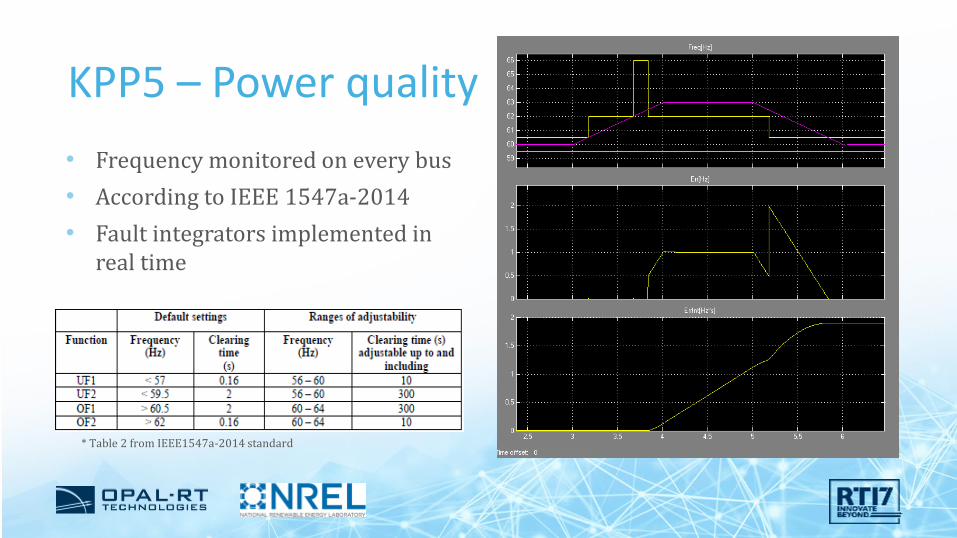
KPP5 – Power quality
• Frequency monitored on every bus
• According to IEEE 1547a-2014
• Fault integrators implemented in real time
* Table 2 from IEEE1547a-2014 standard
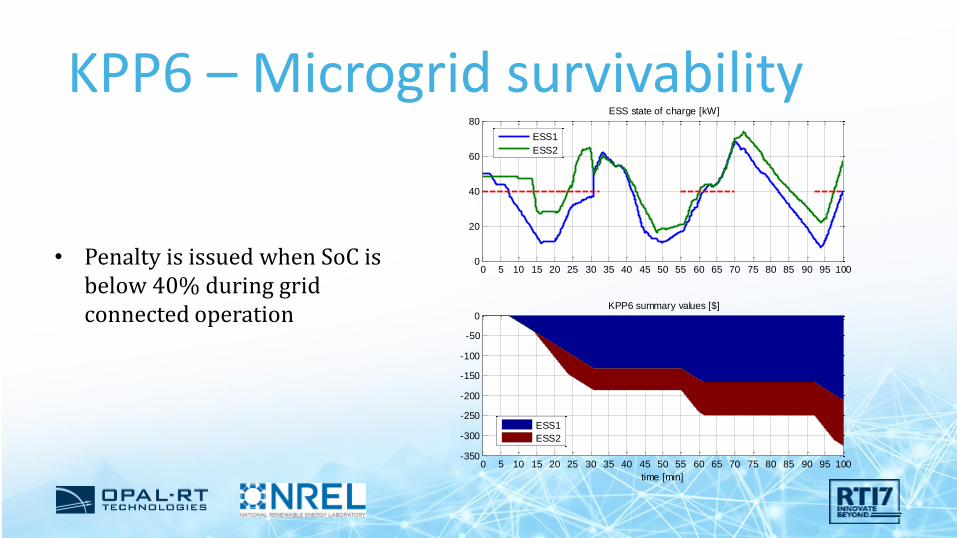
KPP6 – Microgrid survivability
• Penalty is issued when SoC is below 40% during grid connected operation
0 5 10 15 20 25 30 35 40 45 50 55 60 65 70 75 80 85 90 95 1000
20
40
60
80ESS state of charge [kW]
ESS1
ESS2
0 5 10 15 20 25 30 35 40 45 50 55 60 65 70 75 80 85 90 95 100-350
-300
-250
-200
-150
-100
-50
0KPP6 summary values [$]
time [min]
ESS1
ESS2
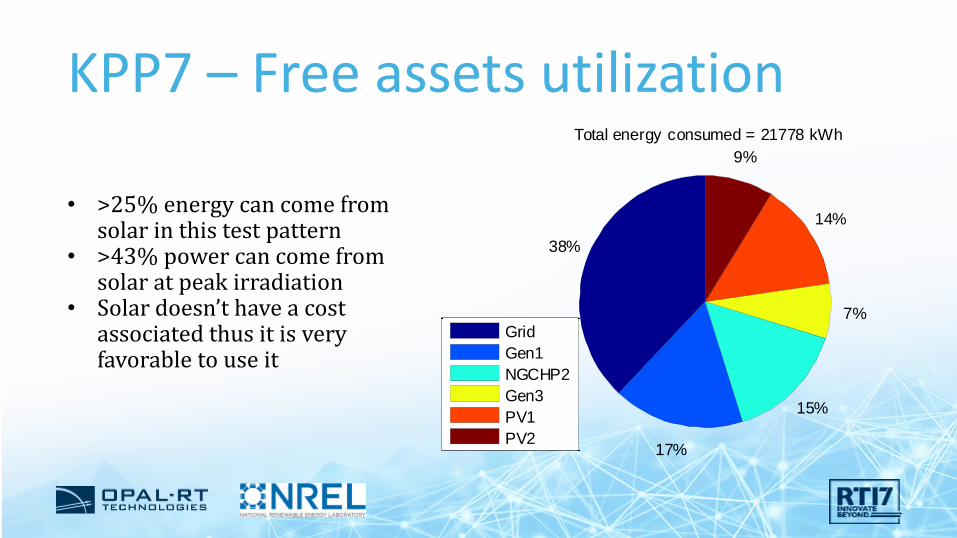
KPP7 – Free assets utilization
38%
17%
15%
7%
14%
9%
Total energy consumed = 21778 kWh
Grid
Gen1
NGCHP2
Gen3
PV1
PV2
2%
17%
34%
47%
Consumption by loads = 19624 kWh
M
I
P
C
• >25% energy can come from solar in this test pattern
• >43% power can come from solar at peak irradiation
• Solar doesn’t have a cost associated thus it is very favorable to use it
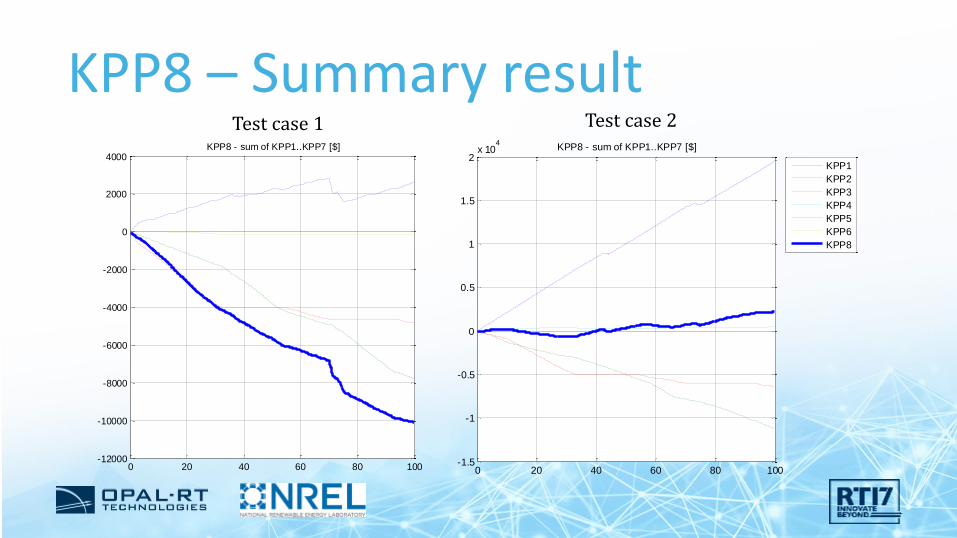
KPP8 – Summary result
0 20 40 60 80 100-12000
-10000
-8000
-6000
-4000
-2000
0
2000
4000KPP8 - sum of KPP1..KPP7 [$]
Test case 1 Test case 2
0 20 40 60 80 100-1.5
-1
-0.5
0
0.5
1
1.5
2x 10
4KPP8 - sum of KPP1..KPP7 [$]
KPP1
KPP2
KPP3
KPP4
KPP5
KPP6
KPP8
Next steps Currently in are at Stage 1 (CHIL) and validating Team #4
We will publish details about competition winner’s strategies and analyze various teams’ approaches
Models will be published after procurement: github.com/mgcp2017/
AcknowledgementsThis work was supported by the U.S. Department of Energy. NREL would like to thank MIT Lincoln Laboratories for their collaboration on this project.
THANK YOU