
Microflora of Soil as Viewed by Freeze-Etching' - Journal of
9
JOURNAL OF BACTERIOLOGY, June 1973, p. 1319-1327 Copyright i 1973 American Society for Microbiology Vol. 114, No. 3 Printed in U.S.A. Microflora of Soil as Viewed by Freeze-Etching' D. L. BALKWILL AND L. E. CASIDA, JR. Department of Microbiology, The Pennsylvania State University, University Park, Pennsylvania 16802 Received for publication 23 February 1973 The indigenous microflora of soil were released from the soil materials and concentrated without the occurrence of growth by use of a blending-simple centrifugation procedure. The cell concentrate was then frozen-etched and viewed by transmission electron microscopy. Criteria were established for detecting microbial cells among the residual soil debris. The freeze-etching of the soil cell concentrate provided results on cell size distributions in agreement with those obtained by thin sectioning. However, the blending-simple centrifugation procedure for cell release and concentration from soil allowed the observation of large cells (> 1.0 ,um in diameter) which apparently are missed by the "exhaus- tive centrifugal washing" cell separation-concentration procedure. The proce- dure of blending-simple centrifugation combined with the viewing of frozen- etched preparations allowed evaluations of the soil microflora for cellular diam- eters, length-width ratios, shapes, and structure. Bae et al. (1) described methods for physi- cally separating and concentrating microbial cells from soil without the occurrence of growth. The cells were then sectioned and evaluated by transmission electron microscopy for size and fine structure. The sectioning required that all gritty soil debris be removed from the organism preparations, and this was accomplished by exhaustive centrifugal cell fractionations and washings. Among other results, this study dem- onstrated the occurrence in soil of many dwarf cells (<0.3 ,m in diameter) as well as cysts and microcysts. Little information resulted, how- ever, concerning the actual shapes of the vari- ous in situ indigenous soil microorganisms. The object of the present study was to deter- mine whether the soil microbial population could be viewed and evaluated by transmission electron microscopy of replicas of frozen-etched cells which had been physically separated from this habitat and, if so, whether simpler proce- dures of cell separation could be used than were required for the thin-section studies. Also of interest were (i) whether the dwarf cells would be detected by this procedure, (ii) whether fractures exposing the interior of a cell to view would aid in the detection of microbial cells and, possibly, provide a clue as to the type of cell that was being viewed, and (iii) whether this approach would allow an overall picture of ' This research was authorized for publication as paper no. 4347 in the joumal series of the Pennsylvania Agricultural Experiment Station on December 4, 1972. the sizes and shapes of the major components of the soil microbial population. MATERIALS AND METHODS Three different samples of local Hagerstown silty clay loam were used in this study. Soils A and B (pH 6.1 and 6.6, and plate counts 1.3 x 10⁵ and 1.0 x 10⁵, respectively, at time of use) were obtained at a depth of approximately 6 cm below the surface vegetation and were stored in bulk for approximately 1 year. No attempt was made to prevent drying. Soil C (pH 6.0; plate count 3.5 x 10⁶ at time of use) consisted of the top 15 cm of soil from directly beneath the surface vegetation, and it was maintained at a moisture level and temperature approximately equal to that at the time of sampling. Soils B and C were screened through a no. 8 sieve and then prefixed by shaking 100 g of soil for 1 h with 100 ml of 2.5% glutaraldehyde in 0.1 M phosphate buffer at pH 7. To release the cells from the soil materials, the above prefixed mixture was combined with 100 ml of 0.2% sodium pyrophosphate and blended in a Waring blender for 1 min (two 30-s bursts separated by a 30-s interval). The resulting suspen- sion was allowed to settle for about 5 min, and then most of the liquid was poured off, leaving the heavier material in the blender. This residual material was further blended with 100 ml of 0.5% sodium pyrophos- phate and, after about 5 min of settling, most of the liquid was again poured off and combined with the supernatant fluid from the first blending. The com- bined fluids were allowed to settle for approximately 15 min so that a division layer was formed. Two-hun- dred milliliters of the upper layer was then withdrawn with a propipette and centrifuged for 15 min at 23,300 x g in a Sorvall RC2-B centrifuge fitted with a GSA 1319 on November 28, 2018 by guest http://jb.asm.org/ Downloaded from
Transcript of Microflora of Soil as Viewed by Freeze-Etching' - Journal of

JOURNAL OF BACTERIOLOGY, June 1973, p. 1319-1327Copyright i 1973 American Society for Microbiology
Vol. 114, No. 3Printed in U.S.A.
Microflora of Soil as Viewed by Freeze-Etching'D. L. BALKWILL AND L. E. CASIDA, JR.
Department of Microbiology, The Pennsylvania State University, University Park, Pennsylvania 16802
Received for publication 23 February 1973
The indigenous microflora of soil were released from the soil materials andconcentrated without the occurrence of growth by use of a blending-simplecentrifugation procedure. The cell concentrate was then frozen-etched andviewed by transmission electron microscopy. Criteria were established fordetecting microbial cells among the residual soil debris. The freeze-etching of thesoil cell concentrate provided results on cell size distributions in agreement withthose obtained by thin sectioning. However, the blending-simple centrifugationprocedure for cell release and concentration from soil allowed the observation oflarge cells (> 1.0 ,um in diameter) which apparently are missed by the "exhaus-tive centrifugal washing" cell separation-concentration procedure. The proce-dure of blending-simple centrifugation combined with the viewing of frozen-etched preparations allowed evaluations of the soil microflora for cellular diam-eters, length-width ratios, shapes, and structure.
Bae et al. (1) described methods for physi-cally separating and concentrating microbialcells from soil without the occurrence of growth.The cells were then sectioned and evaluated bytransmission electron microscopy for size andfine structure. The sectioning required that allgritty soil debris be removed from the organismpreparations, and this was accomplished byexhaustive centrifugal cell fractionations andwashings. Among other results, this study dem-onstrated the occurrence in soil of many dwarfcells (<0.3 ,m in diameter) as well as cysts andmicrocysts. Little information resulted, how-ever, concerning the actual shapes of the vari-ous in situ indigenous soil microorganisms.The object of the present study was to deter-
mine whether the soil microbial populationcould be viewed and evaluated by transmissionelectron microscopy of replicas of frozen-etchedcells which had been physically separated fromthis habitat and, if so, whether simpler proce-dures of cell separation could be used than wererequired for the thin-section studies. Also ofinterest were (i) whether the dwarf cells wouldbe detected by this procedure, (ii) whetherfractures exposing the interior of a cell to viewwould aid in the detection of microbial cellsand, possibly, provide a clue as to the type ofcell that was being viewed, and (iii) whetherthis approach would allow an overall picture of
' This research was authorized for publication as paper no.4347 in the joumal series of the Pennsylvania AgriculturalExperiment Station on December 4, 1972.
the sizes and shapes of the major components ofthe soil microbial population.
MATERIALS AND METHODSThree different samples of local Hagerstown silty
clay loam were used in this study. Soils A and B (pH6.1 and 6.6, and plate counts 1.3 x 10⁵ and 1.0 x 10⁵,respectively, at time of use) were obtained at a depthof approximately 6 cm below the surface vegetationand were stored in bulk for approximately 1 year. Noattempt was made to prevent drying. Soil C (pH 6.0;plate count 3.5 x 10⁶ at time of use) consisted of thetop 15 cm of soil from directly beneath the surfacevegetation, and it was maintained at a moisture leveland temperature approximately equal to that at thetime of sampling.
Soils B and C were screened through a no. 8 sieveand then prefixed by shaking 100 g of soil for 1 h with100 ml of 2.5% glutaraldehyde in 0.1 M phosphatebuffer at pH 7. To release the cells from the soilmaterials, the above prefixed mixture was combinedwith 100 ml of 0.2% sodium pyrophosphate andblended in a Waring blender for 1 min (two 30-s burstsseparated by a 30-s interval). The resulting suspen-sion was allowed to settle for about 5 min, and thenmost of the liquid was poured off, leaving the heaviermaterial in the blender. This residual material wasfurther blended with 100 ml of 0.5% sodium pyrophos-phate and, after about 5 min of settling, most of theliquid was again poured off and combined with thesupernatant fluid from the first blending. The com-bined fluids were allowed to settle for approximately15 min so that a division layer was formed. Two-hun-dred milliliters of the upper layer was then withdrawnwith a propipette and centrifuged for 15 min at 23,300x g in a Sorvall RC2-B centrifuge fitted with a GSA
1319
on Novem
ber 28, 2018 by guesthttp://jb.asm
.org/D
ownloaded from

BALKWILL AND CASIDA
rotor. The resulting clear, straw-colored, supernatantfluid was discarded, leaving a pellet with a slimy,dark-brown to black uppermost layer which was 0.5 to1 mm in thickness. This layer was removed with arubber policeman and subjected to freeze-etching,while the remainder of the pellet (light brown in color)was discarded. The above procedure was also per-formed on non-prefixed soils B and C, by using eitherdistilled water or 0.1% sodium pyrophosphate as thesoil suspension fluid, and on non-prefixed soil A inconjunction with the pyrophosphate.A suspension of cells which had been physically
separated and concentrated from soil A by exhaustivecentrifugal washing followed by a Ludox gradient (1)was kindly supplied by H. C. Bae. These cells hadbeen prefixed in the soil with OSO4.The cell concentrates from soil were diluted with
distilled water to a thick liquid consistency, placed on3-mm gold specimen disks, frozen in Freon 22, andtransferred to liquid nitrogen. They were then frac-tured, etched for 1 min, and replicated in a BalzersBA360M freeze-etching device at -100 C by theprocedure of Moor and Muhlethaler (10). The plati-num-carbon replicas were cleaned in 25% HF for 1 h,rinsed with distilled water, treated in Clorox (CloroxCo., Oakland, Calif., 5.25% NaClO) for 30 min, and,finally, rinsed several times with distilled water. Thecleaned replicas were then picked up on uncoated400-mesh copper grids and viewed with a Philips EM300 electron microscope operating at 60 kV.
Replicas which contained sufficient numbers ofcells (two to four per field at a magnification of 25,500or 32,000, as with soil C) were photographed atrelatively low magnifications (12,000-16,000), and2.7-fold enlargements of the negatives were examinedfor cells. Many areas of these replicas were photo-graphed so as to provide a representative sampling ofthe cells present. If the replicas contained only lownumbers of cells (one per four to five fields at amagnification of 25,500 or 32,000, as with soil B), thereplicas were scanned, and all cell-like objects invarious areas of the replica were photographed atthese magnifications. These cells were then examinedon 2.7-fold enlargements of the negatives.
Cells in the photographs were measured and, ex-cept where length determinations were made, theirsizes were expressed as the small diameter of the cell.Cell shapes were assigned according to length-widthratios; coccoid and oval-shaped cells had a ratio < 1.5,and ratios for coccoid-rods and rod-shaped cells were1.5 to 2.0 and > 2.0, respectively. The cells were alsogrouped as to morphological types as determined bytheir surface characteristics and internal featuresexposed by fracturing.
RESULTSObjects were considered to be cells if they
displayed (i) a fracture down to a typicalmembrane surface (as in Fig. 1), (ii) a cross-fracture showing a defined cell wall or typicalcytoplasm, or both (as in Fig. 2), or (iii) asurface structure of apparent biological origin
(as in Fig. 9). Of the 3,400 celllike objectsphotographed, 98% met one or more of thesecriteria, usually the first. The remainder mayhave been cells, but they lacked sufficientfeatures to identify them as such (Fig. 1).The cells usually could be recognized among
the pieces of soil debris on a well-preparedreplica (Fig. 1), although it was necessary tosearch carefully if large amounts of debris werepresent. The amount of debris could be par-tially controlled by the final dilution of thesoil-cell concentrate just prior to freeze-etching,but it was primarily a factor of the particularsoil being examined. Soil debris also presented aproblem in the cleaning of the replicas; conven-tional reagents seemed to be unable to removeit, thereby requiring the use of 25% HF.The percent distributions of cell sizes for the
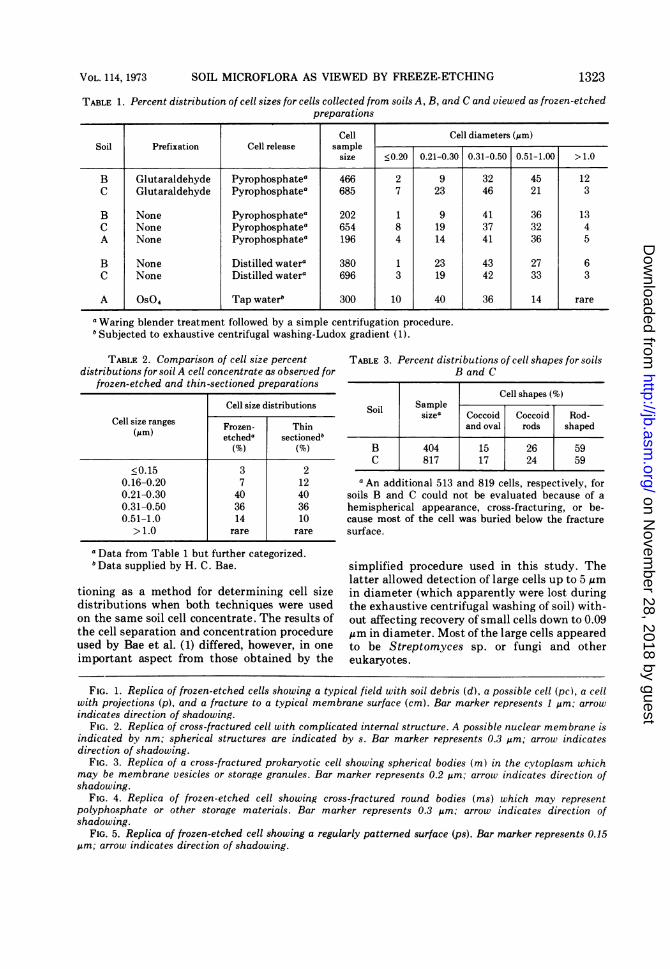
three soils are presented in Table 1. A few cellswere buried too deeply below the surface of thefracture to accurately measure their diameters(Fig. 13, 14) (as indicated by the curvature ofthe exposed portions of the cells), and thesewere not included in the data. There do notappear to be any marked differences in cell sizedistributions for the cells collected from thethree soils by means of the blending-simplecentrifugation procedure and viewed as frozen-etched preparations, and no one prefixation cellrelease procedure used on these soils appearsbetter than the others. The percentage of dwarfcells (<0.30 pm in diameter) in these soilsranged from 10 to 30%, and the percentage ofcells >0.50 pm in diameter ranged from 24 to-57%. In contrast, 50% of the cells for soil A werein the dwarf cell range and 14% were in the>0.50-pm range for cells collected by the ex-haustive centrifugal washing-Ludox procedureand viewed as frozen-etched preparations. How-ever, the cell size distributions as determined byfreeze-etching were in agreement with thoseresulting from the examination of cell thinsections when both procedures were applied tothe same cell concentrate from soil. Thus, thesoil A cell concentrate of Table 1 as obtained bythe exhaustive centrifugal washing-Ludox pro-cedure was examined by both methods, and thecell size percent distributions are presented inTable 2.The percent distributions of microbial cell
shapes for soils B and C are presented in Table3. Because the prefixation cell release proce-dures used did not give significant differences,the data represent the sum results for each soil.Approximately 50% of the cells displayedenough surface area to allow determinations oftheir shapes. The remainder (i) were largely
1320 J. BACTERIOL.
on Novem
ber 28, 2018 by guesthttp://jb.asm
.org/D
ownloaded from

SOIL MICROFLORA AS VIEWED BY FREEZE-ETCHING
buried below the fracture surface, (ii) werecross-fractured in a manner that left little or nosurface area visible, or (iii) appeared as ahemisphere. The true shapes of the hemispheri-cal cells could not be determined, since it wasimpossible to ascertain whether they repre-sented half of a coccoid cell or the end of arod-shaped cell.The ability to determine cell shapes some-
times allowed an expression of both large andsmall diameters of the soil cells. These determi-nations could be made for 233 (41%) of thedwarf cells photographed. Their average lengthwas 0.65 um, and 81% were within the range of0.31 to 0.90 gm. The total range was 0.2 to 1.5,um. For the mid-range cells (small diameter0.31 to 0.50 gm), 419 cells (36%) could bemeasured, and they averaged 0.88,um in length.Eighty-nine percent were in the range of 0.41 to1.2 ,m; the total range was 0.41 to 2.0 ,um.Usually, the lengths for cells with a shortdiameter of >0.50 ,gm could not be determinedbecause of cross-fracturing of partial burialbeneath the fracture plane. Of the 1,221 cellsconsidered in Table 3, 9% presented the approx-imate dimensions of 0.5 by 1.0 um; Russell (13)stated that these dimensions defined a soilcoccoid-rod cell.The various combinations of prefixation and
soil suspension fluids gave almost identicalresults for percent distributions of cell morpho-logical types. Therefore, Table 4 presents onlythose results for soils prefixed with glutaralde-hyde and then suspended in pyrophosphate.Many of the cells observed were prokaryoticforms having no unique morphological features.Some displayed (i) spherical bodies, which mayrepresent membrane vesicles (17) or storagegranules (7, 12, 14) (Fig. 3), (ii) cross-fracturedround bodies, which may represent polyphos-phate (7, 14) or other storage materials (12)(Fig. 4), (iii) patterned (as reported for Nitroso-cystis oceanus; reference 16) (Fig. 5) andstriated (Fig. 6) surfaces, (iv) convoluted cellwalls (possibly bacterial spores; reference 8)(Fig. 7), or (v) granules of poly- 3-hydroxy-butyric acid (12, 14) (Fig. 8).
Cells with somewhat complicated internalorganization (Fig. 2) ranged from around 0.5 to5 ,um in diameter, invariably comprising thelargest cells (larger than 1 gm) in any of the soilsand most of the cells in the 0.7 to 1.0 gm range.These cells may be eukaryotic, as some of themcontain structures that could represent a nu-clear membrane (Fig. 3). Most contain uniden-tified spherical structures (Fig. 3) similar tothose seen in fungal hypae (3), cross-fractured
Streptomyces hyphae (18), or blue-green algae(7).
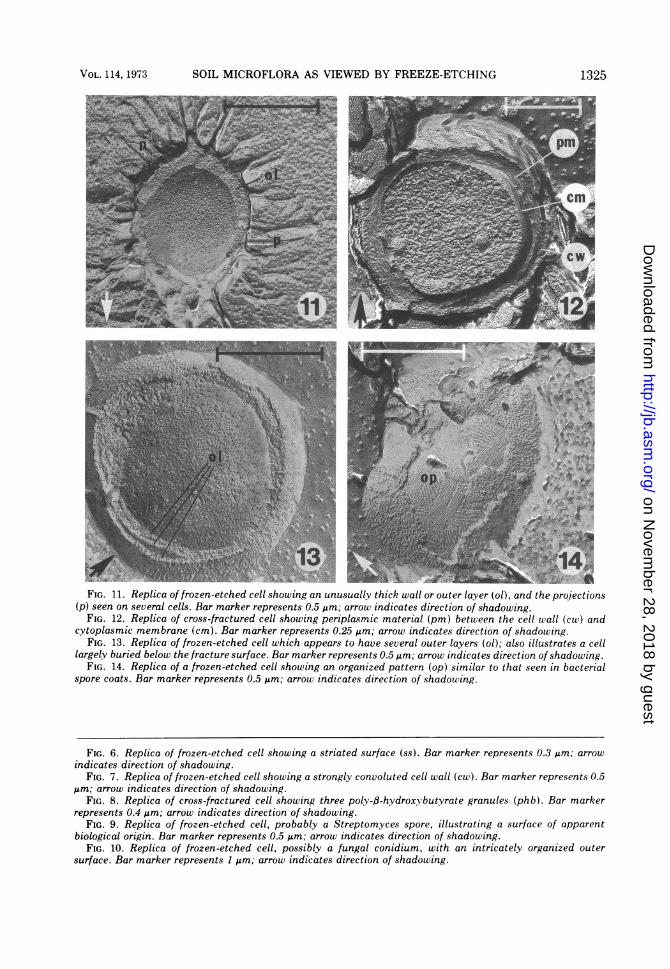
Several morphological types occurred only insmall numbers. Among these were objects withsurfaces similar to fungal conidia (5, 6) (Fig. 10),basidiospores (4), and Streptomyces spores(Fig. 9), as reported by several workers (19, 20).Some cells displayed what appeared to be athick wall (Fig. 11), or material between thewall and plasma membrane (Fig. 12), whereasothers appeared to have several outer layers(Fig. 13) (although these possibly could repre-sent multiple fracturing of gram-negative cellwalls; references 11, 14, 15). A few objectsappeared to be bacterial spores (Fig. 14), havingsurfaces or features similar to those reported forlaboratory-produced spores (8), but no objectswere observed that could be positively identi-fied as cysts based on comparisons with pub-lished photographs of laboratory-produced cysts(2, 9).About 4% of all of the morphological types
observed displayed some sort of projections(Fig. 1, 11). This was not affected by eitherdeletion of prefixation with glutaraldehyde orfailure to use pyrophosphate for the cell-releaseprocedure.
DISCUSSIONThis study showed that the indigenous mi-
croorganisms of soil can be separated and con-centrated relatively easily from their habitatwithout the occurrence of growth, and that theycan be viewed as shadowed replicas of frozen-etched preparations. In most instances, themicrobial cells were easily detected, because oftheir tendency to fracture to an identifiableinternal structure, such as the plasma mem-brane. Only the numerically dominant microor-ganisms were seen in this study, however, as itwould have been necessary to examine muchlarger numbers of cells to detect forms presentin comparatively low numbers.The procedure for cell separation and concen-
tration from soil used in this study is considera-bly simpler and less time consuming than theexhaustive centrifugal washing procedure usedby Bae et al. (1) for their studies of sectionedindigenous soil microorganisms. This is becausefreeze-etching does not require removal of allgritty material. The freeze-etching procedurealso circumvents a potential problem of cellsectioning in that, since there is only onefracture plane, there is no danger of inadvert-ently observing the same cell twice as mightoccur with consecutive sections.
Freeze-etching compared favorably with sec-
1321VOL. 114, 1973
on Novem
ber 28, 2018 by guesthttp://jb.asm
.org/D
ownloaded from
SOIL MICROFLORA AS VIEWED BY FREEZE-ETCHING
TABLE 1. Percent distribution of cell sizes for cells collected from soils A, B, and C and viewed as frozen-etchedpreparations
Cell Cell diameters (Am)Soil Prefixation Cell release sample
size <0.20 0.21-0.30 0.31-0.50 0.51-1.00 > 1.0
B Glutaraldehyde Pyrophosphatea 466 2 9 32 45 12C Glutaraldehyde Pyrophosphatea 685 7 23 46 21 3
B None Pyrophosphatea 202 1 9 41 36 13C None Pyrophosphatea 654 8 19 37 32 4A None Pyrophosphatea 196 4 14 41 36 5
B None Distilled watera 380 1 23 43 27 6C None Distilled watera 696 3 19 42 33 3
A Os04 Tap waterb 300 10 40 36 14 rare
a Waring blender treatment followed by a simple centrifugation procedure.b Subjected to exhaustive centrifugal washing-Ludox gradient (1).
TABLE 2. Comparison of cell size percent TABLE 3. Percent distributions of cell shapes for soilsdistributions for soil A cell concentrate as observed for B and C
frozen-etched and thin-sectioned preparationsCell shapes (%)
Cell size distributions Sol SamplenSoil sizea Coccoid Coccoid Rod-Cell size ranges Frozen- Thin and oval rods shaped
(Mm) etcheda sectionedb(%) (%) B 404 15 26 59
C 817 17 24 59<0.15 3 2
0.16-0.20 7 12 a An additional 513 and 819 cells, respectively, for0.21-0.30 40 40 soils B and C could not be evaluated because of a0.31-0.50 36 36 hemispherical appearance, cross-fracturing, or be-0.51-1.0 14 10 cause most of the cell was buried below the fracture> 1.0 rare rare surface.
a Data from Table 1 but further categorized.bData supplied by H. C. Bae. simplified procedure used in this study. The
latter allowed detection of large cells up to 5 Amtioning as a method for determining cell size in diameter (which apparently were lost duringdistributions when both techniques were used the exhaustive centrifugal washing of soil) with-on the same soil cell concentrate. The results of out affecting recovery of small cells down to 0.09the cell separation and concentration procedure gm in diameter. Most of the large cells appearedused by Bae et al. (1) differed, however, in one to be Streptomyces sp. or fungi and otherimportant aspect from those obtained by the eukaryotes.
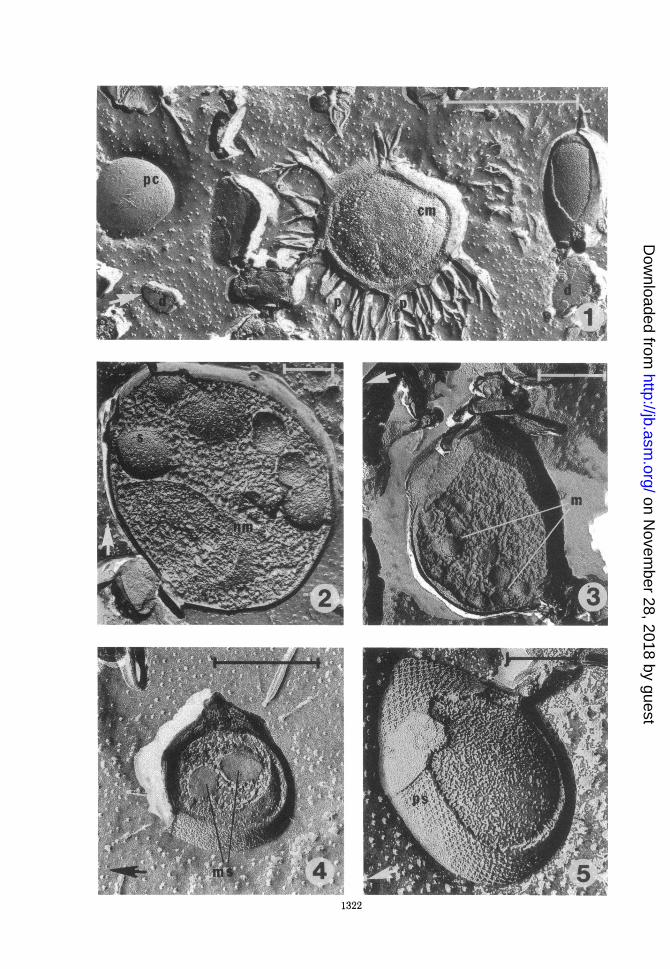
FIG. 1. Replica of frozen-etched cells showing a typical field with soil debris (d), a possible cell (pc), a cellwith projections (p), and a fracture to a typical membrane surface (cm). Bar marker represents 1 ,m; arrowindicates direction of shadowing.
FIG. 2. Replica of cross-fractured cell with complicated internal structure. A possible nuclear membrane isindicated by nm; spherical structures are indicated by s. Bar marker represents 0.3 Mm; arrow indicatesdirection of shadowing.
FIG. 3. Replica of a cross-fractured prokaryotic cell showing spherical bodies (m) in the cytoplasm whichmay be membrane vesicles or storage granules. Bar marker represents 0.2 Mm; arrow indicates direction ofshadowing.
FIG. 4. Replica of frozen-etched cell showing cross-fractured round bodies (ms) which may representpolyphosphate or other storage materials. Bar marker represents 0.3 Mum; arrow indicates direction ofshadowing.
FIG. 5. Replica of frozen-etched cell showing a regularly patterned surface (ps). Bar marker represents 0.15Mm; arrow indicates direction of shadowing.
VOL. 114, 1973 1323
on Novem
ber 28, 2018 by guesthttp://jb.asm
.org/D
ownloaded from

1324
7,k".. Awwl-.Fv
on Novem
ber 28, 2018 by guesthttp://jb.asm
.org/D
ownloaded from
SOIL MICROFLORA AS VIEWED BY FREEZE-ETCHING
FIG. 11. Replica of frozen-etched cell showing an unusually thick wall or outer layer (ol), and the projections(p) seen on seueral cells. Bar marker represents 0.5 ,m; arrow indicates direction of shadowing.
FIG. 12. Replica of cross-fractured cell showing periplasmic material (pm) between the cell wall (cw) andcytoplasmic membrane (cm). Bar marker represents 0.25 ,m; arrow indicates direction of shadowing.
FIG. 13. Replica of frozen-etched cell which appears to have several outer layers (ol); also illustrates a celllargely buried below the fracture surface. Bar marker represents 0.5 Jm; arrow indicates direction of shadowing.
FIG. 14. Replica of a frozen-etched cell showing an organized pattern (op) similar to that seen in bacterialspore coats. Bar marker represents 0.5 Mm; arrow indicates direction of shadowing.
FIG. 6. Replica of frozen-etched cell showing a striated surface (ss). Bar marker represents 0.3 Mm; arrowindicates direction of shadowing.
FIG. 7. Replica of frozen-etched cell showing a strongly convoluted cell wall (cw). Bar marker represents 0.5Mm; arrow indicates direction of shadowing.
FIG. 8. Replica of cross-fractured cell showing three poly-fl-hydroxybutyrate granules (phb). Bar markerrepresents 0.4 Mm; arrow indicates direction of shadowing.
FIG. 9. Replica of frozen-etched cell, probably a Streptomyces spore, illustrating a surface of apparentbiological origin. Bar marker represents 0.5 Mm; arrow indicates direction of shadowing.
FIG. 10. Replica of frozen-etched cell, possibly a fungal conidium, with an intricately organized outersurface. Bar marker represents 1 Mm; arrow indicates direction of shadowing.
VOL. 114, 1973 1325
on Novem
ber 28, 2018 by guesthttp://jb.asm
.org/D
ownloaded from

BALKWILL AND CASIDA
TABLE 4. Percent distributions of cell morphologicaltypes for soils B and C
Distribution ofcell typesa
Cell appearanceSoil Bb Soil CU(%) (%)
ProkaryoticNo unique features 65 81Membrane vesicles or storage 7 5
granulesConvoluted walls 1 6Patterned and striated surfaces 1 1Spores 1 2
Eukaryotic and cells with com-plicated internal organization
Cells 19 2Conidia, basidiospores 2 0
UndeterminedMultiple outer layers or fractures 1 1Thick walls 2 2Periplasmic material 1 1
a Soil samples were prefixed with glutaraldehydeand then suspended in pyrophosphate.
b Sample sizes were soil B, 466 cells and soil C, 622cells.
The freeze-etching technique utilized onlythe uppermost layer of the pellet obtained in thesoil blending-simple centrifugation procedure.The lower layers contained many fewer cells,and those that were present were mainly > 0.5jum in diameter.
Cell sectioning provides information on thediameters and fine structures of cells but yieldsonly sketchy information about cell shapes. Incontrast, freeze-etching provides more informa-tion on cell shapes and surface features but isless definitive as to cell fine structure. Thefreeze-etching information on cell shapes isbiased, however, in favor of rod-shaped cellsbecause of the problem of determining whethera hemisphere above the fracture plane is half ofa coccoid cell, or whether it represents theless-likely possibility of being the end of a rod. Itis probable, then, that a large proportion of thecells whose shapes could not be determined(about half of all cells examined) had a coccoidor coccoid-rod shape. This would mean that thepercent occurrence for these cells in Table 3might be considerably greater and that the aver-age lengths for dwarf and mid-range sized cellsmight be shorter than stated.
Freeze-etching appeared to be unable to de-tect the large numbers of cystlike cells in the
soil habitat as reported in the cell sectioningstudy of Bae et al. (1). This did not seem to be aresult of the differences in the soil workupprocedures used in the two studies, becausefreeze-etching did not detect with certainty anycysts in the soil A preparation (Tables 1 and 2)which had been prepared by exhaustive centrif-ugal washing. More likely, the apparent lack ofcysts with freeze-etching is due to the fracturesnot penetrating deeply enough into the cell toallow observation and identification of the lay-ers within the cyst (9). The fractures of non-encysted cells often penetrated to and wereexposed at the level of the plasma membrane.Obviously, this also could mean that freeze-etching might not be able to show that variousother soil organisms had unique internal struc-tures.
Pyrophosphate, which is generally consideredto be a soil-dispersing agent, was used to bringabout the release of the greatest possible num-ber of cells from the soil particles. The results,however, did not indicate any appreciable in-crease in cell release. In addition, pyrophos-phate had little effect on the cell size percentdistribution patterns obtained. Omission of theprefixation with glutaraldehyde had no signifi-cant effect upon the results, and its use may notbe necessary except as a precaution againstpossible damage to or loss of cells sensitive tothe cell release and concentration procedures.As to the unusual cells found in low numbers
in the soil cell concentrates, those with thickwalls might be cysts, spores, or other restingforms, as might those with material between thewall and cytoplasmic membrane. The lattercould also correspond to the cells with a distinctperiplasmic space, as reported by Bae et al. (1).Finally, the identity of the projections aroundsome of the cells remains uncertain and, al-though these may represent the remains of acapsular or slime layer, they could also be anartifact of the freeze-etching process.
ACKNOWLEDGMENTSThis work was supported by contract NGR 39-009-180 with
the National Aeronautics and Space Administration.
LITERATURE CITED
1. Bae, H. C., E. H. Cota-Robles, and L. E. Casida, Jr. 1972.Microflora of soil as viewed by transmission electronmicroscopy. Appl. Microbiol. 23:637-648.
2. Cagle, G. D., G. R. Vela, and R. M. Pfister. 1972.Freeze-etching of Azotobacter vinelandii: examinationof wall, exine, and vesicles. J. Bacteriol. 109:1191-1197.
3. Hess, W. M. 1968. Ultrastructural comparisons of fungushyphal cells using frozen-etched replicas and thinsections of the fungus Pyrenochaeta terrestris. Can. J.Microbiol. 14:205-210.
1326 J. BACTERIOL.
on Novem
ber 28, 2018 by guesthttp://jb.asm
.org/D
ownloaded from

SOIL MICROFLORA AS VIEWED BY FREEZE-ETCHING
4. Hess, W. M., J. L. Bushnell, and D. J. Weber. 1972.Surface structures and unidentified organelles of Ly-coperdon perlatum Pers. basidiospores. Can. J. Micro-biol. 18:270-271.
5. Hess, W. M., M. M. A. Sassen, and C. C. Remsen. 1968.Surface characteristics of penicillium conidia. Myco-logia 60:290-303.
6. Hess, W. M., and D. L. Stocks. 1969. Surface characteris-tics of aspergillus conidia. Mycologia 61:560-571.
7. Holt, S. C., and M. R. Edwards. 1972. Fine structure ofthe thermophilic blue-green alga Synechococcuslividus Copeland. A study of frozen-fractured-etchedcells. Can. J. Microbiol. 18:175-181.
8. Holt, S. C., and E. R. Leadbetter. 1969. Comparativeultrastructure of selected aerobic spore-forming bac-teria: a freeze-etching study. Bacteriol. Rev.33:346-378.
9. Koo, V. M., L. P. Lin, and H. L. Sadoff. 1969. Surfacestructure of Azotobacter vinelandii cysts as revealed byfreeze-cleaving. J. Bacteriol. 100:1105-1107.
10. Moor, H., and K. Miihlethaler. 1963. Fine structure infrozen-etched yeast cells. J. Cell Biol. 17:609-628.
11. Remsen, C. C., and D. G. Lundgren. 1966. Electronmicroscopy of the cell envelope of Ferrobacillusferrooxidans prepared by freeze-etching and chemicalfixation techniques. J. Bacteriol. 92:1765-1771.
12. Remsen, C. C., and S. W. Watson. 1972. Freeze-etching ofbacteria. Int. Rev. Cytol. 33:253-296.
13. Russell, E. J. 1950. Soil conditions and plant growth, 8thed. Longmans, Green and Co., London.
14. Van Gool, A. P., R. Lambert, and H. Laudelout. 1969.The fine structure of frozen etched nitrobacter cells.Arch. Mikrobiol. 69:281-293.
15. Van Gool, A. P., and N. Nanninga. 1971. Fracture faces inthe cell envelope of Escherichia coli. J. Bacteriol.108:474-481.
16. Watson, S. C., and C. C. Remsen. 1970. Cell envelope ofNitrosocystis oceanus. J. Ultrastruct. Res. 33:148-160.
17. Weigand, R. A., S. C. Holt, J. M. Shively, G. L. Decker,and J. W. Greenawalt. 1973. Ultrastructural propertiesof the extra membranes of Escherichia coli 011Oa as
revealed by freeze-fracturing and negative-stainingtechniques. J. Bacteriol. 113:433-444.
18. Wildermuth, H. 1971. The fine structure of mesosomes
and plasma membrane in Streptomyces coelicolor. J.Gen. Microbiol. 68:53-63.
19. Wildermuth, H., E. Wehrli, and R. W. Home. 1971. Thesurface structure of spores and aerial mycelium inStreptomyces coelicolor. J. Ultrastruct. Res.35:168-180.
20. Williams, S. T., R. M. Bradshaw, J. W. Costerton, and A.Forge. 1972. Fine structure of the spore sheath of someStreptomyces species. J. Gen. Microbiol. 72:249-258.
VOL. 114, 1973 1327
on Novem
ber 28, 2018 by guesthttp://jb.asm
.org/D
ownloaded from