Microeconomics: An Integrated Approach David Besanko and Ronald Braeutigam Chapter 10: Competitive...
41
Microeconomics: An Integrated Approach David Besanko and Ronald Braeutigam Chapter 10: Competitive Markets: Applications Prepared by Katharine Rockett © 2002 John Wiley & Sons, Inc.
-
Upload
alexandro-cullum -
Category
Documents
-
view
259 -
download
2
Transcript of Microeconomics: An Integrated Approach David Besanko and Ronald Braeutigam Chapter 10: Competitive...

Microeconomics: An Integrated Approach
David Besanko and Ronald Braeutigam
Chapter 10: Competitive Markets: Applications
Prepared by Katharine Rockett
© 2002 John Wiley & Sons, Inc.

1. Motivation: Agricultural Price Supports2. Deadweight Loss: "A Perfectly Competitive Market Without Intervention Maximizes Total Surplus"3. Government Intervention: Who wins and who loses?4. Examples of Various Government Policies
Excise TaxesPrice CeilingsProduction QuotasImport Tariffs
5. Conclusions

At the Perfectly Competitive Equilibrium, (Q*,P*), Total Surplus is maximized.
Consumer's Surplus at (Q*,P*): ABCProducer's Surplus at (Q*,P*) : DBCTotal Surplus at (Q*,P*): ADC

Example: Surplus Maximization in Competitive Equilibrium
Demand
Supply
Q
P
Q*
P*
A
B C
D
Q1
Pd
Ps

Example: Surplus Maximization in Competitive Equilibrium
Demand
Supply
Q
P
Q*
P*
A
B C
D
Ps
Pd
Q2
Definition: A deadweight loss is a reduction in net economic benefits resulting from an inefficient allocation of resources.
(Shaded area in diagrams)
Definition: Economic Efficiency means that the total surplus is maximized.
The perfectly competitive equilibrium attains economic efficiency.
"Every consumer who is willing to pay more than the opportunity cost of the resources needed to produce extra output is able to buy; every consumer who is not willing to pay the opportunity cost of the extra output does not buy."
"All gains from trade (between buyers and suppliers) are exhausted at the efficient point."

Government Intervention: Who Wins and Who Loses? Effect on Effect on Effect on Effect on
(domestic) (domestic) (domestic) (domestic) Is a (domestic) Intervention Quantity Consumer Producer Government Deadweight Type: Traded Surplus Surplus Budget Loss created?
Excise Tax Falls Falls Falls Positive Yes
Subsidies toProducers
Rises Rises Rises Negative Yes
MaximumPriceCeilings forProducers
Falls;ExcessDemand
Rise orFall
Falls Zero Yes
MinimumPriceFloors forProducers
Falls;ExcessSupply
Falls Rise orFall
Zero Yes
ProductionQuotas
Falls;ExcessSupply
Falls Rise orFall
Zero Yes
ImportTariffs
Falls Falls Rises Positive Yes
ImportQuotas
Falls Falls Rises Zero Yes

Definition: An excise tax (or a specific tax) is an amount paid by either the consumer or the producer per unit of the good at the point of sale.
(The amount paid by the demanders exceeds the total amount received by the sellers by amount T)

Example: Excise Tax
T
S’
S
Q
P
Q1 Q*
Pd
Ps
Demand
P*

Definition: The amount by which the price paid by buyers, PD, rises over the non-tax equilibrium price, P*, is the incidence of the tax on consumers; the amount by which the price received by sellers, PS, falls below P* is called the incidence of the tax on producers.

Example: Incidence of a Tax in Two Cases
D
D
Q
Q
P
P
S
S’T
S
T
Ps = P*
Pd=P*+T
Pd = P*
Ps = P*-T

"Back of the envelope" method to calculate the incidence of a specific tax
Pd/Ps = /
where: is the own-price elasticity of supply is the own-price elasticity of demand
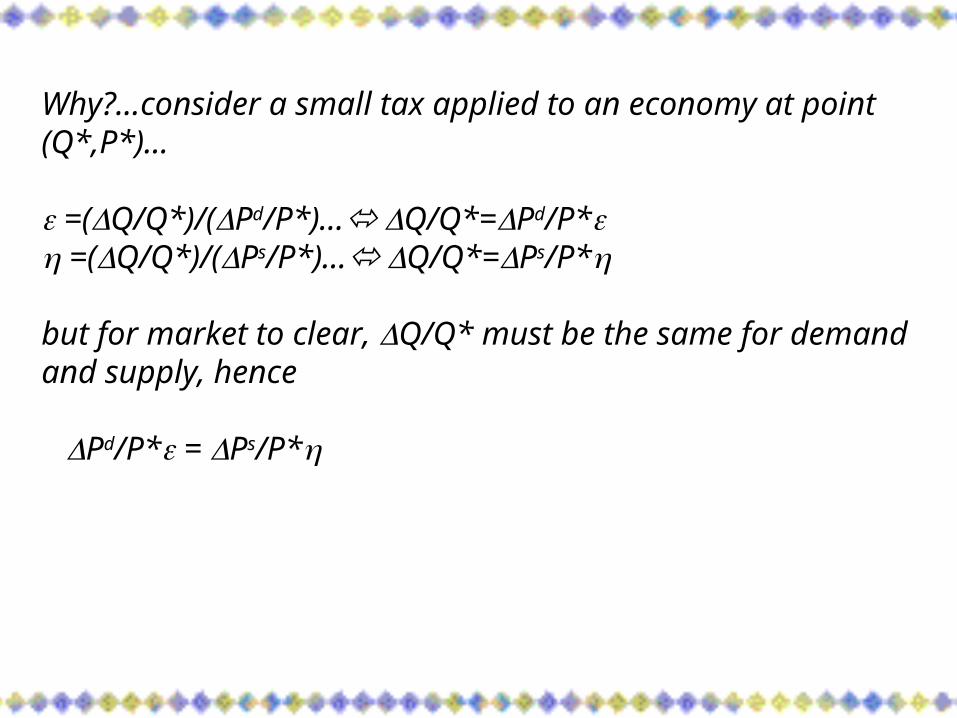
Why?…consider a small tax applied to an economy at point (Q*,P*)…
=(Q/Q*)/(Pd/P*)… Q/Q*=Pd/P* =(Q/Q*)/(Ps/P*)… Q/Q*=Ps/P*
but for market to clear, Q/Q* must be the same for demand and supply, hence
Pd/P* = Ps/P*

Example: Let = -.5 and = 2. What is the relative incidence of a specific tax on consumers and producers?
Pd/Ps = 2/-.5 = -4
interpretation: "consumers pay four times as much as the decrease in price producers receive. Hence, an excise tax of $1 results in an increase in consumer price of $.8 and a decrease in price received by producers of $.2"
Note: Subsidies are negative taxes…

Example: Subsidies
S’
DQ
P
Q* Q2
Ps
Pd

Example: Subsidies
SS’
DQ
P
Q* Q2
Ps
Pd
T

Example: Subsidies
SS’
DQ
P
Q* Q2
Ps
Pd
T

Definition: A price ceiling is a legal maximum on the price per unit that a producer can receive. If the price ceiling is below the pre-control competitive equilibrium price, then the ceiling is called binding.
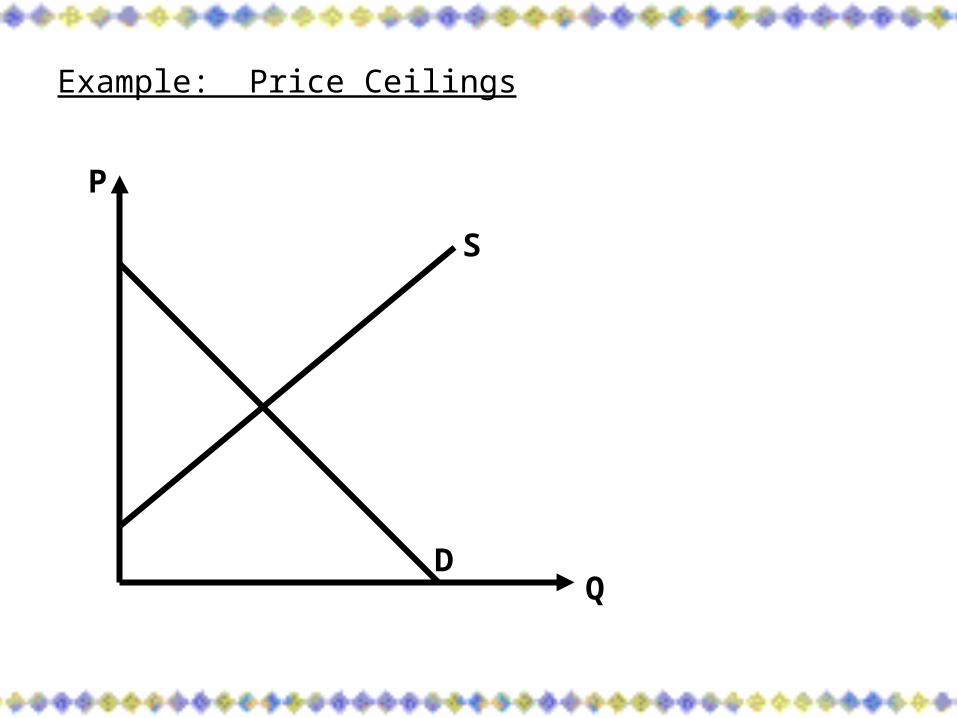
Example: Price Ceilings
S
DQ
P

Example: Price Ceilings
S
DQ
P
PMAX

Example: Price Ceilings
S
DQ
P
Q* QdQs
PMAX
Excess Demand

Definition: A price floor is a minimum price that consumers can legally pay for a good. Price floors sometimes are referred to as price supports. If the price floor is above the pre-control competitive equilibrium price, it is said to be binding.

Example: Price Floor
S
DQ
P

Example: Price Floor
S
DQ
P
Q* QsQd

Example: Price Floor
S
DQ
P
Q* QsQd
PMIN
Excess Supply

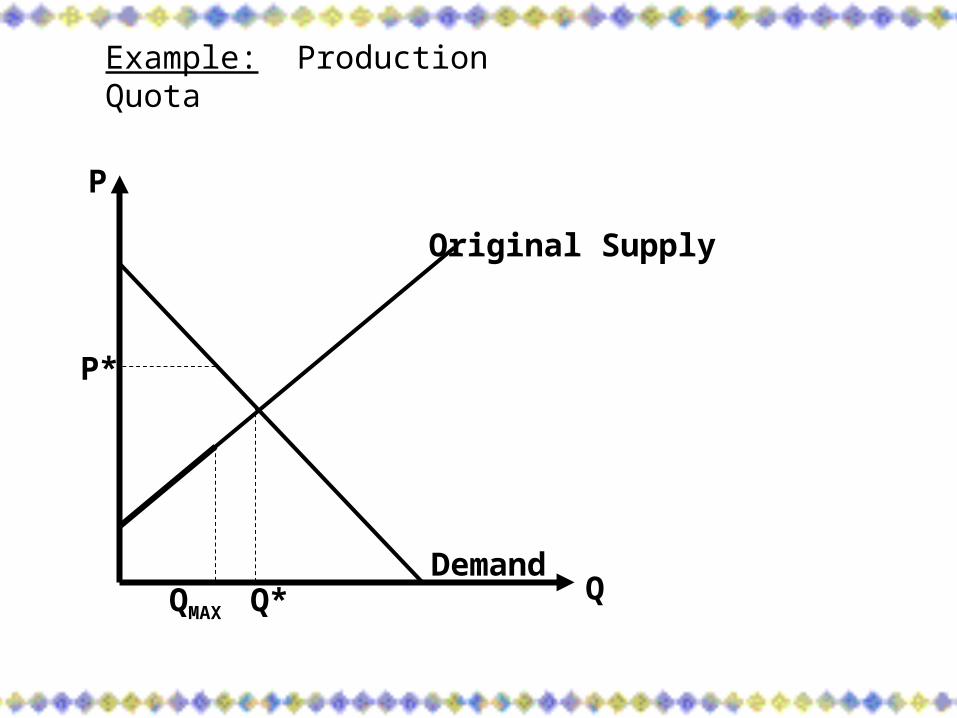
Definition: A production quota is a limit on either the number of producers in the market or on the amount that each producer can sell. The quota usually has a goal of placing a limit on the total quantity that producers can supply to the market.

Example: Production Quota
Original Supply
DemandQ
P
Q*
QMAX
Example: Production Quota
Original Supply
DemandQ
P
Q*
QMAX
P*

Example: Production Quota
Original Supply
DemandQ
P
Q*
QMAX
Supply with quota
P*

Definition: Tariffs are taxes levied by a government on goods imported into the government's own country. Tariffs sometimes are called duties.
Definition: An import quota is a limit on the total number of units of a good that can be imported into the country.

When will importation occur of a good?
Domestic Supply
Domestic Demand
A
C
D
Q
PExample: Importation of a Good

When will importation occur of a good?
Example: Importation of a Good
Domestic Supply
Domestic Demand
Q1 Q4
A
BC
D
Q
P
P*

When will importation occur of a good?
Example: Importation of a Good
Domestic Supply
Domestic Demand
Foreign SupplyPW
Q1 Q4
A
BC
D
Q
P
P*
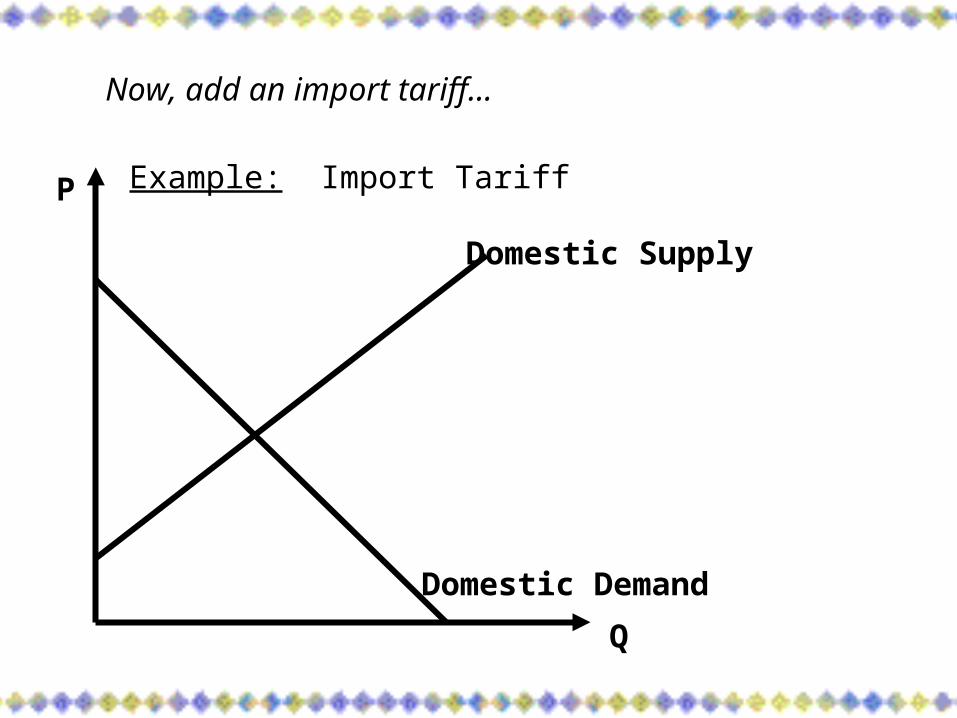
Example: Import Tariff
Now, add an import tariff…
Domestic Supply
Domestic Demand
Q
P

Example: Import Tariff
Now, add an import tariff…
Domestic Supply
Domestic Demand
Q1 Q4Q2 Q3Q
P
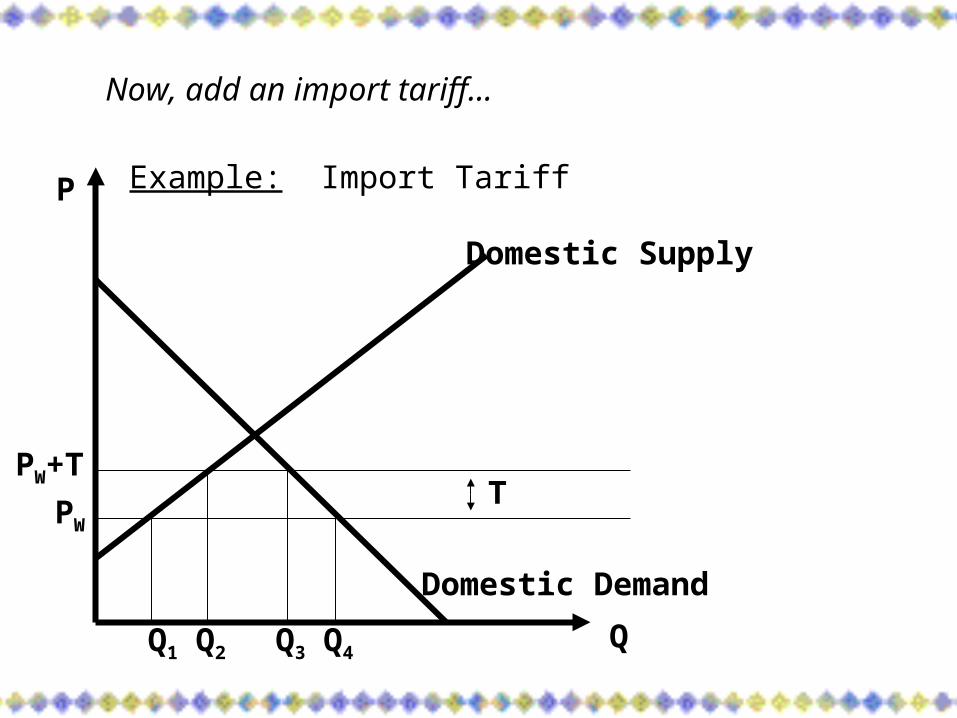
Example: Import Tariff
Now, add an import tariff…
Domestic Supply
Domestic Demand
PW
Q1 Q4
T
Q2 Q3
PW+T
Q
P

Example: Import Tariff
Now, add an import tariff…
Domestic Supply
Domestic Demand
PW
Q1 Q4
T
Q2 Q3
PW+T
Q
P
A BCD

Comparing a tariff to a quota…
Let quota limit imports to Q3-Q2…the equilibrium price would be the same as for the tariff…and the (world) deadweight loss would be the same as well.
Is there a difference? The quota generates no government revenue. Hence, while the total supply and total price for the domestic market remains the same under the two policies, domestic deadweight loss is larger under the quota.

1. An "invisible hand" guides the competitive market to the efficient level of production and consumption.
2. We obtained conclusion (1) for a single market only and under the assumption that price fully reflects all costs and benefits to the market and that there is perfect information. We will relax these assumptions in subsequent chapters.
3. The government policies we examined here all resulted in a deadweight loss compared to the perfectly competitive equilibrium.
4. Conclusion (3) is sensitive to the underlying market structure. We will examine non-competitive market structures in subsequent chapters.
5. Even though all policies resulted in a reduction in total surplus, each had a "constituency" in the form of consumers, producers or the government (effect on budget). If total surplus maximization is not the goal of policy-makers, each policy can be argued for on economic grounds.