
Chapter 2: Basic Microeconomic Tools 1 Basic Microeconomic Tools.
Microeconomic Analysis of Prices, Food andNutrition
Rachel Griffith, Martin O’Connell and Kate Smith
November 2011
Griffith, O’Connell, Smith (IFS) Food Prices November 2011 1 / 35

Motivation
Large and long-term research projectMotivated by the rise in diet related disease in developed countriesHow might food markets fail to deliver optimal outcome?What impact of policy interventions targeted at changing eatinghabits?
Griffith, O’Connell, Smith (IFS) Food Prices November 2011 2 / 35

What role for policy intervention
information and cognitive failures: individual may not havecomplete information, or may fail to process informationexternalities: some costs may accrue to others, not to individualtaking the consumption decisionliquidity/poverty: some households may not be able to afford anutritious dietmarket power of firms: incentives and behaviour in pricing andadvertising
Griffith, O’Connell, Smith (IFS) Food Prices November 2011 3 / 35
Broad research agenda
the impact on nutritional quality of foods purchased of:food pricesadvertisinginnovation in the food market
how the prices of complementary goods (time, food preparationtechnology) affect nutritional outcomesthe relative important of food consumption versus activity andburning calorieswhat will be effect of specific policies?
information campaigns, taxes, regulationincome transfers, social welfare programmesdo they target market failures?will they effect health outcomes, what other welfare considerations?how might firms respond?
Griffith, O’Connell, Smith (IFS) Food Prices November 2011 4 / 35

Specific current projects
Evaluate the impact of the 5-a-day campaign, allowing for firmpricing and advertising responseSimulate the impact of nutrition based taxes in specific markets(saturated fat in butter/margarine, sugar in soda)Describe and model variation in food purchasing behaviour in UK,US and FranceDescribe and model long term trends in food purchasing andactivity levels in the UKEstimate the impact of income transfers on nutritional quality offoods purchasedEstimate trade offs between time and income and the impact onnutrition in households with childrenMethodological advances in specifying and estimating models ofdemand for foods and nutrition
Griffith, O’Connell, Smith (IFS) Food Prices November 2011 5 / 35
Evaluating policies
When evaluating taxes, information, regulation, income transfersNeed to consider impact in presence of oligopolistic behaviour
by supermarketsby food manufacturersvertical relations between retails and manufacturers
and in presence of consumer behaviourwhat impact on different types of consumershow well target market failures
Griffith, O’Connell, Smith (IFS) Food Prices November 2011 6 / 35
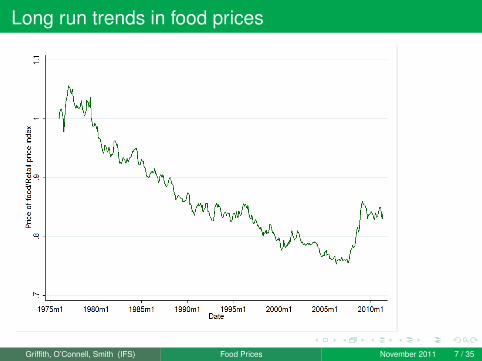
Long run trends in food prices
Griffith, O’Connell, Smith (IFS) Food Prices November 2011 7 / 35
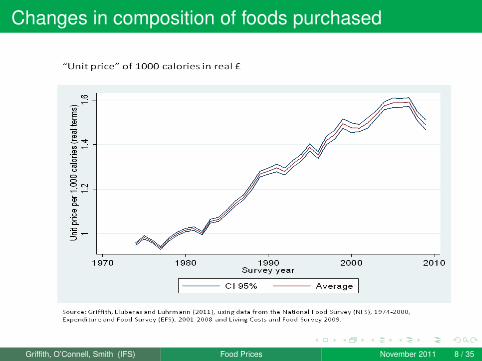
Changes in composition of foods purchased
Griffith, O’Connell, Smith (IFS) Food Prices November 2011 8 / 35
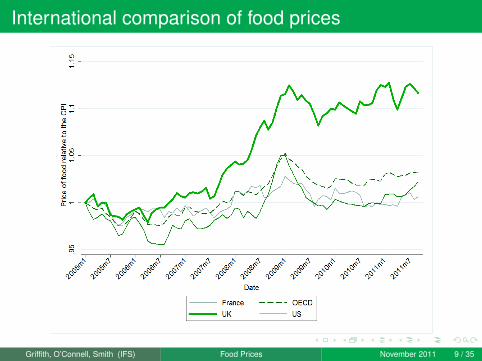
International comparison of food prices
Griffith, O’Connell, Smith (IFS) Food Prices November 2011 9 / 35

Large increase in UK food prices from 2007 to 2009
Griffith, O’Connell, Smith (IFS) Food Prices November 2011 10 / 35
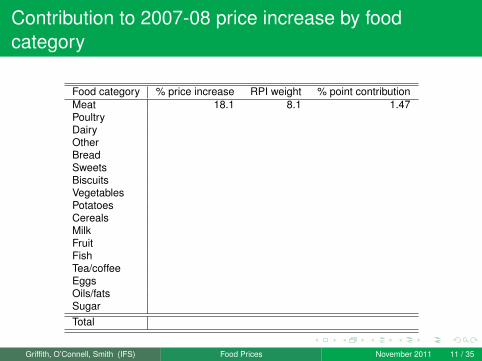
Contribution to 2007-08 price increase by foodcategory
Food category % price increase RPI weight % point contributionMeat 18.1 8.1 1.47PoultryDairyOtherBreadSweetsBiscuitsVegetablesPotatoesCerealsMilkFruitFishTea/coffeeEggsOils/fatsSugarTotal
Griffith, O’Connell, Smith (IFS) Food Prices November 2011 11 / 35
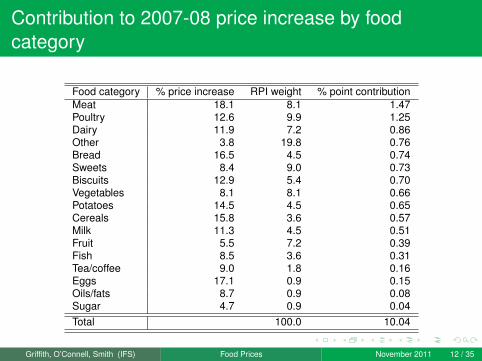
Contribution to 2007-08 price increase by foodcategory
Food category % price increase RPI weight % point contributionMeat 18.1 8.1 1.47Poultry 12.6 9.9 1.25Dairy 11.9 7.2 0.86Other 3.8 19.8 0.76Bread 16.5 4.5 0.74Sweets 8.4 9.0 0.73Biscuits 12.9 5.4 0.70Vegetables 8.1 8.1 0.66Potatoes 14.5 4.5 0.65Cereals 15.8 3.6 0.57Milk 11.3 4.5 0.51Fruit 5.5 7.2 0.39Fish 8.5 3.6 0.31Tea/coffee 9.0 1.8 0.16Eggs 17.1 0.9 0.15Oils/fats 8.7 0.9 0.08Sugar 4.7 0.9 0.04Total 100.0 10.04
Griffith, O’Connell, Smith (IFS) Food Prices November 2011 12 / 35

% point contribution to food price increase
Griffith, O’Connell, Smith (IFS) Food Prices November 2011 13 / 35
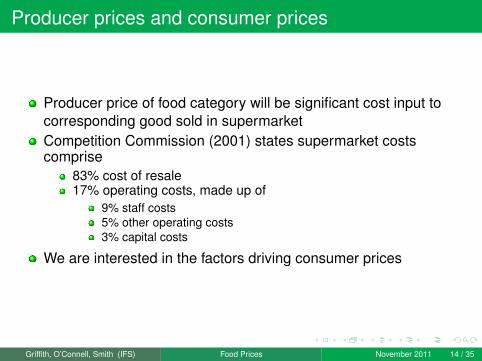
Producer prices and consumer prices
Producer price of food category will be significant cost input tocorresponding good sold in supermarketCompetition Commission (2001) states supermarket costscomprise
83% cost of resale17% operating costs, made up of
9% staff costs5% other operating costs3% capital costs
We are interested in the factors driving consumer prices
Griffith, O’Connell, Smith (IFS) Food Prices November 2011 14 / 35
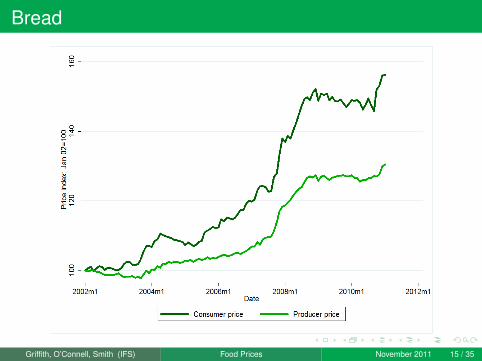
Bread
Griffith, O’Connell, Smith (IFS) Food Prices November 2011 15 / 35
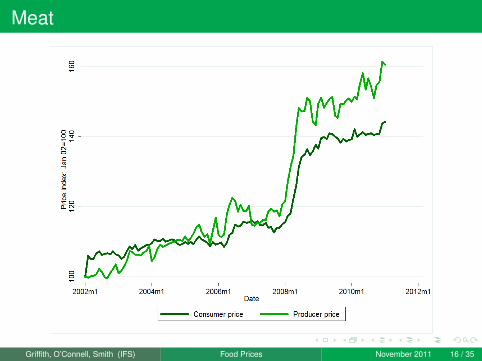
Meat
Griffith, O’Connell, Smith (IFS) Food Prices November 2011 16 / 35

Eggs
Griffith, O’Connell, Smith (IFS) Food Prices November 2011 17 / 35
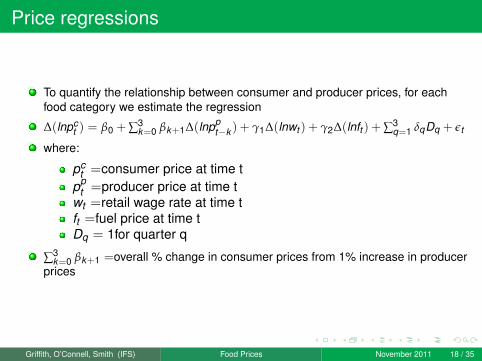
Price regressions
To quantify the relationship between consumer and producer prices, for eachfood category we estimate the regression
∆(lnpct ) = β0 + ∑3
k=0 βk+1∆(lnppt−k ) + γ1∆(lnwt ) + γ2∆(lnft ) + ∑3
q=1 δqDq + εt
where:
pct =consumer price at time t
ppt =producer price at time t
wt =retail wage rate at time tft =fuel price at time tDq = 1for quarter q
∑3k=0 βk+1 =overall % change in consumer prices from 1% increase in producer
prices
Griffith, O’Connell, Smith (IFS) Food Prices November 2011 18 / 35
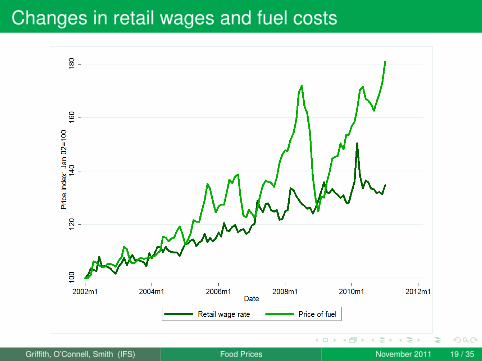
Changes in retail wages and fuel costs
Griffith, O’Connell, Smith (IFS) Food Prices November 2011 19 / 35

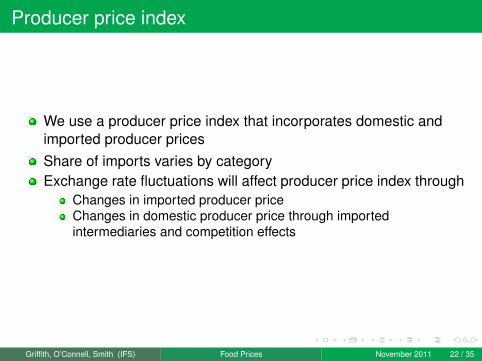
Producer price index
We use a producer price index that incorporates domestic andimported producer pricesShare of imports varies by category
Griffith, O’Connell, Smith (IFS) Food Prices November 2011 20 / 35

Share of imports
Griffith, O’Connell, Smith (IFS) Food Prices November 2011 21 / 35
Producer price index
We use a producer price index that incorporates domestic andimported producer pricesShare of imports varies by categoryExchange rate fluctuations will affect producer price index through
Changes in imported producer priceChanges in domestic producer price through importedintermediaries and competition effects
Griffith, O’Connell, Smith (IFS) Food Prices November 2011 22 / 35

Large depreciation in value of £ in 2008
Griffith, O’Connell, Smith (IFS) Food Prices November 2011 23 / 35

Producer price index
We use a producer price index that incorporates domestic andimported producer pricesShare of imports varies by categoryExchange rate fluctuations will affect producer price index through
Changes in imported producer priceChanges in domestic producer price through importedintermediaries and competition effects
Producer prices will also incorporate recent commodity priceincreases
Griffith, O’Connell, Smith (IFS) Food Prices November 2011 24 / 35

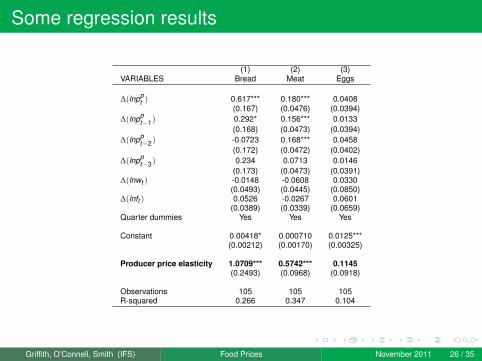
Some regression results
(1) (2) (3)VARIABLES Bread Meat Eggs
∆(lnppt ) 0.617*** 0.180*** 0.0408
(0.167) (0.0476) (0.0394)∆(lnpp
t−1) 0.292* 0.156*** 0.0133(0.168) (0.0473) (0.0394)
∆(lnppt−2) -0.0723 0.168*** 0.0458
(0.172) (0.0472) (0.0402)∆(lnpp
t−3) 0.234 0.0713 0.0146(0.173) (0.0473) (0.0391)
∆(lnwt ) -0.0148 -0.0608 0.0330(0.0493) (0.0445) (0.0850)
∆(lnft ) 0.0526 -0.0267 0.0601(0.0389) (0.0339) (0.0659)
Quarter dummies Yes Yes Yes
Constant 0.00418* 0.000710 0.0125***(0.00212) (0.00170) (0.00325)
Producer price elasticity 1.0709*** 0.5742*** 0.1145(0.2493) (0.0968) (0.0918)
Observations 105 105 105R-squared 0.266 0.347 0.104
Griffith, O’Connell, Smith (IFS) Food Prices November 2011 25 / 35
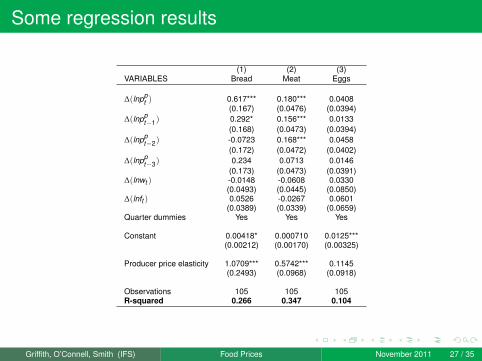
Some regression results
(1) (2) (3)VARIABLES Bread Meat Eggs
∆(lnppt ) 0.617*** 0.180*** 0.0408
(0.167) (0.0476) (0.0394)∆(lnpp
t−1) 0.292* 0.156*** 0.0133(0.168) (0.0473) (0.0394)
∆(lnppt−2) -0.0723 0.168*** 0.0458
(0.172) (0.0472) (0.0402)∆(lnpp
t−3) 0.234 0.0713 0.0146(0.173) (0.0473) (0.0391)
∆(lnwt ) -0.0148 -0.0608 0.0330(0.0493) (0.0445) (0.0850)
∆(lnft ) 0.0526 -0.0267 0.0601(0.0389) (0.0339) (0.0659)
Quarter dummies Yes Yes Yes
Constant 0.00418* 0.000710 0.0125***(0.00212) (0.00170) (0.00325)
Producer price elasticity 1.0709*** 0.5742*** 0.1145(0.2493) (0.0968) (0.0918)
Observations 105 105 105R-squared 0.266 0.347 0.104
Griffith, O’Connell, Smith (IFS) Food Prices November 2011 26 / 35
Some regression results
(1) (2) (3)VARIABLES Bread Meat Eggs
∆(lnppt ) 0.617*** 0.180*** 0.0408
(0.167) (0.0476) (0.0394)∆(lnpp
t−1) 0.292* 0.156*** 0.0133(0.168) (0.0473) (0.0394)
∆(lnppt−2) -0.0723 0.168*** 0.0458
(0.172) (0.0472) (0.0402)∆(lnpp
t−3) 0.234 0.0713 0.0146(0.173) (0.0473) (0.0391)
∆(lnwt ) -0.0148 -0.0608 0.0330(0.0493) (0.0445) (0.0850)
∆(lnft ) 0.0526 -0.0267 0.0601(0.0389) (0.0339) (0.0659)
Quarter dummies Yes Yes Yes
Constant 0.00418* 0.000710 0.0125***(0.00212) (0.00170) (0.00325)
Producer price elasticity 1.0709*** 0.5742*** 0.1145(0.2493) (0.0968) (0.0918)
Observations 105 105 105R-squared 0.266 0.347 0.104
Griffith, O’Connell, Smith (IFS) Food Prices November 2011 27 / 35

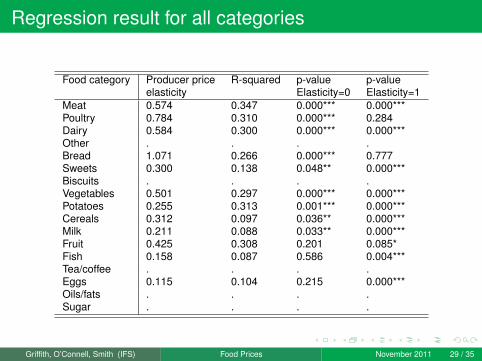
Regression result for all categories
Food category Producer price R-squared p-value p-valueelasticity Elasticity=0 Elasticity=1
Meat 0.574 0.347 0.000*** 0.000***PoultryDairyOtherBreadSweetsBiscuitsVegetablesPotatoesCerealsMilkFruitFishTea/coffeeEggsOils/fatsSugar
Griffith, O’Connell, Smith (IFS) Food Prices November 2011 28 / 35
Regression result for all categories
Food category Producer price R-squared p-value p-valueelasticity Elasticity=0 Elasticity=1
Meat 0.574 0.347 0.000*** 0.000***Poultry 0.784 0.310 0.000*** 0.284Dairy 0.584 0.300 0.000*** 0.000***Other . . . .Bread 1.071 0.266 0.000*** 0.777Sweets 0.300 0.138 0.048** 0.000***Biscuits . . . .Vegetables 0.501 0.297 0.000*** 0.000***Potatoes 0.255 0.313 0.001*** 0.000***Cereals 0.312 0.097 0.036** 0.000***Milk 0.211 0.088 0.033** 0.000***Fruit 0.425 0.308 0.201 0.085*Fish 0.158 0.087 0.586 0.004***Tea/coffee . . . .Eggs 0.115 0.104 0.215 0.000***Oils/fats . . . .Sugar . . . .
Griffith, O’Connell, Smith (IFS) Food Prices November 2011 29 / 35
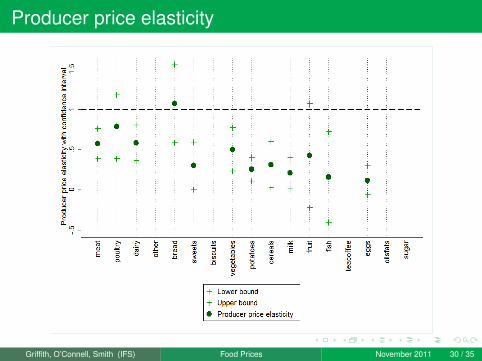
Producer price elasticity
Griffith, O’Connell, Smith (IFS) Food Prices November 2011 30 / 35
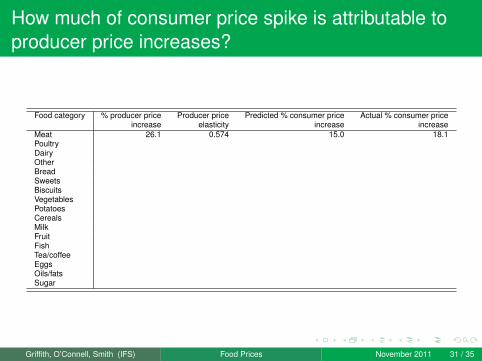
How much of consumer price spike is attributable toproducer price increases?
Food category % producer price Producer price Predicted % consumer price Actual % consumer priceincrease elasticity increase increase
Meat 26.1 0.574 15.0 18.1PoultryDairyOtherBreadSweetsBiscuitsVegetablesPotatoesCerealsMilkFruitFishTea/coffeeEggsOils/fatsSugar
Griffith, O’Connell, Smith (IFS) Food Prices November 2011 31 / 35

How much of consumer price spike is attributable toproducer price increases?
Food category % producer price Producer price Predicted % consumer price Actual % consumer priceincrease elasticity increase increase
Meat 26.1 0.574 15.0 18.1Poultry 11.7 0.784 9.2 12.6Dairy 5.4 0.584 3.2 11.9Other . . . .Bread 11.5 1.071 12.3 16.5Sweets 10.5 0.300 3.2 8.4Biscuits . . . .Vegetables 10.5 0.501 5.3 8.1Potatoes 4.0 0.255 1.0 14.5Cereals 18.1 0.312 5.7 15.8Milk 3.2 0.211 0.7 11.3Fruit 15.6 0.425 6.6 5.5Fish 7.9 0.158 1.2 8.5Tea/coffee . . . .Eggs 6.5 0.115 0.7 17.1Oils/fats . . . .Sugar . . . .
Griffith, O’Connell, Smith (IFS) Food Prices November 2011 32 / 35

How much of consumer price spike is attributable toproducer price increases
Griffith, O’Connell, Smith (IFS) Food Prices November 2011 33 / 35
Summary of work on food price rise
Very preliminary descriptive look at dataSuggests increase in producer prices (which reflect exchange rateand commodity price movements) only tells part of food pricespike storyA lot left unexplained and variation across industriesMay reflect:
Differences in vertical relationsDifferences in downstream competitionUnmeasured changes in other costs, etc.
We are exploring whether and how more disaggregate data mightbe useful to look at these issues
Griffith, O’Connell, Smith (IFS) Food Prices November 2011 34 / 35

Summary
Our objectives are to better understand how interventions in foodmarkets are likely to affect nutrition outcomes, and what otherconsequences they might haveIn order to do this we need to model behaviour of firms andconsumers in food marketsUnderstanding the determinants of food prices is part of thepuzzle
Griffith, O’Connell, Smith (IFS) Food Prices November 2011 35 / 35