
Microchip Atmospheric Pressure Ionization-Mass Spectrometry
70
Microchip Atmospheric Pressure Ionization-Mass Spectrometry By Pekka Östman Division of Pharmaceutical Chemistry Faculty of Pharmacy University of Helsinki Finland Academic dissertation To be presented with the permission of the Faculty of Pharmacy of the University of Helsinki, for public criticism in Auditorium 1041 of Viikki Biocenter on March 2 nd , 2007, at 12 o’clock noon Helsinki 2007
Transcript of Microchip Atmospheric Pressure Ionization-Mass Spectrometry
Microchip Atmospheric Pressure Ionization-Mass
Spectrometry
By
Pekka Östman
Division of Pharmaceutical Chemistry
Faculty of Pharmacy
University of Helsinki
Finland
Academic dissertation
To be presented with the permission of the Faculty of Pharmacy of the
University of Helsinki, for public criticism in Auditorium 1041 of Viikki
Biocenter on March 2nd, 2007, at 12 o’clock noon
Helsinki 2007

2
Supervisors:
Professor Risto Kostiainen Division of Pharmaceutical Chemistry Faculty of Pharmacy University of Helsinki Finland Professor Tapio Kotiaho Environmental Chemistry and Environmental Analytical Chemistry Laboratory of Analytical Chemistry Department of Chemistry Faculty of Science University of Helsinki Finland
Reviewers: Professor Jonas Bergquist Analytical Chemistry & Neurochemistry Department of Physical & Analytical Chemistry Biomedical Centre Uppsala University Sweden Docent Seppo Auriola Department of Pharmaceutical Chemistry Faculty of Pharmacy University of Kuopio Finland
Opponent:
Professor Frants R. Lauritsen Analytical Environment Chemistry Department of Chemistry Faculty of Science University of Copenhagen Denmark
© Pekka Östman 2007 ISBN 978-952-10-3669-9 (printed version) ISSN 1795-7079 ISBN 978-952-10-3670-5 (PDF) http://ethesis.helsinki.fi
Helsinki University Printing House Helsinki 2007
Finland
3
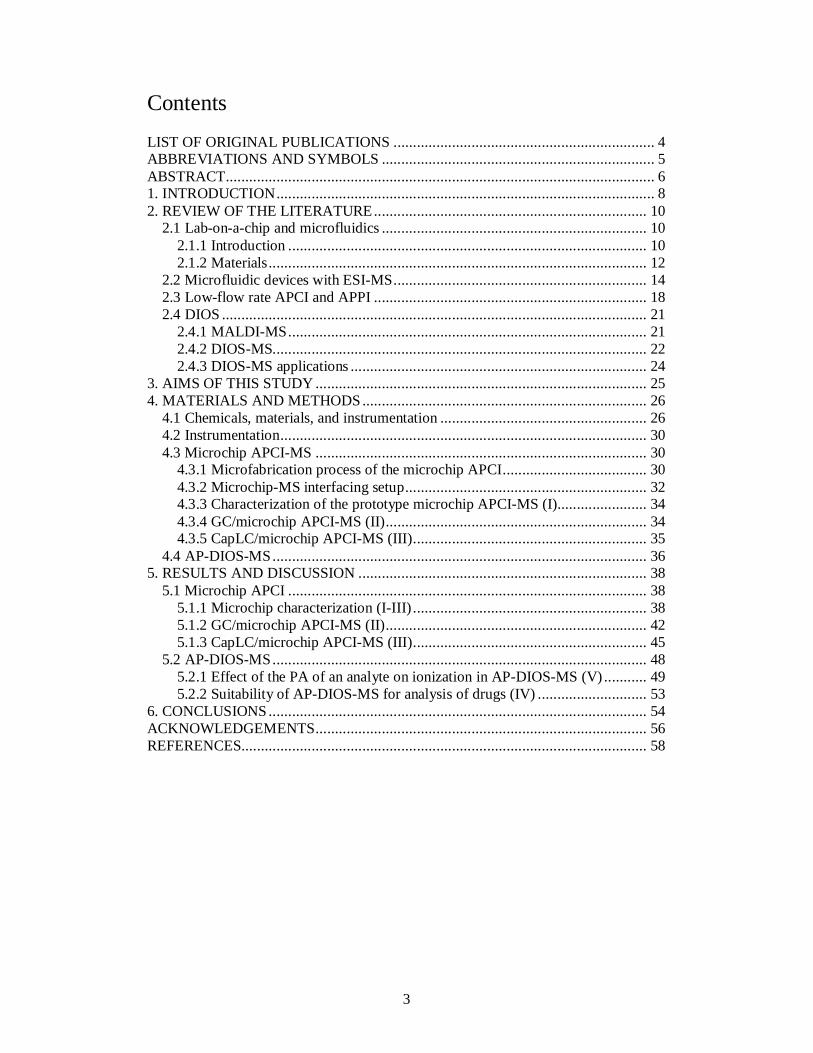
Contents LIST OF ORIGINAL PUBLICATIONS ................................................................... 4 ABBREVIATIONS AND SYMBOLS ...................................................................... 5 ABSTRACT.............................................................................................................. 6 1. INTRODUCTION................................................................................................. 8 2. REVIEW OF THE LITERATURE...................................................................... 10
2.1 Lab-on-a-chip and microfluidics .................................................................... 10 2.1.1 Introduction ............................................................................................ 10 2.1.2 Materials................................................................................................. 12
2.2 Microfluidic devices with ESI-MS................................................................. 14 2.3 Low-flow rate APCI and APPI ...................................................................... 18 2.4 DIOS ............................................................................................................. 21
2.4.1 MALDI-MS............................................................................................ 21 2.4.2 DIOS-MS................................................................................................ 22 2.4.3 DIOS-MS applications ............................................................................24
3. AIMS OF THIS STUDY ..................................................................................... 25 4. MATERIALS AND METHODS......................................................................... 26
4.1 Chemicals, materials, and instrumentation ..................................................... 26 4.2 Instrumentation.............................................................................................. 30 4.3 Microchip APCI-MS ..................................................................................... 30
4.3.1 Microfabrication process of the microchip APCI..................................... 30 4.3.2 Microchip-MS interfacing setup.............................................................. 32 4.3.3 Characterization of the prototype microchip APCI-MS (I)....................... 34 4.3.4 GC/microchip APCI-MS (II)................................................................... 34 4.3.5 CapLC/microchip APCI-MS (III)............................................................ 35
4.4 AP-DIOS-MS................................................................................................ 36 5. RESULTS AND DISCUSSION .......................................................................... 38
5.1 Microchip APCI ............................................................................................ 38 5.1.1 Microchip characterization (I-III) ............................................................ 38 5.1.2 GC/microchip APCI-MS (II)................................................................... 42 5.1.3 CapLC/microchip APCI-MS (III)............................................................ 45
5.2 AP-DIOS-MS................................................................................................ 48 5.2.1 Effect of the PA of an analyte on ionization in AP-DIOS-MS (V) ........... 49 5.2.2 Suitability of AP-DIOS-MS for analysis of drugs (IV) ............................ 53
6. CONCLUSIONS................................................................................................. 54 ACKNOWLEDGEMENTS..................................................................................... 56 REFERENCES........................................................................................................ 58

4
LIST OF ORIGINAL PUBLICATIONS
This doctoral thesis is based on the following five articles, hereafter referred to by
their Roman numerals (I-V):
I Östman, P., Marttila, S. J., Kotiaho, T., Franssila, S., and Kostiainen R.
Microchip Atmospheric Pressure Chemical Ionization Mass Spectrometry.
Analytical Chemistry 2004, 76, 6659-6664.
II Östman, P., Luosujärvi, L., Haapala, M., Grigoras, K., Ketola, R. A., Kotiaho,
T., Franssila, S., and Kostiainen, R. Gas Chromatography - Microchip
Atmospheric Pressure Chemical Ionization - Mass Spectrometry. Analytical
Chemistry 2006, 78, 3027-3031.
III Östman, P., Jäntti, S., Grigoras, K., Saarela, V., Ketola, R. A., Franssila, S.,
Kotiaho, T., and Kostiainen R. Capillary Liquid Chromatography - Microchip
Atmospheric Pressure Chemical Ionization - Mass Spectrometry. Lab on a Chip
2006, 6, 948-953.
IV Huikko, K., Östman, P., Sauber, C., Mandel, F., Grigoras, K., Franssila, S.,
Kotiaho, T., and Kostiainen, R. Feasibility of Atmospheric Pressure
Desorption/Ionization on Silicon Mass Spectrometry in Analysis of Drugs.
Rapid Communications in Mass Spectrometry 2003, 17, 1339–1343.
V Östman, P., Pakarinen, J., Vainiotalo, P., Franssila, S., Kostiainen, R., and
Kotiaho, T. Minimum Proton Affinity for Efficient Ionization with Atmospheric
Pressure Desorption/Ionization on Silicon Mass Spectrometry. Rapid
Communications in Mass Spectrometry 2006, 20, 3669–3673.

5
ABBREVIATIONS AND SYMBOLS
AP atmospheric pressure
AP-DIOS atmospheric pressure desorption/ionization on silicon
APCI atmospheric pressure chemical ionization
API atmospheric pressure ionization
capLC capillary liquid chromatography
CE capillary electrophoresis
DIOS desorption/ionization on silicon
DRIE deep-reactive ion etching
ESI electrospray ionization
GC gas chromatography
HF hydrofluoric acid
i.d. internal diameter
LC liquid chromatography
LOD limit of detection
[M+H] + protonated molecule
MALDI matrix-assisted laser desorption/ionization
MEMS microelectromechanical systems
MS mass spectrometry
MS/MS tandem mass spectrometry
MW molecular weight
m/z mass-to-charge ratio
PA proton affinity
pSi porous silicon
RSD relative standard deviation
SEM scanning electron microscopy
S/N signal-to-noise
TEST testosterone
µ-TAS micro-total analysis systems

6
ABSTRACT
The atmospheric pressure ionization techniques in mass spectrometry (MS),
electrospray ionization (ESI), atmospheric pressure chemical ionization (APCI), and
atmospheric pressure photoionization (APPI), play key roles in the life sciences,
biopharmaceutical chemistry, and environmental research. ESI is the most commonly
used ionization method and the discovery of nano electrospray (nano ESI) and its
combination with nanoliquid chromatography (nanoLC) has established the modern
forms of proteomics, system biology, and metabolomics. With the pressing need for
analytical methods faster than nanoLC/MS, microfluidic ESI-MS systems for
combining rapid separations with high detection sensitivity have been intensively
studied. The complementary API techniques, APCI and APPI, have been overlooked
so far.
For the first time, a novel microchip heated nebulizer for atmospheric pressure
chemical ionization mass spectrometry (APCI-MS) was developed and evaluated. The
microchip included a capillary insertion channel, stopper, vaporizer channel, nozzle,
and nebulizer gas inlet fabricated on a silicon wafer, either anisotropic wet-etched or
deep-reactive ion-etched, and a platinum heater sputtered on a glass wafer. These two
wafers were joined by anodic bonding, creating a two-dimensional version of an
APCI source. The microfabricated stopper in the vaporizer channel ensured correct
positioning of the capillary, which led to reproducible insertion and minimization of
the dead volumes inside the microchip APCI. The etched nozzle in the microchip
formed a narrow sample plume that was ionized by an external corona needle, and the
ions formed were analyzed with a mass spectrometer. The nebulizer chip provided
flow rates down to 50 nl/min thus enabling, for the first time, the use of low-flow rate
separation techniques with APCI-MS.
The feasibility of the microchip APCI for quantitative work was investigated with gas
chromatography/mass spectrometry (GC/MS) and capillary liquid
chromatography/mass spectrometry (capLC/MS). For GC/MS work, a set of volatile
organic compounds and testosterone representing semivolatile compounds were used.

7
The spectra produced by microchip APCI showed intensive protonated molecules and
some fragmentation products as in classical chemical ionization for structure
elucidation. In quantitative analysis the GC/microchip APCI-MS showed good
linearity (regression coefficient (r2) = 0.9989) and repeatability (relative standard
deviation (RSD = 4.4%, n=6)). The limits of detection (LODs) with signal-to-noise
ratio (S/N) of 3 were between 0.5 and 2 µmol/l in the MS mode, using selected ion
monitoring and 0.05 µmol/l with MS/MS using multiple reaction monitoring. The
capLC/microchip APCI-MS work was done with selected neurosteroids. The
capLC/microchip APCI-MS provided quantitative repeatability (RSD, n=6, of peak
areas varied between 12.7% and 18.9%) and good linearity (r2 of area varied between
0.9919 and 0.9994). The LODs (S/N=3) in the MS/MS mode for the neurosteroids
were 20 - 1000 fmol (10 - 500 nmol/l). Comparison of the LODs showed that the
microchip APCI sensitivity in terms of concentration in the sample was comparable to
that of macro-APCI, but the mass flow sensitivity was about 100-200 times better
with microchip APCI. Rapid heat transfer allowed the use of optimized temperatures
for each compound during an LC run.
In another approach, the feasibility of atmospheric pressure desorption/ionization on
silicon-mass spectrometry (AP-DIOS-MS) for drug analysis was investigated. It was
observed that only compounds with relatively high proton affinity, above a threshold
value of 920-950 kJ/mol, are efficiently ionized under AP-DIOS conditions. The
LODs achieved in the MS mode with midazolam, propranolol, and Angiotensin II
were 80 fmol, 20 pmol, and 1 pmol respectively. In the MS/MS mode the LODs for
midazolam and propranolol were 10 fmol and 5 pmol, respectively. The good linearity
(r2 > 0.991), linear dynamic range of 3 orders of magnitude, and repeatability (RSD =
35%, n=7) showed that the method was suitable for quantitative analysis.

8
1. INTRODUCTION
With the increasing demand for faster and more cost-effective analytical methods,
miniaturization of analytical instruments is becoming ever more popular. The major
motivations of miniaturization are increased speed of analysis, lower sample and
reagent consumption, and reduced waste production. Due to the high surface-to-
volume ratio diffusion times are short, allowing fast reactions. These miniaturized
analytical instruments can be highly automated and with the small dimensions, many
systems can be constructed in parallel, providing increasing sample throughput.
Additional advantages include robustness, reliability, the potential for mass
production resulting in low production costs, and use of disposable microchips. The
feasibility of integration of different functional units such as reaction, separation, and
detection on a single microchip consisting of all features of a complete lab has led to
the concepts ‘Micro-Total Analysis Systems’ (µ-TAS) and ‘lab-on-a-chip’. Decreased
sample volumes require an adequate, highly sensitive detection method. The detection
methods used with µ-TAS have most often been optical methods (such as absorption
and fluorescence), electrochemical methods, and mass spectrometry (MS). Most
microfluidic applications so far have relied on fluorescence detection, but MS is
attracting increasing interest for its high specificity and sensitivity.
Modern liquid chromatography/mass spectrometry (LC/MS) is based on atmospheric
pressure ionization (API) techniques: electrospray ionization (ESI), atmospheric
pressure chemical ionization (APCI), and the recently introduced atmospheric
pressure photoionization (APPI). These ionization techniques play key roles in the life
sciences, biopharmaceutical chemistry, and environmental research. ESI is an
excellent technique for ionic and polar compounds, but only polar solvents can be
used and the ionization efficiency for neutral and nonpolar compounds may be poor.
Furthermore, ESI is not amenable to gaseous samples. In contrast, APCI and
especially APPI are better ionization techniques for less or non polar and neutral small
molecules, but they are not suitable for large biomolecules. APCI provides high
ionization efficiency for polar and neutral compounds, allows use of polar and
nonpolar solvents, and tolerates higher electrolyte concentrations. Additionally,

9
suppression of ionization by coeluting compounds is significantly less with APCI than
with ESI. At present ESI is the most common ionization method and to date, it has
been the only ion source available for low flow rate capillary- and nano liquid
chromaography (capLC and nanoLC) applications and microfluidics. The flow rates
used with commercial APCI and APPI ion sources are high, typically above 50
µl/min, making them incompatible for low-flow rate separations.
Desorption/ionization on silicon mass spectrometry (DIOS-MS) is a relatively new
matrix-assisted laser desorption/ionization (MALDI)-related technique. In DIOS,
chemically etched porous silicon (pSi) is used as a sample support and as a substrate
to assist desorption/ionization instead of the matrix compounds used in MALDI. The
fact that no addition of matrix is needed reduces the sample preparation time and
produces high-quality mass spectra that are essentially free of the background peaks at
the low-molecular weight ranges (MW < 800) encountered in MALDI-MS. DIOS is a
relatively soft ionization method and therefore efficient ionization with little
fragmentation of the sample molecule is typically observed. Atmospheric pressure
(AP)-DIOS-MS differs mainly from conventional vacuum DIOS-MS in that the laser
DI steps are conducted under AP, as are the ESI and APCI techniques. AP-DIOS
provides easier interfacing to existing API instruments, including tandem instruments
such as triple quadrupoles and ion traps, and easier sample transfer than with vacuum
DIOS instruments.
In this work the feasibility of two miniaturized API techniques for MS were
evaluated. First, a novel microchip heated nebulizer for APCI-MS was developed and
evaluated (I ). Based on this prototype a new version was designed for analytical work.
Both anisotropic wet etching (II ) and deep-reactive ion etching (DRIE) (III )
fabrication methods were employed in production. The performance of the microchip
as an interface for API-MS for qualititative and quantitative work was evaluated with
gas chromatography (GC) (II ) and capLC (III ). Next, the feasibility of AP-DIOS-MS
for drug analysis was investigated (IV ) and the role of proton affinity (PA) in the
ionization process AP-DIOS-MS was systematically studied (V).

10
2. REVIEW OF THE LITERATURE
2.1 Lab-on-a-chip and microfluidics
2.1.1 Introduction
The current trend in analytical chemistry is miniaturization of analytical instruments,
using microfabrication processes to improve sensitivity and speed of analysis.
Microfabrication is based on the fabrication processes originally developed for micro-
electromechanical systems (MEMS) within the microelectronics industry.
The first analytical microfluidic chip introduced (1978) was a GC etched on a 5-cm
silicon wafer [1]. However, it was the introduction of the µ-TAS concept by Manz et
al. in 1990 [2] that resulted in a tremendous increase in the research and development
of microfluidic chips. The µ-TAS, or ‘lab-on-a-chip’, is a system with integrated
modules that performs all steps in an analysis: sampling, sample pretreatment, sample
transport, chemical reactions, separation, and detection. Microfluidics is used for
precise control of liquid (or gas) in the lab-on-a-chip system. The benefits of
microfluidics include improved performance by increased speeds and higher
throughputs of sample, parallel reactions, fast response, portability of instruments,
highly automated analyses, reduced manufacturing and operating costs, and reduced
resource consumption and waste production. The applications range from clinical
application [3,4], cell analysis and manipulation [5], DNA [6-8], combinatorial
chemistry [9], drug discovery [10,11], high throughput analysis [12], bioanalytical
and pharmaceutical applications [6,13], sizing and quantitation of proteins [6,14] and
peptides [6], and environmental analysis [15-17].
The typical microchip is a planar silicon, glass, or polymer device with an overall size
ranging from millimeters to centimeters and an incorporated network of
interconnected microchannels. The most popular fluid propulsion technique has been
electroosmotic flow. There are several advantages in using electroosmotic flow, such
as simple liquid control, simple chip fabrication, flat flow profile provided by the
electroosmotic flow, and fast analysis [13]. Some examples include on-chip capillary

11
electrophoresis (CE) separation of rhodamine B and di-chlorofluorescein in 0.8 ms
[18] and a baseline separation of 19 amino acids in 165 s [19]. Separation was also
performed with miniaturized LC [20-24]. There is also a commercially available
‘HPLC-Chip’ from Agilent. A novel concept in fluid movement is the fully automated
compact disc format microfluidic system utilizing centrifugal force for fluid
movement, which was developed for sample preparation prior to MALDI-MS analysis
[25-27], and is commercially available from Gyros. The same centrifugal force
concept has also been applied for multiple enzymatic assays [28].
The complexity of bioanalytical samples usually requires sample pretreatment.
Sample pretreatment has been realized in microfluids either by conventional methods,
such as solid-phase extraction, or utilizing the new phenomena offered by scaled-
down devices, such as laminar fluid diffusion interfacing. In laminar fluid diffusion
interfacing two or more streams flow in parallel in a microfluidic chip with no mixing
of the fluids other than by diffusion of particles across the diffusion interface. The
laminar fluid diffusion interface was demonstrated in the separation of small and large
molecules [29], and was successfully applied to blood sample preparation [30] and
on-line desalting of macromolecule solutions [31]. On-chip solid-phase extraction was
done with monolithic porous polymers [32,33], C-18 modified channels [34],
octadecylsilane-coated silica beads [35,36] and octadecylsilane-packed columns [37],
and water-soluble poly(acrylamide-co-alkylacrylamides) [38]. Membrane-based
sample pretreatment can include desalting, elution of analytes from the membrane,
and direct analysis of small drugs, peptides, and proteins [39], concentration of
proteins using a porous silica membrane between adjacent microchannels [40], and
miniaturized supported liquid membrane extraction for sample enrichment [41].
The small sample volumes used in microfluidics require adequate, high-sensitivity
detection techniques. In most microfluidic applications so far, detection has relied on
optical techniques, especially on laser-induced fluorescence for its excellent
sensitivity. Furthermore, the sensitivity is greatly enhanced by reducing the size of the
detection volume, because the background signal that is generated by impurities in the
sample scales linearly with the size of the detection volume [42]. However,
derivatization schemes are needed with nonfluorescent compounds. An alternative to
laser-induced fluorescence is electrochemical detection. Electrochemical detectors can

12
be relatively easily integrated into a microfluidic chip with standard MEMS processes
without loss of sensitivity [43]. In addition, many compounds can be detected without
derivatization. Other detectors such as chemiluminescence detector [44,45], refractive
index detector [46-47], micromachined photoacoustic detector [48], and ultraviolet
(UV) detector [49] have also been used, showing the versatility of detectors that can
be used in µ-TAS. However, for high-throughput sample identification and structure
elucidation, chip-based MS detection is the method of choice. MS is highly sensitive
and is a selective detector suitable for handling the reduced sample volumes of
microfluidics. The capability for performing high-speed separations with microchips
is fully matched by high-throughput MS instrumentation [50]. Furthermore, MS is
able to provide the molecular weight and structural information of an analyte. So far
interfacing of microfluidic devices with MS has been done using either ESI or
MALDI interfaces, of which ESI is more widely used [50-54]. The complementary
API techniques, APCI and APPI, were just recently introduced for interfacing
microfluidic devices with MS [I, 55].
2.1.2 Materials
Silicon and Glass
The fabrication of microfluidic devices was initially undertaken using
micromachining technologies employing silicon and glass [2,56,57]. These include
several different fabrication techniques that selectively add (e.g. sputtering of metal,
oxide growth, or resist spinning) or remove material (etching) from planar substrates.
Once a pattern has been produced in a resist material by lithography, it can be
transferred to the substrate by means of micromachining techniques.
The advantages of silicon are the good mechanical rigidity of microdevices, versatility
of the structural geometry obtainable, and well-developed surface micromachining
technology [58]. The well-developed micromachining technology enables easy
integration of different functionalities, e.g. electrical and thermal functionalities, into
the microdevices. Unfortunately, silicon is a semiconductor, and thick insulating
layers, such as of thermal oxide or nitride, need to be fabricated for high-voltage
applications. Glass is an insulator with a high breakdown voltage, and is optically

13
transparent to UV/visible light. The thermal expansion coefficient for many glasses is
in the same order as silicon, making glass a good substrate for bonding with silicon.
The etching methods for silicon are classified under four categories: wet anisotropic,
wet isotropic, dry anisotropic, and dry isotropic [59-61]. The etching rates for wet
etching are approximately 1 µm/min and for dry etching 1-10 µm/min. In anisotropic
wet etching the structures are determined by the different etching rates of the silicon
crystal planes, while isotropic etching occurs at the same rate in all directions. In
plasma (dry) etching the shape of the channels can be varied from isotropic to vertical
by varying the etching conditions.
On the microfabrication standpoint, glass is difficult to etch and has poor dimensional
control. Glass etching is usually done with isotropic wet etching, limiting the channel
geometry to the elliptical [58]. Other fabrication methods include electrochemical
discharge drilling [62], ultrasonic drilling [63], laser drilling [64], and DRIE [65-68].
The DRIE etching rates for glasses vary between 250 nm/min and 1.2 µm/min,
depending on the chemical composition of the glass [65-68].
Polymers
The advantages of polymers are the low cost of polymer materials, easier fabrication
compared with silicon and glass, freedom in geometrical designs, and the wide range
of material selection [69]. The fabrication processes can be divided into direct
fabrication and replication techniques [57,69]. In direct methods, such as laser
ablation, reactive ion etching, lithography, layering, and mechanical milling, polymers
are structured individually to form system features [57]. Direct methods are often
complex and slow. Replication methods, such as injection molding, hot-embossing,
compression molding, casting, and soft-lithography, on the other hand, involve the use
of a microfabricated molding tool which can then be used to replicate identical
polymer microstructures [57,69]. The replication method enables massproduction of
devices at low cost. A wide variety of polymers have been used, including
poly(methyl methacrylate) (PMMA), polycarbonate (PC), cycloolefin copolymer
(COC), polyimide, polystyrene (PS), poly(dimethylsiloxane) (PDMS) [8,57,69,70],
and SU-8 [70-72].

14
2.2 Microfluidic devices with ESI-MS
2.2.1 Electrospray ionization
Formation of gas-phase ions by ESI was demonstrated by Dole et al. [73] and the first
interfacing of ESI with MS was done by Yamashita and Fenn [74-75]. ESI is a
method in which a liquid is dispersed into small charged droplets by applying a high
electric potential between the tip of a thin capillary and a counter electrode, here the
MS. The ionization process can be divided into three steps: formation of charged
droplets at the tip of the capillary, evaporation of solvent from the droplets and
formation of gas-phase ions. The discovery of nanoelectrospray (nano ESI) and its
combination with nanoLC extended bioanalysis to attomole-sensitivity [76]. An
molecular weight accuracy of 0.01% could be obtained for proteins by applying a
signal-averaging method to the multiple charged ions formed in the ESI process [77].
At present ESI is the most common ionization method used in API-MS. ESI is an
excellent technique for ionic and polar compounds ranging from small molecules to
proteins and peptides, but the ionization efficiency for neutral and nonpolar
compounds may be poor. Other disadvantages include that only polar solvents can be
used and volatile buffers are preferable to minimize contamination. For neutral, less
polar, and ionic compounds APCI or APPI is often more suitable.
2.2.2 Microchip-ESI-MS
For microfluidics, ESI is an ideal ionization source because the flow rates in
microfabricated devices are of the order of 0-300 nl/min [50], thus being similar to the
flow rates of nano ESI sources [78]. The first designs, introduced by Xue et al. [79]
and Ramsey and Ramsey [80], for glass chips were those in which the electrospray
was initiated directly from the edge of the microchip. To date, many different chip-
based ESI-MS interfaces from different materials have been fabricated, as shown in
Table 1. The interfacing techniques can be characterized as two types: interfaces that
spray directly from an exposed channel at the side of a chip (on-chip spraying), and
those that use an external emitter attached to the microchip for spraying (off-chip
spraying) [51-53].

15
Table 1. Microchip-ESI-MS applications, microchip material used and ESI interface type.
Analytes Chip material Interfacing type Reference
Proteins Glass On-chip [79]
Tetrabutylammonium iodide Glass On-chip [80]
Proteins Glass with external ESI needle Off-chip [81]
Proteins Glass with external fused silica capillary nozzle Off-chip [82]
Proteins Polycarbonate (PC) with external ESI needle Off-chip [83]
Proteolytic digests Glass with external ESI needle Off-chip [84]Glass with fused silica nozzle
Peptides Glass On-chip [85]Glass with external ESI needle Off-chip
Small molecules Glass with external fused silica nozzle Off-chip [86]
Peptides and proteins Gglass with external ESI needle Off-chip [87]
Peptides and proteins PDMS (polydimethylsiloxane) with external ESI needle Off-chip [88]
Peptides and proteins Silicon with parylene emitters Off-chip [89]
Peptides Glass with external ESI needle Off-chip [90]
Peptides and proteins Glass with external ESI needle Off-chip [91]
Proteins Silicon nozzle [92]
Small molecules, proteins Glass with external ESI needle Off-chip [93]
Proteins PC with PC emitter Off-chip [94]
Proteins Glass On-chip [95]Glass with external ESI needle Off-chip
Proteins PMMA (poly(methyl methacrylate)) On-chip [96]
Carnitines Glass with external ESI needle Off-chip [97]
Drug molecules Glass with external ESI needle Off-chip [98]
Proteolytic digests Glass with external ESI needle Off-chip [99]
Small molecules Polymer Zeonor 1020 with external ESI needle Off-chip [100]
Protein digest Glass with external ESI needle Off-chip [101]
Proteins PET (poly(ethylene terephthalate)) On-chip [102]
Peptides PDMS with PDMS emitter Off-chip [103]
Small molecules and proteins Parylene C nozzle [104]
Peptides PDMS with external ESI needle Off-chip [105]
Peptides PC with emitter Off-chip [106]PMMC (poly(methyl methacrylate)) with emitter
Peptides SU-8 nozzle [107]
Drug molecules PDMS On-chip [108]
Protein digest Silicon nozzle [109]
Peptides Glassy carbon with external ESI needle Off-chip [110]
Proteins SU-8 nozzle [111]
Peptides PDMS with external ESI needle Off-chip [112]
Peptides PDMS with external ESI needle Off-chip [113]
Drug molecules SU-8 nozzle [114]
Proteins SU-8 with SU-8 emitter Off-chip [115]
Peptides PPM (porous polymer monolith) emitter [116]
Peptides PDMS with external ESI needle Off-chip [117]
Peptides PPM emitter On-chip [118]Proteins Micro ion spray source Off-chip [119]Methanol-water PC emitter array On-chip [120]
On-chip spraying
The on-chip spraying design is attractive due to its simplicity. The outlet can be
formed simply by dicing the chip and it is also free from deadvolume, since no

16
external spraying capillary or needle is needed for spraying. However, in the first
studies the solution exiting the channel resulted in problems by spreading on the
hydrophilic glass surface, which led to the formation of large liquid droplets (volume
of about 12 nl [80]). This wetting prevented the formation of a well-focused electric
field essential for the generation of stable electrospray [79]. In addition, such large
liquid droplets caused excessive band-broadening and sample dilution [84]. For
microchip separations combined with on-chip ESI-MS, in which peak volumes are
typically below 5 nl, any separation would be lost in the too large dead volume of the
electrospray cone [50]. Wetting was minimized by derivatizing the edge of the
glass[79,80], by pneumatically assisting the spray [85], and by fabricating the
microchip from a hydrophobic polymer [108]. Alternatively, on-chip spraying devices
can be fabricated using silicon [92,109] or various polymers such as parylene
[89,104], PC [120], PMMA [118], PDMS [103], and SU-8 [107]. Traditionally,
silicon has allowed very precise and small dimensions for the emitter (15 µm),
resulting in reliable and reproducible electrospray with signal stability and intensity
that are comparable to those obtained using a pulled capillary of similar dimensions
[92]. On the other hand, the polymers used are moldable to any shape and due to their
inherent hydrophobic character, they are suitable for use as ESI emitters with no
further modification procedures needed [54]. In addition, disposable microchip ESI-
MS devices can be made from polymers at low cost. However, the resistance of
different polymers to organic solvents will need to be explored in more detail.
Off-chip spraying
In off-chip spraying, a conventional fused-silica capillary [81,82], an ESI tip [86-
87,91] or embedded spraying capillary [105] is attached to the outlet of the
microchannel. Since a sharp electrospray tip or nozzle is used good ESI conditions are
more readily achieved, resulting in small, well-defined droplets that enhance both
sensitivity and resolution [121]. The ESI capillary can also be removed and replaced
if clogged, preserving the microfluidic device [84]. In addition, this design generally
results in performances comparable to those found for microcolumn separations [50].
However, precise low dead volume alignment of the ESI tip with the separation
channel [86] is essential for maintaining separation efficiency by preventing band-
broadening in these microchip designs [50]. An alternative design, a miniaturized
pneumatic nebulizer coupled with a subatmospheric liquid junction ESI interface can

17
be used [85,91,97,98,100,119]. In the liquid junction interface, a suitable solvent that
is continuously delivered with the aid of an external pump to the liquid junction
interface ensures the transport of the sample through the pneumatically assisted ESI
needle. Proper adjustment of the capillary ends and dimensions in the interface
ensures stable sample delivery to the spray and mixing of the CE buffer with a spray
solution from the liquid junction [85].
Both on-chip CE and on-chip LC separations have been used with microchip ESI-MS.
Zhang et al. recorded separation performance similar to that of standard CE
(separation efficiency >300 000 plates/meter) with on-chip CE separations of peptides
and tryptic digest on a glass chip followed by ESI-MS with a liquid junction-based
ESI interface [85]. Li et al. used a nanospray emitter on a glass chip for the on-chip
CE combined with ESI-MS of synthetic peptide mixtures [90]. Peptide separations
were conducted in less than 90 s with peak widths of approximately 2 s with low
nanomolar detection limits for various peptides and for in-gel digests of proteins. As
an estimation, less than 25 ng of original protein was used in the analysis. Deng et al.
used a glass chip for on-chip CE coupled with a miniature microsprayer via a
microliquid junction at the exit of the CE capillary channel for on-line ESI detection
of carnitine and selected acylcarnitines [97]. Carnitine and three acylcarnitines were
separated in less than 48 s with a measured CE separation efficiency of 2860 plates
(peak width at half-height method). An on-chip ESI-MS device [92], a benchtop
LC/MS, and fraction collection have recently been integrated into a commercial
analytical platform by Advion. Alternatively, it can be used as an infusion ESI-MS
interface. Another LC-based separation device, a microfluidic LC with ESI-MS
detection, was demonstrated [20,22]. The microfluidic device was comprised of a
laser-ablated enrichment column and a reversed-phase separation channel, integrated
rotary valve, and a nano ESI emitter embedded together in polyimide layers. The
device was connected to an external gradient capillary pump, and a microwell plate
autosampler for sample loading and mobile phase delivery. The system provided good
reproducibility of retention time and peak intensity with relative standard deviation
(RSD) values of less than 0.5% and 9.1%, respectively. Sensitivity measurements on
protein digests spiked into rat plasma provided a detection limit of 1-5 fmol. It is
commercially available from Agilent Technologies.

18
While the use of EOF and CE separations in microfluidics has several advantages,
such as its simplicity and the flat flow profile provided by the electroosmotic flow, the
reproducibility and robustness of the on-chip CE/ESI-MS microfluidic devices appear
challenging, and no commercially available analytical platform exists.
2.3 Low-flow rate APCI and APPI
In APCI [122,123] and in APPI [124,125], the ionization of gas-phase sample
molecules is initiated by electrons emitted by the corona discharge needle (Fig. 1) or
by a krypton discharge lamp emitting 10-eV photons, respectively. This is in contrast
to ESI, in which charge separation occurs in the liquid phase at the end of the
microchannel or capillary (section 2.2.1 Electrospray ionization).
H O3+H O3
+
O2
O2O2
O2
N2
H O2
N2
O2
MH+
S
S
SH+
O2
N2
M
SS
M
H O2 N2N2
M
H O2
MS
Corona dischargeneedle
M = analyte molecule= solvent moleculeS
+•
H O2+•
+•
+•
Figure 1. Schematic drawing of an atmospheric pressure chemical ionization.
For LC/MS and CE/MS using either APCI or APPI, the eluted compounds are
vaporized with the aid of nebulizer gas and heat. However, the gas-phase ionization
process also enables the use of GC for sample separation or direct gaseous sample
introduction.
APCI is an ionization technique that is capable of ionizing with high efficiency both
polar and ionic compounds in addition to neutral compounds [122,126]. Other
advantages of APCI over ESI include the use of both polar and nonpolar solvents and
the toleration of higher electrolyte concentrations. Furthermore, suppression of

19
ionization by the coeluting compounds is significantly less with APCI than with ESI
[127]. APPI has the same advantages as APCI, but is even more suitable for nonpolar
compounds [124]. Since the ionization occurs in the gas phase, only relatively small
and thermally stable compounds up to about 1000 amu can be analyzed.
LC/APCI-MS and LC/APPI-MS are widely used in environmental analysis, drug
discovery, metabolics, and bioanalytics [128-136 and references therein]. In addition,
APCI-MS without chromatographic separation was used in environmental analysis
[137-145] and real-time analysis of breath and volatile flavors [146-154]. GC/APCI-
MS was used successfully in environmental analysis in the 1980s [155-166]. In the
early 1990s Ravelsky et al. used GC/APPI-MS for a wide variety of small organic
molecules [167,168].
Commercial APCI and APPI ion sources have been designed primarily for
conventional LC at relatively high flow rates, typically above 50 µl/min, making them
incompatible for low-flow rate separations. To take full advantage of the benefits of
microfluidic devices (section 2.1.1 Introduction) and also the improved sensitivity
provided by cap- and nanoLC, a miniaturized ion source compatible with low flow
rates is essential.
Although some attempts have been made to facilitate APCI ion sources for flow rates
below 10 µl/min, these have been done either by custom-made sources or
modifications of commercial sources and they lack the concept of microchip-based
miniaturization. Tyrefors et al. constructed a custom-made interface for supercritical
fluid chromatography [169]. LODs (with S/N = 3) for anthracene and trilaurin were
about 1 ng and 10 pg, respectively. Repeatabilities (RSD%) of retention time and
relative peak height were 0.24% and 2.6%, respectively. The interface was later
modified by Nyholm et al. for high-temperature open-tubular LC to allow more
efficient vaporization of the liquid mobile phase prior to ionization [170]. The flow
rates of the mobile phase ranged between 0.1 and 1.6 µl/min. The mass flow
sensitivity of 7,8-benzoquinoline was 3 pg/s, corresponding to a concentration of 1
µM using a flow rate of 1 µl/min. Tanaka et al. modified a commercial APCI interface
to accommodate flow rates in the range of 1-10 µl/min for CE/APCI-MS [171]. The

20
modification was done by drilling a hole to the interface to accommodate a stainless
steel tube, providing coaxial sheath liquid flow, around the fused-silica sample
capillary. At a sheath liquid flow rate of 5 µl/min an occasionally unstable MS signal
was observed, presumably due to the breaking of electrical contact across the sheath
liquid, but increasing the sheath liquid flow rate up to 10 µl/min solved the problem.
Nilsson et al. compared CE with APPI-MS and ESI-MS using sheath liquid
interfacing in the analysis of small pharmaceuticals [172]. The flow rate of the sheath
liquid in CE/ESI-MS varied between 5 and 25 µl/min. The lower sheath liquid flow
rate gave a higher signal from the analytes but also resulted in increased background.
In the CE/APPI-MS experiment, the sheath liquid flow rates varied between 15 and
100 µl/min. No clear trends were observed for any of the analytes, supporting the
theory that APPI behaves as a mass-flow sensitive technique. Compared with ESI, the
APPI technique provided a cluster-free background, indicating that the APPI process
is less affected by nonvolatile salts in CE buffers and that a wider range of CE buffers
can be used in CE/APPI-MS analysis then in CE/ESI-MS. Kauppila et al.
demonstrated the use of the same nebulizer chip as used for microchip APCI (the
prototype microchip APCI) in dopant-assisted microchip APPI-MS [55]. Ionization in
the positive and negative ion modes was successfully achieved for naphthalenes and
the spectra were in general similar to those obtained with conventional APPI. The
micro-APPI was compatible for flow rates in the range of 0.05-5 µl/min and was most
efficient at 1-5 µl/min. A stable signal was demonstrated throughout a 5-h
measurement, which proved the excellent stability of microchip APPI.

21
2.4 DIOS
2.4.1 MALDI-MS
MALDI [173] is a soft, i.e. causing little fragmentation, MS ionization technique
widely used for large biomolecules (such as peptides, proteins, oligonucleotides, and
oligosaccharides) and synthetic polymers. In MALDI the sample is mixed with a
matrix, typically in the ratio of 1:1000, and spotted onto a target plate where the
mixture crystallizes. The three most commonly used matrices are 3,5-dimethoxy-4-
hydroxycinnamic acid (sinapinic acid), α-cyano-4-hydroxycinnamic acid (alpha-
cyano or alpha-matrix), and 2,5-dihydroxybenzoic acid (DHB). The crystallized
mixture is irritated with either an infrared (IR) or UV laser and the matrix transforms
the laser energy into excitation energy for the sample. The DI in MALDI is believed
to be a two-step process: primary ionization during or shortly after the laser pulse
followed by ion-molecule reaction in the expanding plume of desorbed material [174].
So far MALDI has been used only in a limited way for small molecules, because the
matrix causes background interference in the low-mass region (MW < 800). Recently,
it was shown that the analysis of small molecules with MALDI can be accomplished
by suppressing the matrix background at an appropriate analyte-to-matrix molar ratio
[175,176] or by using an ionic liquid matrix [177,178].
MALDI has also been combined with microfluidics. The groups of Laurell and
Marko-Varga developed a ‘microfabricated toolbox’ for protein identification, in
which the sample protein digest is spotted with a piezoelectric microdispenser into a
nanovial MALDI target plate and measured with MALDI-MS [179-183]. Liu et al.
demonstrated on-chip CE separation followed by off-line MALDI-MS detection of
proteins [184]. Mok et al. performed protein separation in a plastic chip placed on the
standard MALDI plate [185]. Brivio et al. physically incorporated a continuous-flow
microchip with integrated microdigestion reactor into the standard MALDI sample
plate of an MS instrument [186]. A high-density fully automated compact disc format
microfluidic system was developed for protein sample preparation prior to off-line
MALDI-MS analysis [26-27,187].

22
2.4.2 DIOS-MS
DIOS-MS is a relatively new MALDI-related technique introduced in 1999 by Wei et
al. [188]. In DIOS (Fig. 2) chemically etched pSi is used as a sample support and as a
substrate to assist ionization instead of the matrix compounds used in MALDI. The
fact that the addition of matrix is not needed reduces the sample preparation time and
produces high-quality mass spectra of low-MW (MW < 800) that are essentially free
of the background peaks encountered in MALDI [188-190]. A higher salt tolerance
was also suggested [189,191]. DIOS is a relatively soft ionization method and thus
typically results in efficient ionization with little fragmentation of the sample
molecule [192].
MS
Laser
pSi areas
Silicon substrate
Figure 2. Schematic drawing of desorption/ionization on silicon (DIOS).
The pore morphology and overall porosity greatly impact DIOS efficiency, providing
a suitable structure - a silicon 'skeleton' with up to 80% empty space [61,193] and
internal surface area up to 600 m2/cm3 [58] - for retention of analytes and solvent
molecules [189,190,194]. Pore sizes approximately 200 nm in depth and 50-100 nm in
diameter are best for a wide range of analytes [195]. In the case of UV-DIOS, the high
surface area and strong UV absorption of pSi promote energy transfer from the
substrate to the trapped analytes [189]. In the case of IR-DIOS, the IR laser excites the

23
vibrational groups of the solvent or the analyte itself, leading to desorption and
ionization of the surface solvent and analyte in the expanding plume [196,197].
The DI processes in DIOS have not yet been solved. It is currently believed that
surface roughness, not porosity, is the key element in DI. This was demonstrated with
various mechanically created roughness [196-198] or MEMS-created surface
structures, such as deposited nanostructured thin film [199], ordered silicon
nanocavity arrays [200], silicon nanowires [201], or various submicrometer structures
[202]. The formation of gas-phase ions is initiated on the surface of sharp crystal tips
that protrude out of the sample surface [195,201,203]. During laser irradiation, the
tips act as tiny antennas producing significant field enhancement in the vicinity of the
nanometer tip. Thus, the laser energy is efficiently focused onto a small area [201].
However, porosity plays an important role by creating a scaffold on which more
analytes and solvent molecules can be retained [200] (compared with rough surfaces)
and by resupplying the surface with analyte after a laser pulse [195].
Studies of the fundamentals of DIOS have shown that protonation is the favored
ionization process in DIOS [189,190,198,204]. Deprotonation [189,190,204] and
radical cation formation [203,205] were also observed. It was suggested that the
sources of protons in the positive-ion mode are the silicon hydride surface [189,204]
and residual solvents or contaminants on the surface [188,198]. Recently, Budimir et
al. [206] suggested that ionization in DIOS occurs in the gas phase. They observed
alkali-adduct homo- and heterotrimers with a defined statistical distribution and
concluded that the existence of this statistical distribution reflects a situation that
cannot exist in solution.
Significant improvements have been made to DIOS-MS through surface
modifications. Derivatization of the pSi can be used to make it more resistant to air
oxidation [190,204], ozone oxidation, and acid/base hydrolysis [207]. Derivatization
of the pSi can also serve to enhance DIOS-MS [194,207,208], provide a lower
background, and require less laser power for DI [204,207]. For example, very high
sensitivity, such as 800 ymol for des-Arg9-bradykinin, was attained using a silylated
pSi surface [207].

24
2.4.3 DIOS-MS applications
DIOS-MS has been widely applied for small molecule analysis such as drug
molecules [188,195,204,209-211], illicit drugs [212], and organic dye [203]. Peptides
and proteins have also been investigated, in more then half of the publications listed in
Table 2.
Table 2. DIOS-MS applications.
Analytes Note Reference
Small drug molecules, peptides Native and dodecyl-, ethyl-, phenyl-, and oxide-derivatized pSi [188]
Peptides, proteins Positive- and negative-ion mode [189]
Small molecules, peptides [190]
Exacrine tissue and single neuron [191]
Amino acids, peptides [192]
Small molecules, peptides Biotin-avidin-coated, silylated and oxidized pSi [194]
Forensics [195]
MALDI matrix compounds, peptides, proteins IR-DIOS-MS [196]
Peptides IR-DIOS-MS [197]
Organic dye Reduction of dye [203]
Small molecules Alkane-, alkene, and carboxylic acid-derivatized pSi [204]Positive- and negative-ion mode
Porphyrin derivatives [205]
Fatty acids Negative-ion mode [206]
Peptides Silylated oxidized pSi [207]
Proteins [208]
Small drug molecules, peptides AP-DIOS-MS [209]
Small drug molecules [210]
Small molecules, protein digest [211]
Amphetamines and fentanyls [212]
Proteins [213]
Proteins Perfluorinated surfacants [214]C8F17- and C18-derivatized pSi
Polypropyleneglycol mixtures [215]
Enzymatic reaction of the immobilized enzymes [216]
Enzyme-inhibition reactions [217]
Proteins [218]
Nucleic acid, carbohydrate and steroid analysis [219]
Pentose-borate complexes Silicon dioxide-derivatized pSi [220]
Catecholamines [221]
Cysteine sulfonic acid-containing peptides Positive- and negative-ion mode [222]

25
3. AIMS OF THIS STUDY
The overall aims of the study were to develop and evaluate new microchip-based
interfacing techniques for API-MS.
Specifically, the aims of the research were:
• to develop a miniaturized heated nebulizer for APCI-MS and evaluate its
performance as an interface for capLC/MS and GC/MS (I, II, III ).
• to test the suitability of DIOS-MS at atmospheric pressure for drug analysis,
evaluate its performance for quantitative analysis of drugs, and to clarify the
ionization mechanism for various low-molecular-weight compounds (IV, V ).

26
4. MATERIALS AND METHODS
The chemicals, samples, materials, instruments, analytical methods, and
microfabrication processes are briefly described in this section. The chemicals and
instruments are listed in tables, whereas the microfabrication processes and analytical
procedures are shortly described. More detailed descriptions can be found in the
original publications (I-V ).
4.1 Chemicals, materials, and instrumentation
The reference standards, chemicals, and materials used in this study are listed in Table
3. The purpose of each item is briefly noted.

27
Table 3. Standard compounds, chemicals, and materials used in the study.
Standard/chemical/material Manufacturer/supplier Note Publication
Midazolam Sigma-Aldrich (Germany) Reference standard IV
Hoffman-La Roche (Switzerland)
V
Propranolol Sigma-Aldrich Reference standard I,IV, V
Testosterone Sigma-Aldrich / Fluka (Switzerland) Reference standard I,IV, V
D3-Testosterone Sigma-Aldrich Reference standard IV
1-(Methylamine)-naphthalen Sigma-Aldrich Reference standard IV, V
2-Naphthyl acetic acid Sigma-Aldrich Reference standard IV
2-Naphtoic acid Sigma-Aldrich Reference standard IV
Ketoprofen Sigma-Aldrich Reference standard IV
Paracetamol Sigma-Aldrich Reference standard IV
Paracetamol glucuronide Sigma-Aldrich Reference standard IV
Angiotensin II Sigma-Aldrich Reference standard IV
1,4-Naphtaquinone Fluka Reference standard IV
9-Aminoacridine May & Baker (England) Reference standard V
Benzo[h]quinoline Sigma-Aldrich Reference standard V
Verapamil Sigma-Aldrich Reference standard I,V
4-Acridinol Fluka Reference standard V
Fluorescein Sigma-Aldrich Reference standard V
9-Acridinecarboxylic acid Fluka Reference standard V
Dopamine Fluka Reference standard I,V
Anthracene Fluka Reference standard V
9-methyl-9-anthracenecarboxylate Sigma-Aldrich Reference standard V
Acenaphthene Sigma-Aldrich Reference standard V
4-Bromo-1H-Pyrazole Sigma-Aldrich Reference standard V
4-Chloro-Benzenamine Sigma-Aldrich Reference standard V
9H-Carbazole B.D.H. (England) Reference standard V
2-Naphthalenecarboxylic acid Sigma-Aldrich Reference standard V
Naphthalene Merck (Germany) Reference standard V
2-Naphthalenol Sigma-Aldrich Reference standard V
Acridine Sigma-Aldrich Reference standard I

28
Table 3. (Continued)
Quinoline Acros (Belgium) Reference standard I
Benzaldehyde Sigma-Aldrich Reference standard II
2-Acetylnaphthalene Sigma-Aldrich Reference standard II
Anisole Fluka Reference standard II
Acetoacetone Merck Reference standard II
Dehydroisoandrosterone Sigma-Aldrich Reference standard III
Pregnenolone Sigma-Aldrich Reference standard III
Testosterone Sigma-Aldrich Reference standard III
Progesterone Sigma-Aldrich Reference standard III
Ammonia Merck Reagent I-III
Peroxide Merck Reagent I-III
Hydrogen chloride Merck Reagent I-III
Tetramethyl ammonium hydroxide Honeywell (Germany) Reagent I
Buffered hydrofluoric acid Merck Reagent I-III
Phosphoric acid Merck Reagent I
Acetic acid Merck/VWR Int. (Finland) Reagent I
Potassium hydroxide Merck Reagent II
2-Propanol Rathburn (UK) Reagent / solvent I,II,III,IV
AZ 4562 Clariant AZ, AG (Germany) Photoresist II, III
AZ 5214 AZ Electronic Materials, GmbH (Germany) Photoresist III
Chromium Testbourne Ltd (England) Reagent II,III
Platinum Kultakeskus Oy (Finland) Heater material II,III
Aluminum Testbourne Ltd (England) Heater material I
Hydrofluoric acid Merck/VWR Int. Reagent IV, V
Chlorotrimethylsilane Sigma-Aldrich Reagent III
Methanol J.T.Baker (Holland) Solvent I-V
Water Millipore (USA) Solvent I-V
Ethanol Primalco (Finland) Solvent IV, V
Acetone J.T.Baker Solvent I,II,III,V
Hexane Merck Solvent II
Acetonitrile Rathburn Solvent III

29
Table 3. (Continued)
N2 Whatman 75-720 generator (USA) Nebulizer/curtain /drying/collision gas
I,II,III,IV
N2 Woikoski (Finland) Nebulizer gas I
He Woikoski Carrier gas II
SF6 AGA (Finland) Etchant III
C4F8 AGA Etchant III
O2 AGA Etchant III
Ar AGA Reagent II,III
Air Atlas Copco (Belgium) Auxillary gas I,III
Pyrex 7740 glass Corning (USA) Substrate material I-III
Silicon wafers (100), <0.025 ohm cm resistivity
Okmetic (Finland) Substrate material I
Silicon wafers (100), >500 ohm cm resistivity
Okmetic Substrate material II,III
Epoxy Loctite (Finland) Epoxy glue I
High-temperature epoxy Cotronics (USA) Epoxy glue II,III
Nanoport Upchurch Scientific (USA) Fluidic connectors I-III
PEEK tubing, i.d. 50 µm, o.d. n µm Upchurch Scientific
Sample inlet capillary I
PEEK tubing, i.d. 510 µm, o.d. n µm Upchurch Scientific
Nebulizer gas inlet tubing I-III
FactorFour VF-5ms Varian (USA) GC column II
Deactivated fused-silica capillary, i.d. 0.15 mm, o.d. 0.22 mm SGE (USA) Sample inlet
capillary II
Capillary Column Butt Connector Supelco (USA) Column connector II
SymmetryShield RP18 (0.32 mm, 100 mm, 3.5 µm)a
Waters (USA) LC column III
XTerra MS C-18 (2.1 mm, 100 mm, 3.5 µm)a Waters LC column III
Deactivated fused-silica capillary, i.d. 50 µm, o.d. 220 µm SGE
Sample inlet capillary III
NanoTight Fitting Upchurch Scientific Column tubing fitting III
Darning needle Entaco Limited (England) Corona discharge needle
I-III
a (i.d., length, particle size)

30
4.2 Instrumentation
The instrumentation used in this study is listed in Table 4.
Table 4. Instrumentation used in the experimental work.
Instrumentation Model / type Manufacturer Publication
Mass spectrometer PE Sciex API-300 PE Sciex (Canada) I-III1100 LC/MSD Trap Agilent Technologies (USA) IVQ-Tof micro Waters Micromass (UK) V
Ion source APCI PE Sciex I-IIIAP-MALDI Mass Tech Inc. (USA) IV-V
Liquid chromatograph HP1050 Hewlett-Packard GmbH (Fed. Rep. Of Germany) I, III1100 Series Capillary LC system Agilent Technologies (Germany) III
Gas chromatograph HP5890A gas chromatograph Hewlett-Packard (West Germany) II
Syringe pump Harvard PHD 2000 Advanced Syringe Pump Harvard Apparatus Inc. (USA) I,IIINanopump Upchurch Scientific (USA) III
Loop injector Rheodyne 7725 Rheodyne (USA) I
Eluent flow splitter Acurate AC-100-VAR LC Packings (Switzerland) I
Thermometer Fluke 54 Series II Fluke Corporation (USA) I-III
Power supply GPS-3030 Good Will Instruments Co. Ltd (Taiwan) I, II
EPS EP-6515 EPS Stromversorgung GmbH (Germany) II, IIIHP E3632A Agilent Technologies IV-V
Nitrogen generator Atlas Copco Wilrijk (Belgium) I-III
Aligner Electronic Visions AL6-2 Electronic Visions (USA) I-III
Etcher STS ASE STS ASE (England) III
4.3 Microchip APCI-MS
4.3.1 Microfabrication process of the microchip APCI
The microchip APCI consists of two wafers: a silicon wafer and a Pyrex glass wafer.
The silicon wafer consists of fluidic inlets, vaporizer channel, and a nozzle. The
integrated heater was fabricated on the Pyrex glass wafer.
The prototype (Fig. 3a) had three through-wafer inlets: one for the sample and two for
the nebulizer gas (I ). The fluidic network was fabricated by anisotropic wet etching in
a 25 wt-% tetramethyl ammonium hydroxide solution at 80 °C. The etch rate was
about 0.5 µm/min and was minimized by etching from both sides of the wafer
simultaneously. The widths of the nebulizer gas and liquid sample channels were 300
µm and 120 µm, respectively, the channel depth was 190 µm. A 300-nm aluminum
layer was sputtered onto the Pyrex glass wafer to create the heater electrode and
31
contact pads. The two wafers were joined by anodic bonding. The wafer stack was
heated to 350 °C and a voltage of 300 V was applied for 15 min. The fluidic
connectors were glued onto the microchip with epoxy.
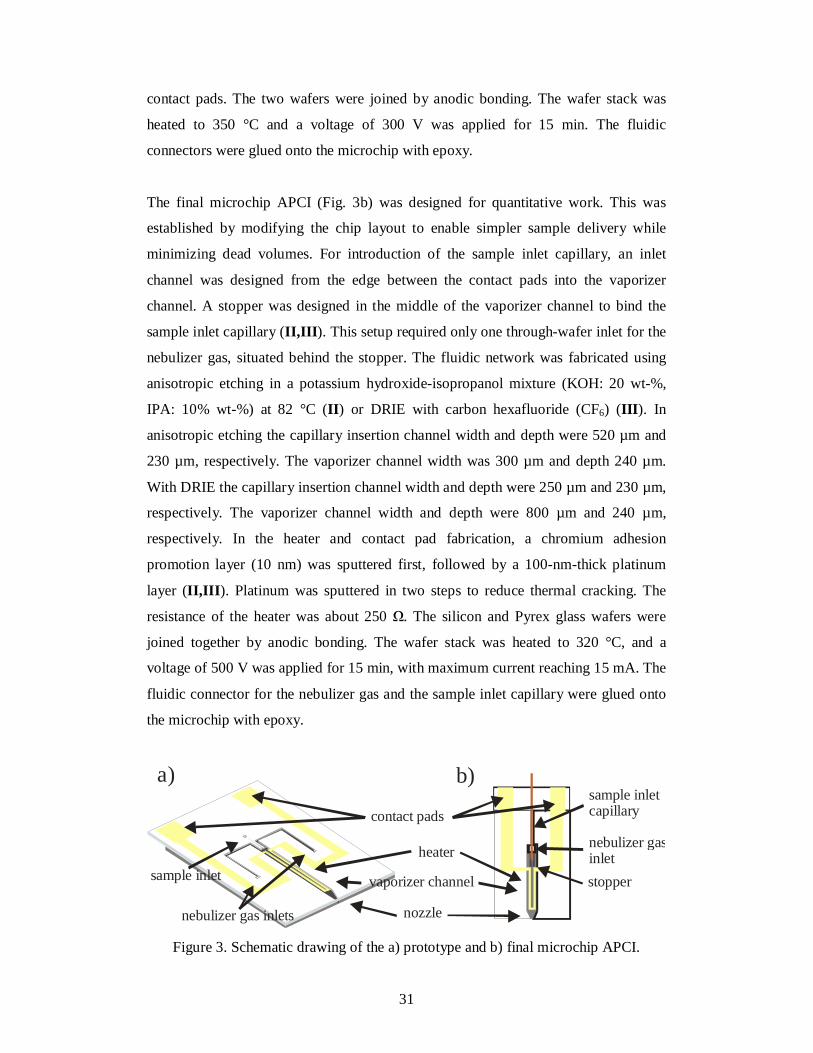
The final microchip APCI (Fig. 3b) was designed for quantitative work. This was
established by modifying the chip layout to enable simpler sample delivery while
minimizing dead volumes. For introduction of the sample inlet capillary, an inlet
channel was designed from the edge between the contact pads into the vaporizer
channel. A stopper was designed in the middle of the vaporizer channel to bind the
sample inlet capillary (II,III ). This setup required only one through-wafer inlet for the
nebulizer gas, situated behind the stopper. The fluidic network was fabricated using
anisotropic etching in a potassium hydroxide-isopropanol mixture (KOH: 20 wt-%,
IPA: 10% wt-%) at 82 °C (II ) or DRIE with carbon hexafluoride (CF6) (III ). In
anisotropic etching the capillary insertion channel width and depth were 520 µm and
230 µm, respectively. The vaporizer channel width was 300 µm and depth 240 µm.
With DRIE the capillary insertion channel width and depth were 250 µm and 230 µm,
respectively. The vaporizer channel width and depth were 800 µm and 240 µm,
respectively. In the heater and contact pad fabrication, a chromium adhesion
promotion layer (10 nm) was sputtered first, followed by a 100-nm-thick platinum
layer (II,III ). Platinum was sputtered in two steps to reduce thermal cracking. The
resistance of the heater was about 250 Ω. The silicon and Pyrex glass wafers were
joined together by anodic bonding. The wafer stack was heated to 320 °C, and a
voltage of 500 V was applied for 15 min, with maximum current reaching 15 mA. The
fluidic connector for the nebulizer gas and the sample inlet capillary were glued onto
the microchip with epoxy.
sample inlet
nebulizer gas inlets
stopper
nozzle
contact pads
sample inletcapillary
heater
vaporizer channel
a) b)
nebulizer gasinlet
Figure 3. Schematic drawing of the a) prototype and b) final microchip APCI.
32
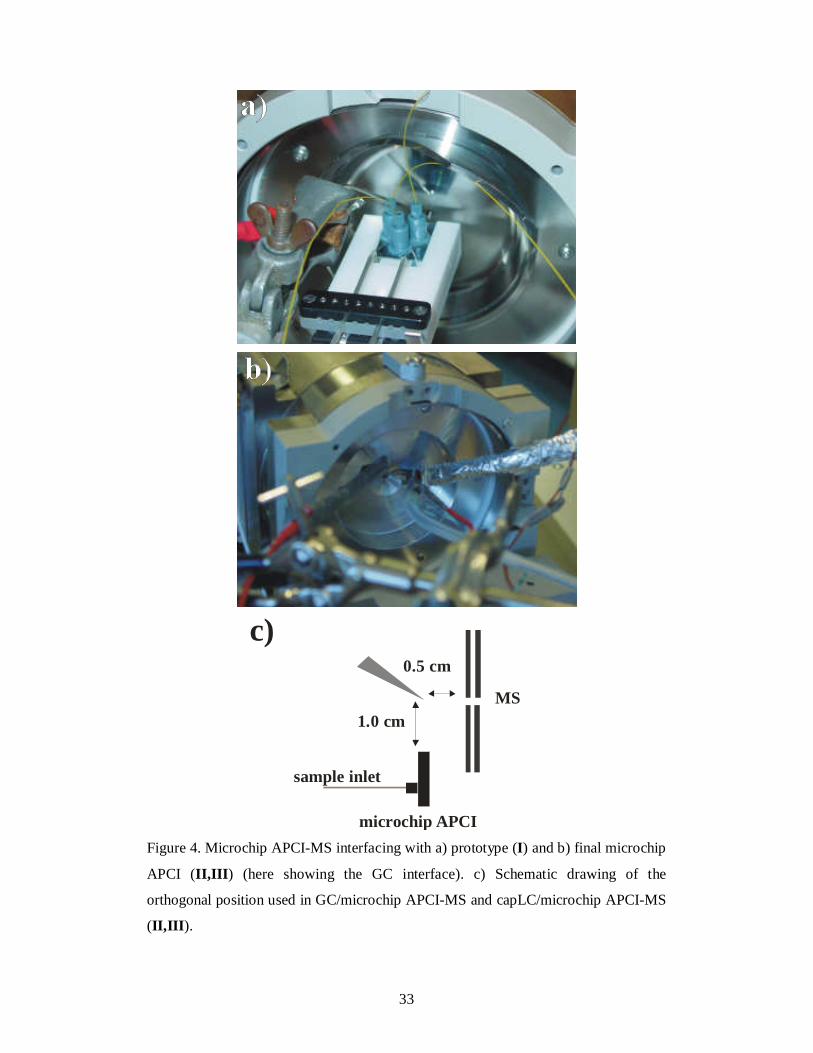
4.3.2 Microchip-MS interfacing setup
The microchip was mounted on the x,y,z-stage, which allowed easy optimization of
the position of the microchip in front of the MS inlet for the prototype (I ). The
optimal distance between the chip edge and the curtain plate was 0.5-1.0 cm (Fig. 4a).
The final microchip APCI (II,III ) was positioned 1 cm away from the MS orifice in
an orthogonal position (Figs. 4b and 4c). The orthogonal position gave much lower
background, especially in MS measurements. The external corona discharge needle
was a knitting needle .
The nebulizer gas was introduced into the microchip APCI via a 510 µm interal
diameter (i.d.) polyetheretherketone (PEEK™) tubing. The back pressure of the
nebulizer gas was optimized for each sample introduction method and ranged from
0.15 bar to 0.5 bar. The temperature of the microchip APCI was adjusted with an
external power supply and monitored with a commercial thermometer. Temperature
readings were taken at the silicon surface above the vaporizer channel and next to the
inlets.
In the GC/microchip APCI-MS work the metal transfer line from a commercial
GC/MS apparatus was extended with a self-made resistor wire heater that
encapsulated the sample inlet capillary. The metal transfer line, the self-made resistor
wire heater, and the microchip APCI were adjusted to an optimal temperature of 280
°C. For the human urine sample measurement the temperature was raised to 300 °C.
33
0.5 cm
1.0 cmMS
sample inlet
microchip APCI
c)
Figure 4. Microchip APCI-MS interfacing with a) prototype (I) and b) final microchip
APCI (II,III) (here showing the GC interface). c) Schematic drawing of the
orthogonal position used in GC/microchip APCI-MS and capLC/microchip APCI-MS
(II,III).

34
4.3.3 Characterization of the prototype microchip APCI-MS (I)
The performance of the microchip APCI was demonstrated in the analysis of six
compounds. The compounds were ionized in the positive- and negative-ion modes
and detected using selective ion monitoring (SIM) of the protonated molecule
([M+H] +), tandem MS (MS/MS) measurements using multiple reaction monitoring
(MRM) of two product ions, or collecting full-scan mass spectra over a range of m/z
100-500. The ion source and MS parameters were optimized for individual analytes.
The analytes were introduced into the microchip APCI by direct infusion via 50-µm
i.d. PEEK™ tubing. For flow rates higher than 1 µl/min, an LC with an autosampler
combined with a splitter was used. For flow rates lower than 1 µl/min, a microsyringe
pump combined with a loop injector was used. The analyte concentrations ranged
from1 nmol/l to 100 µmol/l. The solvent systems were based on pure methanol or
with mixtures of water-methanol (either 20/80 or 80/20 v/v) + 0.1% acetic acid.
Performance of the prototype microchip APCI with respect to performance of the
heater, signal current dependence on flow rate, stability of the ion current,
repeatability, and linearity was evaluated. The mass spectra and LODs of the analytes
obtained using microchip APCI and commercial APCI were compared.
4.3.4 GC/microchip APCI-MS (II)
The suitability of the microchip APCI-MS combined with GC was tested with a set of
relatively labile volatile organic compounds: acetoacetone, anisole, benzaldehyde, and
2-acetylnaphthalene. Positive ion APCI-MS and APCI-MS/MS methods were
optimized with regard to ion source parameters and fragmentation using direct
infusion. The position of the microchip APCI was optimized with respect to the MS
orifice, the external corona discharge needle position, and the nebulizer gas flow rate
by repeated injections of benzaldehyde and monitoring the signal of the [M+H]+. The
compounds were detected by SIM of the [M+H]+, MRM of two product ions, and
collecting full-scan mass spectra over a range of m/z 30-230.

35
The temperature program was optimized for the separation of the four analytes. A 15
m x 0.25 mm i.d. 5% phenyl-95% dimethylpolysiloxane column was used for
separation and helium as the carrier gas. The samples in hexane were injected
manually with splitless injection. The performance for quantitative work was
evaluated by determining the LODs, linearity of response, and repeatability.
The GC/microchip APCI-MS technique was applied for detection of underivatized
testosterone (TEST) from human urine sample. Sample pretreatment of human urine
sample consisted of enzymatic hydrolysis of steroid glucuronites followed by liquid
extraction at basic pH [223]. Prior to measurement the ethanol solvent was evaporated
to dryness and changed to hexane.
4.3.5 CapLC/microchip APCI-MS (III)
Four selected neurosteroids (dehydroisoandrosterone (DHEA), TEST, progesterone
(PROG), and pregnenolone (PREG)) were used as test compounds. Optimization of
the position of the microchip APCI with respect to the MS orifice was done by direct
infusion of TEST and monitoring the signal of the [M+H]+. The positive ion APCI-
MS/MS method was optimized with regard to the ion source parameters, using direct
infusion.
The capLC separation method was based on the method of Jäntti et al. [224]. The
capLC separations were carried out on a reverse-phase C18-capillary column (0.32
mm i.d. x 100 mm, particle size 3.5 µm) with a flow rate of 10 µl/min and a
water/methanol/acetonitrile-based gradient. A reference LC/APCI-MS method, with
the same gradient composition as the capLC/APCI-MS method and a reverse-phase
C18-column (2.1 mm i.d. x 100 mm, particle size 3.5 µm), was optimized with respect
to sensitivity and selectivity.
The performance of the microchip APCI for capLC/APCI-MS was investigated with
respect to LODs, linearity, and repeatability. The performance of the

36
capLC/microchip APCI-MS was compared with LC/APCI-MS with respect to the
LODs.
The surface of the vaporizer channel of the microchip APCI was deactivated by
simultaneous introduction of undiluted chlorotrimethylsilane with a flow rate of 50
µl/min through the nebulizer inlet and acetonitrile with a flow rate of 500 nl/min
through the sample inlet capillary with the heating power of the integrated heater set
to 1.2 W. Acetonitrile was introduced to prevent clogging of the sample inlet
capillary. After derivatization the microchip was washed with acetonitrile.
4.4 AP-DIOS-MS
The pSi spots were made by electrochemical etching of n-type Si wafers in a 1:1 (v/v)
solution of hydrofluoric acid (HF) and ethanol with simultaneous frontside and
backside illumination. The porous areas were defined with a stencil mask containing
an array of round holes, 1 mm in diameter. After the etching step the pSi sample
plates were rinsed and stored in ethanol. An additional HF treatment was performed
prior to usage to remove the oxide layer. The pSi sample plates were attached to an in-
house-modified AP-MALDI target plate with double-sided conductive tape.
The DIOS-MS measurements were done in both the positive- and negative-ion modes.
The MS instruments were operated with a pulsed nitrogen laser at 337 nm. The laser
pulse energy was either adjusted with an attenuator (IV) or fixed at a defined
attenuator value (V). Sample volumes of 0.4 µl (in units of 0.2 µl) were applied on the
pSi sample areas.
The feasibility of usin AP-DIOS in the analysis of small molecules was investigated
with respect to LODs, reproducibility, and linearity (IV). The compounds were
ionized in the positive- and negative-ion modes and detected by collecting full-scan
mass spectra over a range of m/z 100 to 500 or full scan MS/MS spectra over a range
of m/z 100 - 380. In addition, the ionization processes in the positive-ion mode in AP-
DIOS were more systematically investigated, with 20 compounds and propranolol
serving as external standard (V). The relative intensity of each analyte was calculated

37
from the ratio of the absolute intensity of a 100-µmol/l analyte to the intensity of 100
µmol/l propranolol. The 20 compounds were compared by the relative intensity of the
analyte as a function of its calculated PA value. Hybrid density functional theory
(DFT) calculations were used for the determination of the PA values of the reference
standards using the Gaussian 98 program (Gaussian, Inc., USA). The optimized
geometries for the neutrals and the protonated forms were computed at the B3LYP/6-
31G(d) level.

38
5. RESULTS AND DISCUSSION
The main results of the studies are shortly described in this chapter. Further details on
the experimental conditions, analytical and microfabrication procedures, and the
results can be found in the original publications (I-V).
5.1 Microchip APCI
5.1.1 Microchip characterization (I-III)
The microchip APCI was designed as a stable and durable interface for microfluidics,
GC/APCI-MS, and capLC/APCI-MS. Silicon and glass were chosen as substrates
based on their well-established microfabrication processes and advantage in material
properties, e.g. their excellent durability and high-temperature resistance. In
commercial APCI the sample liquid, nebulizer gas, and auxiliary gas flow
concentrically in three tubes while the microchip APCI is a two-dimensional structure
in which the nebulizer gas flows co-axially relative to the sample flow. The fluidic
network was fabricated on the silicon wafer and the heater on the glass wafer.
a) b)
Figure 5. a) Prototype microchip APCI with fluidic inlets attached. Chip size of 18 x
29 mm was mainly determined by the size of the fluidic connectors. b) The final
microchip APCI (in this study) with the nebulizer gas inlet and sample inlet capillary
present. Size of the microchip is 18 x 10 mm.

39
A prototype (Fig. 5a) was first fabricated with anisotropic silicon wet etching with an
integrated aluminum heater (I). This proof-of-concept showed that the microchip
APCI was capable of flow rates down to 50 nl/min and long-term analysis, and that it
produced highly stable ion current. Two approaches for the final design were
investigated (Fig. 5b). In the first (II), anisotropic silicon wet etching was used for
fabrication of the microchip. The second approach (III) utilized DRIE for fabrication.
Anisotropic wet etchings of silicon are limited by the silicon crystal orientation,
leaving the sidewalls of the channels at a 54.7° angle, and due to the long etching
times corner compensation structures are also required (Fig 6a). DRIE, however, is
independent of the crystal orientation and has excellent dimensional control. DRIE
allowed more precise feature shapes and vertical sidewalls (Fig. 6b). Furthermore,
DRIE had a 10-fold faster etching rate than anisotropic wet etching.
Figure 6. Scanning electron microscope pictures showing the nozzle of the microchip
APCI fabricated by a) wet etching and b) DRIE.
Of the two heater materials, aluminum and platinum, platinum proved superior. With
the aluminum heater the maximum continuous operating temperature was estimated to
be 150 °C. With the platinum heater, temperatures have been tested up to the glass-
softening temperature of about 600 °C [225], but the maximum operational surface
temperature limit, about 300 °C, was set by the epoxy glue used in connecting the
Nanoport™-assemblies. The platinum heater thus provides stable and long-term
operation even at high temperatures. The higher maximum operational surface
temperature of the platinum heater, compared with the aluminum heater, also provides
adequate temperature analysis of semivolatile compounds, as demonstrated in the
40
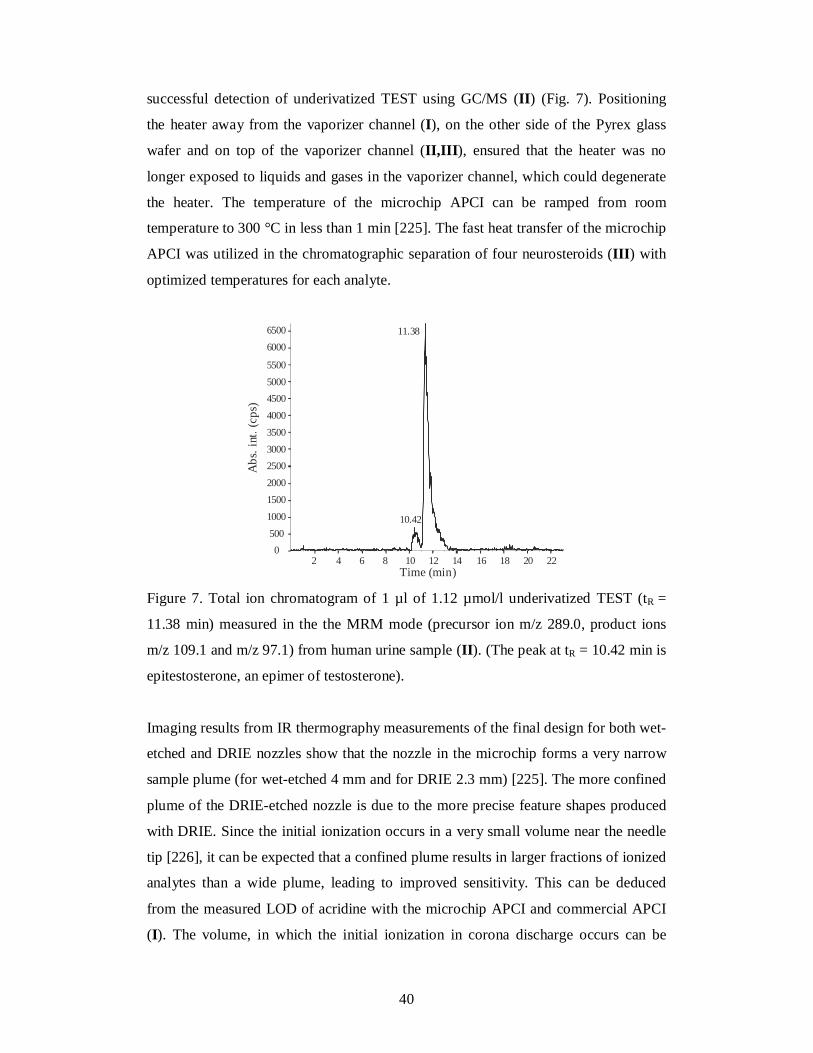
successful detection of underivatized TEST using GC/MS (II) (Fig. 7). Positioning
the heater away from the vaporizer channel (I), on the other side of the Pyrex glass
wafer and on top of the vaporizer channel (II,III), ensured that the heater was no
longer exposed to liquids and gases in the vaporizer channel, which could degenerate
the heater. The temperature of the microchip APCI can be ramped from room
temperature to 300 °C in less than 1 min [225]. The fast heat transfer of the microchip
APCI was utilized in the chromatographic separation of four neurosteroids (III) with
optimized temperatures for each analyte.
2 4 6 8 10 12 14 16 18 20 22Time (min)
0
500
1000
1500
2000
2500
3000
3500
4000
4500
5000
5500
6000
6500 11.38
10.42
Abs
. int
. (cp
s)
Figure 7. Total ion chromatogram of 1 µl of 1.12 µmol/l underivatized TEST (tR =
11.38 min) measured in the the MRM mode (precursor ion m/z 289.0, product ions
m/z 109.1 and m/z 97.1) from human urine sample (II). (The peak at tR = 10.42 min is
epitestosterone, an epimer of testosterone).
Imaging results from IR thermography measurements of the final design for both wet-
etched and DRIE nozzles show that the nozzle in the microchip forms a very narrow
sample plume (for wet-etched 4 mm and for DRIE 2.3 mm) [225]. The more confined
plume of the DRIE-etched nozzle is due to the more precise feature shapes produced
with DRIE. Since the initial ionization occurs in a very small volume near the needle
tip [226], it can be expected that a confined plume results in larger fractions of ionized
analytes than a wide plume, leading to improved sensitivity. This can be deduced
from the measured LOD of acridine with the microchip APCI and commercial APCI
(I). The volume, in which the initial ionization in corona discharge occurs can be

41
assumed to be similar for both APCI sources, since nearly identical corona discharge
needles are used with the same voltages. The sensitivity in terms of concentration was
comparable to that of commercial APCI but the mass flow sensitivity of the microchip
APCI was about 100-200 hundred times better (Table 5). This means that microchip
APCI can be used with significantly smaller sample volumes than macro-APCI,
without decreasing sensitivity in terms of the concentration in the sample.
Table 5. LOD of acridine with microchip APCI and commercial APCI (I).
Flow rate Limits of detection
[µl/min] Consentration Mass flow
[mol/l] [mol/s]
Microchip APCIa 6.2 5 * 10-9 500 * 10-18
Commercial APCI 6.2 75 * 10-9 14 * 10-15
Commercial APCI 1000 5 * 10-9 80 * 10-15
a prototype microchip APCI
Figure 8. a) Absolute intensity of [M+H]+ of acridine as a function of flow rate. The
injection volume was 1 µl and eluent was a water-methanol (20/80 v/v) solution. b)
Selected ion chromatogram of protonated acridine produced by direct infusion of
water-methanol (80/20 v/v) sample solution with flow rate of 1 µl/min. The
concentration of acridine in both measurements was 100 µmol/l.
The suitability of different flow rates was tested by monitoring the signal of the
[M+H] + of acridine at flow rates of 0.05-2.5 µl/min (I). The injection volume and
concentration were kept constant during the test. Since the intensity of the measured
42
ion current was directly proportional to the flow rate the test also confirmed that
microchip APCI-MS was a mass flow-dependent detector (Fig. 8a).
The durability of the prototype was evaluated by recording the ion current of the
[M+H] + of a sample compound, acridine, by direct infusion at constant flow rate (2.5
µl/min) (I). The prototype produced highly stable ion current and allowed continuous
operation for many hours with no problems (Fig. 8b). The highly stable performance
of the prototype was also reported by Kauppila et al. [55] and Franssila et al. [225].
5.1.2 GC/microchip APCI-MS (II)
The applicability of the GC/microchip APCI-MS for quantitative work was
investigated with four volatile organic compounds: acetoacetone, anisole,
benzaldehyde, and 2-acetylnaphthalene.
The optimized position of the corona discharge needle was in front of the orifice and
as close as possible to the MS orifice without disruptive discharge between the
discharge needle and MS. The position of the microchip APCI towards the corona
discharge needle was crucial for efficient ionization, implying the presence of a very
confined plume. When the position of the microchip APCI was varied only a few
millimeters, the signal strength in MS was extinguished altogether. The temperature
of the microchip APCI was adjusted to the same temperature as the commercial metal
GC transfer line and the optimum distance and nebulizer gas flow rate were 1 cm and
2.5 ml/sec, respectively.
The separation efficiency of the GC/microchip APCI-MS system was excellent, with
narrow and well-shaped peaks, typical of GC separations (Fig. 9). For example,
Ravindra et al. compared low-pressure GC/MS with conventional GC/MS in the
analysis of polycyclic aromatic hydrocarbons. They reported peak widths at half
height for low-pressure GC/MS and conventional GC/MS to be 0.025 min and 0.035
min, respectively (for fluoranthene) [227]. The peak half widths and peak asymmetry
factors of the compounds in our system were 0.02-0.04 min and 1.09-1.20,

43
respectively (Table 6). The dead volumes in the microchip APCI or adsorption to the
microchip walls did not contribute to peak broadening. In addition, no memory effects
were observed.
100
2 3 4 5 6 7 8 9 10 11 12 13Time (min)
4.46
12.57 2-acetylnapht alene
[M+H] m/z=171.2+
h
7.26
anisole
[M+H] m/z=109.2+
6.66
benzaldehyde
[M+H] m/z=107.2+
acetoacetone
[M+H] m/z=101.2+
norm
aliz
ed in
tens
ity
50
0
Figure 9. Overlay of selected ion chromatograms of the [M+H]+ of acetoacetone,
benzaldehyde, anisole, and 2-acetylnaphthalene. The injected sample volume was 1 µl
and the concentrations were 100 µmol/l.
Table 6. Retention times (tR), peak widths at half height (Wh), peak base widths (Wb),
theoretical plates (N), plates per length (N/L), and peak asymmetry (As) calculated
from selected ion chromatograms of the [M+H]+ of the compounds. The
concentrations were 100 µmol/l and injection volume was 1 µl.
Analyte tR Wh Wb N N/L As
[min] [min] [min]
Acetoacetone 4.45 0.03 0.284 118700 7900 1.09
Anisole 6.66 0.022 0.251 512400 34200 1.2
Benzaldehyde 7.24 0.039 0.134 191000 12700 1.2
2-Acetylnaphthalene12.6 0.03 0.504 964400 64300 0.97
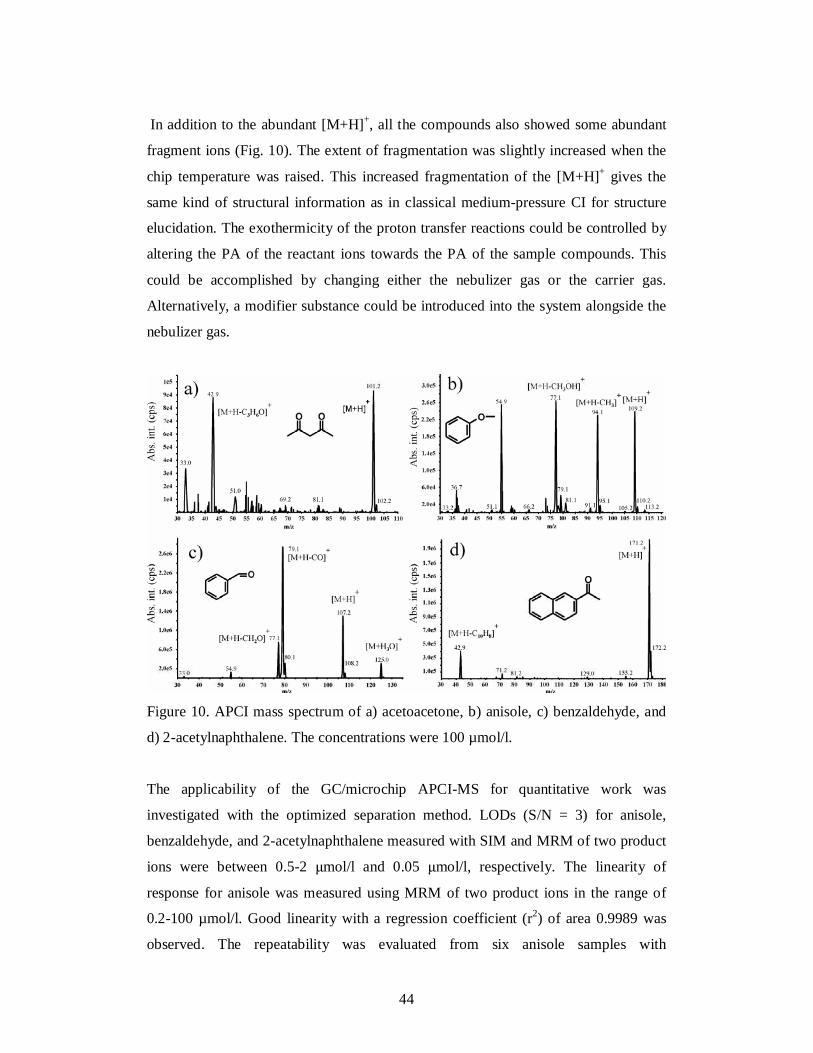
44
In addition to the abundant [M+H]+, all the compounds also showed some abundant
fragment ions (Fig. 10). The extent of fragmentation was slightly increased when the
chip temperature was raised. This increased fragmentation of the [M+H]+ gives the
same kind of structural information as in classical medium-pressure CI for structure
elucidation. The exothermicity of the proton transfer reactions could be controlled by
altering the PA of the reactant ions towards the PA of the sample compounds. This
could be accomplished by changing either the nebulizer gas or the carrier gas.
Alternatively, a modifier substance could be introduced into the system alongside the
nebulizer gas.
Figure 10. APCI mass spectrum of a) acetoacetone, b) anisole, c) benzaldehyde, and
d) 2-acetylnaphthalene. The concentrations were 100 µmol/l.
The applicability of the GC/microchip APCI-MS for quantitative work was
investigated with the optimized separation method. LODs (S/N = 3) for anisole,
benzaldehyde, and 2-acetylnaphthalene measured with SIM and MRM of two product
ions were between 0.5-2 µmol/l and 0.05 µmol/l, respectively. The linearity of
response for anisole was measured using MRM of two product ions in the range of
0.2-100 µmol/l. Good linearity with a regression coefficient (r2) of area 0.9989 was
observed. The repeatability was evaluated from six anisole samples with
45
concentrations of 2 µmol/l and measured with MRM of two product ions. The RSD (n
= 6) of the peak area was found to be 4.4%, indicating good repeatability. The LODs
are too early to compare between commercial GC/EI-MS and GC/microchip APCI-
MS, since a relatively old Sciex 300-mass spectrometer was used. The comparison
may reflect more the sensitivity of mass spectrometer itself than ionization efficiency
of EI and microchip APCI.
The system was finally tested with a human urine sample, which was originally
prepared for LC/MS/MS analysis of steroids. The TEST concentration of the sample
was 1.12 µmol/l (corresponding to 48.66 ng/ml). The concentration of TEST is close
to the minimum required performance limit (MRPL; 10 ng/ml for most steroids) with
normal GC-EI-MS set by World Anti-Doping Agency (WADA). Prior to
GC/microchip APCI-MS/MS measurement the ethanol solvent was evaporated to
dryness and changed to hexane. A new separation method and the temperatures of the
metal transfer line, self-made resistor wire heater, and the microchip APCI were
optimized for TEST. The detection of underivatized TEST in a complex biological
matrix (Fig. 7) shows the potential of the GC/API-MS system in bioanalysis.
5.1.3 CapLC/microchip APCI-MS (III)
The feasibility of the microchip APCI for capLC/APCI-MS was demonstrated with
four selected neurosteroids: TEST, DHEA, PROG, and PREG. A separation method
facilitating the optimal temperature conditions for each neurosteroid was developed
and the optimized method was used to evaluated the capLC/microchip APCI-MS
performance for quantitative analysis. The LODs acquired with capLC/microchip
APCI-MS were compared with those LODs acquired with LC/APCI-MS with a
commercial APCI source.
Taking advantage of the interfacing experiments described in GC/microchip APCI-
MS chapter (5.1.2), a similar interfacing was setup: the corona discharge needle was
mounted in front of the orifice and optimization of the microchip APCI with respect
to the corona discharge needle was done with direct infusion of TEST by monitoring

46
the signal intensity of the [M+H]+. The nebulizer gas back pressure was optimized to
a value of 0.35 bar.
A gradient system of water (soluent A) and water/methanol/acetonitrile (1/3/6 v/v/v)
(soluent B) in which the proportion of soluent B increased from 20% to 100% (v/v)
within 12 min provided best separation and ionization of the compounds. The capLC
runs were performed at a flow rate of 10 µl/min, a limit set by the capLC back
pressure. The microchip APCI temperature optimization was done by repeated
injections with increasing heating power and monitoring the MRM signal intensity of
the individual ion pairs.
In contrast to the GC/microchip APCI-MS experiment, adsorption of sample
compounds to the microchip APCI was observed. To minimize adsorptions and
chromatographic peak broadening the surface of the vaporizer channel of the
microchip APCI was deactivated with chlorotrimethylsilane (Fig. 11).
Figure 11. Merged MRM ion chromatogram (m/z 289.1 → 97.2 and m/z 289.1 →
109.2) of TEST with (a) undeactivated microchip APCI and (b) deactivated microchip
APCI. The concentrations were 100 nmol/l.
The separation efficiency of capLC/microchip APCI-MS (Fig. 12) was comparable to
that of capLC/ESI-MS [228] with peak widths at half height of 0.1-0.12 min and peak
base widths of 0.3-0.4 min. While the estimated dead volume of the DRIE-etched
microchip APCI was 1.5 µl, it did not, however, contribute to peak broadening. Since
the nebulizer gas flow rate was about 2.5 ml/s the entire vaporizer channel was
flushed in less than 1 ms. For quantitative analysis the capLC/microchip APCI-MS

47
provides good linearity with r2 value of the area varied between 0.9919 and 0.9994
and adequate repeatability with RSD (n = 6) varied between 12.7% and 18.9% (Table
8). LODs with an S/N of 3 were between 10 and 500 nmol/l. In comparison to a
commercial APCI source with the same MS and equal injection volume, the LODs
were about 10 times higher (Table 7) with the microchip APCI.
Figure 12. Overlay of extracted ion chromatograms of a) TEST and PROG and b)
DHEA and PREG. The concentrations were 1 µmol/l for TEST, PREG, and PROG,
and 10 µmol/l for DHEA. The second peak in the extracted ion chromatogram of
TEST is from DHEA.
Table 7. Linearity of response and repeatability of the capLC/microchip APCI-MS
system, and LODs (S/N=3) measured both with capLC/microchip APCI-MS and
LC/APCI-MS with a commercial APCI source. Linearity of response was measured
using MRM in the range of 200 nmol/l to 20 µmol/l for TEST, PREG, and PROG,
and 2 µmol/l to 200 µmol/l for DHEA. Repeatability was measured in MRM mode
with 10 µmol/l DHEA and 1 µmol/1 TEST, PREG and PROG, and an injection
volume of 2 µl.
Analyte Linearity of responseRepeatability Limits of detection (S/N=3)
(r2) (STD%, n=6) Microchip APCI Commercial APCI
TEST 0.9994 12.70% 0.01 µmol/l (20 fmola) 0.2 µmol/l (400 fmola)
DHEA 0.9946 14.90% 0.5 µmol/l (1 pmola) 5 µmol/l (10 pmola)
PROG 0.9928 15.70% 0.02 µmol/l (40 fmola) 0.2 µmol/l (400 fmola)
PREG 0.9919 18.90% 0.15µmol/l (300 fmola) 2 µmol/l (4 pmola)a injected amount.

48
5.2 AP-DIOS-MS
With the introduction of the AP-MALDI interface [228] DIOS under AP could also be
carried out. The main advantage of AP-DIOS relative to conventional vacuum DIOS
is that delay between the sample plate introduction to the ion source and the
measurement is minimized, since the sample plates are not transferred to vacuum.
This easier sample handling in API-DIOS enables higher sample throughput. In
addition, the AP-MALDI interface provides easier interfacing to existing API
instruments, including tandem instruments such as triple quadrupoles and ion traps.
DIOS operated using AP techniques are attractive to analytical laboratories requiring
high sample throughput, because the analyses are extremely rapid and are easily
automated.
The suitability of DIOS under AP for the analysis of small molecules was investigated
with unmodified n-type pSi. The MS operating parameters were optimized to
maximize the abundance of the [M+H]+. With AP-DIOS the signal was very stable
and lasted for at least 10 min in the ion trap instrument and about 5 minutes in the
quadrupole/time-of-flight instrument. This is in contrast to our earlier results with
vacuum DIOS [204], in which the signal lasted for only tens of seconds. A similar
long-lasting signal was reported by Pihlainen et al. [212]. This is because the
compounds are desorbed by the laser pulses from the pSi spot to the gas phase more
easily in a vacuum than under AP. The long-lasting signal is advantageous; e.g. in
reaction monitoring (required that the signal is stable) or structure characterization,
allowing operation of the instrument in different modes (negative- , positive-ion
mode, MS, and MS/MS measurements) with long accumulation times.
The mass spectra produced by the different AP instruments were very similar and
comparable to the mass spectra produced by vacuum DIOS (Fig. 13). Most
compounds showed an abundant [M+H]+ and the mass spectra were essentially clean
of background peaks at low mass ranges.
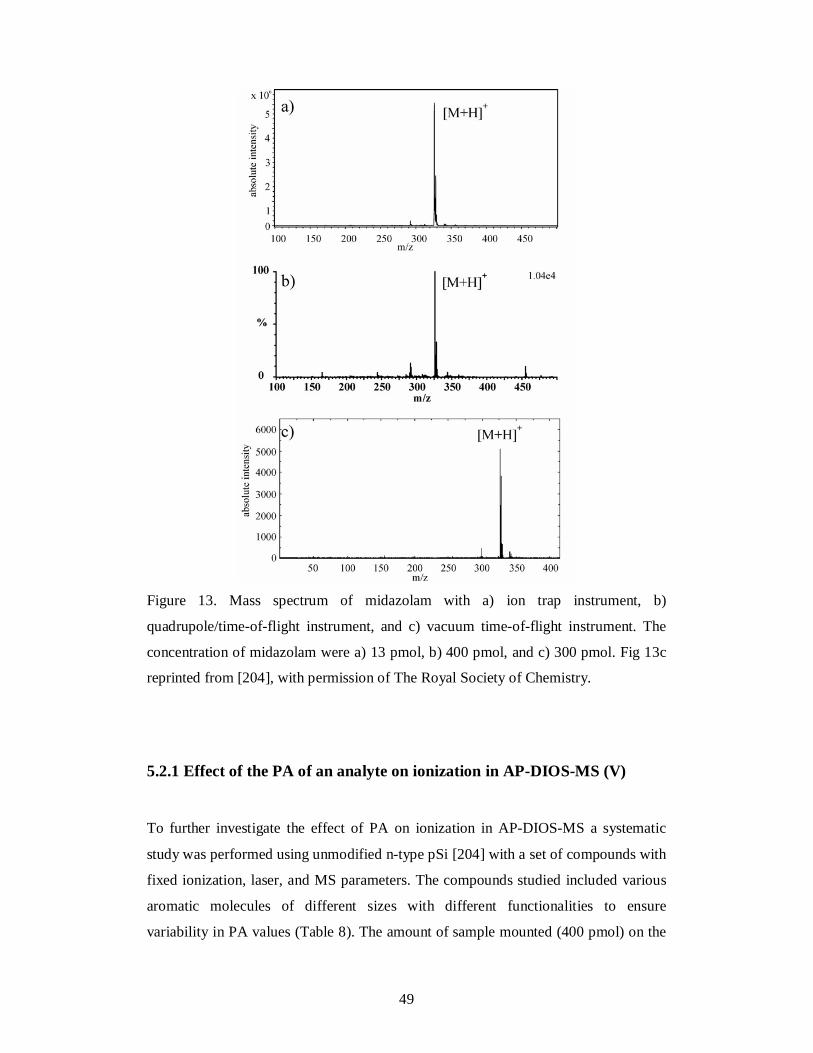
49
Figure 13. Mass spectrum of midazolam with a) ion trap instrument, b)
quadrupole/time-of-flight instrument, and c) vacuum time-of-flight instrument. The
concentration of midazolam were a) 13 pmol, b) 400 pmol, and c) 300 pmol. Fig 13c
reprinted from [204], with permission of The Royal Society of Chemistry.
5.2.1 Effect of the PA of an analyte on ionization in AP-DIOS-MS (V)
To further investigate the effect of PA on ionization in AP-DIOS-MS a systematic
study was performed using unmodified n-type pSi [204] with a set of compounds with
fixed ionization, laser, and MS parameters. The compounds studied included various
aromatic molecules of different sizes with different functionalities to ensure
variability in PA values (Table 8). The amount of sample mounted (400 pmol) on the

50
pSi area was selected such that good-quality mass spectra were obtained for
compounds that ionized easily, but at the same time was low enough to ensure that
direct laser DI was unlikely. A reference standard, propranolol, was used as an
external standard. It was applied to spots different from analytes on the same pSi
sample plate and measured after each sample measurement. The relative intensity of
each analyte was calculated from the ratio of the absolute intensity of a 100-µmol/l
analyte to the intensity of a 100-µmol/l external standard. The 20 compounds were
compared using the relative intensity of the analyte as a function of its calculated PA
value (Table 8).
Since the molecules studied included many compounds with unknown PA, the ab
initio and hybrid density functional calculations were performed to define the values
(Table 8). The lowest energy structures and the preferred protonation sites were first
determined using the HF/3-21G level of theory. The final geometry optimizations and
energy calculations of the most stable protonated and neutral molecules were carried
out using hybrid density functional theory calculations at the B3LYP/6-31G(d) level
of theory.

51
Table 8. Literature and calculated thermochemical values of the compounds.
Relative Calculated Reported
intensity PAb PAc
Compound vs propranolola [kJ/mol] [kJ/mol] Detected as
9-Aminoacridine 4,6 1045 - [M+H] +
Benzo[h]quinoline 4,6 972 973d [M+H] +
Verapamil 2,3 980 - [M+H] +
Midazolam 1,8 1002 - [M+H] +
Propranolol 1,0 987 - [M+H] +
4-Acridinol 0,9 985 - [M+H] +
Fluorescein 0,6 1014 - [M+H] +
Testosterone 0,3 925 - [M+H] +
9-Acridinecarboxylic acid 0,2 985 - [M+H] +
1-(Methylamine)-naphthalene 0 951 - [M+H - NH3]+
Dopamine - 940 - -
Anthracene - 911 877 -
9-Methyl-9-anthracenecarboxylate 0 896 - [M] +
Acenaphthene - 888 852 -
4-Bromo-1H-Pyrazole - 880 - -
4-Chloroaniline - 874 874 -
9H-Carbazole 0 870 - [M+M+H - H2]+
2-Naphthalenecarboxylic acid - 856 - -
Naphthalene - 841 803 -
2-Naphthalenol - 763 - -
a Signal intensity of a compound compared with the signal intensity of propranololb B3LYP/6-31G(d)+ZPE c [229]d PA of acridine
All compounds with calculated PA higher than 950 kJ/mol were ionized well, and
most of the compounds with a PA above 970 kJ/mol produced a very clean mass
spectrum with an abundant [M+H]+ (Fig. 14). The lower-than-expected ionization
efficiency of fluorescein, based on the calculated PA (Table 9), may be due to the
tautomeric equilibrium of fluorescein [230]. Only one of the three tautomeric
structures of fluorescein has the lactone ring and the conjugated double bonds; in two
other structures the lactone ring opens to form monoanion and dianion structures. In a
water-methanol solution, 46% of the fluorescein exists in lactone form, with the rest
in monoanion (48%) and dianion (6%) forms, which explains the low ionization
efficiency of fluorescein [231]. Protonation was also favored for 9-acridinecarboxylic
acid (Fig. 14i) and for 1-(methylamine)-naphthalene (Fig. 14j), but their [M+H]+
fragment easily by the neutral loss of formic acid or ammonia, respectively. Only
TEST (Fig. 14h) clearly appeared as [M+H]+ from the compounds having a PA below

52
950 kJ/mol. Dopamine was not observed at all, despite its relatively high PA (940
kJ/mol). However, vacuum DIOS was used to detect dopamine in the positive-ion
mode [221]. 9H-carbazole most likely produced a protonated dimer. Either a fragment
from that dimer or a radical cation was also observed (Fig. 14k). Methyl-9-
anthracenecarboxylate was detected as a radical cation (Fig. 14l).
Figure 14. AP-DIOS-MS spectra of a) 9-aminoacridine, b) benzo[h]quinoline, c)
verapamil, d) midazolam, e) propranolol, f) 4-acridinol, g) fluorescein, h)
testosterone, i) 9-acridinecarboxylic acid, j) 1-(methylamine)-naphthalene, k) 9H-
carbazole, and l) methyl-9-anthracenecarboxylate. The concentrations were 100 µM,
with 0.4 µl deposited on the pSi plate. m) An AP-DIOS-MS spectrum of the
background from a pSi sample plate without sample addition.

53
The high-PA compounds appear to ‘suppress’ the background. For example 9-
aminoacridine (Fig. 14a), benzo[h]quinoline (Fig. 14b), midazolam (Fig. 14d), and
propranolol (Fig. 14e) all produced clean mass spectra, whereas compounds with
lower PA or acid character, e.g. TEST (Fig. 14h) and 4-acridinol (Fig. 14f), had a
significantly increased background. Similar background suppression of high-PA
compounds was observed in MALDI with low matrix-analyte ratios [232,233].
Compounds with a PA higher than 920-950 kJ/mol were ionized efficiently as
[M+H] + in AP-DIOS-MS on unmodified pSi. Observation of the radical cation for
methyl-9-anthracenecarboxylate and the possible radical cation of 9H-carbazole may
indicate that if the ionization energy and PA of a compound is low enough (below
about 7.5 eV [229] and about 900 kJ/mol, respectively), formation of the radical
cation is possible. Radical cations were previously shown with DIOS [203,205] as
well as with other surface-assisted laser DI methods [196,234,235].
5.2.2 Suitability of AP-DIOS-MS for analysis of drugs (IV)
The suitability of AP-DIOS-MS for quantitative work was investigated with respect to
LODs, linearity of response, and repeatability. The LODs with an S/N ratio of 3 for
midazolam and propranolol in the MS mode were 80 fmol and 20 pmol, respectively,
and in the MS/MS mode 10 fmol and 5 pmol, respectively. The LODs for midazolam
and propranolol in the MS mode correspond well with those obtained earlier with
vacuum DIOS using time-of-flight mass spectrometry [204]. For Angiotensin II the
LOD was 1 pmol in the MS mode. AP-DIOS-MS showed good linearity with
dynamic linear ranges of three orders of magnitude. The linearity of the response was
measured for midazolam with the external standard method and for TEST with the
internal standard method in the range of 0.1-160 pmol and 35-555 pmol, respectively.
An r2 value of 0.991 was obtained for midazolam and a value of 0.994 was obtained
for TEST. The use of propranolol as an internal standard was also tested in the
quantitation of midazolam, but it failed to give reasonable results because midazolam
with higher PA suppressed propranolol. The repeatability of the AP-DIOS-MS
method was measured using 20 pmol of midazolam injected onto different pSi spots.
The RSD of the intensity of the [M+H]+ in seven measurements was 35%.

54
6. CONCLUSIONS
New microchip-based interfacing techniques for API-MS were investigated. A novel
miniaturized heated nebulizer for APCI-MS, the microchip APCI, was developed and
characterized. The performance of the microchip APCI was evaluated as an interface
for capLC/MS and GC/MS. Next, the suitability of DIOS-MS under AP for drug
analysis was investigated and the performance of AP-DIOS-MS for quantitative work
was evaluated. In addition, the ionization mechanism in AP-DIOS was further
investigated.
The microchip APCI provided stable, long-term analysis with high sensitivity from
minimal sample volumes. Good separation efficiency, repeatability and linearity for
both the GC/microchip APCI-MS system and the capLC/microchip APCI-MS
systems were obtained. The mass flow sensitivity of the microchip APCI was about
100-200 times better then commercial APCI ion source making it directly compatible
with low-flow rate separation systems, microfluidic systems, as well as with nano-
and capLC, without loss in sensitivity. In fact, the microchip can be used as an
interface to any API-MS equipped with an APCI source without modifications to the
commercial source. Since ionization is initiated with an external corona discharge
needle the ionization process is independent of flow rate. This is in contrast to
microchip ESI-MS where efficient ionization is limited to a narrow flow rate range
determined by the channel and ESI tip geometry. In addition, the current applied to
the discharge needle does not interfere with possible CE separation. The microchip
APCI can be used as a separate interface as demonstrated, or it can be eventually
integrated into a µ-TAS microchip with integrated injection, fluid handling, and
separation.
The AP-DIOS-MS was very similar to vacuum DIOS-MS. The mass spectra were
essentially free of the background peaks at low-MW (< 800 amu). The systematic
study of the effect of the PA of a compound on ionization in AP-DIOS-MS on
unmodified pSi showed that only compounds with a PA higher than 920-950 kJ/mol

55
were ionized efficiently as [M+H]+, suggesting gas-phase ionization. AP-DIOS-MS is
suitable for quantitative work. The main advantage of AP-DIOS over vacuum DIOS is
that AP-MALDI provides easier interfacing with existing API instruments and easier
sample transfer than with vacuum MALDI instruments. Since the sample plate is not
transferred to vacuum AP-DIOS enables even higher sample throughput than
conventional vacuum DIOS. The observed value of 920-950 kJ/mol in PA clearly
excludes nearly all neutral and less polar small organic molecules from AP-DIOS-MS
analysis on unmodified pSi and empathizes the need for surface modifications. AP-
DIOS-MS appears to be best suited for very rapid qualitative screening of polar
compounds, such as in forensics or proteomics.

56
ACKNOWLEDGEMENTS
This study was carried out in the Division of Pharmaceutical Chemistry and in Viikki
Drug Discovery Technology Center (DDTC), Faculty of Pharmacy, University of
Helsinki, during the years 2002-2006.
I am most grateful to my supervisors prof. Risto Kostiainen and prof. Tapio Kotiaho
for this opportunity to work at the Division of Pharmaceutical Chemistry. I thank
them for introducing me to the world of microfluidics, for deeper understanding of
mass spectrometry, but most importantly for their guidance, invaluable advises and
constant support during these years.
I want to thank all co-authors for their contribution to the work. Special thanks go to
Dr. Sami Franssila, Dr. Kestas Grigoras, Dr. Karti Huikko, Dr. Raimo A. Ketola, Dr.
Friedrich Mandel, Seppo Marttila, Dr. Jaana Pakarinen, Ville Saarela, Dr. Christian
Sauber, and Prof. Pirjo Vainiotalo for their contribution to this work. Prof. Jonas
Bergquist and Docent Seppo Auriola are acknowledged for their careful review of this
manuscript and for their valuable comments.
I also wish to thank Markus, Tiina, Piude, Inkku, Tiina, Sirkku, Päivi, Niina, Laura,
Kati, Kata, Kirsi, Mikko and all the other colleagues at the Division of Pharmaceutical
Chemistry. I am deeply grateful to Sami, Kestas, Ville, Santeri and Seppo in the
Micro- and Nanofabrication Centre (Helsinki University of Technology), Marc in the
Protein Chemistry Unit (Helsinki Biomedicum, University of Helsinki), and the
people in Environmental Chemistry and Environmental Analytical Chemistry
(Laboratory of Analytical Chemistry, University of Helsinki) for collaboration. In
addition, I wish to thank Kai Kolari (VTT Center for Microelectronics) for helping
with the DRIE process.

57
Finally, I extend my warmest thank to my wife Paula for her patience and support
during this project. Sincere thanks are also to my parents and parents-in-law for all
their support.
Financial support from the Finnish National Technology Agency TEKES, the
Academy of Finland, the Jenny and Antti Wihuri Foundation, and CHEMSEM
graduate school as well as instrumental support from Agilent Technologies are
gratefully acknowledged.

58
REFERENCES
[1] Terry S.C. and Angell J.B. Des.Biomed. Appl. Solid State Chem. Sens., Workshop (1978), Meeting date 1977, 207.
[2] Manz A., Graber N., and Widmer H.M. Sens. Actuators B (1990) 244. [3] Liu Y., Garcia C.D., and Henry C.S. Analyst 2003, 128, 1002. [4] Dupuy A.M., Lehmann S., and Cristol J.P. Clin. Chem. Lab. Med. 2005 43,
1291. [5] Yi C., Li C.-W., Ji S., and Yang M. Anal. Chim. Acta 2006, 560, 1. [6] Dolnik V. and Liu S. J. Sep. Sci. 2005, 28, 1994. [7] Kelly R.T. and Woolley A.T. Anal. Chem. 2005, 77, 96A. [8] Sun Y and Kwok Y.C. Anal. Chim. Acta 2006, 556, 80. [9] Watts P. and Haswell S.J. Cur. Opp. Chem. Bio. 2003, 7, 380. [10] Dittrich P.S. and Manz A. Nature Reviews 2006, 5, 210. [11] Pihl J., Karlsson M., and Chiu D.T. DDT 2005, 10, 1377. [12] Laurell T., Nilsson J., and Marko-Varga G. Anal. Chem. 2005, 77, 264A. [13] Huikko K., Kostiainen R., Kotiaho T. E. J. Pharm. Scie. 2003, 20, 149. [14] Cooper J.W., Wang Y., and Lee C.S. Electrophoresis 2004, 25, 3913. [15] Marle L. and Greenway G.M. Trends Anal. Chem. 2005, 24, 795. [16] Ramos L., Ramos J.J., and Brinkman U.A.Th. Anal. Bioanal. Chem. 2005,
381, 119. [17] Chena G.,Lin Y., and Wang J. Talanta 2006, 68, 497. [18] Jakobson S.C., Culbertson C.T., Daler J.E., and Ramsey J.M. Anal. Chem.
1998, 70, 3476. [19] Culbertson C.T., Jacobson S.C., and Ramsey J.M. Anal. Chem. 2000, 72,
5814. [20] Yin H., Killeen K., Brennen R., Sobek D., Werlich M., and van de Goor T.
Anal. Chem. 2005, 77, 527.

59
[21] Shintani Y., Hirako K., Motokawa M., Iwano T., Zhou X., Takano Y., Furuno
M., Minakuchi H., and Ueda M. J. Chromatogr. A, 2005, 1073, 17. [22] Fortier M.-H., Bonneil E., Goodley P., and Thibault P. Anal. Chem. 2005, 77,
1631. [23] Lazar I.M. and Karger B.L. Anal. Chem. 2002, 74, 6259. [24] Lazar I.M., Trisiripisal P., and Sarvaiya H.A. Anal. Chem. 2006, 78,5513. [25] Ehrnström, R. Lab Chip 2002, 2, 26N. [26] Gustafsson M., Hirschberg D., Palmberg C., Jörnvall H., and Bergman T.
Anal. Chem. 2004, 76, 345. [27] Hirschberg D., Jägerbrink T., Samskog J., Gustafsson M., Ståhlberg M.,
Alvelius G., Husman B., Carlquist M., Jörnvall H., and Bergman T. Anal. Chem. 2004, 76, 5864.
[28] Duffy D.C., Gillis H.L., Lin J., Sheppard Jr. N.F., and Kellogg G.J. Anal.
Chem. 1999, 71, 4669–4678. [29] Weigl B.H., Bardell R.L., Kesler N., and Morris C.J. Fresenius J. Anal. Chem.
2001, 371, 97. [30] Jandik P., Weigl B.H., Kessler N., Cheng J., Morris C.J., Schulte T., and
Avdalovic N. J. Chromatogr. A 2002, 954, 33. [31] Wilson D.J. and Konermann L. Anal. Chem. 2005, 77, 6887. [32] Yu C., Davey M.H., Svec F., and Fréchet J.M.J. Anal. Chem. 2001, 73, 5088. [33] Bhattacharyya, A. and Klapperich, C. M. Anal. Chem. 2006, 78, 788. [34] Kutter J.P., Jacobson S.C., and Ramsey, J.M. J. Microcolumn Sep. 2000, 12,
93. [35] Oleschuk R.D., Shultz-Lockyear L.L., Ning Y.B., and Harrison D.J. Anal.
Chem. 2000, 72, 585. [36] Ramsey J.D. and Collins G.E. Anal. Chem. 2005, 77, 6664. [37] Jemere A.B., Oleschuk R.D., Ouchen F., Fajuyigbe F., and Harrison D.J.
Electrophoresis 2002, 23, 3537. [38] Chiesl T.N., Shi W., and Barron A.E. Anal. Chem. 2005, 77, 772. [39] Lion N., Gellon J.-O., Jensen H., and Girault H.H. J. Chromatogr. A 2003,
1003, 11.

60
[40] Foote R.S., Khandurina J., Jacobson S.C., and Ramsey J.M. Anal. Chem. 2005,
77, 57. [41] Wang X.Y., Saridara C., and Mitra S. Anal. Chim. Acta 2005, 543, 92. [42] Janasek D., Franzke J., Manz A. Nature 2006, 442, 374-380. [43] Vandaveer IV W.R., Pasas-Farmer S.A., Fischer D.J., Frankenfeld C.N., and
Lunte S.M. Electrophoresis 2004, 25, 3528. [44] Fiaccabrino G.C., de Rooij N.F., and Koudelka-Hep M. Anal. Chim. Acta
1998, 359, 263. [45] Arora A., Eijkel J.C.T., Morf W.E., and Manz A. Anal. Chem. 2001, 73, 3282. [46] Burggraf N., Krattiger B., de Mello A.J., de Rooij N.F., and Manz A. Analyst
1998, 123, 1443. [47] Kameoka J. and Craighead H.G. Sens. Actuators B 2001, 77, 632. [48] Firebaugh S.L., Jensen K.F., and Schmidt M.A. J. Appl. Phys. 2002, 92, 1555. [49] Ro K.W., Lim K., Shim B.C., and Hahn J.H. Anal. Chem. 2005, 77, 5160. [50] Lazar I.M., Grym J., and Foret F. Mass Spectrometry Reviews 2006, 25,573. [51] de Mello A.J. Lab Chip 2001, 1, 7N. [52] Auroux P.-A., Iossifidis D., Reyes D.R., and Manz A. Anal. Chem. 2002, 74,
2637. [53] Limbach P.A. and Meng Z. Analyst 2002, 127,693. [54] Sung W.-C., Makamba H., and Chen S.-H. Electrophoresis 2005, 26, 1783. [55] Kauppila T.J., Östman P., Marttila S., Ketola R.A., Kotiaho T., Franssila S.,
and Kostiainen R. Anal. Chem. 2004, 76, 6797. [56] Manz A., Harrison D.J., Verpoorte E.M.J., Fettinger J.C., Paulus A., Lüdi H.,
and Widmer H.M. J. Chromatogr. A 1992, 593, 253. [57] de Mello A.J. Lab Chip 2002, 2, 31N. [58] Fintschenko Y. and van den Berg A. J. Chromatogr. A 1998, 819, 3. [59] Madou M. Fundamentals of Microfabrication, CRC Press, New York, 1997. [60] Elwenspoek M.C. and Jansen H.V. Silicon Micromachining, Cambridge
University Press, Cambridge, 1998.

61
[61] Franssila S. Introduction to Microfabrication, John Wiley & Sons, Chichester,
2004. [62] Dario P., Carrozza M.C., Croce N., Montesi M.C., and Cocco M. J.
Micromech. Microeng. 1995, 5, 64. [63] Diepold T. and Obermeier E. J. Micromech. Microeng. 1996, 6, 29. [64] Anthony T. R. J. Appl. Phys. 1981, 52, 5340. [65] Li X., Abe T., and Esashi M. Sens. Actuators A 2001, 87, 139. [66] Li X., Abe T., Liu Y., and Esashi M. J. MEMS 2002, 11, 625. [67] Ichiki T., Sugiyama Y., Taura R., Koidesawa T., and Horiike Y. Thin Solid
Films 2003, 435, 62. [68] Park J.H., Lee N.-E., Lee J., Park J.S., and Park H.D. Microelectronic
Engineering 2005, 82, 119. [69] Becker H. and Gärtner C. Electrophoresis 2000, 21, 12. [70] Kirby B.J. and Hasselbrink E.F. Jr. Electrophoresis 2004, 25, 203. [71] Heuschkela M.O., Guérina L., Buissonb B., Bertrandb D., and Renauda P.
Sens. Actuators B 1998, 48, 356. [72] Tuomikoski S. and Franssila S. Sens. Actuators A 2005, 120, 408. [73] Dole M., Mack L.L., Hines R.L., Mobley R.C., Ferguson L.D., and Alice M.B.
J. Chem. Phys. 1968, 49, 2240. [74] Yamashita M. and Fenn J.B. J. Phys. Chem. 1984, 88, 4451. [75] Yamashita M. and Fenn J.B. J. Phys. Chem. 1984, 88, 4671. [76] Mann M., Meng C.K., and Fenn, J.B. Anal. Chem. 1989, 61, 1702. [77] Fenn J.B., Mann M., Meng C.K., Wong S.F., and Whitehouse C.M., Science
1989, 246, 64. [78] Wilm M. and Mann M. Anal. Chem. 1996, 68, 1. [79] Xue Q., Foret F., Dunayevskiy Y.M., Zavracky P.M., McGruer N.E., and
Karger B.L. Anal. Chem. 1997, 69, 426. [80] Ramsey R.S. and Ramsey J.M. Anal. Chem. 1997, 69, 1174. [81] Figeys D., Ning Y., and Aebersold R. Anal. Chem. 1997, 69, 3153.

62
[82] Figeys D., Gygi S.P., McKinnon G., and Aebersold R. Anal. Chem. 1998, 70,
3728. [83] Xiang F., Lin Y., Wen J., Matson D.W., and Smith R.D. Anal. Chem. 1999,
71, 1485. [84] Li J., Thibault P., Bings N.H., Skinner C.D., Wang C., Colyer C., and Harrison
J. Anal. Chem. 1999, 71, 3036. [85] Zhang B., Liu H., Karger B.L., and Foret F. Anal. Chem. 1999, 71, 3258. [86] Bings N.H., Wang C., Skinner C.D., Colyer C.L., Thibault P., and Harrison
D.J. Anal. Chem. 1999, 71, 3292. [87] Lazar I.M., Ramsey R.S., Sundberg S., and Ramsey J.M. Anal. Chem. 1999,
71, 3627. [88] Chan J.H., Timperman A.T., Qin D., and Aebersold R. Anal. Chem. 1999, 71,
4437. [89] Licklider L., Wang X.-Q., Desai A., Tai Y.-C., and Lee T.D. Anal. Chem.
2000, 72, 367. [90] Li J., Kelly J.F., Chernushevich I., Harrison D.J., and Thibault P. Anal. Chem.
2000, 72, 599. [91] Zhang B., Foret F., and Karger B.L. Anal. Chem. 2000, 72, 1015. [92] Schultz G.A., Corso T.N., Prosser S.J., and Zhang S. Anal. Chem. 2000, 72,
4058. [93] Pinto D.M., Ning Y., and Figeys D. Electrophoresis 2000, 21, 181. [94] Wen J., Lin Y., Xiang F., Matson D.W., Udseth H.R., and Smith R.D.
Electrophoresis 2000, 21, 191. [95] Lazar I.M., Ramsey R.S., Jacobson S.C., Foote R.S., and Ramsey J.M. J.
Chromatogr. A 2000, 892, 195. [96] Yuan C.-H. and Shiea J. Anal. Chem. 2001, 73, 1080. [97] Deng Y., Henion J., Li J., Thibault P., Wang C., and Harrison D.J. Anal.
Chem. 2001, 73, 639. [98] Deng Y., Zhang H., and Henion J. Anal. Chem. 2001, 73, 1432. [99] Lazar I.M., Ramsey R.S., and Ramsey J.M. Anal. Chem. 2001, 73, 1733.

63
[100] Kameoka J., Craighead H.G., Zhang H., and Henion J. Anal. Chem. 2001, 73, 1935.
[101] Zhang B., Foret F., and Karger B.L. Anal. Chem. 2001, 73, 2675. [102] Rohner T.C., Rossier J.S., and Girault H.H. Anal. Chem. 2001, 73, 5353. [103] Kim J.-S. and Knapp D.R. J. Am. Soc. Mass Spectrom. 2001, 12, 463. [104] Kameoka J., Orth R., Ilic B., Czaplewski D., Wachs T., and Craighead H.G.
Anal. Chem. 2002, 74, 5897. [105] Chiou C.-H., Lee G.-B., Hsu H.-T., Chen P.-W., and Liao P.-C. Sens.
Actuators B 2002, 86, 280. [106] Svedberg M., Pettersson A., Nilsson S., Bergquist J., Nyholm L., Nikolajeff
F., and Markides K. Anal. Chem. 2003, 75, 3934. [107] Le Gac S., Arscott S., and Rolando C. Electrophoresis 2003, 24, 3640. [108] Huikko K., Östman P., Grigoras K., Tuomikoski S., Tiainen V.M., Soininen
A., Puolanne K., Manz A., Franssila S., Kostiainen R., and Kotiaho T. Lab Chip 2003, 3, 67.
[109] Sjödahl J.,Melin J., Griss P., Emmer Å., Stemme G., and Roeraade J. Rapid
Commun. Mass Spectrom. 2003, 17, 337. [110] Ssenyange S., Taylor J., Harrison D.J., and McDermott M.T. Anal. Chem.
2004, 76, 2393. [111] Arscott S., Le Gac S., Druon C., Tabourier P., and Rolando C. Sens. Actuators
B 2004, 98, 140. [112] Dahlin A.P., Bergström S.K., Andrén P.E., Markides K.E., and Bergquist J.
Anal. Chem. 2005, 77, 5356. [113] Thorslund S., Lindberg P., Andrén P.E., Nikolajeff F., and Bergquist J.
Electrophoresis 2005, 26, 4674. [114] Tuomikoski S., Sikanen T., Ketola R.A., Kostiainen R., Kotiaho T., and
Franssila S. Electrophoresis 2005, 26, 4691. [115] Carlier J., Arscott S., Thomy V., Camart J.-C., Cren-Olivé C., and Le Gac S. J.
Chromatogr. A 2005, 1071, 213. [116] Bedair M.F. and Oleschuk R.D. Anal. Chem. 2006, 78, 1130. [117] Lindberg P., Dahlin A.P., Bergström S.K., Thorslund S., Andrén P.E.,
Nikolajeff F., and Bergquist J. Electrophoresis 2006, 27, 2075.

64
[118] Koerner T. and Oleschuk R.D. Rapid Commun. Mass Spectrom. 2005, 19, 3279.
[119] Wachs T. and Henion J. Anal. Chem. 2001, 73, 632. [120] Tang K., Lin Y., Matson D.W., Kim T., and Smith R.D. Anal. Chem. 2001, 73,
1658. [121] Oleschuk R.D. and Harrison D.J. Trends Anal. Chem. 2000, 19, 379. [122] Horning E.C., Horning M.G., Carroll D.I., Dzidic I., Haegele K.D., and
Stillwell R.N. Anal. Chem. 1973, 45, 936. [123] Carroll D.I., Dzidic I., Stillwell N., Haegele K.D., and Horning E.C. Anal.
Chem. 1975, 47, 2369. [124] Robb D.B., Covey T.R., and Bruins A.P. Anal. Chem. 2000, 72, 3653. [125] Syage J.A., Evans M.D., and Hanold K.A. Am. Lab. 2000, 32, 24. [126] Sunner J., Ikonomou M.G., and Kebarle P. Anal. Chem. 1988, 60, 1300. [127] King R., Bonfiglio R., Fernandez-Metzler C., Miller-Stein C., and Olah T. J.
Am. Soc. Mass Spectrom. 2000, 11, 942. [128] Reemtsma T. J. Chromatogr. A 2003, 1000, 477. [129] Hayen H. and Karst U. J. Chromatogr. A 2003, 1000, 549. [130] Zwiener C. and Frimmel F.H. Anal. Bioanal. Chem. 2004, 378, 862. [131] Lee H. J. Liq. Chromatogr. & Rel. Technol. 2005, 28, 1161. [132] Chen J., Korfmacher W.A., and Hsieh Y. J. Chromatogr. B 2005, 820, 1. [133] Karst U. Anal. Bioanal. Chem. 2005, 382, 1744. [134] Sforza S., Dall’Asta C., and Marchelli R. Mass Spectrometry Reviews 2006,
25, 54. [135] Manini P., Andreoli R., and Mutti A. Toxicology Letters 2006, 162, 202. [136] Bos S.J., van Leeuwen S.M., and Karst U. Anal. Bioanal. Chem. 2006, 384,
85. [137] Shahin M.M. J. Chem. Phys. 1966, 45, 2600. [138] Siegel M.W. and Fite W.L. J. Phys. Chem. 1976, 80, 2871. [139] Kambara H., Mitsui Y., and Kanomata I. Anal. Chem. 1979, 51, 1447.

65
[140] Kambara H., Ogawa Y., Mitsui Y., and Kanomata I. Anal. Chem. 1980, 52,
1500. [141] Matsuoka S., Nakamura H., and Tamura T. J. Chem. Phys. 1981, 75, 681. [142] Mitsui Y., Kambara H., Kojima M., Tomita H., Katoh K., and Satoh K. Anal.
Chem. 1983, 55, 477. [143] Matsuoka S., Nakamura H., and Tamura T. J. Chem. Phys. 1983, 79, 825. [144] Foster K.L., Cadwell T.E., Benter T., Langer S., Hemminger J.C., and
Finlayson-Pitts B.J. Phys. Chem. Chem. Phys. 1999, 1, 5615. [145] Kinoue T., Asai S., Ishii Y., Ishikawa K., Fujii M., Nakano K., and Hasumi K.
Environ. Health Prev. Med. 2003, 5, 97. [146] Taylor A.J., Linforth R.S.T., Harvey B.A., and Blake A. Food Chemistry
2000, 71, 327. [147] Deibler K.D., Lavin E.H., Linforth R.S.T., Taylor A.J., and Acree T.E. J.
Agric. Food Chem. 2001, 49, 1388. [148] Hollowood T.A., Linforth R.S.T., and Taylor A. J. Chem. Senses. 2002, 27,
583. [149] Weel K.G.C., Boelrijk A.E.M., Alting A.C., Van Mil P.J.J.M, Burger J.J.,
Gruppen H., Voragen A.G.J., and Smit G. J. Agric. Food Chem. 2002, 50, 5149.
[150] Turner J.A., Linforth R.S.T., and Taylor A.J. J. Agric. Food Chem. 2002, 50,
5400. [151] Hodgson M., Linforth R.S.T., and Taylor A.J. J. Agric. Food Chem. 2003, 51,
5052. [152] Lethuaut L., Weel K.G.C., Boelrijk A.E.M., and Brossard C.D. J. Agric. Food
Chem. 2004, 52, 3478. [153] Weel K.G.C., Boelrijk A.E.M., Burger, J.J., Verschueren M., Gruppen H.,
Voragen A.G.J., and Smit G. J. Agric. Food Chem. 2004, 52, 6564. [154] Garratt L.C., Linforth R., Taylor A.J., Lowe K.C., Power J.B., and Davey
M.R. Plant Biotechnology Journal 2005, 3, 165. [155] Mitchum R.K., Moler G.F., and Korfmacher W.A. Anal. Chem. 1980, 52,
2278. [156] Mitchum R.K., Korfmacher W.A., and Moler G.F. Anal. Chem. 1982, 54, 719.

66
[157] Korfmacher W.A., Moler G.F., Delongchamp R.R., Mitchum R.K., and Harless R.L. Chemosphere 1984, 13, 669.
[158] Korfmacher W.A., Mitchum R.K., Hileman F.D., and Mazer T. Chemosphere
1983, 12, 1243. [159] Korfmacher W.A., Fu P.P., Chou M., and Mitchum R.K. HRC & CC 1984, 7,
41. [160] Korfmacher W.A. and Miller D.W. HRC & CC 1984, 7, 581. [161] Korfmacher W.A. amd Rushing L.G. HRC & CC 1986, 9, 293. [162] Korfmacher W.A., Rushing L.G., Engelbach R.J., Freeman J.P., Djuric Z.,
Fifer E.K., and Beland F.A. HRC & CC 1987, 10, 43. [163] Korfmacher W.A., Rushing L.G., Arey J., Zielinska B., and Pitts J.N., Jr. HRC
& CC 1987, 10, 641. [164] Engelbach R.J., Korfmacher W.A., and Rushing L.G. HRC & CC 1988, 11,
661. [165] Kinouchi T., Lopez M.A.T., Rushing L.G., Beland F.A., and Korfmacher
W.A. HRC 1990, 13, 281. [166] Korfmacher W.A., Rushing L.G., Siitonen P.H., Branscomb C.J., and Holder
C.L. HRC & CC 1987, 10, 332. [167] Revel'skii I.A., Yashin Y.S., Voznesenskii V.N., Kuroschkin V.K.,
Kostyanovskii R.G. Izv. Akad. Nauk SSSR, Ser. Khim. 1986, 9, 1987. [168] Revel'skii I.A., Yashin Y.S., Kuroschkin V.K., Kostyanovskii R.G.
Zavodskaya Laboratoriya 1991, 57, 1. [169] Tyrefors L.N., Moulder R.X., and Markides K.E. Anal. Chem. 1993, 65, 2835. [170] Nyholm L.M., Sjöberg P.J.R., and Markides K.E. J. Chromatogr. A 1996, 755,
153. [171] Tanaka Y., Otsuka K., and Terabe S. J. Pharm. Biomed. Anal. 2003, 30, 1889. [172] Nilsson S.L., Andersson C., Sjöberg P.J.R., Bylund D., Petersson P., Jörntén-
Karlsson M., and Markides K.E. Rapid Commun. Mass Spectrom. 2003, 17, 2267.
[173] Karas M., Bachmann D., and Hillenkamp F. Anal. Chem. 1985, 57, 2935. [174] Knochenmuss R. Analyst 2006, 131, 966.

67
[175] Knochenmuss R., Dubois F., Dale M., and Zenobi R. Rapid Commun. Mass Spectrom. 1996, 10, 871.
[176] Knochenmuss R., Karbach V., Wiesli U., Breuker K., and Zenobi R. Rapid
Commun. Mass Spectrom. 1998, 12, 529. [177] Santos L.S., Haddad R., Höehr N.F., Pilli R.A., and Eberlin M.N. Anal. Chem.
2004, 76, 2144. [178] Tholey A. and Heinzle E. Anal. Bioanal. Chem. 2006, 386, 24. [179] Önnerfjord P, Nilsson J, Wallman L, Laurell T, and Marko-Varga G. Anal.
Chem. 1998, 70, 4755. [180] Ekström S., Önnerfjord P., Nilsson J., Bengtsson M., Laurell T., and Marko-
Varga G. Anal. Chem. 2000, 72, 286–293. [181] Ekström S., Ericsson D., Önnerfjord P., Bengtsson M., Nilsson J., Marko-
Varga G., and Laurell T. Anal. Chem. 2001, 73, 214. [182] Marko-Varga G., Ekström S., Helldin G., Nilsson J., and Laurell T.
Electrophoresis 2001, 22, 3978. [183] Ekström S., Nilsson J., Helldin G., Laurell T., and Marko-Varga G.
Electrophoresis 2001, 22, 3984. [184] Liu J., Tseng K., Garcia B., Lebrilla C.B., Mukerjee E., Collins S., and Smith
R. Anal. Chem. 2001, 73, 2147. [185] Mok M.L., Hua L., Phua J.B., Wee M.K., and Sze N.S. Analyst 2004, 129,
109. [186] Brivio M., Fokkens R.H., Verboom W., Reinhoudt D.N., Tas N.R., Goedbloed
M., and van den Berg A. Anal. Chem. 2002, 74, 3972. [187] Ehrnström R. Lab Chip 2002, 2, 26N–30N. [188] Wei J., Buriak J.M., and Siuzdak G. Nature 1999, 399, 243. [189] Kruse R.A., Li X., Bohn P.W., and Sweedler J.V. Anal. Chem. 2001, 73, 3639. [190] Shen Z., Thomas J.J., Averbuj C., Broo K.M., Engerlhard M., Crowell J.E.,
Finn M.G., and Siuzdak G. Anal. Chem. 2001, 73, 612. [191] Kruse R.A., Rubakhin S.S., Romanova E.V., Bohn P.W., and Sweedler J.V. J.
Mass Spectrom. 2001, 36, 1317. [192] Go E.P., Shen Z., Harris K., and Siuzdak G. Anal. Chem. 2003, 75, 5475. [193] Canham, L.T. Appl. Phys. Lett. 1990, 57, 1046.

68
[194] Meng J-C., Siudzak G., and Finn M.G. Chem. Commun. 2004, 2108. [195] Thomas J.J., Shen Z., Blackledge R., and Siuzdak G. Anal. Chim. Acta 2001,
442, 183. [196] Rousell D.J., Dutta S.M., Little M.W., and Murray K.K. J. Mass Spectrom.
2004, 39,1182. [197] Bhattacharya, S.H., Raiford T.J., and Murray K.K. Anal. Chem. 2002, 74,
2228. [198] Alimpiev S., Nikiforov S., Karavanskii V., Minton T., and Sunner J. J Chem.
Phys. 2001, 115, 1891. [199] Cuiffi J.D., Hayes D.J., Fonash S.J., Brown K.N., and Jones A.D. Anal. Chem.
2001, 73, 1292. [200] Finkel, N.H., Prevo B.G., Velev O.D., and He, L. Anal. Chem. 2005, 77, 1088. [201] Go E.P., Apon J.V, Luo G., Saghatelian A., Daniels R.H., Sahi V., Dubrow R.,
Cravatt B.F., Vertes A., and Siuzdak G. Anal. Chem. 2005, 77, 1641. [202] Okuna S., Arakawa R., Okamoto K., Matsui Y., Seki S., Kozawa T., Tagawa
S., and Wada Y. Anal. Chem. 2005, 77, 5364. [203] Okuno S., Nakano M., Matsubayashi G., Arakawa R., and Wada Y. Rapid
Commun. Mass Spectrom. 2004, 18, 2811. [204] Tuomikoski S., Huikko K., Grigoras K., Östman P., Kostiainen R., Baumann
M., Abian J., Kotiaho T., and Franssila S. Lab Chip 2002, 2, 247. [205] Li Q., Winefordner J.D., and Powell DH. Proc. 53rd Annual Conference, Am.
Soc. for Mass Spectrom., San Antonio, Texas, June 5-9, 2005. [206] Budimir N., Blais J.-C., Fournier F., and Tabet J.-C. Rapid Commun. Mass
Spectrom. 2006, 20, 680. [207] Trauger S.A., Go E.P., Shen Z., Apon J. V., Compton B.J., Bouvier E.S.P.,
Finn M.G., and Siuzdak G. Anal. Chem. 2004, 76, 4484. [208] Thomas J.J., Shen Z., Crowell J.E., Finn M.G., and Siuzdak G. Proc. Natl.
Acad. Sci. 2001, 98, 4932. [209] Laiko V.V., Taranenko N.I., Berkout V.D., Musselman B.D., and Doroshenko
V.M. Rapid Commun. Mass Spectrom. 2002, 16, 1737. [210] Wall D.B., Finch J.W., and Cohen S.A. Rapid Commun. Mass Spectrom. 2004,
18, 1403.

69
[211] Go E.P., Prenni J.E., Wei J., Jones A., Hall S.C., Witkowska H.E., Shen Z., and Siuzdak G. Anal. Chem. 2003, 75, 2504.
[212] Pihlainen K., Grigoras K., Franssila S., Ketola R.,Kotiaho T., and Kostiainen
R. J. Mass Spectrom. 2005, 40, 539. [213] Lewis W.G., Shen Z., Finn M.G., and Siuzdak G. Int. J. Mass Spectrom. 2003,
226, 107. [214] Nordström A., Apon, J.V., Uritboonthai W., Go, E.P., and Siuzdak G. Anal.
Chem. 2006, 78, 272. [215] Okuno S., Wada Y., and Arakawa R. Int. J. Mass. Spectrom. 2005, 241, 43. [216] Xu S., Pan C., Hu L., Zhang Y., Guo Z., Li X., and Zou H. Electrophoresis
2004, 25, 3669. [217] Wall D.B., Finch J.W., and Cohen S.A. Rapid Commun. Mass Spectrom. 2004,
18, 1482. [218] Prenni J.E., Shen Z., Trauger S., Chen W., and Siuzdak G. Spectroscopy 2003
17, 693. [219] Compton B.J. and Siuzdak G. Spectroscopy 2003, 17, 699. [220] Li Q., Ricardo A., Benner S.A., Winefordner J.D., and Powell D.H. Anal.
Chem. 2005, 77, 4503 [221] Kraj A., Dylag T., Gorecka-Drzazga A., Bargiel S., Dziuban J., and Silberring
J. Acta Biochimica Polonica 2003, 50, 783. [222] Kinumi T., Shimomae Y., Arakawa R., Tatsu Y., Shigeri Y., Yumoto N., and
Niki E. J. Mass Spectrom. 2006, 41, 103. [223] Thevis M., Geyer H., Mareck U., and Schänzer W. J. Mass Spectrom. 2005,
40, 955. [224] Jäntti S., Uutela P., Airavaara M., Piepponen P., Kostiainen R., and Ketola R.
A. 21st Montreux Symposium on Liquid Chromatography/Mass Spectrometry, 10-12.11.2004, Montreux, Switzerland.
[225] Franssila S., Marttila S., Kolari K., Östman P., Kotiaho T., Kostiainen R.,
Lehtiniemi R., Fager C.-M., and Manninen J. J. MEMS 2006, 15, 1251-1259. [226] Chen J. and Davidson J.H. Plasma Chem. Plasma Process. 2002, 22, 495. [227] Ravindra K., Godoi A.F.L., Bencs L., and Van Grieken R. J. Chromatogr. A
2006 ,1114, 278.

70
[228] Doroshenko V.M., Laiko V.V., Taranenko N.I., Berkout V.D., and Lee H.S. Int. J. Mass Spectrom. 2002, 221, 39.
[229] National Institute of Standards and Technology. NIST chemistry webbook -
NIST standard reference database number 69, June 2005 release. ( Available at: http://www.webbook.nist.gov/chemistry/ ).
[230] Jang Y.H., Hwang S., and Chung D.S. Chemistry Letters 2001, 12, 1316. [231] Klonis N. and Sawyer W.H. Photochemistry and Photobiology 2000, 72, 179. [232] Knochenmuss R., Stortelder A., Breuker K., and Zenobi R. J. Mass Spectrom.
2000, 35, 1237. [233] Salo P.K., Salomies H., Harju K., Ketola R.A., Kotiaho T., Yli-Kauhaluoma
J., and Kostiainen R. J. Am. Soc. Mass Spectrom. 2005, 16, 906. [234] Dale M.J., Knochenmuss R., and Zenobi R. Anal. Chem. 1996, 68, 3321. [235] Chen Y.-C., Sheia J., and Sunner J. J Chromatogr. A 1998, 826, 77.


![Electrospray ionization mass spectrometry of ...93)85031-R.pdfElectrospray Ionization Mass Spectrometry of Phosphopeptides Isolated by On-Line ... this purpose [19~22]. Immobilized](https://static.fdocuments.in/doc/165x107/5ad660d07f8b9a6b668b8d17/electrospray-ionization-mass-spectrometry-of-9385031-rpdfelectrospray-ionization.jpg)