Microbial source tracking markers at three inland ... · Microbial Source Tracking Markers at Three...
16
Prepared in cooperation with the Ohio Water Development Authority and Muskingum Watershed Conservancy District Microbial Source Tracking Markers at Three Inland Recreational Lakes in Ohio, 2011 Open-File Report 2012–1222 U.S. Department of the Interior U.S. Geological Survey
Transcript of Microbial source tracking markers at three inland ... · Microbial Source Tracking Markers at Three...
Prepared in cooperation with the Ohio Water Development Authority and Muskingum Watershed Conservancy District
Microbial Source Tracking Markers at Three Inland Recreational Lakes in Ohio, 2011
Open-File Report 2012–1222
U.S. Department of the InteriorU.S. Geological Survey

Cover image: View of area near Crystal Beach, Buckeye Lake, Ohio (photograph by Donna Francy, U.S. Geological Survey).

Microbial Source Tracking Markers at Three Inland Recreational Lakes in Ohio, 2011
By Donna S. Francy and Erin A. Stelzer
Prepared in cooperation with the Ohio Water Development Authority and Muskingum Watershed Conservancy District
Open-File Report 2012–1222
U.S. Department of the InteriorU.S. Geological Survey

U.S. Department of the InteriorKEN SALAZAR, Secretary
U.S. Geological SurveyMarcia K. McNutt, Director
U.S. Geological Survey, Reston, Virginia: 2012
For more information on the USGS—the Federal source for science about the Earth, its natural and living resources, natural hazards, and the environment, visit http://www.usgs.gov or call 1–888–ASK–USGS.
For an overview of USGS information products, including maps, imagery, and publications, visit http://www.usgs.gov/pubprod
To order this and other USGS information products, visit http://store.usgs.gov
Any use of trade, product, or firm names is for descriptive purposes only and does not imply endorsement by the U.S. Government.
Although this report is in the public domain, permission must be secured from the individual copyright owners to reproduce any copyrighted materials contained within this report.
Suggested citation: Francy, D.S., and Stelzer, E.A., 2012, Microbial source tracking markers at three inland recreational lakes in Ohio, 2011: U.S. Geological Survey Open-File Report 2012–1222, 8 p.

iii
Contents
Abstract ...........................................................................................................................................................1Introduction ....................................................................................................................................................1Methods...........................................................................................................................................................1
Sampling Sites and Procedures .........................................................................................................1Microbial Source Tracking (MST) Marker Analyses ......................................................................3
Escherichia coli and MST Markers in Lake-Water Samples .................................................................4References Cited............................................................................................................................................8
Figures
1. Map showing locations of the three study lakes in Ohio .......................................................2 2. Graph showing percentages of samples with not detected, estimated
quantities, and measured quantities of microbial source tracking markers: A, Buckeye Lake Crystal and Fairfield. B, Atwood Lake. C, Tappan Lake Main and ditch, 2011 ....................................................................................................................7
Tables
1. Beach study sites and agencies responsible for sampling ...................................................3 2. Standard curve characteristics for microbial source tracking (MST) markers .................4 3. Quality-control field blank data for Escherichia coli and microbial source
tracking (MST) markers, 2011 .....................................................................................................4 4. Quality-control concurrent replicate data for Escherichia coli and microbial
source tracking (MST) markers, 2011 .......................................................................................5 5. Concentrations of microbial source tracking (MST) markers in inland lake
samples, 2011 ................................................................................................................................6

iv
Conversion Factors
Multiply By To obtain
Length
foot (ft) 0.3048 meter (m)
Volume
liter (L) 0.2642 gallon (gal)
milliliter (mL) 0. 03381 fluid ounce (oz)
microliter (µL) 1,000 milliliter (mL)
Mass
gram (g) 0.03527 ounce, avoirdupois (oz) Temperature in degrees Celsius (°C) may be converted to degrees Fahrenheit (°F) as follows:
°F=(1.8×°C)+32

Microbial Source Tracking Markers at Three Inland Recreational Lakes in Ohio, 2011
By Donna S. Francy and Erin A. Stelzer
Abstract
During the 2011 recreational season, samples were collected for E. coli and microbial source tracking (MST) marker concentrations to begin to understand potential sources of fecal contamination at three inland recreational lakes in Ohio—Buckeye, Atwood, and Tappan Lakes. The results from 32 regular samples, 4 field blanks, and 7 field replicates col-lected at 5 sites are presented in this report. At the three lakes, the ruminant-associated marker was found most often (57–73 percent of samples) but at estimated quantities, followed by the dog-associated marker (30–43 percent of samples). The human-associated marker was found in 14 and 50 percent of samples from Atwood and Tappan Lakes, respectively, but was not found in any samples from the two Buckeye Lake sites. The gull-associated marker was detected in only two samples, both from Tappan Lake.
Introduction
Identifying sources of fecal contamination at recreational beaches with elevated Escherichia coli (E. coli) concentra-tions is important for implementing appropriate remedial and control strategies and understanding human health risk of the water’s use. Microbial source tracking (MST) is a term used for identifying sources of fecal contamination in the environ-ment. MST techniques are based on the concept that intestinal systems of different warmblooded animals select for specific microbial populations in response to differences in diet and physiology. A widely used MST method is the use of host-associated MST markers. For this method, a targeted genetic sequence of DNA is amplified by the polymerase chain reac-tion (PCR) into an amount that can be quantified. Host-associ-ated MST markers have been identified from different groups of fecal bacteria, often from the genus Bacteroides, a bacte-rium abundant in the gut of warmblooded animals (Layton and others, 2006). Although the occurrence of host-associated MST markers has been investigated at coastal beaches (Bower and others, 2005; Wong and others, 2009; Edge and others, 2010), to our knowledge there are no published studies that use these markers to identify sources of fecal contamination at
inland recreational beaches. Inland water bodies are popular swimming and boating destinations throughout the United States and, because of differences in size and hydrology, the water quality at inland lakes may be affected differently by contaminant sources than at coastal beaches.
This report describes the results of research by the U.S. Geological Survey (USGS), in cooperation with the Ohio Water Development Authority and the Muskingum Water-shed Conservancy District, to begin to understand the sources behind elevated E. coli concentrations at three inland recre-ational lakes in Ohio. Thirty-two regular samples, four field blanks, and seven replicates were collected and analyzed for concentrations of E. coli, general Bacteroides, and host-asso-ciated markers for humans, ruminants, dogs, and gulls. The results are presented in this report. This work is part of a larger monitoring study that was done to determine whether predic-tive models for E. coli could be used to provide near-real-time assessments of water quality at inland recreational beaches.
Methods
Sampling Sites and Procedures
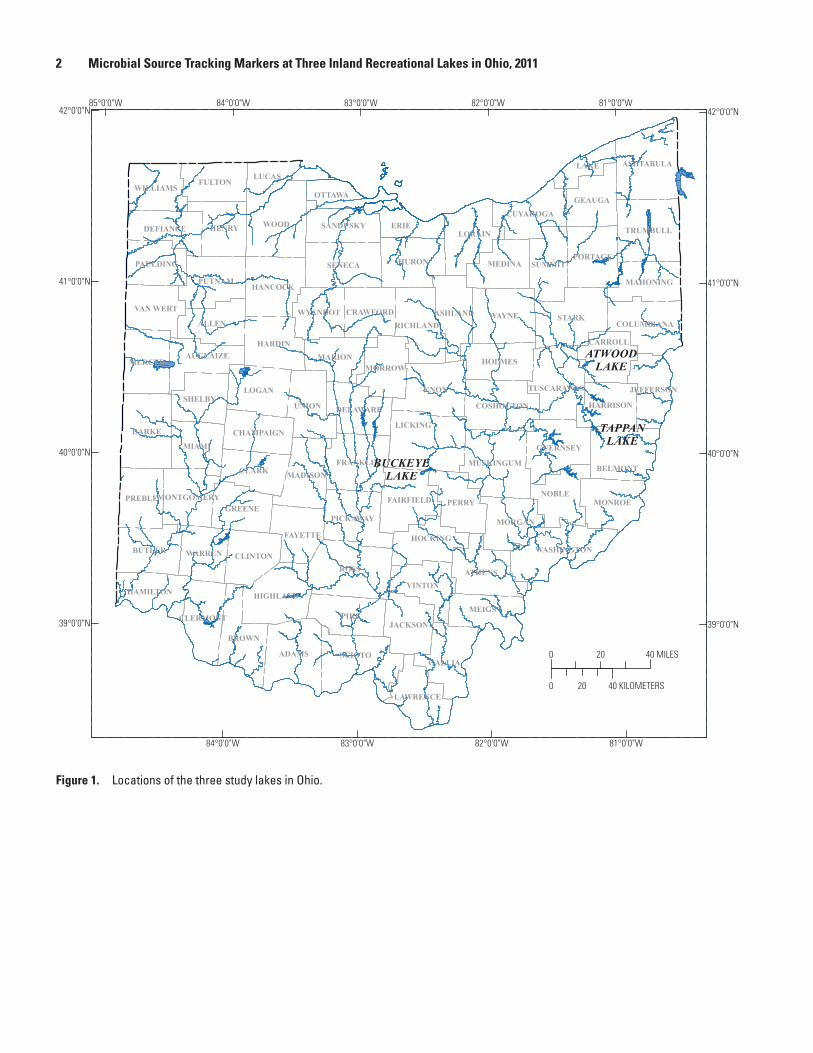
Samples were collected from five sites at three inland recreational lakes in Ohio (fig. 1, table 1) affected by elevated E. coli concentrations. Buckeye Lake is a shallow manmade reservoir in central Ohio constructed in the early 19th century for the Miami and Erie Canal, which connected the Ohio River with Lake Erie. Two beach sites were included at Buckeye Lake—Crystal and Fairfield. Sources of fecal contamination to Buckeye Lake are largely unidentified and may include birds and other wildlife, runoff from parking lots, and agricultural animals. Atwood Main and Tappan Main are sites at popular swimming beaches on reservoirs located in mixed recreational and agricultural areas in eastern Ohio. Potential sources of fecal contamination at Atwood Main include birds and dis-charge from a nearby intermittent stream. Potential sources of fecal contamination at Tappan Main include birds and other wildlife, runoff from the parking lot, and a lagoon wastewater treatment system that discharges effluent into a nearby ditch. The ditch drains into Tappan Lake near the beach. A sampling
ROSS
PIKE
WOOD
KNOX
STARK
DARKELICKING
ADAMS SCIOTO
WAYNE
MIAMI
UNION
HURON
GALLIA
SENECA
MEIGS
LOGAN
LORAIN
BROWN
ALLEN
ATHENS
HARDIN
ASHTABULA
HENRY
CLARK
PERRYNOBLE
BUTLER
TRUMBULL
PUTNAM
BELMONT
VINTON
FRANKLIN
MERCER
ERIE
MEDINA
MUSKINGUM
PREBLE
HIGHLAND
HANCOCK
SUMMITPORTAGE
FULTON
SHELBY
LUCAS
MONROE
MARION
FAIRFIELD
HOLMES
MADISON
PICKAWAYGREENE
RICHLAND
GEAUGA
CLINTON
GUERNSEY
MORGAN
WASHINGTON
FAYETTE
WARREN
HOCKING
LAKE
JACKSON
WILLIAMS
COSHOCTON
MORROW
CARROLL
PAULDING
DELAWARE
DEFIANCE
TUSCARAWAS
CUYAHOGA
AUGLAIZE
HAMILTON
LAWRENCE
WYANDOTCOLUMBIANA
VAN WERT
HARRISON
MAHONING
SANDUSKY
CHAMPAIGN
CRAWFORD
OTTAWA
ASHLAND
CLERMONT
JEFFERSON
MONTGOMERY
BUCKEYELAKE
TAPPANLAKE
ATWOODLAKE
0 4020 MILES
0 4020 KILOMETERS
81°0'0"W
81°0'0"W
82°0'0"W
82°0'0"W
83°0'0"W
83°0'0"W
84°0'0"W
84°0'0"W85°0'0"W42°0'0"N 42°0'0"N
41°0'0"N 41°0'0"N
40°0'0"N 40°0'0"N
39°0'0"N 39°0'0"N
2 Microbial Source Tracking Markers at Three Inland Recreational Lakes in Ohio, 2011
Figure 1. Locations of the three study lakes in Ohio.

Methods 3
Table 1. Beach study sites and agencies responsible for sampling.
[MWCD, Muskingum Watershed Conservancy District, New Philadelphia, Ohio; USGS, U.S. Geological Survey, Columbus, Ohio]
Site nameUSGS site identification
number1 Short name Site descriptionSampled
by
Atwood Lake Main Beach 403219081155500 Atwood Main Popular bathing beach MWCD
Buckeye Lake Fairfield 395520082281500 Buckeye Fairfield Small beach USGS
Buckeye Lake Crystal 395557082283800 Buckeye Crystal Small beach USGS
Tappan Lake Main Beach 401926081105100 Tappan Main Popular bathing beach MWCD
Tappan Lake ditch 401910081111200 Tappan ditch Ditch MWCD1Corresponds to the latitude and longitude of each site.
site, Tappan ditch, was included to compare the sources of fecal contamination in the ditch to those at the swimming beach. The potential for human sources from wastewater at Buckeye Lake sites and at Atwood Main are unlikely because the communities around these reservoirs are served by sanitary sewer systems.
Data were collected during July–September 2011 by the USGS Columbus office (Buckeye Lake sites) or by the Musk-ingum Watershed Conservancy District (MWCD, Atwood and Tappan sites). Thirty-two samples for E. coli and MST mark-ers were collected by using standard grab-sampling techniques (Myers and others, 2007) at 2–3 ft water depths, in areas used for swimming. A 1-L or 3-L sterile polypropylene sample bottle was filled with water about 1 ft below the water surface, placed on ice, and transported by car or shipped overnight to the USGS Ohio Water Microbiology Laboratory (OWML) in Columbus, Ohio. In addition to regular sampling for E. coli and MST markers, four field blanks and seven replicates were collected and analyzed. If a MST marker was detected in one replicate and not the other, the result from the positive rep-licate was used; otherwise, an average of two replicates was used for data analysis.
Samples for E. coli were analyzed within 6 hours of col-lection at the OWML or MWCD office by use of the Coli-lert Quanti-Tray/2000 method (IDEXX Laboratories, Inc., Westbrook, Maine) and are reported in most probable number per 100 milliliters (MPN/100 mL). Sample processing and quality-control procedures are described in Myers and others (2007). Daily data on E. coli concentrations and MST mark-ers were entered into the USGS National Water Information System (NWIS; data available at http://nwis.waterdata.usgs.gov/oh/nwis/qwdata).
Microbial Source Tracking (MST) Marker Analyses
Water samples for MST analyses were filtered onto Nucleopore polycarbonate filters (Whatman/GE Healthcare, Piscataway, N.J.) at the USGS Columbus laboratory within 24 hours of sample collection. Filters were preserved at −70 °C in screw-cap vials with 0.3 g of acid-washed glass beads (Sigma, St. Louis, Mo.) until batch analysis was done after sample collection for the recreational season was completed. Samples were extracted by use of a DNA-EZ extraction kit (GeneRite, North Brunswick, N.J.) according to manufacturer’s instructions, except that no prefilter was used and the final elution volume was 200 µL.
At the Columbus laboratory, DNA extracts were analyzed by qPCR for five MST markers: a general Bacteroides marker present in most warmblooded animals—AllBac (Layton and others, 2006); a human-associated Bacteroides marker—HF183 (Seurinck and others, 2005); a ruminant-associated Bacteroides marker—BoBac (Layton and others, 2006); a dog-associated Bacteroides marker—BacCan (Kildare and others, 2007); and a gull-associated marker from the species Catellicoccus marimammalium—Gull2 (Sinigalliano and others, 2010). All qPCR assays were performed as described in the citations, with the exception of the Gull2, in which a double-quenched probe was used. The probe, which was labeled with an internal ZEN Quencher and an Iowa Black Quencher (Integrated DNA Technologies, Coralville, Iowa), was designed to reduce background and increase qPCR signal. Analyses by qPCR were run in duplicate by using 5 µL of DNA extract and 20 µL of master mix in an Applied Biosys-tems 7500 (Foster City, Calif.) thermal cycler. Depending on

4 Microbial Source Tracking Markers at Three Inland Recreational Lakes in Ohio, 2011
the MST assay, either TaqMan Universal PCR Master Mix or SYBR Green PCR Master Mix was used.
Plasmid standards for each MST assay were used to establish standard curves for quantification of MST mark-ers. These were constructed by insertion of PCR-amplified marker sequences into the pCR4 TOPO E. coli plasmid vector (Invitrogen, Carlsbad, Calif.). The plasmid DNA was extracted and purified from E. coli cells by using the QIAPrep Spin Miniprep Kit (Qiagen, Valencia, Calif.). Copy number was calculated from DNA concentration, measured by use of the PicoGreen assay (Invitrogen, Carlsbad, Calif.), and the molecular weight of the plasmid. Sample results were reported as copies per 100 milliliters (copies/100 mL). Standard curve characteristics are included in table 2.
Laboratory quality-control samples included a process-ing blank (phosphate-buffered water processed with the water samples when filtered), an extraction blank (GeneRite Elution Buffer processed with filtered water samples during each batch of DNA extraction), a no-template control (molecular-grade water included on each qPCR plate), and positive controls
(plasmid-based standard curves included in each qPCR run). Matrix inhibition was tested by using matrix spikes, as described in Stoeckel and others (2011).
Table 2. Standard curve characteristics for microbial source tracking (MST) markers.
[Dynamic range and limit of detection are reported in copies/reaction]
MST marker
Number of compiled
curves
Dynamic range
Amplification efficiency (percent)
R2 value
Limit of detection
AllBac 13 4.08 × 10² – 8.72 × 10⁷ 92 0.997 8.1
BacCan 7 4.84 × 101 – 7.70 × 10⁶ 89 0.999 42.2
BoBac 16 3.62 × 101 – 6.38 × 10⁶ 90 0.996 3.2
Gull2 2 5.52 × 101 – 5.52 × 10⁶ 82 0.997 1
HF183 19 2.26 × 101 – 6.06 × 10⁶ 98 0.996 6.3
Table 3. Quality-control field blank data for Escherichia coli and microbial source tracking (MST) markers, 2011.
[Escherichia coli (E. coli) are reported in most probable number per 100 milliliters (MPN/100 mL); MST markers are reported in copies per 100 milliliters (copies/100 mL); <, less than; —, not done; E, estimated value]
Date Sampling site E. coli AllBac, General
HF183, Human
BoBac, Ruminant
BacCan, Dog
Gull2, Gull
7/31
8/14
8/30
9/6
Atwood Main
Atwood Main
Buckeye Crystal
Buckeye Fairfield
<1
—
<1
<1
<160
<530
<160
<530
E 400
<500
<130
<430
<64
<260
<64
<210
<840
<3,400
<840
<2,800
<20
<80
<20
<67
Escherichia coli and MST Markers in Lake-Water Samples
Quality-control samples for E. coli and MST markers were collected to aid in data interpretations. In the four field blanks, sample results were below detection for all but one sample (table 3). For HF183 (human), an estimated concen-tration of 400 copies/100 mL was found in one field blank sample. Seven concurrent replicates for E. coli and MST markers were collected (table 4), and the absolute value log10 differences (AVLD) were calculated for each replicate pair when at least one replicate included a detection. The ranges of AVLDs for AllBac and Gull2 markers (0.01–0.51 cop-ies/100 mL) were similar to the range of AVLDs for E. coli
Escherichia coli and MST Markers in Lake-Water Samples 5
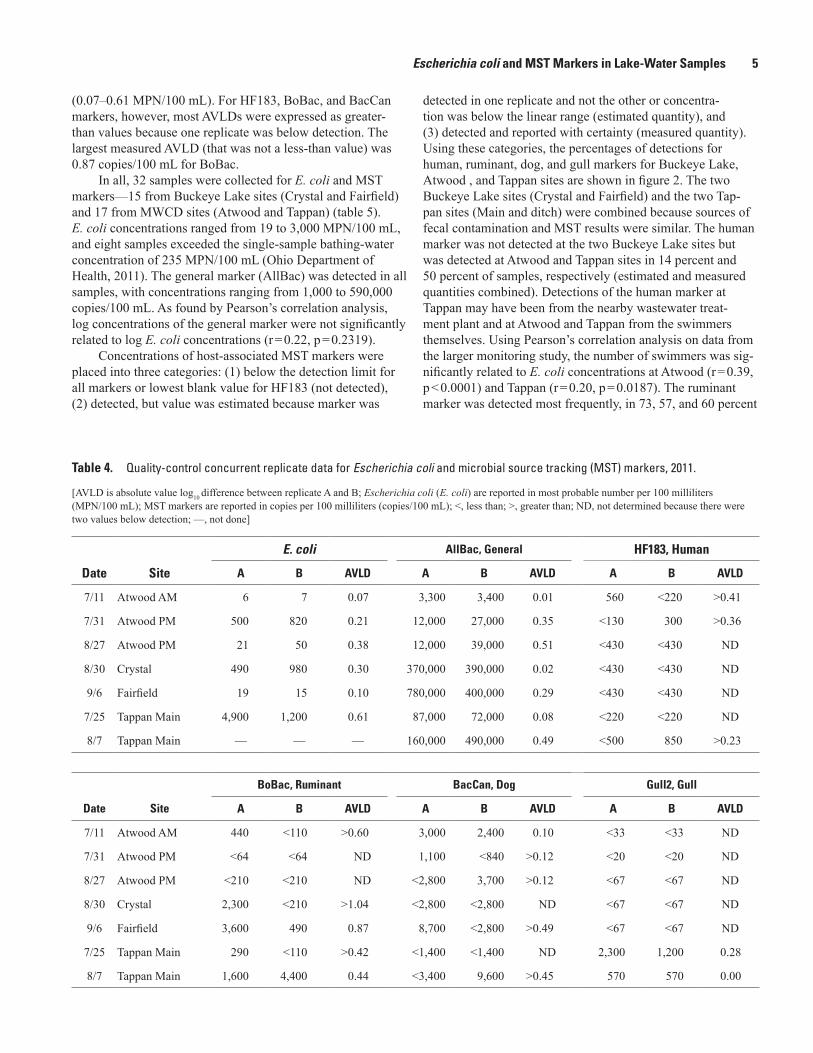
(0.07–0.61 MPN/100 mL). For HF183, BoBac, and BacCan markers, however, most AVLDs were expressed as greater-than values because one replicate was below detection. The largest measured AVLD (that was not a less-than value) was 0.87 copies/100 mL for BoBac.
In all, 32 samples were collected for E. coli and MST markers—15 from Buckeye Lake sites (Crystal and Fairfield) and 17 from MWCD sites (Atwood and Tappan) (table 5). E. coli concentrations ranged from 19 to 3,000 MPN/100 mL, and eight samples exceeded the single-sample bathing-water concentration of 235 MPN/100 mL (Ohio Department of Health, 2011). The general marker (AllBac) was detected in all samples, with concentrations ranging from 1,000 to 590,000 copies/100 mL. As found by Pearson’s correlation analysis, log concentrations of the general marker were not significantly related to log E. coli concentrations (r = 0.22, p = 0.2319).
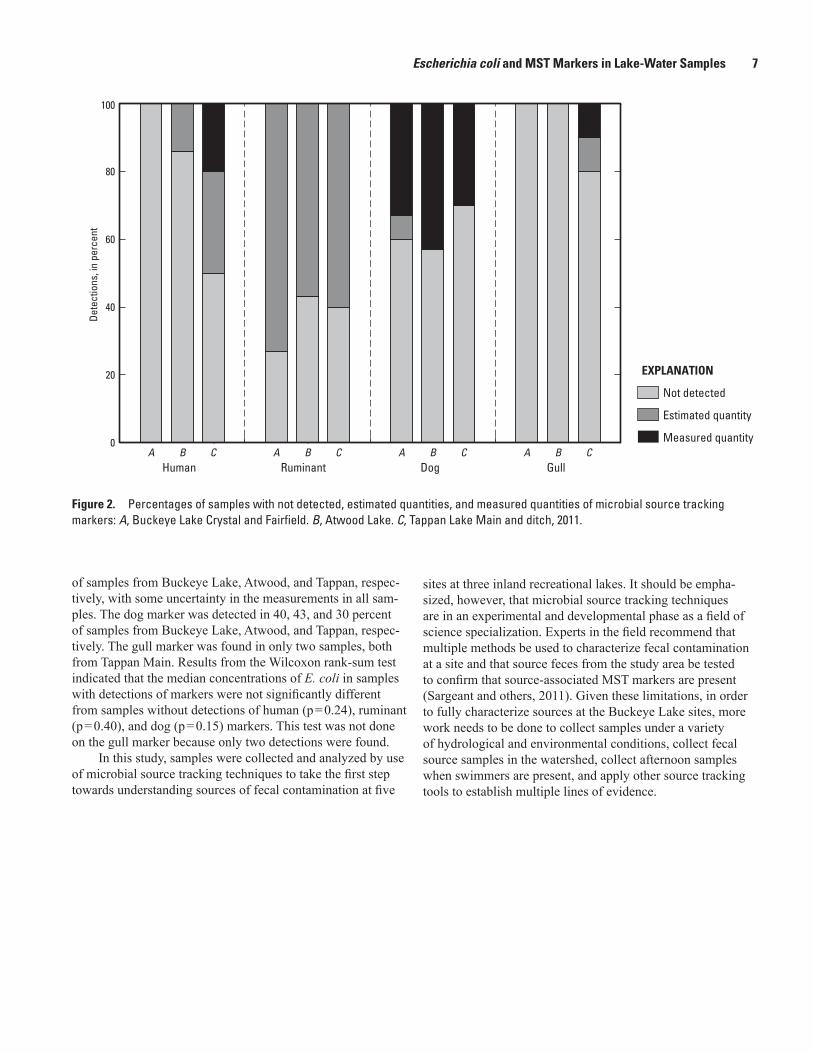
Concentrations of host-associated MST markers were placed into three categories: (1) below the detection limit for all markers or lowest blank value for HF183 (not detected), (2) detected, but value was estimated because marker was
detected in one replicate and not the other or concentra-tion was below the linear range (estimated quantity), and (3) detected and reported with certainty (measured quantity). Using these categories, the percentages of detections for human, ruminant, dog, and gull markers for Buckeye Lake, Atwood , and Tappan sites are shown in figure 2. The two Buckeye Lake sites (Crystal and Fairfield) and the two Tap-pan sites (Main and ditch) were combined because sources of fecal contamination and MST results were similar. The human marker was not detected at the two Buckeye Lake sites but was detected at Atwood and Tappan sites in 14 percent and 50 percent of samples, respectively (estimated and measured quantities combined). Detections of the human marker at Tappan may have been from the nearby wastewater treat-ment plant and at Atwood and Tappan from the swimmers themselves. Using Pearson’s correlation analysis on data from the larger monitoring study, the number of swimmers was sig-nificantly related to E. coli concentrations at Atwood (r = 0.39, p < 0.0001) and Tappan (r = 0.20, p = 0.0187). The ruminant marker was detected most frequently, in 73, 57, and 60 percent
Table 4. Quality-control concurrent replicate data for Escherichia coli and microbial source tracking (MST) markers, 2011.
[AVLD is absolute value log difference between replicate A and B; Escherichia coli (E. coli) are reported in most probable number per 100 milliliters 10 (MPN/100 mL); MST markers are reported in copies per 100 milliliters (copies/100 mL); <, less than; >, greater than; ND, not determined because there were two values below detection; —, not done]
E. coli AllBac, General HF183, Human
Date Site A B AVLD A B AVLD A B AVLD
7/11
7/31
8/27
8/30
9/6
7/25
8/7
Atwood AM
Atwood PM
Atwood PM
Crystal
Fairfield
Tappan Main
Tappan Main
6
500
21
490
19
4,900
—
7
820
50
980
15
1,200
—
0.07
0.21
0.38
0.30
0.10
0.61
—
3,300
12,000
12,000
370,000
780,000
87,000
160,000
3,400
27,000
39,000
390,000
400,000
72,000
490,000
0.01
0.35
0.51
0.02
0.29
0.08
0.49
560
<130
<430
<430
<430
<220
<500
<220
300
<430
<430
<430
<220
850
>0.41
>0.36
ND
ND
ND
ND
>0.23
BoBac, Ruminant BacCan, Dog Gull2, Gull
Date Site A B AVLD A B AVLD A B AVLD
7/11
7/31
8/27
8/30
9/6
7/25
8/7
Atwood AM
Atwood PM
Atwood PM
Crystal
Fairfield
Tappan Main
Tappan Main
440
<64
<210
2,300
3,600
290
1,600
<110
<64
<210
<210
490
<110
4,400
>0.60
ND
ND
>1.04
0.87
>0.42
0.44
3,000
1,100
<2,800
<2,800
8,700
<1,400
<3,400
2,400
<840
3,700
<2,800
<2,800
<1,400
9,600
0.10
>0.12
>0.12
ND
>0.49
ND
>0.45
<33
<20
<67
<67
<67
2,300
570
<33
<20
<67
<67
<67
1,200
570
ND
ND
ND
ND
ND
0.28
0.00

6 Microbial Source Tracking Markers at Three Inland Recreational Lakes in Ohio, 2011
Table 5. Concentrations of microbial source tracking (MST) markers in inland lake samples, 2011.
[E. coli, Escherichia coli; A, average of two replicates; >, greater than; <, less than; R, value reported was detected in one field replicate but not in the second replicate; E, estimated value because it was detected in one replicate and not the other or was below the linear range; detections of AllBac, BoBac, BacCan and Gull2 are shaded]
MST markers (copies/100 mL)
Date Time SiteE. coli
(MPN/ 100 mL)AllBac
(general)HF183
(human)BoBac
(ruminant)BacCan
(dog)Gull2 (gull)
7/11 9:55 Buckeye Crystal 29 130,000 <500 E 1,300 E 3,800 <80
7/17 7:05 Buckeye Crystal 58 160,000 <500 E 550 <3,400 <80
7/24 7:10 Buckeye Crystal 130 390,000 <500 E 2,200 <3,400 <80
7/30 6:55 Buckeye Crystal 920 310,000 <370 E 670 4,900 <57
8/8 8:22 Buckeye Crystal 24 160,000 <500 <260 44,000 <80
8/22 7:12 Buckeye Crystal 650 310,000 <430 <210 <2,800 <67
8/30 8:10 Buckeye Crystal A 740 A 380,000 <430 RE 2,300 <2,800 <67
9/13 10:50 Buckeye Crystal 39 330,000 <430 E 1,600 <2,800 <67
7/17 7:38 Buckeye Fairfield 19 180,000 <500 <260 5,100 <80
7/24 8:00 Buckeye Fairfield 210 200,000 <500 E 1,100 <3,400 <80
7/25 10:07 Buckeye Fairfield 210 46,000 <500 E 520 <3,400 <80
7/30 7:35 Buckeye Fairfield 80 190,000 <370 E 540 7,400 <57
8/8 8:02 Buckeye Fairfield 26 170,000 <500 <260 <3,400 <80
8/22 8:00 Buckeye Fairfield 39 180,000 <430 E 1,500 <2,800 <67
9/6 9:33 Buckeye Fairfield A 17 A 590,000 <430 AE 2,000 RE 8700 <67
7/11 9:19 Atwood Main A 6 AE 3,400 RE 560 RE 440 A 2,700 <33
7/25 9:42 Atwood Main 60 200,000 <220 E 290 <1,400 <33
7/31 8:47 Atwood Main 32 E 1,000 <130 E 270 <840 <20
8/14 9:03 Atwood Main 32 E 6,800 <500 <260 <3,400 <80
7/31 12:41 Atwood Main A 660 A 20,000 RE 300a <64 RE 1,100 <20
8/27 14:00 Atwood Main A 36 AE 26,000 <430 <210 RE 3,700 <67
9/11 13:38 Atwood Main 210 42,000 <430 E 960 <2,800 <67
7/11 10:54 Tappan Main 201 E 10,000 <220 E 190 12,000 <33
7/25 10:53 Tappan Main A 3,000 A 80,000 <220 RE 290 <1,400 A 1,800
8/7 13:17 Tappan Main 120 A 320,000 RE 850 AE 3,000 RE 9,600 AE 570
8/14 10:24 Tappan Main 96 E 9,800 1,600 <64 <840 <20
8/15 10:17 Tappan Main 21 E 51,000 <500 E 420 <3,400 <80
7/11 11:16 Tappan ditch 340 45,000 <130 <110 <1,400 <33
7/25 11:09 Tappan ditch 120 E 10,000 <220 <110 <1,400 <33
8/7 17:53 Tappan ditch 2000 590,000 E 590 <260 <3,400 <80
8/14 10:39 Tappan ditch >2400 65,000 E 710 E 930 5,100 <33
8/15 13:10 Tappan ditch ND 350,000 2,600 E 550 <3,400 <80a Not considered a detection because it was below the value found in one field blank.
Escherichia coli and MST Markers in Lake-Water Samples 7
EXPLANATION
Not detected
Estimated quantity
Measured quantity
0
20
40
60
80
100
Human Ruminant Dog Gull
Det
ectio
ns, i
n pe
rcen
t
A B C A B C A B C A B C
Figure 2. Percentages of samples with not detected, estimated quantities, and measured quantities of microbial source tracking markers: A, Buckeye Lake Crystal and Fairfield. B, Atwood Lake. C, Tappan Lake Main and ditch, 2011.
of samples from Buckeye Lake, Atwood, and Tappan, respec-tively, with some uncertainty in the measurements in all sam-ples. The dog marker was detected in 40, 43, and 30 percent of samples from Buckeye Lake, Atwood, and Tappan, respec-tively. The gull marker was found in only two samples, both from Tappan Main. Results from the Wilcoxon rank-sum test indicated that the median concentrations of E. coli in samples with detections of markers were not significantly different from samples without detections of human (p = 0.24), ruminant (p = 0.40), and dog (p = 0.15) markers. This test was not done on the gull marker because only two detections were found.
In this study, samples were collected and analyzed by use of microbial source tracking techniques to take the first step towards understanding sources of fecal contamination at five
sites at three inland recreational lakes. It should be empha-sized, however, that microbial source tracking techniques are in an experimental and developmental phase as a field of science specialization. Experts in the field recommend that multiple methods be used to characterize fecal contamination at a site and that source feces from the study area be tested to confirm that source-associated MST markers are present (Sargeant and others, 2011). Given these limitations, in order to fully characterize sources at the Buckeye Lake sites, more work needs to be done to collect samples under a variety of hydrological and environmental conditions, collect fecal source samples in the watershed, collect afternoon samples when swimmers are present, and apply other source tracking tools to establish multiple lines of evidence.
8 Microbial Source Tracking Markers at Three Inland Recreational Lakes in Ohio, 2011
References Cited
Bower, P.A., Scopel, C.O., Jensen, E.T., Depas, M.M., and McLellan, S.L., 2005, Detection of genetic markers of fecal indicator bacteria in Lake Michigan and determination of their relationship to Escherichia coli densities using stan-dard microbiological methods: Applied and Environmental Microbiology, v. 71, no. 12, p. 8305–8313.
Edge, T.A., Hill, S., Seto. P., and Marsalek, J., 2010, Library-dependent and library-independent microbial source tracking to identify spatial variation in faecal contamina-tion sources along a Lake Ontario beach: Water Science & Technology, v. 62, no. 3, p. 719–727.
Kildare, B.J., Leutenegger, C.M., McSwain, B.S., Bambic, D.G., Rajal, V.B., and Wuertz, S., 2007, 16S rRNA-based assays for quantitative detection of universal, human-, cow-, and dog-specific fecal Bacteroidales—A Bayesian approach: Water Research, v. 41, no. 16, p. 3701–3715.
Layton, A., McKay, L., Williams, D., Garrett, V., Gentry, R., and Sayler, G., 2006, Development of Bacteroides 16S rRNA gene TaqMan-based real-time PCR assays for estima-tion of total, human, and bovine fecal pollution in water: Applied and Environmental Microbiology, v. 72, no. 6, p. 4214–4224.
Myers, D.N., Stoeckel, D.M., Bushon, R.N., Francy, D.S., and Brady, A.M.G., 2007, Fecal indicator bacteria (ver. 2.0): U.S. Geological Survey Techniques of Water-Resources Investigations, book 9, chap. A7, section 7.1, accessed October 2011 at http://pubs.water.usgs.gov/twri9A/.
Ohio Department of Health, 2011, Bathing beach monitoring program, accessed October 2011 at http://www.odh.ohio.gov/odhprograms/eh/bbeach/beachmon.aspx.
Seurinck, S., Defoirdt, T., Verstraete, W., and Siciliano, S.D., 2005, Detection and quantification of the human-specific HF183 Bacteroides 16S rRNA genetic marker with real-time PCR for assessment of human faecal pollution in fresh-water: Environmental Microbiology, v. 7, no. 2, p. 249–259.
Sinigalliano, C.D., Fleisher, J.M., Gidley, M.L., Solo-Gabriele, H.M., Shibata, T., Plano, L.R., Elmir, S.M., Wanless, D., Bartkowiak, J., Boiteau, R., Withum, K., Abdelzaher, A.M., He, G., Ortega, C., Zhu, X., Wright, M.E., Kish, J., Hollenbeck, J., Scott, T., Backer, L.C., and Fleming, L.E., 2010, Traditional and molecular analyses for fecal indicator bacteria in non-point source subtropical recreational marine waters: Water Research, v. 44, no.13, p. 3763–3772.
Sargeant, D., Kamin, W.R., and Collyard, S., 2011, Review and critique of current microbial source tracking (MST) techniques: Olympia, Wash., Washington State Depart-ment of Ecology Publication No. 11-03-038, accessed September 2012 at https://fortress.wa.gov/ecy/publications/SummaryPages/1103038.html, 66 p.
Stoeckel, D.M., Stelzer, E.A., Stogner, R.W., and Mau, D.P., 2011, Semi-quantitative evaluation of fecal contamina-tion potential by human and ruminant sources using multiple lines of evidence: Water Research, v. 45, no. 10, p. 3225–3244.
Wong, M., Kumar, L., Jenkins, T.M., Xagoraraki, I., Phaniku-mar, M.S., and Rose, J.B., 2009, Evaluation of public health risks at recreational beaches in Lake Michigan via detec-tion of enteric viruses and a human-specific bacteriological marker: Water Research, v. 43, no. 4, p. 1137–1149.


Francy and Stelzer—M
icrobial Source Tracking Markers at Three Inland Recreational Lakes in O
hio, 2011—O
pen-File Report 2012–1222