MICROBIAL KINETICS OF ANODE-RESPIRING … on science and scifi, for teaching me microbial kinetics...
161
Management of Microbial Communities to Improve Growth of Chloroethene-Respiring Dehalococcoides by Anca Georgiana Delgado A Dissertation Presented in Partial Fulfillment of the Requirements for the Degree Doctor of Philosophy Approved July 2013 by the Graduate Supervisory Committee: Rosa Krajmalnik-Brown, Chair Hinsby Cadillo-Quiroz Rolf U. Halden Bruce E. Rittmann Valerie Stout ARIZONA STATE UNIVERSITY August 2013
-
Upload
nguyenkiet -
Category
Documents
-
view
220 -
download
2
Transcript of MICROBIAL KINETICS OF ANODE-RESPIRING … on science and scifi, for teaching me microbial kinetics...

Management of Microbial Communities to Improve Growth of Chloroethene-Respiring
Dehalococcoides
by
Anca Georgiana Delgado
A Dissertation Presented in Partial Fulfillment
of the Requirements for the Degree
Doctor of Philosophy
Approved July 2013 by the
Graduate Supervisory Committee:
Rosa Krajmalnik-Brown, Chair
Hinsby Cadillo-Quiroz
Rolf U. Halden
Bruce E. Rittmann
Valerie Stout
ARIZONA STATE UNIVERSITY
August 2013
ABSTRACT
Reductive dechlorination by members of the bacterial genus Dehalococcoides is a
common and cost-effective avenue for in situ bioremediation of sites contaminated with
the chlorinated solvents, trichloroethene (TCE) and perchloroethene (PCE). The
overarching goal of my research was to address some of the challenges associated with
bioremediation timeframes by improving the rates of reductive dechlorination and the
growth of Dehalococcoides in mixed communities.
Biostimulation of contaminated sites or microcosms with electron donor fails to
consistently promote dechlorination of PCE/TCE beyond cis-dichloroethene (cis-DCE),
even when the presence of Dehalococcoides is confirmed. Supported by data from
microcosm experiments, I showed that the stalling at cis-DCE is due a H2 competition in
which components of the soil or sediment serve as electron acceptors for competing
microorganisms. However, once competition was minimized by providing selective
enrichment techniques, I illustrated how to obtain both fast rates and high-density
Dehalococcoides using three distinct enrichment cultures. Having achieved a heightened
awareness of the fierce competition for electron donor, I then identified bicarbonate
(HCO3−) as a potential H2 sink for reductive dechlorination. HCO3
− is the natural buffer
in groundwater but also the electron acceptor for hydrogenotrophic methanogens and
homoacetogens, two microbial groups commonly encountered with Dehalococcoides. By
testing a range of concentrations in batch experiments, I showed that methanogens are
favored at low HCO3−
and homoacetogens at high HCO3−. The high HCO3
−
concentrations increased the H2 demand which negatively affected the rates and extent of
i

dechlorination. By applying the gained knowledge on microbial community
management, I ran the first successful continuous stirred-tank reactor (CSTR) at a 3-d
hydraulic retention time for cultivation of dechlorinating cultures. I demonstrated that
using carefully selected conditions in a CSTR, cultivation of Dehalococcoides at short
retention times is feasible, resulting in robust cultures capable of fast dechlorination.
Lastly, I provide a systematic insight into the effect of high ammonia on communities
involved in dechlorination of chloroethenes. This work documents the potential use of
landfill leachate as a substrate for dechlorination and an increased tolerance of
Dehalococcoides to high ammonia concentrations (≥2 g L−1
NH4+-N) without loss of the
ability to dechlorinate TCE to ethene.
ii

ACKNOWLEDGMENTS
This dissertation research was possible through the collaboration with and help of
many people. I will start by acknowledging my Ph.D. advisor, Dr. Rosa Krajmalnik-
Brown. Rosy, you have inspired in me the very same passion and scientific curiosity you
have for reductive dechlorination, microbial interactions, and our favorite microbe,
Dehalococcoides. As my academic advisor, you have holistically mentored me to ensure
I will become a good researcher by teaching me to be a better critical thinker, to reason
my experiments through, to do publication-quality research, by giving me “freedom” in
the laboratory, by constantly giving me feedback on experiments and written documents,
and by showing interest in my work. You have also gone above and beyond your
academic responsibilities to look out for me on so many occasions and, like a parent, to
help me overcome the rougher times and to not lose focus. I am immensely grateful and
deeply honored to be forever bonded with you in my career in science.
I will next acknowledge my committee members, Dr. Bruce Rittmann, Dr. Rolf
Halden, Dr. Hinsby Cadillo-Quiroz, and Dr. Valerie Stout. Bruce, you have contributed
to this dissertation by giving feedback (and geography lessons) on the projects on
numerous occasions from written documents and research presentations. But I think your
greatest contribution is instilling in me the appreciation and joy of collaborative work,
which is a core philosophy in the Center you lead. Rolf, as a member of my committee,
you have been directly and from the very beginning involved in my Ph.D. projects. I
thank you for involvement in advancing my work towards publications and for providing
me with your expertise from field work. Hinsby and Valerie, I am grateful to have had
iii

the support of such exemplary microbiologists and educators, and I thank you both for
contributions from our committee meetings.
I give credit to Dr. César Torres, Dr. Prathap Parameswaran, and Dr. Sudeep
Popat for sharing both science and friendship with me, and for unofficially mentoring me
in their areas of expertise. César, I thank you for the numerous, tireless insightful
discussions on science and scifi, for teaching me microbial kinetics and thermodynamics,
and for your magic hands that made the CSTR work possible and fixed so many things in
the lab throughout the years. Prathap, you have been my hands-on mentor in the
laboratory and have showed me the many faces of the anaerobic world. You have also
been an inspiration for your work ethic in the lab, time management, and mentorship
philosophy. Sudeep, your involvement in some of my projects and your effortless,
constant availability to answer questions and debate science, have made you one of my
favorite people to work with.
Next, I acknowledge Diane Hagner, our lab manager, for having our Center safe,
organized and efficient, for her friendship and for ensuring that I, and so many others, can
perform our research. I thank past and present members of the dechlorination team,
Michal Ziv-El, Ying Yao, Katie Nelson, Kylie Kegerreis, and Devyn Fajardo-Williams,
for all their help and hard work. Michal, you have been a leader in our team and I am
grateful for all that I’ve learned from you and with you on reductive dechlorination.
Devyn, you have been beyond instrumental to this dissertation work and I am grateful to
have mentored you and worked so closely with you in the past years. I also acknowledge
Jon Badalamenti, my friend and fellow microbiologist, for moral support and help in the
iv

lab on so many occasions. A big thanks to Daewook Kang for his expertise on
pyrosequencing and his willingness to be part of my research, and Joe Micelli, for his
contributions to the work in Chapter 3. I am also thankful to Hansa Done, Emily
Bondank, Zuena Mushtaq, and Mark Peng, my mentees, for their hard work and
contributions to this dissertation work. And, I thank Natasha Weatherspoon, my close
friend and my mentor when I was an undergraduate, for teaching me core microbiology
and molecular biology skills, and for sharing together the grad school experience.
Lastly, for their love, patience, and support, I thank my family close by: my aunt,
Nicoleta, my uncle, Kevin, my cousins, Viktor, Péter, and Liliom, and my family far
away: my gradparents, Niculaie and Kati, my beloved mother, Emi, and my brother, Adi.
Adi, I dedicate this work to you!
v

TABLE OF CONTENTS
Page
LIST OF TABLES………………………………………………………………………..ix
LIST OF FIGURES…………………………………………………………………….... x
CHAPTER
1. INTRODUCTION AND SIGNIFICANCE ............................................................... 1
The legacy of chlorinated ethenes as environmental pollutants ............................. 1
Prospects for bioremediation .................................................................................. 2
Dissertation framework ........................................................................................... 4
2. BACKGROUND ........................................................................................................ 9
Chlorinated ethenes .................................................................................................... 9
Microbiology at work towards remediating chlorinated ethenes contamination ..... 11
Dehalococcoides, the prominent bioremediator ...................................................... 14
Reductive dehalogenase: core enzymes for organohalide respiration ..................... 21
Importance of mixed cultures containing Dehalococcoides .................................... 22
DehaloR^2, a model Dehalococcoides-containing dechlorinating culture
performing rapid dechlorination of TCE to ethene .................................................. 27
3 SELECTIVE ENRICHMENT TECHNIQUES ABRIDGE SOIL OR SEDIMENT
MICROBIAL DIVERSITY TO YIELD ROBUST CHLORINATED ETHENES-
RESPIRING DEHALOCOCCOIDES CULTURES ................................................ 34
Introduction .............................................................................................................. 34
Materials and methods ............................................................................................. 37
Results and discussion ............................................................................................. 42
vi

CHAPTER Page
4 ROLE OF BICARBONATE AS A PH BUFFER AND ELECTRON SINK IN
MICROBIAL DECHLORINATION OF CHLOROETHENES ............................. 56
Introduction .............................................................................................................. 56
Materials and methods ............................................................................................. 60
Results and discussion ............................................................................................. 64
Conclusions .............................................................................................................. 77
5 SUCCESSFUL OPERATION OF CONTINUOUS REACTORS AT SHORT
RETENTION TIMES RESULTS IN HIGH-DENSITY, FAST-RATE
DEHALOCOCCOIDES DECHLORINATING CULTURES ................................. 78
Introduction .............................................................................................................. 78
Materials and methods ............................................................................................. 83
Results ...................................................................................................................... 88
Discussion ................................................................................................................ 97
6 EFFECT OF HIGH AMMONIA ON MICROBIAL COMMUNITIES DRIVING
CHLORINATED ETHENES REDUCTIVE DECHLORINATION .................... 101
Introduction ............................................................................................................ 101
Materials and methods ........................................................................................... 104
Results and discussion ........................................................................................... 107
vii

CHAPTER Page
7 KEY FINDINGS AND RECOMMENDATIONS FOR FUTURE WORK ..........118
Key findings ........................................................................................................... 118
Recommendations for future work ........................................................................ 121
REFERENCES ............................................................................................................... 131
viii

LIST OF TABLES
Table Page
2.1 Chlorinated ethenes factsheet. ....................................................................................10
2.2 Dehalogenation capabilities of isolated D. mccartyi strains. ......................................17
2.3 Inocula sources and enrichment conditions of chlorinated ethenes-dechlorinating
cultures. .....................................................................................................................24
2.4 Comparison of maximum chlorinated ethene turnover rates (ΔC Δt–1
)max to
ethene and the corresponding concentration of Dehalococcoides ............................32
3.1 Conversion rates of TCE to ethene, Dehalococcoides concentrations and yields in
the sediment-free enrichment cultures developed in this study. ...............................47
4.1 Time course pH measurements. ..................................................................................76
5.1 Experimental conditions tested for CSTR optimization .............................................82
5.2 Maximum conversion rate of chloroethenes by DehaloR^2 culture produced in a
CSTR fed with 1 mM TCE and 2 mM TCE influent concentrations .......................94
5.3 Summary of key parameters and microbial inocula employed in chlorinated
ethenes CSTR studies ...............................................................................................98
6.1 A Northwest Regional Landfill leachate characterization from Surprise, AZ. .........105
6.2 Extent of TCE reductive dechlorination observed at the ammonia concentrations
tested in this study. ..................................................................................................109
6.3 Comparison of microbial growth as determined by qPCR .......................................114
ix
LIST OF FIGURES
Figure Page
2.1 Schematic of reductive dechlorination. .......................................................................11
2.2 Phylogenetic tree of organohalide respiring bacteria ..................................................13
2.3 Schematic of bioremediation via biostimulation and bioaugmentation. .....................15
2.4 Chemical conditions of chlorinated ethenes in culture microcosoms and
sediment-free cultures ...............................................................................................29
2.5 Bacterial community diversity by phylum in the microcosm sediment and
duplicate DehaloR^2 enrichment cultures ................................................................30
2.6 Dechlorination of TCE to ethene where the electron donors were (a) lactate and
methanol, and (b) lactate only ...................................................................................32
3.1 Biostimulation of organohalide-respiring communities containing
Dehalococcoides and dechlorination of TCE in microcosms, first transfers from
microcosms, and enriched soil/sediment-free cultures. ............................................44
3.2 Methane production in microcosms and subsequent enrichment cultures. .................45
3.3 Bacterial diversity at class level as determined by 454 pyrosequencing of the V2-
V3 region of the 16S rRNA genes ............................................................................49
3.4 Alpha and Beta microbial diversity analyses ..............................................................51
3.5 Enumeration of Dehalococcoides mccartyi in enrichment cultures ...........................53
3.6 Bioaugmentation of microcosms with their respective enrichment cultures. .............54
4.1 Chloroethenes dechlorination at different HCO3− concentrations ..............................65
x

Figure Page
4.2 Methanogenesis and homoacetogenesis during active evolvement of reductive
dechlorination ...........................................................................................................68
4.3 Calculated HCO3− consumption for methane and acetate production ........................70
4.4 Distribution of electrons fed as H2 towards dechlorination, methanogenesis, and
homoacetogenesis at various HCO3−
concentrations. ...............................................72
4.5 pH changes resulting from biological HCO3−
consumption .......................................75
5.1 Schematic and photograph of the experimental apparatus employed .........................84
5.2 Dechlorination of 1 mM TCE and 2 mM TCE influent and the corresponding
percent ethene conversion in CSTRs operated at a 3-d HRT ...................................89
5.3 Microbial populations abundance in a 3-d HRT CSTR determined by qPCR. ..........91
5.4 Consumption of lactate and methanol and production of acetate, propionate, and
methane during continuous feed of medium in a 3-d HRT CSTR. ..........................93
5.5 Experimental time-course measurements to determine the maximum rate of
conversion, Rmax, for the culture produced in a 3-dHRT CSTR ...............................95
5.6 Viability and performance of DehaloR^2 culture produced in a CSTR after
storage at 4 °C for 7 months and 15 months ............................................................96
6.1 Dechlorination of TCE to ethene by ZARA-10 culture in bottles containing (A)
0.08 (Control), (B) 0.5, (C) 1 and (D) 2 g L−1
NH4+-N. ..........................................108
6.2 Effect of ammonia on fermentation (A-D), methanogenesis (E) and reductive
dechlorination (F) for ZARA-10 culture. ................................................................111
xi

Figure Page
6.3 Quantitative PCR enumerating the 16S rRNA gene copies of Dehalococcoides,
Geobacteraceae, and Archaea, and FTHFS gene copies for each ammonia
concentration tested ................................................................................................113
6.4 Assessment of dechlorination of TCE in bottles containing landfill leachate and
bioaugmented with a dechlorinating culture (10% inoculum). ...............................116
xii

1
CHAPTER 1
INTRODUCTION AND SIGNIFICANCE
1.1 The legacy of chlorinated solvents as environmental pollutants
Contamination with anthropogenic chemicals from the industry-driven progress of
civilization has bared heavy effects on land and water resources worldwide. The ‘70s
and ‘80s were pivotal in the realization of the effect of environmental contaminants on
human health and the need to establish laws and agencies to better protect people. A
prominent example is the founding of the U.S. Environmental Protection Agency (EPA)
in 1970, which set to ensure environmental protection to the American people through a
range of federal research, monitoring, standard-setting, and enforcement activities (US
EPA 1992). This was followed in 1972 by the Clean Water Act (based on the Federal
Water Pollution Control Act of 1948) and by the Comprehensive Environmental
Response, Compensation and Liability Act (CERCLA) in 1980, which established the
Superfund program, an environmental program addressing abandoned hazardous waste
sites (US EPA 2013b). As a result of these actions and the continuing update of
environmental policies and regulations in the latest decades, we have achieved better
environmental practices and have taken action towards remediating sites affected by
pollutants.
However, decades of improper disposal practices of chemicals, careless handling,
accidental spills, and the continuous generation of waste by all communities, industries,
technologies and military, have taken a heavy toll on the environment. To date, there are
~1300 Superfund sites and hundreds of thousands of sites polluted with organic and

2
inorganic compounds requiring decontamination (US EPA 2013b). In fact, the EPA
estimates that a quarter of American populations resides within four miles of a Superfund
hazardous waste site (US EPA 2012). Some of the most common organic pollutants at
Superfund sites, U.S. National Priorities List (NPL) and groundwater sources are the
chlorinated ethenes, trichloroethene (TCE) and perchloroethene (PCE) (McCarty 1997;
Moran et al. 2007; Rittmann and McCarty 2001; US EPA 2013b).
1.2 Prospects for bioremediation
Both TCE and PCE were used extensively in the past century as organic solvents
for multiple industrial processes (summarized in section 2.1). Most of the environments
containing chlorinated ethenes are the result of activities that took place many years ago,
although accidental spills still occur nowadays (Office of Response and Restoration
2012). Chlorinated ethenes are of major concern to the public as they have serious health
effects. According to the Agency for Toxic Substances and Disease Registry (ATSDR),
the reported health effects include liver and kidney toxicity and depression of the nervous
system (ATSDR 2011), while prolonged exposure can cause cancer (National Research
Council 2006). Because of their frequent presence in groundwater, toxicity and potential
for human exposure, the EPA and the ATSDR have placed TCE and PCE in the 2011
Priority List of Hazardous Substances at number 16 and 33, respectively, out of 275
substances (ATSDR 2011). Vinyl chlorinde (VC), a monochlorinated ethene synthesized
as a precursor for polyvinyl chloride plastic and a product of biological transformation of
polychlorinated ethenes (reviewed in section 2.1 and 2.2), is the first organic pollutant of
the ATSDR list, ranked at number 4, after arsenic, lead, and mercury (ATSDR 2011).

3
Between 2000 and 2009, the EPA allocated over $200 million/year for
remediation, which includes remediation of chloroethenes, and estimated that
remediation for fiscal years 2010 to 2014 would be from $335 to $681 million each year
(United States Government Accountability Office 2010). Towards these remediation
efforts, a multitude of physical, chemical and biological treatments have been employed
for cleanup of chlorinated solvents. The EPA website lists the following: pump-and-treat
systems, bioremediation, electrokinetics, flushing technologies (cosolvent/alcohol
flooding, surfactant flushing, in situ oxidation), monitored natural attenuation,
phytoremediation, thermal processes (steam injection, electrical heating, in situ
vitrification), volatilization technologies (soil vapor extraction, air sparging, in-well
stripping), and treatment walls (US EPA 2013c).
Among the biological methods, bioremediation using Dehalococcoides via
reductive dechlorination is an accepted, environmentally benign, and cost effective
approach for decontaminating water and soil polluted with chlorinated ethenes (Ellis et
al. 2000; Hendrickson et al. 2002; Lendvay et al. 2003; Major et al. 2002).
Dehalococcoides can utilize PCE and TCE, and the lesser chlorinated ethenes,
dichloroethene (DCE) and VC, as electron acceptors for energy metabolisms, generating
ethene, as the non-toxic end product (He et al. 2003b; Maymo-Gatell et al. 1997; Sung et
al. 2006b). At contaminated sites, bioremediation using Dehalococcoides-containing
cultures occurs through biostimulation or bioaugmentation. Biostimulation entails
establishing the appropriate conditions (pH, redox potential) and providing nutrients for
growth (electron donor, carbon source, and vitamins) to stimulate growth of the
endogenous Dehalococcoides microbial populations. Bioaugmentation involves the same
4
steps as for biostimulation, plus the addition of a microbial consortium capable to
dechlorination of PCE and TCE to ethene. To this day, all effective bioaugmentation
consortia for chlorinated ethenes contain the bacterial genus Dehalococcoides.
1.3 Dissertation framework
Because of Dehalococcoides’ unique ability to transform chlorinated ethenes to
ethene, hundreds of sites have been restored via biostimulation or bioaugmentation (Lyon
and Vogel 2012). Moreover, bioaugmentation with Dehalococcoides-containing cultures
for remediation of chlorinated solvents is now the emblematic example of
bioaugmentation due to some clearly documented successes (Ellis et al. 2000; Lendvay et
al. 2003; Lyon and Vogel 2012; Major et al. 2002). Nevertheless, in situ bioremediation
using Dehalococcoides-containing cultures is many times hindered by factors leading to
undesired or unpredictable outcomes. Some of these include difficulty of aquifer
preconditioning, pH management, choice of electron donor as H2 precursor, in situ
transport and distribution of microbial cultures and nutrients, composition and efficacy of
bioaugmentation cultures, declines due to not well understood microbial interactions, and
the very long time often needed to achieve targeted site cleanup (Stroo et al. 2012).
The overarching goal of my dissertation research is to address some of the
challenges associated with bioremediation timeframes by improving growth of
Dehalococcoides in mixed communitied and the rates of reductive dechlorination. My
four main dissertation objectives were to 1) propose and validate a laboratory enrichment
method that consistently results in fast rates of TCE dechlorination and mixed cultures
with high-densities of Dehalococcoides, 2) evaluate the role of bicarbonate as a pH buffer

5
and electron sink in the microbial dechlorination of chloroethenes, 3) develop and
optimize a continuous bioreactor for fast cultivation of Dehalococcoides in mixed
cultures, and 4) assess the effect of high ammonia concentrations on TCE dechlorination
and the microbial communities directly and indirectly involved in the dechlorination
process.
To accomplish these objectives, I applied a combination of fundamental
principles of microbiology and engineering. The laboratory research experiments
discussed herein complement important needs in the field of bioremediation and can be
utilized to draft strategies to advance bioremediation of chlorinated ethenes. Moreover,
my research expands our fundamental understanding of the physiology, kinetics, and
ecology of Dehalococcoides-based mixed cultures. The structure of the dissertation is as
follows:
Chapter 2. I first provide a background on chlorinated ethenes, reductive dechlorination,
Dehalococcoides, and mixed communities. In addition to the relevant literature review,
in Chapter 2 I also summarize a line of research (where I was directly involved) that
played a significant role towards the motivation and the research approaches in Chapters
3-6. This is the characterization of DehaloR^2, the principal dechlorinating culture
containing Dehalococcoides enriched in the Krajmalnik-Brown Laboratory with sediment
samples retrieved and provided by Dr. Rolf Halden. The work on DehaloR^2 was
published in Applied Microbiology and Biotechnology (Ziv-El et al. 2011; Ziv-El et al.
2012a).

6
Chapter 3. Biostimulation with electron donor sometimes fails to promote the growth of
Dehalococcoides and significant reductive dechlorination beyond cis-DCE in microcosm
experiments or at contaminated sites. I hypothesized that, often times, the discrepancy
between the presence and the activity of Dehalococcoides is not due to their metabolic
potential, but to the inherent intricacies driven by the variety of alternate electron
acceptors in soils or sediments. In this chapter, I investigated selective enrichment and
culturing techniques to abridge microbial diversity in order to yield ethene, the desired
end-product of reductive dechlorination of chloroethene, and robust growth of
chlorinated ethene-respiring Dehalococcoides in mixed cultures. The research in this
chapter also describes the enrichment and characterization of three additional
dechlorinating cultures, ZARA-10, LINA-09, and ISLA-09. This chapter will be
submitted for publication.
Chapter 4 Buffering to achieve pH control is crucial for successful TCE anaerobic
bioremediation. Bicarbonate (HCO3−) is the natural buffer in groundwater and the buffer
of choice in the laboratory and at contaminated sites undergoing biological treatment with
organohalide respiring microorganisms. However, HCO3− also serves as the electron
acceptor for hydrogenotrophic methanogens and hydrogenotrophic homoacetogens, two
microbial groups competing with Dehalococcoides for H2. I studied the effect of HCO3−
as a buffering agent and the effect of HCO3−-consuming reactions in a range of
concentrations (2.5-30 mM). My hypothesis was that the presence of excess HCO3−
would channel electrons towards methanogenesis and homoacetogenesis, and, hence, this

7
competition for H2 would decrease the rates of reductive dechlorination. This chapter
was published in an altered format in Microbial Cell Factories (Delgado et al. 2012).
Chapter 5. With the knowledge acquired on enriching, growing, and managing
Dehalococcoides-containing cultures, I next address the need for continuous production
of dense cultures in larger volumes in the laboratory. In this chapter, I report on the
successful growth of a representative Dehalococcoides-containing culture in a
continuous-flow stirred tank reactor (CSTR) at a 3-d hydraulic retention time using feed
concentrations of 1 and 2 mM TCE, respectively. Typically, Dehalococcoides cultures
are grown in batch-fed reactors. Batch systems can be cumbersome, as self or
competitive inhibition on dechlorination, and toxicity on Dehalococcoides and other
community members prevents feeding TCE or PCE in high concentrations. Therefore,
batch cultivation of Dehalococcoides entails receiving (and reducing mostly to ethene)
several non-inhibitory, successive feeds of electron acceptors. A CSTR theoretically
could overcome these limitations. However, based on the findings from Chapter 3 and 4,
I hypothesized that, for successful cultivation of Dehalococcoides-containing cultures, I
must minimize the excessive proliferation of microorganisms competing with
Dehalococcoides for H2. This chapter will be submitted for publication.
Chapter 6. A large majority of soil and groundwater environments containing PCE or
TCE are also impacted by other co-contaminants, e.g., other organic chlorinated solvents,
petroleum hydrocarbons, heavy metals, inorganic, and organic nitrogen. Under
appropriate conditions, the latter represents a potential nutrient source. Prime examples
8
of environments where chloroethenes and nitrogen-containing compounds such as
ammonium/ammonia are found as co-contaminants are landfills. A large number of
cases of groundwater contamination with landfill leachate have been documented.
Therefore, in this chapter I assessed the impact of total ammonia nitrogen on mixed
microbial communities driving the reductive dechlorination of TCE and the possibility of
using leachate as electron donor for dechlorination or ammonia-nitrogen as specific
inhibitor of the microbial community members. This chapter will be submitted for
publication.
Chapter 7. Here, I present key findings and some concluding remarks from the research
studies described in Chapters 3-6. I also make recommendations for studies that would
either be a natural progression or alongside the research from this dissertation. These
include constructing and deconstructing reductively dechlorinating communities, finding
a “natural” electron acceptor for Dehalococcoides, and modeling reductive dechlorination
in a CSTR.

9
CHAPTER 2
BACKGROUND
2.1 Chlorinated ethenes
PCE and TCE have accumulated in the environment as a consequence of their
broad commercial and industrial usages and historically careless disposal. In fact, before
1972, encouraged by the preconception that “dilution is the solution to pollution”, these
solvents were commonly disposed in the ground or down the drain (Loffler et al. 2012).
Because of their low solubility and higher density than water, PCE and TCE migrated in
the subsurface where they often persist as dense nonaqueous phase liquids (DNAPLs).
Table 2.1 summarizes relevant properties and facts for chlorinated ethenes, which range
from a tetra-chlorined ethene (PCE) to a monochlorinated ethene (VC), and ethene, the
non-chlorinated backbone compound. The dichloroethene (DCE) isomers (cis-, trans-,
and 1,1-) and VC also have industrial application or serve as intermediates in chemical
processes (Table 2.1). Contamination with DCEs and VC from industry manufacturing
has been reported (Bradley 2003; Office of Response and Restoration 2012). However,
unlike PCE and TCE, the large majority of contamination with DCEs and VC has arisen
from biological and abiotic transformation of the higher chlorinated ethenes and
trichloroethane (TCA), another priority pollutant and industrial organic solvent.

10
Table 2.1 Chlorinated ethenes factsheet
Compound Molecular
weight
Aqueous
solubility
(mM)
Main industrial usage ATDSR
2011
rank
Health effects EPA maximum
contaminant
level (µg L−1
)
PCE 165.83 1.2 Dry cleaning agent, metal
degreaser, solvent,
chemical intermediate
33 Probable human
carcinogen
5
TCE 131.39 8.4 Metal degreaser and
cleaning agent, chemical
intermediate
16 Human
carcinogen
5
cis-DCE 96.94 36.1 Waxes and resins solvent,
rubber extraction agent,
refrigerant, chemical
intermediate
213 Probable human
carcinogen
70
trans-DCE 96.94 64.9 Waxes and resins solvent,
rubber extraction agent,
refrigerant, chemical
intermediate
177 Probable human
carcinogen
100
1,1-DCE 96.94 25.8 Production agent for
adhesives and synthetic
fibers, refrigerant, food
packaging and coating
resins agent
81 Probable human
carcinogen
7
VC 62.49 43.2 Chemical intermediate 4 Human
carcinogen
2
Ethene 28.05 4.7 Fruit ripening agent,
chemical intermediate
- - None

11
2.2 Microbiology at work: reductive dechlorination by organohalide respiring
bacteria
All chlorinated ethenes can be transformed by microbes under anaerobic
conditions through reductive dechlorination, which is the core process of my research.
Reductive dechlorination has also been termed halorespiration, chlororespiration,
dechlororespiration, and organohalide respiration. Throughout this dissertation, I use
reductive dechlorination and organohalide respiration. A schematic of reductive
dechlorination of PCE to ethene is presented in Figure 2.1. Reductive dechlorination
entails removing a chlorine atom and replacing it with a hydrogen atom in a stepwise
fashion, as depicted in Figure 2.1. Two electrons are required to drive the replacement of
each chlorine atom; therefore, dechlorination of PCE to ethene is an eight electron
process. Additionally, one proton (H+) and one Cl
− are released at each dechlorination
step.
Figure 2.1 Schematic of reductive dechlorination. Sequential reductive dechlorination of
PCE, TCE, DCE, and VC to ethene and the corresponding oxidation of H2 at each step in
the pathway. The most common DCE congener from reductive dechlorination is cis-
DCE. The smaller size of trans- and 1,1-DCE in the schematic is meant to denote the
lower abundance of these products.

12
Biological reductive dechlorination of PCE to VC was first described by Bouwer
and McCarty (Bouwer and McCarty 1983), and the revelation that VC, the most toxic
intermediate from reductive dechlorination, can be detoxified to ethene under
methanogenic conditions followed several years later (Distefano et al. 1991; Freedman
and Gossett 1989). These works were pivotal to establishing a line of research on
microorganisms with the potential to transform chlorinated solvents to an
environmentally harmless product, thus becoming important for biotechnological
applications. Bacteria capable of organohalide respiration using halogenated compounds
have been reviewed in several publications (Hug et al. 2013; Loffler and Edwards 2006;
Loffler et al. 2005; Smidt and de Vos 2004; Tas et al. 2010). The phylogenetic
relationship between the multiple groups of organohalide respirers is shown in Figure 2.2.

13
Figure 2.2 Phylogenetic tree of organohalide respiring bacteria based sequences of 16S
rRNA gene. The bacterial names and taxa in bold letters indicate already completed or in
progress genome sequencing. This figure is from Tas et al. (2010).

14
2.3 Dehalococcoides, the prominent bioremediator
Chlorinated ethenes dechlorinators are found within the Gram-negative and
Gram-positive groups and belong to diverse taxa: Chloroflexi (class Dehalococcoidetes),
Firmicutes (class Clostridia) and Proteobacteria (class δ- and ε-Proteobacteria)
(Figure 2.2). Multiple genera are capable of partial reduction of PCE and TCE to cis-
DCE, e.g. Geobacter (Sung et al. 2006a), Desulfuromonas (Loffler et al. 2000),
Desulfitobacterium (Gerritse et al. 1996), Sulfurospirillum (Luijten et al. 2003),
Dehalogenimonas (Manchester et al. 2012) , and Dehalobacter (Holliger et al. 1998).
Dehalococcoides is the only genus capable of complete reduction of PCE to ethene
(Maymo-Gatell et al. 1997) and the focal point of my studies. Dehalobacter,
Dehalogenimonas, and Dehalococcoides are strictly organohalide respiring bacteria;
however, most other genera perform alternate metabolic reactions using non chlorinated
electron acceptors, including sulfur reduction (Desulfuromonas (Loffler et al. 2000) and
Geobacter (Sung et al. 2006a)), fermentation (Desulfitobacterium (Villemur et al. 2006)
and Sulfurospirillum (Luijten et al. 2003)), metal reduction (Geobacter (Sung et al.
2006a) and Desulfitobacterium (Villemur et al. 2006)), and denitrification
(Sulfurospirillum (Luijten et al. 2003)).
In the survey of contaminated groundwater from multiple North American and
European sites by Hendrickson et al., Dehalococcoides were found in all site samples
where ethene formation was observed from the reductive dechlorination of PCE or TCE
(Hendrickson et al. 2002). To date, ethene formation from this process has not been
proven to occur in any other bacterium; hence, a paradigm exists exclusively linking

15
ethene production to Dehalococcoides. The isolation and characterization a
microorganism responsible of PCE detoxification to ethene, D. mccartyi strain 195, in
1997 was received with great interest and enthusiasm by the research community
(MaymoGatell et al. 1997) and have since put Dehalococcoides at the heart of
bioremediation of chlorinated solvents.
For bioremediation of chlorinated ethenes using Dehalococcoides, the main
processes implemented in the field are biostimulation and bioaugmentation (Lyon and
Vogel 2012). A simple schematic of the combined processes is provided in Figure 2.3.
Biostimulation entails establishing the appropriate conditions (pH, redox potential) and
providing nutrients for growth (electron donor, carbon source, and vitamins) to stimulate
the endogenous microbial populations at a contaminated site. Bioaugmentation usually
involves the same steps as for biostimulation, plus the addition of a microbial consortium
containing Dehalococcoides capable to dechlorination of PCE and TCE to ethene.
Figure 2.3 Schematic of bioremediation via biostimulation and bioaugmentation.

16
2.3.1 Dehalococcoides, an overview
Phylogenetically, D. mccartyi species are part of the phylum Chloroflexi (green
non-sulfur bacteria), class Dehalococcoidetes, order Dehalococcoidales, family
Dehalococcoidaceae, in the genus Dehalococcoides (Loffler et al. 2013). They are
mesophilic, neutrophilic, and strictly anaerobic microorganisms. Exposure to as little as
4 mg L−1
O2 results in cell death (Amos et al. 2008). Dehalococcoides are small in size
(one of the smallest bacteria characterized) with a diameter of 0.4-1 µm and a cell
thickness of 0.1 µm (He et al. 2005; MaymoGatell et al. 1997). They have an irregular
coccus-like morphology (hence, the name coccoid) that resembles a doughnut or a red
blood cell (MaymoGatell et al. 1997).
Isolation of these bacteria has been reported to be difficult, often requiring years
to obtain isolates (He et al. 2005; Loffler et al. 2005; Loffler et al. 2012; Loffler et al.
2013; Magnuson et al. 2000). Loffler et al. (2005) detailed the steps involved in the
enrichment, cultivation, and isolation of Dehalococcoides. Some of the inherent
difficulties in the isolation of these bacteria come from the fact that they need strictly
anaerobic conditions, are not culturable on agar plates, require multiple dilution-to-
extinction procedures to ensure purity, exhibit low biomass and turbidity cannot be
measured using optical density, and cannot be viewed effectively using light microscopy
(Loffler et al. 2012; Loffler et al. 2005). Despite of these challenges, several
characterized isolates exist and are compiled in Table 2.2.

17
Table 2.2 Dehalogenation capabilities of isolated D. mccartyi strains
D. mccartyi
strain
Electron acceptorsa,b
Reference
195 PCE, TCE, cis-DCE, 1,1-DCE,
trans-DCE, VC, 1,2-dibromoethane
(MaymoGatell et al. 1997)
HCB (Fennell et al. 2004)
2,3-DCP, 2,3,4-TCP
(Adrian et al. 2007)
1,2-DCA (Maymo-Gatell et al. 1999)
BAV1 cis-DCE, trans-DCE, 1,1-DCE, VC,
vinyl bromide, 1.2-DCA
(He et al. 2003a)
CBDB1 HCB (Adrian et al. 2000)
PCE, TCE (Adrian et al. 2007)
2,3-DCP; 2,3,4-TCP, , 2,3,5-TCP,
2,3,6-TCP, 3,4,5-TCP, 2,3,4,6-
TeCP, pentachlorophenol (Adrian et al. 2007)
polychlorinated dioxins (Bunge et al. 2003)
polychlorinated biphenyls (Adrian et al. 2009)
VS TCE, cis-DCE, 1,1-DCE, VC (Cupples et al. 2003; Muller
et al. 2004)
FL2
TCE, cis-1,2-DCE, trans-1,2-DCE,
PCE, VC (He et al. 2005)
GT TCE, cis-DCE, 1,1-DCE, VC (Sung et al. 2006b)
DCMB5 1,2,4-trichlorodibenzo-p-dioxin (Bunge et al. 2003)
1,2,3-TCB
MB PCE, TCE, octa-BDEs (Cheng and He 2009)
ANAS1 TCE, cis-DCE, 1,1-DCE (Lee et al. 2011)
ANAS2 TCE, cis-DCE, 1,1-DCE, VC (Lee et al. 2011) aThe list of electron acceptors for each strain includes those metabolized and cometabolized.
bAbbreviations: DCA, dichloroethane; HCB, hexachlorobenzene; TCB, trichlorobenzene; DCB,
dichlorobenzene; TeCP, tetrachlorophenol; TCP, trichlorophenol; DCP, dichlorophenol; MCP;
monochlorophenol; BDE, bromodiphenyl ether.
2.3.2 Metabolism and nutritional requirements
A central effort in my dissertation work is the targeted improvement of reductive
dechlorination rates and growth of Dehalococcoides. In all of my research chapters, I
address this effort through multiple avenues, including optimization of nutrients, nutrient
concentrations, and other components in the growth medium. Therefore, I next present
an overview of Dehalococcoides metabolism and nutritional requirements.

18
Electron acceptors. As seen in Table 2.2, in the laboratory, growth of
Dehalococcoides isolates has only been proven via organohalide respiration using an
array of halogenated and polyhalogenated electron acceptors, mainly chlorinated or
brominated, with varying carbon backbones, including ethenes (Cheng and He 2009; He
et al. 2005; He et al. 2003a; Lee et al. 2011; Maymo-Gatell et al. 1997; Sung et al.
2006b), ethanes (Maymo-Gatell et al. 1999), dioxins (Bunge et al. 2003), biphenyls
(Adrian et al. 2009), benzenes (Adrian et al. 2000; Fennell et al. 2004), and phenols
(Adrian et al. 2007). Based on the current knowledge, some of the strains (e.g., strain
195 and CBDB1) seem to be more metabolically diverse, while others (e.g., strain GT,
ANAS1, and ANAS2) are limited (based on the current library of tested acceptors) to
only one type of halogenated compound (Table 2.2). None of the isolated
Dehalococcoides strains tested was able to ferment or respire the following non-
halogenated electron acceptors: oxygen, sulfate, sulphite, thiosulphate, sulphur, fumarate,
nitrate, ferric iron, or 3-chloro-4-hydroxy benzoate (Adrian et al. 2000; He et al. 2005; He
et al. 2003b; Lee et al. 2011; Maymo-Gatell et al. 1997). The process of organohalide
respiration, through which Dehalococcoides derive energy, is mediated by a class of
enzymes called reductive dehalogenases (RDases). I include a discussion on these
enzymes in section 2.4.
Electron donor and carbon source. Whereas diverse in terms of the halogenated
electron acceptors they can utilize, thus far Dehalococcoides are restricted to H2 as their
obligate electron donor. All D. mccartyi strains grow by organohalide respiration when
H2 was provided as a gas, and none were able to derive reducing equivalents from

19
formate, acetate, lactate, pyruvate, glycerol, fumarate, citrate, glucose, methanol, ethanol,
or yeast extract (He et al. 2005; He et al. 2003b; Maymo-Gatell et al. 1997).
Dehalococcoides contain multiple hydrogenase complexes, membrane-bound (Hup, Hyc,
Ech, Hym) as well as cytoplasmic (Vhu), to oxidize H2 to protons and electrons (Schipp
et al. 2013). Insights from the sequenced genomes of strain 195 (Seshadri et al. 2005),
VS (McMurdie et al. 2009), BAV1 (McMurdie et al. 2009), GT (Stroo ch2), and CBDB1
(Kube et al. 2005) reveal five separate hydrogenase gene clusters conserved between the
strains in term of nucleotide sequence and organization. In pure cultures of D. mccartyi
and in mixed cultures grown on PCE, the Hup hydrogenase was highly expressed at the
transcriptional level (Morris et al. 2006). On the other hand, Ech and Hyc had lower
expression levels and were proposed to generate low-potential electrons for biosynthesis
rather than for respiration (Morris et al. 2006). The hydrogenase functional redundancy
was hypothesized to have evolved as a consequence of varying fluxes of hydrogen in the
environment (Loffler et al. 2012).
Unlike for other non-Dehalococcoidetes classes of organohalide respirers, energy
generation and cellular synthesis (carbon metabolism) are not linked in Dehalococcoides.
All strains utilize acetate for anabolism (Loffler et al. 2013; Maymo-Gatell et al. 1997);
yet, the extent of Dehalococcoides carbon sources has not been fully investigated.
Several substrates tested that did not support growth include fumarate, malate, lactate,
pyruvate, glucose, succinate, propionate, and glutamate (Cheng and He 2009; Lee et al.
2011). It was previously suggested from genomic data that Dehalococcoides might also
utilize CO2 as a carbon source (Islam et al. 2010). Recent publications state acetate/CO2

20
as carbon sources for Dehalococcoides (Lee et al. 2011; Schipp et al. 2013). However,
further experimental data are needed to confirm the need for this substrate as multiple
research groups, including the Laboratory of Dr. Krajmalnik-Brown, have been able to
successfully cultivate pure cultures of D. mccartyi using acetate only (as the carbon
source) in medium without CO2/HCO3−.
Other required nutrients. All Dehalococcoides utilize ammonia through
glutamate and glutamine, which donate nitrogen for synthesis of cellular components (He
et al. 2007). Commonly, the concentration of ammonia (added as NH4Cl) in the medium
to derive growth of Dehalococcoides is 6 mM (Loffler et al. 2005). The effect of
ammonia at concentrations above those required for growth was investigated for the first
time in this dissertation (Chapter 6). Interestingly, D. mccartyi strain 195, MB, ANAS1,
and ANAS2 possess a nitrogenase-encoding operon (nif) for fixing atmospheric N2 to
ammonia (Lee et al. 2012; Lee et al. 2009). Strain 195 is the only that has been grown as
a diazatroph; however, the N2-fixing strain grows poorly and dechlorinates TCE at slower
rates compared to the 195 strain cultured with ammonia as the source of nitrogen (Lee et
al. 2009; Maymo-Gatell et al. 1999).
Vitamins are essential nutrients for Dehalococcoides. These are typically
provided at a final concentration per liter: biotin, 0.02 mg; folic acid, 0.02 mg; pyridoxine
hydrochloride, 0.1 mg; riboflavin, 0.05 mg; thiamine, 0.05 mg; nicotinic acid, 0.05 mg;
pantothenic acid, 0.05 mg; vitamin B12, 0.05 mg; p-aminobenzoic acid, 0.05 mg; thioctic
acid, 0.05 mg Vitamin B12 (cyanocobalamin) is of utmost importance as it is a cofactor
for the reductases carrying out the reductive dechlorination. Even though required for

21
core metabolic reactions, Dehalococcoides do not possess genes for de novo synthesis of
vitamin B12. They do, however, encode genes in their genome for acquisition and
transport (Yan et al. 2012).
2.4 Reductive dehalogenase: core enzymes for organohalide respiration
A comprehensive overview of reductive dehalogenase (RDase) enzymes from
Dehalococcoides and from other organohalide respirers and a proposal for a classification
systems was published by Hug et al. (Hug et al. 2013). RDases are oxygen-sensitive
proteins located in association with the cytoplasmic membrane. They are monomeric and
contain prosthetic corrinoid cofactors and two Fe4S4 clusters (Magnuson et al. 2000;
Magnuson et al. 1998). The large subunit, A, of the enzyme is the reactive center and
contains a Tat signal sequence. The presence of the Tat sequence suggests that this
protein is exported across the cytoplasmic membrane (Wickner and Schekman 2005).
The smaller subunit, B, is proposed to function as the anchor for subunit A into the
outside of the cytoplasmic membrane (Krajmalnik-Brown et al. 2004; Muller et al. 2004).
Protein purification and the subsequent characterization of RDases from
Dehalococcoides have been limited by the low biomass yields obtained from these
microbes. Therefore, the large majority of our knowledge of Dehalococcoides RDases
stems from genomic data. Currently, there are several hundred RDase gene sequences in
Dehalococcoides (NCBI). Each sequenced strain contains a multitude of putative RDase
genes, ranging from 17 to 36 genes (Loffler et al. 2012; Loffler et al. 2013). This
functional surplus could be an indication of unrevealed metabolic capabilities and an

22
adaptation to metabolizing electron acceptors beyond those shown in the laboratory. Out
of the large number of putative RDase genes, only four have been assigned a function
with respect to PCE to ethene dechlorination: pceA, tceA, vcrA, and bvcA. The gene
products catalyze the following reactions:
PceA: PCE TCE (Fung et al. 2007; Magnuson et al. 1998)
TceA: TCE VC (Magnuson et al. 2000)
VcrA: DCEs, VC ethene (Muller et al. 2004)
BvcA: VC ethene (Krajmalnik-Brown et al. 2004)
The genes encoding these reductases are also important genetic markers for
Dehalococcoides. In the laboratory or during bioremediation scenarios, quantitative real-
time PCR tracking the RDase genes, as well as the 16S rRNA gene of Dehalococcoides,
make it possible to correlate Dehalococcoides presence to chemical measurements
(Ritalahti et al. 2006).
2.5 Importance of mixed cultures containing Dehalococcoides
The original bioremediation applications in environments contaminated with the
lesser chlorinated ethenes relied on aerobic cometabolism by methane, toluene, phenol,
and ammonia oxidizers (Ely et al. 1997; Pant and Pant 2010; Rasche et al. 1991). In
practice, this strategy was challenging from multiple aspects, including the fact that
bacteria cometabolizing chlorinated ethenes were not growing on these substrates, were
producing toxic intermediates, were limited by the availability of oxygen, and could not
degrade the fully chlorinated ethene, PCE (Pant and Pant 2010; Rasche et al. 1991;
23
Steffan and Vainberg 2012). In the early 2000s, bioremediation took a new turn of
events with Ellis et al. (2000) and Major et al. (2002) documenting successful
bioaugmentations of contaminated sites with Dehalococcoides mixed cultures that grow
on PCE and TCE. Hence, various sediment-free, chlorinated ethene-respiring
communities have been developed and characterized for application in bioaugmentation
and for fundamental laboratory studies (Duhamel and Edwards 2006; Macbeth et al.
2004; Richardson et al. 2002; Schaefer et al. 2009).
Table 2.3 contains a comprehensive list of dechlorinating cultures, their origin,
and enrichment conditions. As shown in Table 2.3, the overwhelming majority of the
microbial inocula for these chloroethenes bioaugmentation cultures was obtained from
environments with contaminated soil, sediment, or groundwater. Evidently, these
contaminated environments provide a unique niche for growth of organohalide-respirers,
as they contain chlorinated electron acceptors in abundance. Thus far, studies on
bioremediation of chlorinated ethenes have established a strong correlation between
robust or improved growth of Dehalococcoides and their rates of reductive dechlorination
in communities, compared to strains in isolation. For this reason, as seen in Table 2.3,
Dehalococcoides bioaugmentation cultures are cultivated using fermentable substrates.
The choice of fermentable for the enrichment and cultivation of these consortia differ
between research labs, resulting in diverse communities, with lactate and methanol as the
most commonly used fermentable compounds.

24
Table 2.3 Inocula sources and enrichment conditions of chlorinated ethenes-dechlorinating cultures
Enrichment
Culture Inoculum source Contamination and/or
anthropogenic
activity
Chlorinated
e− acceptor
e− donor and
carbon
source
Reference
Unnamed1
Sludge, Ithaca wastewater
treatment plant, NY
Wastewater PCE Methanol
and acetate
(Distefano et al. 1991)
Pinellas Soil and groundwater,
Department of Energy’s
Pinellas site, Largo, FL
Chlorinated solvents
(mostly TCE)
TCE Lactate (Harkness et al. 1999)
ANAS Soil, Alameda Naval Air
Station, CA
Chlorinated solvents
(mostly TCE) and
waste oil
TCE Lactate (Richardson et al. 2002)
KB1®
Soil and groundwater, Southern
Ontario contaminated site,
Canada
TCE TCE Methanol (Duhamel et al. 2002)
Unnamed2
Aquifer material, Bachman
Road Residential Wells site,
Oscoda, MI
PCE
cis-DCE Lactate (Lendvay et al. 2003)
Victoria3
Aquifer material, Victoria
contaminated site, TX
PCE PCE Benzoate (Cupples et al. 2003)
Unnamed4
Sediment, Red Cedar River, MI No contamination PCE H2 and
acetate
(He et al. 2005)
PM Aquifer material, Point Mugu
Naval Air Weapons Station,
CA
TCE TCE Butanol (Yu et al. 2005a)
EV Groundwater, Evanite site,
Corvallis, OR
TCE PCE Butanol (Yu et al. 2005a)
Enrichment originating D. mccartyi strains 1195,
2 BAV1,
3VS, and
4FL2

25
Table 2.3 (Cont.) Inocula sources and enrichment conditions of chlorinated ethenes-dechlorinating cultures
.
Enrichment
Culture Inoculum source Contamination and/or
anthropogenic
activity
Chlorinated
e− acceptor
e− donor and
carbon
source
Reference
SDC-9™
Aquifer material, contaminated
site, Southern CA
Chlorinated solvents PCE Lactate (Schaefer et al. 2009)
Hawaii-05™
Aquifer material, Hickam Air
Force Base, HI
Chlorinated solvents TCE Lactate (Vainberg et al. 2009)
PKJS™
Aquifer material, Air Force
Plant PJKS, CO
TCE TCE Lactate (Vainberg et al. 2009)
DehaloR^2 Estuarine sediment,
Chesapeake Bay, MD
Wastewater effluent TCE Lactate and
methanol
(Ziv-El et al. 2011)
ZARA-10 Garden soil, Cuzdrioara,
Romania
No contamination TCE Lactate and
methanol
Chapter 3
LINA-09 Mangrove sediment, Carolina,
Puerto Rico
No contamination TCE Lactate and
methanol
Chapter 3
ISLA-08 Groundwater sediment, Parris
Island Marine Corps Recruit
Depot, SC
PCE TCE Lactate and
methanol
Chapter 3

26
The differences in growth substrates or other growth-medium components and the
origin of microbial inocula have yielded both similar and distinguishable features in the
microbial composition of these cultures. The common community members in most
chloroethene-dechlorinating cultures in Table 2.3 are Dehalococcoides (usually more
than one strain), other organohalide respirers performing reduction of PCE/TCE to cis-
DCE (e.g., Geobacter, Dehalobacter, and Desulfuromonas), fermenting Bacteria, and
methanogenic Archaea. Fermentation of complex substrates provides Dehalococcoides
with growth macronutrients (i.e., H2, their electron donor and acetate, their carbon
source) and with micronutrients (i.e., specific amino acids (Zhuang et al. 2011), and
vitamin B12 (co-factor cobalamin required for their reductive dehalogenase enzymes (He
et al. 2007)). However, fermentation products also sustain the growth of other microbial
groups that directly compete with Dehalococcoides and other community members for
some of the very same resources.
For example, historically, methanogens have been considered a sink of H2 in
bioaugmentation cultures or in communities biostimulated at contaminated sites. The H2
fed to dechlorinators, either directly or indirectly (through fermentation reactions), can be
spent by hydrogenotrophic methanogens, especially in HCO3- abundant conditions as they
reduce HCO3−/CO2 to produce methane. In terms of the energetics of H2-consuming
reactions, hydrogenotrophic methanogens gain less energy than dechlorinators (Loffler et
al. 1999). Similarly, the affinity for H2, dictated by the half-saturation concentration (Ks),
is lower for hydrogenotrophic methanogens compared to dechlorinators (Cordruwisch et
al. 1988; Kotsyurbenko et al. 2001).
27
Many methanogenic microorganisms produce corrinoids (Mazumder et al. 1987;
Silveira et al. 1991; Stupperich and Krautler 1988; Stupperich et al. 1987; Yan et al.
2013), including variants of vitamin B12 (Factor III and pseudo vitamin B12). Recent
coculture experiments revealed that the corrinoids synthesized by Methanosarcina
barkerii strain Fusaro containg the lower α-ligand, 5’-hydroxybenzimidazole, failed to
support growth and reductive dechlorination by D. mccartyi strain BAV1 (Yan 2013).
However, when the α-ligand, 5’,6’-dimethylbenzimidazole, was added to these
cocultures, growth of D. mccartyi was enhanced when compared to axenic cultures (Yan
et al. 2013). In fact, similar observations were documented with Sporomusa sp. strain
KB-1 and Geobacter sulfurreducens. These bacteria also do not synthsize the “right”
corrinoids, but by processing 5’,6’-dimethylbenzimidazole, they can stimulate improved
growth of D. mccartyi strains (Yan et al. 2013; Yan et al. 2012). Therefore,
understanding and managing the dualistic relations (synthrophic versus competitive) in
mixed microbial communities dechlorinating PCE or TCE is essential for effective
bioremediation using Dehalococcoides, and is a recurring theme throughout this
disseration.
2.6 DehaloR^2, a model Dehalococcoides-containing dechlorinating culture
performing rapid dechlorination of TCE to ethene
DehaloR^2 is a sediment-free, anaerobic microbial culture initially developed in
2008 (Yao 2009) and stably maintained since 2009 in the Krajmalnik-Brown Laboratory.
The microbial inoculum for DehaloR^2 was core sediments from a brackish tributary of
28
the Chesapeake Bay near Baltimore, MD, provided by Dr. Rolf Halden. The
development and characterization of DehaloR^2 was published by Ziv-El et al. (2011).
2.6.1 From sediment microcosm to sediment-free culture
The dechlorination activity in the microcosms established with Chesapeake Bay
estuarine sediment is presented in Figure 2.4. TCE was predominantly converted to
trans-DCE and cis-DCE by day 40, after which reductive dechlorination stalled at a
trans-to-cis-DCE mole ratio of 1.67±0.15. After 160 days of incubation, the microcosm
stalled at DCE was transferred to fresh medium, and complete dechlorination was
attained when sediment was precluded from the culture (Figure 2.4). This was a first and
unusual report of achieving complete dechlorination to ethene after transferring an
incompletely dechlorinating microcosm. The immediate onset and rapid complete
dechlorination to ethene in ~10 days (Figure 2.4) suggested that Dehalococcoides capable
of dechlorination to ethene were present in the microcosm. However, as hypothesized,
they may have been inhibited by sediment constituents, including the antimicrobial
agents, triclosan and triclocarban, and triclocarban dechlorination products, which were
detected in the sediment from Chesapeake Bay (Miller et al. 2008). The cause for this
inhibition and the accumulation of DCE isomers will be investigated with other sediment
and soil materials in Chapter 3.

29
Figure 2.4 Chemical conditions in culture vessels showed a shift from incomplete
reductive dechlorination of TCE to DCE (trans-to-cis isomer ratio of 1.67±0.15) in the
initial sediment microcosm to complete and much more rapid dechlorination to ethene
with negligible accumulation of trans-DCE in the first transfer to a sediment-free culture,
designated DehaloR^2. Shown are measurements for a representative microcosm and
averages of triplicate cultures of DehaloR^2. This figure was regenerated and modified
from Ziv-El et al (Ziv-El et al. 2011).
2.6.2 Enriched microbial communites in DehaloR^2
The microbial community enriched in DehaloR^2 was investigated through 454
pyrosequencing, a clone library, and qPCR targeting specific bacterial and archael
members. The structure of the microbial communities as determined by pyrosequencing
is shown in Figure 2.5. In the sediment microcosm, Proteobacteria was the dominant
phylum (72% of all sequences), which decreased after enrichment. In the duplicate
sediment-free culture samples, Firmicutes became the major phylum with 78-86% of the
total sequences. The genus Dehalococcoides and its corresponding phylum, Chloroflexi,
were non-detect (zero sequences) in the sediment and increased to 9-16% in DehaloR^2
culture. In Chapter 3, the microbial communities of three additional soil/sediment-free
dechlorinating cultures, enriched under the same growth conditions as Dehalor^2, were
investigated using 454 pyrosequencing.

30
Figure 2.5 Bacterial community diversity by phylum in the microcosm sediment and
duplicate DehaloR^2 enrichment cultures. Pyrosequencing targeted the V4 region of the
16S rDNA for the sediment and the combined V2 and V3 regions for DehaloR^2. This
figure is from Ziv-El et al. (Ziv-El et al. 2011).
The findings from the constructed clone library were complementary to the
pyrosequncing data. Of the 73 sequenced clones, 73% were fermenters, with
homoacetogens constituting 48% (31 Acetobacterium and 4 Spirochaetes clones).
Dehalococcoides sp. were represented by 19 clones (26.0%) and mutliple strains, some of

31
which may be novel, according to sequencing data. The actual copy number of the 16S
rRNA genes of Dehalococcoides as measured by qPCR in the enriched sediment-free
culture were 1.54 ± 0.27 1011
copies L−1
, while those of Geobacter were 2.67 ± 0.38
1010
copies L−1
. The abundaces of Dehalococcoides and Geobacter in DehaloR^2
compared favorably to reports from other enrichment cultures in the literature.
2.6.3 Reductive dechlorination – a rate comparison in mixed microbial cultures
One of the key findings in the DehaloR^2 study was its maximum rates of
dechlorination of TCE to ethene. These rates were determined by consecutively feeding
the electron acceptor, TCE, and electron donor in batch serum bottles. A time-course
experiment used to calculate the dechlorination rates is in Figure 2.6a, when lactate and
methanol were the electron donors, and Figure 2.6b, when lactate only was used as
electron donor. The maximum rate of TCE reductive dechlorination to ethene was 0.92 ±
0.1 mM Cl− d
−1 when the concentration of Dehalococcoides had also reached a maximum
(Table 2.4).

32
Figure 2.6 Dechlorination of TCE to ethene by DehaloR^2 sediment-free cultures when
the electron donors were (a) lactate and methanol upon 3rd
consecutive addition, and (b)
lactate only upon 5th
consecutive addition. The error bars are standard deviation of
triplicate cultures.
Table 2.4 Comparison of maximum chlorinated ethene turnover rates (ΔC Δt–1
)max to
ethene and the corresponding concentration of Dehalococcoides (XDhc), for select
chlorinated ethene mixed microbial communities in batch serum bottles. This table is
adapted from Ziv-El et al (Ziv-El et al. 2011; Ziv-El et al. 2012a)
Culture (ΔC Δt–1
)max
[mM Cl– d
–1]
Dehalococcoides
[cells L−1
]
DehaloR^2 0.92 ± 0.1 (TCE to 90 % ethene) 1.54 ± 0.27 × 10¹¹
SDC-9 2.9 (PCE) 1.4 × 10¹¹
Unnamed 0.96 (PCE) N/A
VS 0.31 (VC) 4.0 × 10¹¹
KB1 0.16 (TCE) 8 × 10¹⁰
ANAS 0.006 (TCE), 0.05 (TCE) 1.0 ± 0.29 × 10¹⁰
BDI 0.03 (TCE) 1 × 10¹¹
Reporting and comparing the maximum rate of reductive dechlorination can be of
practical value when selecting potential cultures for bioaugmentation. As seen in Table
2.4, DehaloR^2 is one of the fastest cultures reported in the literature (Table 2.4) (Amos
et al. 2008; Cupples et al. 2004; Richardson et al. 2002; Vainberg et al. 2009; Xiu et al.
2010). The cultures tabulated in Table 2.4 were enriched under different conditions and
contained vaying microbial communities. In Chapter 3, I performed an examination to
determine whether the fast rates of dechlorination and high densities of Dehalococcoides

33
observed in DehaloR^2 are related to the environmental source of the microbial inocula
or to the laboratory enrichment techniques provided. Moreover, in Chapter 5, I testeded
whether the fast rates of DehaloR^2 can be improved by better managing microbial
communites and by changing the growth conditions from batch-fed to continuously-fed.

34
CHAPTER 3
SELECTIVE ENRICHMENT TECHNIQUES ABRIDGE SOIL OR SEDIMENT
MICROBIAL DIVERSITY TO YIELD ROBUST CHLORINATED ETHENES-
RESPIRING DEHALOCOCCOIDES CULTURES1
3.1 Introduction
Dehalococcoides mccartyi is a newly classified genus and species belonging to
the Dehalococcoidia class in the phylum Chloroflexi (Loffler et al. 2013). The members
of this genus respire halogenated compounds with an array of carbon backbones of
biogenic and anthropogenic origin (i.e., ethenes, ethanes, benzenes, phenols, and
biphenyls) (Adrian et al. 2009; Adrian et al. 2007; Adrian et al. 2000; Bunge et al. 2003;
He et al. 2003b; Loffler et al. 2013; Maymo-Gatell et al. 1999; Maymo-Gatell et al. 1997;
Wang and He 2013). The environmental distribution of Dehalococcoides spans across a
wide range of habitats. They have been detected in the soil, sediment, and groundwater
of numerous contaminated sites (Hendrickson et al. 2002; Tas et al. 2010; van der Zaan et
al. 2010) and in an array of uncontaminated environments, including freshwater river
sediments (He et al. 2005), saltwater and freshwater lake sediments (Krzmarzick et al.
2013), forest and state park soils (Krzmarzick et al. 2012), estuarine sediments
(Kittelmann and Friedrich 2008b), and marine subsurface sediments (Futagami et al.
2009). Whereas their “natural” role in the cycling of halogens has only been recently
investigated (Krzmarzick et al. 2012), Dehalococcoides have been largely explored in the
past two decades in the context of bioremediation of contaminated environments.
1 This chapter was prepared as a manuscript and will be submitted for publication.

35
Of particular importance for bioremediation are Dehalococcoides mccartyi strains
that utilize the soil and groundwater contaminants perchloroethene (PCE) and
trichloroethene (TCE) and transform them to the non-toxic, non-chlorinated end product,
ethene (Cupples et al. 2003; He et al. 2003b; Maymo-Gatell et al. 1997; Sung et al.
2006b). These strains couple the reductive dechlorination of PCE, TCE, and the daughter
chlorinated products, cis-dichloroethene (cis-DCE) and vinyl chloride (VC), to growth
using H2 as electron donor and acetate as carbon source (Loffler et al. 2013). Hence,
stimulation of endogenous Dehalococcoides (biostimulation) or addition of laboratory-
cultivated consortia containing Dehalococcoides (bioaugmentation) are avenues utilized
to decontaminate and restore sites polluted with chlorinated ethenes (Ellis et al. 2000;
Lendvay et al. 2003; Major et al. 2002).
The capacity to detoxify chlorinated ethenes is, to date, unique to
Dehalococcoides; on the other hand, the potential for partial reduction of PCE and TCE
to cis-DCE extends to multiple bacterial genera (Hug et al. 2013). Thus, it is puzzling
when Dehalococcoides are present, yet, dechlorination of PCE/TCE stalls at cis-DCE and
VC. This outcome was reported in soil and sediment microcosm studies and in bench-
scale bioremediation scenarios (Futagami et al. 2009; Harkness et al. 1999; Kittelmann
and Friedrich 2008a; van der Zaan et al. 2010; Ziv-El et al. 2012a). The inability to
biostimulate Dehalococcoides in order to promote reductive dechlorination beyond cis-
DCE and VC was also documented at contaminated sites undergoing biological
remediation (Ellis et al. 2000; Shani et al. 2013; Stroo et al. 2012). A unifying
explanation across studies for this inability to achieve reductive dechlorination of cis-
DCE or VC to ethene is absent; the most commonly proposed explanation in the above
36
mentioned works was the absence of Dehalococcoides strains with DCE- and VC-
respiring metabolic capabilities (Ellis et al. 2000; Futagami et al. 2009; Harkness et al.
1999; Kittelmann and Friedrich 2008a; Sleep et al. 2006). However, this unpredicted
outcome was also noted even when Dehalococcoides mccartyi genes coding for the VC
reductive dehalogenase enzymes, vcrA and bvcA, were detected (van der Zaan et al.
2010). Yet, neither VC reduction nor increases in Dehalococcoides mccartyi occurred in
microcosms biostimulated with a fermentable substrate (van der Zaan et al. 2010).
We hypothesize that, often times, the discrepancy between the expected and the
observed activities of Dehalococcoides in microcosms or in the environment is not due to
their metabolic potential but to the intrinsic competition for H2, driven by the variety of
alternate electron acceptors in soils and sediments. Common electron acceptors,
including nitrate, Fe (III), sulfate, sulfur, and bicarbonate (HCO3−) foster the growth of
diverse, H2-oxidizing microorganisms. These terminal electron accepting microbial
processes were previously shown to affect the reductive dechlorination of chlorinated
ethenes in enrichment cultures containing Dehalococcoides (Berggren et al. 2013a;
Delgado et al. 2012; Fennell and Gossett 1998; Yang and McCarty 1998). In fact,
recently, Fe (III) reduction and VC dechlorination were deemed antagonistic reactions
(Shani et al. 2013). Therefore, in the presence of alternate electron acceptors,
biostimulation of Dehalococcoides may be impeded or minimized, resulting in prolonged
lag times before the onset of dechlorination and/or incomplete dechlorination of PCE and
TCE.
Our study investigates selective enrichment and culturing techniques to abridge
microbial diversity in soil and sediment microcosms in order to yield microbial

37
communities which completely dechlorinate PCE/TCE to ethene and to obtain robust
growth of chlorinated ethene-respiring Dehalococcoides. For this investigation, we used
geographically distinct, microbially-diverse soil and sediment from uncontaminated
environments and compared them against a less diverse, contaminated sediment. Our
findings support competition for the electron donor as the underlying factor for the
inability to biostimulate Dehalococcoides in soil and sediment microcosms stalled at cis-
DCE. Furthermore, using three soil/sediment-free enrichment cultures, we bring
evidence linking fast rates of TCE to ethene dechlorination and high densities of
Dehalococcoides to the culturing protocol, independent of the origin of the microbial
inocula, which brings about potential implications for improving bioremediation in
chloroethene-contaminated environments.
3.2 Materials and methods
Environmental sources
The soil and sediment samples originated from the following geographic
locations: Cuzdrioara, Cluj County, Romania (47.17°N, 23.92°E), Carolina, Puerto Rico,
USA (18.34°N, 65.95°W), and Parris Island Marine Corps Recruit Depot, Beaufort
County, South Carolina, USA (32.33°N, 80.69°W). The Cuzdrioara soil was collected
from an uncontaminated vegetable garden from a depth of ~15 cm. The Carolina
sediment was sampled from an uncontaminated, tropical mangrove with a shallow water
table (10-15 cm). The sediments from Parris Island were core samples collected from a 5
m depth in an area of the military base contaminated with PCE. The source of PCE
contamination was an accidental spill from a dry-cleaning store in 1994 (Krug et al.
38
2010). Once brought to the laboratory, all soils and sediments were stored at 4 °C until
the establishment of microcosms.
Microcosms and enrichment of soil/sediment-Free, chloroethene-respiring
Dehalococcoides cultures
We established the following microcosms: Cuzdrioara soil, n = 3; Carolina
sediment, n = 3; and Parris Island sediment, n = 20 (duplicates from 10 core sections
evenly dispersed throughout the 5 m depth profile) in HCO3−-buffered, reduced anaerobic
mineral medium. The salts and trace mineral concentrations in the medium were
previously described (Delgado et al. 2012). Each microcosm consisted of 5 g soil or
sediment in 160-mL glass serum bottles with 100 mL medium. The initial pH of the
medium was 7.8. We added to each microcosm 0.2-0.3 mmol L−1
TCE (nominal
concentration) as the chlorinated electron acceptor. Additionally, we added the
fermentable substrates lactate (5 mM) and methanol (12 mM) as H2 and acetate
precursors, 1 mL ATCC vitamin mix, and 50 μL of vitamin B12 from a 1 g L−1
stock
solution. The microcosm bottles were incubated statically at 30° C. Cuzdrioara and
Carolina microcosms were incubated for 200 days, during which time 5 mM lactate was
re-added on two separate occasions (days 46 and 180).
We performed serial transfers (10% vol/vol) into same size serum bottles using
the same medium compositions to remove the soil or sediment. The microcosm bottles
were shaken vigorously and allowed to settle for 15 minutes so that the supernatant was
mostly devoid of soil or sediment when transferred over into the new bottles. Upon each
transfer, we supplied additional TCE, lactate, and methanol. After three consecutive
transfers, we named the enrichment culture from Cuzdrioara soil, ZARA-10, from

39
Carolina sediment, LINA-09, and from Parris Island sediment, ISLA-08. We maintained
the three enrichment cultures by feeding them 3-4 times consecutively with 0.5 mmol L−1
TCE, 5 mM lactate, and 12 mM methanol or 1 mmol L−1
TCE, 5 mM lactate, and 24 mM
methanol. Each addition of TCE was allowed to proceed to ≥80% ethene. We flushed
the headspace of the bottles with ultra-high purity N2 gas to remove headspace gases that
accumulated as a result of dechlorination (ethene and VC), fermentation (CO2) and
methanogenesis (CH4) before adding a new dose of TCE and fermentable substrates.
Removal of CO2 from the headspace would also raise the pH of the medium, which
decreased as a result of dechlorination and fermentation. When not actively used in
experiments, we keep stock cultures of the soil/sediment-free enrichments in a 4°C
refrigerator. No significant loss of activity is observed in these cultures even after several
months of storage at 4°C.
ZARA-10 and LINA-09 bioaugmentation experiments
Bioaugmentation experiments were carried out to evaluate whether ZARA-10 and
LINA-09 soil/sediment-free cultures could dechlorinate TCE to ethene in the soil and
sediment from which they originated. We setup glass serum bottles (four bottles per
culture) with 2.5 g soil or sediment, 50 mL reduced anaerobic medium, 0.25 mmol L−1
TCE, 5 mM lactate and 12 mM methanol, and 1% inoculum vol/vol (0.5 mL) ZARA-10
or LINA-09 culture, respectively. We measured the dechlorination of TCE to ethene in
time-course experiments.
Gas and liquid chemical analyses
Gas samples were extracted from the headspace of bottles to measure chlorinated
ethenes (TCE, cis-DCE, and VC), ethene, and methane using a Shimadzu GC-2010

40
(Columbia, USA) instrument with a flame ionized detector (FID). Details on the column
type and properties, GC temperature and pressure profiles, calibration curves, and
detection limits for each compound were published elsewhere (Delgado et al. 2012).
1 mL liquid samples were prepared for high performance liquid chromatography
(HPLC; Shimadzu LC-20AT) through filtration using a 0.2 μm polyvinylidene fluoride
membrane syringe filter (Pall Corporation, USA). We measured lactate, acetate,
propionate, and methanol using the method outlined by Parameswaran et al.
(Parameswaran et al. 2011), except the elution time was 40 minutes and the column
temperature was constant at 50°C.
Microbial community analyses
We extracted genomic DNA from 0.25 g of soil or sediment using the PowerSoil®
DNA Isolation Kit (MO BIO Laboratories, Inc., USA) following the protocol
recommended by the manufacturer. For soil/sediment-free consortia, we used pellets
formed from 1.5 mL liquid culture. Before DNA extraction, we pretreated the pellets as
noted in Ziv-El et al. (Ziv-El et al. 2011). Then, we followed the protocol for Gram-
positive bacteria outlined in the DNeasy® Blood and Tissue Kit (QIAGEN, USA).
We enumerated the 16S rRNA genes of Dehalococcoides mccartyi and their
reductive dehalogenase genes, tceA, vcrA, and bvcA via quantitative PCR (qPCR).
Triplicate TaqMan® assays were setup for assayed samples and standard curve points
and contained the following per 10 µL reaction: 4 µL of 2.5X MasterMix solution (5
PRIME MasterMix), 0.3 µL F’ and R’ primers from 10 µM stocks, 0.03 µL probe from
100 µM stock, 1.37 µL PCR water, and 4 µL DNA template (diluted 1:10). The primers
for the Dehalococcoides mccartyi 16S rRNA gene, tceA, and vcrA were published in

41
Holmes et al. (Holmes et al. 2006) and for bvcA in Ritalahti et al. (Ritalahti et al. 2006).
We used an Eppendorf Realplex 4S realcycler with a PCR temperature profile and cycles
as outlined by Ziv-El et al. (Ziv-El et al. 2011).
We determined the relative community structure using 454 pyrosequencing in
soils, sediments, and soil/sediment-free enrichment cultures. The DNA samples were
analyzed at the Research and Testing Laboratory (Lubbock, TX). The targets were the
combined V2 and V3 regions of the Bacterial 16S rRNA gene using the primers 104F
(5’-GGCGVACGGGTGAGTAA-3’) and 530R (5’-CCGCNGCNGCTGGCAC-3’).
Amplicon pyrosequencing was performed with 454 GS-FLX Titanium protocols
(Wolcott et al. 2009). We qualified raw sequences by trimming off low-quality bases and
removing low-quality, chimeric sequences, and singletons using the QIME software.
After quality control, aligning and clustering as described (Kang et al. 2013), we obtained
bacterial identification by using the Ribosomal Database Project classifier with a 50%
confidence threshold (Cole et al. 2009). We obtained the following number of qualified
sequences: Cuzdrioara soil, 6,924; Carolina sediment, 7,904; and Parris Island sediment,
1,486; ZARA-10 enrichment culture, 3,141; LINA-09 enrichment culture, 2,847; and
ISLA-08 enrichment culture, 2,205. We calculated Phylogenetic Diversity (PD) in QIME
using the PD Whole Tree estimator. Before proceeding with these calculations, we
trimmed the sequencing data such that all samples had equal sampling depth (1486). We
also performed Principal Component Analysis (PCA) to evaluate similarity among soil
and sediment samples and soil/sediment-free enrichment cultures.

42
3.3 Results and discussion
Biostimulation of endogenous Dehalococcoides in microcosms from distinct
environments
A range of (mostly) contaminated environments has served as microbial inocula
for Dehalococcoides enrichment cultures throughout the two decades of research on
reductive dechlorination. These environments were thought to be most fitting for finding
microorganisms that can metabolize a specific pollutant as they have already been
exposed to that pollutant. Table 2.3 contains a comprehensive collection of cultures
employed in fundamental studies and in bioaugmentation research/applications for PCE
or TCE dechlorination. Development of these enrichment cultures is a lengthy process
(Loffler et al. 2005), as the enrichments must be actively fed and transferred to ensure the
desired biological activity. Therefore, careful consideration is given to any
environmental sample (soil, sediment, or groundwater) before pursuing this labor- and
time-intensive work. Evidence of reductive dechlorination to VC and ethene is often a
crucial decision factor in choosing to pursue this laboratory work. This evidence can also
play an important role in deciding whether to proceed with in situ biostimulation. VC
and ethene are measured either directly during contaminated site analyses or in laboratory
microcosm experiments (Aziz et al. 2012; Stroo et al. 2012). For the majority of the
enrichment cultures in Table 2.3 there was evidence of desired biological activity through
one or both assessment methods.
In this study, reductive dechlorination of TCE and the subsequent enrichment of
Dehalococcoides respiring chlorinated ethenes were evaluated in a total of 26
microcosms. Figure 3.1 (left panels) shows the dechlorination profile in microcosms

43
established with the three geographically-distinct environmental sources as inocula and
amended with TCE and the fermentable substrates, lactate and methanol. As depicted in
Figure 3.1A-B (left panels), cis-DCE was the end product from TCE reduction in all
microcosms set up with uncontaminated soil from Cuzdrioara and uncontaminated
sediment from Carolina. Moreover, we biostimulated two additional times with 5 mM
lactate (days 46 and 180) to ensure the availability of electron donor and we incubated
these microcosms for up to 200 days. However, the additional electron donor did not
further advance cis-DCE reduction. We tracked production of methane in the
microcosms stalled at cis-DCE (Figure 3.2). Methane concentrations increased
throughout the incubation period, reaching up to 7.2 mmol L−1
and 8.8 mmol L−1
in
Cuzdrioara and Carolina microcosms, respectively (Figure 3.2). Although multiple
additions of fermentable substrates and the extended incubation did not generate VC and
ethene, as presented in Figure 3.1A-B (left panels), the methane data strongly indicated
that methanogenesis was one of the biological processes benefiting from biostimulation.
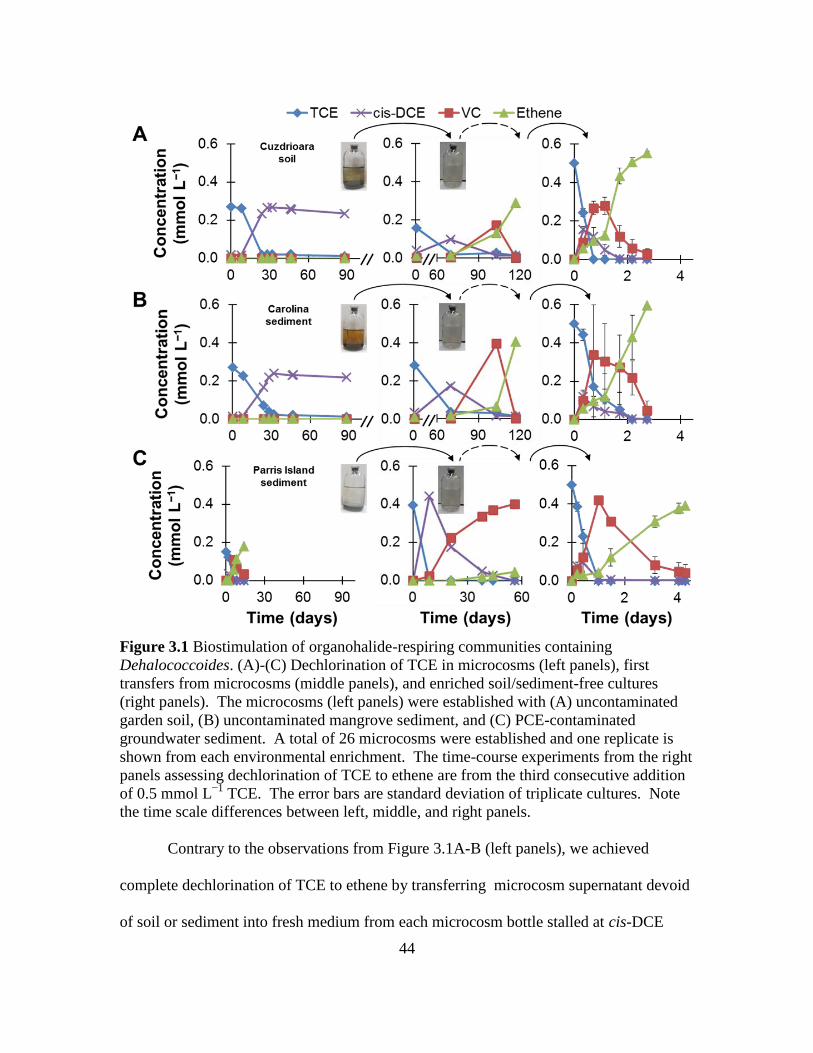
44
Figure 3.1 Biostimulation of organohalide-respiring communities containing
Dehalococcoides. (A)-(C) Dechlorination of TCE in microcosms (left panels), first
transfers from microcosms (middle panels), and enriched soil/sediment-free cultures
(right panels). The microcosms (left panels) were established with (A) uncontaminated
garden soil, (B) uncontaminated mangrove sediment, and (C) PCE-contaminated
groundwater sediment. A total of 26 microcosms were established and one replicate is
shown from each environmental enrichment. The time-course experiments from the right
panels assessing dechlorination of TCE to ethene are from the third consecutive addition
of 0.5 mmol L−1
TCE. The error bars are standard deviation of triplicate cultures. Note
the time scale differences between left, middle, and right panels.
Contrary to the observations from Figure 3.1A-B (left panels), we achieved
complete dechlorination of TCE to ethene by transferring microcosm supernatant devoid
of soil or sediment into fresh medium from each microcosm bottle stalled at cis-DCE

45
(Figure 3.1A-B, middle panels). This outcome confirmed that endogenous cis-DCE- and
VC-respiring Dehalococcoides could indeed be biostimulated. The fact that VC and
ethene were produced in the absence of the soil or sediment brought about two
possibilities: 1) compounds inhibiting Dehalococcoides were present in the soil or
sediment or, in accordance with our hypothesis, 2) the electrons from the fermentable
substrates were being utilized by H2-competing microorganisms growing on components
of the soil and sediment serving as electron acceptors.
Figure 3.2 Methane production in microcosms and subsequent enrichment cultures. (A)-
(B) Left panels: time-course methane measurements in Cuzdrioara and Carolina
microcosms biostimulated with fermentable substrates. (A)-(B) Right panels: final
methane concentrations recorded in Cuzdrioara and Carolina microcosms (end of
experiments from Figure 3.1A-B, day 200) and final methane concentrations in ZARA-
10 and LINA-09 enrichment cultures (end of experiments from Figure 3.1A-B, day 2.8).

46
With the lactate and methanol provided upon establishing the microcosms with
Parris Island contaminated sediment, dechlorination proceeded beyond cis-DCE (Figure
3.1C, left panel). VC and ethene formed within 30 days in 40% of the microcosms
containing sediment from this location. Furthermore, VC and ethene production was
obtained in microcosms from across the different core depths. The dechlorination
activity in our laboratory microcosms and microcosm transfers (Figure 3.1C left and
center panels) mirrored the endogenous dechlorinating activity at the Parris Island site,
where TCE, cis-DCE, VC, and ethene were detected from dechlorination of PCE after
biostimulation with emulsified vegetable oil (US EPA 2013a).
Characterization of soil/sediment-free cultures enriched in Dehalococcoides
As shown in Figure 3.1 A-B (left panels), microcosm data failed to predict the
“true” reductive dechlorination potential in the Cuzdrioara soil and the Carolina
sediment. In spite of this, we showed that ethene could be obtained as the end-reduced
product of TCE dechlorination through the enrichment process. We then further sought
to evaluate the impact of selective enrichment and culturing techniques on the
soil/sediment-free microbial communities developed from the three distinct
environments. The enrichment cultures ZARA-10, LINA-09, and ISLA-08 were
maintained under identical batch-fed growth conditions. Figure 3.1A-C (right panels)
reveals that, as a result of the growth protocol, fast reduction of TCE to ethene was
achieved in all three enrichment cultures, regardless of the environment where the
microbial inocula originated. Moreover, the culture performance parameters tabulated in
Table 3.1 show similarly high maximum observed transient conversion rates (on the

47
order of mM Cl− released per day) in ZARA-10, LINA-09, and ISLA-08 enrichment
cultures, and dechlorination of 0.5 mmol L−1
TCE to ≥80% ethene in as short as 1.7 days.
Table 3.1 Conversion rates of TCE to ethene, days to complete dechlorination,
Dehalococcoides concentrations, and Dehalococcoides yields in the sediment-free
enrichment cultures developed in this study. The values reported are averages from
triplicate cultures
Enrichment culture
ZARA-10 LINA-09 ISLA-08
Highest transient conversion rate1
(mmol Cl− released L
−1 d
−1)
2.67 ± 0.34 2.37 ± 0.43 2.51 ± 0.08
Conversion of 0.5 mmol L−1
TCE to
≥80% ethene2,3
(days)
1.7 2.8 4.0
Conversion of 1 mmol L−1
TCE to
≥80% ethene2 (days)
2.3 5.9 8.8
Final Dehalococcoides densities
(cells mL−1
) at 0.5 mmol L−1
TCE3
9.6 108
1.4 109
1.9 109
(cells mL−1
) at 1 mmol L−1
TCE3
2.3 109 1.8 10
9 2.3 10
9
Yield Dehalococcoides4
(cells µmol−1
Cl−
released)
2.6 108
1.8 108
2.3 108
1Rate calculated between two consecutive sampling points. The transient rates were highest for all cultures
on the third addition of 1 mmol L−1
TCE. 2Conversion times reported for the third addition of TCE
3Final densities after
three consecutive additions of TCE
4Yields were calculated from the change in the 16S rRNA gene copies measured by qPCR and the change
in concentration of TCE reduced to ethene as described (Duhamel and Edwards 2007).
Insights from the composition of microbial communities
To gain insights into the differences between the microcosms that could or could
not be biostimulated beyond cis-DCE, we took advantage of high throughput sequencing.
The larger pie graphs in Figure 3.3 illustrate the 454 pyrosequencing data at class level
from Cuzdrioara soil, Carolina sediment, and Parris Island sediment. The class of interest
for TCE to ethene respiration is Dehalococcoidia, containing the genera Dehalococcoides
(Loffler et al. 2012), Dehalogenimonas (Moe et al. 2009), and Dehalobium (May et al.
2008). Dehalococcoidia was in low abundance in all soil and sediment samples (<1% of
total sequences), and hence, it is not shown in the large pie graphs. As seen in Figure 3.3

48
(large pie graphs), the Cuzdrioara and Carolina environments were more diverse than the
Parris Island sediment and were predominantly populated by α-, β-, γ-, δ-, and ε-
Proteobacteria. The microbial communities in Cuzdriora soil and Carolina sediment
(Figure 3.3, large pie graphs) concur with previously described microbial communities in
environments where sulfate (Hansel et al. 2008; Purdy et al. 2001), sulfur (Hansel et al.
2008), iron (Miceli et al. 2012), nitrate (Van Nostrand et al. 2011; Van Trump et al.
2011), and HCO3− (Kotsyurbenko et al. 2001) were abundant. Compared to Cuzdrioara
and Carolina samples, the Parris Island sediment contained fewer classes (Figure 3.3,
large pie graph), and had a higher relative abundance of Dehalococcoidia (0.4%),
potentially pointing towards an opposed relationship between high microbial diversity
and successful biostimulation of VC- and ethene-producing Dehalococcoidia.
While in low abundance in the soils and sediments, relative to the other bacterial
classes, Dehalococcoidia became one of the most prevalent taxa in all three enrichment
cultures. This is depicted in the small overlaid pie charts in Figure 3.3: ZARA-10, 9%;
LINA-09, 3%; ISLA-08, 21%. Furthermore, the predominant classes in all three
originating environments, α-, β-, γ-, and ε-Proteobacteria were absent (zero sequences) in
the enrichment cultures (Figure 3.3, small overlaid pie graphs). The family
Geobacteraceae within the δ-Proteobacteria, containing bacterial members known to
respire TCE (Sung et al. 2006a), was maintained in low abundance (<1%) in the
enrichment cultures ZARA-10 and LINA-09. These findings are opposite to previously
published data by Miceli et al. who employed the same soil and sediment samples
collected from Cuzdrioara and Carolina for the enrichment of anode-respiring
communities in microbial electrochemical cells (Miceli et al. 2012). In the study by

49
Miceli et al., when garden soil from Cuzdrioara was used as a microbial inoculum, the
resulting enrichment was dominated by δ-Proteobacteria (~90% relative abundance)
(Miceli et al. 2012). When the source of microbes was Carolina mangrove sediment,
~60% of the enriched biofilm was comprised of α-, γ-, and δ-Proteobacteria (Miceli et al.
2012). The elimination or minimization of these classes in the enrichment cultures from
this study is attributed to the selective conditions provided in the medium, with TCE and
HCO3− as the sole electron acceptors. HCO3
−-reducing methanogens continued to be
active in all enrichment cultures; however, as shown in Figure 3.2, methane production
was drastically diminished when compared to the activity in the microcosms.
Figure 3.3 Bacterial diversity at class level as determined by 454 pyrosequencing of the
V2-V3 region of the 16S rRNA genes. The large pie charts represent the relative
abundance of select classes in the Cuzdrioara uncontaminated soil, Carolina
uncontaminated sediment and Parris Island contaminated sediment. The small overlaid
pie charts show the five most abundant classes in the soil/sediment-free enrichment
cultures, ZARA-10, LINA-09, and ISLA-08. The classified taxa presented contributed to
at least 1% of the total relative abundance and are organized in alphabetical order.

50
Diversity analyses reveal convergent enrichment cultures
We conducted alpha diversity analyses using phylogeny-based metrics
(Phylogenetic Diversity (PD) index) to estimate microbial diversity. According to the PD
analyses depicted in Figure 3.4A-C, the microbial diversity in the three enrichment
cultures resulted in comparable, low PD values. This was achieved in the Cuzdrioara soil
and the Carolina sediment (Figure 3.4A-B), which had PD values approximately four fold
higher than that of Parris Island (Figure 3.4C). Furthermore, principal component
analyses (PCA) between samples (beta diversity) reveals that heterogeneous soil and
sediment samples (blue symbols, Figure 3.4D) converged to very similar, highly efficient
TCE-respiring microbial communities after the enrichment (green symbols, Figure 3.4D).

51
Figure 3.4 Alpha and beta microbial diversity analyses. (A)-(C) Phylogenetic Diversity
(PD) Whole Tree measurements from the 454 analysis using trimmed, equal sequencing
depth OTUs (1486) per sample. (D) Weighted UNIFRAC distance calculated after
trimming the samples to equal sequence depth in QIIME. The Principal Component
Analysis (PCA) was generated by grouping the samples into two categories
(soils/sediments vs. enrichment cultures). The color blue corresponds to the
soil/sediment samples, while green corresponds to the soil/sediment-free enrichment
cultures.
Effect of enrichment techniques on growth of Dehalococcoides mccartyi
Enumeration of Dehalococcoides mccartyi was achieved through qPCR targeting
the 16S rRNA genes (Table 3.1 and Figure 3.5) and their reductive dehalogenase genes,
tceA, vcrA, and bvcA (Figure 3.5). Reductive dehalogenase genes coding for enzymes
involved in dechlorination of TCE to VC (TceA) (Magnuson et al. 2000), cis-DCE and
VC to ethene (VcrA) (Muller et al. 2004), and VC to ethene (BvcA) (Krajmalnik-Brown

52
et al. 2004) were all enriched in ZARA-10 and LINA-09 soil/sediment-free cultures
(Figure 3.5). The fact that Dehalococcoides mccartyi strain 195-/FL2-like (containing
tceA), strain GT-/VS-like (containing vcrA), and strain BAV1-like (containing bvcA)
were present in these enrichment cultures from cis-DCE stalled microcosms is further
evidence that the potential for complete dechlorination (with overlapping functional
redundancy) was present in the environmental samples.
The three enrichment cultures exhibited some microbiological differences with respect to
the Dehalococcoides mccartyi strains present (vrcA was not detected in ISLA-08).
However, common to all enrichment cultures were the very high (and similar) densities
of Dehalococcoides mccartyi of ~109 Dehalococcoides cells mL
−1 (or 10
12 cells L
−1)
(Table 3.1 and Figure 3.5). These densities were the result of the culturing protocol,
where we fed high doses of TCE (1.5-3 mmol L−1
over three additions). To our
knowledge, this is the first study to report such high densities of Dehalococcoides
mccartyi in multiple enrichment cultures and in batch-fed cultures cultivated in serum
bottles.
Taken together, the rates and the times required for complete reduction to ethene
of the TCE supplied (Figure 3.1, right panels), and the resulting Dehalococcoides
mccartyi concentrations (Table 3.1 and Figure 3.5) compare favorably to previously
published values, tabulated by Ziv-El et al. (Ziv-El et al. 2011; Ziv-El et al. 2012a). The
dechlorination rates and Dehalococcoides densities, two important and interconnected
factors for successful bioremediation, varied sometimes by orders of magnitude (Ziv-El
et al. 2011; Ziv-El et al. 2012a) between the cultures reported. A contributing factor to
these variances could be the enrichment techniques employed, as the compared studies

53
used different conditions and different stimulation techniques for the development and
cultivation of reductively dechlorinating cultures. Our results support the idea that an
“optimal’ microbial community, where Dehalococcoides thrive, can be achieved under
the enrichment conditions described herein.
Figure 3.5 Enumeration of Dehalococcoides mccartyi in enrichment cultures. qPCR
tracking Dehalococcoides 16S rRNA genes and their reductive dehalogenase genes, tceA,
vcrA, and bvcA using qPCR in the enrichment cultures after three consecutive additions
of 0.5 mmol L−1
TCE. The plot is representative of triplicate cultures and the error bars
are standard deviations of triplicate qPCR reactions.
Outlook on bioremediation using Dehalococcoides
One important aspect of our study, shown with the Cuzdrioara soil and Carolina
sediment, is the ability to stimulate the production of VC and ethene and the growth of
cis-DCE and VC-respiring Dehalococcoides. We believe this outcome was obtained by
removing or diluting the soil or sediment components and the subsequent microbial
guilds competing for the electron donor. To strengthen this point, we designed a simple
experiment to show that, once Dehalococcoides are enriched and in high abundance, they
could better compete in the complex soil or sediment environments from which they

54
originated. For this, we re-established microcosms containing Cuzdrioara soil and
Carolina sediment and bioaugmented the microcosms with a 1% vol/vol inoculum of
ZARA-10 or LINA-09 enrichment culture, respectively, to more appropriately reflect the
dilution factor in bioremediation scenarios at contaminated sites. As seen in Figure 3.6A-
B and supportive of our hypothesis, with both enrichment cultures dechlorination of TCE
proceeded to ethene and we achieved close to complete dechlorination of 0.25 mmol L−1
TCE to ethene in ~30 days. The rates of reductive dechlorination obtained with this
smaller inoculum also exclude the possibility that the cis-DCE stall resulted from
components in the soil or sediment inhibiting the native Dehalococcoides.
Figure 3.6 Bioaugmentation of microcosms with their respective enrichment cultures.
Dechlorination of TCE in (A) in Cuzdrioara soil microcosms bioaugmentated with
ZARA-10 enrichment culture and in (B) Carolina sediment microcosms bioaugmented
with LINA-09 culture. The inoculum used for these experiments was 1% vol/vol.

55
For bioremediation of PCE or TCE contaminated sites, microcosm experiments
have historically been utilized as indicators of endogenous microbial biological activity
(Stroo et al. 2012). The results of microcosm experiments help researchers and
bioremediation practitioners decide on whether biostimulation or bioaugmentation is the
appropriate treatment for decontamination of environments polluted by chlorinated
solvents (Stroo et al. 2012). In cases where incomplete dechlorination was observed in
microcosms, this has been attributed to the presence of inhibiting conditions or the lack
of Dehalococcoides capable of complete dechlorination. Our findings clearly show that
neither result from Cuzdrioara or Carolina biostimulated microcosms could be explained
by those two hypotheses.
Instead an electron donor competition is proposed, supported by our data, in
which components of the soil or sediment serve as electron acceptor for competing H2-
oxidizing microorganisms. Therefore, our results bring experimental evidence towards a
new possible explanation to “unsuccessful” microcosm experiments. If indeed microbial
competition for electron donor is a major determining factor in the success of the
microcosms, it will certainly be a determining factor in bioremediation as well. Our work
provides a new perspective to better understand site assessment and possibly improve the
bioremediation process.

56
CHAPTER 4
ROLE OF BICARBONATE AS A PH BUFFER AND ELECTRON SINK IN
MICROBIAL DECHLORINATION OF CHLOROETHENES2
4.1 Introduction
Organohalide respiring microorganisms represent a unique, efficient, and
sustainable approach to detoxifying chloroethenes contamination from soil, water, and
groundwater (Ellis et al. 2000; Marzorati et al. 2010; Maymo-Gatell et al. 1997). These
microbes are important because they can use priority pollutants such as trichloroethene
(TCE), dichloroethene (DCE) and vinyl chloride (VC) as electron acceptors for energy
metabolism (Tas et al. 2010). Dehalococcoides bacteria hold a prominent role among the
organohalide respirers isolated to date, as these are the only ones having the proven
ability to detoxify chloroethenes to the innocuous end product, ethene (He et al. 2003b;
Maymo-Gatell et al. 1997). Dehalococcoides have a constrained metabolism; they
strictly utilize hydrogen (H2) as the electron donor and acetate as the carbon source
(Loffler et al. 2013). The most common method for delivery of H2 and acetate at
bioremediation sites is the addition of fermentable substrates as precursors (Ellis et al.
2000; Major et al. 2002; Schaefer et al. 2010). H2 gas has also been supplied for
groundwater field applications (Edstrom et al. 2005) and in engineered ex situ treatment
technologies for chloroethenes remediation (Ma et al. 2003; Villano et al. 2011; Ziv-El et
al. 2012b). In systems fed with H2, the pH tends to rise as a result of competing
2 This chapter was published in altered format as Delgado AG, Parameswaran P, Fajardo-Williams D,
Halden RU, Krajmalnik-Brown R. 2012. Role of bicarbonate as a pH buffer and electron sink in microbial
dechlorination of chloroethenes. Microbial Cell Factories 11(128).

57
biological reactions, whereas dechlorination and/or fermentation of H2-releasing
compounds decrease the pH. As a consequence, buffering and pH management are
important parameters for assessing in situ and ex situ remediation approaches, and are
crucial for sustained dechlorination (Robinson and Barry 2009; Robinson et al. 2009;
Ziv-El et al. 2012b).
In groundwater, dissolution of carbonate (CO32−
)-containing minerals serves as
the natural pH buffer. Among the CO32−
species, bicarbonate3 (HCO3
−) is the most
abundant at neutral pH, and it contributes substantially to the alkalinity of groundwater.
Typical HCO3−
concentrations in groundwater are in the range of 0.7-10 mM (Abdelouas
et al. 1998; Wilkin and Digiulio 2010). Additionally, HCO3−
is supplemented to
groundwater as a common strategy when biostimulation or bioaugmentation are
employed in order to buffer the protons produced by the biological reactions (Ellis et al.
2000; Schaefer et al. 2010).
In laboratory settings, pH management is also commonly achieved through the
addition of HCO3− buffer in the form of NaHCO3 or KHCO3. HCO3
− has been used for
growth of Dehalococcoides strains (Loffler et al. 2005) and for mixed dechlorinating
communities (Duhamel and Edwards 2007; Vainberg et al. 2009; Ziv-El et al. 2011) to
maintain a favorable pH. Dehalococcoides optimum pH has been reported to range from
6.9-7.5 (Loffler et al. 2013); yet, to date, there is a lack of systematic studies defining
both the pH boundaries for these important organisms, and the effect pH exerts on each
step in the TCE reduction pathway. Beyond its function as a buffer, HCO3− also serves
as an electron acceptor for other microorganisms commonly encountered with
3 Throughout this work, HCO3
− is used to denote the buffer HCO3
−/CO2. At the pH ranges observed in this
study, HCO3− accounted for 90% or greater of the two species.

58
organohalide respirers in the environment and in laboratory-cultured consortia. For
example, at neutral pH, hydrogenotrophic methanogens consume HCO3− and H2 to
generate methane (Cordruwisch et al. 1988):
Hydrogenotrophic methanogenesis:
HCO3− + 4 H2 + H
+ → CH4 + 3 H2O (Equation 4.1)
The competition for H2 among organohalide respirers and methanogens has been well
documented (Aulenta et al. 2005; Ballapragada et al. 1997; Carr and Hughes 1998;
Fennell and Gossett 1998; Fennell et al. 1997; Smatlak et al. 1996; Yang and McCarty
1998). However, none of these studies have addressed how consumption of H2, whether
added as gas or as a result of fermentation, is affected by varying HCO3− concentrations.
Homoacetogens are other important microorganisms commonly encountered with
organohalide respirers. Homoacetogens produce H2 from fermentation of complex
substrates and/or consume available H2 (Drake 1994; Rittmann and Herwig 2012).
Hydrogenotrophic homoacetogens catalyze the formation of acetate from H2 and HCO3−
in their energy metabolism (Drake 1994):
Hydrogenotrophic homoacetogenesis:
2 HCO3− + 4 H2 + H
+ → CH3COO
− + 4 H2O (Equation 4.2)
They, too, compete for H2 with organohalide respirers. To date, the limited number of
studies that have investigated hydrogenotrophic homoacetogenesis in TCE dechlorinating
consortia (Yang and McCarty 1998; Yang and McCarty 2000) has not included HCO3−
concentration as a variable driving the extent and the rates of reductive dechlorination.
Hydrogenotrophic methanogens and homoacetogens can also affect pH in
dechlorinating communities. Methanogens produce methane as the end product (Eq. 4.1)

59
by expending one proton and one HCO3−, while hydrogenotrophic homoacetogens
generate acetate (Eq. 4.2) from one proton and two HCO3−. Both reactions increase the
pH while consuming HCO3−, which often is the only buffer in the system. The effect of
HCO3−
concentration in TCE dechlorinating microbial communities has not been studied.
Few studies focusing on other dechlorinating systems have recognized its importance and
examined the effect of HCO3− concentrations on the formation of chlorinated daughter
products, thus motivating this work. For example, removal of chlorophenols from
simulated wastewater in upflow anaerobic sludge blanket (UASB) reactors revealed
significant inhibition on dechlorination at high HCO3− (3500 mg L
−1 as CaCO3) and high
pH (Majumder and Gupta 2009). In microcosms showing microbial dechlorination of
polychlorinated biphenyls with H2 gas as electron donor, 100 mg L−1
HCO3− (1.64 mM)
yielded the fastest rates of dechlorination, whereas addition of 1000 mg L−1
HCO3− (16.4
mM) resulted in the slowest polychlorinated biphenyls dechlorination rates and triggered
the most acetate to form (Yan et al. 2006).
In this study, we evaluate the role of HCO3−
as a buffering agent and as an
electron acceptor in TCE reductively dechlorinating mixed communities using a
previously described culture, DehaloR^2, as a model consortium (Ziv-El et al. 2011). H2,
and not fermentable substrates, was used as the sole electron donor to directly and
accurately measure hydrogenotrophic production of methane and acetate from HCO3−.
The concentrations of HCO3− tested reflect typical groundwater concentrations (2.5-10
mM), as well as commonly reported laboratory concentrations (30 mM).

60
4.2 Materials and methods
Microbial inoculum and preparation of batch cultures
The sediment-free microbial consortium, DehaloR^2, described by Ziv-El et al.
(2011) was used as an inoculum for all experiments. For the experiments in this study,
we preconditioned the inoculum culture by growing it in 10 mM HCO3− medium, with
excess H2 as electron donor, and two consecutive feedings of 10 μL neat TCE in 120 mL
medium.
Reduced anaerobic mineral medium was prepared containing the following
reagents per liter: 1 g NaCl, 0.06 g MgCl2 x 6H2O, 0.2 g KH2PO4, 0.3 g NH4Cl, 0.3 g
KCl, 0.005 g CaCl2 x 2H2O, and 1 mL of Trace A and Trace B solutions described
elsewhere (Loffler et al. 2005). During medium preparation, nitrogen was the sole gas
for boiling and bottling and the reducing agents were 0.2 mM L-cysteine and 0.2 mM
Na2S x 9 H2O. No buffer was added to the medium before autoclaving. For bottling, we
used 160-mL glass serum bottles containing 90 mL liquid and 70 mL headspace sealed
with black butyl rubber stoppers and aluminum crimps.
The concentrations of NaHCO3 tested were 2.5, 5, 10, and 30 mM. In the cultures
where both NaHCO3 and HEPES (pKa = 7.55) were used as buffers, we supplemented 5
mM HEPES in combination with 2.5, 5 and 10 mM HCO3−, and 10 mM HEPES in the 30
mM HCO3−
cultures. NaHCO3 and HEPES were delivered to each bottle from 1 M
sterile anaerobic stock solutions. The initial pH was adjusted with sterile 2.25 N HCl or
NaOH to 7.5 (± 0.1). At time 0, we added to each culture bottle 0.55 mmol L–1
TCE (5
μL neat or 71.3 mg L−1
), 1 mL ATCC vitamin mix, 50 μL of 1 g L−1
vitamin B12 solution,
8.2 mmol L–1
H2 (20 mL H2 gas), and 10 mL DehaloR^2 microbial culture corresponding
61
to a 10% inoculum. The working volume was 100 mL of liquid with 60 mL of
headspace. The bottles were incubated in the dark at 30°C without shaking. An
additional 8.2 mmol L–1
H2 was added on day 12 (all cultures) and on day 26 (only to
cultures still undergoing dechlorination). All experimental conditions were tested in
triplicates and the experiments were also performed on two separate occasions.
Chemical and pH measurements for the time course experiments
We measured TCE, cis-DCE, VC, ethene, and methane using a gas
chromatograph (GC) (Shimadzu GC-2010; Columbia, MD) equipped with a flame
ionization detector (FID). The compounds were carried by helium gas through an Rt-QS-
BOND capillary column (Restek; Bellefonte, PA). The oven temperature was maintained
at 110°C for 1 min, followed by a temperature increase of 50°C min−1
to 200°C. Then,
the temperature ramp was further raised to 240°C with a 15°C min−1
gradient and held for
1.5 mins. The temperatures of the FID and the injector were 240°C. Chloroethenes,
ethene and methane calibrations in 160-mL bottles with 100 mL liquid volume were
performed in a range of 0.05-2.45 mmol L–1
. The detection limit for all compounds
measured on the GC-FID is ≤0.018 mmol L–1
.
A GC instrument equipped with a thermal conductivity detector (TCD) was
employed to measure H2 before reinjecting additional H2 to the cultures on day 12. The
instrument settings used were those previously outlined (Parameswaran et al. 2011). The
H2 detection limit for the GC-TCD is 0.8% vol/vol.
We quantified acetate, propionate, and formate from 0.75-mL liquid samples
filtered through a 0.2 μm polyvinylidene fluoride membrane syringe filter (Pall
Corporation; Ann Arbor, MI) into 2-mL glass vials (VWR; Radnor, PA) via high

62
performance liquid chromatography (HPLC) using a previously published method
(Parameswaran et al. 2011). Five point calibration curves (0.5-10 mM) were generated
for acetate, propionate, and formate during every HPLC run. The detection limit for the
compounds measured on the HPLC was ≤0.1 mM.
0.29 ± 0.06 mM propionate was carried over from the inoculum culture and the
final measured concentration was 0.33 ± 0.04 mM, indicative that propionate did not
serve as a significant source of electrons. Formate was sometimes also detected at low
concentrations (0.1-0.3 mM), however, we did not identify a clear trend on the
formation/consumption of this product. Therefore, propionate and formate were omitted
from the electron balances in Figure 4.3.
The pH was measured using an Orion 2-Star pH bench top meter (Thermo
Scientific, USA) that was calibrated regularly with 4.01, 7.00, and 10.01 standard
solutions from the manufacturer.
All cultures were sampled for gas and liquid analyses until dechlorination of TCE
to ethene was complete or until the end of experiments on day 40.
DNA extraction and molecular microbial characterization
Pellets were formed by centrifugation from 2-mL liquid from each culture
replicate and they were stored at -20°C until the DNA extraction. Genomic DNA was
extracted for two time points for all sets of HCO3− & HEPES, and two time points for the
set with 30 mM HCO3− only. Before DNA extraction, the replicate pellets were thawed,
resuspended in the supernatant and combined so that only extraction per set per time
point was performed. This was done to increase total biomass and DNA yield. The DNA
extraction was performed as previously described (Ziv-El et al. 2011).

63
We employed quantitative real-time PCR (qPCR) to target the 16S rRNA gene of
Dehalococcoides and Archaea (TaqMan® assays) and the FTHFS gene of
homoacetogens (SYBR Green assay). Triplicate reactions were setup for the six point
standard curves and the samples in 10 µL total volume using 4 µL of 1/10 diluted DNA
as template. We generated standard curves by serially diluting 10 ng μL–1
plasmid DNA.
The primers and probes, reagents concentrations, and thermocycler (Realplex 4S
thermocycler; Eppendorf, USA) conditions were those described for Dehalococcoides
(Holmes et al. 2006), Archaea (Parameswaran et al. 2010; Yu et al. 2005b), and FTHFS
(Parameswaran et al. 2010; Xu et al. 2009). Acetoclastic methanogens (the order
Methanosarcinales) were not assayed because they are absent in the culture employed in
this study, which this was confirmed by qPCR previously (Ziv-El et al. 2011).
Time 0 for all qPCR assays was generated by amplifying genomic DNA from the
inoculum culture and assigning 10% as the starting concentrations of gene copies per L
culture.
Calculations
The distributions of electrons from Figure 4.4 were calculated in units of me-
equivalents for each compound from the equation below:
[ ]
[ ]
The number of me- equivalents for dechlorination is 2, 4, and 6 for DCE, VC and ethene,
respectively, 8 for acetate and methane, and 2 for H2.

64
4.3 Results and discussion
Chloroethenes reductive dechlorination at different HCO3− concentrations
The time course dechlorination measurements presented in Figure 4.1 show a
short lag time for the onset of dechlorination of 0.55 mmol L−1
TCE. TCE to cis-DCE
conversion was the fastest dechlorination step in all cultures, with only VC and ethene
detected after day 5, regardless of the concentration of HCO3−
added. A close monitoring
of VC to ethene reduction rates between each GC measurement revealed that after day 5,
dechlorination rates had slowed down at all HCO3− concentrations, especially in the
cultures containing 30 mM (Figure 4.1G-H), suggesting an electron donor limitation.
The measured H2 levels on day 12 were 1.5 mmol L–1
at 2.5 mM HCO3−
and 0.5 mmol
L–1
at 5 mM HCO3−. At 10 and 30 mM HCO3
−, no H2 peak was detected on the GC-TCD
on day 12. Immediately after injecting an additional 8.2 mmol L–1
H2 on day 12, we
observed an increase in the rates of VC consumption and ethene formation, as seen in
Figure 4.1A-H.

65
Figure 4.1 Chloroethenes dechlorination at different HCO3
− concentrations.
Time course of chloroethenes dechlorination to ethene in cultures amended with H2 as the
sole electron donor and with HCO3− buffer (graphs A, C, E, and G) and a combination of
HCO3− and HEPES buffers (graphs B, D, F, and H). The arrows represent the 2
nd and 3
rd
addition of 8.2 mmol L−1
H2. The error bars are standard deviations of triplicate cultures.
66
Following the second addition of H2, all cultures reached ≥70% conversion of
TCE to ethene. Complete TCE dechlorination (Figure 4.1D) was first observed between
days 17 and 18 in cultures containing 5 mM HCO3− and 5 mM 4-(2-hydroxyethyl)-1-
piperazineethanesulfonic acid (HEPES), which was provided as an additional buffer.
Complete conversion to ethene was further observed in the cultures with 2.5 mM HCO3−
& HEPES on day 26. A threefold increase in the 16S rRNA Dehalococcoides genes
(data not shown) from 1.13 x 10¹¹
(±4.98 x 10
9) copies L
−1 (time 0) to 3.71 x 10
11 (±2.78
x 1010
) and 3.67 x 10¹¹
(±8.04 x 10⁹) copies L
−1 was detected after complete
dechlorination at 5 mM HCO3− & HEPES and 2.5 mM HCO3
− & HEPES, respectively.
Chloroethenes conversion rates in the cultures containing 10 and 30 mM HCO3− were the
slowest, as seen in Figure 4.1. The Dehalococcoides 16S rRNA gene copies per L in the
cultures with HCO3−
and HEPES after complete conversion to ethene were 2.07 x 10¹¹
(±
5.79 x 10⁹) at 10 mM and 2.03 x 10
11 (± 5.59 x 10
9) at 30 mM (data not shown). The
lower resulting cell density coupled to decreased dechlorination rates indicates that
Dehalococcoides growth was diminished at the higher HCO3− concentrations (Student’s t
test; ≥70% confidence level).
We observed a second H2 limitation at 10 and 30 mM HCO3−, with the complete
cessation of VC reduction at 30 mM between days 18 and 26 (Figure 4.1G-H).
Consequently, an additional dose of H2 (8.2 mmol L–1
) was injected into all cultures still
undergoing dechlorination. With the 3rd
addition of electron donor, the 10 and 30 mM
HCO3− cultures supplemented with HEPES dechlorinated all TCE to ethene by day 28
and 32 (Figure 4.1F and H), respectively. The parallels without HEPES showed
incomplete conversion to ethene even by day 40 (Figure 4.1E and G) and VC

67
dechlorination had stalled once again on day 35, or it was proceeding at much reduced
rates.
Methane and acetate production during TCE reductive dechlorination
In Figure 4.1, we show how H2 was limiting dechlorination rates before the 2nd
and 3rd
H2 addition at the different concentrations of HCO3−
tested. The theoretical H2
demand for 0.55 mmol TCE L−1
TCE is 1.65 mmol H2 L−1
. Considering that the H2 at
time 0 was 8.2 mmol L−1
, five times in excess of the theoretical demand for
dechlorination, the slower dechlorination rates observed, together with H2 depletion,
indicated that competing microorganisms were consuming H2 faster than the
dechlorinators. An increase in methane of only 0.01 mmol L−1
was detected at all HCO3−
concentrations before day 4 (Figure 4.2A), which coincides with the disappearance of
TCE and formation of less chlorinated daughter products (Figure 4.1). The lack of
methane production was also confirmed by the qPCR data which show no relative
increase in the numbers of Archaea gene copies L−1
at this time point compared to the
10% inoculum (Figure 4.2B, day 7). The lag time for methane production could have
been due to the previously reported longer lag time of the methanogenic microorganisms
(Fey and Conrad 2000) and the toxic effect of TCE on methanogens (Yang and McCarty
2000). Additionally, besides Dehalococcoides, other dechlorinators can use TCE as
electron acceptor and H2 as electron donor to produce cis-DCE. A competitive advantage
of Geobacter spp., the other identified TCE to cis-DCE respirers in the inoculum culture
(Ziv-El et al. 2011), over methanogens could have also contributed to a delayed onset of
methanogenesis.
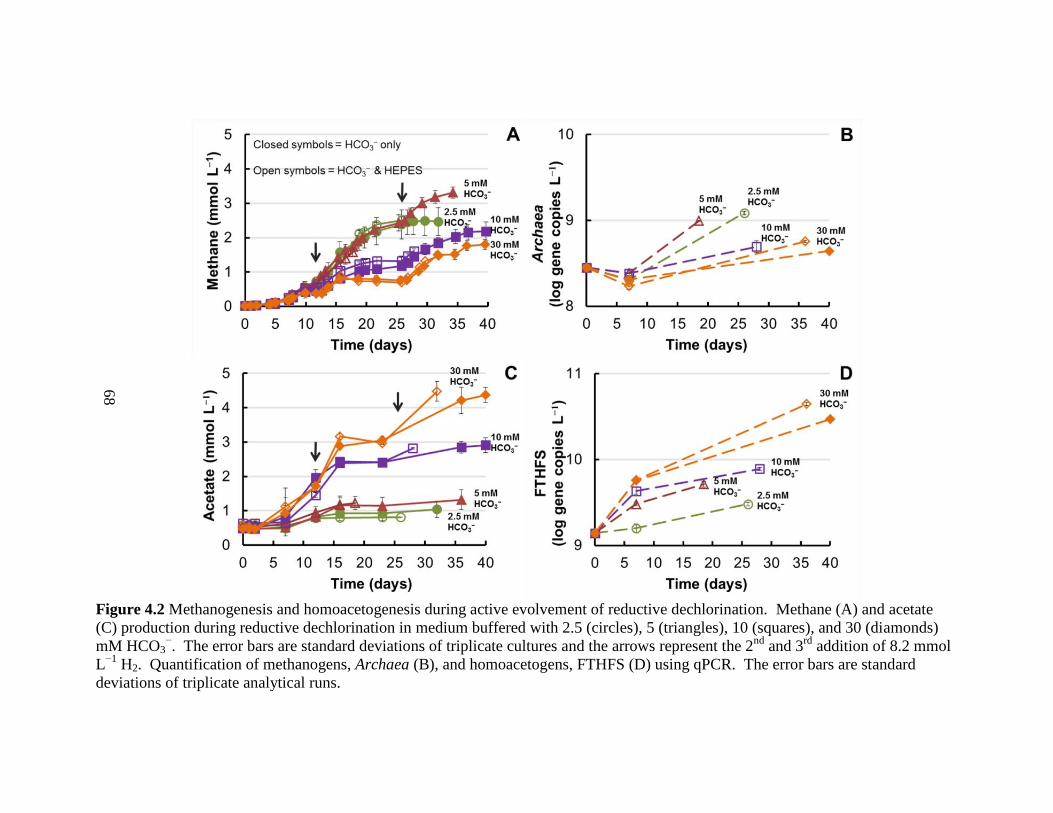
68
Figure 4.2 Methanogenesis and homoacetogenesis during active evolvement of reductive dechlorination. Methane (A) and acetate
(C) production during reductive dechlorination in medium buffered with 2.5 (circles), 5 (triangles), 10 (squares), and 30 (diamonds)
mM HCO3−. The error bars are standard deviations of triplicate cultures and the arrows represent the 2
nd and 3
rd addition of 8.2 mmol
L−1
H2. Quantification of methanogens, Archaea (B), and homoacetogens, FTHFS (D) using qPCR. The error bars are standard
deviations of triplicate analytical runs.

69
Methanogenesis was mostly stimulated at 2.5 mM HCO3− and 5 mM HCO3
−, and
it was less active with increasing concentrations of HCO3− (Figure 4.2A). The methane
production trends observed are supported by a higher increase in Archaea numbers at the
lower HCO3− concentrations (2.5 and 5 mM in Figure 4.2B) compared to 10 and 30 mM
(Figure 4.2B). At 30 mM HCO3−, we detected no net increase in methane between day
10 and 12, suggesting that methanogens, like dechlorinators, were also experiencing H2
limitation. Once H2 became available after the second addition, methane production rates
quickly increased in all cultures (Figure 4.2A).
Upon the third addition of H2 (day 26), methane no longer increased at 2.5 mM
HCO3− even though H2 was provided (Figure 4.2A, day 26-32), indicating a HCO3
−, and
not a H2 limitation. Even though HCO3− was not measured due to analytical limitations,
we were able to track HCO3− consumption via production of methane and acetate, as
illustrated in Figure 4.3. The HCO3− utilization balance presented in Figure 4.3 shows
that production of methane (and to a lesser degree acetate) exhausted all the HCO3
− in the
systems initially supplemented with 2.5 mM.
Homoacetogenesis exhibited the opposite trend to methanogenesis. According to
the time course concentrations recorded and shown in Figure 4.2C, more acetate was
produced when more HCO3− buffer was present. Additionally, among all conditions
tested, the greatest increase in copies L−1
culture by day 7 of the formyltetrahydrofolate
synthase (FTHFS) gene, a functional marker for acetogens, was detected at 30 mM
HCO3− (Figure 4.2D), and the relative numbers of gene copies were lower with
decreasing concentrations of HCO3−. Before the second addition of H2, all cultures
showed an increase of 0.3-1.3 mM acetate (Figure 4.2C). However, after injecting the

70
second dose of H2, only a small rise in acetate was observed at 2.5 and 5 mM HCO3−. In
contrast, at 10 and 30 mM HCO3−, we detected a boost in homoacetogenesis (Figure
4.2C) and corresponding higher increases in the FTHFS gene (Figure 4.2D).
Figure 4.3 Calculated HCO3
− consumption for methane and acetate production.
Calculated HCO3− utilization by hydrogenotrophic methanogens and hydrogenotrophic
homoacetogens at the end of the experiments in the absence or presence of HEPES
(denoted as H on the X-axis). A maximum of 1 mM HCO3− was assumed as carryover
from the 10% inoculum culture, which was grown in 10 mM HCO3− medium. The
stoichiometric requirement for methane is one HCO3−
and for acetate is two HCO3−.
The qPCR data for both methanogens and homoacetogens correlate well with our
analytical data. The resulting increased levels of homoacetogens coupled to the lowest
levels of methanogens at 30 mM HCO3− indicate benefits for the first group at the higher
HCO3− concentrations. Unlike homoacetogens, the resulting methanogenic
microorganisms were present at similar levels in cultures initially containing 2.5 and 5
mM HCO3−
and less plentiful in cultures initially containing 10 and 30 mM HCO3−
(Figure 4.2B). Overall, our findings are consistent with the lower HCO3−
requirement for
methane production: one mol HCO3−
consumed for one mol methane (Eq. 4.1) vs. two
mol HCO3− consumed for one mol acetate (Eq. 4.2). Additionally, these data are in

71
agreement with the findings of Florencio et al., 1995 (Florencio et al. 1995) on substrate
competition between methylotrophic methanogens and methanol-utilizing acetogens in
UASB reactors, where acetogenesis was significant and outcompeted methanogenesis
only in the presence of exogenously supplemented HCO3−.
Distribution of electrons for H2-consuming processes
The fate of electrons fed as H2 is depicted in Figure 4.4. By day 12 (after one
addition of H2; Figure 4.4A), 70% or greater of the total added electrons can be
accounted for towards the three main energy-deriving reactions, dechlorination,
homoacetogenesis and methanogenesis, under all conditions tested. Biomass was not
included in these balances, however, a 10-20% fraction of the total electrons can be
assumed for cell synthesis (Rittmann and McCarty 2001). 1.65 mmol H2, the theoretical
H2 requirement for dechlorination of 0.55 mmol TCE, equals to 3.3 me- equivalents H2,
and each 8.2 mmol L–1
H2 addition represents 16.4 me- equivalents. Out of the three
main processes occurring in our test systems, TCE dechlorination utilized a small fraction
of 9.3% out of the total me- equivalents for the cultures that completed dechlorination
with two H2 additions (Figure 4.1B and D), and 6.7% of the total me- equivalents for
those that received three H2 additions (Figure 4.1A, C, E, F, G, and H).
From the H2 me- equivalents provided at time 0, only 18.3% would have been
required to completely reduce TCE to ethene. As seen in Figure 4.1 and 4.4A, none of
the cultures, regardless of their H2 demand, completed dechlorination with the initial H2.
Additionally, the 10 and 30 mM HCO3−
amendments with or without HEPES received H2
fifteen times in excess of the theoretical demand for dechlorination, yet only the sets

72
supplemented with HEPES completed dechlorination, implicating an important pH
factor, which is discussed in the next section.
Figure 4.4 Distribution of electrons fed as H2 towards dechlorination, methanogenesis,
and homoacetogenesis at various HCO3−
concentrations. (A) Average data from triplicate
cultures on day 12 after addition of 16.4 me- equiv. H2 (8.2 mmol L
−1). (B) Average final
data from triplicate cultures after addition of 33 me- equivalents (16.4 mmol L
−1 H2 in 2.5
mM HCO3− & HEPES and 5 mM HCO3
− & HEPES) and 49 me
- equivalents (32.8 mmol
L−1
in all other sets). The presence of the additional buffer, HEPES, is denoted as H on
the X-axis.
Overall, the fate of most H2 me- equivalents was to HCO3
−-driven reactions
towards the production of methane and acetate. Acetate from hydrogenotrophic
homoacetogenesis was also found to be the main sink of electrons in a field study that

73
used H2 gas for remediation of chlorinated ethenes in groundwater (Edstrom et al. 2005).
Moreover, Duhamel and Edwards 2007 (Duhamel and Edwards 2007) investigated the
growth and yields of hydrogenotrophic methanogens, acetogens and dechlorinators
during the process of dechlorination. The authors found that most of the electrons fed as
methanol in 30 mM HCO3− buffered medium went towards acetogenesis and that
methanogens were outcompeted by acetogens. Our data from 10 and 30 mM HCO3−
corroborate their findings; however, one important additional finding from our
experiments, as seen in Figure 4.2 and 4.4, is that methanogens can outcompete
homoacetogens at low HCO3−
concentrations (2.5 and 5 mM).
The results on TCE dechlorination, methanogenesis and homoacetogenesis from
this work at different HCO3−
concentrations offer some insights into which competing
microbial groups will prevail and how HCO3−
consumption affects rates of
dechlorination. Furthermore, our study also alludes to how HCO3−
drives the H2
competition between organohalide respirers, methanogens, and homoacetogens. This
important aspect has not been determined previously in reductive dechlorination, to our
knowledge. In addition, for application purposes, it is important to consider how
temperature could affect these findings, as these predictions might be somewhat different
at lower temperatures, such as those in groundwater. Our experiments were performed at
30°C, however, temperature studies on organohalide respirers (i.e. Dehalococcoides)
have documented slower rates of dechlorination at 10-15°C compared to their maximum
rates at 30-35°C (Friis et al. 2007). Homoacetogens are even greater H2 and HCO3−
consumers than methanogens at lower temperatures (Fey and Conrad 2000;
Kotsyurbenko et al. 2001), hence, the predominance of homoacetogens would be greater

74
in groundwater systems. Furthermore, because many homoacetogens can consume
fermentables and/or H2 to produce acetate (Drake 1994), it is important to consider
homoacetogenesis as an electron sink and alkalinity-consuming process in dechlorination
at the laboratory and field scale. Although comprehensive models on in situ reductive
dechlorination have been developed (Clapp et al. 2004; Fennell and Gossett 1998;
Robinson and Barry 2009; Robinson et al. 2009), the introduction of hydrogenotrophic
homoacetogenesis in these models has not been considered.
Effect of pH on dechlorination in HCO3− -amended cultures
We supplemented HEPES to all HCO3− concentrations tested to separate between
the effect of HCO3− as an electron acceptor/sink and the effect of pH changes resulting
from microbial processes that use HCO3−
as an electron acceptor, i.e. methanogenesis and
homoacetogenesis. The time course measurements presented in Table 4.1 and the final
measurements in Figure 4.5 uncovered a trend when HCO3− was the sole buffer: a higher
pH increase with increasing HCO3−
concentrations due to methanogenesis and
homoacetogenesis HCO3−-consuming reactions. This was not the case at 30 mM HCO3
−,
where we recorded a lower final pH than at 10 mM HCO3− (Figure 4.5) due to the
buffering capacity from the 20 mM unconsumed HCO3− (Figure 4.3). However, in a
separate experiment where we increased the total concentration of H2 to 41 2 mmol L−1
in cultures containing 30 mM HCO3−, we recorded a final pH of 9.6 under these
conditions (data not shown). These cultures also exhibited slower rates of dechlorination
compared to the data from Figure 4.1 and no ethene formed by day 40 of the experiments
(data not shown).

75
Figure 4.5 pH changes resulting from biological HCO3
− consumption. Average initial
(t=0) and final pH measurements in all HCO3− amendments from this study in the
absence (closed symbols) or presence (open symbols) of HEPES. The error bars are
standard deviations of triplicate cultures. The buffer HEPES is denoted as H on the X-
axis.
An increase in pH at all HCO3− concentrations tested was also observed when
HEPES was present as an additional buffer but the pH increase was within a much
narrower range (Figure 4.5). We ran statistical analyses and determined that, because of
better pH buffering, the rates of dechlorination were significantly faster (Student t-test, P
<0.05) in the presence of HEPES, compared to when HCO3–
was the sole buffer (Figure
4.1). In this study, we show that high pH can also occur in dechlorinating systems,
especially in engineered systems fed with H2, and this pH change can negatively impact
chloroethenes reduction. A detrimental effect on TCE dechlorination that resulted in
accumulation of mainly cis-DCE at pH 8.3 was previously observed in an anaerobic
biotrickling filter (Popat and Deshusses 2009). Our results show that high pH is stressful
to TCE dechlorinating microorganisms, hence, research on bioremediation of
chloroethenes will greatly benefit from comprehensive pH studies.

76
Table 4.1 Time course pH measurements. Average pH values with standard deviations of triplicate cultures containing 2.5, 5, 10, and
30 mM HCO3− as the sole buffer and a combination of HCO3
− and HEPES. The values in bold are the final pH measurements
[HCO3−] mM
Day 2.5
2.5 &
HEPES 5
5 &
HEPES 10
10 &
HEPES 30
30 &
HEPES
0
7.49 ±
0.06
7.48 ±
0.08
7.47 ±
0.05
7.51 ±
0.07
7.54 ±
0.05
7.46 ±
0.04
7.44 ±
0.03
7.43 ±
0.03
1
7.41 ±
0.07
7.43 ±
0.08
7.45 ±
0.07
7.51 ±
0.04
7.56 ±
0.03
7.45 ±
0.06
7.45 ±
0.09
7.50 ±
0.02
7
7.23 ±
0.05
7.38 ±
0.09
7.37 ±
0.06
7.44 ±
0.09
7.66 ±
0.18
7.47 ±
0.06
7.56 ±
0.07
7.58 ±
0.03
17
7.29 ±
0.03
7.26 ±
0.12
7.36 ±
0.03
7.48 ±
0.12
7.87 ±
0.11
7.53 ±
0.04
7.60 ±
0.11
7.60 ±
0.03
19 −
7.58 ±
0.01 −
7.61 ±
0.09 − − − −
20 − − −
− − − −
23
7.81 ±
0.06 −
7.92 ±
0.09
8.12 ±
0.11 − − −
26 −
7.62 ±
0.09 −
−
7.64 ±
0.01
7.68 ±
0.09
7.65 ±
0.01
28 −
−
− 7.76 ±
0.05 − −
32
7.97 ±
0.20
−
−
− 7.80 ±
0.04
35
8.55 ±
0.20
8.73 ±
0.10
8.07 ±
0.19
40
8.71 ±
0.19
8.13 ±
0.17

77
4.4 Conclusions
Despite the fact that HCO3− is a common natural buffer and addition of more
HCO3− can counteract pH deviations from the optimum range for dechlorination, the
results of our study point out that 1) high HCO3−
concentrations increase the H2 demand,
and that 2) consumption of HCO3− contributes to pH increases that could adversely affect
TCE dechlorination rates or result in accumulation of toxic intermediate by-products (i.e.,
DCE and VC). Our findings regarding the effect of pH increases from HCO3−-
consuming reactions are relevant for ex situ chloroethenes remediation technologies that
provide H2 and for laboratory amendments. When fermentable substrates are used to
stimulate reductive dechlorination, or, in the case of groundwater where HCO3− is
replenished from minerals dissolution or organics oxidation, this increase in pH will
likely be offset by the protons produced from fermentation or by the constant supply of
buffer.
However, the lessons learned from this study on dechlorination, methanogenesis,
and homoacetogenesis highlight that HCO3−, especially when abundant, could be an
important variable for biologically-driven TCE dechlorination, as it has a prominent role
as an electron acceptor by stimulating competing H2-consuming processes. Our findings
also point out that a shift in the main H2 competitors occurs depending on the HCO3−
concentration available in the environment, with homoacetogens as the greater electron
sink at high HCO3−, and methanogens as the main H2 competitors at low HCO3
−.

78
CHAPTER 5
SUCCESSFUL OPERATION OF CONTINUOUS REACTORS AT SHORT
RETENTION TIMES RESULTS IN HIGH-DENSITY, FAST-RATE
DEHALOCOCCOIDES DECHLORINATING CULTURES4
5.1 Introduction
In the United States, at least 60% of the National Priorities List Superfund sites
and at least 17% of groundwater sources have detectable levels of chlorinated solvents,
including trichloroethene (TCE) and perchloroethene (PCE) (ATDSR 2011; Moran et al.
2007). The presence and persistence of these compounds in the environment is a major
threat to public health. Biological reduction by members of the bacterial genus
Dehalococcoides is a common and cost-effective avenue for in situ bioremediation of
sites contaminated with chlorinated solvents. Dehalococcoides mccartyi strains provide a
unique solution to remediating chlorinated ethenes as they can reductively dechlorinate
PCE and TCE to the non-toxic end product, ethene, with transient production of cis-
dichloroethene (cis-DCE) and vinyl chloride (VC) (Ellis et al. 2000; Loffler et al. 2013;
Maymo-Gatell et al. 1997).
The common laboratory cultivation method for TCE- and PCE-dechlorinating
cultures containing D. mccartyi is in batch reactors under batch-fed conditions. To
achieve high concentrations of Dehalococcoides (e.g., 1011
-1012
cells L−1
), these cultures
must be fed with high concentrations (mM range) of chlorinated ethenes. Batch systems
can be cumbersome, as self or competitive inhibition of dechlorination, and toxicity of
4 This chapter was prepared as a manuscript and has been submitted for publication.

79
Dehalococcoides and other community members prevents feeding TCE or PCE in high
concentrations (Chambon et al. 2013). Therefore, batch cultivation of Dehalococcoides
entails receiving and reducing (mostly to ethene) several non-inhibitory, successive feeds
of electron acceptors.
Laboratory studies, as well as bioaugmentation applications at contaminated sites,
often require large volumes of culture containing high-density Dehalococcoides cells.
Continuous stirred-tank reactors (CSTRs) are well established sources for yielding large
volumes of steady-state cells or proteins (Hoskisson and Hobbs 2005). Moreover, a
short-hydraulic retention time (HRT) CSTR is an ideal tool for community-based
transcriptomics or proteomics studies, which require cells constantly growing and at high
densities. Unlike in a batch reactor, theoretically, inhibition or toxicity to microbial
community members can be minimized in a CSTR by continuously maintaining low
concentrations of TCE or PCE. These low concentrations should enable feeding higher
concentrations of chlorinated solvents in the same time interval than in a batch reactor,
thus achieving higher Dehalococcoides concentrations.
Kinetic parameters suggest the potential for culturing Dehalococcoides at a short
HRT in a CSTR. Specifically, doubling times of ≤1 d have been reported for some D.
mccartyi pure cultures (Cheng and He 2009; Maymo-Gatell et al. 1997) and D. mccartyi
enrichment cultures (Vainberg et al. 2009). Furthermore, the low Monod half-maximum
rate concentrations (Ks) for TCE, cis-DCE, and VC of D. mccartyi (<5 µM) (Popat and
Deshusses 2011) indicate that these microbes should perform well in a continuous-flow
reactor where the aqueous concentrations of electron acceptors are low. Despite these
potential advantages, dechlorination studies using CSTRs are limited (Berggren et al.

80
2013b; Carr et al. 2000; Drzyzga et al. 2001; Sabalowsky and Semprini 2010; Yang and
McCarty 1998; Zheng et al. 2001). In the past two decades since the discovery of D.
mccartyi, there has been little success in achieving sustainable growth of dechlorinating
cultures that are able to reduce chloroethenes to mostly ethene. In fact, Yang and
McCarty (1998) and Berggren et al. (2013) are the only two cases reported for the
complete conversion of PCE and TCE to ethene in CSTRs (Dehalococcoides
concentrations were not reported) operated at a 36- and a 50-d HRT, respectively. These
HRTs are even longer than those of methanogenic anaerobic digesters (Tchobanaglous et
al. 2003), even though the growth rates of D. mccartyi are faster than those of acetoclastic
methanogens (Tchobanaglous et al. 2003).
A good understanding of the growth requirements and microbial interactions in
dechlorinating cultures containing Dehalococcoides should allow for cultivation of
Dehalococcoides in a high-growth rate system, such as a short-HRT CSTR. We
hypothesized that culturing Dehalococcoides communities in a short-HRT CSTR has,
thus far, been impeded for two major reasons. First is inhibition due to toxicity of the
chlorinated electron acceptors. For growth of dechlorinating cultures to occur, a high
enough concentration of chlorinated solvents must be fed to attain high concentrations of
Dehalococcoides. Yet, very high removal of TCE or PCE to ethene must occur to avoid
inhibition (the effluent concentrations of chlorinated ethenes must be low). Second is the
stringent competition between Dehalococcoides and other community members for the
obligate electron donor, H2.
We report here the successful cultivation and performance of a D. mccartyi-
containing culture in a CSTR operated at a 3-d HRT and fed with 1 and 2 mM TCE. To

81
achieve this successful, proof-of-concept CSTR operation, we built upon data from prior
CSTR runs in our laboratory and a systematic study evaluating HCO3−
as a competing
electron acceptor in microbial dechlorination of TCE (Delgado et al. 2012). In the
previous CSTR runs, summarized in the Table 5.1, we tested different operating
conditions (TCE concentration, electron donor concentration, and HRT) in 30 mM
bicarbonate (HCO3−)-buffered medium. In the HCO3
− study (Delgado et al. 2012), we
saw that high HCO3− levels (i.e., 30 mM) increase the H2 demand by stimulating
homoacetogenesis and methanogenesis, two processes competing for H2 and, therefore,
potentially limiting reductive dechlorination of chloroethenes. Thus, the successful CSTR
runs presented here were achieved with an optimized medium composition with a low
bicarbonate concentration, thereby managing the microbial communities and achieving
low effluent concentrations of chlorinated ethenes.

82
Table 5.1 Experimental conditions tested for CSTR optimization
a all CSTR conditions were tested for at least three HRTs or until performance of the reactors decreased.
brun 7 and 8 were the most succesful and are presented in detail in the Results and Discussion sections.
[Substrate]influent
Run HRT
(d)
TCE
(mM)
Lactate
(mM)
Methanol
(mM)
HCO3−/CO2
buffer (mM)
Notesa
1 4 3 10 12 30
Ethene was the most prevalent dechlorination end-
product throughout three HRTs; low
methanogenesis.
2 2 4 10 12 30
Ethene was the most prevalent dechlorination end-
product throughout three HRTs; low
methanogenesis.
3 8 8.37 15-20 12 30
Conversion to mostly ethene occurred initially,
however TCE accumulated after two HRTs and
performance did not recovered; active
methanogenesis.
4 4 8.37 20 12 30
Conversion to ethene and VC occurred within the
first two HRTs. cis-DCE accumulated after four
HRTs and performance did not recover; active
methanogenesis.
5 3 4 20 12 30 TCE accumulated after four HRTs and performance
did not recover.
6 4 4 20 12 30 Conversion to cis-DCE and VC occurred operating
for six HRTs; active methanogenesis.
7b
3 1 7.5 15 5 (+20 mM
HEPES)
Conversion to mainly ethene was achieved and was
sustained.
8b
3 2 10 15 5 (+20 mM
HEPES)
Conversion to mainly ethene was achieved and was
sustained.

83
5.2 Materials and methods
Bioreactor design and operation
A schematic and photograph of the reactor setup used (Bioreactor 1 and 2) are
shown in Figure 5.1. Each reactor consisted of a 0.65-L glass bottle sealed with a butyl
rubber stopper and a screw cap. The stopper was perforated to fit the influent and
effluent lines, and a gas sampling port containing a removable septum (IceBlue® Septa,
Restek, USA). The septum was changed several times throughout the runs and some
losses of headspace compounds occurred due to brief flushing with ultra-high purity
(UHP) N2. The actual liquid and headspace operating volumes were 0.5 L and 0.1 L,
respectively. Each reactor was magnetically stirred at 200 RPM and submerged in a
water bath set at 30°C. Influent medium was pumped from 5-L glass bottles containing 4
L of medium with a Minipuls 3 peristaltic pump (Gilson, Inc., USA) to achieve a 3-d
HRT. All lines and tubing used were 1/8” diameter stainless steel or Viton material. The
liquid sampling port was located before the effluent collection bottle. The effluent
culture was collected into 1-L glass bottles equipped with 1-L gas Tedlar bags (SKC Inc.,
USA) for gas collection.

84
Figure 5.1 Schematic (top panel) and photograph (bottom panel) of the experimental
apparatus employed in this study.
Bioreactor 1 and Bioreactor 2 were operated under identical conditions for a total
of 120 and 100 days, respectively. During this time, the bioreactors were fed TCE-
containing medium continuously at all times, except for the initial four days after
inoculation and for seven days in between switching the concentrations of TCE from 1 to

85
2 mM. Before increasing the TCE concentration in the influent medium, the bioreactors
were also flushed with UHP N2 to remove headspace gases.
Inoculum culture and medium composition
The culture employed for the studies herein was DehaloR^2 (Ziv-El et al. 2011), a
TCE to ethene dechlorinating consortium containing Dehalococcoides and Geobacter.
DehaloR^2 was initially grown in a CSTR fed with 3 mM TCE at a 4-d HRT (Table 5.1,
Run 1). The culture from this run was collected and stored at 4°C for 15 months prior to
inoculating the bioreactors presented herein. 0.5 L DehaloR^2 culture (100% vol/vol)
per reactor was inoculated on day 0. Trace concentrations of cis-DCE and VC were
present in this culture during storage; therefore, we added 2 mM lactate and kept the
reactors in batch mode for ~4 days to reduce the chlorinated ethenes to ethene before
proceeding to continuous operation.
We prepared reduced anaerobic mineral medium containing 1 mM TCE (aqueous
concentration), 7.5 mM sodium DL-lactate, 15 mM methanol, 15 mM 4-(2-
hydroxyethyl)-1-piperazineethanesulfonic acid (HEPES), 5 mM NaHCO3, 5 mL L−1
ATCC vitamin supplement, 500 μg L−1
vitamin B12, 0.25 µg L−1
resazurin, 0.2 mM L-
cysteine, and 0.2 mM Na2S x 9 H2O. The salts and trace nutrients added per liter medium
were those described in Delgado et al. (Delgado et al. 2012). In the medium with 2 mM
TCE, the lactate and HEPES were increased to 10 mM and 20 mM, respectively, NaCl
was decreased to 0.1 g L−1
, and methanol was kept at 15 mM. The influent medium pH
was adjusted to 7.5-7.8 with 10 N NaOH. The same base medium composition was used
for previous CSTR runs presented in Table 5.1, except the noted differences summarized
in the table. We first autoclaved the medium, boiled it under a stream of UHP N2, and
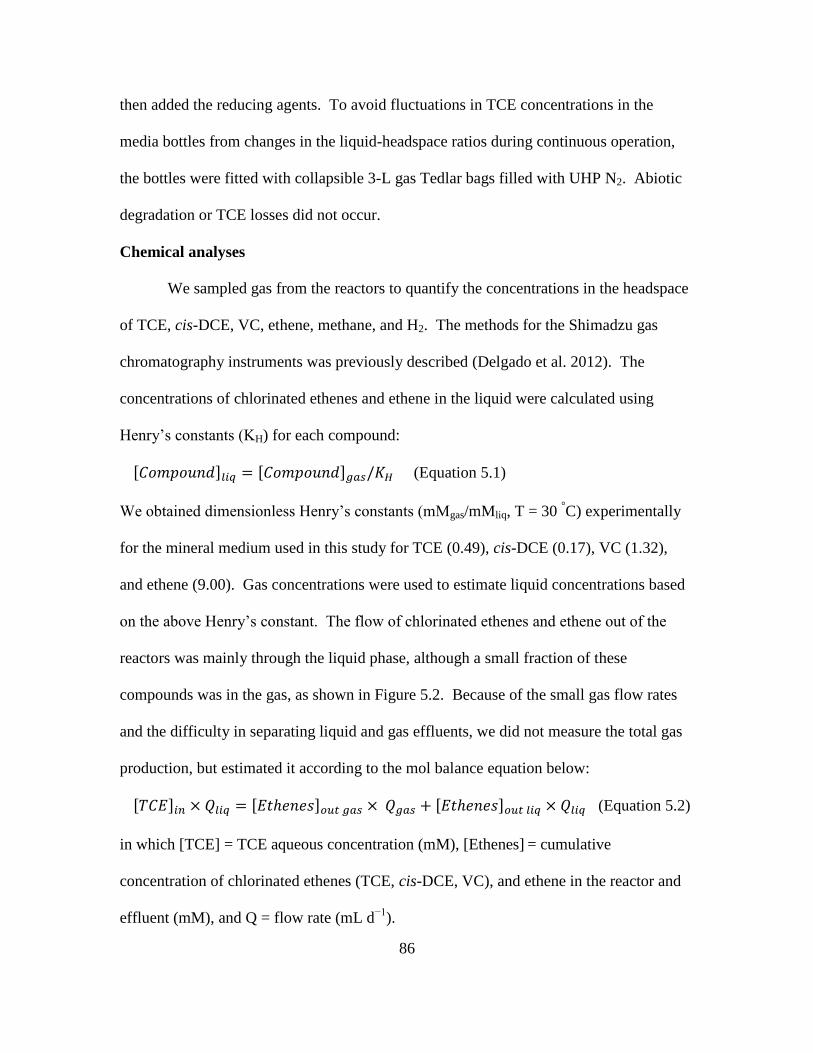
86
then added the reducing agents. To avoid fluctuations in TCE concentrations in the
media bottles from changes in the liquid-headspace ratios during continuous operation,
the bottles were fitted with collapsible 3-L gas Tedlar bags filled with UHP N2. Abiotic
degradation or TCE losses did not occur.
Chemical analyses
We sampled gas from the reactors to quantify the concentrations in the headspace
of TCE, cis-DCE, VC, ethene, methane, and H2. The methods for the Shimadzu gas
chromatography instruments was previously described (Delgado et al. 2012). The
concentrations of chlorinated ethenes and ethene in the liquid were calculated using
Henry’s constants (KH) for each compound:
[ ] [ ] (Equation 5.1)
We obtained dimensionless Henry’s constants (mMgas/mMliq, T = 30 °C) experimentally
for the mineral medium used in this study for TCE (0.49), cis-DCE (0.17), VC (1.32),
and ethene (9.00). Gas concentrations were used to estimate liquid concentrations based
on the above Henry’s constant. The flow of chlorinated ethenes and ethene out of the
reactors was mainly through the liquid phase, although a small fraction of these
compounds was in the gas, as shown in Figure 5.2. Because of the small gas flow rates
and the difficulty in separating liquid and gas effluents, we did not measure the total gas
production, but estimated it according to the mol balance equation below:
[ ] [ ] [ ] (Equation 5.2)
in which [TCE] = TCE aqueous concentration (mM), [Ethenes] = cumulative
concentration of chlorinated ethenes (TCE, cis-DCE, VC), and ethene in the reactor and
effluent (mM), and Q = flow rate (mL d−1
).

87
We removed liquid samples to measure lactate, methanol, acetate, and propionate
using high purity liquid chromatography (HPLC) (Delgado et al. 2012). We used an
Orion pH meter (Thermo Scientific, USA) to monitor the pH, which ranged from 6.3 to
7.5. We performed pH adjustments to ~7 with 10 N NaOH only when the pH inside the
reactors dropped to 6.3.
Microbial ecology
We extracted total genomic DNA from pellets made with 1.5 mL liquid samples
according to the protocol previously published (Ziv-El et al. 2011). Quantitative real-
time PCR (qPCR) assays were performed targeting the 16S rRNA genes of D. mccartyi,
Geobacteraceae, and Archaea, and formyltetrahydrofolate synthase (FTHFS) (gene
involved in the pathway for acetate production by homoacetogens) as described by Ziv-El
et al. (Ziv-El et al. 2012b). We also performed qPCR tracking the reductive
dehalogenase genes of D. mccartyi, tceA, vcrA, and bvcA, using the qPCR protocol,
primers, probes, reagent concentrations, and PCR conditions detailed previously (Ziv-El
et al. 2012b), except each reductive dehalogenase gene was assayed separately.
Conversion rates and long-term viability of CSTR-grown culture
Once pseudo steady-state (defined as stable conversion to ethene) was achieved
for the 1 mM and 2 mM TCE continuous runs, we determined the maximum rates of
conversion, Rmax, for TCE, cis-DCE, and VC. We transferred 100 mL effluent culture to
160-mL serum glass bottles, and flushed for 20 min with UHP N2 gas to remove any
carry-over ethenes. Then, we provided a chlorinated electron acceptor (0.5 mmol
Lculture−1
of either TCE, cis-DCE, or VC), 5 mM lactate, 12 mM methanol, and 10 mL H2
(4.1 mmol Lculture−1
). The bottles were incubated at 30 °C on an orbital shaker set at 200

88
RPM. We measured the concentration of dechlorination products formed over short time
intervals (five hours or less) in order to minimize increases in dechlorinating populations.
qPCR tracking the D. mccartyi 16S rRNA gene confirmed that these bacteria had not
grown significantly throughout the course of these short tests (data not shown). All Rmax
values were determined from at least triplicate experiments.
The culture produced in the CSTR from Runs 1-2 and 7-8 in Table 5.1 was stored
in a 4°C refrigerator and periodically monitored for activity. Viability experiments
consisted of transferring 10 mL stored culture to 160-mL serum bottles containing 90 mL
anaerobic medium (10% inoculum vol/vol), adding 0.5-1 mmol Lculture−1
TCE, 5 mM
lactate, and 12 mM methanol, and monitoring TCE dechlorination to ethene in time
course experiments.
5.2 Results
Dechlorination performance in a 3-d HRT CSTR fed with 1 mM or 2 mM TCE
We initially assessed the dechlorination activity (performance of the culture) in
the CSTRs by measuring TCE and its dechlorination products using a GC. Figure 5.2
shows the performance of the replicate CSTRs fed 1 mM TCE at a 3-d HRT. cis-DCE
and VC initially accumulated in the bioreactors within the first two HRTs; however, by
day 11, ethene became the prevalent dechlorination end-product, and >90% conversion of
TCE to ethene was observed thereafter. Both bioreactors reached dechlorination pseudo
steady-state after ~5.5 HRTs, which was maintained until the end of this continuous run.

89
Figure 5.2. Dechlorination of 1 mM TCE and 2 mM TCE influent and the corresponding
percent ethene conversion (top line graphs) in CSTRs operated at a 3-d HRT. The light
gray shaded areas are periods of batch operation and the dashed line represents the start
of the 2 mM TCE continuous feed. Shown are (A) Bioreactor 1 and (B) Bioreactor 2.
When the influent was 2 mM TCE, the bioreactors exhibited the same conversion
trends as when initially fed with 1 mM TCE (Figure 5.2). For the first several HRTs, cis-
DCE and VC were the main dechlorination products. Conversion to mostly ethene was
achieved in ~14 days (day 65), but performance declined shortly after (Figure 5.2A). We
believe this decline was due to an oxygen leak into the reactor from a damaged influent
pump tubing. Once the tubing was replaced, the reactor recovered, and a pseudo steady-
state with greater than 93% conversion to ethene was achieved by day 94 with 2 mM
TCE influent concentration, and sustained for 9 subsequent HRTs (Figure 5.2A). The
duplicate bioreactor presented in Figure 5.2B also reached conversion to mostly ethene,
with a pseudo-steady state of ~80% reduction to ethene of 2 mM-fed TCE.

90
Growth of Dehalococcoides and enrichment of efficient dechlorinating microbial
communities
The high conversion to ethene was coupled to increases in Dehalococcoides
densities. We monitored the growth of D. mccartyi every HRT until pseudo steady-state
was achieved. Figure 5.3A shows the initial concentration of D. mccartyi and the
average pseudo steady-state abundances of 1.3 1012
and 1.6 1012
cells Lculture−1
when
continuously feeding 1 or 2 mM TCE, respectively, at a rate of biomass production of 3.3
1011
D. mccartyi cells Lculture−1
d−1
. In terms of D. mccartyi diversity/composition, the
CSTR-grown culture contained the three previously identified reductive dehalogenase
genes, tceA (Magnuson et al. 1998), vcrA (Muller et al. 2004), and bvcA (Krajmalnik-
Brown et al. 2004). Figure 5.3B highlights that concentrations of the three reductive
dehalogenase genes increased during operation, reaching their highest levels during the 2
mM-TCE pseudo-steady state, with abundances of 1011
copies L−1
for tceA and vcrA, and
108 copies L
−1 for bvcA. Besides Dehalococcoides, DehaloR^2 culture contains one other
identified dechlorinating genus, Geobacter (Ziv-El et al. 2011; Ziv-El et al. 2012c),
which only partially reduces TCE to cis-DCE (Sung et al. 2006a). Geobacter, assayed
using the 16S rRNA gene of Geobacteraceae, also increased throughout the two
operating conditions (Figure 5.3A). The densities obtained for Geobacteraceae in our
CSTRs were 6.4 1010
gene copies Lculture−1
. Data on growth of TCE/PCE-reducing
Geobacter in CSTRs for pure culture or for mixed communities are absent from the
literature; however, the abundances obtained for these microbes in our CSTRs are also on
the high end compared to those in batch-fed mixed dechlorinating cultures (Duhamel and
Edwards 2007; Ziv-El et al. 2011).

91
Figure 5.3 Microbial populations abundance in a 3-d HRT CSTR determined by qPCR at
time 0 (no-fill bars), 1 mM TCE pseudo steady-state (light-filled bars), and 2 mM TCE
pseudo steady-state (dark-filled bars). (A) Log concentrations of Dehalococcoides
mccartyi (DHC), Geobacteraceae (GEO), FTHFS (FTH), and Archaea (ARC). (B) Log
concentrations of Dehalococcoides mccartyi functionally-defined reductive dehalogenase
genes, tceA, vcrA, and bvcA. All error bars show standard deviations of replicate samples
(time 0, n = 2; 1 mM TCE, n = 4; 2 mM TCE, n = 3) and analytical qPCR reactions (time
0, n = 6; 1 mM TCE, n = 12; 2 mM TCE, n = 9).
Fate of electron donors and H2-induced microbial interactions
Consumption of the provided fermentable substrates is presented in Figure 5.4A
and C. Lactate was not detectable in all measurements at both influent TCE
concentrations. Approximately half of the 15 mM methanol was consumed for the phase
with 1 mM TCE influent, while close to complete methanol consumption was recorded at
2 mM TCE pseudo-steady state (Figure 5.4A and C). The duplicate bioreactors behaved
similarly in terms of lactate and methanol consumption in the 1 mM TCE and 2 mM TCE
runs, although the bioreactor converting TCE to ~80% ethene (Figure 5.2B) did not
completely consume the influent methanol until the last HRT.
As a result of lactate and methanol fermentation, H2 concentrations in the
headspace of the bioreactors were 0.3-0.5 mM for the 1 mM TCE run. However, with 2
mM TCE, H2 was no longer detected in the headspace (the detection limit for our H2
measurements was 0.018 mmol L−1
gas concentration) despite a higher lactate

92
concentration feed. One of the driving hypotheses of this study was that growth of
Dehalococcoides coupling high cell densities to dechlorination of TCE to ethene can
occur if competition for H2 by non-dechlorinating populations is minimized. H2-
oxidizing methanogens, the only type of methanogens in the inoculum culture, were
initially present at concentrations of 109 gene copies Lculture
−1 and decreased by two orders
of magnitude to 107 gene copies Lculture
−1 during the 1 mM TCE run (Figure 5.3A). The
decrease in gene copies of methanogens was also corroborated by the gradual decrease in
methane in the bioreactors, as seen in Figure 5.4B and D. During the 2-mM TCE
continuous run, the gene copies of methanogens per liter culture increased to 108 (Figure
5.3A) and, hence, methane concentrations in the liquid were up to 1.3 mM (Fig. 5.4B and
D). This was likely a consequence of the increase in lactate influent concentration from
7.5 mM to 10 mM, which subsequently yielded additional H2 and HCO3−/CO2 as growth
substrates for hydrogenotrophic methanogens. The FTHFS gene copies of
hydrogenotrophic homoacetogens, another competing sink coupling H2 oxidation to the
reduction of HCO3−, were 5 10
10 initially, decreased during the 1-mM run and
remained fairly constant at the 2-mM pseudo steady-state (Figure 5.3A).

93
Figure 5.4 Consumption of influent lactate and methanol and production of acetate,
propionate, and methane during continuous feed of medium containing 1 mM TCE and 2
mM TCE in a 3-d HRT CSTR. The light gray shaded areas are periods of batch
operation and the dashed line represents the start of the 2 mM TCE continuous feed.
Shown are (A-B) Bioreactor 1 and (C-D) Bioreactor 2.
Dechlorination kinetics of the CSTR-grown culture
Table 5.2 summarizes the maximum conversion rates, Rmax, at pseudo-steady state
obtained from the culture produced in the CSTR grown with the two concentrations of
TCE. Experimental data for the values in Table 5.2 were obtained from separate short-
term batch experiments for each individual chlorinated ethene (examples shown in Figure
5.5). These experiments were performed to ensure that the rates of dechlorination were
within the same order of magnitude for all chlorinated ethenes. With the culture
produced when continuously feeding 2 mM TCE, we obtained an overall rate of
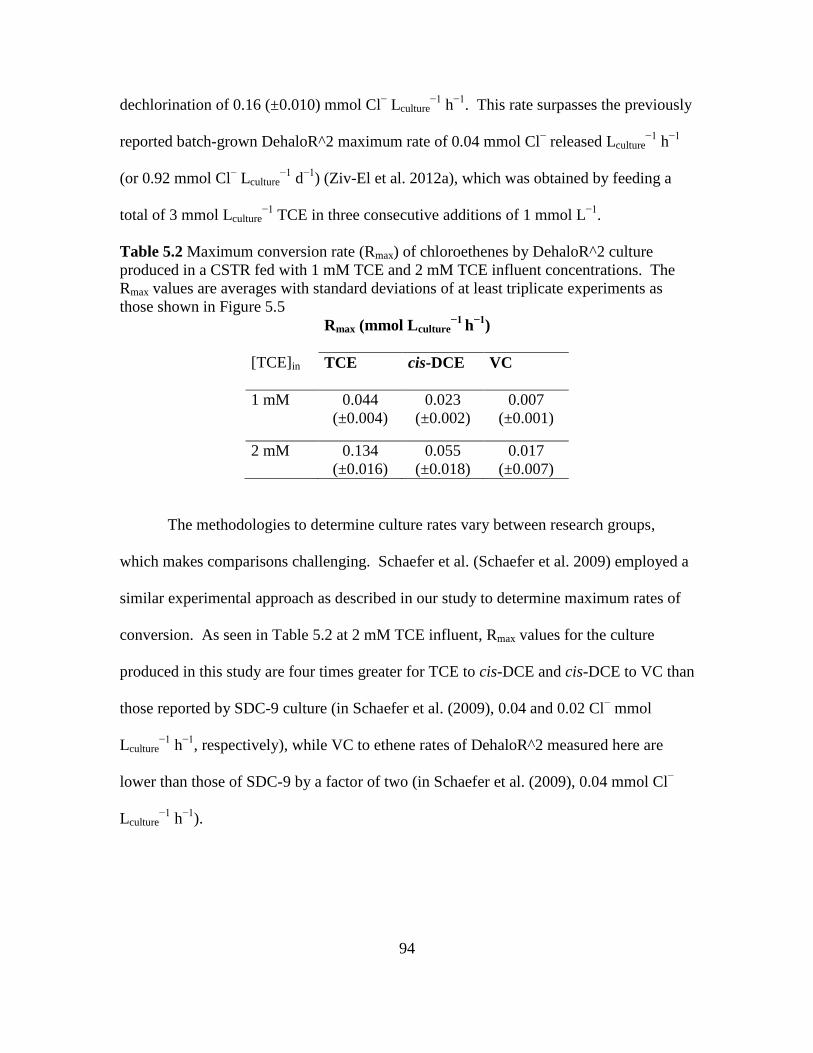
94
dechlorination of 0.16 (±0.010) mmol Cl− Lculture
−1 h
−1. This rate surpasses the previously
reported batch-grown DehaloR^2 maximum rate of 0.04 mmol Cl− released Lculture
−1 h
−1
(or 0.92 mmol Cl− Lculture
−1 d
−1) (Ziv-El et al. 2012a), which was obtained by feeding a
total of 3 mmol Lculture−1
TCE in three consecutive additions of 1 mmol L−1
.
Table 5.2 Maximum conversion rate (Rmax) of chloroethenes by DehaloR^2 culture
produced in a CSTR fed with 1 mM TCE and 2 mM TCE influent concentrations. The
Rmax values are averages with standard deviations of at least triplicate experiments as
those shown in Figure 5.5
Rmax (mmol Lculture−1
h−1
)
[TCE]in TCE cis-DCE VC
1 mM 0.044
(±0.004)
0.023
(±0.002)
0.007
(±0.001)
2 mM 0.134
(±0.016)
0.055
(±0.018)
0.017
(±0.007)
The methodologies to determine culture rates vary between research groups,
which makes comparisons challenging. Schaefer et al. (Schaefer et al. 2009) employed a
similar experimental approach as described in our study to determine maximum rates of
conversion. As seen in Table 5.2 at 2 mM TCE influent, Rmax values for the culture
produced in this study are four times greater for TCE to cis-DCE and cis-DCE to VC than
those reported by SDC-9 culture (in Schaefer et al. (2009), 0.04 and 0.02 Cl− mmol
Lculture−1
h−1
, respectively), while VC to ethene rates of DehaloR^2 measured here are
lower than those of SDC-9 by a factor of two (in Schaefer et al. (2009), 0.04 mmol Cl−
Lculture−1
h−1
).

95
Figure 5.5 Experimental time-course measurements to determine the maximum rate of
conversion, Rmax, for the culture produced in a 3-dHRT CSTR fed with an influent
containing (A) 1 mM TCE and (B) 2 mM TCE. 0.5 mmol L−1
TCE, cis-DCE, or VC was
added to the effluent culture in serum batch bottles in separate experiments. The
production rate of the lesser chlorinated products, cis-DCE, VC, or ethene, was measured
over short periods (5 hours or less) to minimize microbial growth. The points are
experimental measurements and the lines are linear fits of the experimental data.
We predicted that Rmax and D. mccartyi cell density would roughly double when
the influent concentration of TCE was increased from 1 mM to 2 mM. Table 5.2 and
Figure 5.5 reveal that the rates of TCE and cis-DCE dechlorination were three times
greater, while VC dechlorination rates were two times greater at 2 mM TCE influent.
Yet, D. mccartyi concentrations increased only from 1.3 1012
(1-mM TCE run) to 1.6
1012
cells Lculture−1
(2-mM TCE run). A plausible explanation for the apparent
discordance between the higher rates of dechlorination and those of D. mccartyi cell
copies is related to the growth of Geobacter dechlorinators in the culture. Geobacter
increased ~2.5 fold when the CSTR medium contained 2 mM TCE (Figure 5.3A). This
suggests that the contribution of Geobacter in the reduction of TCE to cis-DCE increased
significantly at 2 mM TCE feed, when compared to the contribution of D. mccartyi for
this dechlorination step.

96
Culture viability after prolonged storage
An advantage in producing dense microbial cultures containing Dehalococcoides
is that they can be cultured in the laboratory and stored for later usage for prolonged
periods without significant loss in activity. The culture initially produced in our CSTR
(Run 1, Table 5.1) was stored for extended periods at 4°C. Figure 5.6A shows that
complete dechlorination of ~0.7 mmol Lculture−1
TCE occurred in 6 days after the culture
had been stored in a refrigerator for seven months. After 15 months of storage, the same
concentration of TCE was reduced to 80% ethene in 15 days (Figure 5.6B), implying
that, while some loss of activity will occur (due to cell decay), these cultures maintain
good dechlorinating activity profiles when the appropriate conditions are provided for
revival and growth.
Figure 5.6 Viability and performance of DehaloR^2 culture produced in a CSTR after
storage at 4 °C for 7 months (panel A) and 15 months (panel B). Dechlorination of TCE
to ethene was assessed by transferring 10 mL refrigerated culture into 90 mL reduced
anaerobic mineral medium amended with TCE and electron donors. The error bars are
standard deviations of triplicate cultures.

97
Discussion
In this study, we show that using carefully selected conditions in a CSTR,
cultivation of Dehalococcoides at short HRTs is feasible, resulting in robust communities
capable of fast dechlorination. A compilation of previous CSTR studies on
dechlorination of chlorinated ethenes is shown in Table 5.3. As revealed in Table 5.3, in
most previous CSTR studies, the main reduced end-product of dechlorination of TCE and
PCE was cis-DCE. This suggested that D. mccartyi respiring cis-DCE or VC to ethene
were inhibited by high concentrations of chlorinated solvents, washed out, or
outcompeted by other microbes. Our study is the first to document conversion to mostly
ethene in a CSTR at a 3-d HRT (Table 5.3). We also report for the first time pseudo
steady-state densities and production rates for Dehalococcoides cultivated in a CSTR.
Moreover, the values for D. mccartyi presented in Figure 3A are close to the maximum
ever reported for these microbes; the only past study to obtain growth to 1012
Dehalococcoides cells Lculture−1
was Vainberg et al. (2009).
The community data regarding methanogens and homoacetogens abundances, in
conjunction with the CSTR dechlorination performance and the concentrations of
methane and acetate, support the fact that competing sinks for H2 were minimized using
our medium composition, thus allowing H2 to be used optimally for dechlorination.
Indeed, Dehalococcoides and Geobacter growth correlated with good TCE
dechlorination performance in these continuous reactors. Moreoever, recently,
Geobacter was documented to provide D. mccartyi with required corrinoids for
dechlorinating activity and cellular growth (Yan et al. 2012) and, therefore, may be a
desired partner in Dehalococcoides-containing cultures.

98
Table 5.3 Summary of key parameters and microbial inocula employed in chlorinated ethenes CSTR studies
Chlorinated
ethene
e- donor and C
source
Undefined
nutrients
Buffer HRT
(d)
Major
reduced
product
Inoculum culture
1 mM TCE
2 mM TCE
7.5 mM lactate and
15 mM methanol
10 mM lactate and
15 mM methanol
15 mM HEPES and
5 mM HCO3−
20 mM HEPES and
5 mM HCO3−
3
3
Ethene
Ethene
DehaloR^2 dechlorination culture
converting TCE to ethene (this
study)
1.12 mM
PCE
4.3 mM lactate 0.02 g L−1 yeast
extract
35 mM Na2CO3 and
6 mM K2HPO4
50-55 Ethene Point Mugu (PM) dechlorinating
culture converting PCE to ethene
(Berggren et al. 2013b)
7.4 mM TCE 25.6 mM lactate CO32− 5.9-
25.3
cis-DCE Evanite (EV) subculture converting
PCE to cis-DCE (Sabalowsky and
Semprini 2010)
0.52 mM
PCE
52 mM methanol,
20 mM pyruvate or
80% H2/20% CO2,
and 2 mM acetate
0.2 g L−1 yeast
extract, 1% spent
medium
90 mM HCO3− 11
5.8
2.9
VC
cis-DCE
cis-DCE
Methanol/PCE enrichment culture
converting PCE to VC and ethene
(Zheng et al. 2001)
≤ 50 mM
PCE
(nominal)
45 mM lactate 10 mM (NH4)H2PO4
and 20% CO2
~2 cis-DCE Co-culture of Desulfitobacterium
frappieri TCE1 and Desulfovibrio
sp. strain SULF1 (Drzyzga et al.
2001)
0.2 g PCE in
hexadecane
NAPL
10 mM formate 0.2 g L−1 yeast
extract
10 mM HCO3− 3 cis-DCE Methanol/PCE enrichment culture
converting PCE to VC and ethene
(Carr et al. 2000)
0.98 mM
PCE
1.7 mM benzoate 0.02 g L−1 yeast
extract
14 mM Na2CO3 and
3 mM K2HPO4
36 Ethene Dechlorinating source culture
converting PCE to ethene (Yang
and McCarty 1998)

99
The CSTR-produced culture exhibited very rapid rates of dechlorination, as
shown in Table 5.2. The lower Rmax for VC compared to TCE and cis-DCE (Table 5.2)
implies that the limiting step in the CSTRs was dechlorination of VC. VC to ethene is
commonly the slowest dechlorination step (Yu et al. 2005a), which might explain some
of the rate differences between VC and TCE and cis-DCE dechlorination. Another factor
we identified that could have led to lower apparent rates for VC dechlorination is the
poorer gas-liquid transfer properties of VC, given its higher Henry’s constant. In abiotic
batch experiments using our medium composition (data not shown), we determined that
0.5 mmol L−1
VC added as gas did not equilibrate between the liquid and gas within the
time of the Rmax experiments (5 hours or less). Therefore, the slower dissolution of VC
into the medium might have limited its bioavailability. Hence, the reported values for
VC in Table 5.2 are the minimum Rmax for this electron acceptor, with the possibility that
the rates were higher as we did not observe significant VC accumulation during reactor
operation (Figure 5.2).
The high abundances of D. mccartyi obtained in our CSTRs (1012
Dehalococcoides cells L−1
) clearly support the opportunity for their efficient cultivation
in continuous reactors at short HRTs, which brings about numerous advantages when
working with dechlorinating cultures. In the laboratory, such a system is ideal to provide
a continuous supply of uniform culture for downstream applications requiring large
volumes of cultures. These could include studies on microbial interactions, inhibition,
transcriptomics and proteomics, experiments testing a large matrix of environmental
conditions, or pilot-scale bioaugmentation applications. Moreover, a CSTR can
100
minimize reactor size requirements and/or time of operation to achieve high-density
Dehalococcoides cultures.
For field applications, a short-HRT CSTR would be ideal for production of robust
cultures capable of fast-rate of dechlorination containing high-cell density
Dehalococcoides. Depending on the site to be remediated, bioaugmentation can require
hundreds to thousands liters of bioaugmenting culture (Aziz et al. 2012). Fast
dechlorination rates linked to high concentrations of D. mccartyi have been demonstrated
in few well-characterized, batch grown bioaugmentation cultures, including the
commercially produced culture, SDC-9, where PCE is constantly supplied to batch
fermenters and 1011
-1012
Dehalococcoides cells are produced (Vainberg et al. 2009).
This study demonstrates that a similar outcome in terms of Dehalococcoides densities
and rates of dechlorination can also be achieved using a continuous-flow bioreactor, and
provides the first scientific platform for a potential future implementation of such system
at a larger scale.

101
CHAPTER 6
EFFECT OF HIGH AMMONIA ON MICROBIAL COMMUNITIES DRIVING
CHLORINATED ETHENES REDUCTIVE DECHLORINATION5
6.1 Introduction
Decades of improper chemical disposal, careless handling, and accidental spills,
along with the continuous generation of waste by all communities, industries,
technologies and military, have led to extensive contamination of soil and groundwater.
To date, ~1300 Superfund sites and hundreds of thousand sites are polluted with organic
and inorganic compounds requiring decontamination (US EPA 2012). One of the most
common organic pollutants of soil and groundwater is the industrial solvent
trichloroethene (TCE) (ATDSR 2011). TCE is a toxic, carcinogenic compound (ATDSR
2011). Because of its frequency, of toxicity, and potential for human exposure, TCE has
been placed in the most recent CERCLA Priority List of Hazardous Substances at
number 16 out of 275 substances (ATDSR 2011).
TCE can be biologically detoxified to ethene via reductive dechlorination by
Dehalococcoides mccartyi species (Maymo-Gatell et al. 1997). These hydrogen-
oxidizing anaerobes utilize TCE as an electron acceptor for energy metabolism (Cupples
et al. 2003; He et al. 2003b; Maymo-Gatell et al. 1997; Sung et al. 2006b) and acetate as
carbon source for cell synthesis (Tang et al. 2009). Reductive dechlorination of TCE
occurs in a step-wise manner with transient production of cis-dichloroethene (cis-DCE)
and vinyl chloride (VC). Because of their fruitful ability to transform chlorinated ethenes
5 This chapter was prepared as a manuscript and will be submitted for publication.

102
to a harmless end-product, Dehalococcoides have been extensively and successfully
employed for in situ bioremediation scenarios at contaminated sites (Ellis et al. 2000;
Lendvay et al. 2003; Major et al. 2002; Schaefer et al. 2010).
A large number of environments containing TCE, including Superfund sites, U.S.
National Priorities List (NPL) hazardous waste sites, and groundwater sources, are also
polluted by multiple contaminants (Moran et al. 2007; US EPA 2012). These include
other industrial solvents (e.g. perchloroethene, trichloroethane, and dichloromethane),
metals (e.g. lead, arsenic, copper, and cadmium), petroleum hydrocarbons (benzene,
toluene, ethylbenzene, and xylene), and nitrogen-containing compounds (e.g. nitrate and
ammonia). Ammonia is another priority pollutant in the 2011 CERCLA list and was
detected at 135 NPL hazardous waste sites (ATDSR 2011). Contamination with high
ammonia has been reported in urban and rural areas from sewage and mains leakage,
septic tanks, industrial spillages, river or channel infiltration, fertilizers, house building,
storm water and direct recharge, contaminated land, and landfills (Bohlke et al. 2006;
Wakida and Lerner 2005).
Past studies on TCE in situ bioremediation in the presence of ammonia have
exclusively focused on cometabolism with aerobic conditions (Arciero et al. 1989; Ely et
al. 1997; Rasche et al. 1991; Yang et al. 1999). Aerobically, TCE can be biodegraded by
ammonia-oxidizing bacteria using ammonia as a growth substrate (Arciero et al. 1989;
Ely et al. 1997; Rasche et al. 1991; Yang et al. 1999). In the past two decades, however,
anaerobic reductive has emerged as the most feasible avenue for bioremediation of TCE
(Stroo 2012). Yet, investigations on the effect of ammonia on anaerobic TCE reductive
dechlorination have not been carried out. Ammonia is the preferred nitrogen source for

103
synthesis of cellular components in Dehalococcoides (He et al. 2007) and in a multitude
of bacterial or archaeal microbial groups. However, when present at high concentrations,
ammonia exerts inhibition via disturbance of cellular homeostasis. Specifically, NH3
readily diffuses into the cell, where it gets protonated to NH4+ (Kadam and Boone 1996).
Consequently, high ammonia can increase the intracellular pH and alter the cell redox
potential (Sprott and Patel 1986). Depletion of H+ from conversion of NH3 to NH4
+ also
disrupts the proton motive force and energy acquisition required for growth (Hajarnis and
Ranade 1994; Kadam and Boone 1996; Sprott and Patel 1986).
Tolerance to high ammonia concentrations is microorganism-dependent (Lay et
al. 1998; Muller et al. 2006) and tolerance to ammonia by Dehalococcoides is not known.
The knowledge gap on the effect of high ammonia in TCE- reductively dechlorinating
microbial communities containing Dehalococcoides is significant. For field applications,
this knowledge limitation prevents us from assessing or predicting the outcome of
anaerobic in situ bioremediation where TCE and ammonia are co-contaminants. In the
present study, we assessed the effect of high total ammonia6 nitrogen (TAN) in defined
medium and in landfill leachate. We evaluated a range of concentrations (up to 2 g L−1
NH4+-N) and quantitatively tracked reductive dechlorination, fermentation,
homoacetogenesis and methanogenesis in Dehalococcoides-containing enrichment
cultures fed with TCE and fermentable substrates.
6 Comprises both unprotonated (NH3) and protonated (NH4
+) forms. Where appropriate, NH3 and NH4
+
chemical formulas are used to denote the species discussed.

104
6.2 Materials and methods
NH4Cl batch experiments
Microbial inocula, composition, and growth. Two mixed microbial cultures, ZARA-10
(Chapter 3) and DehaloR^2 (Ziv-El et al. 2011), dechlorinating TCE to ethene, were used
in this study. For the experiments herein, ZARA-10 culture was cultivated in serum
batch bottles, while DehaloR^2 inoculum was cultivated in a chemostat as described in
Chapter 5. Both cultures were grown on TCE as the chlorinated electron acceptor, and
fermentable substrates, lactate and methanol, were the electron donors and carbon
sources. The microbial composition of these cultures was previously determined using
454 pyrosequencing and quantitative real-time PCR (qPCR) in Ziv-El et al. (2011) and in
Chapter 3. Both cultures are enriched in Dehalococcoides and fermenting and
homoacetogenic bacteria (predominated by the genera Acetobacterium and Clostridium).
ZARA-10 is more active in methanogenesis than DehaloR^2; however, both contain only
hydrogenotrophic methanogens (Ziv-El et a. 2011 and Chapter 3).
Medium and concentrations of TAN tested. We prepared reduced anaerobic mineral
medium buffered with 30 mM HCO3− as previously described (Ziv-El et al. 2011) in 160-
mL glass serum bottles containing 90 mL medium. TAN was added in the form of
NH4Cl powder before sealing the bottles with butyl rubber stoppers and crimping with
aluminum crimps. NH4Cl was supplemented to obtain the following final concentrations
in g L−1
NH4+-N: 0.5, 1, and 2. The concentration of NH4
+-N in the controls was 0.08 g
L−1
(6 mM NH4Cl). Ammonia measurements at time 0 and at the end of the expriments
confirmed that no ammonia losses occurred. We setup triplicate bottles for each
condition. At the beginning of the experiments, each bottle received 5 µL neat TCE (0.5
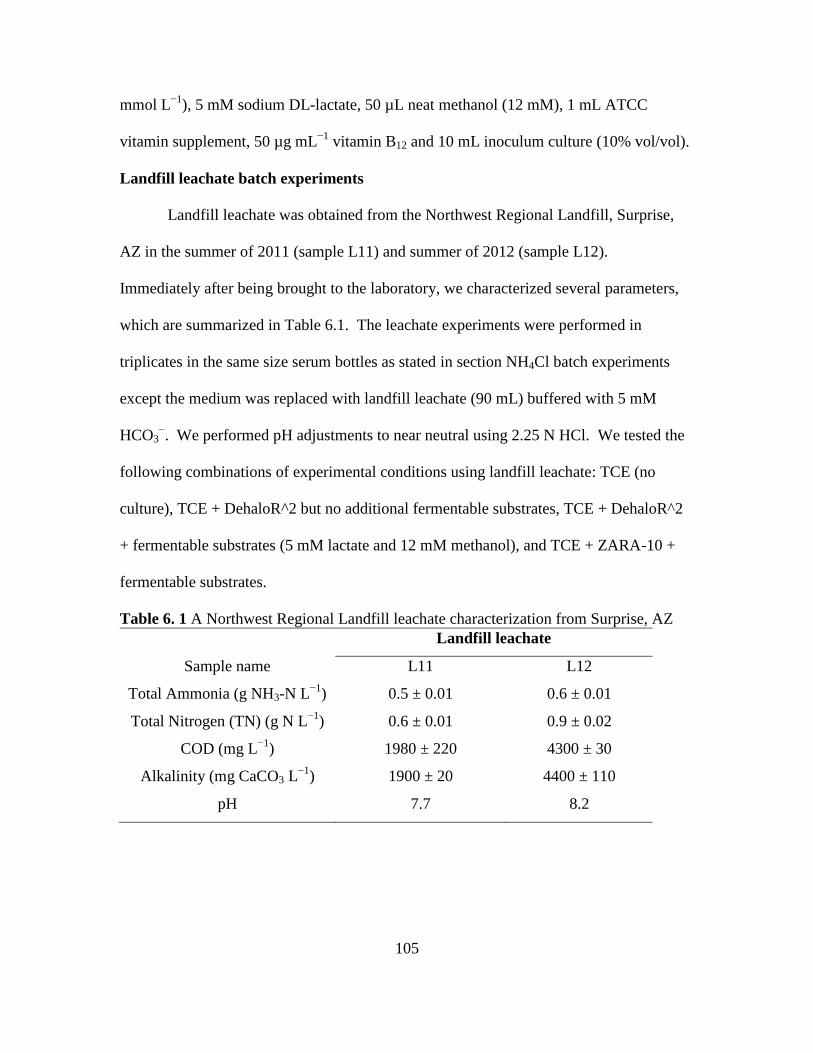
105
mmol L−1
), 5 mM sodium DL-lactate, 50 µL neat methanol (12 mM), 1 mL ATCC
vitamin supplement, 50 µg mL−1
vitamin B12 and 10 mL inoculum culture (10% vol/vol).
Landfill leachate batch experiments
Landfill leachate was obtained from the Northwest Regional Landfill, Surprise,
AZ in the summer of 2011 (sample L11) and summer of 2012 (sample L12).
Immediately after being brought to the laboratory, we characterized several parameters,
which are summarized in Table 6.1. The leachate experiments were performed in
triplicates in the same size serum bottles as stated in section NH4Cl batch experiments
except the medium was replaced with landfill leachate (90 mL) buffered with 5 mM
HCO3−. We performed pH adjustments to near neutral using 2.25 N HCl. We tested the
following combinations of experimental conditions using landfill leachate: TCE (no
culture), TCE + DehaloR^2 but no additional fermentable substrates, TCE + DehaloR^2
+ fermentable substrates (5 mM lactate and 12 mM methanol), and TCE + ZARA-10 +
fermentable substrates.
Table 6. 1 A Northwest Regional Landfill leachate characterization from Surprise, AZ
Landfill leachate
Sample name L11 L12
Total Ammonia (g NH3-N L−1
) 0.5 ± 0.01 0.6 ± 0.01
Total Nitrogen (TN) (g N L−1
) 0.6 ± 0.01 0.9 ± 0.02
COD (mg L−1
) 1980 ± 220 4300 ± 30
Alkalinity (mg CaCO3 L−1
) 1900 ± 20 4400 ± 110
pH 7.7 8.2
106
Gas and liquid chemical analyses
We extracted 200 µL of headspace gas from each bottle to measure TCE, cis-
DCE, VC, ethene, and methane using a gas chromatograph (GC) instrument (Shimadzu
GC-2010; Columbia, MD) equipped with a flame ionization detector (FID) and a Rt-QS-
BOND capillary column (Restek; Bellefonte, PA). The GC settings were those
previously published (Delgado et al. 2012). We performed calibration curves within a
range of 0.05-2.45 mmol L–1
for all chlorinated ethenes, ethene and methane in the same
size serum bottles as those used for the experiments. To measure H2, we employed a GC
equipped with a thermal conductivity detector (TCD) with the instrument settings were
outlined elsewhere (Parameswaran et al. 2011). Even though it measured, H2 never
accumulated to detectable levels in the headspace of the bottles. The detection limit for
H2 is 0.8% vol/vol.
We quantified lactate, methanol, acetate, and propionate via high performance
liquid chromatography (HPLC) using a previously published method (Parameswaran et
al. 2011) from 1-mL liquid samples filtered through a 0.2 μm polyvinylidene fluoride
membrane syringe filter (Pall Corporation; Ann Arbor, MI). Five point calibration curves
were generated for each acid and alcohol during every HPLC run.
Total Chemical Oxygen Demand (COD) was determined using the HACH COD
kits, and Total Nitrogen with HACH TNT 828 (Hach Company Loveland, CO).
The pH was measured using an Orion 2-Star pH bench top meter (Thermo
Scientific, USA) calibrated with the standard solutions purchased from the manufacturer.

107
Quantitative real-time PCR (qPCR)
We extracted DNA from 0.5 mL pellets formed by centrifugation and stored at -
20°C until the DNA extraction. The detailed DNA extraction protocol was previously
described (Ziv-El et al. 2011). We then employed qPCR for the following targets:
Dehalococcoides 16S rRNA gene, Geobacteraceae 16S rRNA gene, Archaea 16S rRNA
gene (methanogens), and the formyltetrahydrofolate (FTHFS) gene (homoacetogens).
We setup triplicate reactions for the six point standard curves and the samples in 10 µL
total volume using 4 µL of 1/10 diluted DNA as template. The standard curves were
produced by serially diluting 10 ng μL–1
plasmid DNA. The primers and probes, reagents
concentrations, and thermocycler (Realplex 4S thermocycler; Eppendorf, USA)
conditions were those previously published (Ziv-El et al. 2012b).
6.3 Results and discussion
We supplemented increasing concentrations of NH4Cl (0.5, 1, and 2 g L−1
NH4+-
N) to ZARA-10, a representative TCE-dechlorinating culture containing
Dehalococcoides (the main TCE respirers), fermenters, hydrogenotrophic
homoacetogens, and hydrogenotrophic methanogens. Figure 6.1 presents the effect of
increasing TAN on dechlorination performance under all conditions tested in time-course
experiments. TAN concentrations induced differences in the rates of reductive
dechlorination. The rates of dechlorination decreased with increasing concentration of
ammonia (Figure 6.1B-D), but, dechlorination to ethene occurred at all conditions tested
(Figure 6.1A-D). As expected, dechlorination rates with the ZARA-10 inoculum were

108
fastest in the Controls (0.08 g L−1
NH4+-N), where TAN was supplemented at non-toxix
concentrations as an essential growth nutrient (Figure 6.1A).
Figure 6.1 Dechlorination of TCE to ethene by ZARA-10 culture in bottles containing
(A) 0.08 (Control), (B) 0.5, (C) 1 and (D) 2 g L−1
NH4+-N. All cultures initially received
5 mM lactate and 12 mM methanol as electron donors and carbon sources. The cultures
in panel C and D received an additional 5 mM lactate on day 46. The error bars are
standard deviations of triplicate cultures are not shown when smaller than the symbols.
Because the greatest effect of TAN on biological reductive dechlorination was
observed at 2 g L−1
NH4+-N, we tested it with an additional dechlorinating culture,
DehaloR^2, to strengthen our observations. As shown in Table 6.2, the end-reduced
products of reductive dechlorination with DehaloR^2 inocula were also VC and ethene at
2 g L−1
NH4+-N. Both cultures contain multiple strains of Dehalococcoides involved in
the different steps of reductive dechlorination of TCE to ethene (Ziv-El et al. 2011). The

109
findings with two separate dechlorination cultures from our study are strongly indicative
that Dehalococcoides populations carrying out dechlorination of chlorinated ethenes are
tolerant to concentrations as high as 2 g L−1
NH4+-N. This is an important finding for
bioremediation, as the function (ability to reduce TCE to ethene) of either ZARA-10 or
DehaloR^2 was slowed, but not lost when these microorganisms were exposed to TAN
ranges from 0.5-2 L−1
NH4+-N.
Table 6.2 Extent of TCE reductive dechlorination observed at the ammonia
concentrations tested in this study. N/D = not determined
TAN (g NH4+-N L
−1)
Inoculum culture 0.5 1 2
ZARA-10 Ethene Ethene VC and ethene
DehaloR^2 N/D N/D VC and ethene
An investigation into the fate of the electrons provided as fermentable substrates,
lactate and methanol, in ZARA-10 cultures is shown in Figure 6.2. The measurements
for lactate and methanol also reveal an influence of ammonia on the consumption of these
compounds and the subsequent production of fermentation products. Specifically, the
rates of fermentation at the different ammonia concentrations correlated negatively with
increasing NH4+-N concentrations as follows (in descending order): 0.08 g L
−1 NH4
+-N
(Control) > 0.5 g L−1
NH4+-N > 1 g L
−1 NH4
+-N > 2 g L
−1 NH4
+-N (Figure 6.2A-B). The
cultures mostly affected by this lag time in fermentation were those containing 2 g L−1
NH4+-N, with the complete depletion of the methanol provided at time 0 only after ~16

110
days (Figure 6.2A-B), compared to the controls, which depleted the methanol after 4
days. Previous work on glucose fermentation to H2 and volatile acids in batch
experiments containing TAN at 0.5 and 2 g L−1
N also showed differences in the
metabolic rates of fermentation (slower rates and longer lag time at higher ammonia
concentrations) (Salerno et al. 2006), consistent with our findings for lactate and
methanol.
The differences in lactate and methanol fermentation rates were also accompanied
by variances in the concentrations of acetate and propionate formed at high TAN (0.5-2 g
L−1
NH4+-N) when compared to Controls (Figure 6.2C-D). With 5 mM lactate and 12
mM methanol initially added, acetate production was positively correlated to increasing
TAN concentrations (Figure 6.2C). The cultures containing 2 g L−1
NH4+-N accumulated
~15 mM acetate, while the Controls accumulated 8 mM acetate (Figure 6.2C).
Significant differences were not observed for propionate formation at 0.5 and 1 g L−1
NH4+-N (3.8 mM under both conditions). On the other hand, at 2 g L
−1 NH4
+-N,
production of propionate was drastically diminished (Figure 6.2D).

111
Figure 6.2 Effect of ammonia on fermentation (A-D), methanogenesis (E) and reductive
dechlorination (F) for ZARA-10 culture. Symbols: triangles, 0.08 g L−1
NH4+-N;
diamonds, 0.5 g L−1
NH4+-N; circles, 1 g L
−1 NH4
+-N; squares, 2 g L
−1 NH4
+-N. The
error bars are standard deviations of triplicate cultures.
Besides dechlorination, acetogenesis, and fermentation, of particular interest to
reductive dechlorination is methanogenesis. As discussed in Chapter 4,
hydrogenotrophic methanogens compete for H2 with Dehalococcoides, and, therefore,
their excessive proliferation must be avoided. In animal waste streams containing
112
concentrations of 1 g L−1
N or higher, TAN decreased the specific methanogenic activity
by up to 50% (Braun et al. 1981; Hansen et al. 1998; Sossa et al. 2004). Consisten with
observations in other systems, methanogenesis was slowed in our system by the presence
of high TAN, compared to Controls (Figure 6.2E). The inhibitory effect of high TAN
was distinguishable between cultures in terms of lag time and total methane produced.
Explicitly, the methanogenic lag times were positively correlated with increasing TAN
concentrations. Methanogenic lag times in descending order were: 2 g L−1
NH4+-N > 1 g
L−1
NH4+-N > 0.5 g L
−1 NH4
+-N. From the lactate and methanol initially added as H2
precursors at time 0, the total methane concentrations produced in the presence of excess
TAN in ascending order were 2 g L−1
NH4+-N > 1 g L
−1 NH4
+-N > 0.5 g L
−1 NH4
+-N
(Figure 6.2E). On the second addition of lactate on day 46 at 1 and 2 g L−1
NH4+-N, the
methane concentration also increased and reached similar levels to Controls at 2 g L−1
NH4+-N (data not shown in Figure 6.2E).
To correlate the chemical data shown in Figure 6.2 with microbial growth, we
employed qPCR targeting select groups of interest in the representative culture, ZARA-
10. Figure 6.3 shows the qPCR data enumerating Dehalococcoides, Geobacteraceae,
FTHFS (homoacetogens), and Archaea (methanogens) in the ZARA-10 inoculum and at
the end of the experiments for Controls and for the cultures supplemented with 0.5-2 g
L−1
NH4+-N. Figure 6.3 and Table 6.3 highlight the effect of TAN on growth when
ammonia was present in excess than the amount required as a nitrogen source for growth.
Interestingly, out of all the microbial groups assayed, Dehalococcoides was least affected
by increasing TAN (Figure 6.3 and Table 6.3). At the opposite end, Geobacteraceae, the
other bacterial group involved in partial reduction of TCE to cis-DCE in ZARA-10

113
cultures was significantly impacted by high TAN. Geobacteraceae showed no growth
relative to the inoculum at 1 and 2 g L−1
NH4+-N, respectively, and lower concentrations
than the initial ones were detected (Figure 6.3 and Table 6.3). These findings imply that
batch concentrations ≥ 1 g L−1
NH4+-N completely inhibit growth of Geobacter-type
dechlorinators.
Figure 6.3 Quantitative PCR (qPCR) enumerating the 16S rRNA gene copies of
Dehalococcoides, Geobacteraceae, and Archaea, and FTHFS gene copies for each
ammonia concentration tested at time 0 (10% inoculum) and at the end of the
experiments (Controls (0.08 g L−1
NH4+-N), day 8; 0.5 g L
−1 NH4
+-N, day 19; 1 g L
−1
NH4+-N, day 60; 2 g L
−1 NH4
+-N, day 100). The data are averages of triplicate qPCR
reactions. The error bars are standard deviations of the mean and are not shown when
smaller than the symbols.
Homoacetogens were assayed using the FTHFS gene, which is a highly conserved
gene in the acetyl-CoA pathway (Figure 6.3). The homoacetogens present in the
inoculum culture are able to grow on the fermentable substrates and/or on the H2
produced from fermentation and HCO3−/CO2. The FTHFS genes copies decreased as a
function of increasing TAN (Figure 6.3), indicating a negative impact on cell synthesis.
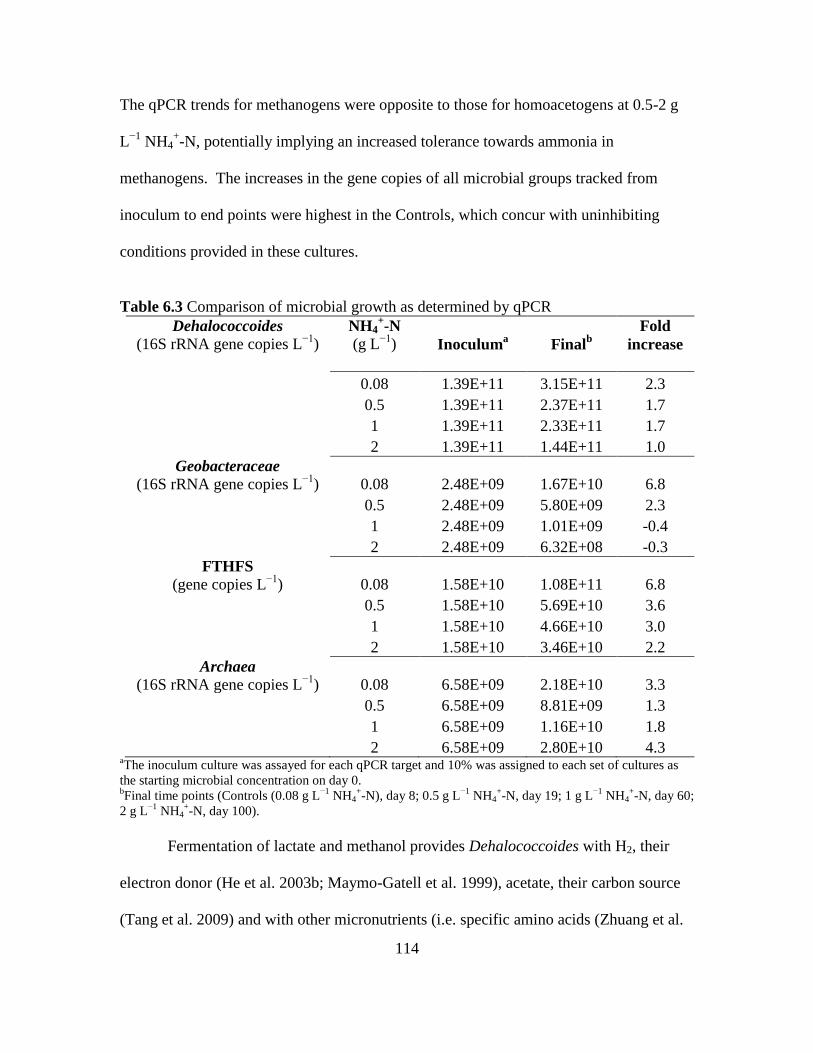
114
The qPCR trends for methanogens were opposite to those for homoacetogens at 0.5-2 g
L−1
NH4+-N, potentially implying an increased tolerance towards ammonia in
methanogens. The increases in the gene copies of all microbial groups tracked from
inoculum to end points were highest in the Controls, which concur with uninhibiting
conditions provided in these cultures.
Table 6.3 Comparison of microbial growth as determined by qPCR
Dehalococcoides
(16S rRNA gene copies L−1
) NH4
+-N
(g L−1
)
Inoculum
a
Final
b
Fold
increase
0.08 1.39E+11 3.15E+11 2.3
0.5 1.39E+11 2.37E+11 1.7
1 1.39E+11 2.33E+11 1.7
2 1.39E+11 1.44E+11 1.0
Geobacteraceae
(16S rRNA gene copies L−1
) 0.08 2.48E+09 1.67E+10 6.8
0.5 2.48E+09 5.80E+09 2.3
1 2.48E+09 1.01E+09 -0.4
2 2.48E+09 6.32E+08 -0.3
FTHFS
(gene copies L−1
) 0.08 1.58E+10 1.08E+11 6.8
0.5 1.58E+10 5.69E+10 3.6
1 1.58E+10 4.66E+10 3.0
2 1.58E+10 3.46E+10 2.2
Archaea (16S rRNA gene copies L
−1) 0.08 6.58E+09 2.18E+10 3.3
0.5 6.58E+09 8.81E+09 1.3
1 6.58E+09 1.16E+10 1.8
2 6.58E+09 2.80E+10 4.3 aThe inoculum culture was assayed for each qPCR target and 10% was assigned to each set of cultures as
the starting microbial concentration on day 0. bFinal time points (Controls (0.08 g L
−1 NH4
+-N), day 8; 0.5 g L
−1 NH4
+-N, day 19; 1 g L
−1 NH4
+-N, day 60;
2 g L−1
NH4+-N, day 100).
Fermentation of lactate and methanol provides Dehalococcoides with H2, their
electron donor (He et al. 2003b; Maymo-Gatell et al. 1999), acetate, their carbon source
(Tang et al. 2009) and with other micronutrients (i.e. specific amino acids (Zhuang et al.

115
2011) and vitamin B12, a co-factor cobalamin required for their reductive dehalogenase
enzymes) (He et al. 2007). Therefore, a plausible explanation for the decreased rates in
dechlorination at increasing TAN concentrations includes beside the direct, toxic effect of
ammonia on Dehalococcoides, a H2 limitation, and potentially a nutrient limitation.
Moreover, in a previous work (Yan et al. 2012), it was demonstrated that Geobacter
lovleyi also provide Dehalococcoides with vitamin B12. The complete inhibition of this
bacterium at 1 and 2 g L−1
NH4+-N might have also contributed to slower TCE to ethene
reduction rates.
We sought to expand our findings on the effect of TAN in defined medium with
experiments using leachate collected from a landfill in Arizona. Landfills are prime
examples of environments containing high TAN (Arigala et al. 1995; Christensen et al.
2001; Kjeldsen et al. 2002). Landfills are also a noteworthy source of a variety of
polluting substances, including TCE or other chlorinated ethenes (Chang et al. 2003;
Kjeldsen et al. 2002). Moreover, a large number of cases of groundwater contamination
with landfill leachate have been documented (Christensen et al. 2001), and leachate
sometimes contains TAN concentrations as high as 1 g L−1
NH3-N (Wakida and Lerner
2005).
A time-course experiment testing the effect of landfill leachate on TCE biological
reduction is presented in Figure 6.4. Reduction of TCE was not observed in abiotic
controls or in unbuffered landfill leachate with a starting pH of 8.2. Figure 6.4A
demonstrates that remediation of TCE to ethene in landfill leachate containing 0.6 g L−1
N (Sample L11, Table 6.1) occurs, even without external electron donors. Landfill
leachate typically contains abundant sources of organics (Kjeldsen et al. 2002) which can

116
be fermented to H2. However, TCE detoxification occurred at faster rates when we
supplemented lactate and methanol (Figure 6.4B).
Figure 6.4 Assessment of dechlorination of TCE in bottles containing landfill leachate
and bioaugmented with a dechlorinating culture (10% inoculum) (A) without provided
electron donors or (B-C) with additional fermentable substrates as sources of electrons.
The error bars are standard deviations of triplicate cultures are not shown when smaller
than the symbols.

117
As expected, when we employed a higher strength leachate containing 0.9 g L−1
N
(Sample L12, Table 6.1), the rates of TCE reductive dechlorination were slower (Figure
6.4C), supportive of the results obtained in defined medium. Nonetheless, after 100 days
of incubation, ethene was the predominant metabolic product from reductive
dechlorination even at this higher TAN concentration from landfill leachate.
This work provides the first and systematic insights into the effects of high
ammonia on bioremediation of chlorinated ethenes in environments polluted with both
contaminants, such as groundwater and landfills. Our data on reductive dechlorination by
Dehalococcoides-containing cultures reveals relative ammonia tolerance for
Dehalococcoides of up to 2 g L−1
NH4+-N. Despite the fact that reductive dechlorination
rates and the growth of Dehalococcoides as well as the rates of fermentation were
affected by high TAN, dechlorination of TCE proceeded all the way to ethene. This
demonstrates that detoxification of chlorinated ethenes is feasible even at the high
ammonia concentrations tested in this study.

118
CHAPTER 7
KEY FINDINGS AND RECOMMENDATIONS FOR FUTURE WORK
7.1 Key findings
In situ bioremediation using Dehalococcoides is a promising, environmentally
friendly solution for restoring soil and groundwater contaminated by chlorinated ethenes.
My research advances the knowledge on reductive dechlorination and the involved
microbial communities. This work details novel or optimized approaches to improve
reductive dechlorination and growth of Dehalococcoides in mixed communities and
provides insights into some of the challenges and factors potentially limiting
biostimulation or bioaugmentation.
In Chapter 3, I provide a different explanation on the inability to consistently
promote reductive dechlorination of PCE/TCE beyond DCE in microcosms or at
contaminated sites, even when the presence of Dehalococcoides communities is
confirmed. Previously, this inability was explained by the presence of inhibiting
conditions or by the absence of Dehalococcoides capable of complete dechlorination.
My results from Cuzdrioara and Carolina biostimulated and later bioaugmented
microcosms cannot be explained by either of those two hypotheses. I instead propose
that the stalling at DCE was due to an electron donor competition in which components
of the soil or sediment served as electron acceptor for competing microorganisms.
Furthermore, I provide evidence on the importance of specific enrichment techniques and
growth protocols. Using the three soil/sediment-free enrichment cultures described in
Chapter 3 (originating from geographically distinct regions), I demonstrate that

119
Dehalococcoides can become significant competitors for electron donor, and I show how
to obtain fast rates and high concentrations of Dehalococcoides in the laboratory by
diminishing competitors for H2.
As a result of the study in Chapter 3, I achieved a heightened awareness of the
fierce competition for electron donor at sites contaminated with chlorinated solvents or in
laboratory cultures. In Chapter 4, I then identified HCO3−, the natural buffer in
groundwater and the buffer of choice in the laboratory and at contaminated sites
undergoing biological treatment, as a potential H2 sink for reductive dechlorination.
HCO3− is the electron acceptor for hydrogenotrophic methanogens and hydrogenotrophic
homoacetogens, two microbial groups competing for H2 with Dehalococcoides. Indeed,
data from Chapter 4 clearly shows that high HCO3−
concentrations increase the H2
demand and negatively affect the rates and extent of dechlorination. The lessons learned
from that study on competition among dechlorination, methanogenesis, and
homoacetogenesis highlight that HCO3−, especially when abundant, could be an
important, but not previously considered, variable for biologically-driven TCE
dechlorination.
By applying the knowledge gained from microbial community management from
Chapters 2 (DehaloR^2 work) and Chapter 3 and 4, I achieved the first ever successful
high growth-rate continuous reactor (3-d HRT CSTR) for cultivation of dechlorinating
cultures containing Dehalococcoides. Critical for the successful operation of this CSTR
(Chapter 5) was maximizing certain interaction while minimizing others. I show that by
using carefully selected conditions in a CSTR, including minimizing HCO3−, I could
prevent the excessive growth of methanogens and homoacetogens, making cultivation of

120
Dehalococcoides-containing cultures at short HRTs feasible. This resulted in 1012
Dehalococcoides cells L−1
and robust cultures capable of fast dechlorination. The
evidence presented in Chapter 5 and in Chapter 3, consistently exemplifies that
Dehalococcoides are not slow-growing anaerobes. To the contrary, they perform
reduction of TCE to ethene at fast rates when present in well managed mixed
communities.
One of the challenging aspects of bioremediation of chlorinated solvents is their
co-occurrence with other contaminants. In Chapter 6, I provide a first and systematic
insight into the effect of high ammonia on bioremediation of chlorinated ethenes in
environments impacted by both contaminants, such as contaminated groundwater or
landfills. Specifically, I examined the effect of total ammonia nitrogen on mixed
microbial communities driving the reductive dechlorination of TCE and the possibility of
using leachate as electron donor for dechlorination or ammonia-nitrogen as specific
inhibitor of the microbial community members. Fermentation rates were impacted by
high ammonia concentrations while Geobacter bacteria were completely inhibited at the
higher ammonia concentrations tested. However, I present a previously undocumented
increased tolerance of Dehalococcoides to high ammonia concentrations without loss of
the ability to dechlorinate TCE to ethene. This demonstrates that detoxification of
chlorinated ethenes is feasible even at 2 g L−1
NH4+-N.
Next, I succinctly describe several research works which I believe merit to be
pursued. These studies are recommended because they are either a logical next step from
my dissertation work or because they lie within my research interests.

121
7.2 Recommendations for future work
Constructing and deconstructing reductively dechlorinating communities
After the first isolation of Dehalococcoides mccartyi, it was hypothesized that
Dehalococcoides have undefined nutritional requirements, as, when grown in isolation,
strain 195 required filtered supernatant from an anaerobic digestor enrichment culture
(Maymo-Gatell et al. 1997). The isolation of Dehalococcoides mccartyi strain BAV1
occurred in completely defined basal salts medium, which demonstrated that no unknown
nutrients are necessary for growth of this microbe coupled to reductive dechlorination
(He et al. 2003b). However, all isolates described in Table 2.2 grow poorly and perform
reduction of chlorinated ethenes at drastically lower rates when compared to mixed
enrichment cultures containing Dehalococcoides. And so, in recent years, a line of
research has emerged into unveiling the required syntrophic interactions that enhance
reductive dechlorination by Dehalococcoides in mixed communities.
The Krajmalnik-Brown Laboratory has also partaken into investigating syntrophic
interactions and ideal reductively-dechlorinating microbial communities through the
work of Ziv-El et al. (Ziv-El et al. 2011; Ziv-El et al. 2012c) and the work in Chapters 3
and 5. Ideal, robust communities, showing major improvements over previously
described cultures in the literature have been enriched in the Krajmalnik-Brown Lab on
multiple occasions. Yet, our work has not elucidated whether certain specific microbes
or microbial groups are either required or ‘better” partners than others to obtain fast rates
of reductive dechlorination. The literature also presents somewhat unclear evidence
towards this scientific inquiry in tri- and co-cultures containing D. mccartyi strains and

122
pure strains of either a fermenter, methanogen, or another TCE-respirer (Men et al. 2012;
Yan et al. 2013; Yan et al. 2012).
In light of the multiple changes I made to the medium composition used for
growth of dechlorinating cultures and the strictly anaerobic cultivation techniques I
practiced (Chapter 3,4, and 6), it would be worthwhile to first test whether growth of pure
cultures D. mccartyi can be improved. For this, I propose to grow D. mccartyi isolates
using the optimized medium from Chapter 5, except lactate and methanol should be
replaced with H2 and acetate. These pure cultures should be grown as described in
Chapter 3 by feeding multiple consecutive additions of chlorinated ethenes, H2 and
acetate. The purpose of this study would be to compare the rates of reductive
dechlorination, yields, and maximum cell concentrations achieved with published values
from the literature.
Regardless of the outcome from the experiments with Dehalococcoides isolates in
terms of better or similar growth compared to the literature, I propose to further test D.
mccartyi strains in defined cultures with other microbes. These microbes should be
chosen based on the knowledge gained on the microbial composition of the four
enrichment cultures, DehaloR^2 (Ziv-El et al. 2011), ZARA-10, LINA-09, and ISLA-08
(Chapter 3). Both common genera enriched in each culture, as well as unique genera
should be tested. Potential candidates for these experiments would be strains of
Acetobacterium and Clostridium (fermeters and acetogens), Methanobacterium
(hydrogenotrophic methanogen), Geobacter and Desulfitobacterium (TCE to DCE
respirers). These experiments could potentially elucidate whether an ideal community
can be constructed and/or whether fast rates of dechlorination and enhanced growth of

123
Dehalococcoides is linked to a specific microbe (certain genera) or a specific microbial
function (i.e. fermenter, corrinoid-producing methanogen).
“Natural’ electron acceptors in the metabolism of Dehalococcoides
The role and lifestyle of Dehalococcoides in natural environments remains, to this
day, an enigma. In the laboratory, these bacteria have been grown exclusively on
anthropogenic halogenated substances and the majority of Dehalococcoides studies have
been in conjunction with contaminated sites. But beyond contaminated sites,
Dehalococcoides have also been detected in an array of pristine environments, including
freshwater river sediments (He et al. 2005), freshwater lake sediments (Krzmarzick et al.
2013), forest and state park soils (Krzmarzick et al. 2012), estuarine sediments
(Kittelmann and Friedrich 2008b), and marine subsurface sediments (Futagami et al.
2009). Yet, our understanding of Dehalococcoides in these environments is limited.
This lack of knowledge is partially due to the unknown identity of the compounds serving
as electron acceptors in these natural habitats (Krzmarzick et al. 2012), and the inherent
challenges associated with studying microbial functions in complex systems such as soils
or sediments (Zhou et al. 2002).
A first elegant effort in exploring the lifestyle of Dehalococcoides-like
Chloroflexi in natural habitats was recently published by Krzmarzick et al. (2012). In
that study, the authors established growth of Dehalococcoides in soil slurries and showed
dechlorination of enzymatically chlorinated organic matter (Krzmarzick et al. 2012).
Thus, Krzmarzick et al. (2012) hypothesized that Dehalococcoides may play a role in the
cycling of halogens in nature (chlorine and bromine), which may explain their ubiquity in

124
natural habitats. In Chapter 3, I employed two samples containing Dehalococcoides
(garden soil from Romania and mangrove sediment from Puerto Rico) originating from
environments with no history of contamination. Thus, Chapter 3 expands the limited
number of Dehalococcoides studies from uncontaminated sites. Moreover, Chapter 3,
together with the other works on Dehalococcoides in natural environments, concurs with
their yet unexplored natural metabolic capabilities and ecological interactions. Therefore,
I recommend a study to search for “natural” electron acceptors for Dehalococcoides.
For this search, I propose to do a thorough chemical characterization on pristine
soil and sediment employed in Chapter 3. In nature, thousands of halogenated
compounds are produced from volcanic activity, forest fires, geothermal processes and
from micro- and macroorganisms (Griebler et al. 2004; Haggblom and Bossert 2003).
Therefore, the chemical characterization of the soil and sediment should comprise of at
least the composition of ions, including F−, Br
−, Cl
−, and I
−, total organic carbon, and
humic acids. Next, I will generate hypotheses on the nature of the compound/s
potentially utilized by Dehalococcoides. These hypotheses will be generated taking into
account i) the chemical characterization of the soil and sediment, ii) the type of biota
(microorganisms, macroorganisms, and plats) found in these environments, iii) reported
halogenated compounds produced in environments similar to those where the soil and
sediment were collected, and iv) compounds that can be halogenated by microorganisms.
In support of this recommended work is preliminary evidence from experiments
performed by Kylie Kegerreis advised by Dr. Rosa Krajmalnik-Brown that
debromination of 2,6-dibromophenol, produced in nature by marine hemichordates

125
(Steward et al. 1995), is debrominated to phenol by DehaloR^2 and ZARA-10
enrichment cultures.
Once a library of electron acceptor candidates is identified, I propose to first
detect them in the soil and sediment using mass spectroscopy. Then, I will test these
compounds in microcosms containing the soil and sediment from the uncontaminated
sites and in the enrichment cultures generated in Chapter 3. If the compounds are
respired, the respiration should be coupled to the growth of Dehalococcoides. Therefore,
I will monitor the biotrasformation of the compounds tested and the growth of
Dehalococcoides and Eubacteria using quantitative PCR. The discovery of a ‘natural”
electron acceptor utilized by Dehalococcoides will not only help us understand their role
in nature, but will also help us improve their growth in the laboratory. The “natural”
electron acceptors could be used to grow Dehalococcoides for bioaugmentation
application. Additionally, these acceptors could potentially be supplemented at sites
undergoing bioremediation where the contaminants (e.g. PCE or TCE) are present in very
low concentrations, and therefore do not support significant growth.
Modeling reductive dechlorination and growth of Dehalococcoides in a CSTR
In Chapter 6, I operated a CSTR at a 3-d HRT for the cultivation of
Dehalococcoides-containing cultures. I now propose to model and bring further
optimizations to the CSTR concept with the main goal to increase the production rate of
high-cell density Dehalococcoides bioaugmentation cultures. I propose to develop a
mathematical model using MATLAB software. The model will be an expansion of the
CSTR equations for bioreactors presented in biotechnology textbooks, particularly in

126
Rittmann and McCarty (2001) (Rittmann and McCarty 2001). The following equations
exemplify the substrate, S and the mass of a microorganism, Xa in a typical steady-state
CSTR:
(Equation 7.1)
(Equation 7.2)
where S = effluent substrate concentration (mmol L−1
), K = concentration giving one-half
the maximum rate (mmol L−1
), b = endogenous decay coefficient (d−1
), and θ = HRT (d),
Y = yield for cell synthesis (mmol L−1
cell−1
), qmax = maximum specific rate of substrate
utilization (mmol L−1
d−1
), Xa = concentration of active biomass (cells L−1
), and S0 =
influent substrate concentration (mmol L−1
).
The development of the model will occur in two phases. In the first phase of the
model, I will focus on reductive dechlorination and growth of Dehalococcoides,
assuming excess H2, which will be provided from fermentation of lactate and methanol.
In the case of a TCE- or PCE-reducing CSTR, Equation 7.1 and 7.2 do not suffice to
explain reductive dechlorination due to the unique multiple steps: PCETCEcis-
DCEVCethene, and the involvement of different bacteria in each step. Specifically,
reductive dechlorination of PCE and TCE to cis-DCE only can be carried out by non-
Dehalococcoides organohalide respirers (Smidt and de Vos 2004; Tas et al. 2010).
Moreover, PCE and TCE strongly inhibit cis-DCE and VC reduction, cis- DCE strongly
inhibits VC reduction, and VC moderately inhibits cis-DCE reduction (Chambon et al.
2012). Hence, the model will be expanded to include multiple electron-acceptor steps
(PCE, TCE, cis-DCE, VC) and multiple dechlorinating genera, competitive inhibition,

127
and toxicity of the chlorinated ethenes. These modifications are crucial to predict the
process of reductive dechlorination.
In order to develop a model that predicts the CSTR performance and limitations,
the following parameters are needed: K, µmax, Y, and b. While some of these parameters
can be obtained from batch studies in the literature, they should also be determined these
parameters experimentally because the proposed work models a CSTR system not
previously described. I will carry out experiments to obtain K for each individual
chlorinated electron acceptor as described previously (Popat and Deshusses 2011) using
effluent culture grown in a CSTR. To determine µmax (maximum specific growth rate
(d−1
)), I will perform growth experiments using a small starting concentration of
Dehalococcoides (107 cell L
−1), TCE, and H2 as electron donor. Growth rates will be
obtained from time-course TCE dechlorination data coupled to increases in cells of
Dehalococcoides and other organohalide respirers over time. To calculate b, I propose to
use a methodology not previously employed for consortia containing Dehalococcoides:
viable PCR. This method uses nucleic acid intercalating dyes (e.g. ethidium monoazide)
to discriminate between viable and non-viable cells (Chen and Chang 2010; Shi et al.
2011). Y can be calculated by dividing the concentrations of Dehalococcoides cells
produced in the CSTR by the concentration of TCE consumed. For all experiments
stated here, dechlorination will be measured using gas chromatography and microbial cell
densities will be obtained from qPCR assays. The model will be able to predict the
optimum S0
and HRT in order to maximize Xa and the highest rate of Dehalococcoides
production in TCE bioaugmentation cultures. I will test the model by running CSTR
128
experiments under the optimum conditions dictated by the model with different consortia
to ensure reproducibility across cultures with diverse microbial compositions.
Expanding the CSTR model to include competing biological processes and simulating
groundwater conditions
For on-site applications of bioaugmentation, a cost-effective approach would be
to grow these bioaugmentation cultures at the contaminated site using the contaminated
groundwater as medium (augmented with electron donors and nutrients). Commonly
employed electron donors for bioaugmentation include lactate, methanol, emulsified
vegetable oil, and hydrogen-releasing compounds (HRC®). For this reason, I will expand
the CSTR model to include a multispecies microbial system that includes the process of
fermentation of substrates, homoacetogenesis, and methanogenesis, along with the
process of reductive dechlorination. Depending on the site chemistry, other microbial
process could be included, such as iron, sulfate or nitrate reduction. The parameters
required for each of these non-dechlorinating microbial processes are well-known and
reported in literature (Loffler et al. 1999; Parameswaran et al. 2011; Rittmann and
McCarty 2001; Rittmann and Herwig 2012; Ziv-El et al. 2012b; Ziv-El et al. 2012c). By
including the complex microbial community, the model can estimate the production and
consumption of H2, and the possible limitations encountered by Dehalococcoides under
site-specific conditions. Along with the model development, I will run CSTR
experiments with real groundwater and augmented with TCE (to simulate contamination)
and with various fermentable substrates utilized for mass-production of bioaugmentation
cultures.
129
Growth of organohalide respiring communities at large-scale and in other bioreactors
Depending on the site to be remediated, bioaugmentation can require hundreds to
thousands liters of bioaugmenting culture (Aziz et al. 2012). Batch fermentor production
of cultures containing 1012
Dehalococcoides cells per liter requires 35 days (Vainberg et
al. 2009) or longer. The CSTR growth method presented in Chapter 6 requires only three
days to produce 1012
Dehalococcoides cells L−1
, thus improving the rate of culture
production at least ten times. The work in Chapter 6 provides the first scientific
platform for a potential future implementation of such system at larger scale.
Towards this goal, I recommend increasing the size of the reactors to 5-10 L and
running CSTR experiments under the optimal conditions previously identified. For
application purposes, I also suggest expanding the range of electron donors, electron
acceptors, and buffers for the growth of dechlorinating cultures in CSTRs. All
enrichment cultures described in this dissertation were grown using lactate and methanol,
however other less expensive substrates, such as ethanol, glycerol, emulsified vegetable
oil or molasses and buffers, such as phosphate, should be tested. As discussed in Chapter
5, PCE and TCE often occur with other chlorinated solvents at contaminated sites.
Therefore, I suggest initially growing the enrichment cultures with PCE and TCE and low
levels of other electron acceptors (e.g. trichloroethane, carbon tetrachloride,
dichloroethane, trifluoroethane) to precondition the cultures to these alternate electron
acceptors. If the cultures are unable to degrade these compounds, I suggest enriching for
the appropriate microbes in microcosms and then culturing the enrichment in CSTRs.
The results presented in this dissertation provide compelling evidence that D.
mccartyi is a fast-growing anaerobic microorganism. The development of a continuous

130
TCE-dechlorinating bioreactor, along with a successful operation of the membrane
biofilm reactor (MBfR) for ex situ TCE remediation in our Center (Ziv-El et al. 2012b),
proves that dechlorinating consortia can be grown at rates similar to those for fermenting
microorganisms. Therefore, I propose expanding the studies of bioreactors in which
dechlorinating consortia are grown, including commonly used designs, such as a packed-
bed reactor and an upflow anaerobic sludge blanket (UASB).

131
REFERENCES
Abdelouas A, Lu YM, Lutze W, Nuttall HE. 1998. Reduction of U(VI) to U(IV) by
indigenous bacteria in contaminated ground water. Journal of Contaminant
Hydrology 35(1-3):217-233.
Adrian L, Dudkova V, Demnerova K, Bedard DL. 2009. "Dehalococcoides" sp strain
CBDB1 extensively dechlorinates the commercial polychlorinated biphenyl
mixture Aroclor 1260. Applied and Environmental Microbiology 75(13):4516-
4524.
Adrian L, Hansen SK, Fung JM, Gorisch H, Zinder SH. 2007. Growth of
Dehalococcoides strains with chlorophenols as electron acceptors. Environmental
Science & Technology 41(7):2318-2323.
Adrian L, Szewzyk U, Wecke J, Gorisch H. 2000. Bacterial dehalorespiration with
chlorinated benzenes. Nature 408(6812):580-583.
Amos BK, Ritalahti KM, Cruz-Garcia C, Padilla-Crespo E, Loffler FE. 2008. Oxygen
effect on Dehalococcoides viability and biomarker quantification. Environmental
Science & Technology 42(15):5718-5726.
Arciero D, Vannelli T, Logan M, Hooper AB. 1989. Degradation of trichloroethylene by
the ammonia-oxidizing bacterium Nitrosomonas europaea. Biochemical and
Biophysical Research Communications 159(2):640-643.
Arigala SG, Tsotsis TT, Webster IA, Yortsos YC, Kattapuram JJ. 1995. Gas generation,
trasport, and extraction in landfills. Journal of Environmental Engineering-Asce
121(1):33-44.
ATSDR. 2011. Agency for Toxic Substances and Disease Registry.
http://www.atsdr.cdc.gov.ezproxy1.lib.asu.edu/cercla/.
Aulenta F, Gossett JM, Papini MP, Rossetti S, Majone M. 2005. Comparative study of
methanol, butyrate, and hydrogen as electron donors for long-term dechlorination
of tetrachloroethene in mixed anerobic cultures. Biotechnology and
Bioengineering 91(6):743-753.
Aziz CE, Wymore RA, Steffan RJ. 2012. Bioaugmentation considerations. In: Stroo HF,
Leeson A, Ward HC, editors. Bioaugmentation for Groundwater Remediation.
New York: Springer. p 141-169.
Ballapragada BS, Stensel HD, Puhakka JA, Ferguson JF. 1997. Effect of hydrogen on
reductive dechlorination of chlorinated ethenes. Environmental Science &
Technology 31(6):1728-1734.

132
Berggren DRV, Marshall IPG, Azizian MF, Spormann AM, Semprini L. 2013. Effects of
sulfate reduction on the bacterial community and kinetic parameters of a
dechlorinating culture under chemostat growth conditions Environmental Science
& Technology DOI 10.1021/es304244z.
Bohlke JK, Smith RL, Miller DN. 2006. Ammonium transport and reaction in
contaminated groundwater: Application of isotope tracers and isotope
fractionation studies. Water Resources Research 42(5).
Bouwer EJ, McCarty PL. 1983. Transformation of halogenated organic compounds under
denitrification conditions. Applied and Environmental Microbiology 45(4):1295-
1299.
Bradley PM. 2003. History and ecology of chloroethene biodegradation: A review.
Bioremediation Journal 7(2):81-109.
Braun R, Huber P, Meyrath J. 1981. Ammonia toxicity in liquid piggery manure
digestion. Biotechnology Letters 3(4):159-164.
Bunge M, Adrian L, Kraus A, Opel M, Lorenz WG, Andreesen JR, Gorisch H, Lechner
U. 2003. Reductive dehalogenation of chlorinated dioxins by an anaerobic
bacterium. Nature 421(6921):357-360.
Carr CS, Garg S, Hughes JB. 2000. Effect of dechlorinating bacteria on the longevity and
composition of PCE-containing nonaqueous phase liquids under equilibrium
dissolution conditions. Environmental Science & Technology 34(6):1088-1094.
Carr CS, Hughes JB. 1998. Enrichment of high rate PCE dechlorination and comparative
study of lactate, methanol, and hydrogen as electron dopers to sustain activity.
Environmental Science & Technology 32(12):1817-1824.
Chambon JC, Bjerg PL, Scheutz C, Bælum J, Jakobsen R, Binning PJ. 2012b. Review of
reactive kinetic models describing reductive dechlorination of chlorinated ethenes
in soil and groundwater Biotechnology and Bioengineering DOI
10.1002/bit.24714.
Chang YC, Jung K, Yoo YS. 2003. Anaerobic degradation of cis-1,2-dichloroethylene by
cultures enriched from a landfill leachate sediment. Journal of Microbiology and
Biotechnology 13(3):366-372.
Chen NT, Chang CW. 2010. Rapid quantification of viable legionellae in water and
biofilm using ethidium monoazide coupled with real-time quantitative PCR.
Journal of Applied Microbiology 109(2).

133
Cheng D, He JZ. 2009. Isolation and characterization of "Dehalococcoides" sp strain
MB, which dechlorinates tetrachloroethene to trans-1,2-dichloroethene. Applied
and Environmental Microbiology 75(18):5910-5918.
Christensen TH, Kjeldsen P, Bjerg PL, Jensen DL, Christensen JB, Baun A, Albrechtsen
HJ, Heron C. 2001. Biogeochemistry of landfill leachate plumes. Applied
Geochemistry 16(7-8):659-718.
Clapp LW, Semmens MJ, Novak PJ, Hozalski RM. 2004. Model for in situ
perchloroethene dechlorination via membrane-delivered hydrogen. Journal of
Environmental Engineering-Asce 130(11):1367-1381.
Cole JR, Wang Q, Cardenas E, Fish J, Chai B, Farris RJ, Kulam-Syed-Mohideen AS,
McGarrell DM, Marsh T, Garrity GM and others. 2009. The Ribosomal Database
Project: improved alignments and new tools for rRNA analysis. Nucleic Acids
Research 37:D141-D145.
Cordruwisch R, Seitz HJ, Conrad R. 1988. The capacity of hydrogenotrophic anaerobic
bacteria to compete for traces of hydrogen depends on the redox potential of the
terminal electron acceptor. Archives of Microbiology 149(4):350-357.
Cupples AM, Spormann AM, McCarty PL. 2003. Growth of a Dehalococcoides-like
microorganism on vinyl chloride and cis-dichloroethene as electron acceptors as
determined by competitive PCR. Applied and Environmental Microbiology
69(2):953-959.
Cupples AM, Spormann AM, McCarty PL. 2004. Vinyl chloride and cis-dichloroethene
dechlorination kinetics and microorganism growth under substrate limiting
conditions. Environmental Science & Technology 38(4):1102-1107.
Delgado AG, Parameswaran P, Fajardo-Williams D, Halden RU, Krajmalnik-Brown R.
2012. Role of bicarbonate as a pH buffer and electron sink in microbial
dechlorination of chloroethenes. Microbial Cell Factories 11(128).
Distefano TD, Gossett JM, Zinder SH. 1991. Reductive dechlorination of high-
concentrations of tetrachloroethene to ethene by an anaerobic enrichment culture
in the absence of methanogenesis. Applied and Environmental Microbiology
57(8):2287-2292.
Drake HL. 1994. Acetogenesis. Reddy CA, Chakrabarty AM, Demain AL, Tiedje JM,
editors. New York, NY: Chapman & Hall.

134
Drzyzga O, Gerritse J, Dijk JA, Elissen H, Gottschal JC. 2001. Coexistence of a sulphate-
reducing Desulfovibrio species and the dehalorespiring Desulfitobacterium
frappieri TCE1 in defined chemostat cultures grown with various combinations of
sulphate and tetrachloroethene. Environmental Microbiology 3(2):92-99.
Duhamel M, Edwards EA. 2006. Microbial composition of chlorinated ethene-degrading
cultures dominated by Dehalococcoides. Fems Microbiology Ecology 58(3):538-
549.
Duhamel M, Edwards EA. 2007. Growth and yields of dechlorinators, acetogens, and
methanogens during reductive dechlorination of chlorinated ethenes and
dihaloelimination of 1,2-dichloroethane. Environmental Science & Technology
41(7):2303-2310.
Duhamel M, Wehr SD, Yu L, Rizvi H, Seepersad D, Dworatzek S, Cox EE, Edwards EA.
2002. Comparison of anaerobic dechlorinating enrichment cultures maintained on
tetrachloroethene, trichloroethene, cis-dichloroethene and vinyl chloride. Water
Research 36(17):4193-4202.
Edstrom JA, Semmens MJ, Hozalski RM, Clapp LW, Novak PJ. 2005. Stimulation of
dechlorination by membrane-delivered hydrogen: Small field demonstration.
Environmental Engineering Science 22(3):281-293.
Ellis DE, Lutz EJ, Odom JM, Buchanan RJ, Bartlett CL, Lee MD, Harkness MR,
Deweerd KA. 2000. Bioaugmentation for accelerated in situ anaerobic
bioremediation. Environmental Science & Technology 34(11):2254-2260.
Ely RL, Williamson KJ, Hyman MR, Arp DJ. 1997. Cometabolism of chlorinated
solvents by nitrifying bacteria: Kinetics, substrate interactions, toxicity effects,
and bacterial response. Biotechnology and Bioengineering 54(6):520-534.
Fennell DE, Gossett JM. 1998. Modeling the production of and competition for hydrogen
in a dechlorinating culture. Environmental Science & Technology 32(16):2450-
2460.
Fennell DE, Gossett JM, Zinder SH. 1997. Comparison of butyric kid, ethanol, lactic
acid, and propionic acid as hydrogen donors for the reductive dechlorination of
tetrachloroethene. Environmental Science & Technology 31(3):918-926.
Fennell DE, Nijenhuis I, Wilson SF, Zinder SH, Haggblom MM. 2004. Dehalococcoides
ethenogenes strain 195 reductively dechlorinates diverse chlorinated aromatic
pollutants. Environmental Science & Technology 38(7):2075-2081.

135
Fey A, Conrad R. 2000. Effect of temperature on carbon and electron flow and on the
archaeal community in methanogenic rice field soil. Applied and Environmental
Microbiology 66(11):4790-4797.
Florencio L, Field JA, Lettinga G. 1995. Substrate competition between methanogens and
acetogens during the degradation of methanol in UASB reactors. Water Research
29(3):915-922.
Freedman DL, Gossett JM. 1989. Biological reductive dechlorination of
tetrachloroethylene and trichloroethylene to etheylene under methanogenic
conditions. Applied and Environmental Microbiology 55(9):2144-2151.
Friis AK, Heimann AC, Jakobsen R, Albrechtsen HJ, Cox E, Bjerg PL. 2007.
Temperature dependence of anaerobic TCE-dechlorination in a highly enriched
Dehalococcoides-containing culture. Water Research 41(2):355-364.
Fung JM, Morris RM, Adrian L, Zinder SH. 2007. Expression of reductive dehalogenase
genes in Dehalococcoides ethenogenes strain 195 growing on tetrachloroethene,
trichloroethene, or 2,3-dichlorophenol. Applied and Environmental Microbiology
73(14):4439-4445.
Futagami T, Morono Y, Terada T, Kaksonen AH, Inagaki F. 2009. Dehalogenation
activities and distribution of reductive dehalogenase homologous genes in marine
subsurface sediments. Applied and Environmental Microbiology 75(21):6905-
6909.
Gerritse J, Renard V, Gomes TMP, Lawson PA, Collins MD, Gottschal JC. 1996.
Desulfitobacterium sp strain PCE1, an anaerobic bacterium that can grow by
reductive dechlorination of tetrachloroethene or ortho-chlorinated phenols.
Archives of Microbiology 165(2):132-140.
Griebler C, Safinowski M, Vieth A, Richnow HH, Meckenstock RU. 2004. Combined
application of stable carbon isotope analysis and specific metabolites
determination for assessing in situ degradation of aromatic hydrocarbons in a tar
oil-contaminated aquifer. Environmental Science & Technology 38(2):617-631.
Haggblom MM, Bossert ID. 2003. Dehalogenation: Microbial Processes and
Environmental Applications. Boston, MA: Kluwer Academic Publishers.
Hajarnis SR, Ranade DR. 1994. Revival of Methanobacterium formicicum after its
inhibition by high-concentrations of ammonia. Letters in Applied Microbiology
18(5):254-256.

136
Hansel CM, Fendorf S, Jardine PM, Francis CA. 2008. Changes in bacterial and archaeal
community structure and functional diversity along a geochemically variable soil
profile. Applied and Environmental Microbiology 74(5):1620-1633.
Hansen KH, Angelidaki I, Ahring BK. 1998. Anaerobic digestion of swine manure:
Inhibition by ammonia. Water Research 32(1):5-12.
Harkness MR, Bracco AA, Brennan MJ, Deweerd KA, Spivack JL. 1999. Use of
bioaugmentation to stimulate complete reductive dechlorination of trichloroethene
in dover soil columns. Environmental Science & Technology 33(7):1100-1109.
He J, Sung Y, Krajmalnik-Brown R, Ritalahti KM, Loffler FE. 2005. Isolation and
characterization of Dehalococcoides sp strain FL2, a trichloroethene (TCE)- and
1,2-dichloroethene-respiring anaerobe. Environmental Microbiology 7(9):1442-
1450.
He JZ, Holmes VF, Lee PKH, Alvarez-Cohen L. 2007. Influence of vitamin B12 and
cocultures on the growth of Dehalococcoides isolates in defined medium. Applied
and Environmental Microbiology 73(9):2847-2853.
He JZ, Ritalahti KM, Aiello MR, Loffler FE. 2003a. Complete detoxification of vinyl
chloride by an anaerobic enrichment culture and identification of the reductively
dechlorinating population as a Dehalococcoides species. Applied and
Environmental Microbiology 69(2):996-1003.
He JZ, Ritalahti KM, Yang KL, Koenigsberg SS, Loffler FE. 2003b. Detoxification of
vinyl chloride to ethene coupled to growth of an anaerobic bacterium. Nature
424(6944):62-65.
Hendrickson ER, Payne JA, Young RM, Starr MG, Perry MP, Fahnestock S, Ellis DE,
Ebersole RC. 2002. Molecular analysis of Dehalococcoides 16S ribosomal DNA
from chloroethene-contaminated sites throughout North America and Europe.
Applied and Environmental Microbiology 68(2):485-495.
Holliger C, Hahn D, Harmsen H, Ludwig W, Schumacher W, Tindall B, Vazquez F,
Weiss N, Zehnder AJB. 1998. Dehalobacter restrictus gen. nov. and sp. nov., a
strictly anaerobic bacterium that reductively dechlorinates tetra- and
trichloroethene in an anaerobic respiration. Archives of Microbiology 169(4):313-
321.
Holmes VF, He JZ, Lee PKH, Alvarez-Cohen L. 2006. Discrimination of multiple
Dehalococcoides strains in a trichloroethene enrichment by quantification of their
reductive dehalogenase genes. Applied and Environmental Microbiology
72(9):5877-5883.

137
Hoskisson PA, Hobbs G. 2005. Continuous culture - making a comeback? Microbiology-
Sgm 151:3153-3159.
Hug LA, Maphosa F, Leys D, Loffler FE, Smidt H, Edwards EA, Adrian L. 2013.
Overview of organohalide-respiring bacteria and a proposal for a classification
system for reductive dehalogenases. Philosophical Transactions of the Royal
Society B-Biological Sciences 368(1616).
Islam MA, Edwards EA, Mahadevan R. 2010. Characterizing the metabolism of
Dehalococcoides with a constraint-based model. Plos Computational Biology
6(8).
Kadam PC, Boone DR. 1996. Influence of pH ammonia accumulation and toxicity in
halophilic, methylotrophic methanogens. Applied and Environmental
Microbiology 62(12):4486-4492.
Kang D-W, Park J, Ilhan Z, Wallstrom G, LaBaer J, Adams J, Krajmalnik-Brown R.
2013. Reduced incidence of Prevotella and other fermenters in intestinal
microflora of autistic children. PLoS ONE 8(7):e68322.
doi:10.1371/journal.pone.0068322.
Kittelmann S, Friedrich MW. 2008a. Identification of novel perchloroethene-respiring
microorganisms in anoxic river sediment by RNA-based stable isotope probing.
Environmental Microbiology 10(1):31-46.
Kittelmann S, Friedrich MW. 2008b. Novel uncultured Chloroflexi dechlorinate
perchloroethene to trans-dichloroethene in tidal flat sediments. Environmental
Microbiology 10(6):1557-1570.
Kjeldsen P, Barlaz MA, Rooker AP, Baun A, Ledin A, Christensen TH. 2002. Present
and long-term composition of MSW landfill leachate: A review. Critical Reviews
in Environmental Science and Technology 32(4):297-336.
Kotsyurbenko OR, Glagolev MV, Nozhevnikova AN, Conrad R. 2001. Competition
between homoacetogenic bacteria and methanogenic archaea for hydrogen at low
temperature. Fems Microbiology Ecology 38(2-3):153-159.
Krajmalnik-Brown R, Holscher T, Thomson IN, Saunders FM, Ritalahti KM, Loffler FE.
2004. Genetic identification of a putative vinyl chloride reductase in
Dehalococcoides sp strain BAV1. Applied and Environmental Microbiology
70(10):6347-6351.
Krug T, O’Hara S, Watling M, Quinn J. 2010. Final Report, ESTCP Project ER-0431,
Emulsified zero-valent nano-scale iron treatment of chlorinated solvent DNAPL
source areas.

138
Krzmarzick MJ, Crary BB, Harding JJ, Oyerinde OO, Leri AC, Myneni SCB, Novak PJ.
2012. Natural niche for organohalide-respiring Chloroflexi. Applied and
Environmental Microbiology 78(2):393-401.
Krzmarzick MJ, McNamara PJ, Crary BB, Novak PJ. 2013. Abundance and diversity of
organohalide-respiring bacteria in lake sediments across a geographical sulfur
gradient. Fems Microbiology Ecology 84(2):248-258.
Kube M, Beck A, Zinder SH, Kuhl H, Reinhardt R, Adrian L. 2005. Genome sequence of
the chlorinated compound respiring bacterium Dehalococcoides species strain
CBDB1. Nature Biotechnology 23(10):1269-1273.
Lay JJ, Li YY, Noike T. 1998. The influence of pH and ammonia concentration on the
methane production in high-solids digestion processes. Water Environment
Research 70(5):1075-1082.
Lee PKH, Cheng D, Hu P, West KA, Dick GJ, Brodie EL, Andersen GL, Zinder SH, He
JZ, Alvarez-Cohen L. 2011. Comparative genomics of two newly isolated
Dehalococcoides strains and an enrichment using a genus microarray. Isme
Journal 5(6):1014-1024.
Lee PKH, Dill BD, Louie TS, Shah M, VerBerkmoes NC, Andersen GL, Zinder SH,
Alvarez-Cohen L. 2012. Global transcriptomic and proteomic responses of
Dehalococcoides ethenogenes strain 195 to fixed nitrogen limitation. Applied and
Environmental Microbiology 78(5).
Lee PKH, He JZ, Zinder SH, Alvarez-Cohen L. 2009. Evidence for nitrogen fixation by
"Dehalococcoides ethenogenes" strain 195. Applied and Environmental
Microbiology 75(23):7551-7555.
Lendvay JM, Loffler FE, Dollhopf M, Aiello MR, Daniels G, Fathepure BZ, Gebhard M,
Heine R, Helton R, Shi J and others. 2003. Bioreactive barriers: A comparison of
bioaugmentation and biostimulation for chlorinated solvent remediation.
Environmental Science & Technology 37(7):1422-1431.
Loffler FE, Edwards EA. 2006. Harnessing microbial activities for environmental
cleanup. Current Opinion in Biotechnology 17(3):274-284.
Loffler FE, Ritalahti KM, H ZS. 2012. Dehalococcoides and reductive dechlorination of
chlorinated solvents. Stroo HF, Leeson A, Ward CH, editors. New York:
Springer.
Loffler FE, Sanford RA, Ritalahti KM. 2005. Enrichment, cultivation, and detection of
reductively dechlorinating bacteria. Environmental Microbiology 397:77-111.
139
Loffler FE, Sun Q, Li JR, Tiedje JM. 2000. 16S rRNA gene-based detection of
tetrachloroethene-dechlorinating Desulfuromonas and Dehalococcoides species.
Applied and Environmental Microbiology 66(4):1369-1374.
Loffler FE, Tiedje JM, Sanford RA. 1999. Fraction of electrons consumed in electron
acceptor reduction and hydrogen thresholds as indicators of halorespiratory
physiology. Applied and Environmental Microbiology 65(9):4049-4056.
Loffler FE, Yan J, Ritalahti KM, Adrian L, Edwards EA, Konstantinidis KT, Müller JA,
Fullerton H, Zinder SH, Spormann AM. 2013. Dehalococcoides mccartyi gen.
nov., sp. nov., obligate organohalide-respiring anaerobic bacteria, relevant to
halogen cycling and bioremediation, belong to a novel bacterial class,
Dehalococcoidetes classis nov., within the phylum Chloroflexi. International
Journal of Systematic and Evolutionary Microbiology 63:625-635.
Luijten M, de Weert J, Smidt H, Boschker HTS, de Vos WM, Schraa G, Stams AJM.
2003. Description of Sulfurospirillum halorespirans sp nov., an anaerobic,
tetrachloroethene-respiring bacterium, and transfer of Dehalospirillum
multivorans to the genus Sulfurospirillum as Sulfurospirillum multivorans comb.
nov. International Journal of Systematic and Evolutionary Microbiology 53:787-
793.
Lyon DY, Vogel TM. 2012. Bioaugmentation for groundwater remediation: an overview.
Stroo HF, Leeson A, Ward CH, editors. New York: Springer.
Ma X, Novak PJ, Clapp LW, Semmens MJ, Hozalski RM. 2003. Evaluation of
polyethylene hollow-fiber membranes for hydrogen delivery to support reductive
dechlorination in a soil column. Water Research 37(12):2905-2918.
Macbeth TW, Cummings DE, Spring S, Petzke LM, Sorenson KS. 2004. Molecular
characterization of a dechlorinating community resulting from in situ
biostimulation in a trichloroethene-contaminated deep, fractured basalt aquifer
and comparison to a derivative laboratory culture. Applied and Environmental
Microbiology 70(12):7329-7341.
Magnuson JK, Romine MF, Burris DR, Kingsley MT. 2000. Trichloroethene reductive
dehalogenase from Dehalococcoides ethenogenes: Sequence of tceA and substrate
range characterization. Applied and Environmental Microbiology 66(12):5141-
5147.
Magnuson JK, Stern RV, Gossett JM, Zinder SH, Burris DR. 1998. Reductive
dechlorination of tetrachloroethene to ethene by two-component enzyme pathway.
Applied and Environmental Microbiology 64(4):1270-1275.

140
Major DW, McMaster ML, Cox EE, Edwards EA, Dworatzek SM, Hendrickson ER,
Starr MG, Payne JA, Buonamici LW. 2002. Field demonstration of successful
bioaugmentation to achieve dechlorination of tetrachloroethene to ethene.
Environmental Science & Technology 36(23):5106-5116.
Majumder PS, Gupta SK. 2009. Effect of influent pH and alkalinity on the removal of
chlorophenols in sequential anaerobic-aerobic reactors. Bioresource Technology
100(5):1881-1883.
Manchester MJ, Hug LA, Zarek M, Zila A, Edwards EA. 2012. Discovery of a trans-
dichloroethene-respiring dehalogenimonas species in the 1,1,2,2-
tetrachloroethane-dechlorinating WBC-2 consortium. Applied and Environmental
Microbiology 78(15):5280-5287.
Marzorati M, Balloi A, de Ferra F, Corallo L, Carpani G, Wittebolle L, Verstraete W,
Daffonchio D. 2010. Bacterial diversity and reductive dehalogenase redundancy
in a 1,2-dichloroethane-degrading bacterial consortium enriched from a
contaminated aquifer. Microbial Cell Factories 9:12.
May HD, Miller GS, Kjellerup BV, Sowers KR. 2008. Dehalorespiration with
polychlorinated biphenyls by an anaerobic ultramicrobacterium. Applied and
Environmental Microbiology 74(7):2089-2094.
Maymo-Gatell X, Anguish T, Zinder SH. 1999. Reductive dechlorination of chlorinated
ethenes and 1,2-dichloroethane by "Dehalococcoides ethenogenes" 195. Applied
and Environmental Microbiology 65(7):3108-3113.
Maymo-Gatell X, Chien YT, Gossett JM, Zinder SH. 1997. Isolation of a bacterium that
reductively dechlorinates tetrachloroethene to ethene. Science 276(5318):1568-
1571.
Mazumder TK, Nishio N, Fukuzaki S, Nagai S. 1987. Production of extracellular vitamin
B12 compounds from methanol by Methanosarcina barkeri. Applied
Microbiology and Biotechnology 26(6):511-516.
McCarty PL. 1997. Microbiology - Breathing with chlorinated solvents. Science
276(5318):1521-1522.
McMurdie PJ, Behrens SF, Muller JA, Goke J, Ritalahti KM, Wagner R, Goltsman E,
Lapidus A, Holmes S, Loffler FE and others. 2009. Localized plasticity in the
streamlined genomes of vinyl chloride respiring Dehalococcoides. Plos Genetics
5(11).

141
Men YJ, Feil H, VerBerkmoes NC, Shah MB, Johnson DR, Lee PKH, West KA, Zinder
SH, Andersen GL, Alvarez-Cohen L. 2012. Sustainable syntrophic growth of
Dehalococcoides ethenogenes strain 195 with Desulfovibrio vulgaris
Hildenborough and Methanobacterium congolense: global transcriptomic and
proteomic analyses. Isme Journal 6(2):410-421.
Metcalf & Eddy Inc., Tchobanaglous G, Burton FL, Stensel HD. 2003. Wasterwater
Engineering: Treatment and Reuse. New York: The McGraw-Hill Companies,
Inc.
Miceli JF, Parameswaran P, Kang DW, Krajmalnik-Brown R, Torres CI. 2012.
Enrichment and analysis of anode-respiring bacteria from diverse anaerobic
inocula. Environmental Science & Technology 46(18):10349-10355.
Miller TR, Heidler J, Chillrud SN, Delaquil A, Ritchie JC, Mihalic JN, Bopp R, Halden
RU. 2008. Fate of triclosan and evidence for reductive dechlorination of
triclocarban in estuarine sediments. Environmental Science & Technology
42(12):4570-4576.
Moe WM, Yan J, Nobre MF, da Costa MS, Rainey FA. 2009. Dehalogenimonas
lykanthroporepellens gen. nov., sp nov., a reductively dehalogenating bacterium
isolated from chlorinated solvent-contaminated groundwater. International
Journal of Systematic and Evolutionary Microbiology 59:2692-2697.
Moran MJ, Zogorski JS, Squillace PJ. 2007. Chlorinated solvents in groundwater of the
United States. Environmental Science & Technology 41(1):74-81.
Morris RM, Sowell S, Barofsky D, Zinder S, Richardson, R. 2006. Transcription and
mass-spectroscopic proteomic studies of electron transport oxidoreductases in
Dehalococcoides ethenogenes. Environmental Microbiology 8(9):1499-1509.
Muller JA, Rosner BM, von Abendroth G, Meshulam-Simon G, McCarty PL, Spormann
AM. 2004. Molecular identification of the catabolic vinyl chloride reductase from
Dehalococcoides sp strain VS and its environmental distribution. Applied and
Environmental Microbiology 70(8):4880-4888.
Muller T, Walter B, Wirtz A, Burkovski A. 2006. Ammonium toxicity in bacteria.
Current Microbiology 52(5):400-406.
National Research Council. 2006. Human Health Risks of Trichloroethylene: Key
Scientific Issues. Washington, D.C.: Committee on human health risks of
trichloroethylene. Board on environmental studies and toxicology. Division on
Earth and life sciences. The National Academies Press.

142
Office of Response and Restoration. 2012. A Train Derails in Paulsboro, N.J., Releasing
23,000 Gallons of Toxic Vinyl Chloride Gas.
http://response.restoration.noaa.gov/about/media/train-derails-paulsboro-nj-
releasing-23000-gallons-toxic-vinyl-chloride-gas.html.
Pant P, Pant S. 2010. A review: Advances in microbial remediation of trichloroethylene
(TCE). Journal of Environmental Sciences-China 22(1):116-126.
Parameswaran P, Torres CI, Lee HS, Rittmann BE, Krajmalnik-Brown R. 2011.
Hydrogen consumption in microbial electrochemical systems (MXCs): The role
of homo-acetogenic bacteria. Bioresource Technology 102(1):263-271.
Parameswaran P, Zhang HS, Torres CI, Rittmann BE, Krajmalnik-Brown R. 2010.
Microbial community structure in a biofilm anode fed with a fermentable
substrate: The significance of hydrogen scavengers. Biotechnology and
Bioengineering 105(1):69-78.
Popat SC, Deshusses MA. 2009. Reductive dehalogenation of trichloroethene vapors in
an anaerobic biotrickling filter. Environmental Science & Technology
43(20):7856-7861.
Popat SC, Deshusses MA. 2011. Kinetics and inhibition of reductive dechlorination of
trichloroethene, cis-1,2-dichloroethene and vinyl chloride in a continuously fed
anaerobic biofilm reactor. Environmental Science & Technology 45(4):1569-
1578.
Purdy KJ, Nedwell DB, Embley TM, Takii S. 2001. Use of 16S rRNA-targeted
oligonucleotide probes to investigate the distribution of sulphate-reducing bacteria
in estuarine sediments. Fems Microbiology Ecology 36(2-3):165-168.
Rahm BG, Chauhan S, Holmes VF, Macbeth TW, Sorenson KSJ, Alvarez-Cohen L.
2006. Molecular characterization of microbial populations at two sites with
differing reductive dechlorination abilities. Biodegradation 17(6):523-534.
Rasche ME, Hyman MR, Arp DJ. 1991. Factors limiting aliphatic chlorocarbon
degradation by Nitrosomonas europaea – cometabolic inactivation of ammonia
monooxygenase and substrate specificity. Applied and Environmental
Microbiology 57(10):2986-2994.
Richardson RE, Bhupathiraju VK, Song DL, Goulet TA, Alvarez-Cohen L. 2002.
Phylogenetic characterization of microbial communities that reductively
dechlorinate TCE based upon a combination of molecular techniques.
Environmental Science & Technology 36(12):2652-2662.

143
Ritalahti KM, Amos BK, Sung Y, Wu QZ, Koenigsberg SS, Loffler FE. 2006.
Quantitative PCR targeting 16S rRNA and reductive dehalogenase genes
simultaneously monitors multiple Dehalococcoides strains. Applied and
Environmental Microbiology 72(4):2765-2774.
Rittmann BE, McCarty PL. 2001. Environmental Biotechnology: Principles and
Applications. Boston: McGraw-Hill Book Co.
Rittmann S, Herwig C. 2012. A comprehensive and quantitative review of
dark fermentative biohydrogen production Microbial Cell Factories 11:115.
Robinson C, Barry DA. 2009. Design tool for estimation of buffer requirement for
enhanced reductive dechlorination of chlorinated solvents in groundwater.
Environmental Modelling & Software 24(11):1332-1338.
Robinson C, Barry DA, McCarty PL, Gerhard JI, Kouznetsova I. 2009. pH control for
enhanced reductive bioremediation of chlorinated solvent source zones. Science
of the Total Environment 407(16):4560-4573.
Sabalowsky AR, Semprini L. 2010. Trichloroethene and cis-1,2-dichloroethene
concentration-dependent toxicity model simulates anaerobic dechlorination at
high concentrations. II: Continuous flow and attached growth reactors.
Biotechnology and Bioengineering 107(3):540-549.
Salerno MB, Park W, Zuo Y, Logan BE. 2006. Inhibition of biohydrogen production by
ammonia. Water Research 40(6):1167-1172.
Schaefer CE, Condee CW, Vainberg S, Steffan RJ. 2009. Bioaugmentation for
chlorinated ethenes using Dehalococcoides sp.: Comparison between batch and
column experiments. Chemosphere 75(2):141-148.
Schaefer CE, Lippincott DR, Steffan RJ. 2010. Field-scale evaluation of bioaugmentation
dosage for treating chlorinated ethenes. Ground Water Monitoring and
Remediation 30(3):113-124.
Schipp CJ, Marco-Urrea E, Kublik A, Seifert J, Adrian L. 2013. Organic cofactors in the
metabolism of Dehalococcoides mccartyi strains. Philosophical Transactions of
the Royal Society B-Biological Sciences 368(1616).
Seshadri R, Adrian L, Fouts DE, Eisen JA, Phillippy AM, Methe BA, Ward NL, Nelson
WC, Deboy RT, Khouri HM and others. 2005. Genome sequence of the PCE-
dechlorinating bacterium Dehalococcoides ethenogenes. Science 307(5706):105-
108.

144
Shi H, Xu W, Luo Y, Chen L, Liang Z, Zhou X, Huang K. 2011. The effect of various
environmental factors on the ethidium monazite and quantitative PCR method to
detect viable bacteria. Journal of Applied Microbiology 111(5).
Silveira RG, Nishio N, Nagai S. 1991. Growth characteristics and corrinoid production of
Methanosarcina barkeri on methanol-acetate medium. Journal of Fermentation
and Bioengineering 71(1):28-34.
Sleep BE, Seepersad DJ, Mo K, Heidorn CM, Hrapovic L, Morrill PL, McMaster ML,
Hood ED, LeBron C, Lollar BS and others. 2006. Biological enhancement of
tetrachloroethene dissolution and associated microbial community changes.
Environmental Science & Technology 40(11):3623-3633.
Smatlak CR, Gossett JM, Zinder SH. 1996. Comparative kinetics of hydrogen utilization
for reductive dechlorination of tetrachloroethene and methanogenesis in an
anaerobic enrichment culture. Environmental Science & Technology 30(9):2850-
2858.
Smidt H, de Vos WM. 2004. Anaerobic microbial dehalogenation. Annual Review of
Microbiology 58:43-73.
Sossa K, Alarcon M, Aspe E, Urrutia H. 2004. Effect of ammonia on the methanogenic
activity of methylaminotrophic methane producing Archaea enriched biofilm.
Anaerobe 10(1):13-18.
Sprott GD, Patel GB. 1986. Ammonia toxicity in pure cultures of methaongenic bacteria.
Systematic and Applied Microbiology 7(2-3):358-363.
Steffan RJ, Vainberg S. 2012. Production and handling of Dehalococcoides
bioaugmentation cultures. In: Stroo HF, Leeson A, Ward CH, editors.
Bioaugmentation for Groundwater Remediation. New York: Springer. p 89-115.
Steward CC, Dixon TC, Chen YP, Lovell CR. 1995. Enrichment and isolataion of a
reductively debrominating bacterium from a burrow of a bromometabolite-
producing marine hemichordate. Canadian Journal of Microbiology 41(7):637-
642.
Stroo HF, Major DW, Steffan RJ, Koenisgsberg SS, Ward CH. 2012. Bioaugmentation
with Dehalococcoides: a decision guide. Stroo HF, Leeson A, Ward CH, editors.
New York: Springer.
Stupperich E, Krautler B. 1988. Pseudo vitamin B12 or 5-hydroxybenzimidazolyl
cobamide are the corrinoids found in methanogenic bacteria. Archives of
Microbiology 149(3):268-271.

145
Stupperich E, Steiner I, Eisinger HJ. 1987. Substitution of co-alpha-(5—
hydroxybenzimidazolyl) cobamide (Factor III) by vitamin B12 in
Methanobacterium thermoautotrophicum. Journal of Bacteriology 169(7):3076-
3081.
Sung Y, Fletcher KF, Ritalaliti KM, Apkarian RP, Ramos-Hernandez N, Sanford RA,
Mesbah NM, Loffler FE. 2006a. Geobacter lovleyi sp nov strain SZ, a novel
metal-reducing and tetrachloroethene-dechlorinating bacterium. Applied and
Environmental Microbiology 72(4):2775-2782.
Sung Y, Ritalahti KM, Apkarian RP, Loffler FE. 2006b. Quantitative PCR confirms
purity of strain GT, a novel trichloroethene-to-ethene-respiring Dehalococcoides
isolate. Applied and Environmental Microbiology 72(3):1980-1987.
Tang YJJ, Yi S, Zhuang WQ, Zinder SH, Keasling JD, Alvarez-Cohen L. 2009.
Investigation of carbon metabolism in "Dehalococcoides ethenogenes" strain 195
by use of isotopomer and transcriptomic Analyses. Journal of Bacteriology
191(16):5224-5231.
Tas N, van Eekert MHA, de Vos WM, Smidt H. 2010. The little bacteria that can -
diversity, genomics and ecophysiology of 'Dehalococcoides' spp. in contaminated
environments. Microbial Biotechnology 3(4):389-402.
Tchobanaglous G, Burton FL, Stensel HD, Metcalf & Eddy. 2003. Wasterwater
Engineering: Treatment and Reuse. New York: The McGraw-Hill Companies,
Inc.
United States Government Accountability Office. 2010. EPA’s estimated costs to
remediate existing sites exceed current funding levels, and more sites are expected
to be added to the National Priorities List. http://www.gao.gov/products/GAO-10-
380.
US EPA. 1992. The Guardian: Origins of the EPA: U.S. Environmental Protection
Agency.
US EPA. 2012. Superfund. Superfund sites where you live.
http://www.epa.gov/superfund/sites/.
US EPA. 2013a. Region 4 Superfund, Parris Island Marine Corps Recruit Depot.
http://epa.gov/region4/superfund/sites/fedfacs/parisiudptsc.html#progress.
US EPA. 2013b. Superfund. Cleaning up the Nation's Hazardous Wastes Sites.
http://www.epa.gov/superfund/.

146
US EPA. 2013c. Trichloroethylene (TCE) treatment technologies. http://www.clu-
in.org/contaminantfocus/default.focus/sec/trichloroethylene_(tce)/cat/Treatment_
Technologies/.
Vainberg S, Condee CW, Steffan RJ. 2009. Large-scale production of bacterial consortia
for remediation of chlorinated solvent-contaminated groundwater. Journal of
Industrial Microbiology & Biotechnology 36(9):1189-1197.
van der Zaan B, Hannes F, Hoekstra N, Rijnaarts H, de Vos WM, Smidt H, Gerritse J.
2010. Correlation of Dehalococcoides 16S rRNA and chloroethene-reductive
dehalogenase genes with geochemical conditions in chloroethene-contaminated
groundwater. Applied and Environmental Microbiology 76(3):843-850.
Van Nostrand JD, Wu LY, Wu WM, Huang ZJ, Gentry TJ, Deng Y, Carley J, Carroll S,
He ZL, Gu BH and others. 2011. Dynamics of microbial community composition
and function during in situ bioremediation of a uranium-contaminated aquifer.
Applied and Environmental Microbiology 77(11):3860-3869.
Van Trump JI, Wrighton KC, Thrash JC, Weber KA, Andersen GL, Coates JD. 2011.
Humic acid-oxidizing, nitrate-reducing bacteria in agricultural ssoils. Mbio 2(4).
Villano M, De Bonis L, Rossetti S, Aulenta F, Majone M. 2011. Bioelectrochemical
hydrogen production with hydrogenophilic dechlorinating bacteria as
electrocatalytic agents. Bioresource Technology 102(3):3193-3199.
Villemur R, Lanthier M, Beaudet R, Lepine F. 2006. The Desulfitobacterium genus.
Fems Microbiology Reviews 30(5):706-733.
Wakida FT, Lerner DN. 2005. Non-agricultural sources of groundwater nitrate: a review
and case study. Water Research 39(1):3-16.
Wang SQ, He JZ. 2013. Phylogenetically distinct bacteria involve extensive
dechlorination of Aroclor 1260 in sediment-free cultures. Plos One 8(3).
Wickner W, Schekman R. 2005. Protein translocation across biological
membranes. Science 310(5753): 1452-1456.
Wilkin RT, Digiulio DC. 2010. Geochemical impacts to groundwater from geologic
carbon sequestration: Controls on pH and inorganic carbon concentrations from
reaction path and kinetic modeling. Environmental Science & Technology
44(12):4821-4827.

147
Wolcott RD, Gontcharova V, Sun Y, Dowd SE. 2009. Evaluation of the bacterial
diversity among and within individual venous leg ulcers using bacterial tag-
encoded FLX and Titanium amplicon pyrosequencing and metagenomic
approaches. Bmc Microbiology 9.
Xiu ZM, Jin ZH, Li TL, Mahendra S, Lowry GV, Alvarez PJJ. 2010. Effects of nano-
scale zero-valent iron particles on a mixed culture dechlorinating
trichloroethylene. Bioresource Technology 101(4):1141-1146.
Xu KW, Liu H, Du GC, Chen J. 2009. Real-time PCR assays targeting
formyltetrahydrofolate synthetase gene to enumerate acetogens in natural and
engineered environments. Anaerobe 15(5):204-213.
Yan J, Im J, Yang Y, Loffler FE. 2013. Guided cobalamin biosynthesis supports
Dehalococcoides mccartyi reductive dechlorination activity. Philosophical
Transactions of the Royal Society B-Biological Sciences 368(1616).
Yan J, Ritalahti KM, Wagner DD, Loffler FE. 2012. Unexpected specificity of
interspecies cobamide transfer from Geobacter spp. to organohalide-respiring
Dehalococcoides mccartyi strains. Applied and Environmental Microbiology
78(18):6630-6636.
Yan T, LaPara TM, Novak PJ. 2006. The effect of varying levels of sodium bicarbonate
on polychlorinated biphenyl dechlorination in Hudson River sediment cultures.
Environmental Microbiology 8(7):1288-1298.
Yang L, Chang YF, Chou MS. 1999. Feasibility of bioremediation of trichloroethylene
contaminated sites by nitrifying bacteria through cometabolism with ammonia.
Journal of Hazardous Materials 69(1):111-126.
Yang YR, McCarty PL. 1998. Competition for hydrogen within a chlorinated solvent
dehalogenating anaerobic mixed culture. Environmental Science & Technology
32(22):3591-3597.
Yang YR, McCarty PL. 2000. Biologically enhanced dissolution of tetrachloroethene
DNAPL. Environmental Science & Technology 34(14):2979-2984.
Yao Y. 2009. Development of a novel dechlorinating culture. Tempe: Arizona State
University.
Yu SH, Dolan ME, Semprini L. 2005a. Kinetics and inhibition of reductive
dechlorination of chlorinated ethylenes by two different mixed cultures.
Environmental Science & Technology 39(1):195-205.

148
Yu Y, Lee C, Kim J, Hwang S. 2005b. Group-specific primer and probe sets to detect
methanogenic communities using quantitative real-time polymerase chain
reaction. Biotechnology and Bioengineering 89(6):670-679.
Zheng D, Carr CS, Hughes JB. 2001. Influence of hydraulic retention time on extent of
PCE dechlorination and preliminary characterization of the enrichment culture.
Bioremediation Journal 5(2):159-168.
Zhou JZ, Xia BC, Treves DS, Wu LY, Marsh TL, O'Neill RV, Palumbo AV, Tiedje JM.
2002. Spatial and resource factors influencing high microbial diversity in soil.
Applied and Environmental Microbiology 68(1):326-334.
Zhuang WQ, Yi S, Feng XY, Zinder SH, Tang YJJ, Alvarez-Cohen L. 2011. Selective
utilization of exogenous amino acids by Dehalococcoides ethenogenes strain 195
and its effects on growth and dechlorination activity. Applied and Environmental
Microbiology 77(21):7797-7803.
Ziv-El M, Delgado AG, Yao Y, Kang DW, Nelson KG, Halden RU, Krajmalnik-Brown
R. 2011. Development and characterization of DehaloR^2, a novel anaerobic
microbial consortium performing rapid dechlorination of TCE to ethene. Applied
Microbiology and Biotechnology 92(5):1063-1071.
Ziv-El M, Delgado AG, Yao Y, Kang DW, Nelson KG, Halden RU, Krajmalnik-Brown
R. 2012a. Development and characterization of DehaloR^2, a novel anaerobic
microbial consortium performing rapid dechlorination of TCE to ethene (vol 92,
pg 1063, 2011). Applied Microbiology and Biotechnology 95(1):273-274.
Ziv-El M, Popat SC, Cai K, Halden RU, Krajmalnik-Brown R, Rittmann BE. 2012b.
Managing methanogens and homoacetogens to promote reductive dechlorination
of trichloroethene with direct delivery of H2 in a membrane biofilm reactor.
Biotechnology and Bioengineering 109(9):2200-2210.
Ziv-El M, Popat SC, Parameswaran P, Kang DW, Polasko A, Halden RU, Rittmann BE,
Krajmalnik-Brown R. 2012c. Using electron balances and molecular techniques
to assess trichoroethene-induced shifts to a dechlorinating microbial community.
Biotechnology and Bioengineering 109(9):2230-2239.