Micro-Scale Engineering –II Lab-on-a-Chip for...
36
Micro-Scale Engineering –II Lab-on-a-Chip for DNA/RNA Analysis Y. C. Lee Department of Mechanical Engineering University of Colorado Boulder, CO 80309-0427 [email protected] January 23, 2014 1
Transcript of Micro-Scale Engineering –II Lab-on-a-Chip for...

Micro-Scale Engineering –II Lab-on-a-Chip for DNA/RNA Analysis
Y. C. Lee Department of Mechanical Engineering
University of Colorado Boulder, CO 80309-0427
January 23, 2014 1

High-throughput microfluidic single-cell RT-qPCR
A. K. White et al., "High-throughput microfluidic single-cell RT-qPCR," PNAS, 2011 Aug 23; 108(34):13999-4004.
2

4mm
Sample loading lane with 50 cell processing units in each lane.
300 parallel RT-qPCR assays and executes all steps of single-cell capture, lysis, reverse transcription, and qPCR.
Microfluidic single-cell RT-qPCR Common feed channel
3

Cell Processing Unit
400µm 4mm
Each unit consists of (i) a reagent injection line, (ii) a 0.6-nL cell capture chamber with integrated cell traps, (iii) a 10-nL reverse transcription (RT) chamber, and (iv) a 50-nL PCR chamber.
4

Three Layers of the Device
Flow Layer
13um 14um 15
0 um
Air
Valve Connection
Cell Trap
Chamber & Bus
24um
Blank Layer
Control Layer
PDMS
5

Device Operation
400µm 400µm
Hydrodynamic single cell trap
85 oC for 7 min
6

400µm
2 μL 10× Reverse Transcription Buffer, 4 μL 5× RTstem-loop miRNA primer from ABI, 1 μL 100mM dNTPs, 1.34 μL of 50 U∕μL Multiscribe Reverse Transcriptase, 0.26 μL of 20 U∕μL RNase Inhibitor, 2 μL 1% Tween 20, 9.4 μL PCR grade water.
A pulsed temperature RT protocol was carried out by placing the microfluidic device on a flatbed thermocycler (2 min at 16 °C, followed by 60 cycles of 30 s at 20 °C, 30 s at 42 °C, and 1 s at 50 °C). RT enzyme was inactivated at 85 °C (5 min), and then the device was cooled to 4 °C.
Device Operation
7

Device Operation
400µm
The PCR reagent was prepared with 25 μL of 2× TaqMan Universal Master Mix (ABI), 2.5 μL 20× Real-Time miRNA assays (primers and probe, ABI), 5 μL of 1% Tween 20, and 7.5 μL of PCR grade water.
The device was transferred to an enclosure for real-time PCR (Prototype version of Biomark™ Instrument, Fluidigm). The real-time PCR enclosure consists of a custom flatbed thermocycler, a xenon arc lamp and filter set, and a CCD imager with optics for fluorescent imaging of the entire device periodically during PCR thermocycling (see description of real-time PCR instrumentation below). PCRs were thermocycled with the following conditions: 10 min at 95 °C, followed by 50 cycles of 15 s at 95 °C and 1 min at 60 °C. Images were acquired at 60 °C.
8

DNA fragments and oligonucleotides for Polymerase Chain Reaction (PCR) 9

Polyoma virus JC DNA detection by PCR in CSF of HIV infected patients with suspected progressive multifocal leukoencephalopathy
CSF was obtained from lumbar puncture and stored at –70 °C until further analysis. CSF samples (500 µL) were thawed and centrifuged at 17,000 x g for 1 hr at 4 °C. The pellet and 180 µL of supernatant were mixed and digested with Proteinase K for 1 hr at 56 °C. DNA was extracted using a standard protocol that included phenol–choloform extraction and ethanol precipitation. The final pellet was resuspended in 50 µL of nuclease-free water. Ten microliters of each DNA extract was used in the PCR reaction using the forward primer AJ-1: 5’-A A AT G T T C C T C C A G T T C T- 3’ and the reverse primer A J - 2 : 5’- AT T C A C A AT G C T T T T C C C A – 3’. These primers amplify a fragment of 193 base pairs of the VP1 gene of J C V. The cycling program consisted of 35 rounds of amplification. Each amplification cycle consisted of denaturation for 30 sec at 94 °C, annealing for 30 sec at 55 °C, and elongation for 30 sec at 72 °C. A final step of 72 °C was added. The PCR products were concentrated by ethanol precipitation, coated onto microplate wells, and detected by hybridization with biotinylated probe AJ-3 ( 5’ biotin - C T T G AT G A AT T T G G T G T T G G G C – 3’). Absorbance was recorded in a microplate reader following an enzyme-mediated colorimetric reaction .
AMERICAN CLINICAL LABORATORY, November 2001 10

Restriction Nucleases
Bacteria different enzymes 4 to 8 nucleotides to kill virus methylation at an A or a C residue to protect itself. Hundreds available. 11

Enzyme Organism from which derived Target sequence (cut at *) 5' -->3'
Ava I Anabaena variabilis C* C/T C G A/G G Bam HI Bacillus amyloliquefaciens G* G A T C C Bgl II Bacillus globigii A* G A T C T Eco RI Escherichia coli RY 13 G* A A T T C Eco RII Escherichia coli R245 * C C A/T G G Hha I Haemophilus haemolyticus G C G * C Hpa I Haemophilus parainflenzae G T T * A A C Mbo I Moraxella bovis *G A T C Pst I Providencia stuartii C T G C A * G Sma I Serratia marcescens C C C * G G G SstI Streptomyces stanford G A G C T * C Sal I Streptomyces albus G G * T C G A C
• http://www.firstmarket.com/cutter/cut2.html 12
DNA Polymerase 13

DNA fragments and oligonucleotides for Polymerase Chain Reaction (PCR) 14

Polymerase Chain Reaction (PCR) 15

dNTP: dATP, dCTP, dGTP and dTTP
16
dCTP
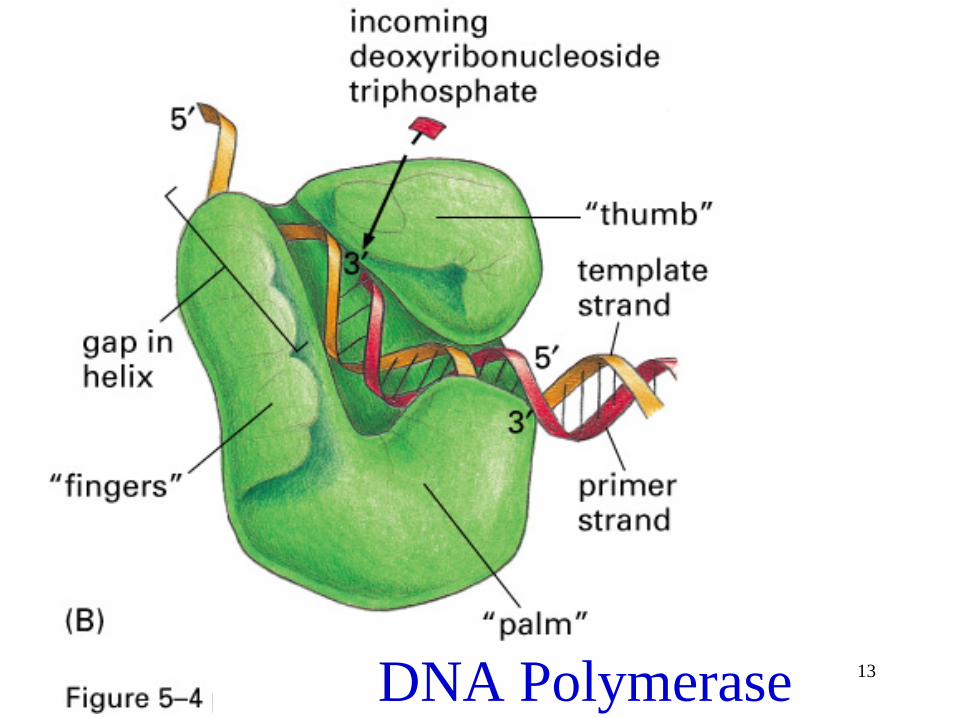
PCR Chip
Output
Input
72o
60o
95o
Li and Chen, IMECE 2002 17

MicroRNA: miRNA
(approximately 22 nucleotides) 18

Reverse transcription polymerase
chain reaction (RT-PCR)
complementary DNA
qPCR is referred to as quantitative PCR, quantitative real-time PCR, and real-time quantitative PCR. 19

400µm
Device Operation
20

Intercalating Dyes
21

Fluorophores are between base pairs or bind to the end of the fragment
22

Green Fluorescent Protein (GFP)
1. Excitation using blue light emtting diode, < 500 nm 2. Fluorescent light at 515 nm
Excitation light Filter Alternating layers of titanium oxide and silicon oxide
Photodetector (~ 6 um from sample)
23

Image taken after 40 cycles of PCR from dilution series of purified total RNA (GAPDH housekeeping gene
expression; no cells)
Total RNA from K562 cells 6 lanes (left to right): 40 pg∕chamber, 5 pg∕chamber, 625 fg∕chamber, 78 fg∕chamber, 10 fg∕chamber, and no-template control (NTC)
Digital pattern single molecule detection average copy number of GAPDH to be 979 +/- 240 transcript copies per single-cell equivalent (20 pg)
40,5
0.625,0.078
0.010,NTC
24
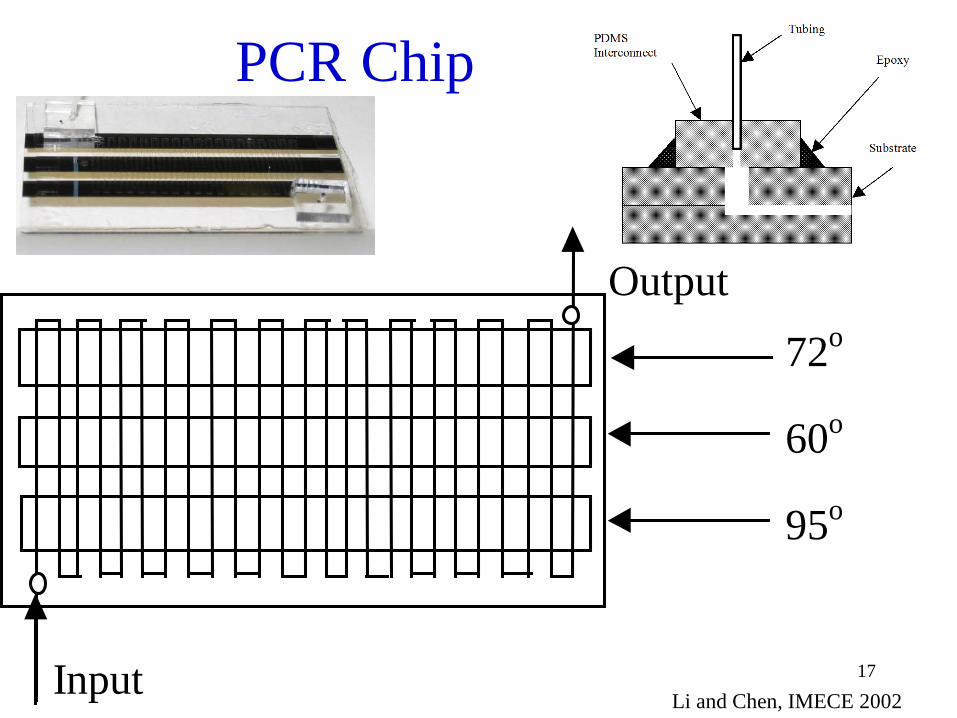
Real-time amplification
curves Efficiency of Amplification: uniform amplification across the array and technical error of less than 10% in absolute concentration, near the limit of qPCR precision.
Ct: Cycle Threshold 25
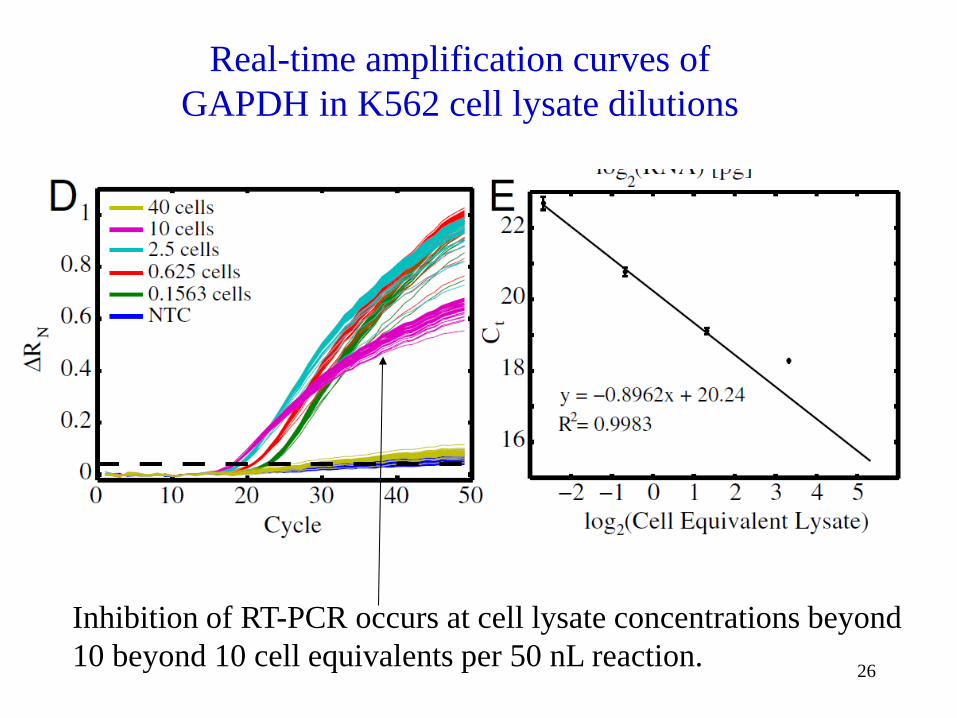
Real-time amplification curves of GAPDH in K562 cell lysate dilutions
Inhibition of RT-PCR occurs at cell lysate concentrations beyond 10 beyond 10 cell equivalents per 50 nL reaction. 26

Ct in each chamber
Ct of Cell(s) in Each Unit
Cells in each chamber
Number of GAPDH transcripts (N=233 for a single cell) 27

miRNA expression in K562 cells and hESCs
miR-16 miR-223
Low concentration
1,9561 single- cell measurements of the expression of 9 miRNA in K562 cells
28

An Integrated Nanoliter DNA Analysis Device (Mark Burns et al., Science, 1998)
DNA solution DNA fragments amplification site-specific oligonucleotides
Reagent solution Bso B1 restriction enzymes Bst DNA polymerase enzymes
Outside sources: Pressure Electronic control Optical excitation source
Electronic signals
Intercalatng dye
29
47mm X 5mm X 1mm

Three Layers of the Device
Flow Layer
13um 14um 15
0 um
Air
Valve Connection
Cell Trap
Chamber & Bus
24um
Blank Layer
Control Layer
PDMS
30

Fabrication Process for a Microfluidic Device
Photolithography: Photo resist: Microchem SU-8 3050 Thickness: 50 um, at 3000rpm 45 seconds
SU-8 structure
Masks
Fabrication processes of Photolithography
31

Soft lithography : Polydimethylsiloxane (PDMS) DOW CORNING -- SYLGARD 184
Hydrophobic surface
Hydrophilic surface after plasma treatment
Oxygen plasma surface treatment 30 seconds in Oxygen Plasma chamber: PDMS surface property converts from hydrophobic to hydrophilic
Fabrication processes of Softlithography
a. Oxygen plasma treatment on Glass slide
b. Oxygen plasma treatment on PDMS
Surface oxidation is believed to expose silanol groups (OH) at the surface of the PDMS layers that when brought together form covalent siloxane bonds (Si–O). 32

Multilayer soft
lithography
33

400µm
Device Operation
34

Cell trapping: no significant bias in selecting cells of different sizes
Fig. S1. Histograms showing the size distribution of cells in original sample as measured by Cedex (A) are consistent with the size distribution of cells isolated by microfluidic traps (B). Under the assumption of spherical cell shape the distribution of diameters of trapped cells corresponds to a mean volume of 4.2 pL with a standard deviation of 2.0 pL 35

Fig. S2. On-chip cell washing. (A) Measurements of GAPDH in cells washed in PBS off-chip prior to injection into microfluidic device, without an on-chip wash contain background signal from template in supernatant. Without on-chip washing, untrapped cells remain in the capture chambers, resulting in fewer single cell measurements (histogram inlayed). Detection of residual RNA after washing is dramatically reduced by comparison to off-chip results (Fig. S4) due to small volume processing. (B) On-chip washing was found to reduce the background signal from free RNA in the supernatant and dramatically increased the number of single cells analyzed. (C) Comparison of GAPDH measurements from loading purified RNA and washing, or not washing, the cell-capture chambers.
Free RNA, cellular debris, and untrapped cells washed away
36