MICRO AND SMALL MEDIUM ENTERPRISES IN INDIA: AN … · FIG 1.2: PERCENTAGE SHARE OF MSMEs IN TOTAL...
29
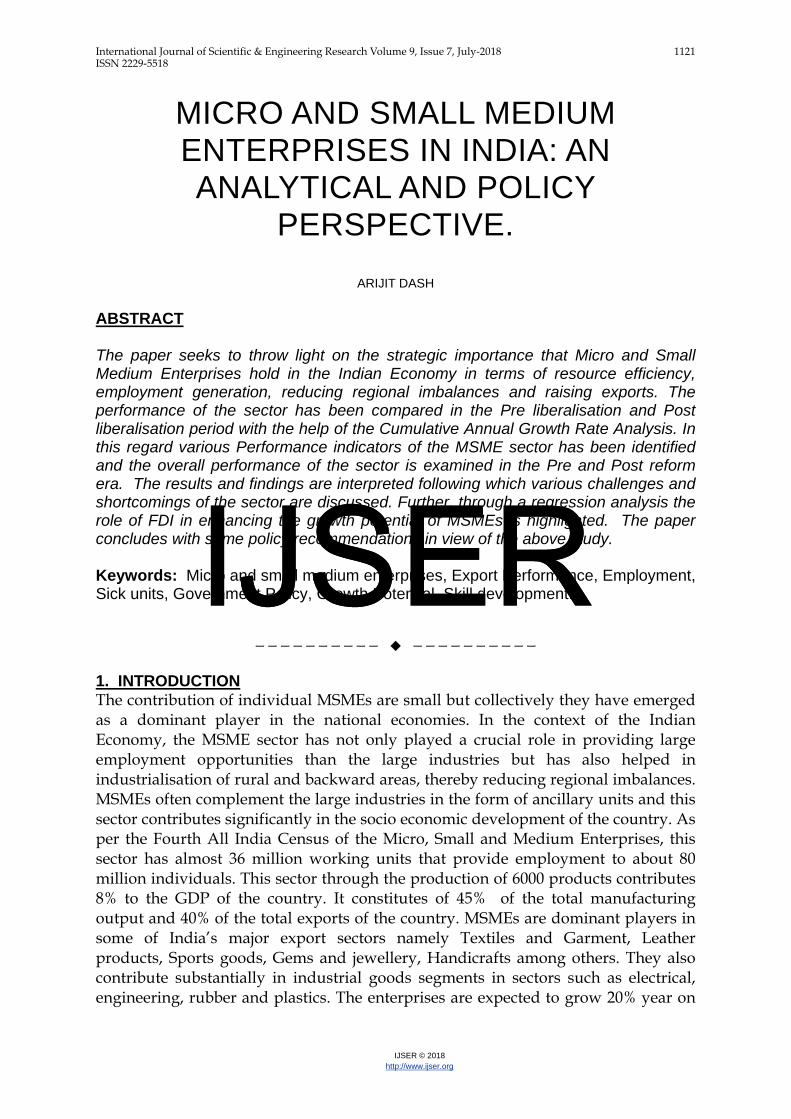
International Journal of Scientific & Engineering Research Volume 9, Issue 7, July-2018 1121 ISSN 2229-5518 IJSER © 2018 http://www.ijser.org MICRO AND SMALL MEDIUM ENTERPRISES IN INDIA: AN ANALYTICAL AND POLICY PERSPECTIVE. ARIJIT DASH ABSTRACT The paper seeks to throw light on the strategic importance that Micro and Small Medium Enterprises hold in the Indian Economy in terms of resource efficiency, employment generation, reducing regional imbalances and raising exports. The performance of the sector has been compared in the Pre liberalisation and Post liberalisation period with the help of the Cumulative Annual Growth Rate Analysis. In this regard various Performance indicators of the MSME sector has been identified and the overall performance of the sector is examined in the Pre and Post reform era. The results and findings are interpreted following which various challenges and shortcomings of the sector are discussed. Further, through a regression analysis the role of FDI in enhancing the growth potential of MSMEs is highlighted. The paper concludes with some policy recommendations in view of the above study. Keywords: Micro and small medium enterprises, Export Performance, Employment, Sick units, Government Policy, Growth Potential, Skill development. —————————— —————————— 1. INTRODUCTION The contribution of individual MSMEs are small but collectively they have emerged as a dominant player in the national economies. In the context of the Indian Economy, the MSME sector has not only played a crucial role in providing large employment opportunities than the large industries but has also helped in industrialisation of rural and backward areas, thereby reducing regional imbalances. MSMEs often complement the large industries in the form of ancillary units and this sector contributes significantly in the socio economic development of the country. As per the Fourth All India Census of the Micro, Small and Medium Enterprises, this sector has almost 36 million working units that provide employment to about 80 million individuals. This sector through the production of 6000 products contributes 8% to the GDP of the country. It constitutes of 45% of the total manufacturing output and 40% of the total exports of the country. MSMEs are dominant players in some of India’s major export sectors namely Textiles and Garment, Leather products, Sports goods, Gems and jewellery, Handicrafts among others. They also contribute substantially in industrial goods segments in sectors such as electrical, engineering, rubber and plastics. The enterprises are expected to grow 20% year on IJSER IJSER
Transcript of MICRO AND SMALL MEDIUM ENTERPRISES IN INDIA: AN … · FIG 1.2: PERCENTAGE SHARE OF MSMEs IN TOTAL...
International Journal of Scientific & Engineering Research Volume 9, Issue 7, July-2018 1121 ISSN 2229-5518
IJSER © 2018 http://www.ijser.org
MICRO AND SMALL MEDIUM ENTERPRISES IN INDIA: AN ANALYTICAL AND POLICY
PERSPECTIVE.
ARIJIT DASH ABSTRACT The paper seeks to throw light on the strategic importance that Micro and Small Medium Enterprises hold in the Indian Economy in terms of resource efficiency, employment generation, reducing regional imbalances and raising exports. The performance of the sector has been compared in the Pre liberalisation and Post liberalisation period with the help of the Cumulative Annual Growth Rate Analysis. In this regard various Performance indicators of the MSME sector has been identified and the overall performance of the sector is examined in the Pre and Post reform era. The results and findings are interpreted following which various challenges and shortcomings of the sector are discussed. Further, through a regression analysis the role of FDI in enhancing the growth potential of MSMEs is highlighted. The paper concludes with some policy recommendations in view of the above study. Keywords: Micro and small medium enterprises, Export Performance, Employment, Sick units, Government Policy, Growth Potential, Skill development.
—————————— ——————————
1. INTRODUCTION The contribution of individual MSMEs are small but collectively they have emerged as a dominant player in the national economies. In the context of the Indian Economy, the MSME sector has not only played a crucial role in providing large employment opportunities than the large industries but has also helped in industrialisation of rural and backward areas, thereby reducing regional imbalances. MSMEs often complement the large industries in the form of ancillary units and this sector contributes significantly in the socio economic development of the country. As per the Fourth All India Census of the Micro, Small and Medium Enterprises, this sector has almost 36 million working units that provide employment to about 80 million individuals. This sector through the production of 6000 products contributes 8% to the GDP of the country. It constitutes of 45% of the total manufacturing output and 40% of the total exports of the country. MSMEs are dominant players in some of India’s major export sectors namely Textiles and Garment, Leather products, Sports goods, Gems and jewellery, Handicrafts among others. They also contribute substantially in industrial goods segments in sectors such as electrical, engineering, rubber and plastics. The enterprises are expected to grow 20% year on
IJSERIJSER
International Journal of Scientific & Engineering Research Volume 9, Issue 7, July-2018 1122 ISSN 2229-5518
IJSER © 2018 http://www.ijser.org
year with 90% of the industrial units belonging to the sector. This growth can be attributed to the fact that the units need comparatively lower investment and some of them are backed by local and foreign funding.
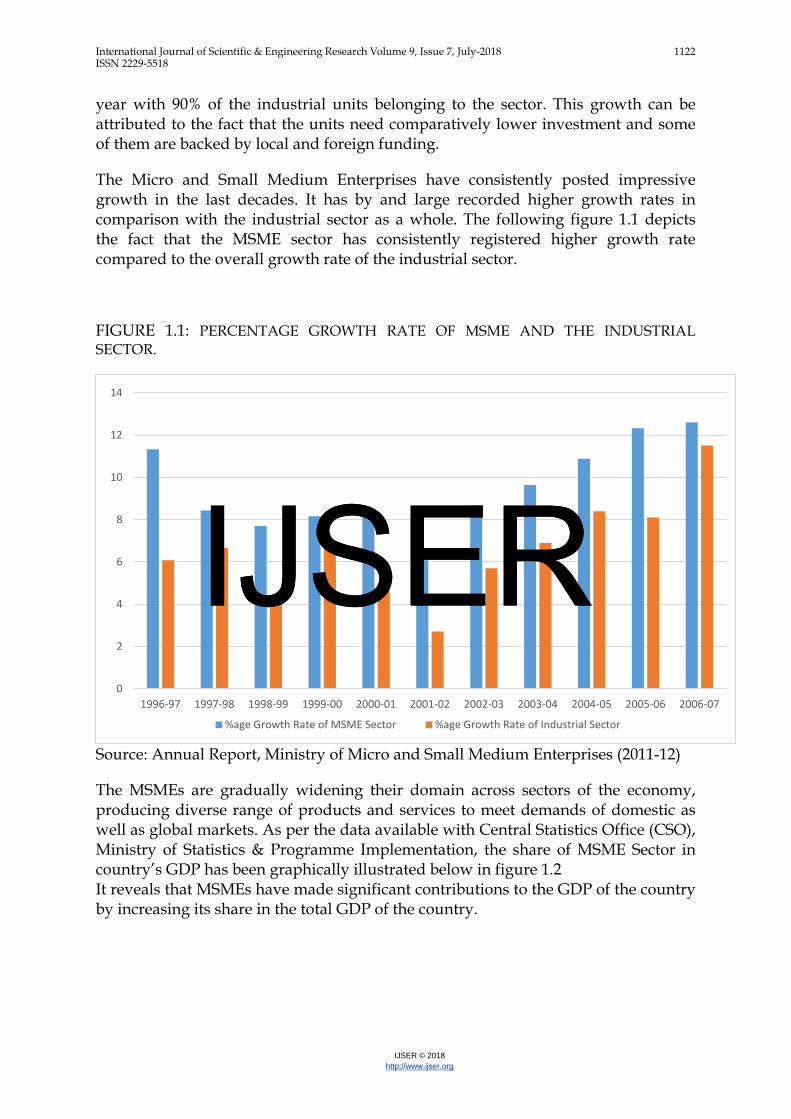
The Micro and Small Medium Enterprises have consistently posted impressive growth in the last decades. It has by and large recorded higher growth rates in comparison with the industrial sector as a whole. The following figure 1.1 depicts the fact that the MSME sector has consistently registered higher growth rate compared to the overall growth rate of the industrial sector.
FIGURE 1.1: PERCENTAGE GROWTH RATE OF MSME AND THE INDUSTRIAL SECTOR.
Source: Annual Report, Ministry of Micro and Small Medium Enterprises (2011-12)
The MSMEs are gradually widening their domain across sectors of the economy, producing diverse range of products and services to meet demands of domestic as well as global markets. As per the data available with Central Statistics Office (CSO), Ministry of Statistics & Programme Implementation, the share of MSME Sector in country’s GDP has been graphically illustrated below in figure 1.2 It reveals that MSMEs have made significant contributions to the GDP of the country by increasing its share in the total GDP of the country.
0
2
4
6
8
10
12
14
1996-97 1997-98 1998-99 1999-00 2000-01 2001-02 2002-03 2003-04 2004-05 2005-06 2006-07
%age Growth Rate of MSME Sector %age Growth Rate of Industrial Sector
IJSERIJSER

International Journal of Scientific & Engineering Research Volume 9, Issue 7, July-2018 1123 ISSN 2229-5518
IJSER © 2018 http://www.ijser.org
FIG 1.2: PERCENTAGE SHARE OF MSMEs IN TOTAL GDP OF INDIA.
Source: Fourth All India Census of MSME 2006-07.
In the backdrop of the above statistical evidences, the rest of the paper is structured as follows: Section 2 contains a brief review of the relevant literature on Micro and Small Medium Enterprises in India. Section 3 deals with the evolution of MSMEs in India since the 1950s and gives a brief insight into the performance of MSMEs in India. A Cumulative Annual Growth Rate Analysis is performed in Section 4 wherein the Pre and Post reform performance of MSMEs is examined and critically evaluated. Section 5 attempts to mirror the Challenges faced by the Micro and Small Medium Enterprises in India following which the paper attempts to highlight the role of FDI in enhancing the growth potential of MSMEs through a regression analysis in Section 6. Section 7 proposes some policies in the backdrop of the challenges that the MSMEs faces and the concluding remarks are presented in Section 8. 2. LITERATURE REVIEW
33.5 34
34.5 35
35.5 36
36.5 37
37.5 38
38.5
IJSERIJSER
International Journal of Scientific & Engineering Research Volume 9, Issue 7, July-2018 1124 ISSN 2229-5518
IJSER © 2018 http://www.ijser.org
The existing literary work, survey and policy study provides holistic insight into the importance of Micro and Small Medium Enterprises in the Indian Economy. Mali (1998) observed that small and medium enterprises (SMEs) and micro enterprises have to face increasing competition in the present scenario of globalization and they have to specifically improve themselves in the fields of management, marketing, product diversification, infrastructural development, technological up gradation. Moreover, new small and medium enterprises may have to move from slow growth area to the high growth area and they have to form strategic alliance with entrepreneurs of neighbouring countries. Singh et al. (2012) analysed the performance of Small scale industry in India and focused on policy changes which have opened new opportunities for this sector. Their study concluded that the MSME sector has made good progress in terms of number of units, production & employment levels. The study recommended the emergence of technology development and strengthening of financial infrastructure to boost the sector and to achieve growth target. Venkatesh and Muthiah (2012) found that the role of small & medium enterprises (SMEs) in the industrial sector is growing rapidly and they have become a thrust area for future growth. They emphasized that nurturing the MSME sector is essential for the economic well-being of the nation. This Paper is a humble attempt to delve deep into the MSME sector of the Indian economy and it differs from the existing literature in several aspects. Firstly, the importance of the sector has been highlighted by recognising some key performance indicators of the Micro and Small Medium Enterprises over the years. Secondly, the statistical analysis (Cumulative Annual Growth Rate Analysis) gives a brief insight into the growth performance of the MSMEs over the Pre and Post reforms period of the Indian Economy. The paper also throws light on the major constraints that the MSMEs face and suggests some policies in this regard. 3: EVOLUTION OF MSMEs IN INDIA The definition of MSMEs in India dates back to the year 1951 when the term Small Scale Industry was defined under the Industries (Development and Regulation) Act. The Factories Act defined the manufacturing units in terms of workers employed and the Reserve Bank of India, at times made a distinction in terms of quantum of advances granted to a unit. It was in August 9, 2005 that ushered in a new policy for development of the MSME sector and more importantly defined the MSME which later became a part of the MSME Development Act, 2006. In accordance with the provision of the Micro, Small and Medium Enterprises Development Act (2006), MSMEs are classified into the “Manufacturing” and the “Service Enterprises.” The former is defined in terms of investment in Plant and Machinery and the latter in terms of investment in equipment. The MSMED Act (2006) was a step forward to facilitate the development of the enterprises and enhance their competitiveness. The act provides a legal framework for “enterprise” which includes the manufacturing and service entities. The Annual report of Micro, Small and Medium Enterprises of India (2011) states that, MSMED Act 2006 was enacted to address issues affecting Micro, Small and Medium Enterprises (MSMEs) and to cover the investment ceiling
IJSERIJSER
International Journal of Scientific & Engineering Research Volume 9, Issue 7, July-2018 1125 ISSN 2229-5518
IJSER © 2018 http://www.ijser.org
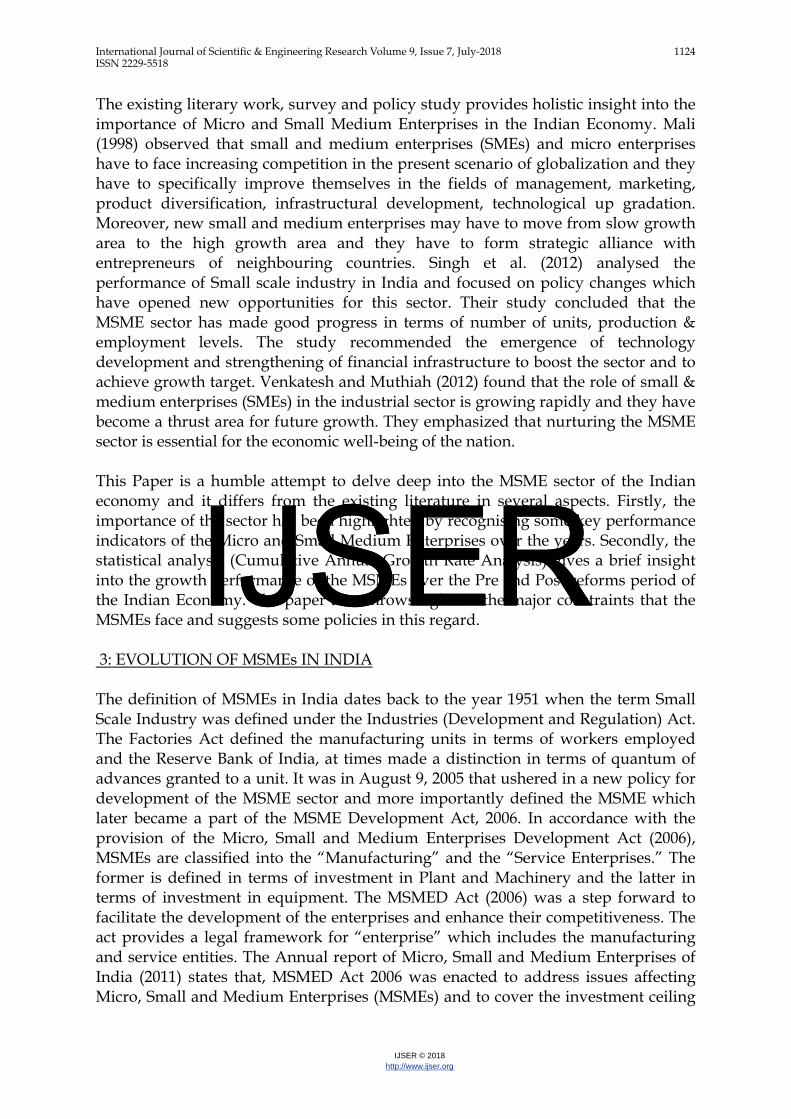
of the sector. The salient features of the Act include, setting up of a National Board for MSMEs, classification of enterprises, advisory committees for promotion, development and enhancement of MSMEs and schemes to foster the growth of the enterprises. It has been estimated that the Micro sector with 630.52 lakh estimated enterprises accounts for more than 99% of total estimated number of MSMEs. On the other hand, the small sector with 3.31 lakh and Medium sector with 0.05 lakh estimated MSMEs accounts for 0.52% and 0.01% of total estimated MSMEs, respectively. Figure 3.1 gives a brief insight into the percentage share of Rural and Urban MSMEs in the country. FIG 3.1: PERCENTAGE SHARE OF RURAL AND URBAN MSMEs
Source: Annual Report, Ministry of Micro and Small Medium Enterprises (2017-18)
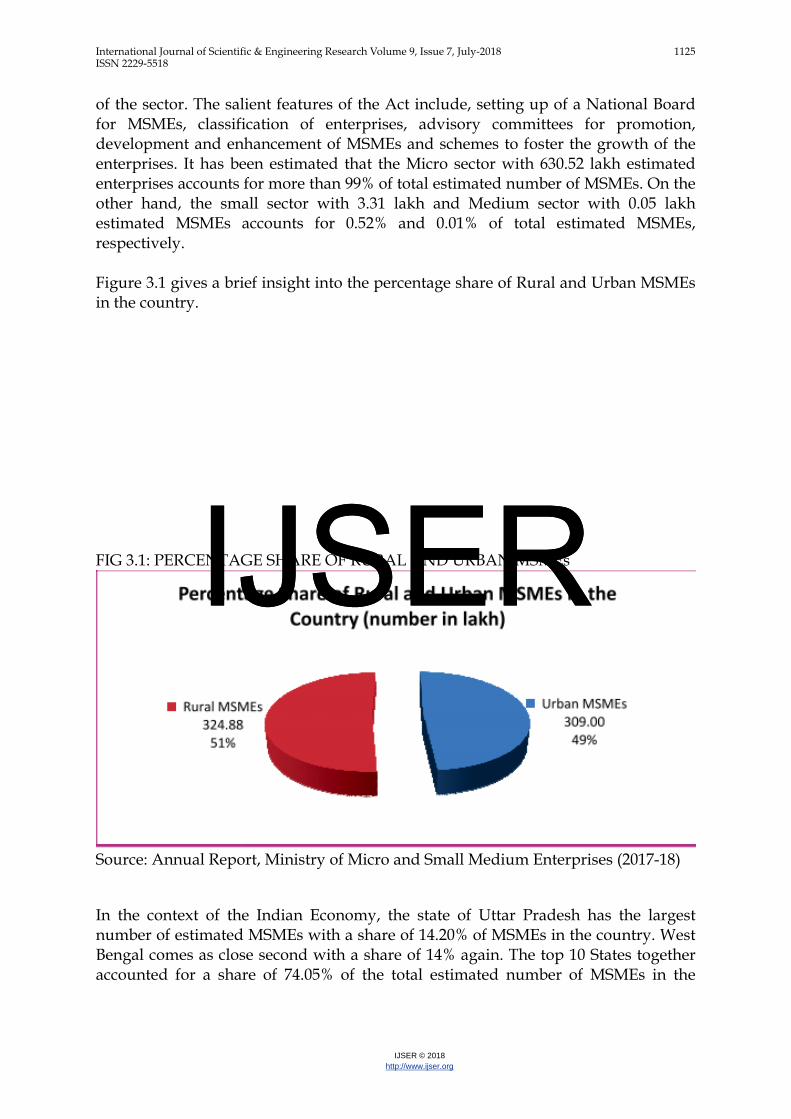
In the context of the Indian Economy, the state of Uttar Pradesh has the largest number of estimated MSMEs with a share of 14.20% of MSMEs in the country. West Bengal comes as close second with a share of 14% again. The top 10 States together accounted for a share of 74.05% of the total estimated number of MSMEs in the
IJSERIJSER
International Journal of Scientific & Engineering Research Volume 9, Issue 7, July-2018 1126 ISSN 2229-5518
IJSER © 2018 http://www.ijser.org
country. Figure below shows the distribution of estimated enterprises in the top ten States. FIG 3.2: NUMBER OF ESTIMATED MSMES IN THE INDIAN STATES
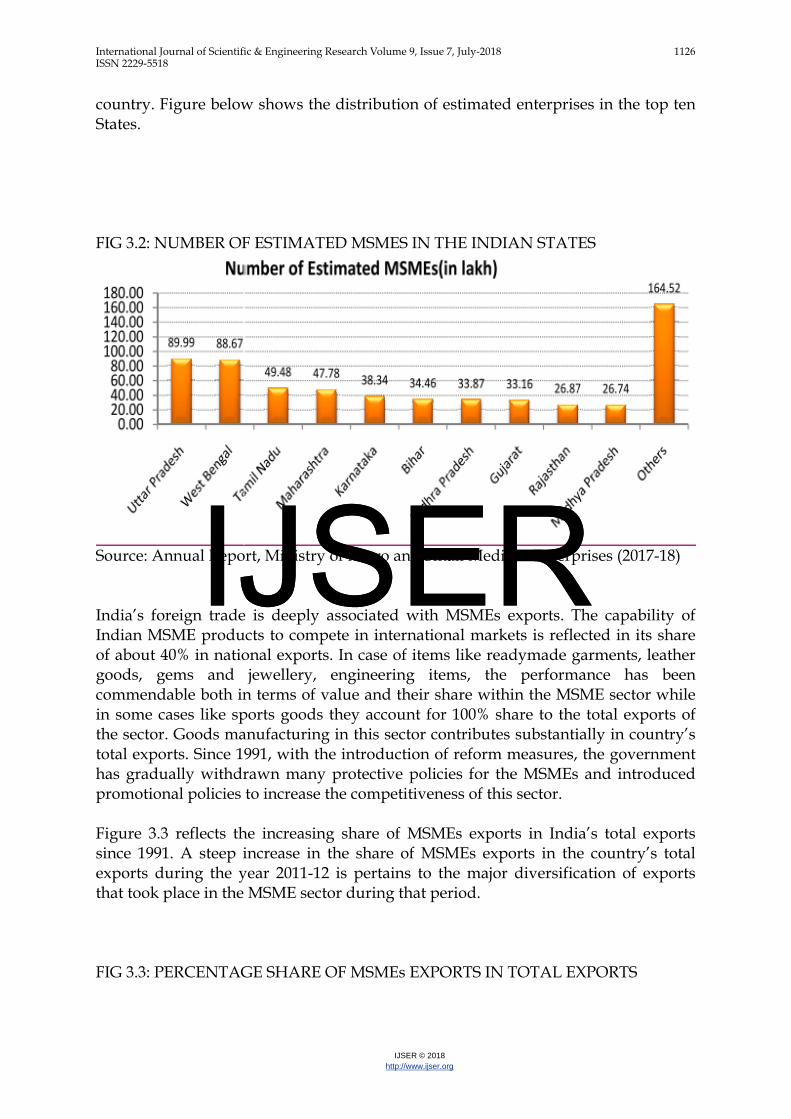
Source: Annual Report, Ministry of Micro and Small Medium Enterprises (2017-18) India’s foreign trade is deeply associated with MSMEs exports. The capability of Indian MSME products to compete in international markets is reflected in its share of about 40% in national exports. In case of items like readymade garments, leather goods, gems and jewellery, engineering items, the performance has been commendable both in terms of value and their share within the MSME sector while in some cases like sports goods they account for 100% share to the total exports of the sector. Goods manufacturing in this sector contributes substantially in country’s total exports. Since 1991, with the introduction of reform measures, the government has gradually withdrawn many protective policies for the MSMEs and introduced promotional policies to increase the competitiveness of this sector. Figure 3.3 reflects the increasing share of MSMEs exports in India’s total exports since 1991. A steep increase in the share of MSMEs exports in the country’s total exports during the year 2011-12 is pertains to the major diversification of exports that took place in the MSME sector during that period. FIG 3.3: PERCENTAGE SHARE OF MSMEs EXPORTS IN TOTAL EXPORTS
IJSERIJSER
International Journal of Scientific & Engineering Research Volume 9, Issue 7, July-2018 1127 ISSN 2229-5518
IJSER © 2018 http://www.ijser.org
Source: RBI handbook of statistics, Annual Report of Ministry of Small Medium Enterprises 2015-16. 4. STATISTICAL ANALYSIS 4.1 METHODOLOGY The Cumulative Annual Growth Rate Analysis (CAGR) has been used to study and compare the rate of change of each performance variables of MSMEs between the periods under consideration. The various Performance indicators or variables taken into consideration are Number of units, Export value, Employment and number of sick units. The comparison has been made in a way that if number of units of MSMEs is taken as a performance variable, then the CAGR for the Pre liberalisation period is computed first and then compared with the Post liberalisation result. The CAGR has been computed as follows: -
CAGR(Tn,T0) = [(VTn/VT0)1/Tn-T0] − 1 ,
0
5
10
15
20
25
30
35
40
45
50
Percentage share of MSMEs Exports in total Exports
IJSERIJSER
International Journal of Scientific & Engineering Research Volume 9, Issue 7, July-2018 1128 ISSN 2229-5518
IJSER © 2018 http://www.ijser.org
Where, V stands for value, Tn is the value of current Period and T0 is the value of initial period. A higher CAGR for Number of units, Export value, Employment reflects better Performance of the MSMEs. On the contrary, a higher CAGR of sick units indicates poor performance of the MSMEs. The analysis has been computed and interpreted in three time periods, namely the Pre reform period (1973-1990), Post reform period (1991-2005) and the Post MSMED Act period (2006-2014). While computing the CAGR, the data used has been collected from the various Annual Survey Reports of the Ministry of MSME, Govt. of India. (Refer Appendix).
4.2 PRE LIBERALISATION PERFORMANCE OF ÍSSI’S (1973-1990)
TABLE 1
PERFORMANCE INDICATORS
No of Units (in millions)
Exports (Cr)
Employment (Lakhs)
Sick Units (in numbers)
CAGR 0.167200816
0.193544782
0.079885688
0.25599066
CAGR % 16.72
19.35
7.98
25.6
Table 1 depicts the Pre liberalisation performance of SSI’s during the period 1973 to 1990. On analysing the various performance variables of MSMEs through the lens of the Cumulative Annual Growth Rate Analysis (CAGR), the following observations have been made.
• The CAGR value for the number of units and exports is around 17% and 19% respectively, thereby indicating a better position of the sector.
• The rate of growth of Sick units during this period is high, thereby raising concerns about the sector.
• Moreover, the growth rate of Employment is low and this can be attributed to higher sickness leading to lower productivity and lower investment in this sector.
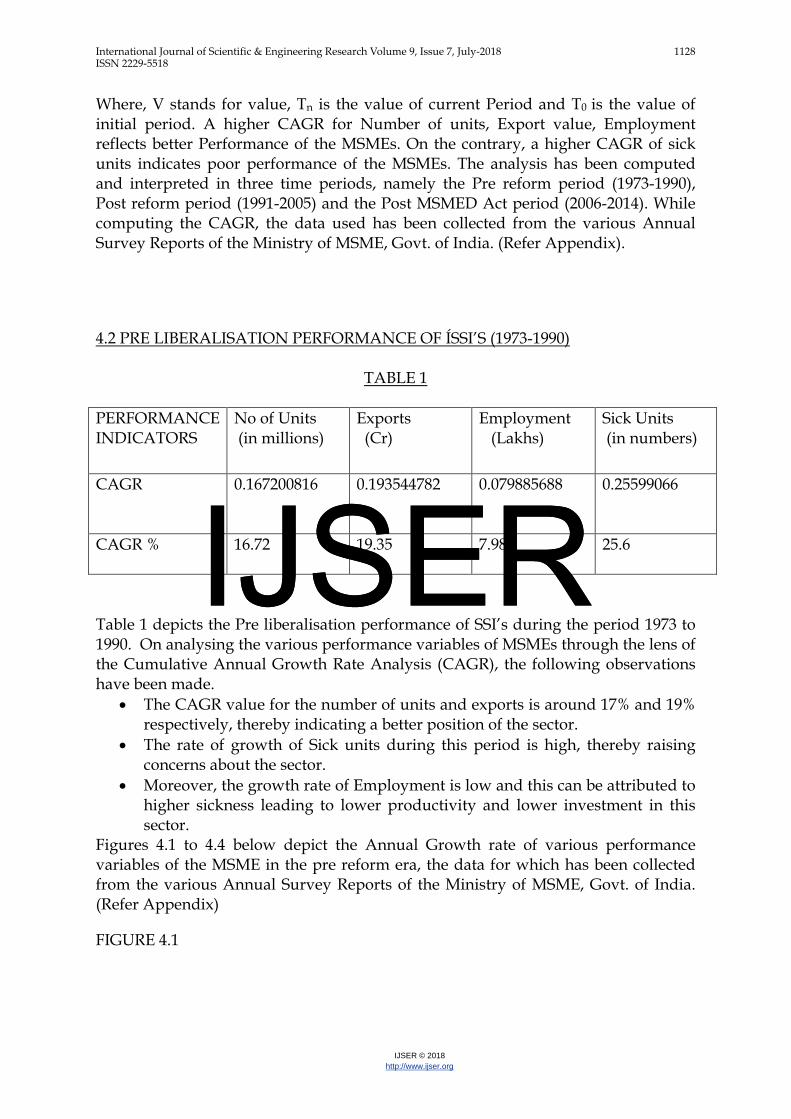
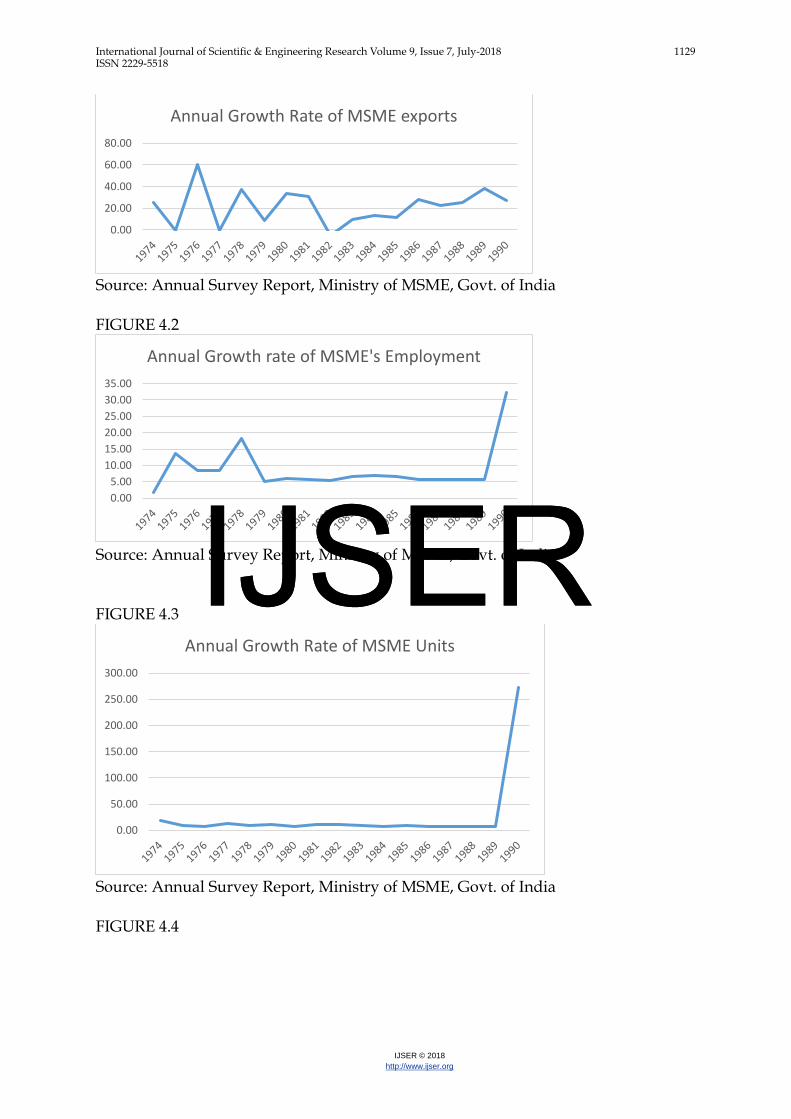
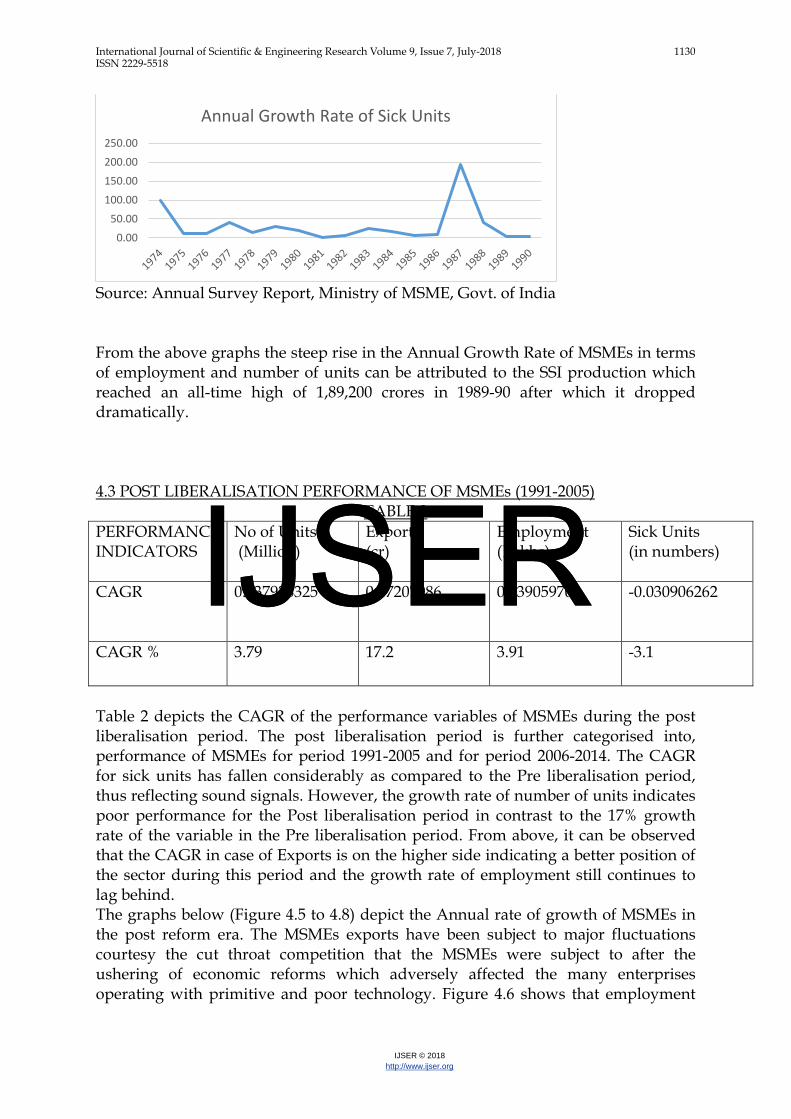
Figures 4.1 to 4.4 below depict the Annual Growth rate of various performance variables of the MSME in the pre reform era, the data for which has been collected from the various Annual Survey Reports of the Ministry of MSME, Govt. of India. (Refer Appendix)
FIGURE 4.1
IJSERIJSER
International Journal of Scientific & Engineering Research Volume 9, Issue 7, July-2018 1129 ISSN 2229-5518
IJSER © 2018 http://www.ijser.org
Source: Annual Survey Report, Ministry of MSME, Govt. of India FIGURE 4.2
Source: Annual Survey Report, Ministry of MSME, Govt. of India FIGURE 4.3
Source: Annual Survey Report, Ministry of MSME, Govt. of India FIGURE 4.4
0.00
20.00
40.00
60.00
80.00
Annual Growth Rate of MSME exports
0.00 5.00
10.00 15.00 20.00 25.00 30.00 35.00
Annual Growth rate of MSME's Employment
0.00
50.00
100.00
150.00
200.00
250.00
300.00
Annual Growth Rate of MSME Units
IJSERIJSER
International Journal of Scientific & Engineering Research Volume 9, Issue 7, July-2018 1130 ISSN 2229-5518
IJSER © 2018 http://www.ijser.org
Source: Annual Survey Report, Ministry of MSME, Govt. of India From the above graphs the steep rise in the Annual Growth Rate of MSMEs in terms of employment and number of units can be attributed to the SSI production which reached an all-time high of 1,89,200 crores in 1989-90 after which it dropped dramatically. 4.3 POST LIBERALISATION PERFORMANCE OF MSMEs (1991-2005)
TABLE 2 PERFORMANCE INDICATORS
No of Units (Million)
Exports (cr)
Employment (Lakhs)
Sick Units (in numbers)
CAGR 0.037928325
0.17207086
0.039059709
-0.030906262
CAGR % 3.79 17.2 3.91 -3.1
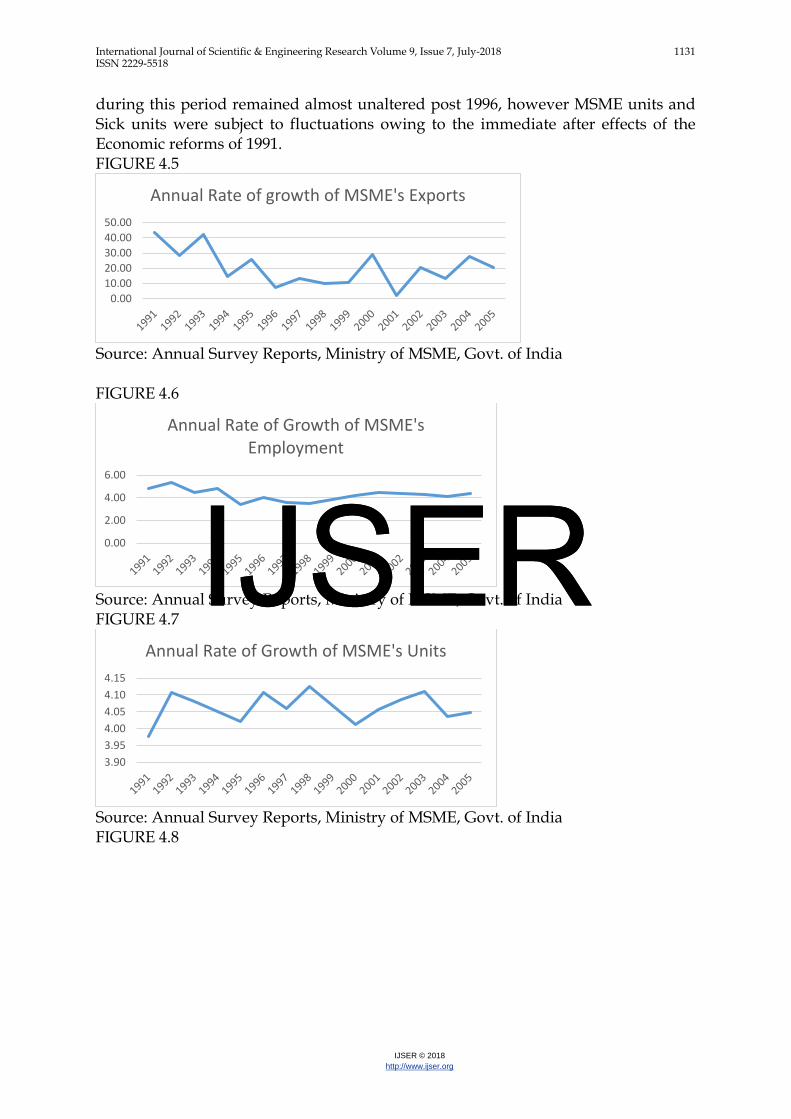
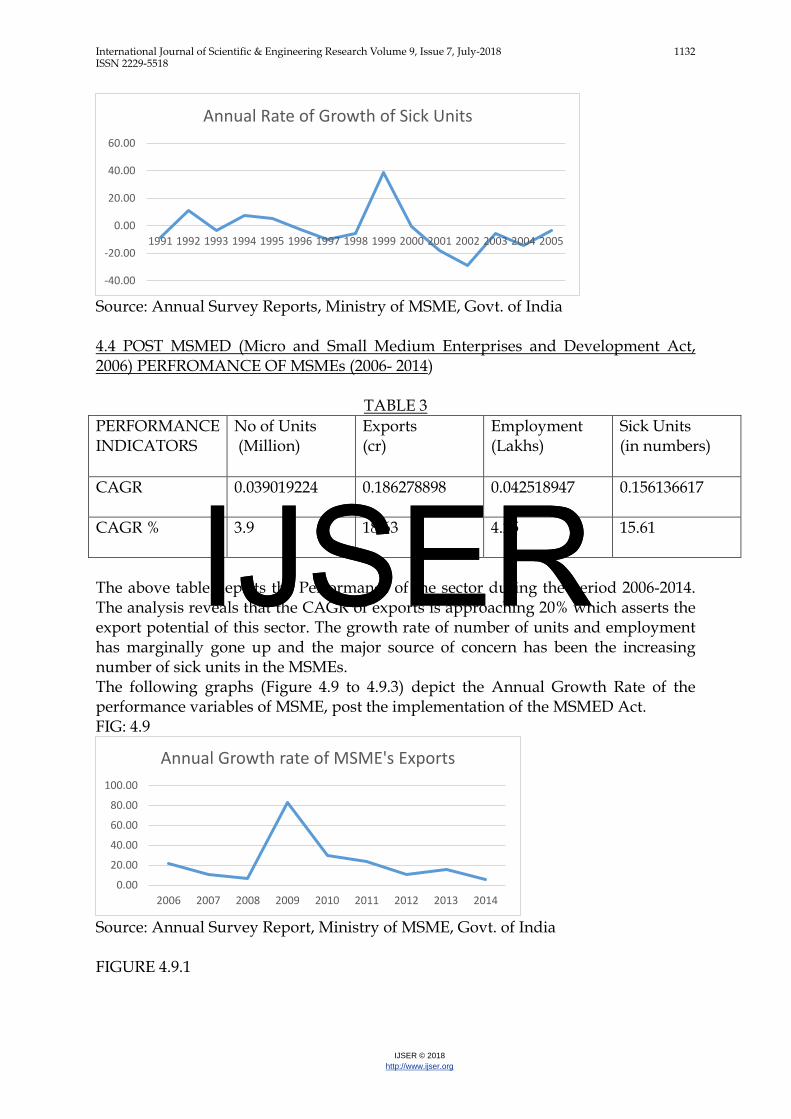
Table 2 depicts the CAGR of the performance variables of MSMEs during the post liberalisation period. The post liberalisation period is further categorised into, performance of MSMEs for period 1991-2005 and for period 2006-2014. The CAGR for sick units has fallen considerably as compared to the Pre liberalisation period, thus reflecting sound signals. However, the growth rate of number of units indicates poor performance for the Post liberalisation period in contrast to the 17% growth rate of the variable in the Pre liberalisation period. From above, it can be observed that the CAGR in case of Exports is on the higher side indicating a better position of the sector during this period and the growth rate of employment still continues to lag behind. The graphs below (Figure 4.5 to 4.8) depict the Annual rate of growth of MSMEs in the post reform era. The MSMEs exports have been subject to major fluctuations courtesy the cut throat competition that the MSMEs were subject to after the ushering of economic reforms which adversely affected the many enterprises operating with primitive and poor technology. Figure 4.6 shows that employment
0.00
50.00
100.00
150.00
200.00
250.00
Annual Growth Rate of Sick Units
IJSERIJSER
International Journal of Scientific & Engineering Research Volume 9, Issue 7, July-2018 1131 ISSN 2229-5518
IJSER © 2018 http://www.ijser.org
during this period remained almost unaltered post 1996, however MSME units and Sick units were subject to fluctuations owing to the immediate after effects of the Economic reforms of 1991. FIGURE 4.5
Source: Annual Survey Reports, Ministry of MSME, Govt. of India FIGURE 4.6
Source: Annual Survey Reports, Ministry of MSME, Govt. of India FIGURE 4.7
Source: Annual Survey Reports, Ministry of MSME, Govt. of India FIGURE 4.8
0.00 10.00 20.00 30.00 40.00 50.00
Annual Rate of growth of MSME's Exports
0.00
2.00
4.00
6.00
Annual Rate of Growth of MSME's Employment
3.90 3.95 4.00 4.05 4.10 4.15
Annual Rate of Growth of MSME's Units
IJSERIJSER
International Journal of Scientific & Engineering Research Volume 9, Issue 7, July-2018 1132 ISSN 2229-5518
IJSER © 2018 http://www.ijser.org
Source: Annual Survey Reports, Ministry of MSME, Govt. of India 4.4 POST MSMED (Micro and Small Medium Enterprises and Development Act, 2006) PERFROMANCE OF MSMEs (2006- 2014)
TABLE 3 PERFORMANCE INDICATORS
No of Units (Million)
Exports (cr)
Employment (Lakhs)
Sick Units (in numbers)
CAGR 0.039019224
0.186278898
0.042518947
0.156136617
CAGR % 3.9 18.63 4.25 15.61
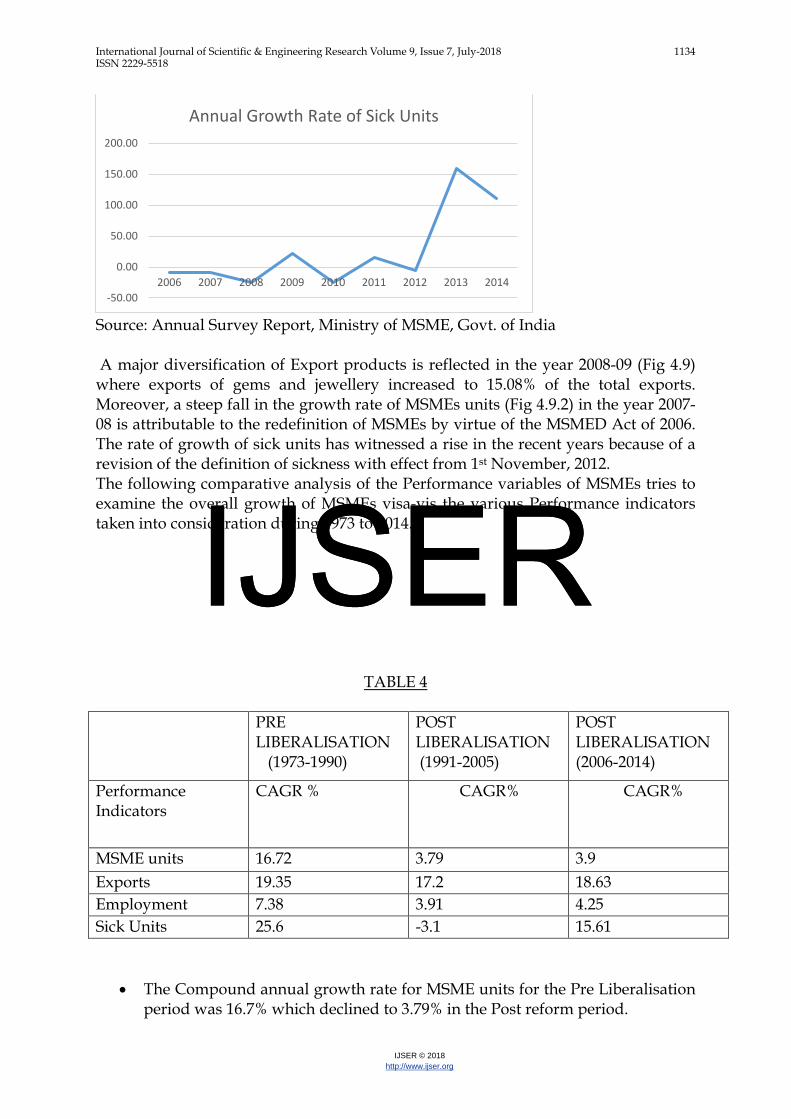
The above table depicts the Performance of the sector during the period 2006-2014. The analysis reveals that the CAGR of exports is approaching 20% which asserts the export potential of this sector. The growth rate of number of units and employment has marginally gone up and the major source of concern has been the increasing number of sick units in the MSMEs. The following graphs (Figure 4.9 to 4.9.3) depict the Annual Growth Rate of the performance variables of MSME, post the implementation of the MSMED Act. FIG: 4.9
Source: Annual Survey Report, Ministry of MSME, Govt. of India FIGURE 4.9.1
-40.00
-20.00
0.00
20.00
40.00
60.00
1991 1992 1993 1994 1995 1996 1997 1998 1999 2000 2001 2002 2003 2004 2005
Annual Rate of Growth of Sick Units
0.00
20.00
40.00
60.00
80.00
100.00
2006 2007 2008 2009 2010 2011 2012 2013 2014
Annual Growth rate of MSME's Exports
IJSERIJSER

International Journal of Scientific & Engineering Research Volume 9, Issue 7, July-2018 1133 ISSN 2229-5518
IJSER © 2018 http://www.ijser.org
Source: Annual Survey Report, Ministry of MSME, Govt. of India FIGURE 4.9.2
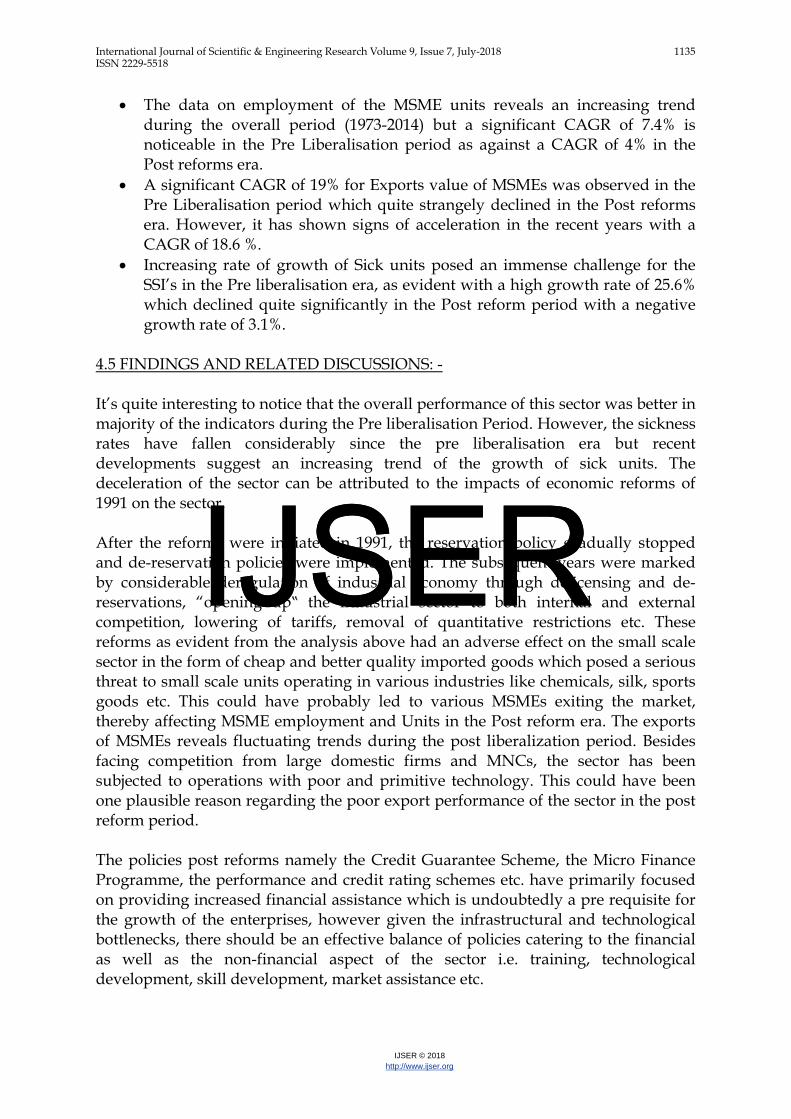
Source: Annual Survey Report, Ministry of MSME, Govt. of India FIG: 4.9.3
0.00
50.00
100.00
150.00
200.00
2006 2007 2008 2009 2010 2011 2012 2013 2014
Annual Growth rate of MSME's Employment
0.00
50.00
100.00
150.00
200.00
250.00
2006 2007 2008 2009 2010 2011 2012 2013 2014
Annual Growth Rate of MSMEs Units
IJSERIJSER
International Journal of Scientific & Engineering Research Volume 9, Issue 7, July-2018 1134 ISSN 2229-5518
IJSER © 2018 http://www.ijser.org
Source: Annual Survey Report, Ministry of MSME, Govt. of India A major diversification of Export products is reflected in the year 2008-09 (Fig 4.9) where exports of gems and jewellery increased to 15.08% of the total exports. Moreover, a steep fall in the growth rate of MSMEs units (Fig 4.9.2) in the year 2007-08 is attributable to the redefinition of MSMEs by virtue of the MSMED Act of 2006. The rate of growth of sick units has witnessed a rise in the recent years because of a revision of the definition of sickness with effect from 1st November, 2012. The following comparative analysis of the Performance variables of MSMEs tries to examine the overall growth of MSMEs visa-vis the various Performance indicators taken into consideration during 1973 to 2014.
TABLE 4
PRE LIBERALISATION (1973-1990)
POST LIBERALISATION (1991-2005)
POST LIBERALISATION (2006-2014)
Performance Indicators
CAGR % CAGR% CAGR%
MSME units 16.72 3.79 3.9 Exports 19.35 17.2 18.63 Employment 7.38 3.91 4.25 Sick Units 25.6 -3.1 15.61
• The Compound annual growth rate for MSME units for the Pre Liberalisation period was 16.7% which declined to 3.79% in the Post reform period.
-50.00
0.00
50.00
100.00
150.00
200.00
2006 2007 2008 2009 2010 2011 2012 2013 2014
Annual Growth Rate of Sick Units
IJSERIJSER
International Journal of Scientific & Engineering Research Volume 9, Issue 7, July-2018 1135 ISSN 2229-5518
IJSER © 2018 http://www.ijser.org
• The data on employment of the MSME units reveals an increasing trend during the overall period (1973-2014) but a significant CAGR of 7.4% is noticeable in the Pre Liberalisation period as against a CAGR of 4% in the Post reforms era.
• A significant CAGR of 19% for Exports value of MSMEs was observed in the Pre Liberalisation period which quite strangely declined in the Post reforms era. However, it has shown signs of acceleration in the recent years with a CAGR of 18.6 %.
• Increasing rate of growth of Sick units posed an immense challenge for the SSI’s in the Pre liberalisation era, as evident with a high growth rate of 25.6% which declined quite significantly in the Post reform period with a negative growth rate of 3.1%.
4.5 FINDINGS AND RELATED DISCUSSIONS: - It’s quite interesting to notice that the overall performance of this sector was better in majority of the indicators during the Pre liberalisation Period. However, the sickness rates have fallen considerably since the pre liberalisation era but recent developments suggest an increasing trend of the growth of sick units. The deceleration of the sector can be attributed to the impacts of economic reforms of 1991 on the sector. After the reforms were initiated in 1991, the reservation policy gradually stopped and de-reservation policies were implemented. The subsequent years were marked by considerable deregulation of industrial economy through delicensing and de-reservations, “opening up‟ the industrial sector to both internal and external competition, lowering of tariffs, removal of quantitative restrictions etc. These reforms as evident from the analysis above had an adverse effect on the small scale sector in the form of cheap and better quality imported goods which posed a serious threat to small scale units operating in various industries like chemicals, silk, sports goods etc. This could have probably led to various MSMEs exiting the market, thereby affecting MSME employment and Units in the Post reform era. The exports of MSMEs reveals fluctuating trends during the post liberalization period. Besides facing competition from large domestic firms and MNCs, the sector has been subjected to operations with poor and primitive technology. This could have been one plausible reason regarding the poor export performance of the sector in the post reform period. The policies post reforms namely the Credit Guarantee Scheme, the Micro Finance Programme, the performance and credit rating schemes etc. have primarily focused on providing increased financial assistance which is undoubtedly a pre requisite for the growth of the enterprises, however given the infrastructural and technological bottlenecks, there should be an effective balance of policies catering to the financial as well as the non-financial aspect of the sector i.e. training, technological development, skill development, market assistance etc.
IJSERIJSER
International Journal of Scientific & Engineering Research Volume 9, Issue 7, July-2018 1136 ISSN 2229-5518
IJSER © 2018 http://www.ijser.org
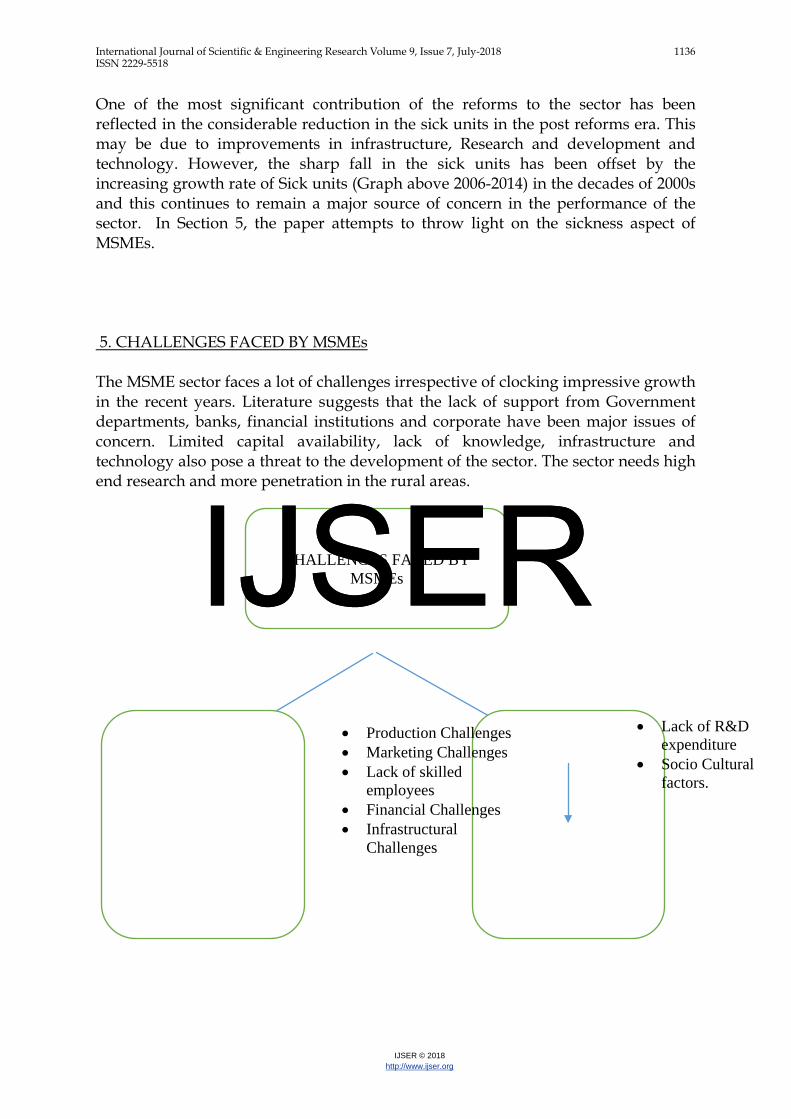
One of the most significant contribution of the reforms to the sector has been reflected in the considerable reduction in the sick units in the post reforms era. This may be due to improvements in infrastructure, Research and development and technology. However, the sharp fall in the sick units has been offset by the increasing growth rate of Sick units (Graph above 2006-2014) in the decades of 2000s and this continues to remain a major source of concern in the performance of the sector. In Section 5, the paper attempts to throw light on the sickness aspect of MSMEs. 5. CHALLENGES FACED BY MSMEs The MSME sector faces a lot of challenges irrespective of clocking impressive growth in the recent years. Literature suggests that the lack of support from Government departments, banks, financial institutions and corporate have been major issues of concern. Limited capital availability, lack of knowledge, infrastructure and technology also pose a threat to the development of the sector. The sector needs high end research and more penetration in the rural areas.
CHALLENGES FACED BY MSMEs
Internal Factors External Factors
• Production Challenges • Marketing Challenges • Lack of skilled
employees • Financial Challenges • Infrastructural
Challenges
• Lack of R&D expenditure
• Socio Cultural factors.
IJSERIJSER
International Journal of Scientific & Engineering Research Volume 9, Issue 7, July-2018 1137 ISSN 2229-5518
IJSER © 2018 http://www.ijser.org
Internal factors include all management related factors like production, marketing, human resource development, financial and infrastructure related factors etc. In considering both internal and external factors, SME ‘s can manage and control internal factors but external factors can be dealt with by government’s involvement through implementing some specific schemes and programs for respective sector wise and also by category of industry wise. Internal challenges are production, marketing, financial, human resource development and infrastructure etc. Production challenges include lack of power, lack of resources, lack of scarcity, lack of high cost raw materials, poor quality of raw materials, lack of machinery etc. Marketing challenges include lack of promotional strategies, lack of market channels, lack of networking, lack of organized distribution channels, lack of delivery time etc. Financial challenges include lack of credit from banks, lack of awareness on schemes and services, delayed process in bank, lack of working capital etc. Internal Challenges also includes the Human Development Challenges which includes the lack of training, lack of motivation among employees, lack of skilled employees, lack of technical and managerial training, improper way of recruiting etc. • Besides the above challenges the MSMEs face there are few constraints the
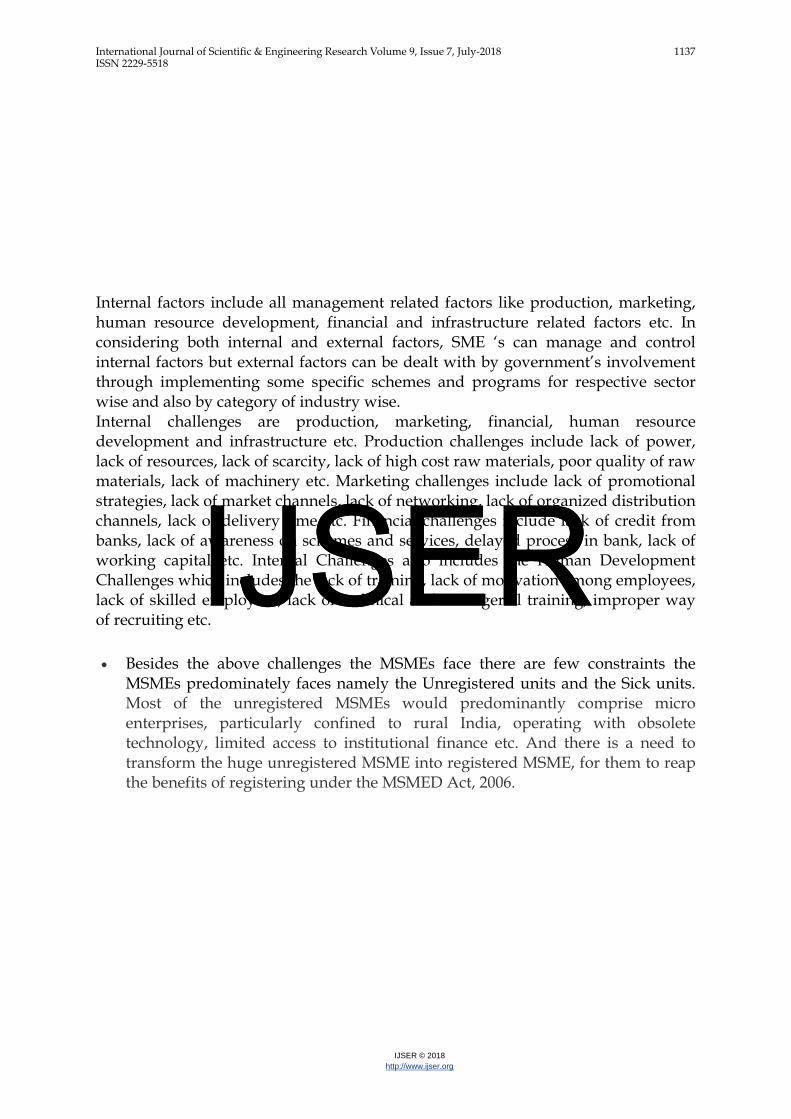
MSMEs predominately faces namely the Unregistered units and the Sick units. Most of the unregistered MSMEs would predominantly comprise micro enterprises, particularly confined to rural India, operating with obsolete technology, limited access to institutional finance etc. And there is a need to transform the huge unregistered MSME into registered MSME, for them to reap the benefits of registering under the MSMED Act, 2006.
IJSERIJSER
International Journal of Scientific & Engineering Research Volume 9, Issue 7, July-2018 1138 ISSN 2229-5518
IJSER © 2018 http://www.ijser.org
FIG: 5.1 GROWTH RATE OF UNREGISTERED ENTERPRISES BY SECTOR
Source: Annual Report 2014-15, Ministry of Small Medium Enterprises
As stated by the RBI, a Micro and Small Enterprise is considered as sick if :-
a) Any of the borrowal account of the enterprise remains NPA for three months or more.
b) There is an erosion in the net worth due to accumulated losses to the extent of 50% of its net worth during the previous accounting year.
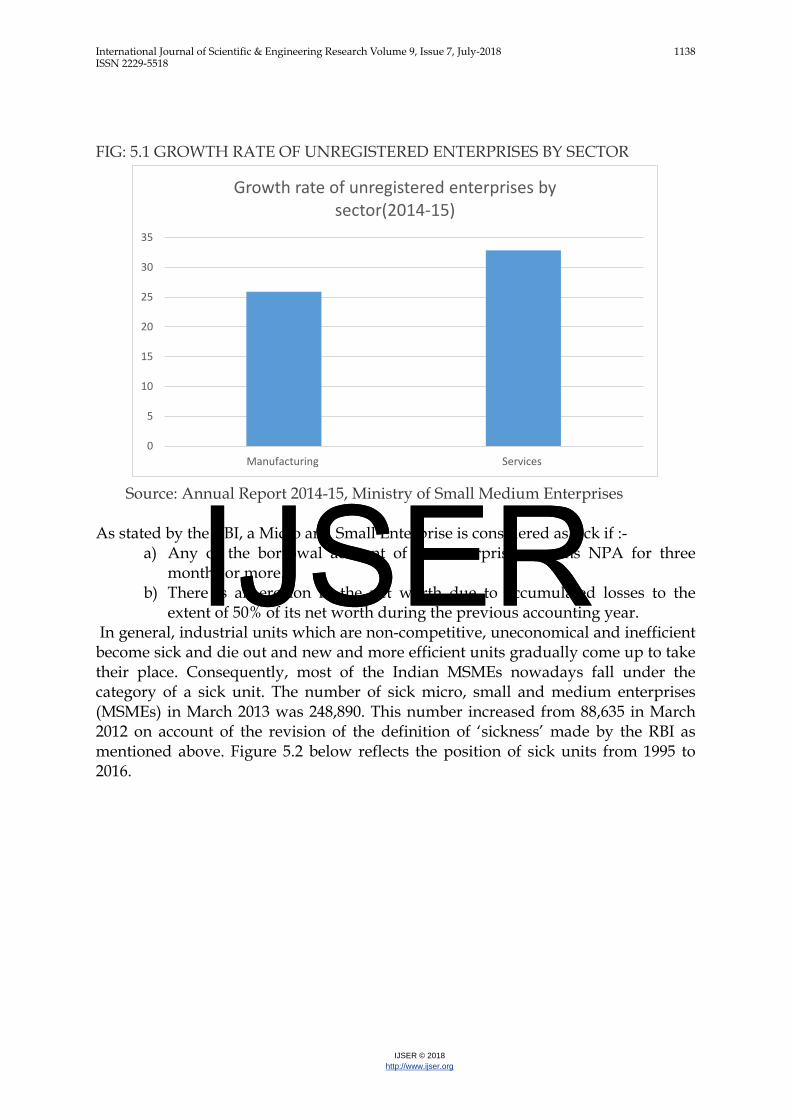
In general, industrial units which are non-competitive, uneconomical and inefficient become sick and die out and new and more efficient units gradually come up to take their place. Consequently, most of the Indian MSMEs nowadays fall under the category of a sick unit. The number of sick micro, small and medium enterprises (MSMEs) in March 2013 was 248,890. This number increased from 88,635 in March 2012 on account of the revision of the definition of ‘sickness’ made by the RBI as mentioned above. Figure 5.2 below reflects the position of sick units from 1995 to 2016.
0
5
10
15
20
25
30
35
Manufacturing Services
Growth rate of unregistered enterprises by sector(2014-15)
IJSERIJSER
International Journal of Scientific & Engineering Research Volume 9, Issue 7, July-2018 1139 ISSN 2229-5518
IJSER © 2018 http://www.ijser.org
FIG: 5.2 POSITION OF SICK UNITS
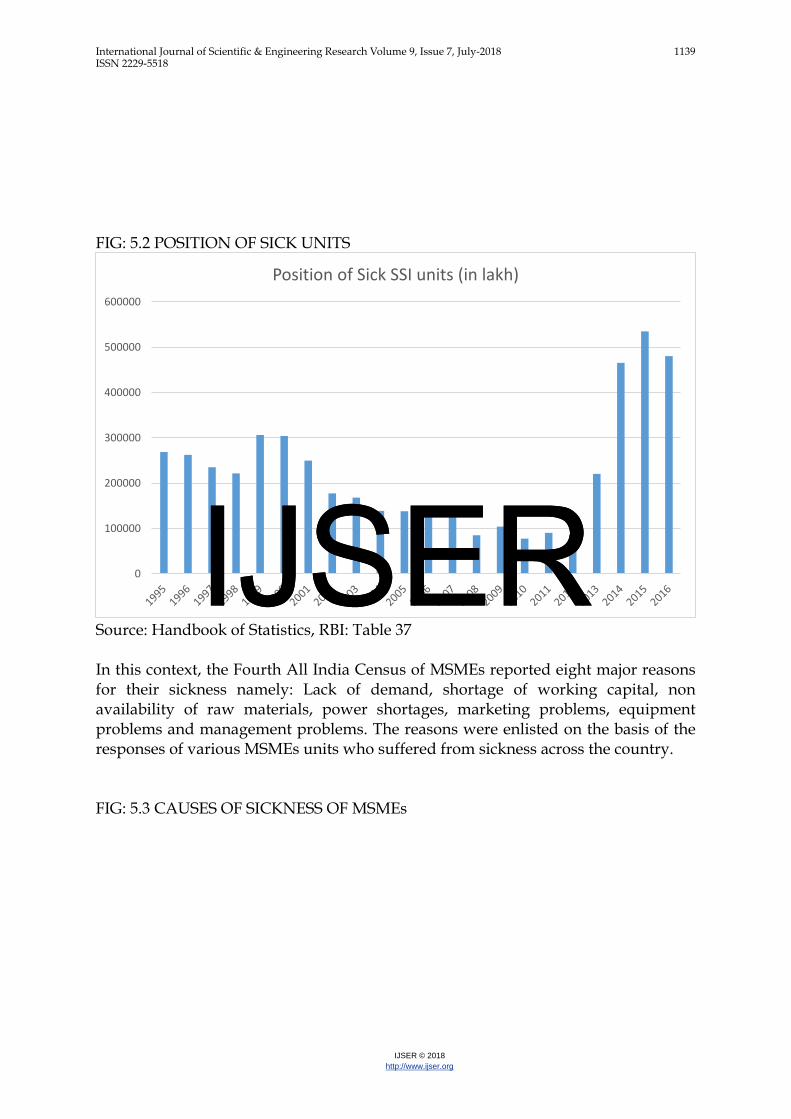
Source: Handbook of Statistics, RBI: Table 37 In this context, the Fourth All India Census of MSMEs reported eight major reasons for their sickness namely: Lack of demand, shortage of working capital, non availability of raw materials, power shortages, marketing problems, equipment problems and management problems. The reasons were enlisted on the basis of the responses of various MSMEs units who suffered from sickness across the country. FIG: 5.3 CAUSES OF SICKNESS OF MSMEs
0
100000
200000
300000
400000
500000
600000
Position of Sick SSI units (in lakh)
IJSERIJSER
International Journal of Scientific & Engineering Research Volume 9, Issue 7, July-2018 1140 ISSN 2229-5518
IJSER © 2018 http://www.ijser.org
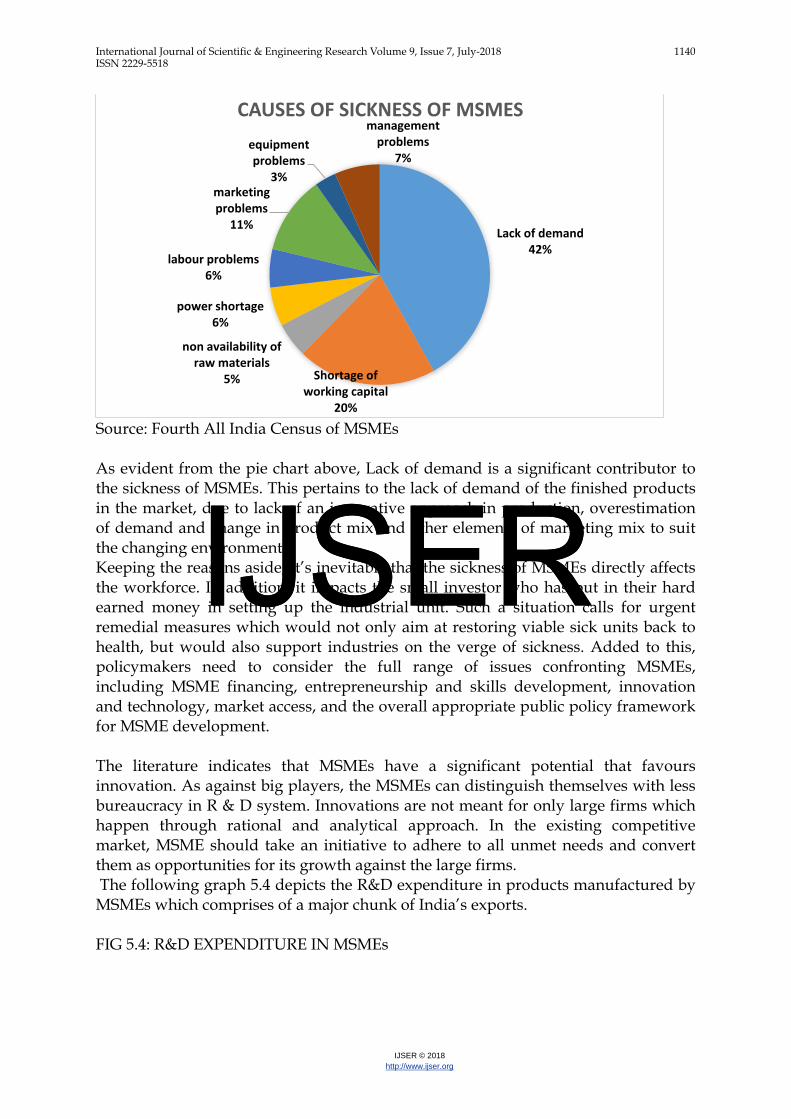
Source: Fourth All India Census of MSMEs As evident from the pie chart above, Lack of demand is a significant contributor to the sickness of MSMEs. This pertains to the lack of demand of the finished products in the market, due to lack of an innovative approach in production, overestimation of demand and change in product mix and other elements of marketing mix to suit the changing environment. Keeping the reasons aside, it’s inevitable that the sickness of MSMEs directly affects the workforce. In addition, it impacts the small investor who has put in their hard earned money in setting up the industrial unit. Such a situation calls for urgent remedial measures which would not only aim at restoring viable sick units back to health, but would also support industries on the verge of sickness. Added to this, policymakers need to consider the full range of issues confronting MSMEs, including MSME financing, entrepreneurship and skills development, innovation and technology, market access, and the overall appropriate public policy framework for MSME development. The literature indicates that MSMEs have a significant potential that favours innovation. As against big players, the MSMEs can distinguish themselves with less bureaucracy in R & D system. Innovations are not meant for only large firms which happen through rational and analytical approach. In the existing competitive market, MSME should take an initiative to adhere to all unmet needs and convert them as opportunities for its growth against the large firms. The following graph 5.4 depicts the R&D expenditure in products manufactured by MSMEs which comprises of a major chunk of India’s exports. FIG 5.4: R&D EXPENDITURE IN MSMEs
Lack of demand 42%
Shortage of working capital
20%
non availability of raw materials
5%
power shortage 6%
labour problems 6%
marketing problems
11%
equipment problems
3%
management problems
7%
CAUSES OF SICKNESS OF MSMES
IJSERIJSER

International Journal of Scientific & Engineering Research Volume 9, Issue 7, July-2018 1141 ISSN 2229-5518
IJSER © 2018 http://www.ijser.org
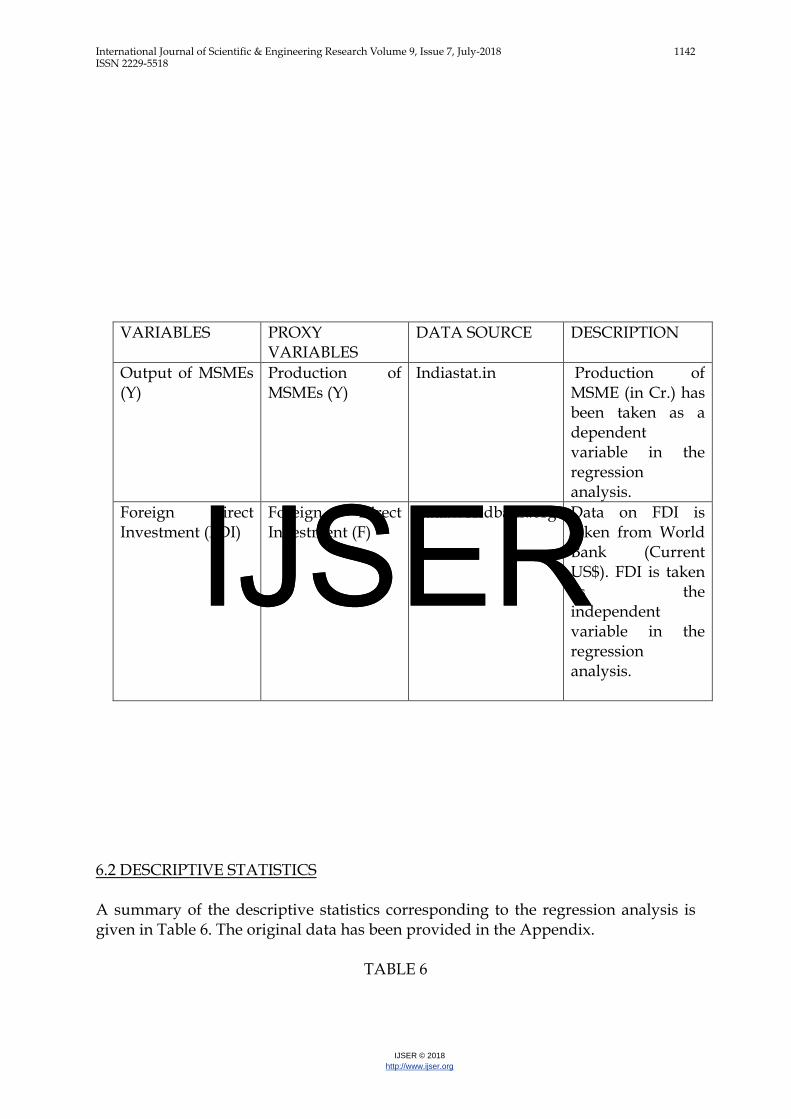
Source: data.gov.in As evident from the graph, this insufficient R&D expenditure is a major constraint to the infrastructural development of MSMEs. In this regard, the presence of Foreign Direct Investment(FDI) can improve infrastructure along with quality of labor force, R&D activities of domestic firms and improve production technology which would have long term positive effects. This relationship between FDI and overall growth of MSMEs has been further justified with an empirical analysis in the next section. 6. ECONOMETRIC ANALYSIS DEPENDENCE OF THE OVERALL PRODUCTION OF MSMEs ON FDI. 6.1 DATA DESCRIPTION A formal definition of the variables used in the empirical study is provided below in Table 5. A regression analysis has been performed showing the relationship between FDI and the overall production of MSMEs.
TABLE 5: DESCRIPTION OF VARIABLES
0
5
10
15
20
25
Engineering goods Basic Pharmaceuiticals
Chemical and allied products
leather products papers and pulps Gems and Jewellery
R&D Expenditure in MSMEs (in cr)
R&D Expenditure (Rs. Crores) in 2007-08 R&D Expenditure (Rs. Crores) in 2008-09
R&D Expenditure (Rs. Crores) in 2009-10
IJSERIJSER
International Journal of Scientific & Engineering Research Volume 9, Issue 7, July-2018 1142 ISSN 2229-5518
IJSER © 2018 http://www.ijser.org
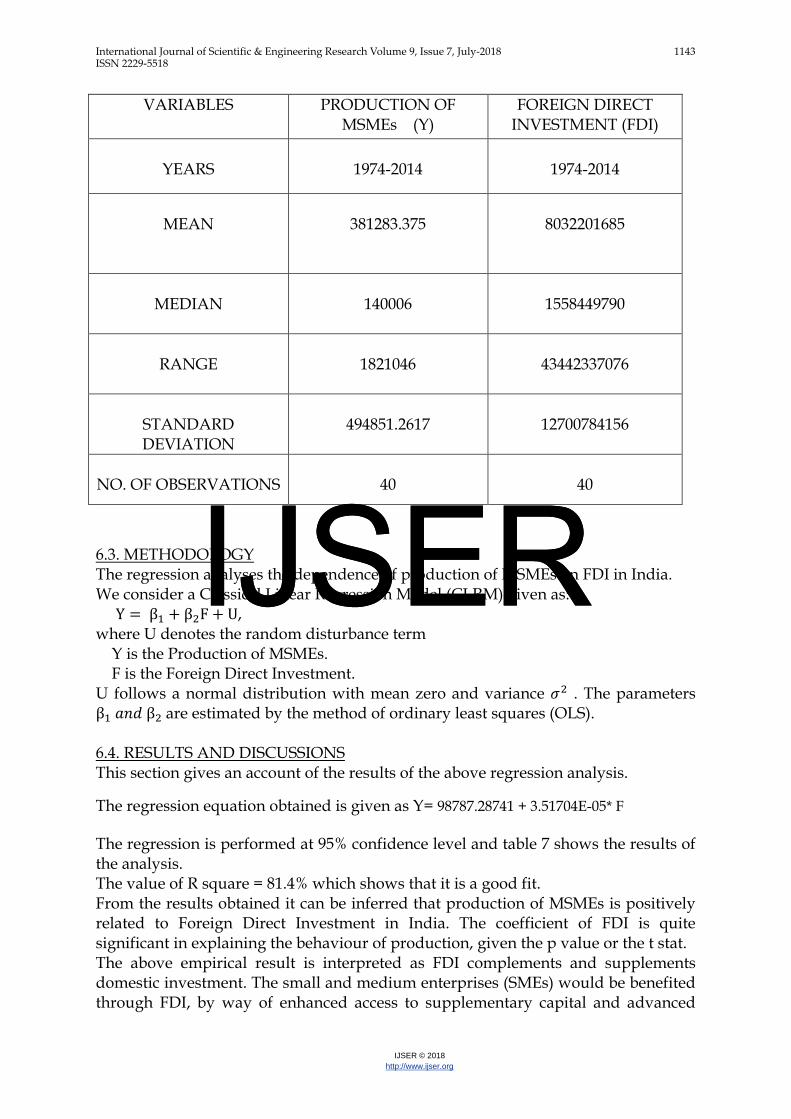
6.2 DESCRIPTIVE STATISTICS A summary of the descriptive statistics corresponding to the regression analysis is given in Table 6. The original data has been provided in the Appendix.
TABLE 6
VARIABLES PROXY VARIABLES
DATA SOURCE DESCRIPTION
Output of MSMEs (Y)
Production of MSMEs (Y)
Indiastat.in Production of MSME (in Cr.) has been taken as a dependent variable in the regression analysis.
Foreign Direct Investment (FDI)
Foreign Direct Investment (F)
data.worldbank.org Data on FDI is taken from World Bank (Current US$). FDI is taken as the independent variable in the regression analysis.
IJSERIJSER
International Journal of Scientific & Engineering Research Volume 9, Issue 7, July-2018 1143 ISSN 2229-5518
IJSER © 2018 http://www.ijser.org
VARIABLES PRODUCTION OF MSMEs (Y)
FOREIGN DIRECT INVESTMENT (FDI)
YEARS
1974-2014
1974-2014
MEAN
381283.375
8032201685
MEDIAN
140006
1558449790
RANGE
1821046
43442337076
STANDARD DEVIATION
494851.2617
12700784156
NO. OF OBSERVATIONS
40
40
6.3. METHODOLOGY The regression analyses the dependence of production of MSMEs on FDI in India. We consider a Classical Linear Regression Model (CLRM) given as: Y = β1 + β2F + U, where U denotes the random disturbance term Y is the Production of MSMEs. F is the Foreign Direct Investment. U follows a normal distribution with mean zero and variance 𝜎2 . The parameters β1 𝑎𝑛𝑑 β2 are estimated by the method of ordinary least squares (OLS). 6.4. RESULTS AND DISCUSSIONS This section gives an account of the results of the above regression analysis.
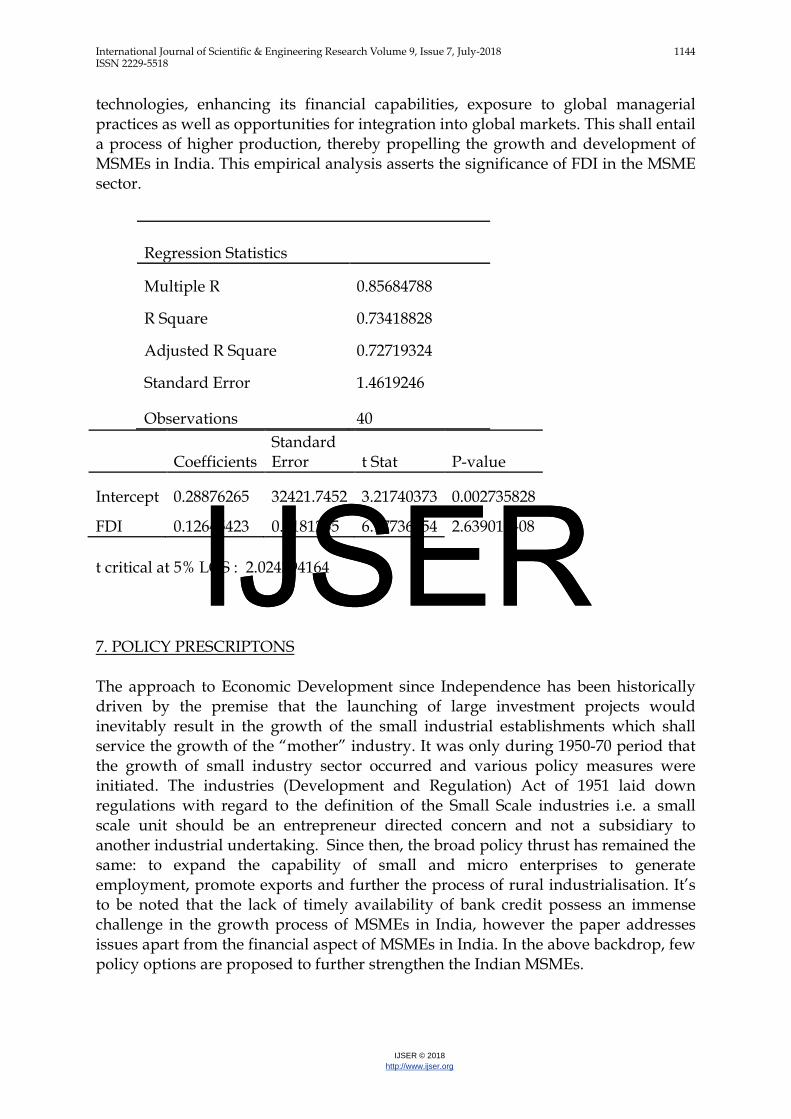
The regression equation obtained is given as Y= 98787.28741 + 3.51704E-05* F The regression is performed at 95% confidence level and table 7 shows the results of the analysis. The value of R square = 81.4% which shows that it is a good fit. From the results obtained it can be inferred that production of MSMEs is positively related to Foreign Direct Investment in India. The coefficient of FDI is quite significant in explaining the behaviour of production, given the p value or the t stat. The above empirical result is interpreted as FDI complements and supplements domestic investment. The small and medium enterprises (SMEs) would be benefited through FDI, by way of enhanced access to supplementary capital and advanced
IJSERIJSER
International Journal of Scientific & Engineering Research Volume 9, Issue 7, July-2018 1144 ISSN 2229-5518
IJSER © 2018 http://www.ijser.org
technologies, enhancing its financial capabilities, exposure to global managerial practices as well as opportunities for integration into global markets. This shall entail a process of higher production, thereby propelling the growth and development of MSMEs in India. This empirical analysis asserts the significance of FDI in the MSME sector.
Coefficients Standard Error t Stat P-value
Intercept 0.28876265 32421.7452 3.21740373 0.002735828
FDI 0.12645423 0.0181235 6.97736254 2.63901E-08 t critical at 5% LOS : 2.024394164 7. POLICY PRESCRIPTONS The approach to Economic Development since Independence has been historically driven by the premise that the launching of large investment projects would inevitably result in the growth of the small industrial establishments which shall service the growth of the “mother” industry. It was only during 1950-70 period that the growth of small industry sector occurred and various policy measures were initiated. The industries (Development and Regulation) Act of 1951 laid down regulations with regard to the definition of the Small Scale industries i.e. a small scale unit should be an entrepreneur directed concern and not a subsidiary to another industrial undertaking. Since then, the broad policy thrust has remained the same: to expand the capability of small and micro enterprises to generate employment, promote exports and further the process of rural industrialisation. It’s to be noted that the lack of timely availability of bank credit possess an immense challenge in the growth process of MSMEs in India, however the paper addresses issues apart from the financial aspect of MSMEs in India. In the above backdrop, few policy options are proposed to further strengthen the Indian MSMEs.
Regression Statistics
Multiple R 0.85684788
R Square 0.73418828
Adjusted R Square 0.72719324
Standard Error 1.4619246
Observations 40
IJSERIJSER

International Journal of Scientific & Engineering Research Volume 9, Issue 7, July-2018 1145 ISSN 2229-5518
IJSER © 2018 http://www.ijser.org
Firstly, given the huge potential of small scale industries in terms of employment and exports, labour plays a key role in furthering the growth of MSMEs. Hence, attracting and retaining the right talent becomes a critical bottleneck for many MSMEs in their future growth. It is indeed ironic that in a nation of more than one billion individuals, skilled labour is cited as scarce. India needs to capitalize on its unique demographic dividend given the huge pool of young workforce. In this context, greater government expenditure on Vocational training and skill development is vital. The following graph throws light on the importance of skill development in the MSME sector and the need to train its abundant skilled manpower. FIG 7.1: INCREMENTAL HUMAN RESOURCE REQUIREMENT IN MSME SECTOR
Source: Forbes India, 2015 According to the 2015 report by Forbes India, it is estimated that by 2022 the number of skilled people required for MSME sector will be around 150 million that is one fourth of the total working population. So it’s the responsibility of the government to ensure implementation of various skill development schemes. Moreover, investments need to be made on a large scale into the domain of skill development. In this regard, greater participation between the public and private sectors is the framework for future which involves long term commitment of resources as well as sharing of risks.
0 10 20 30 40 50 60 70
Textiles and Clothing
Building and construction industry
Auto and Auto components
Real estate services
Gems and jewellery
Leather and Leather goods
Furniture and Furnishings
Electronics and Hardware
Incremental Human Resource Requirement till 2022(in Million)
Employment in 2012 Employment by 2022
26.2
33.0
35.0
14.0
4.7
4.5
3.4
3.
IJSERIJSER
International Journal of Scientific & Engineering Research Volume 9, Issue 7, July-2018 1146 ISSN 2229-5518
IJSER © 2018 http://www.ijser.org
Secondly, the concept of “Cluster Development” offers new insights into the potential role of MSMEs in enhancing their access to new technology and together moving forward by creating an environment for mutual learning. Clusters can be best defined as an agglomeration of small scale industries with concentration of similar related products or that are faced with common opportunities and threat. The success of the UNIDO Cluster development initiative in the knitwear cluster of Ludhiana helped MSMEs overcome major challenges and to meet competition through superior quality and technology upgradation. Moreover, the process of liberalization and market reforms since 1991 has brought about intense competition for MSMEs in both domestic and overseas markets. This has made it imperative for Indian MSMEs to overcome the challenges that they face and maintain, improve and sustain their competitiveness through lower costs, improved quality, making available wider choice by initiating various measures, including innovation and the upgradation of technology. In this regard, FDI can act as a catalyst in transferring techniques for inventory and quality control and can contribute to the overall efficiency of MSMEs. FDI and investments from the private sector can be possible in the sector in the marketing segment, which is currently weak. Moreover, this shall also entail a process of sharing of knowledge, experience and technical expertise, thereby enhancing the growth potential of MSMEs. Policies like Marketing Assistance and technological upgradation scheme, Micro and Small Enterprises Cluster Development Programme, MSME Market development assistance programme etc. were significant steps in this direction, however they haven’t achieved their desired objectives. Indian MSMEs continue to face the problem of infrastructure bottlenecks in terms of a lack of adequate transportation facilities like railways, waterways, roadways and airways, low or no access to a reliable power supply, lack of proper communication channels, inadequate marketing facilities, lack of funds, etc. Hence the key demand of the Indian MSME sector is the availability of adequate infrastructure at reasonable rates. Policy makers need to create an enabling environment by providing adequate infrastructure to attract investments in India, most importantly in the MSME sector. The state governments, along with the industry associations, should involve the private sector in the development of infrastructure in existing industrial estates and clusters and permit the provision of infrastructural services. 8. CONCLUSION In a nutshell we can say that Micro, Small and Medium Enterprises (MSMEs) have emerged as an engine of growth in Indian economy. They have emerged as a vibrant and dynamic component of the economy by virtue of their significant contribution to GDP, industrial production and exports. However, the most important contribution of this sector is towards employment generation which is second only to agriculture in India. The experiences of recent years show that employment in agriculture sector has been declining as well as large industries are also experiencing jobless growth. In
IJSERIJSER
International Journal of Scientific & Engineering Research Volume 9, Issue 7, July-2018 1147 ISSN 2229-5518
IJSER © 2018 http://www.ijser.org
such a situation, the main responsibility for job creation rests with unorganized sector. Undoubtedly, the MSME sector has the huge potential to contribute in the course of time to making India a 20 trillion-dollar economy. But in order to unleash the growth potential of this sector, there are some stark issues and challenges which need to be resolved first. Despite various incentives and facilities being provided to Indian MSMEs, they are losing their economic strength and emanating signals of large-scale sickness. Thus, more efforts are needed for reviving and promoting the Indian MSME sector. The efficiency and competitiveness of this sector can be improved through continuous technology innovation; quality improvement; easy access to finance, better infrastructural facilities, and upgrading skills. Thus, the paper tries to posit that addressing only the financing constraints in isolation is not enough. In light of the CAGR analysis which suggests the lacklustre performance of MSMEs in the post reform period, It’s important that in addressing the constraints that MSMEs face, there should be a more focused and sustained intervention to prepare the MSMEs for the challenges ahead and to take full advantages of the liberalised trade environment. The econometric analysis also highlights the role of FDI in ensuring higher productivity. Hence, it is not the choice between regulatory and promotional policies but the balance between the two and their overall effectiveness that shall determine the future of the MSME sector in India. REFERENCES
1. Mohan, Rakesh. 2006. Small scale industry policy in India: A critical evaluation. In A.O. Krueger (Ed.), Economic policy reform and the Indian economy.
2. Ghatak, Shambhu. "Micro, small and medium enterprises (MSMEs) in India: an appraisal." 2010. Journal of technology management & innovation 6.1: 66-76.
3. Goyal K.A et al. An Overview of Sickness in Micro, Small & Medium Enterprises in India. 2012. Pacific Business Review International. Vol. 5, Issue 5: 29-35
4. Govt. of India, 2016-17. Ministry of Micro, Small and Medium Enterprises, Annual Report.
5. Kumar, Pankaj. 2014. An Empirical Study on Performance of Indian MSME. Asia-Pacific Journal of Management Research and Innovation. Vol. 10 : 367–375
6. Venkatesh, Sudha et al. 2012. SMEs in India: Importance and Contribution. Asian Journal Of Management Research. Vol.2, Issue 2.
7. Singh Sumanjeet, Paliwal Minakshi. 2017. Unleashing The Growth Potential Of Indian MSME Sector. Comparative Economic Research, Vol.20: 36-52
8. Micro, Small and Medium Enterprises in India. 2017. Taxmann Publications, Indian Institute of Banking and Finance, Mumbai.
IJSERIJSER
International Journal of Scientific & Engineering Research Volume 9, Issue 7, July-2018 1148 ISSN 2229-5518
IJSER © 2018 http://www.ijser.org
9. Handbook of Statistics, Reserve Bank of India. 10. Annual Survey Reports, Ministry of Micro and Small Medium Enterprises,
Govt. of India.
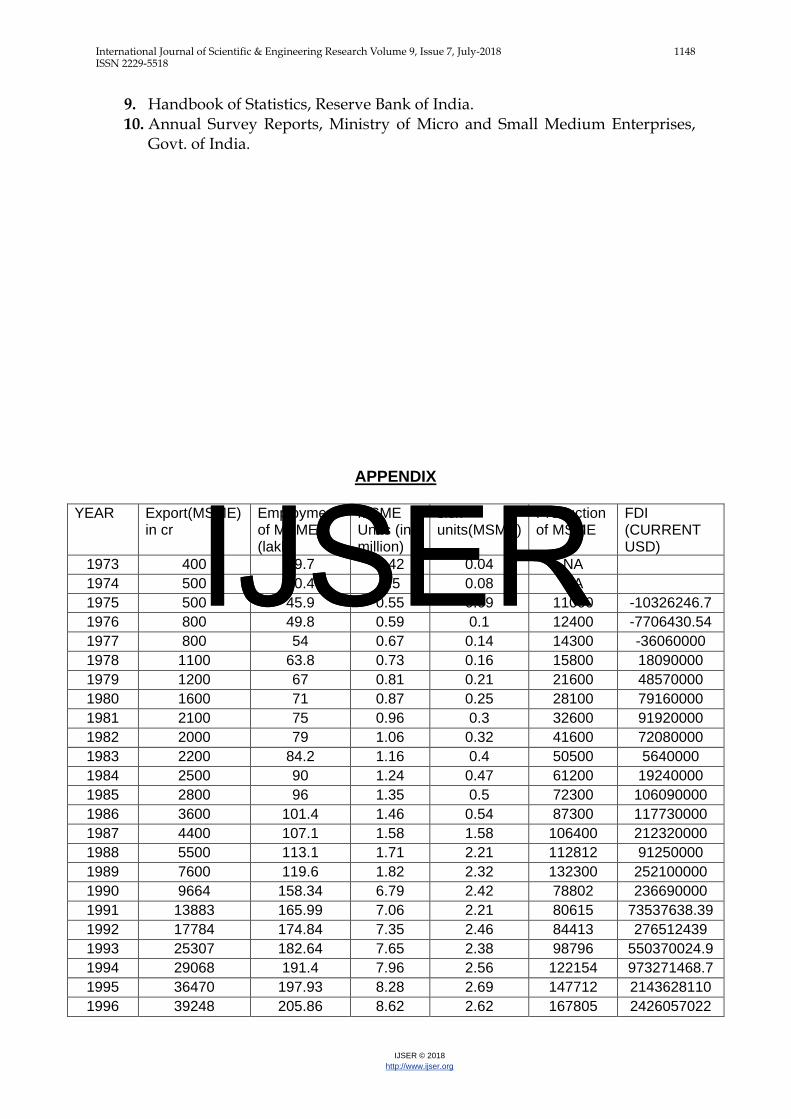
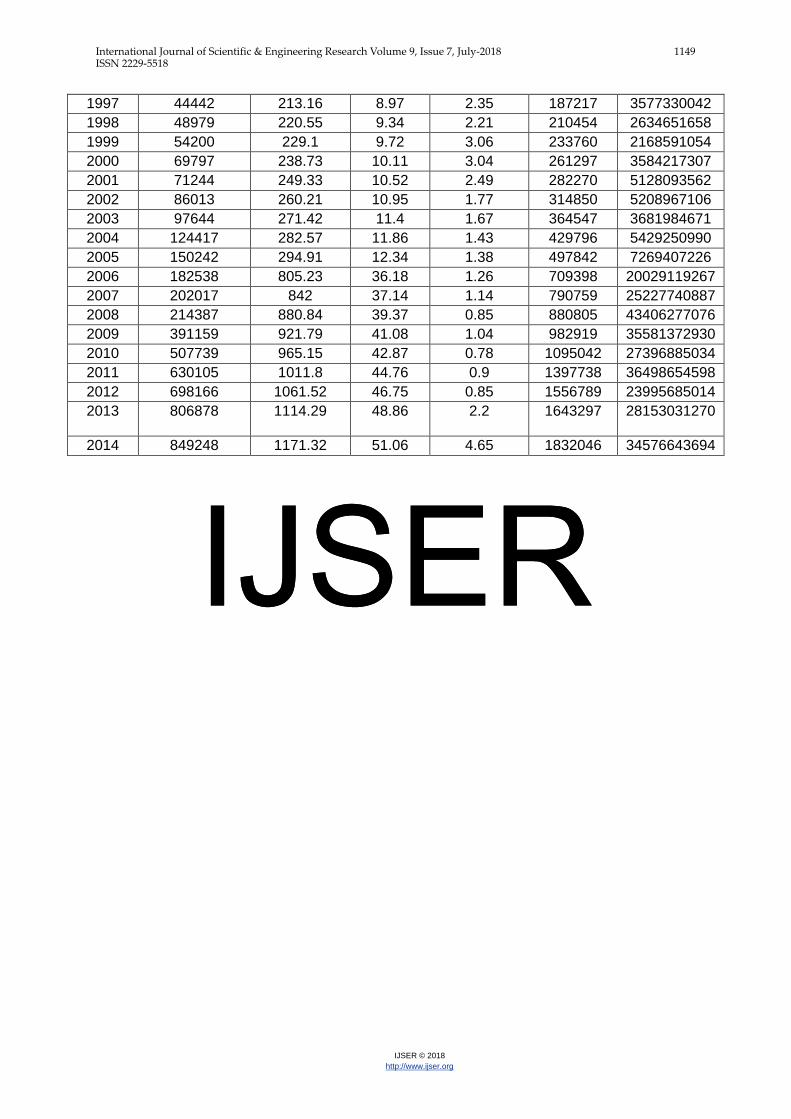
APPENDIX
YEAR Export(MSME) in cr
Employment of MSME (lakh)
MSME Units (in million)
sick units(MSME)
Production of MSME
FDI (CURRENT USD)
1973 400 39.7 0.42 0.04 NA 1974 500 40.4 0.5 0.08 NA 1975 500 45.9 0.55 0.09 11000 -10326246.7 1976 800 49.8 0.59 0.1 12400 -7706430.54 1977 800 54 0.67 0.14 14300 -36060000 1978 1100 63.8 0.73 0.16 15800 18090000 1979 1200 67 0.81 0.21 21600 48570000 1980 1600 71 0.87 0.25 28100 79160000 1981 2100 75 0.96 0.3 32600 91920000 1982 2000 79 1.06 0.32 41600 72080000 1983 2200 84.2 1.16 0.4 50500 5640000 1984 2500 90 1.24 0.47 61200 19240000 1985 2800 96 1.35 0.5 72300 106090000 1986 3600 101.4 1.46 0.54 87300 117730000 1987 4400 107.1 1.58 1.58 106400 212320000 1988 5500 113.1 1.71 2.21 112812 91250000 1989 7600 119.6 1.82 2.32 132300 252100000 1990 9664 158.34 6.79 2.42 78802 236690000 1991 13883 165.99 7.06 2.21 80615 73537638.39 1992 17784 174.84 7.35 2.46 84413 276512439 1993 25307 182.64 7.65 2.38 98796 550370024.9 1994 29068 191.4 7.96 2.56 122154 973271468.7 1995 36470 197.93 8.28 2.69 147712 2143628110 1996 39248 205.86 8.62 2.62 167805 2426057022
IJSERIJSER
International Journal of Scientific & Engineering Research Volume 9, Issue 7, July-2018 1149 ISSN 2229-5518
IJSER © 2018 http://www.ijser.org
1997 44442 213.16 8.97 2.35 187217 3577330042 1998 48979 220.55 9.34 2.21 210454 2634651658 1999 54200 229.1 9.72 3.06 233760 2168591054 2000 69797 238.73 10.11 3.04 261297 3584217307 2001 71244 249.33 10.52 2.49 282270 5128093562 2002 86013 260.21 10.95 1.77 314850 5208967106 2003 97644 271.42 11.4 1.67 364547 3681984671 2004 124417 282.57 11.86 1.43 429796 5429250990 2005 150242 294.91 12.34 1.38 497842 7269407226 2006 182538 805.23 36.18 1.26 709398 20029119267 2007 202017 842 37.14 1.14 790759 25227740887 2008 214387 880.84 39.37 0.85 880805 43406277076 2009 391159 921.79 41.08 1.04 982919 35581372930 2010 507739 965.15 42.87 0.78 1095042 27396885034 2011 630105 1011.8 44.76 0.9 1397738 36498654598 2012 698166 1061.52 46.75 0.85 1556789 23995685014 2013 806878 1114.29 48.86 2.2 1643297 28153031270
2014 849248 1171.32 51.06 4.65 1832046 34576643694
IJSERIJSER