Mick Buffier - World Coal Association
32
The essential role of coal and low emission coal technology Mick Buffier Chairman
-
Upload
informa-australia -
Category
Business
-
view
720 -
download
0
Transcript of Mick Buffier - World Coal Association

The essential role of coal and low emission coal technology
Mick Buffier
Chairman

Some Opening Questions1. Under the IEA Scenario matched closest to national COP 21 INDC’s, what % do fossil fuels contribute to the energy mix now and expected to be in 2040?
2. Similar for the electricity mix, for coal and non-hydro renewables?
3. What % contribution does Australia make up of world coal production?A) > 50%B) > 25%C) > 10%D) < 10%
4. Who produces more coal – Australia in total or one company, Coal India Ltd?
5. Name Australia’s 3 top export revenue earners in FY 05 and FY15?
6. In August approximately what contribution did coal make in the energy mix in each of NSW,
Qld and Vic?A) < 40%B) > 40%C) > 70%D) > 90%
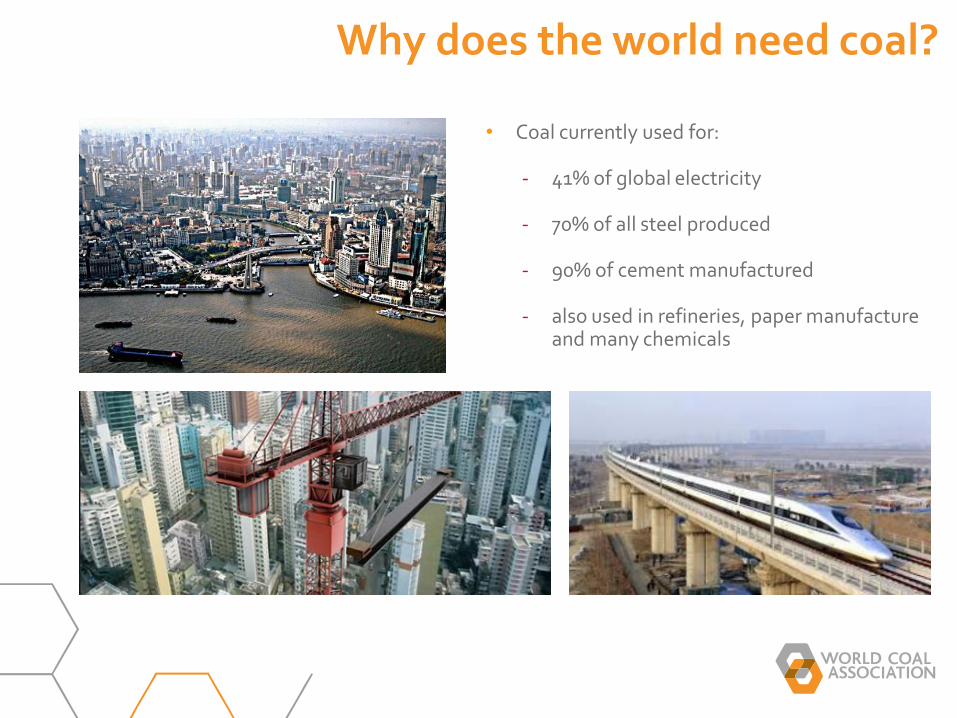
Why does the world need coal?
• Coal currently used for:
- 41% of global electricity
- 70% of all steel produced
- 90% of cement manufactured
- also used in refineries, paper manufacture and many chemicals
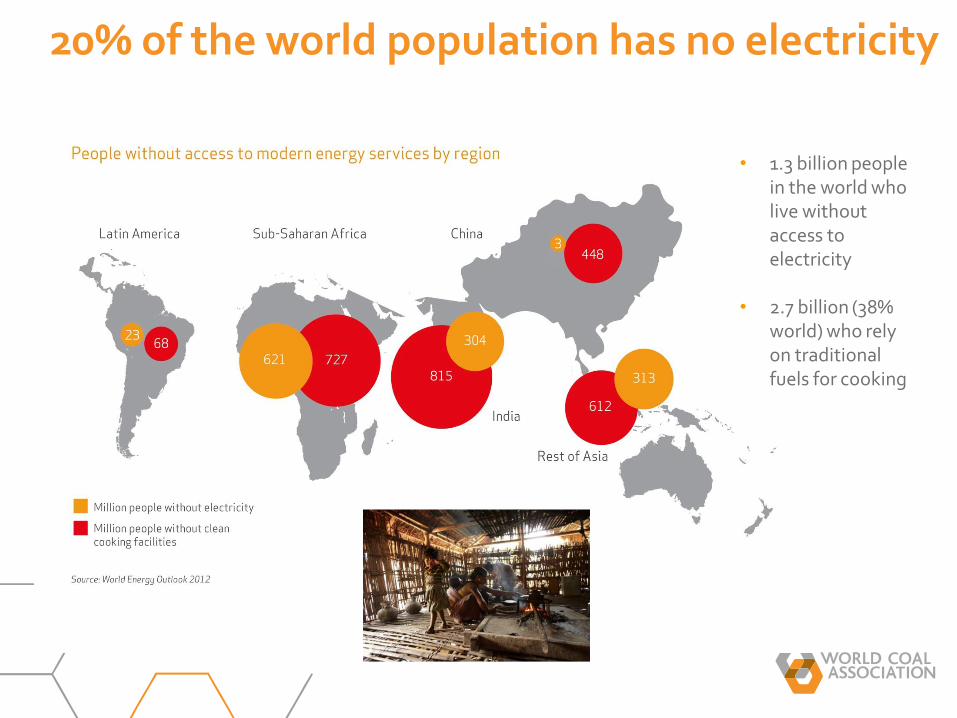
• 1.3 billion people in the world who live without access to electricity
• 2.7 billion (38% world) who rely on traditional fuels for cooking
20% of the world population has no electricity

Coal is part of the Paris Agreement
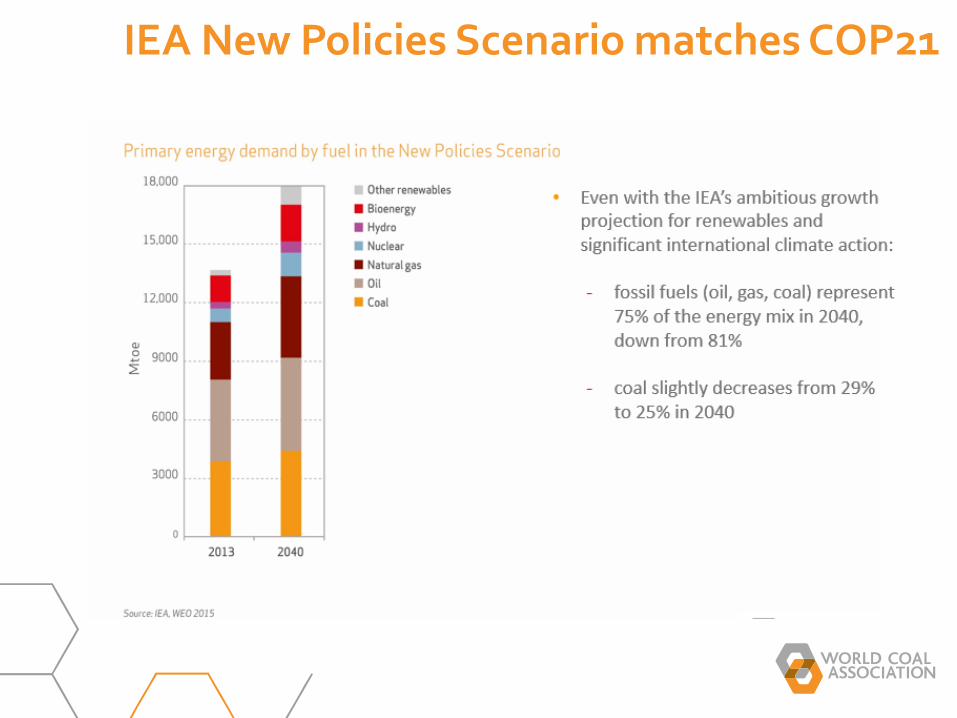
IEA New Policies Scenario matches COP21

Coal continues to grow, even as share declines

Asia will drive new coal generation capacity
Asian share of global coal power generation capacity:
2000 – 38%
2015 – 69%
2040 – 77%
Will require an additional 1 billion tonnes per annum of coal

Coal generation 2015 increases across Asia

IEA - infrastructure costs favour coal power over gas for Asian energy importers
Coal and gas-fired power investment in Asian markets (2015)
• “Asian markets comprised 85% of global coal powered investment, while N. America and Middle East with robust infrastructure favoured gas over coal”IEA World Energy Investment, London 16 Sept 2016

Large-scale power generation will be a critical enabler of growth in India
Electricity demand in India is expected to average 4.4% pa over the next 25 years
While coal generation capacity more than doubles, renewables are required to increase exponentially (non-hydro renewables over 10 times) to meet demand
IEA indicates that maintaining an adequate electricity supply represents a significant investment challenge requiring $2 trillion (in 2013 dollars)
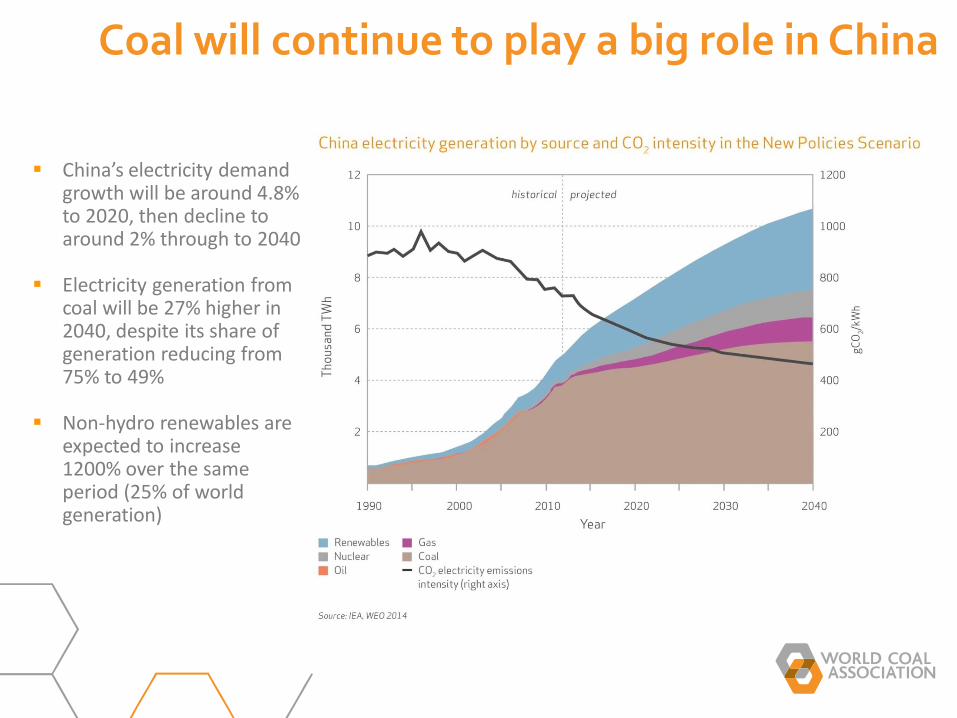
Coal will continue to play a big role in China
China’s electricity demand growth will be around 4.8% to 2020, then decline to around 2% through to 2040
Electricity generation from coal will be 27% higher in 2040, despite its share of generation reducing from 75% to 49%
Non-hydro renewables are expected to increase 1200% over the same period (25% of world generation)
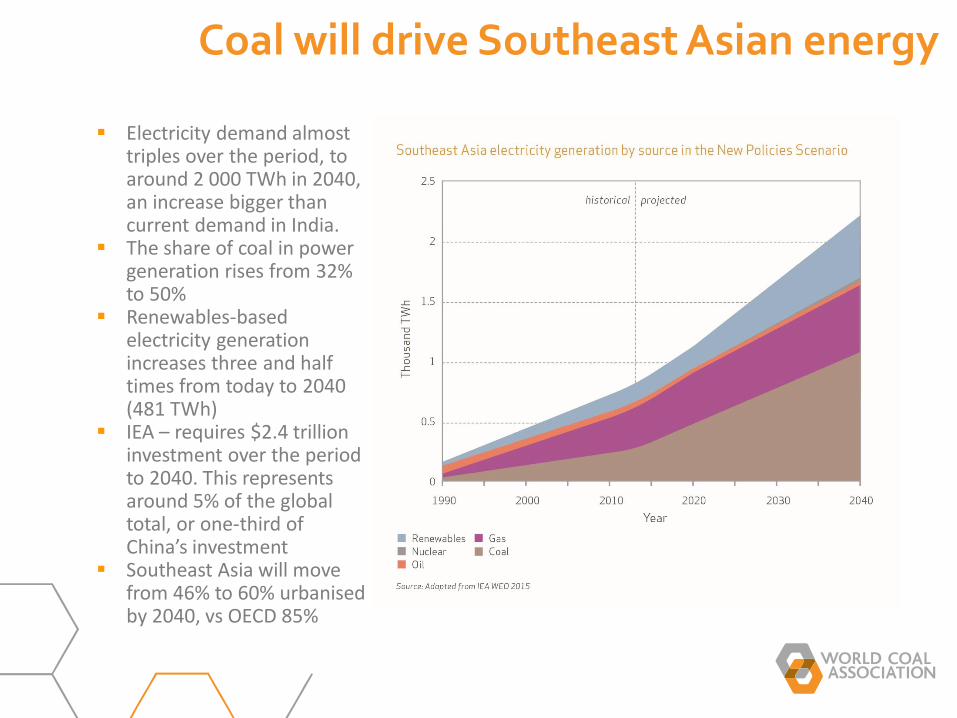
Coal will drive Southeast Asian energy
Electricity demand almost triples over the period, to around 2 000 TWh in 2040, an increase bigger than current demand in India.
The share of coal in power generation rises from 32% to 50%
Renewables-based electricity generation increases three and half times from today to 2040 (481 TWh)
IEA – requires $2.4 trillion investment over the period to 2040. This represents around 5% of the global total, or one-third of China’s investment
Southeast Asia will move from 46% to 60% urbanised by 2040, vs OECD 85%

HELE must be the global standard for coal
Japan and China have been the most active in building USC plants
J-Power upgraded their 1967 sub-critical Isogo 38% efficient coal-fired power plant to an USC 43% efficiency plant with SOx, NOx, PM reduced to less than 1/3 of previous levels
China’s Ninghai plant has a capacity of 4,400MW and China is relying on these larger, advanced units for dispatch to displace higher emission from older, less efficient power stations
The units have integrated advanced air quality control systems, yielding non-carbon air emissions well below China’s latest more stringent standards, and also below comparable standards in North America and Europe
WCA wants to see more action on HELE

Coal plant development mix of HELE

China committed to HELE, others less so

Non-OECD Asia needs to make HELE switch

HELE is cost competitive today…

… and in the future (and so is coal+CCS)

HELE in India – meeting twin objectives

HELE in India – examining the impact

WCA supports coordinated international action
International platform to help drive deployment of HELE technologies in developing and emerging economies
Public private partnership to overcome financial, technical and regulatory barriers
Currently seeking partners to help build an initial alliance

CCS is critical to global climate objectives
CCS is expected to deliver 12% of cumulative GHG emissions cuts through to 2050. It is therefore a key low-carbon technology
The world’s first large scale integrated CCS project capturing CO2 from a coal-fired power plant – SaskPower’s Boundary Dam – has just started full scale operation at the end of September 2014

Why CCS has been slow to progress
1%

CCS needs policy parity with renewables
• In the period 2007 to 2016, value of global policy support for renewable energy deployment was around US$800B.
• Total value of policy support for deployment of CCS over all time is around $20B
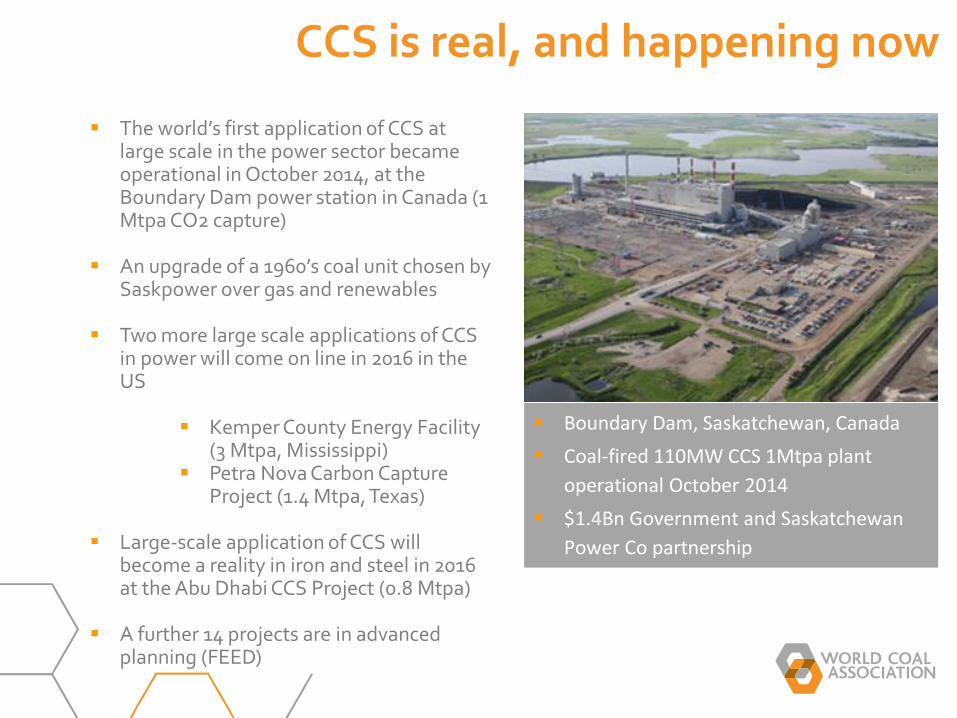
CCS is real, and happening now
Boundary Dam, Saskatchewan, Canada
Coal-fired 110MW CCS 1Mtpa plant
operational October 2014
$1.4Bn Government and Saskatchewan
Power Co partnership
The world’s first application of CCS at large scale in the power sector became operational in October 2014, at the Boundary Dam power station in Canada (1 Mtpa CO2 capture)
An upgrade of a 1960’s coal unit chosen by Saskpower over gas and renewables
Two more large scale applications of CCS in power will come on line in 2016 in the US
Kemper County Energy Facility (3 Mtpa, Mississippi)
Petra Nova Carbon Capture Project (1.4 Mtpa, Texas)
Large-scale application of CCS will become a reality in iron and steel in 2016 at the Abu Dhabi CCS Project (0.8 Mtpa)
A further 14 projects are in advanced planning (FEED)

In summary – the WCA view
We must recognise that coal is an important driver of affordable, reliable energy to support economic development and competitiveness
Coal plays a major role in industrialising and urbanising economies
In any scenario coal is still going to play a major role in the world’s energy mix – especially across Asia
We can significantly reduce emissions from coal with commercially available technology today – we should encourage and support deployment of HELE technologies in preference of less efficient technologies
More public support is needed to facilitate increased commercial demonstration of CCS to drive costs down so that we can begin a transition toward near-zero emission fossil fuels
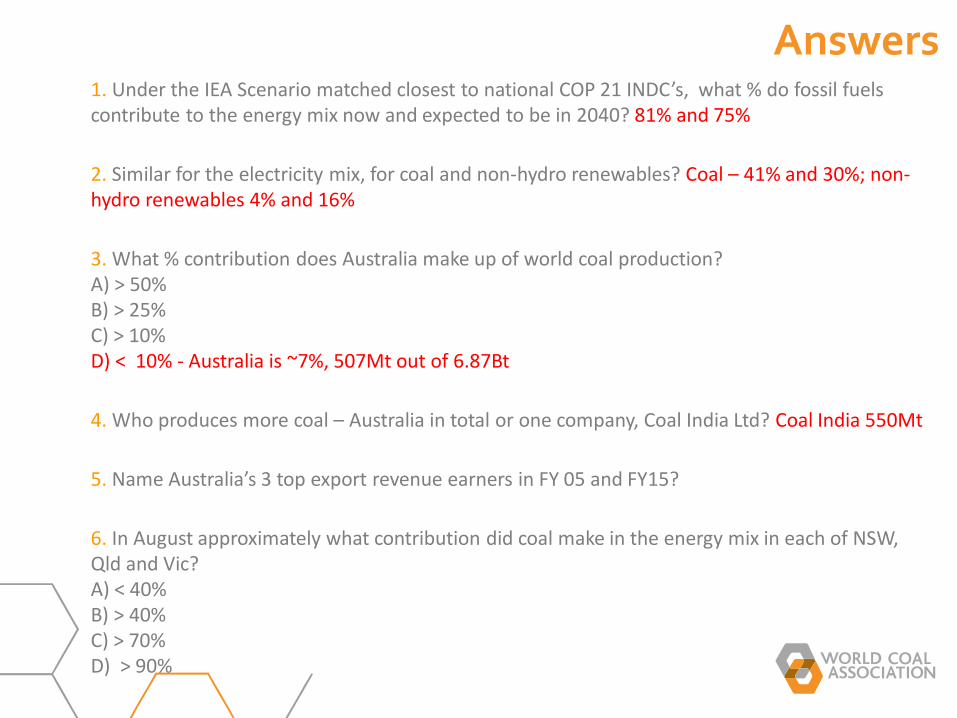
Answers1. Under the IEA Scenario matched closest to national COP 21 INDC’s, what % do fossil fuels contribute to the energy mix now and expected to be in 2040? 81% and 75%
2. Similar for the electricity mix, for coal and non-hydro renewables? Coal – 41% and 30%; non-hydro renewables 4% and 16%
3. What % contribution does Australia make up of world coal production?A) > 50%B) > 25%C) > 10%D) < 10% - Australia is ~7%, 507Mt out of 6.87Bt
4. Who produces more coal – Australia in total or one company, Coal India Ltd? Coal India 550Mt
5. Name Australia’s 3 top export revenue earners in FY 05 and FY15?
6. In August approximately what contribution did coal make in the energy mix in each of NSW, Qld and Vic?A) < 40%B) > 40%C) > 70%D) > 90%

Name Australia’s 3 top export revenue earners in FY 05 and FY15?

Q6. Recent COAG energy statement emphasised gas, renewables & batteries; coal not mentioned
Sunday 15 August 2016
At 10.10pm EST Sunday, sun’s long down, wind’s died away, the NSW load is 7,571 MW. Black
coal is meeting 7,389 MW of it — or 97.6%. Just 12 Mw of wind, 89 MW of hydro and 81 MW
of gas.
Meanwhile in Queensland, where the load is 6,614 MW, fossil-fuelled plant (coal plus gas) is
6,528 MW = 98.7% (of which the coal load is 5,953 MW or 90%).
Down in Victoria, where the load is 6,099 MW and wind and hydro between them are
contributing 552 MW, the brown coal capacity in use is 5,547 MW = 90.9 %
And over West, where it is just after 7pm, the SWIS load is 2,587 MW — of which fossil fuels are
meeting 94% (black coal 1,394 MW and gas 1,040 MW) versus 136 MW of wind and 1 MW of
rooftop solar.