Michigan's Economic Outlook and Budget Review - May 2013
70
Ellen Jeffries, Director – Lansing, Michigan – (517) 373-2768 www.senate.michigan.gov/sfa Senate Fiscal Agency MICHIGAN'S ECONOMIC OUTLOOK AND BUDGET REVIEW FY 2012-13, FY 2013-14 AND FY 2014-15 May 13, 2013
Transcript of Michigan's Economic Outlook and Budget Review - May 2013

Ellen Jeffries, Director – Lansing, Michigan – (517) 373-2768 www.senate.michigan.gov/sfa
Sen
ate
Fis
cal A
gen
cy
MICHIGAN'S ECONOMIC OUTLOOK AND BUDGET REVIEW
FY 2012-13, FY 2013-14
AND FY 2014-15
May 13, 2013

THE SENATE FISCAL AGENCY
The Senate Fiscal Agency is governed by a board of five members, including the majority and minority leaders of the Senate, the Chairperson of the Appropriations Committee of the Senate, and two other members of the Appropriations Committee of the Senate appointed by the Chairperson of the Appropriations Committee with the concurrence of the Majority Leader of the Senate, one from the minority party.
The purpose of the Agency, as defined by statute, is to be of service to the Senate Appropriations Committee and other members of the Senate. In accordance with this charge, the Agency strives to achieve the following objectives:
1. To provide technical, analytical, and preparatory support for all appropriations bills.
2. To provide written analyses of all Senate bills, House bills, and Administrative Rules considered by the Senate.
3. To review and evaluate proposed and existing State programs and services.
4. To provide economic and revenue analysis and forecasting.
5. To review and evaluate the impact of Federal budget decisions on the State.
6. To review and evaluate State issuance of long-term and short-term debt.
7. To review and evaluate the State's compliance with constitutional and statutory fiscal requirements.
8. To prepare special reports on fiscal issues as they arise and at the request of members of the Senate.
The Agency is located on the 8th floor of the Victor Office Center. The Agency is an equal opportunity employer.
Ellen Jeffries, Director Senate Fiscal Agency
P.O. Box 30036 Lansing, Michigan 48909-7536
Telephone (517) 373-2768
Internet Home Page http://www.senate.michigan.gov/sfa

ACKNOWLEDGEMENT This Economic Outlook and Budget Review was prepared and written by Ellen Jeffries, Director, and David Zin, Chief Economist, of the Senate Fiscal Agency. Karen Hendrick, Executive Secretary and Administrative Assistant, coordinated the production of this report.


TABLE OF CONTENTS Page EXECUTIVE SUMMARY .................................................................................................... 1 ECONOMIC REVIEW AND OUTLOOK ............................................................................. 3 RECENT U.S. ECONOMIC HIGHLIGHTS .................................................................... 3 FORECAST SUMMARY ............................................................................................... 8 FORECAST RISKS ...................................................................................................... 10 THE FORECAST FOR STATE REVENUE ........................................................................ 15 REVENUE OVERVIEW ................................................................................................ 15 FY 2012-13 REVISED REVENUE ESTIMATES ........................................................... 19 FY 2013-14 REVISED REVENUE ESTIMATES ........................................................... 23 FY 2014-15 REVISED REVENUE ESTIMATES ........................................................... 26 MAJOR GENERAL FUND AND SCHOOL AID FUND TAXES IN FY 2012-13 THROUGH FY 2014-15 ................................................................................................ 28 REVENUE TRENDS .................................................................................................... 30 SENATE FISCAL AGENCY BASELINE REVENUE FORECAST HISTORY ................. 31 BUDGET STABILIZATION FUND ..................................................................................... 33 COMPLIANCE WITH STATE REVENUE LIMIT ................................................................ 36 THE REVENUE LIMIT .................................................................................................. 36 REQUIREMENTS IF REVENUE LIMIT IS EXCEEDED ................................................ 36 REVENUE LIMIT COMPLIANCE PROJECTIONS ........................................................ 37 ESTIMATE OF YEAR-END BALANCES ........................................................................... 39 FY 2012-13 YEAR-END BALANCE .............................................................................. 41 FY 2013-14 YEAR-END BALANCE .............................................................................. 44 FY 2014-15 BUDGET OUTLOOK ................................................................................. 48 CONCLUSION ............................................................................................................. 50


EX
EC
UT
IVE
SU
MM
AR
Y


1
EXECUTIVE SUMMARY ECONOMIC FORECAST The U.S. economy, as measured by inflation-adjusted gross domestic product, after growing 2.2% during 2012, is predicted to expand 1.7% in 2013, 2.4% in 2014, and 2.7% in 2015. Light vehicle sales are forecasted to rise from 14.4 million units in 2012, to 15.1 million units in 2013, 15.3 million units in 2014, and 15.5 million units in 2015. The unemployment rate is expected to fall from 8.1% in 2012 to 7.7% in 2013, 7.0% in 2014, and 6.4% in 2015; while the consumer price index is estimated to increase 1.8% in 2013, 2.5% in 2014, and 2.1% in 2015. The Michigan economy, as measured by inflation-adjusted personal income, is estimated to grow 0.6% in 2013, 1.9% in 2014, and 1.8% in 2015, after rising 1.4% in 2012. Wage and salary employment is predicted to continue growing, increasing 1.2% during 2013, 0.8% in 2014, and 0.5% in 2015. REVENUE FORECAST In fiscal year (FY) 2012-13, the economy will grow more slowly than in FY 2011-12, resulting in slower revenue growth. General Fund/General Purpose (GF/GP) and School Aid Fund (SAF) revenue will total an estimated $20.5 billion, 1.6% above the FY 2011-12 level and $541.9 million above the January 2013 consensus estimate. Reflecting a combination of temporary behavioral changes in response to the uncertainty on Federal fiscal policy at the end of 2012 and tax changes enacted during 2011 and 2012, General Fund/General Purpose revenue is expected to decrease 0.2% from the FY 2011-12 level to $9.2 billion while SAF revenue is projected to increase 3.1% to $11.2 billion. In FY 2013-14, GF/GP and SAF revenue will total an estimated $20.9 billion, up 2.3% from FY 2012-13 and $243.4 million above the January 2013 consensus estimate. General Fund/General Purpose revenue will total an estimated $9.5 billion, an increase of 2.6% from FY 2012-13 that largely reflects changes in tax policy, while SAF revenue will rise to an estimated $11.5 billion, a 2.2% increase. In FY 2014-15, GF/GP and SAF revenue will total an estimated $21.6 billion, up 3.1% from FY 2013-14 and $182.4 million above the January 2013 consensus estimate. General Fund/General Purpose revenue will total an estimated $9.8 billion, an increase of 3.2% from FY 2013-14, while SAF revenue will rise to an estimated $11.8 billion, a 3.0% increase. YEAR-END BALANCE ESTIMATES Based on the revised Senate Fiscal Agency (SFA) revenue estimates and enacted and projected appropriations, the SFA is estimating that the FY 2012-13 GF/GP budget will have a positive ending balance of $592.5 million. A comparison of the FY 2012-13 SAF revenue estimates and enacted and projected SAF appropriations produces a $146.8 million SAF surplus. Comparing the SFA's FY 2013-14 revenue estimate with the appropriation bills as passed by the Senate (and the Senate Appropriations Community Health Subcommittee recommendation for the Department of Community Health), leads to a $252.7 million positive balance in the FY 2013-14 GF/GP budget. The SFA's FY 2013-14 SAF revenue estimate, combined with the Senate-passed SAF appropriations, results in a $165.9 million SAF surplus. If the SFA's FY 2014-15 GF/GP revenue estimate is compared with the FY 2013-14 Senate appropriation recommendations, adjusted for caseload changes and an economic factor of 1.8%, there is a projected $60.3 million budget surplus. If the SFA's 2014-15 SAF revenue estimate is compared with the FY 2013-14 Senate-passed SAF appropriations adjusted for FY 2014-15 estimated pupils and other costs, there is a projected $122.4 million SAF surplus.

2
EXECUTIVE SUMMARY
SENATE FISCAL AGENCY ECONOMIC AND BUDGET SUMMARY
ECONOMIC PROJECTIONS (Calendar Year)
2011 Actual
2012 Actual
2013 Estimate
2014 Estimate
2015 Estimate
Real Gross Domestic Product (% change) 1.8% 2.2% 1.7%
2.4% 2.7%
U.S. Consumer Price Index (% change) 3.2% 2.1% 1.8% 2.5% 2.1% Light Motor Vehicle Sales (millions of units) 12.7 14.4 15.1 15.3 15.5 U.S. Unemployment Rate (%) 8.9% 8.1% 7.7% 7.0% 6.4% Real Michigan Personal Income (% change) 2.3% 1.4% 0.6% 1.9% 1.8% Michigan Wage & Salary Employment (% chng) 2.3% 1.8% 1.2% 0.8% 0.5%
REVENUE ESTIMATES
GENERAL FUND/GENERAL PURPOSE (GF/GP) AND SCHOOL AID FUND (SAF)
(Millions of Dollars)
FY 2012-13 Estimate FY 2013-14 Estimate FY 2014-15 Estimate
Baseline
Tax Changes
Net Available
Baseline
Tax Changes
Net Available
Baseline
Tax Changes
Net Available
GF/GP $9,803.9 ($559.8) $9,244.2 $9,929.6 ($448.2) $9,481.4 $10,159.3 ($374.1) $9,785.2 % Change 6.9% (0.2%) 1.3% 2.6% 2.3% 3.2% School Aid Fund $11,946.6 ($729.1) $11,217.6 $12,180.6 ($721.7) $11,458.9 $12,539.1 ($733.2) $11,805.9 % Change 2.9% 3.1% 2.0% 2.2% 2.9% 3.0% Total GF/GP & SAF $21,750.6 ($1,288.8) $20,461.8 $22,110.3 ($1,169.9) $20,940.3 $22,698.4 ($1,107.3) $21,591.1 % Change 4.7% 1.6% 1.7% 2.3% 2.7% 3.1% Revenue Limit - Under (Over) $6,989.0 $7,531.1 $7,588.6 FY 2012-13 Estimate FY 2013-14 Estimate FY 2014-15 Estimate
Revision from Jan. Consensus
GF/GP ........................................ SAF ............................................ Total ..........................................
$452.0 89.9 $541.9
$217.0 26.4 $243.4
$145.3 37.1 $182.4
YEAR-END BALANCE ESTIMATES
(Fiscal Year, Millions of Dollars)
FY 2012-13 Estimate
FY 2013-14 Estimate
FY 2014-15 Estimate
General Fund/General Purpose .............................................................................................................................
$592.5
$252.7
$60.3
School Aid Fund ..................................................................................................................................................... 146.8 165.9 122.4 Budget Stabilization Fund....................................................................................................................................... 508.8 516.4 524.1

EC
ON
OM
IC R
EV
IEW
AN
D O
UT
LO
OK


3
ECONOMIC REVIEW AND OUTLOOK State revenue, particularly tax revenue, depends heavily on economic conditions. This section presents the Senate Fiscal Agency's (SFA's) latest economic forecast for 2013, 2014, and 2015, as well as a summary of recent economic activity. RECENT U.S. ECONOMIC HIGHLIGHTS Since the 2008-2009 recession, generally regarded as the most severe economic contraction in more than 70 years, the economy has grown slowly and many fundamental elements of the economy remain well below their prerecession peaks, or even below historical averages. Inflation-adjusted Gross Domestic Product (GDP) in the first quarter of 2013 was only 3.2% above the level during the fourth quarter of 2007, when the recession began, and only 8.3% above the level in the second quarter of 2009, when the economy finished contracting. As a result, the economy has averaged only 2.1% annual growth since the end of the recession, compared with an average of 3.3% annual growth over the 1960-2007 period, and 3.8% average annual growth over the 1991-1999 period. Consumption has grown somewhat, averaging annual growth of 2.1%, but this growth has been partially offset by the contracting government sector, which has declined approximately 1.2% per year at the Federal level and 2.0% per year at the state and local levels. Consumption growth has remained weak for a variety of reasons, and a substantial portion of any gains in spending has reflected increased purchases of motor vehicles. Consumers have remained risk averse about spending, especially for other big-ticket items and nonessential purchases, as employment growth has remained weak and wage increases have been negligible. Motor vehicle purchases have been an exception due to factors ranging from rising fuel costs' encouraging the purchase of more fuel-efficient vehicles to the marked increase in the age of the vehicle fleet. The housing market also improved substantially in 2012, although it remains weak by almost any historical measure (Figure 1). Housing starts in 2012 grew 28.2% compared with the 2011 level but, despite the increases, 2012 represented the fourth-weakest year of housing starts (based on data available back to 1959) and was 23.0% below the lowest year before the 2008-2009 recession. Despite the weakness in overall consumer spending, spending continues rising at a faster rate than income. Since the second quarter of 2009, personal income has risen at an average annual rate of 1.7% per year, while wage and salary income has averaged 1.1% annual growth (Figure 2). As a result, a meaningful portion of the growth in consumption has been financed by reduced savings and increased consumer debt. Outstanding consumer debt has increased 15.9% since the third quarter of 2010, and at an annual rate of 6.8% during the fourth quarter of 2012 (Figure 3). Consumer debt per person rose 5.0% between the fourth quarter of 2011 and the fourth quarter of 2012, compared with growth in personal income per person of 4.1%. At the same time, personal saving as a share of disposable personal income (which represents income after most taxes, other than sales taxes and payroll taxes such as payments to social security and Medicare) declined from 5.1% in 2010 to 3.9% in 2012. Notwithstanding the growth in the economy, a number of fundamental indicators still exhibit limited, if any, improvement. Payroll employment continued to decline for months after the end of the recession in June 2009, falling by approximately 1.3 million jobs by February 2010. Despite gains during 2012, March 2013 employment remained 2.7 million jobs (2.0%) below the January 2008 peak, and employment has averaged only 1.5% annual growth since the February 2010 trough. During 2011 and 2012, monthly gains in payroll employment averaged

4
179,000 per month, less than the average monthly increase in the civilian noninstitutional population from which the labor force is measured. As a result, although the unemployment rate declined from 9.3% in 2009 to 8.1% in 2012, the decline was driven significantly by reduced labor force participation, which declined from approximately 66.0% before the recession to 63.3% during the first quarter of 2013 (Figure 4).
Figure 1
Figure 2
1995Q11998Q1
2001Q12004Q1
2007Q12010Q1
2013Q1
0
500
1,000
1,500
2,000
2,500
2%
3%
4%
5%
6%
7%
Housing Starts (Y1)Residential Investment, Share of GDP (Y2)
Housing's Weak Recovery
Source: Census Bureau and Bureau of Economic Analysis, U.S. Dept. of Commerce
1994Q11997Q1
2000Q12003Q1
2006Q12009Q1
2012Q1
60
70
80
90
100
110
Inflation Adjusted Personal Consumption ExpendituresInflation Adjusted Wage and Salary Income
During Current Recovery
Spending Growing Faster Than Wage Income
Source: Bureau of Economic Analysis, U.S. Department of Commerce

5
Figure 3
Figure 4
Other indicators provide a mixed view of the economy, and a view that suggests the economy is still growing but more slowly than in the last two years. While new orders for manufactured goods (excluding defense-related orders) rose 13.0% between 2010 and 2011, new orders increased only 2.8% in 2012 and orders in March 2013 were up only 0.6% from the prior-year level. Similarly, the Institute for Supply Management manufacturing index declined in three of the last four months, and while the index remains about 50 (the level indicating expansion in the manufacturing sector), over the last 12 months it has averaged 51.3, down from 55.2 during 2011. The index for the nonmanufacturing sector also decreased in three of the last four
2008Q12008Q4
2009Q32010Q2
2011Q12011Q4
2012Q3
-6.0%
-4.0%
-2.0%
-0.0%
2.0%
4.0%
6.0%
8.0%
Consumer Credit Per PersonPersonal Income Per Person
For The Last Eight Consecutive Quarters
Consumer Credit Debt Rising Faster Than Income
Source: U.S. Bureau of Economic Analysis and Federal Reserve Board of Governors
19761978
19801982
19841986
19881990
19921994
19961998
20002002
20042006
20082010
2012
55.0
57.5
60.0
62.5
65.0
67.5
70.0
Michigan U.S.
Labor Force Participation at Lowest Levels in Decades
Source: Bureau of Labor Statistics, U.S. Department of Labor

6
months, but remains above 50. Despite slower economic activity, corporate profits remain strong, growing 6.8% in 2012 and reaching an all-time record high (in both nominal and inflation-adjusted terms) in the fourth quarter of 2012, exceeding $2.0 trillion (Figure 5).
Figure 5
Several economic indicators currently exhibit conditions that have both positive and negative implications, and exhibit strength for some aspects of the economy but not for others. Productivity, as measured by output per worker, increased more rapidly in 2012, rising from 0.8% annual growth in 2011 to 0.9% in 2012. However, during the first quarter of 2013, productivity increased at a 1.5% annual rate. Productivity gains increase output and income, but reduce the need for additional workers. Details for selected economic indicators are presented in Table 1 and Table 2. Michigan's economy spent the 2000-2010 period in recession, largely driven by the same fundamental restructuring that affected manufacturing globally. Manufacturing experienced a significant surge in productivity over that time period, driven by increased competition in the economy. For Michigan, the effect of productivity improvements was substantial, particularly given that there was more room for improvement in the durable goods and motor vehicle manufacturing sectors than in many other sectors, that Michigan was, and remains, very disproportionately concentrated in motor vehicle manufacturing, and that the motor vehicle industries have become one of the most competitive sectors of the economy. For Michigan, those factors were complicated as General Motors, Ford, and Chrysler lost market share over most of the last decade, leaving Michigan to lose employment from both productivity and reduced demand. The impact on the Michigan economy was exacerbated by the rapid and drastic decline in automobile sales in late 2008 and during 2009, reflecting national collapses in sectors such as construction, real estate, and finance.
However, the drag from the manufacturing sector on Michigan's economy appears to have bottomed out and the recovery in vehicle sales nationally has helped Michigan's economic situation. Manufacturing employment in Michigan rose by 87,900 jobs (20.0%) between June 2009, when the U.S. recession ended, and January 2012. During most of 2012, payroll
1951Q11957Q1
1963Q11969Q1
1975Q11981Q1
1987Q11993Q1
1999Q12005Q1
2011Q1
0
$500
$1,000
$1,500
$2,000
2.0%
3.5%
5.0%
6.5%
8.0%
9.5%
11.0%
12.5%
14.0%
Corporate Profits (All Sectors) (Y1)Corp. Profits (Share of Gross Domestic Product) (Y2)
New Record High in Fourth Quarter of 2012
Inflation-Adjusted Corporate Profits
Source: Bureau of Economic Analysis, U.S. Dept. of Commerce

7
employment changed little, although, on a seasonally adjusted basis, Michigan payroll employment increased by 32,800 jobs between March 2012 and March 2013; with 47.9% of the net gains attributable to the manufacturing sector. The unemployment rate declined from a high of 14.2% in August 2009 to 9.2% in January 2012, although the decline was more attributable to the departure of more than 171,000 individuals from the labor force than to the employment gain of less than 85,000. Since January 2012, the unemployment rate has remained relatively flat, in a range between 8.9% and 9.3%.
Table 1
THE SENATE FISCAL AGENCY ECONOMIC FORECAST (Calendar Years)
2011 Actual
2012 Actual
2013 Estimate
2014 Estimate
2015 Estimate
United States Nominal GDP (year-to-year growth) 4.0% 4.0% 3.2% 4.2% 4.7% Inflation-Adjusted GDP (year-to-year growth) 1.8% 2.2% 1.7% 2.4% 2.7% Unemployment Rate 8.9% 8.1% 7.7% 7.0% 6.4% Inflation Consumer Price Index (year-to-year growth) 3.2% 2.1% 1.8% 2.5% 2.1% GDP Implicit Price Deflator (year-to-year growth) 2.1% 1.8% 1.6% 1.8% 2.0% Interest Rates 90-day Treasury Bill 0.05% 0.09% 0.13% 0.18% 0.22% 10-year Treasury Bill 2.78% 1.80% 2.18% 2.61% 2.83% Corporate Aaa Bond 4.64% 3.67% 3.94% 4.12% 4.20% Federal Funds Rate 0.10% 0.14% 0.17% 0.21% 0.32% Light Motor Vehicle Sales (millions of units) 12.7 14.4 15.1 15.3 15.5 Auto 6.2 7.4 7.8 7.8 7.9 Truck 6.5 7.1 7.4 7.5 7.6 Import Share 23.0% 22.1% 22.0% 22.5% 22.6% Michigan Personal Income (millions) $358,152 $370,599 $379,736 $393,911 $408,745 Year-to-year growth 5.6% 3.5% 2.5% 3.7% 3.8% Inflation-Adjusted Personal Income (year-to-year growth) 2.3% 1.4% 0.6% 1.9% 1.8% Wage & Salary Income (millions) $183,000 $189,121 $194,143 $198,685 $203,758 Year-to-year growth 5.5% 3.3% 2.7% 2.3% 2.6% Detroit Consumer Price Index (year-to-year growth) 3.3% 2.0% 1.9% 1.8% 1.9% Wage & Salary Employment (thousands) 3,951.8 4,024.2 4,073.3 4,106.8 4,128.0 Year-to-year growth 2.3% 1.8% 1.2% 0.8% 0.5% Unemployment Rate 10.4% 9.1% 8.7% 8.4% 8.2%

8
Table 2
THE SENATE FISCAL AGENCY U.S. ECONOMIC FORECAST DETAIL (Calendar Years)
2011 Actual
2012 Actual
2013 Estimate
2014 Estimate
2015 Estimate
Gross Domestic Product (billions of dollars) $15,075.7 $15,684.8 $16,191.5 $16,870.3 $17,667.6 Year-to-year growth 4.0% 4.0% 3.2% 4.2% 4.7% Inflation-Adjusted GDP and Components Gross Domestic Product (billions of 2005 dollars) $13,299.1 $13,593.2 $13,818.1 $14,144.9 $14,522.2 Year-to-year growth 1.8% 2.2% 1.7% 2.4% 2.7% Consumption (billions of 2005 dollars) $9,428.8 $9,603.3 $9,804.8 $10,012.3 $10,254.4 Year-to-year growth 2.5% 1.9% 2.1% 2.1% 2.4% Business Fixed Investment (billions of 2005 dollars) $1,378.2 $1,487.9 $1,564.7 $1,666.7 $1,783.4 Year-to-year growth 8.6% 8.0% 5.2% 6.5% 7.0% Change in Business Inventories (billions of 2005 dollars) $31.0 $43.0 $38.3 $41.2 $39.9 Residential Investment (billions of 2005 dollars) $327.6 $367.1 $422.3 $482.1 $518.7 Year-to-year growth -1.4% 12.1% 15.0% 14.2% 7.6% Government Spending (billions of 2005 dollars) $2,523.9 $2,481.1 $2,462.6 $2,452.6 $2,458.8 Year-to-year growth -3.1% -1.7% -0.7% -0.4% 0.3% Net Exports (billions of 2005 dollars) ($408.0) ($400.7) ($403.7) ($405.1) ($401.5) Exports (billions of 2005 dollars) $1,776.9 $1,837.3 $1,883.7 $1,987.1 $2,107.0 Imports (billions of 2005 dollars) $2,184.9 $2,238.0 $2,287.4 $2,392.2 $2,508.5 Personal Income (year-to-year growth) 5.2% 3.5% 2.8% 5.0% 5.2% Adjusted for Inflation 2.0% 1.4% 1.0% 2.4% 3.1% Wage & Salary Income (year-to-year growth) 4.0% 3.3% 2.9% 4.3% 5.1% Personal Saving Rate 4.2% 3.9% 2.2% 2.6% 3.2% Capacity Utilization Rate 76.5% 77.6% 78.7% 79.5% 80.0% Housing Starts (millions of units) 0.609 0.781 1.051 1.180 1.266 Conventional Mortgage Rates 4.5% 3.7% 3.7% 4.1% 4.4% Federal Budget Surplus (billions of dollars, NIPA basis) ($1,339.4) ($1,211.0) ($872.1) ($690.3) ($641.4) FORECAST SUMMARY During 2013, both the U.S. and Michigan economies are expected to expand at a slightly slower rate than during 2012. Both the U.S. and Michigan economies are forecast to exhibit both income and employment growth during 2013, although Michigan is expected to grow more slowly than the nation as a whole. Table 1 and Table 2 provide a summary of key economic indicators from the SFA's economic forecast, with references to recent years. Inflation-adjusted GDP is projected to rise 1.7% in 2013, a rate slightly lower than the 2.2% increase in 2012. The economy then will begin to grow more rapidly, with inflation-adjusted

9
GDP rising 2.4% during 2014 and 2.7% in 2015. The expansion over the forecast period primarily reflects improvements in business investment and residential investment that will more than offset the drag on the economy from a declining public sector.
Employment gains over the forecast period will be muted, particularly compared with prior recoveries, because while productivity growth is expected to be less than what was exhibited during the last decade, consumer demand is not likely to grow much more rapidly than productivity. Furthermore, business investment is expected to continue to focus on equipment and software, which generally replaces capital for labor, although investment in structures, which represents new facilities, is also expected to exhibit significant growth. The U.S. unemployment rate is expected to decrease from 8.1% during 2012 to 7.7% in 2013, 7.0% in 2014, and 6.4% in 2015. Inflation is not anticipated to be a concern over the forecast period, despite the assumption of high (but only slowly increasing) energy prices and a decline in the value of the dollar over the forecast period. The U.S. Consumer Price Index (CPI) is anticipated to increase 1.8% in 2013, followed by increases of 2.5% in 2014 and 2.1% in 2015. Export growth is expected to be tempered by slower economic growth overseas, particularly due to recessionary or near-recessionary economic conditions in Europe, and slower growth in China. As foreign economies improve later in the forecast period, the twin gains of healthier export markets and continued declines in the value of the dollar will improve U.S. exports. Productivity, weak domestic consumer demand, and substantial weakness in the labor market will help keep labor costs low, with unit labor costs expected to increase 0.7% in 2013, before rising 1.3% in 2014 and 1.8% in 2015. In Michigan, both job growth and personal income growth are expected to remain below the national average (despite outperforming the national average in both 2010 and 2011) and the historical State average prior to 2000 (Figures 6 and 7). Inflation-adjusted personal income is projected to increase only 0.6% in 2013, before growing by 1.9% in 2014 and 1.8% in 2015. Payroll employment is expected to increase 1.2% in 2013, after rising 1.8% during 2012, and then increase 0.8% in 2014 and 0.5% in 2015. Private sector gains in employment during 2013 and 2014 are expected to be partially offset by declines in public sector employment, as State and local governments experience continued budgetary problems. Nationally, light vehicle sales are expected to increase from 14.4 million units in 2012 to 15.1 million units in 2013, 15.3 million units in 2014, and 15.5 million units in 2015. In Michigan, higher vehicle sales, stability in the housing market, and an improved national economy are expected to allow the unemployment rate to slowly decline, from 8.7% in 2013 to 8.4% in 2014, and 8.2% in 2015. Compared with the January 11, 2013, Consensus Economic Forecast, both the U.S. and Michigan forecasts are slightly weaker in both 2013 and 2014. Weak employment growth, weak income growth, and slowdowns in overseas economies will temper the pace of the U.S. and Michigan recoveries during the forecast period. Improved vehicle sales and stronger profitability in Michigan's vehicle sector will provide stability to the Michigan employment situation as the government sector contracts.

10
Figure 6
Figure 7
FORECAST RISKS Forecasting the behavior of the economy requires making assumptions about the behavior of certain key economic variables. As a result, all forecasts carry a certain amount of error. However, unexpected changes in economic fundamentals often represent the greatest source of error. The challenge for the current forecast is to determine when the economy will complete the adjustments required to exhibit consistent economic growth. Such turning points are difficult to predict and adjustments after financial collapses such as occurred during the 2008-2009
19791981
19831985
19871989
19911993
19951997
19992001
20032005
20072009
20112013
2015
80
90
100
110
120
130
140
150
160U.S.Michigan
U.S. and Michigan Wage and Salary Employment
2013, 2014,& 2015
Estimated
Source: U.S. Department of Labor and the Senate Fiscal Agency
19791981
19831985
19871989
19911993
19951997
19992001
20032005
20072009
20112013
2015
-10%
-5%
0
5%
10%Michigan U.S.
Adjusted for Inflation
U.S. and Michigan Personal Income Growth
2013, 2014,& 2015
Estimated
Source: U.S. Department of Commerce and the Senate Fiscal Agency
11
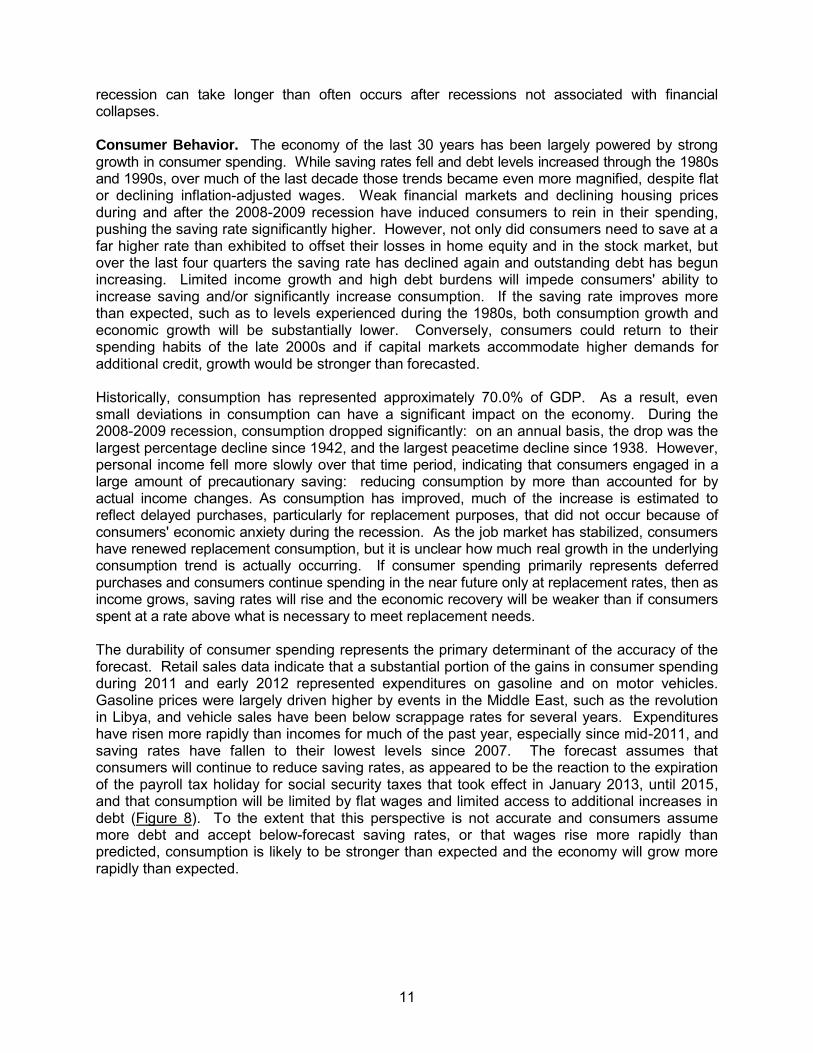
recession can take longer than often occurs after recessions not associated with financial collapses. Consumer Behavior. The economy of the last 30 years has been largely powered by strong growth in consumer spending. While saving rates fell and debt levels increased through the 1980s and 1990s, over much of the last decade those trends became even more magnified, despite flat or declining inflation-adjusted wages. Weak financial markets and declining housing prices during and after the 2008-2009 recession have induced consumers to rein in their spending, pushing the saving rate significantly higher. However, not only did consumers need to save at a far higher rate than exhibited to offset their losses in home equity and in the stock market, but over the last four quarters the saving rate has declined again and outstanding debt has begun increasing. Limited income growth and high debt burdens will impede consumers' ability to increase saving and/or significantly increase consumption. If the saving rate improves more than expected, such as to levels experienced during the 1980s, both consumption growth and economic growth will be substantially lower. Conversely, consumers could return to their spending habits of the late 2000s and if capital markets accommodate higher demands for additional credit, growth would be stronger than forecasted. Historically, consumption has represented approximately 70.0% of GDP. As a result, even small deviations in consumption can have a significant impact on the economy. During the 2008-2009 recession, consumption dropped significantly: on an annual basis, the drop was the largest percentage decline since 1942, and the largest peacetime decline since 1938. However, personal income fell more slowly over that time period, indicating that consumers engaged in a large amount of precautionary saving: reducing consumption by more than accounted for by actual income changes. As consumption has improved, much of the increase is estimated to reflect delayed purchases, particularly for replacement purposes, that did not occur because of consumers' economic anxiety during the recession. As the job market has stabilized, consumers have renewed replacement consumption, but it is unclear how much real growth in the underlying consumption trend is actually occurring. If consumer spending primarily represents deferred purchases and consumers continue spending in the near future only at replacement rates, then as income grows, saving rates will rise and the economic recovery will be weaker than if consumers spent at a rate above what is necessary to meet replacement needs. The durability of consumer spending represents the primary determinant of the accuracy of the forecast. Retail sales data indicate that a substantial portion of the gains in consumer spending during 2011 and early 2012 represented expenditures on gasoline and on motor vehicles. Gasoline prices were largely driven higher by events in the Middle East, such as the revolution in Libya, and vehicle sales have been below scrappage rates for several years. Expenditures have risen more rapidly than incomes for much of the past year, especially since mid-2011, and saving rates have fallen to their lowest levels since 2007. The forecast assumes that consumers will continue to reduce saving rates, as appeared to be the reaction to the expiration of the payroll tax holiday for social security taxes that took effect in January 2013, until 2015, and that consumption will be limited by flat wages and limited access to additional increases in debt (Figure 8). To the extent that this perspective is not accurate and consumers assume more debt and accept below-forecast saving rates, or that wages rise more rapidly than predicted, consumption is likely to be stronger than expected and the economy will grow more rapidly than expected.

12
Figure 8
The Labor Market. During 2011, Michigan experienced a marked decline in the unemployment rate, outpacing drops in the unemployment rate nationally. With Michigan posting the first annual job gains since 2000 during 2011 and 2012, the decline in the unemployment rate would appear to reflect rising employment levels. However, while job gains have helped reduce the unemployment rate, the primary factor causing the unemployment rate to decline over this period has been the withdrawal of individuals from the labor force. Individuals who have a job or are actively seeking work are counted as participating in the labor force, and the unemployment rate reflects the number of individuals who do not have a job and are actively seeking work divided by the size of the labor force. Since the 2000 recession, labor force participation has fallen, with the steepest declines occurring in 2010 and 2011. Labor force participation can decline for a variety of reasons, ranging from individuals' choosing to permanently retire, to discouraged unemployed individuals' giving up searching for a job. Regardless of the reasons for their departure from the labor force, the withdrawal has implications for the economy. To the extent that such individuals remain out of the labor force, they generally face more limited income growth and reduce the pool of workers from which businesses can hire, potentially putting upward pressure on wages. On the other hand, to the extent that these individuals have only temporarily left the labor force, while they still face limited income growth, they represent a somewhat hidden group of unemployed individuals who will depress wages when the economy does begin to recover. How those who are not part of the labor force behave over the forecast period has important implications for the economy and the forecast. To the extent these individuals face limited incomes and reduced income growth, consumption and investment will be depressed, lowering economic growth and reducing tax revenue. If these individuals enter (or re-enter) the labor force, the unemployment rate is not likely to decrease much and may actually increase. To the extent these individuals find employment, the economy will improve, but at the expense of reducing the income gains that other workers might realize from an improving economy. As a result, both nationally and in Michigan, the large number of individuals who have left the labor force represent a factor that may exert a substantial slowing effect on the future growth of the economy.
1947Q11953Q3
1960Q11966Q3
1973Q11979Q3
1986Q11992Q3
1999Q12005Q3
2012Q1
0
50
100
150
200Profits After Tax, Adjusted for InflationEmployee Compensation
Profits at Record Highs, Compensation Flat for More Than a Decade
Profits and Pay at Nonfinancial Corporations
Source: Bureau of Economic Analysis, U.S. Department of Commerce

13
Economic Policy and International Events. During 2011 and 2012, the U.S. economy was repeatedly buffeted by various policy crises, ranging from debates about the Federal government's debt ceiling to a deficit reduction plan (the "fiscal cliff") to issues associated with financial crises in the Eurozone and economic slowdowns in China. In the case of issues that became embroiled in political deadlock, solutions were often reached and underlying economic fundamentals remained relatively unchanged although often the brinksmanship resulted in distortionary short-term behavior, such as the payment of substantial dividends in late 2012 in anticipation of possible changes in the taxes as part of any deal on the "fiscal cliff". A number of these issues promise to remain, or return, during the forecast period, with new decisions regarding the debt ceiling and the Federal budget being required in 2013 and the slowdown in the Eurozone appearing to deepen. The forecast assumes that the policy choices will ultimately have little effect on the underlying economic fundamentals and that any brinksmanship or acute market situations will be transitory and have little permanent effect. Michigan's Situation. While over the last decade Michigan's employment situation fared worse than the national average, and, in some cases or time periods within that range, worse than any other state, Michigan's performance was not particularly inconsistent with other states' when Michigan's economic composition is considered. Generally, states with higher manufacturing concentrations (particularly in the transportation equipment manufacturing sector) experienced weaker job performance during the last decade, both because of the economic changes occurring in that sector and because of the dependence of other sectors within those states on manufacturing activity. As indicated earlier, productivity gains have made American manufacturing firms more profitable and more competitive, but have reduced the need for hiring additional employees to meet increased demand.
Weak markets for housing, credit, and employment, coupled with high energy prices and substantial debt burdens, are expected to exert a dragging force on any increases in demand over the forecast period. For Michigan, both employment gains and improvements in economic growth will be restrained by vehicle sales that are expected to remain substantially below the levels experienced over the last two decades, as little growth is expected beyond replacement demand, and the vehicle manufacturing sector is expected to continue to exhibit strong productivity gains. On the other hand, compared with the prior decade, the Detroit 3 share of the sales mix is expected to remain fairly stable (Figure 9). Michigan's economic fortunes historically have been very closely linked with sales of domestically produced light vehicles (Figure 10). Despite the improvement forecasted in vehicle sales, and the renewed profitability of domestic automobile manufacturers, much of the additional demand can be met with existing employees, and low capital costs combined with meaningful productivity growth mean few incentives to increase hiring significantly. As a result, although as of June 2009, Michigan had lost more than two-thirds of the jobs (68.2%, a decline of approximately 241,300 jobs) in transportation equipment manufacturing that existed at the May 2000 peak, the majority of those jobs will never return and any gains in employment in the near future are likely to be muted. As identified in versions of this report prepared for earlier forecasts, even with something approximating normal employment growth in Michigan, it is unlikely that Michigan will reach the level of total employment reported in April 2000 (the prerecession peak) again for decades.
The forecast expects employment levels in the transportation equipment manufacturing sector to increase slightly through the forecast period. Overall employment in Michigan also is expected to grow slightly, with many of the employment gains over the forecast largely offset by declines in State and local government employment. However, for both the economy and State tax revenue to improve markedly, more substantial employment gains in the economy as a whole will need to occur. While increased profitability in the vehicle industry has stabilized much of the Michigan

14
economy, significant and sustained growth is unlikely to occur until a meaningful recovery occurs in both the financial sector and the housing industry, and consumers have improved their debt-to-income ratios. These changes, which are expected to take years, will need to occur at both the national and statewide levels before Michigan will experience economic growth on a sustained basis.
Figure 9
Figure 10
19951996
19971998
19992000
20012002
20032004
20052006
20072008
20092010
20112012
20132014
2015
9
10
11
12
13
14
15
16
17
18
40%
44%
48%
52%
56%
60%
64%
68%
72%
76%
U.S. Light Vehicle Sales (Y1)Detroit 3 Share (Y2)
Sales Rising While Market Share Stabilizes
Detroit 3 Market Share and Light Vehicle Sales
Source: Automotive News & Bureau of Economic Analysis, U.S. Department of Commerce
2013, 2014,& 2015
Estimated
19821984
19861988
19901992
19941996
19982000
20022004
20062008
20102012
85.0%
90.0%
95.0%
100.0%
105.0%
1.0
1.7
2.4
3.1
3.8
Mi Per Capita Income, % of US (Y1)Mi Motor Vehicle Production (Y2)
Michigan's Performance Relative to US. Follows Michigan Vehicle Production
Michigan Economy Still Strongly Linked to Auto Industry
Source: Bureau of Economic Analysis, U.S. Department of Commerce

F
OR
EC
AS
T F
OR
S
TA
TE
RE
VE
NU
E


15
THE FORECAST FOR STATE REVENUE This section of the Economic Outlook and Budget Review presents the Senate Fiscal Agency's (SFA's) estimates for General Fund/General Purpose (GF/GP) and School Aid Fund (SAF) revenue. The revised estimates for FY 2012-13, FY 2013-14, and FY 2014-15 are presented. The revenue estimates for each of these fiscal years include the estimates for baseline revenue, which measures what the revenue would be without any changes in the State's tax structure, and net revenue, which equals baseline revenue adjusted for the impact of all enacted tax changes. In addition, these revenue estimates represent the revenue generated from ongoing revenue sources and generally do not include any revenue included in the GF/GP or SAF budget from one-time revenue adjustments, transfers, or other nonrecurring revenue items. Any one-time revenue adjustments and transfers used to balance the GF/GP and SAF budgets in FY 2012-13, FY 2013-14, and FY 2014-15 are discussed in the last section of this report. REVENUE OVERVIEW The revised estimates for FY 2012-13, FY 2013-14, and FY 2014-15 are presented in Table 3 and are summarized below. FY 2012-13 Revised Revenue Estimate GF/GP and SAF revenue is expected to total $20.5 billion in FY 2012-13. This revised estimate for FY 2012-13 is up 1.6% or $317.5 million from the final revenue for FY
2011-12. In FY 2012-13, increased revenue generally reflects the continued growth in the economy,
although the revenue is higher also as a result of temporary financial and political events at the end of 2012 and beginning of 2013.
The revised estimate for FY 2012-13 is $541.9 million above the January 2013 consensus revenue estimate.
FY 2013-14 Revised Revenue Estimate GF/GP and SAF revenue is expected to total $20.9 billion in FY 2013-14. This revised estimate for FY 2013-14 is up 2.3% or $478.6 million from the revised estimate for
FY 2012-13. While the revenue increase in FY 2012-13 reflects improvements in the level of economic
activity, the growth rate is reduced slightly by the absence of the temporary financial and political events that occurred during FY 2012-13.
The revised estimate for FY 2013-14 is $243.4 million above the January 2013 consensus revenue estimate.
FY 2014-15 Revised Revenue Estimate GF/GP and SAF revenue is expected to total $21.6 billion in FY 2014-15. This revised estimate for FY 2014-15 is up 3.1% or $650.8 million from the revised estimate for
FY 2013-14. As in FY 2013-14, the revenue increase in FY 2013-14 reflects improvements in the level of
economic activity. The revised estimate for FY 2014-15 is $183.0 million above the January 2013 consensus
revenue estimate.

16
Table 3 SENATE FISCAL AGENCY REVENUE ESTIMATES FOR FY 2011-12 THROUGH FY 2014-15
GENERAL FUND/GENERAL PURPOSE AND SCHOOL AID FUND (Millions of Dollars)
FY 2011-12 Final
FY 2012-13 Revised Est.
FY 2013-14 Revised Est.
FY 2014-15 Initial Est.
GENERAL FUND/GENERAL PURPOSE Baseline Revenue $9,169.4 $9,803.9 $9,929.6 $10,159.3 Tax Changes Not In Baseline 95.8 (559.8) (448.2) (374.1) Revenue After Tax Changes: Net Income Tax 4,817.2 5,845.3 5,914.8 6,097.0 MBT, Corp. Income Tax, SBT, & Insur. Tax 1,569.4 792.6 802.1 840.8 Other Taxes 2,312.2 2,228.1 2,428.5 2,518.2 Total Taxes 8,698.8 8,866.0 9,152.3 9,456.0 Nontax Revenue 566.4 378.2 329.2 329.2 TOTAL GF/GP REVENUE $9,265.2 $9,244.2 $9,481.4 $9,785.2
SCHOOL AID FUND Baseline SAF $11,613.9 $11,946.6 $12,180.6 $12,539.1 Tax Changes Not In Baseline (734.9) (729.1) (721.7) (733.2) TOTAL SAF REVENUE $10,878.9 $11,217.6 $11,458.9 $11,805.9
BASELINE GF/GP AND SAF REVENUE 20,783.3 21,750.6 22,110.3 22,698.4 Tax & Revenue Changes (639.1) (1,288.8) (1,169.9) (1,107.3) GF/GP & SAF REV. AFTER CHANGES $20,144.1 $20,461.8 $20,940.3 $21,591.1 ADDENDUM: Sales Tax $6,952.8 $7,040.3 $7,240.7 $7,506.6 PERCENT CHANGE
GENERAL FUND/GENERAL PURPOSE Baseline Revenue 6.6% 6.9% 1.3% 2.3%
Revenue After Tax Changes: Net Income Tax 8.4 21.3 1.3 3.0 MBT, Corp. Income Tax, SBT, & Insur. Tax (3.0) (49.5) 1.2 4.8 Other Taxes 4.5 (3.6) 9.0 3.7 Total Taxes 5.1 1.9 3.2 3.3 Nontax Revenue 5.1 (33.2) (13.0) 0.0 TOTAL GF/GP REVENUE 5.1% (0.2%) 2.6% 3.2%
SCHOOL AID FUND Baseline SAF 3.1 2.9 2.0 2.9 TOTAL SAF REVENUE (3.3%) 3.1% 2.2% 3.0%
BASELINE GF/GP AND SAF REVENUE 4.5 4.7 1.7 2.7 GF/GP & SAF REV. AFTER CHANGES 0.4% 1.6% 2.3% 3.1% ADDENDUM: Sales Tax 3.6% 1.3% 2.8% 3.7%
17
6.1%5.1%
1.1%
-2.7%
2.9%
6.5%
8.3%
6.0%6.1%5.5%5.9%
7.9%
6.1%
-1.6%-1.5%-0.8%
1.8%
4.5%
1.0%1.2%0.5%
-9.1%
-2.1%
9.3%
4.5% 4.7%
1.7%2.7%
FISCAL YEAR'87-'88
'88-'89'89-'90
'90-'91'91-'92
'92-'93'93-'94
'94-'95'95-'96
'96-'97'97-'98
'98-'99'99-2000
2000-01'01-'02
'02-'03'03-'04
'04-'05'05-06
'06-07'07-08
'08-09'09-10
'10-11'11-12
'12-13'13-14
'14-15-12%
-9%
-6%
-3%
0
3%
6%
9%
12%
and School Aid Fund Baseline RevenueChange in General Fund/General Purpose
(Annual Percentage Change)
SFA Estimate
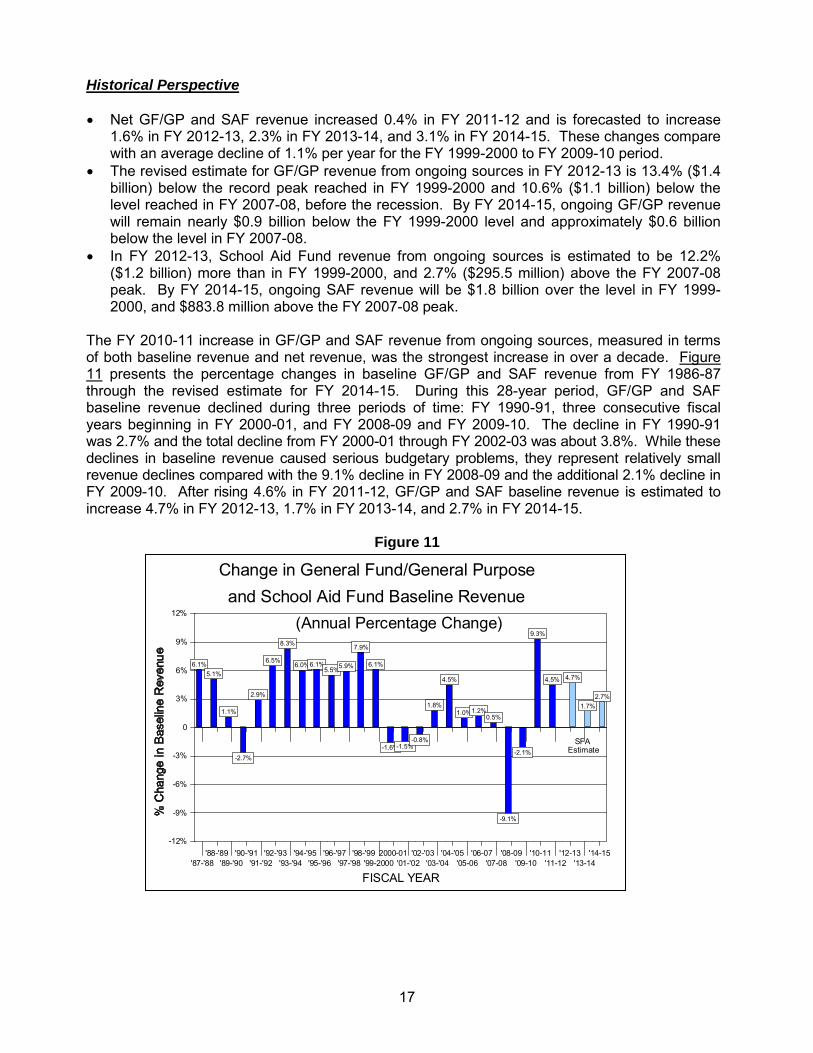
Historical Perspective Net GF/GP and SAF revenue increased 0.4% in FY 2011-12 and is forecasted to increase
1.6% in FY 2012-13, 2.3% in FY 2013-14, and 3.1% in FY 2014-15. These changes compare with an average decline of 1.1% per year for the FY 1999-2000 to FY 2009-10 period.
The revised estimate for GF/GP revenue from ongoing sources in FY 2012-13 is 13.4% ($1.4 billion) below the record peak reached in FY 1999-2000 and 10.6% ($1.1 billion) below the level reached in FY 2007-08, before the recession. By FY 2014-15, ongoing GF/GP revenue will remain nearly $0.9 billion below the FY 1999-2000 level and approximately $0.6 billion below the level in FY 2007-08.
In FY 2012-13, School Aid Fund revenue from ongoing sources is estimated to be 12.2% ($1.2 billion) more than in FY 1999-2000, and 2.7% ($295.5 million) above the FY 2007-08 peak. By FY 2014-15, ongoing SAF revenue will be $1.8 billion over the level in FY 1999-2000, and $883.8 million above the FY 2007-08 peak.
The FY 2010-11 increase in GF/GP and SAF revenue from ongoing sources, measured in terms of both baseline revenue and net revenue, was the strongest increase in over a decade. Figure 11 presents the percentage changes in baseline GF/GP and SAF revenue from FY 1986-87 through the revised estimate for FY 2014-15. During this 28-year period, GF/GP and SAF baseline revenue declined during three periods of time: FY 1990-91, three consecutive fiscal years beginning in FY 2000-01, and FY 2008-09 and FY 2009-10. The decline in FY 1990-91 was 2.7% and the total decline from FY 2000-01 through FY 2002-03 was about 3.8%. While these declines in baseline revenue caused serious budgetary problems, they represent relatively small revenue declines compared with the 9.1% decline in FY 2008-09 and the additional 2.1% decline in FY 2009-10. After rising 4.6% in FY 2011-12, GF/GP and SAF baseline revenue is estimated to increase 4.7% in FY 2012-13, 1.7% in FY 2013-14, and 2.7% in FY 2014-15.
Figure 11

18
Figure 12 compares actual FY 1995-96 through estimated FY 2013-14 GF/GP revenue and SAF revenue from ongoing sources with their respective levels for each of the fiscal years since the Proposal A school finance tax reforms were put in place. General Fund/General Purpose revenue peaked in FY 1999-2000 and then declined for three consecutive years due to a faltering economy and cuts to the income tax and the Single Business Tax (SBT). In FY 2007-08, GF/GP revenue jumped to $9.3 billion due to the increase in the income tax rate and the adoption of, and subsequent increase in, the Michigan Business Tax (MBT). The significant decline in GF/GP revenue experienced during FY 2008-09 and FY 2009-10, due to the 2008-09 recession, reduced GF/GP revenue to its lowest level since FY 1987-88, as shown in Figure 13. Despite the growth estimated over the forecast period, ongoing GF/GP revenue in FY 2013-14 will be approximately 1.7% (or $160.1 million) below the FY 1997-98 level (without accounting for inflation), and 3.7% (or $332.7 million) below the FY 1967-68 level if adjusted for inflation. In sharp contrast to the path GF/GP revenue has taken during this period, SAF-earmarked revenue has been on a fairly smooth upward trend, even though the economic downturn reduced SAF revenue in FY 2008-09 and FY 2009-10. Ongoing SAF revenue is expected to grow consistently through the forecast period, except for a significant decline during FY 2011-12 due to tax policy changes. In FY 2013-14, SAF revenue is predicted to be approximately 63.6% above the revenue level in FY 1995-96 (without accounting for inflation) and 9.9% (or $1.1 billion) below if adjusted for inflation, as shown in Figure 14.
Figure 12
1995-961996-97
1997-981998-99
1999-002000-01
2001-022002-03
2003-042004-05
2005-062006-07
2007-082008-09
2009-102010-11
2011-122012-13*
2013-14*2014-15*
$5,000
$6,000
$7,000
$8,000
$9,000
$10,000
$11,000
$12,000
$13,000
GF/GP SAF
Revenue from Ongoing Revenue Sources
General Fund/General Purpose & School Aid Fund
(Millions of Dollars)
* SFA Estimate

19
Figure 13
Figure 14
FY 2012-13 REVISED REVENUE ESTIMATES General Fund/General Purpose and SAF revenue will total an estimated $20.5 billion in FY
2012-13, which is up 1.6% or $317.5 million from final revenue for FY 2011-12. The revised estimate for FY 2012-13 is $541.9 million above the January 2013 consensus
estimate.
Fiscal Year1960-61
1964-651968-69
1972-731976-77
1980-811984-85
1988-891992-93
1996-972000-01
2004-052008-09
2012-130
$2,000
$4,000
$6,000
$8,000
$10,000
$12,000
$14,000
$16,000
Actual In 2010 Dollars
Nominal Revenue in FY 14 Below FY 98 Level; Adj. for Inflation, the FY 68 Level
Ongoing General Fund Revenue
2013, 2014& 2015
Estimated
Source: U.S. Dept. of Commerce, Michigan Dept. of Treasury, and Senate Fiscal Agency
Fiscal Year1994-95
1996-971998-99
2000-012002-03
2004-052006-07
2008-092010-11
2012-132014-15
0
$2,000
$4,000
$6,000
$8,000
$10,000
$12,000
$14,000
$16,000
ActualAdjusted for Inflation (2010 Dollars)
Nominal Rev. in FY 14 Below FY 08; Adj. for Inflation, Below Start of Prop. A
Ongoing School Aid Fund Revenue
2013, 2014& 2015
Estimated
Source: U.S. Dept. of Commerce, Michigan Dept. of Treasury, and Senate Fiscal Agency

20
Most economic activity in Michigan is expected to grow more slowly during FY 2012-13, although baseline GF/GP and SAF revenue will rise due to circumstances not related to underlying economic fundamentals, so revenue growth will be slightly greater than that experienced during FY 2011-12. The slight increase in baseline revenue growth is largely attributable to higher quarterly and annual income tax payments that reflect a substantial increase in dividend payments and capital gain realizations that occurred as taxpayers anticipated Federal tax changes in January 2013 associated with the "fiscal cliff". However, several tax policy changes will largely offset that additional revenue, as discussed below. The revised estimates for FY 2012-13 GF/GP and SAF revenue are summarized in Table 4. Tax Policy Changes Several tax policy changes are expected to alter revenue during FY 2012-13, with the most significant impacts associated with modifications enacted in 2011 to the individual income tax and the replacement of the MBT with a Corporate Income Tax (CIT). Furthermore, despite the repeal of the MBT, several MBT credits enacted in earlier years will begin to reduce revenue during FY 2012-13. Income Tax Reform. Legislation adopted in May 2011 made fundamental alterations to the Michigan individual income tax. The changes included postponing or eliminating scheduled rate reductions, expanding the tax base by eliminating many deductions and exemptions, and repealing or reducing a large number of credits. The combined effect of these changes, and subsequent associated legislation, is expected to increase individual income tax revenue in FY 2012-13 by approximately $1,249.5 million, of which $1,156.4 million is expected to be directed to the General Fund. Business Tax Changes. Concurrently with the modifications adopted for the individual income tax, the legislation also effectively repealed the MBT as of January 1, 2012, and replaced it with a Corporate Income Tax. The CIT taxes a narrower base and fewer firms, and thus is expected to generate substantially less revenue than generated by the MBT. The legislation also provided for certain credits that had been awarded under the MBT to continue to be claimed, under an "option" tax. This option allows taxpayers to continue to claim those credits if they continue to file under the MBT. The option reduces revenue significantly, beginning in FY 2011-12, because between 2008 and 2010, various special credits were enacted to subsidize certain types of manufacturing activity, including photovoltaic cells, polycrystalline silicon, and certain high-power energy batteries. During FY 2010-11, only the photovoltaic credit exhibited an impact, reducing MBT revenue by approximately $1.5 million. In FY 2012-13, the value of these credits is expected to increase, reducing revenue by an estimated $475.4 million. The combined effect of the elimination of the MBT, the new CIT, the increased business tax credits, and the other legislative changes to business taxes is to lower FY 2012-13 revenue by $1.9 billion. Sales Tax Redirection. Legislation adopted concurrently with the FY 2012-13 budget redirected $110.0 million in sales tax revenue to the State Trunkline Fund ($100.0 million) and the Aeronautics Fund ($10.0 million). This earmark reduced the revenue that would have otherwise been available to the General Fund. As a result, although sales tax revenue is expected to increase 1.3% in FY 2012-13, sales tax revenue directed to the General Fund is expected to decline $85.1 million in FY 2012-13, compared to the FY 2011-12 level. Unclaimed Property. In 2010, Michigan enacted changes to the State's laws regarding unclaimed property, altering the applicable dormancy period for many types of property to be considered abandoned and accelerating when the State receives the property. As a result, the State collected an additional $175.4 million during FY 2010-11, and an additional $35.0 million during FY 2011-12.

21
However, a portion of these increases represents property that the State would have received in later fiscal years. As a result, the changes are expected to reduce revenue by approximately $35.0 million per year during the FY 2012-13 to FY 2014-15 period. Furthermore, several audits related to unclaimed property generated substantial revenue during FY 2011-12. The combination of these two policies results in a revenue impact that swings from a $104.8 million increase in FY 2011-12 to a $6.8 million reduction in FY 2012-13, a drop of $111.6 million. By FY 2013-14, the changes result in a net loss of $40.8 million, down $145.6 million from FY 2011-12. General Fund/General Purpose Revenue General Fund/General Purpose revenue will total an estimated $9.2 billion in FY 2012-13, a
decrease of 0.2% or $21.0 million from FY 2011-12. The revised GF/GP estimate for FY 2012-13 is $452.0 million above the January 2013
consensus revenue estimate. Modest economic growth during 2013 will result in higher tax collections during FY 2012-13. Growth in GF/GP revenue is expected to primarily reflect growth in income tax revenue, especially in estimated quarterly and annual payments, and an anticipated 22.0% decline in individual income tax refunds. A portion of this growth is offset by the tax policy changes associated with the MBT and the sales tax. The revised GF/GP revenue estimate for FY 2012-13 is summarized in Table 4. School Aid Fund School Aid Fund revenue from all earmarked taxes and the lottery will total an estimated
$11.2 billion in FY 2012-13, which is up 3.1% or $338.7 million from FY 2011-12. This revised SAF revenue estimate for FY 2012-13 is $89.9 million above the January 2013
consensus revenue estimate.
The projected 3.1% increase in SAF revenue in FY 2012-13 largely reflects the impact of additional income tax revenue. However, the improving housing market also is expected to result in net increases in revenue from the State Education Tax and the real estate transfer tax. Revenue from the State Education Tax is expected to increase 0.7% while revenue from the real estate transfer tax will rise 35.4%. While sales tax revenue is expected to increase, the growth rate is expected to be less than in recent years. The revised SAF revenue estimate for FY 2012-13 is summarized in Table 4.

22
Table 4
FY 2012-13 REVISED REVENUE ESTIMATES GENERAL FUND/GENERAL PURPOSE AND SCHOOL AID FUND
(Millions of Dollars) Change from FY 2011-12
FY 2011-12
Final FY 2012-13
Revised Est. Dollar
Change
Percent Change
$ Change from 01/13 Consensus
GENERAL FUND/GENERAL PURPOSE: Baseline Revenue
1) $,169.4 $,803.9 $34.5 6.9% $72.0 Tax Changes Not In Baseline 95.8 (559.8) (655.6) --- (20.0) Revenue After Tax Changes Personal Income Tax Gross Collections 9,052.9 9,850.8 797.9 8.8 528.0 Less: Refunds (2,134.6) (1,665.3) 469.3 (22.0) (80.0) Net Income Tax Collections 6,918.4 8,185.5 1,267.1 18.3 448.0 Less: Earmarking to SAF (2,100.2) (2,339.2) (239.0) 11.4 (122.8) Campaign Fund (1.0) (1.0) 0.0 0.0 0.0 Net Income Tax to GF/GP 4,817.2 5,845.3 1,028.1 21.3 325.2 Other Taxes Michigan Business Tax 798.3 (443.0) (1,241.3) (155.5) 180.4 Corporate Income Tax 0.0 925.0 925.0 --- 0.0 Sales 1,081.2 996.1 (85.1) (7.9) (18.5) Use 794.0 830.7 36.7 4.6 (16.9) Cigarette 192.6 192.9 0.3 0.2 2.7 Insurance Company Premiums 290.2 295.6 5.4 1.9 (11.4) Telephone & Telegraph 59.2 59.0 (0.2) (0.3) 0.0 Oil & Gas Severance 53.6 51.5 (2.1) (3.9) (1.5) All Other 612.5 112.9 (499.6) (81.6) (8.0) Subtotal Other Taxes 3,881.7 3,020.7 (860.9) (22.2) 126.8 Total Nontax Revenue 566.4 378.2 (188.2) (33.2) 0.0 GF/GP REV. AFTER TAX CHANGES $9,265.2 $9,244.2 ($21.0) (0.2%) $452.0 SCHOOL AID FUND: Baseline Revenue
1) $11,613.9 $11,946.6 $332.7 2.9% $89.9 Tax Changes Not In Baseline (734.9) (729.1) 5.8 --- 0.0 Revenue After Tax Changes Sales Tax 5,057.0 5,120.5 63.5 1.3 (69.2) Use Tax 412.6 415.4 2.8 0.7 (8.5) Lottery Revenue 778.4 762.1 (16.3) (2.1) 12.1 State Education Property Tax 1,789.5 1,801.6 12.1 0.7 0.0 Real Estate Transfer Tax 150.1 203.3 53.2 35.4 33.7 Michigan Business Tax 0.0 0.0 0.0 --- 0.0 Income Tax 2,100.2 2,339.2 239.0 11.4 122.8 Casino Tax 115.8 109.6 (6.2) (5.4) 1.3 Other Revenue 475.3 465.9 (9.4) (2.0) (2.3) SAF REV. AFTER TAX CHANGES $10,878.9 $11,217.6 $338.7 3.1% $89.9 BASELINE GF/GP AND SAF $20,783.3 $21,750.6 $967.3 4.7% $561.9 Tax & Revenue Changes (639.1) (1,288.8) (649.7) --- (20.0) GF/GP & SAF REV. AFTER CHANGES $20,144.2 $20,461.8 $317.5 1.6% $541.9 Sales Tax $6,952.8 $7,040.3 $87.5 1.3% ($94.4) 1) FY 2011-12 is the base year for baseline revenue.
23
FY 2013-14 REVISED REVENUE ESTIMATES Total GF/GP and SAF revenue will reach an estimated $20.9 billion in FY 2013-14, an increase
of 2.3% or $478.6 million from the revised estimate for FY 2012-13. The revised estimate for FY 2013-14 is $243.4 million above the January 2013 consensus
estimate. The level of economic activity in Michigan is expected to continue growing during FY 2013-14. Furthermore, while the significant tax policy changes that reduced revenue in FY 2012-13 will still exhibit an effect on revenue, the impact will be reduced. However, the marked increase in estimated quarterly and annual income tax payments associated with the Federal "fiscal cliff" events in December 2012 and January 2013 are not expected to repeat, reducing the growth from those sources of revenue. As a result, baseline GF/GP and SAF revenue is expected to increase 1.7% in FY 2013-14. However, net revenue will grow more rapidly due to several tax policy changes. The revised estimate of GF/GP and SAF revenue for FY 2013-14 is summarized in Table 5. Tax Policy Changes As in FY 2012-13, several tax policy changes are expected to affect revenue during FY 2013-14, with the most significant impacts coming from increases in business tax credits and the expiration of the earmark on sales tax revenue. Income Tax Reform. By FY 2013-14, the legislation adopted in May 2011 will have been effective for two full fiscal years, reducing significant year-to-year swings in revenue associated with its implementation. However, those changes will be responsible for a significant increase in revenue from what otherwise would have been received. The combined effect of the legislation is expected to increase individual income tax revenue in FY 2013-14 by approximately $1.5 billion, of which $1.4 billion is expected to be directed to the General Fund. Business Tax Changes. As discussed above, the 2011 legislation also repealed the MBT effective January 1, 2012, replaced it with a Corporate Income Tax, and provided for certain credits that had been awarded under the MBT to continue to be claimed, under an "option" tax. The value of these credits is expected to peak in FY 2013-14, at $623.0 million. The combined effect of the elimination of the MBT, the new CIT, the increased business tax credits, and the other legislative changes to business taxes is to lower FY 2013-14 revenue by $2.0 billion. Insurance Tax Changes. Legislation enacted in 2012 allows for Blue Cross Blue Shield of Michigan to convert from a tax-exempt nonprofit firm to a nonprofit mutual insurer. One aspect of this legislation is that the firm will become subject to taxes levied on insurance companies. The estimate assumes that payments will begin during FY 2013-14, adding approximately $40.0 million in revenue to the General Fund. Sales Tax Redirection. As discussed above, legislation redirected $110.0 million in sales tax revenue to the State Trunkline Fund ($100.0 million) and the Aeronautics Fund ($10.0 million) during FY 2012-13. Since this earmark affected revenue for FY 2012-13 only, the revenue available to the General Fund is greater in FY 2013-14. As a result, although sales tax revenue is expected to increase 2.8% in FY 2013-14, sales tax revenue directed to the General Fund is expected to increase $132.9 million or 13.3% in FY 2013-14, compared with the FY 2012-13 level.

24
General Fund/General Purpose Revenue General Fund/General Purpose revenue will total an estimated $9.5 billion in FY 2013-14, an
increase of 2.6% or $237.2 million from the revised estimate for FY 2012-13. The revised GF/GP estimate for FY 2013-14 is $217.0 million above the January 2013
consensus revenue estimate. Baseline GF/GP revenue is expected to increase 1.3%, but the tax policy changes are expected to enhance the revenue gain from the improving economy, resulting in a net revenue increase of 2.6%. The changes associated with the sales tax earmark and insurance taxes will add a combined $150.0 million to FY 2013-14 General Fund revenue, approximately 63.2% of the net revenue increase over FY 2012-13. The revised GF/GP revenue estimates for FY 2013-14 are summarized in Table 5. School Aid Fund School Aid Fund revenue from all earmarked taxes and the lottery will total an estimated $11.5
billion in FY 2013-14, an increase of $241.3 million, or 2.2%, from the revised estimate for FY 2012-13.
The revised SAF estimate for FY 2013-14 is $26.4 million above the January 2013 consensus revenue estimate.
The forecasted increase in SAF revenue reflects growth in every major revenue source other than the lottery. Stronger growth in sales tax revenue accounts for approximately 60.4% of the net increase in revenue. The improving housing market will result in higher revenue from the State Education Tax and the real estate transfer tax, while the growing economy will result in higher income tax revenue to the School Aid Fund. The revised SAF revenue estimates for FY 2013-14 are summarized in Table 5.

25
Table 5
FY 2013-14 REVISED REVENUE ESTIMATESGENERAL FUND/GENERAL PURPOSE AND SCHOOL AID FUND
(Millions of Dollars) Change from FY 2012-13
FY 2012-13
Revised Est. FY 2013-14
Revised Est. Dollar
Change Percent Change
$ Change from 01/13 Consensus
GENERAL FUND/GENERAL PURPOSE: Baseline Revenue1) $9,803.9 $9,929.6 $125.7 1.3% $197.1Tax Changes Not In Baseline (559.8) (448.2) 111.6 --- 20.0Revenue After Tax Changes Personal Income Tax Gross Collections 9,850.8 9,955.0 104.2 1.1 285.0 Less: Refunds (1,665.3) (1,670.1) (4.8) 0.3 (80.0) Net Income Tax Collections 8,185.5 8,284.9 99.4 1.2 205.0 Less: Earmarking to SAF (2,339.2) (2,369.1) (29.9) 1.3 (66.3) Campaign Fund (1.0) (1.0) 0.0 0.0 0.0Net Income Tax to GF/GP 5,845.3 5,914.8 69.5 1.2 138.7Other Taxes Michigan Business Tax (443.0) (505.4) (62.4) 14.1 100.0 Corporate Income Tax 925.0 960.0 35.0 3.8 (20.0) Sales 996.1 1,129.0 132.9 13.3 (27.8) Use 830.7 898.0 67.3 8.1 (3.3) Cigarette 192.9 190.5 (2.4) (1.2) 3.1 Insurance Company Premiums 295.6 347.5 51.9 17.6 28.5 Telephone & Telegraph 59.0 59.0 0.0 0.0 0.0 Oil & Gas Severance 51.5 55.0 3.5 6.8 0.0 All Other 112.9 103.9 (9.0) (8.0) (2.1)Subtotal Other Taxes 3,020.7 3,237.5 216.8 7.2 78.4Total Nontax Revenue 378.2 329.2 (49.0) (13.0) 0.0GF/GP REV. AFTER TAX CHANGES $9,244.2 $9,481.4 $237.2 2.6% $217.0 SCHOOL AID FUND: Baseline Revenue1) $11,946.6 $12,180.6 $234.0 2.0% $21.4Tax Changes Not In Baseline (729.1) (721.7) 7.4 --- 5.0Revenue After Tax Changes Sales Tax 5,120.5 5,266.3 145.8 2.8 (91.7)Use Tax 415.4 449.0 33.6 8.1 (1.7)Lottery Revenue 762.1 760.0 (2.1) (0.3) 15.0State Education Property Tax 1,801.6 1,829.6 28.0 1.6 11.0Real Estate Transfer Tax 203.3 208.5 5.2 2.6 25.0Michigan Business Tax 0.0 0.0 0.0 --- --- Income Tax 2,339.2 2,369.1 29.9 1.3 66.3Casino Tax 109.6 113.0 3.4 3.1 2.0Other Revenue 465.9 463.4 (2.5) (0.5) 0.5SAF REV. AFTER TAX CHANGES $11,217.6 $11,458.9 $241.3 2.2% $26.4 BASELINE GF/GP AND SAF 21,750.6 22,110.3 359.7 1.7 218.5Tax & Revenue Changes (1,288.8) (1,169.9) 118.9 --- 25.0GF/GP & SAF REV. AFTER CHNGS $20,461.8 $20,940.3 $478.6 2.3% $243.4 Sales Tax $7,040.3 $7,240.7 $200.4 2.8% ($125.0)1) FY 2011-12 is the base year for baseline revenue.

26
FY 2014-15 REVISED REVENUE ESTIMATES Total GF/GP and SAF revenue will reach an estimated $21.6 billion in FY 2014-15, an increase
of 3.1% or $650.8 million from the revised estimate for FY 2013-14. The revised estimate for FY 2014-15 is $183.0 million above the January 2013 consensus
revenue estimate. Michigan's economy is expected to expand more rapidly during FY 2014-15 than during either FY 2012-13 or FY 2013-14, with personal income exhibiting the strongest growth since FY 2010-11, although the increase will be less than the improvement experienced during FY 2010-11. On a baseline basis, GF/GP and SAF revenue is expected to increase 2.9% in FY 2014-15, reflecting the stronger level of State economic activity. Tax policy changes are expected to have less of an effect on net revenue, resulting in net revenue growth of 3.1%. The initial estimate of GF/GP and SAF revenue for FY 2013-14 is summarized in Table 6. Tax Policy Changes Tax policy changes are expected to continue affecting revenue during FY 2014-15, with income tax revenue higher and business tax revenue lower than what would have occurred absent the legislation adopted in 2011. However, the year-over-year change in the impacts of these provisions will be less than in previous years. Income Tax Reform. The combined effect of legislation adopted in May 2011 is expected to increase individual income tax revenue by approximately $1.8 billion in FY 2014-15, of which $1.7 billion is expected to be directed to the General Fund. Business Tax Changes. The combined effect of the elimination of the MBT, the new Corporate Income Tax, the increased business tax credits, and the other legislative changes to business taxes is to lower FY 2013-14 revenue by $1.9 billion. Insurance Tax Changes. As discussed above, legislation enacted in 2012 allows for Blue Cross Blue Shield of Michigan to convert from a tax-exempt nonprofit firm to a nonprofit mutual insurer. One aspect of this legislation is that the firm will become subject to taxes levied on insurance companies. The estimate assumes a full year of tax payments from the change, totaling $70.0 million in General Fund revenue, during FY 2014-15. General Fund/General Purpose Revenue General Fund/General Purpose revenue will total an estimated $9.8 billion in FY 2014-15, an
increase of 3.2% or $303.8 million from the revised estimate for FY 2013-14. The revised GF/GP estimate for FY 2014-15 is $145.7 million above the January 2013 consensus
revenue estimate. Baseline GF/GP revenue is expected to increase 2.3%. Tax policy changes will add to the revenue gain from the improving economy, with credits under the MBT expected to decline and insurance tax revenue rising from the changes at Blue Cross Blue Shield. The revised GF/GP revenue estimates for FY 2014-15 are summarized in Table 6.

27
Table 6
FY 2014-15 REVISED REVENUE ESTIMATES GENERAL FUND/GENERAL PURPOSE AND SCHOOL AID FUND
(Millions of Dollars) Change from FY 2013-14
FY 2013-14
Revised Est. FY 2014-15
Revised Est. Dollar
Change
Percent Change
$ Change from 01/13 Consensus
GENERAL FUND/GENERAL PURPOSE: Baseline Revenue
1) $9,929.6 $10,159.3 $229.7 2.3% $105.7 Tax Changes Not In Baseline (448.2) (374.1) 74.1 --- 40.0 Revenue After Tax Changes Personal Income Tax Gross Collections 9,955.0 10,240.1 285.1 2.9 225.0 Less: Refunds (1,670.1) (1,705.0) (34.9) 2.1 (80.0) Net Income Tax Collections 8,284.9 8,535.1 250.2 3.0 145.0 Less: Earmarking to SAF (2,369.1) (2,437.1) (68.0) 2.9 (52.3) Campaign Fund (1.0) (1.0) 0.0 0.0 0.0 Net Income Tax to GF/GP 5,914.8 6,097.0 182.2 3.1 92.7 Other Taxes Michigan Business Tax (505.4) (542.2) (36.8) 7.3 50.0 Corporate Income Tax 960.0 990.0 30.0 3.1 (30.0) Sales 1,129.0 1,168.2 39.2 3.5 (33.3) Use 898.0 938.0 40.0 4.5 6.0 Cigarette 190.5 188.0 (2.5) (1.3) 4.2 Insurance Company Premiums 347.5 393.0 45.5 13.1 58.0 Telephone & Telegraph 59.0 59.0 0.0 0.0 0.0 Oil & Gas Severance 55.0 57.0 2.0 3.6 0.0 All Other 103.9 108.0 4.1 4.0 (1.9) Subtotal Other Taxes 3,237.5 3,359.0 121.5 3.8 53.0 Total Nontax Revenue 329.2 329.2 0.0 0.0 0.0 GF/GP REV. AFTER TAX CHANGES $9,481.4 $9,785.2 $303.8 3.2% $145.7 SCHOOL AID FUND: Baseline Revenue
1) $12,180.6 $12,539.1 $358.5 2.9% $17.4 Tax Changes Not In Baseline (721.7) (733.2) (11.5) --- 20.0 Revenue After Tax Changes Sales Tax 5,266.3 5,460.3 194.0 3.7 (91.7) Use Tax 449.0 469.0 20.0 4.5 0.0 Lottery Revenue 760.0 768.0 8.0 1.1 26.0 State Education Property Tax 1,829.6 1,873.8 44.2 2.4 15.0 Real Estate Transfer Tax 208.5 218.7 10.2 4.9 26.0 Michigan Business Tax 0.0 0.0 0.0 --- --- Income Tax 2,369.1 2,437.1 68.0 2.9 52.3 Casino Tax 113.0 119.0 6.0 5.3 3.0 Other Revenue 463.4 460.0 (3.4) (0.7) 6.8 SAF REV. AFTER TAX CHANGES $11,458.9 $11,805.9 $347.0 3.0% $37.3 BASELINE GF/GP AND SAF 22,110.3 22,698.4 588.1 2.7 123.1 Tax & Revenue Changes (1,169.9) (1,107.3) 62.6 --- 60.0 GF/GP & SAF REV. AFTER CHNGS $20,940.3 $21,591.1 $650.8 3.1% $183.0 Sales Tax $7,240.7 $7,506.6 $265.9 3.7% ($125.0) 1) FY 2010-11 is the base year for baseline revenue.
28
School Aid Fund School Aid Fund revenue from all earmarked taxes and the lottery will total an estimated $11.8
billion in FY 2014-15, an increase of $347.0 million, or 3.0%, from the revised estimate for FY 2013-14.
The revised SAF estimate for FY 2014-15 is $37.3 million above the January 2013 consensus revenue estimate.
The forecasted increase in SAF revenue reflects growth in every major revenue source. Continued improvements in the housing market will result in higher revenue under the State Education Tax and the real estate transfer tax, while the growing economy will increase sales tax and income tax revenue to the School Aid Fund. The revised SAF revenue estimates for FY 2014-15 are summarized in Table 6. MAJOR GENERAL FUND AND SCHOOL AID FUND TAXES IN FY 2012-13 THROUGH FY 2014-15 Individual Income Tax. The income tax will generate an estimated $8.2 billion in FY 2012-13, an increase of 18.3% from FY 2011-12 and 14.7% above the FY 1999-2000 record high for income tax revenue. Modest increases in economic activity will combine with the impact of tax reform legislation and additional revenue associated with the Federal "fiscal cliff" crisis during December 2012 and January 2013 to push individual income tax revenue higher in FY 2012-13. By FY 2013-14, faster year-over-year growth in individual income tax revenue attributable to the tax reform legislation will have dissipated, but stronger economic growth is expected to increase collections from income tax withholding by 3.4%. Some of this increase will be offset by the loss of the additional revenue associated with the "fiscal cliff". Compared with January 2013 consensus revenue estimates, the revised individual income tax estimate for FY 2012-13 is $448.0 million higher, while the revised estimates for FY 2013-14 and FY 2014-15 are $205.0 million and $145.0 million, respectively, higher. These upward revisions in income tax revenue will increase both GF/GP revenue and SAF revenue. The School Aid Fund receives 23.3% of gross income tax collections (withholding, quarterly, and annual payments), while the GF/GP budget receives 76.7% of gross collections, and incurs the negative impact of all income tax refunds (or positive impact of reduced refunds), including the refund payments for the homestead property tax credit and the earned income tax credit (both of which were reduced substantially by the tax reform legislation). Sales Tax. As employment has stabilized and the economy has continued to grow, consumers and businesses have become less cautious, increasing spending on items subject to the sales tax. A significant portion of the sales tax growth experienced during the last two fiscal years has reflected higher gas prices and increases in residential utility rates, as well as rising vehicle sales. While gasoline prices are expected to remain high over the forecast period, they are not expected to show the types of increases experienced earlier in the decade. Stable economic conditions also have led consumers to increase spending on replacement durable goods, purchases that were delayed during the 2008-2009 recession. While the economy is expected to be weaker during the forecast period than during FY 2010-11, reflecting limited gains in both employment and average wage earnings, sales tax revenue in FY 2012-13 will total an estimated $7.0 billion, a 1.3% increase from the FY 2011-12 level. Sales tax collections are expected to continue growing, rising 2.8% in FY 2013-14 and 3.7% in FY 2014-15, when they will total $7.5 billion. Generally, these increases are below the average growth experienced during the 1990s, but are substantially above the growth rates experienced during much of the last decade. Compared with January 2013 consensus revenue estimates, the revised sales tax estimate for FY 2012-13 is down $94.4 million while the revised estimates for FY 2013-14 and FY 2014-15 are each down $125.0 million. Most of the sales tax revenue is earmarked to the SAF (73.3%) and most of the remainder goes to local government revenue sharing payments, the Comprehensive Transportation Fund, and the General

29
Fund. The amount going to revenue sharing includes only constitutional revenue sharing earmarks, and, to reflect the significant portion of sales tax revenue earmarked statutorily to revenue sharing that has been diverted to the General Fund, this report directs all of the statutory revenue sharing earmark to the General Fund and shows the appropriation for statutory revenue sharing as a revenue reduction on the balance sheet, as discussed in the last section of the version of this report issued in December 2011. Use Tax. Use tax collections, which reflect the taxes levied on a variety of activities ranging from spending at hotels and motels, telephone service (both residential and business), and business equipment purchased in other states for use in Michigan, can be volatile. Baseline use tax revenue is expected to grow 1.8% in FY 2012-13, but net revenue is expected to increase 3.3%, reflecting the impact of a large refund paid in FY 2011-12. In later fiscal years, improvements in economic activity and business investment will result in growing use tax revenue. In FY 2013-14, use tax receipts will total an estimated $1.3 billion, an increase of 8.1% from the revised estimate for FY 2012-13. As the economy continues to improve, use tax revenue is expected to increase 4.5% in FY 2014-15, to $1.4 billion. Compared with the January 2013 consensus revenue estimates, the FY 2012-13 estimate for use tax collections has been revised downward by $25.4 million, while the FY 2013-14 estimate is $5.0 million lower and the FY 2014-15 estimate is $9.0 million higher. The GF/GP budget receives two-thirds of use tax revenue and the remaining one-third goes to the SAF. Tobacco Taxes. Collections from the cigarette and other tobacco products taxes will total an estimated $957.5 million in FY 2012-13, a decrease of 0.6% from FY 2011-12. In FY 2013-14, tobacco tax revenue is expected to decline another 1.3%, to $944.9 million, before falling 1.4% in FY 2014-15, to $931.9 million. These estimated declines reflect the ongoing steady decline in tobacco consumption. Tobacco tax revenue is earmarked to several different funds including the General Fund and the SAF. Casino Tax. The State's tax on casinos equals 8.1% of gross gaming receipts and is directed to the SAF. Baseline casino tax revenue is expected to increase 4.4% during FY 2012-13, but the opening of new casinos in northern Ohio is expected to result in reduced revenue in late 2012 and early 2013. As the economy improves and the novelty of the Ohio casinos declines, a portion of the lost casino tax revenue will be recovered. As a result, casino tax revenue is expected to decline in FY 2012-13, falling 5.4% to $109.6 million, and then rebound in FY 2013-14, rising 3.1% to $113.0 million. State Education Property Tax. Weakness in the housing sector has driven State Education Tax revenue down since FY 2006-07. The housing market began to stabilize during 2012, and State Education Tax revenue is expected to rise 0.7% in FY 2012-13. As the housing market continues to improve, State Education Tax revenue will mostly be able to keep pace with inflation, and is expected to increase 1.6% and 2.4%, respectively, in FY 2013-14 and FY 2014-15. However, State Education Tax revenue in FY 2014-15 will still be 10.0% below the FY 2006-07 peak. All of the revenue generated by the State Education Tax is earmarked to the SAF. Lottery. Baseline lottery revenue is expected to decline slightly over the forecast period, varying as tepid income growth trades off with increased competition from other types of gaming activity and few significant new games. Absent record-setting jackpots, which often boost lottery revenue significantly, lottery revenue is expected to decline 2.1% in FY 2012-13, to $762.1 million, and then decline 0.3% in FY 2013-14 before rising 1.1% in FY 2014-15 as a result of several new games. All of the net revenue generated by the lottery is earmarked to the SAF.

30
Michigan Business Tax/Corporate Income Tax. Legislation adopted in May 2011 repealed the MBT for most taxpayers beginning January 1, 2012. Corporate taxpayers have begun to pay a Corporate Income Tax that is expected to generate less than one-third of the revenue from the MBT. Under the legislation, unincorporated businesses and "pass-through" entities such as S-corporations, partnerships, and many limited liability companies (LLCs) will not pay any separate business tax to the State. Those businesses that continue to pay the MBT will do so largely to claim substantial refundable credits awarded in previous years. As a result, over much of the forecast period, MBT revenue will be negative, reflecting refund payments. The Corporate Income Tax is expected to grow over the forecast period, as profits improve, although the CIT is expected to be a more volatile tax than the MBT. Business taxes, representing the combination of MBT and Corporate Income Tax revenue, declined 35.4% in FY 2011-12, from $2.1 billion to $1.3 billion, largely reflecting the incomplete revenue replacement under the CIT and a partial year of lost MBT revenue. As the MBT credits increase in FY 2012-13 and the full-year impact of the transition to the Corporate Income Tax occurs, business tax revenue is expected to decline another 64.2%, to $481.9 million. In FY 2013-14, the second full year under the Corporate Income Tax, CIT revenue is expected to increase 3.8%, but increased MBT credits will combine with MBT refunds to cause net business tax revenue to decline another 5.7%, to $454.6 million. Business tax revenue is expected to decline another 1.5% in FY 2014-15. Reflecting stronger corporate profits, the revised estimate for business taxes in FY 2012-13 is $162.5 million above the January 2013 consensus estimate, while the revised estimate for FY 2013-14 is $108.5 million higher. According to the MBT Act, the SAF received $729.0 million of MBT revenue in FY 2008-09, with that amount indexed in future years to the percentage change in the U.S. Consumer Price Index (CPI) during the previous fiscal year. In FY 2010-11, MBT revenue earmarked to the SAF totaled $739.2 million. The tax reform legislation adopted in 2011 repealed the earmark along with the MBT, so no revenue from the MBT will be directed to the SAF in FY 2011-12 or later, lowering the SAF by an estimated $777.3 million in FY 2012-13, $792.1 million in FY 2013-14, and $808.7 million in FY 2014-15. All remaining MBT revenue, and all of the Corporate Income Tax revenue, goes to the General Fund. REVENUE TRENDS Revenue collections depend on both tax laws and economic conditions. Over time, different taxes tend to exhibit certain average growth rates, although these growth rates are often affected substantially by changes in the law. As a result, the forecast attempts to examine baseline revenue growth, which reflects the growth in revenue that would occur absent any changes to the law. However, the tax law assumed when computing a baseline is updated every year. Maintaining a common baseline over a long period of time could quickly become unwieldy and the difference between baseline and actual net collections would become so large that it would be difficult to estimate the revenue or even compare the two measures. In any given year, actual revenue from any tax will generally deviate from the average growth rates and the strength of forecasts largely depends on the ability to estimate these deviations. The inherent uncertainty of the future means that longer-term trend growth rates are less accurate than the more detailed forecast data for earlier fiscal years. Furthermore, history indicates that not only will the economy likely deviate from trends over this period but the Legislature is likely to enact various changes to the State's tax laws. Based on a longer-term view of Michigan's economy for FY 2014-15 and FY 2015-16, net GF/GP revenue is expected to increase 2.9% in FY 2015-16, to $10.1 billion, while SAF revenue will

31
increase 2.7%, to $12.1 billion. In FY 2016-17, net GF/GP revenue is expected to increase 5.1%, to $10.6 billion, while SAF revenue will increase 2.7%, to $12.5 billion.
SENATE FISCAL AGENCY BASELINE REVENUE FORECAST HISTORY
The history of the Senate Fiscal Agency's and consensus estimates for GF/GP and SAF baseline revenue for FY 2012-13, FY 2013-14, and FY 2014-15 is presented in Tables 7, 8, and 9. Baseline estimates are used to track the forecast history for these fiscal years in order to avoid the wide swings in revenue estimates that occur when tax changes are enacted for a particular fiscal year after the initial revenue estimates have been calculated for that fiscal year. In addition, in order to provide an accurate comparison, all of the previous baseline estimates made for FY 2012-13, FY 2013-14, and FY 2014-15 have been adjusted to reflect a common base year. The initial GF/GP and SAF baseline revenue estimate for FY 2012-13 was made in May 2011 at $20.1 billion, as shown in Table 7. This estimate was lowered by $143.3 million at the May 2011 Consensus Revenue Estimating Conference, increased by $208.2 million in the January 2012 Consensus Revenue Estimating Conference, and increased by $4.0 million at the May 2012 Consensus Revenue Estimating Conference. This estimate was increased by $16.4 million at the January 2013 Consensus Revenue Estimating Conference. The Senate Fiscal Agency's revised estimate for FY 2012-13 presented in this report increases the baseline estimate $484.4 million above the January 2013 consensus estimate, to $20.7 billion.
Table 7
CHANGES IN SENATE FISCAL AGENCY BASELINE REVENUE ESTIMATES FOR FY 2012-13
(Millions of Dollars)
Forecast Date GF/GP SAF Total
May 13, 2011 $8,428.7 $11,694.8 $20,123.5 May 16, 2011a) 8,339.0 11,641.2 19,980.2 December 28, 2011 8,395.0 11,645.7 20,040.7 January 14, 2012 a) 8,418.6 11,769.8 20,188.4 May 9, 2012 8,389.4 11,852.6 20,242.0 May 16, 2012 a) 8,313.6 11,878.8 20,192.4 December 28, 2012 8,187.6 11,818.1 20,005.8 January 11, 2013 a) 8,319.3 11,856.7 20,176.0 May 13, 2013 8,803.7 11,856.7 20,660.4 Change From Previous Estimate: Dollar Change $484.4 $0.0 $484.4 Percent Change 5.8% 0.0% 2.4% Change From Initial Estimate: Dollar Change $375.0 $161.9 $536.9 Percent Change 4.4% 1.4% 2.7% a) Consensus estimate between the Senate Fiscal Agency, House Fiscal Agency, and Department of
Treasury. Note: Baseline base year equals FY 2011-12, baseline revenue reflects full earmark of sales tax
revenue to revenue sharing.
The initial GF/GP and SAF baseline revenue estimate for FY 2013-14 was made in December 2011 at $20.7 billion, as shown in Table 8. This estimate was increased by $193.0 million at the January 2012 Consensus Revenue Estimating Conference and increased by $88.7 million at the May 2012 Consensus Revenue Estimating Conference. At the January 2013 Consensus Revenue Estimating Conference the estimate was lowered by $133.4 million. The Senate Fiscal Agency's

32
revised estimate for FY 2013-14 presented in this report increases the baseline estimate $226.3 million above the January 2013 consensus estimate, to $21.1 billion.
The initial GF/GP and SAF baseline revenue estimate for FY 2014-15 was made in December 2012 at $21.1 billion, as shown in Table 9. This estimate was increased by $420.6 million at the January 2013 Consensus Revenue Estimating Conference. The Senate Fiscal Agency's revised estimate for FY 2014-15 presented in this report increases the baseline estimate $123.1 million above the January 2013 consensus estimate, to $21.6 billion.
Table 8
CHANGES IN SENATE FISCAL AGENCY BASELINE REVENUE ESTIMATES FOR FY 2013-14
(Millions of Dollars)
Forecast Date GF/GP SAF Total
December 28, 2011 $8,758.2 $11,930.7 $20,688.9 January 14, 2012 a) 8,790.6 12,091.2 20,881.9 May 9, 2012 8,855.3 12,152.4 21,007.7 May 16, 2012 a) 8,768.9 12,201.7 20,970.6 December 28, 2012 8,610.4 12,106.8 20,717.2 January 11, 2013 a) 8,678.0 12,159.2 20,837.2 May 13, 2013 8,882.9 12,180.6 21,063.5 Change From Previous Estimate: Dollar Change $204.9 $21.4 $226.3 Percent Change 2.4% 0.2% 1.1% Change From Initial Estimate: Dollar Change $124.7 $249.9 $374.6 Percent Change 1.4% 2.1% 1.8% a) Consensus estimate between the Senate Fiscal Agency, House Fiscal Agency, and Department of
Treasury. Note: Baseline base year equals FY 2011-12, baseline revenue reflects full earmark of sales tax
revenue to revenue sharing.
Table 9
CHANGES IN SENATE FISCAL AGENCY BASELINE REVENUE ESTIMATES FOR FY 2014-15
(Millions of Dollars)
Forecast Date GF/GP SAF Total
December 28, 2012 $8,697.4 $12,366.0 $21,063.4 January 11, 2013 a) 8,962.2 12,521.8 21,484.0
May 13, 2013 9,068.0 12,539.1 21,607.1 Change From Previous Estimate: Dollar Change $105.8 $17.3 $123.1 Percent Change 1.2% 0.1% 0.6% Change From Initial Estimate: Dollar Change $370.6 $173.1 $543.7 Percent Change 4.3% 1.4% 2.6% a) Consensus estimate between the Senate Fiscal Agency, House Fiscal Agency, and Department of
Treasury. Note: Baseline base year equals FY 2011-12, baseline revenue reflects full earmark of sales tax
revenue to revenue sharing.

BU
DG
ET
ST
AB
ILIZ
AT
ION
FU
ND


33
BUDGET STABILIZATION FUND The Counter-Cyclical Budget and Economic Stabilization Fund (BSF) was established by Public Act 76 of 1977. The BSF is a cash reserve to which the State, in years of economic growth, adds revenue, and from which, in years of economic recession, the State withdraws revenue. The Fund's purposes are to mitigate the adverse effects on the State budget of downturns in the business cycle and to reserve funds that can be available during periods of high unemployment for State projects that will increase job opportunities. The requirements for contributions to and withdrawals from the BSF are established in State law. By statute, revenue may be added to the BSF when Michigan personal income, less transfer payments and adjusted for inflation, increases by more than 2.0%. When the growth in real personal income less transfer payments is over 2.0%, the pay-in to the BSF is equal to the percentage growth in excess of 2.0% multiplied by the total General Fund/General Purpose (GF/GP) revenue. Funds may be transferred out of the BSF for budget stabilization purposes when Michigan personal income less transfer payments, adjusted for inflation, decreases on a calendar-year basis. The withdrawal equals the percentage decline in adjusted real personal income multiplied by the annual GF/GP revenue. Thus, funds contributed to the BSF in growth years are used to supplement current revenue during a recession, reducing the need either to increase taxes or to reduce State services in a time of poor economic conditions. Withdrawals from the BSF also are permitted for State job creation programs in times of high unemployment. When the State's unemployment rate averages between 8.0% and 11.9% during a calendar quarter, 2.5% of the balance in the BSF may be withdrawn during the subsequent quarter and appropriated for projects that will create job opportunities. If the unemployment rate averages 12.0% or higher for a calendar quarter, up to 5.0% of the BSF balance may be withdrawn. In order for any payment into or out of the BSF actually to occur under either the personal income or the unemployment rate formula described above, the payment must be appropriated by the Legislature. In addition, the Legislature may appropriate transfers into or out of the BSF even if the formulas do not trigger a transfer. For example, in FY 1998-99, the Legislature appropriated a transfer into the BSF of $55.2 million in response to the personal income formula; however, the Legislature also appropriated to the BSF the ending balance of the General Fund/General Purpose budget, which equaled $189.2 million. Also in FY 1998-99, the Legislature appropriated the transfer of $73.7 million from the BSF to the School Aid Fund to finance scheduled payments to K-12 school districts required under the Durant court case. Table 10 presents the recent history of the BSF in terms of actual transfers into and out of the Fund, interest earnings, and year-end balances from FY 1998-99 through FY 2011-12. Also presented in this table are the SFA's estimates for FY 2012-13, FY 2013-14, and FY 2014-15. The BSF year-end balance as a percentage of GF/GP and SAF revenue is shown in Figure 15, and the estimated economic stabilization trigger calculations for FY 2012-13, FY 2013-14, and FY 2014-15 are presented in Table 11. FY 2011-12 The BSF ended FY 2010-11 with a balance of $2.2 million. During FY 2011-12, $362.7 million was deposited into the Fund, and the Fund earned $0.2 million in interest (primarily due to low interest rates), leaving an ending balance of $365.1 million.

34
FY 2012-13, FY 2013-14, AND FY 2014-15 Based on the SFA's revised estimates of personal income, transfer payments, and the Detroit Consumer Price Index (CPI), the budget stabilization formula does not trigger any payments into or withdrawals from the Fund for FY 2012-13. However, based on the appropriations that have been enacted for FY 2012-13, a transfer of $140.0 million will be made into the Fund. While the Governor has recommended that an additional $75.0 million be deposited into the Fund during FY 2013-14, any transfer into the BSF will need to be approved by the Legislature. No transfer out of, or into, the BSF is calculated for either FY 2013-14 or FY 2014-15, as shown in Table 11. Given the enacted appropriations for FY 2012-13, combined with the revised year-end balance estimates presented later in this report, no transfers out of the BSF are anticipated over the forecast period.
Table 10 BUDGET AND ECONOMIC STABILIZATION FUND TRANSFERS, EARNINGS AND FUND BALANCE
FY 1998-99 TO FY 2014-15 ESTIMATE (Millions of Dollars)
Fiscal Year Pay-In Interest Earned Pay-Out Fund Balance
1998-99 $244.4 $51.2 $73.7 $1,222.5 1999-00 100.0 73.9 132.0 1,264.4
2000-01 0.0 66.7 337.0 994.2 2001-02 0.0 20.8 869.8 145.2 2002-03 0.0 1.8 147.0 0.0 2003-04 81.3 0.0 0.0 81.3 2004-05 0.0 2.0 81.3 2.0 2005-06 0.0 0.0 0.0 2.0 2006-07 0.0 0.1 0.0 2.1 2007-08 0.0 0.1 0.0 2.2 2008-09 0.0 0.0 0.0 2.2 2009-10 0.0 0.0 0.0 2.2 2010-11 0.0 0.0 0.0 2.2 2011-12 362.7 0.2 0.0 365.1
Senate Fiscal Agency estimates:
2012-13 140.0 3.7 0.0 508.8 2013-14 0.0 7.6 0.0 516.4 2014-15 0.0 7.7 0.0 524.1

35
0.1 0.1 0.1
4.4
4.8 4.74.5 4.5
4.0
2.0
0.2
2.9
6.46.6
7.36.9
5.7
6.5 6.4
5.2
0.8
0.00.4
0.0 0.0 0.0 0.0 0.0 0.0 0.1
1.8
2.5 2.5 2.4
Fiscal Year
'81-82'82-83
'83-84'84-85
'85-86'86-87
'87-88'88-89
'89-90'90-91
'91-92'92-93
'93-94'94-95
'95-96'96-97
'97-98'98-99
'99-00'00-01
'01-02'02-03
'03-04'04-05
'05-06'06-07
'07-08'08-09
'09-10'10-11
'11-12'12-13
'13-14'14-15
-0.5
0.5
1.5
2.5
3.5
4.5
5.5
6.5
7.5
8.5
As a Percent of GF/GP & SAF Revenue
Budget Stabilization Fund Year-End Balance
FY 1980-81 Through FY 2014-15 Estimate
FY ‘12-13, FY ‘13-14 andFY ‘14- 15 are SFA Forecast
Figure 15
Table 11 ESTIMATED ECONOMIC AND BUDGET STABILIZATION FUND TRIGGER
FY 2012-13, FY 2013-14, and FY 2014-15 (Millions of Dollars)
CY 2012 CY 2013 CY 2014 CY 2015
Michigan Personal Income (MPI) $370,599 $379,736 $393,911 $408,745 Less: Transfer Payments 83,672 86,719 91,093 96,116 Subtotal $286,926 $293,017 $302,818 $312,628 Divided by: Detroit CPI, 12 months average ending June 30 (1982-84=1) 2.144 2.182 2.222 2.264 Equals: Real Adjusted MPI $133,859 $134,294 $136,282 $138,068 Percent Change from Prior Year 0.33% 1.48% 1.31% Excess Over 2.0% 0.00% 0.00% 0.00%
FY 2012-13 FY 2013-14 FY 2014-15
Multiplied by: Estimated GF/GP Revenue $9,244.2 $9,481.4 $9,785.2 Equals: Transfer to the BSF $0.0 $0.0 $0.0 OR Transfer from the BSF $0.0 $0.0 $0.0 Note: Numbers may not add due to rounding. CY = Calendar Year; FY = Fiscal Year


C
OM
PL
IAN
CE
WIT
H
S
TA
TE
RE
VE
NU
E L
IMIT


36
COMPLIANCE WITH STATE REVENUE LIMIT
Article IX, Section 26 of the Michigan Constitution establishes a limit on the amount of revenue State government may collect in any fiscal year. This section of the Constitution was adopted by a vote of the people in 1978 and the limit was first applicable in FY 1979-80. In the first 15 years this revenue limit was in effect (FY 1979-80 to FY 1993-94), the revenue limit was never exceeded. The largest gap between revenue and the limit occurred in FY 2008-09, when State revenue was $8.0 billion below the revenue limit. In FY 1994-95, State revenue exceeded the revenue limit, for the first time, by $109.6 million. This was due to new State revenue being generated as part of the school financing reform that was enacted in 1994. In FY 1995-96 through FY 1997-98, revenue fell below the revenue limit again. In FY 1998-99 and FY 1999-2000, revenue exceeded the limit, but not by enough to require refunds to be paid to taxpayers. In FY 2000-01 through FY 2006-07, revenue fell well below the revenue limit and then remained well below the revenue limit in FY 2007-08 despite increases in the income and Michigan business tax rates. Based on the SFA's latest economic forecast and revenue estimates, it is estimated that revenue subject to the revenue limit will continue to remain well below the revenue limit in FY 2012-13 through FY 2014-15. THE REVENUE LIMIT The revenue limit specifies that for any fiscal year, State government revenue may not exceed a certain percentage of Michigan personal income. The Constitution requires that the limit be calculated each year using the percentage that State government revenue in FY 1978-79 was of Michigan personal income in calendar year 1977, which equaled 9.49%. Therefore, for any fiscal year, State government revenue may not exceed 9.49% of Michigan total personal income for the calendar year prior to the calendar year in which the fiscal year begins. For example, in FY 2009-10, State government revenue could not exceed 9.49% of personal income for calendar year 2008. Given that Michigan personal income for 2008 equaled $349.6 billion at the time compliance was determined, the revenue limit for FY 2009-10 was $33.2 billion. State government revenue subject to the limit includes total State government tax revenue and all other State government revenue, such as license fees, and interest earnings. For purposes of the limit, State government revenue does not include Federal aid. Personal income is a measure of the total income received by individuals, including wages and salaries, proprietors' income, interest and dividend income, rental income, and transfer payments. It is the broadest measure of overall economic activity for the State of Michigan and is estimated by the U.S. Department of Commerce's Bureau of Economic Analysis. REQUIREMENTS IF REVENUE LIMIT IS EXCEEDED If final revenue exceeds the revenue limit, the Constitution and State law provide procedures to deal with this event. If revenue exceeds the limit by less than 1.0%, the excess revenue must be deposited into the Budget Stabilization Fund. If the revenue limit is exceeded by 1.0% or more, the excess revenue must be refunded to individual and business taxpayers, on a pro rata basis. These refunds would be given to taxpayers who file an annual return under the Income Tax Act (including a Corporate Income Tax return) in the following fiscal year, because these taxpayers would have made withholding and quarterly estimated payments during the fiscal year when the revenue limit was exceeded. The law requires that these refunds occur in the fiscal year following the filing of the report which determines that the limit was exceeded. This report for any particular fiscal year is typically issued in the spring following the end of the fiscal year.
37
REVENUE LIMIT COMPLIANCE PROJECTIONS Based on final revenue for FY 2011-12 and the SFA's revenue estimates for FY 2012-13, FY 2013-14, and FY 2014-15, revenue subject to the constitutional revenue limit is estimated to remain well below the limit for each of these fiscal years. The SFA's estimates of the State's compliance with the revenue limit are presented in Table 12. FY 2011-12 In FY 2011-12, the revenue limit equaled 9.49% of Michigan's personal income in calendar year 2010. According to the U.S. Department of Commerce's Bureau of Economic Analysis, Michigan personal income for 2010 was $339.0 billion, so the revenue limit equaled $32.2 billion. Based on the final revenue for FY 2011-12, revenue subject to the limit totaled $26.4 billion. As a result, revenue subject to the limit fell below the revenue limit by $5.7 billion, or 17.8%. The gap between the revenue limit and revenue subject to the limit increased in FY 2011-12 because personal income grew more rapidly between 2009 and 2010 than did revenue between FY 2010-11 and FY 2011-12. FY 2012-13 In FY 2012-13, the revenue limit will equal 9.49% of Michigan's personal income in calendar year 2011. The Bureau of Economic Analysis estimate of Michigan personal income in calendar year 2011 equals $358.2 billion, resulting in a revenue limit of $34.0 billion for FY 2012-13. Based on the SFA's revised revenue estimates for FY 2012-13, revenue subject to the revenue limit will equal an estimated $27.0 billion, and will fall below the limit by $7.0 billion, or 20.6%, in FY 2012-13. The increase in the gap between estimated revenue and the limit during FY 2012-13 reflects the 2.1% increase in revenue subject to the limit combined with the 5.6% increase in personal income during 2011. The 2011 increase in personal income raises the FY 2012-13 revenue limit by $1.8 billion. FY 2013-14 The preliminary Bureau of Economic Analysis estimate for Michigan personal income during 2012 equals $370.6 billion, and as a result, the revenue limit will equal $35.2 billion in FY 2013-14. Based on the SFA's revised revenue estimates for FY 2013-14, revenue subject to the revenue limit will equal an estimated $27.6 billion. As a result, revenue subject to the revenue limit will fall below the limit by an estimated $7.5 billion, or 21.4%, in FY 2013-14. The additional increase in the gap between estimated revenue and the limit during FY 2013-14 reflects factors similar to those during FY 2012-13. Revenue subject to the limit is estimated to increase 2.4% in FY 2013-14, compared with the 3.5% increase in personal income during 2012, which raises the revenue limit by $1.2 billion. FY 2014-15 The SFA estimates that personal income in Michigan during 2013 will equal $379.7 billion, and as a result, the revenue limit will equal $36.0 billion in FY 2014-15. Based on the SFA's revised revenue estimates for FY 2014-15, revenue subject to the revenue limit will equal an estimated $28.4 billion. As a result, revenue subject to the revenue limit will fall below the limit by an estimated $7.6 billion, or 21.1% in FY 2014-15.

38
Table 12 COMPLIANCE WITH CONSTITUTIONAL REVENUE LIMIT
SECTION 26 OF ARTICLE IX OF THE STATE CONSTITUTION FY 2010-11 THROUGH FY 2014-15 ESTIMATE
(Millions of Dollars)
FY 2010-11 Final
FY 2011-12 Estimate
FY 2012-13 Estimate
FY 2013-14 Estimate
FY 2014-15 Estimate
Revenue Subject to Limit Revenue: Gen’l Fund/Gen’l Purpose (baseline) $8,604.1 $9,169.4 $9,803.9 $9,929.6 $10,159.3 Constitutional Revenue Sharing (baseline) 664.7 707.5 704.4 737.1 768.5 School Aid Fund (baseline) 11,260.5 11,613.9 11,946.6 12,180.6 12,539.1 Transportation Funds 2,028.9 2,041.4 2,109.5 2,122.3 2,137.2 Other Restricted Non-Federal Aid Revenue 3,595.9 3,631.9 3,740.8 3,853.0 3,968.6 Adjustments: GF/GP Federal Aid (17.3) (54.8) (20.0) (20.0) (25.0) GF/GP Balance Sheet Adjustments 208.9 70.9 (556.6) (442.2) (366.1) SAF Balance Sheet Adjustments (12.4) (734.9) (729.1) (721.7) (733.2) Total Revenue Subject to Limit $26,333.3 $26,445.3 $26,999.5 $27,638.7 $28,448.4
Revenue Limit Personal Income: Calendar Year CY 2009 CY 2010 CY 2011 CY 2012 CY 2013
Amount $328,942 $339,044 $358,152 $370,599 $379,736 Revenue Limit Ratio 9.49% 9.49% 9.49% 9.49% 9.49% Revenue Limit $31,216.6 $32,175.3 $33,988.6 $35,169.8 $36,036.9 1.0% of Limit 312.2 321.8 339.9 351.7 360.4 Amount Under (Over) Limit $4,883.3 $5,730.0 $6,989.0 $7,531.1 $7,588.6 Percent Below Limit 15.6% 17.8% 20.6% 21.4% 21.1%


ES
TIM
AT
E O
F
YE
AR
-EN
D B
AL
AN
CE
S


39
ESTIMATE OF YEAR-END BALANCES
Based on the economic and revenue forecasts outlined earlier in this report, along with enacted and projected State appropriations, the Senate Fiscal Agency (SFA) has revised its estimates of the FY 2012-13, FY 2013-14, and FY 2014-15 General Fund/General Purpose (GF/GP) and School Aid Fund (SAF) year-end balances. This section of the report discusses the year-end balances and addresses the issues the members of the Legislature are facing as they attempt to complete action on the FY 2013-14 State budget. On February 7, 2013, Governor Rick Snyder presented his FY 2013-14 and FY 2014-15 State budget recommendations to the Legislature. The numbers contained in the Governor's budget recommendations were based on the consensus revenue estimates agreed to on January 11, 2013, fee adjustments of $90.4 million, and passage of legislation that would allow Health Insurance Claims Assessment (HICA) revenue to achieve a level of $400.0 million. The Governor also proposed to increase fuel taxes and vehicle registration fees by $1.2 billion in order to fund his transportation investment package. The Governor's FY 2013-14 budget recommendation was balanced between estimated revenue and recommended appropriations pursuant to constitutional requirements. Since the Governor introduced the FY 2013-14 State budget to the Legislature in February 2013, several factors have changed, which will have a direct impact on the final decisions to be made by the Legislature on the State budget. The recent performance of the United States and Michigan economies has generally tracked the levels assumed at the January 2013 Consensus Revenue Estimating Conference. However, estimates of State income tax withholding amounts and Michigan Business Tax receipts appear to have been understated in January. This results in a fairly substantial increase from January to May in the estimates of FY 2012-13 GF/GP revenue and increases GF/GP revenue estimates for FY 2013-14 and FY 2014-15, but at a lower rate. The SFA also is estimating an increase in SAF revenue from the January 2013 consensus for FY 2012-13 with smaller increases from the January 2013 SAF estimates for FYs 2013-14 and 2014-15. Table 13 provides a summary of the SFA's estimates of the FY 2012-13, FY 2013-14, and FY 2014-15 year-end balances of the GF/GP and SAF budgets; Tables 14 and 15 provide more detail regarding these year-end balances. Based on current SFA revenue estimates along with enacted and projected State appropriations, the FY 2012-13 GF/GP budget will have a surplus of $592.5 million and the SAF budget will have a surplus of $146.8 million. Based on current SFA revenue estimates along with Senate-passed State appropriations and SFA estimates of caseload changes, the FY 2013-14 GF/GP budget will have a surplus of $252.7 million and the SAF budget will have a surplus of $165.9 million. A comparison of the SFA's estimate of FY 2014-15 revenue with FY 2014-15 appropriations continued at the FY 2013-14 Senate-passed level, adjusted for Senate caseload estimates and a 1.8% economic increase, leads to a projected $60.3 million GF/GP budget surplus and a projected $122.4 million SAF surplus.
Table 13
GENERAL FUND/GENERAL PURPOSE AND SCHOOL AID FUND SFA ESTIMATED YEAR-END BALANCES
(Millions of Dollars)
FY 2012-13 Estimate
FY 2013-14 Estimate
FY 2014-15 Estimate
General Fund/General Purpose $592.5 $252.7 $60.3 School Aid Fund
$146.8 $165.9 $122.4

40
Table 14
FY 2012-13, FY 2013-14, AND FY 2014-15 GENERAL FUND/GENERAL PURPOSE (GF/GP) REVENUE, EXPENDITURES, AND YEAR-END BALANCE ESTIMATES
(Millions of Dollars)
FY 2012-13 FY 2013-14 FY 2014-15
Revenue: Beginning Balance .................................................................... $979.2 $592.5 $252.7
Ongoing Revenue: Consensus Revenue Estimate (January 2013) ........................ $8,792.2 $9,264.4 $9,639.9 May 2013 SFA Estimate Revenue Change .............................. 452.0 217.0 145.3 SFA Revenue Estimate (May 2013) ......................................... $9,244.2 $9,481.4 $9,785.2 Other Revenue Adjustments: Revenue Sharing Payments ................................................. (350.6) (358.6) (358.6) Shift of Borrowing Costs to School Aid Fund........................ 3.2 6.0 8.0 Sales Tax Revenue Shift from GF to Transportation Funds 0.0 (129.2) (129.2) Subtotal Ongoing Revenue....................................................... $8,896.8 $8,999.6 $9,305.4 Non-Ongoing Revenue: One-Time Appropriation for Revenue Sharing ......................... (20.0) (22.0) (22.0) Liquor Purchase Revolving Fund Lapse ................................... (2.0) 0.0 0.0 Total Estimated GF/GP Revenue ........................................... $9,854.0 $9,570.1 $9,536.1
Expenditures: Initial Ongoing and One-Time Appropriations (Senate) ........... $8,994.2 $9,213.3 $9,397.5 One-Time Appropriation to Budget Stabilization Fund ............. 140.0 0.0 0.0 One-Time Appropriation to Michigan Health Savings Fund ..... 0.0 0.0 0.0 Enacted Supplementals ............................................................ 42.5 0.0 0.0 Pending Supplementals ............................................................ 15.0 0.0 0.0 Pending DCH/DHS Caseload/Cost Supplemental ................... (57.4) 0.0 0.0 Additional Caseload and Cost Adjustments (DCH/DHS) ......... 7.6 (19.9) (13.3) Health Insurance Claims Assessment Revenue Shortfall ........ 137.0 124.0 110.0 Estimated Debt Service Savings-Refinancing of SBA Bonds .. (17.4) 0.0 0.0 Total Estimated GF/GP Expenditures ................................... $9,261.5 $9,317.4 $9,475.8
Projected Year-End GF/GP Balance ..................................... $592.5 $252.7 $60.3

41
Table 15 FY 2012-13, FY 2013-14, AND FY 2014-15 SCHOOL AID FUND (SAF)
REVENUE, EXPENDITURES, AND YEAR-END BALANCE ESTIMATES (Millions of Dollars)
FY 2012-13 FY 2013-14 FY 2014-15
Revenue: Beginning Balance .................................................................... $254.1 $146.8 $165.9
Ongoing Revenue: Consensus Revenue Estimate (January 2013) ........................ $11,127.7 $11,432.5 $11,768.8 May 2013 SFA Estimate Revenue Change .............................. 89.9 26.4 37.1 SFA Revenue Estimate (May 2013) ......................................... $11,217.6 $11,458.9 $11,805.9 Other Revenue Adjustments: General Fund/General Purpose Grant ................................. 282.4 180.0 230.0 Federal Ongoing Aid ............................................................. 1,701.0 1,764.4 1,764.4 MPSERS Retirement Obligation Reform Reserve Fund ...... 0.0 150.0 0.0 Subtotal Ongoing Revenue....................................................... $13,201.0 $13,553.3 $13,800.3 Non-Ongoing Revenue: General Fund/General Purpose Grant ..................................... 0.0 49.6 0.0 Total Estimated School Aid Fund Revenue ......................... $13,455.1 $13,749.7 $13,966.2
Expenditures: Initial Ongoing and One-Time Appropriations (Senate) ........... $12,944.5 $13,225.7 $13,225.7 Enacted Supplemental: PA 465 of 2012 (PILT)........................ 0.2 0.0 0.0 Pending Supplementals ............................................................ 20.0 0.0 0.0 Cost Adjustments/Pupil Blend Savings (SFA Estimate) ........... (54.5) (40.0) 220.0 Partially Fund Community Colleges with School Aid Fund ...... 197.6 197.6 197.6 Partially Fund Higher Education with School Aid Fund ............ 200.5 200.5 200.5 Total Estimated School Aid Fund Expenditures ................. $13,308.3 $13,583.8 $13,843.8
Projected Year-End School Aid Fund Balance .................... $146.8 $165.9 $122.4 FY 2012-13 YEAR-END BALANCE During May and June 2012, the Michigan Legislature approved FY 2012-13 GF/GP budgets that were balanced between estimated revenue and enacted appropriations. The initial budget approved by the Legislature was based on a May 2012 consensus revenue estimate. The revisions to the consensus revenue estimates agreed to in January 2013 reflected decreases in both GF/GP and SAF revenue, but the enacted FY 2012-13 GF/GP and SAF budgets were still in balance. The current SFA revenue estimates, which result in increases in both GF/GP and SAF revenue from the January 2013 consensus, produce a surplus in the FY 2012-13 GF/GP budget of $592.5 million and a surplus in the FY 2012-13 SAF budget of $146.8 million. Under current law, ending balances for both the GF/GP budget and the SAF budget are carried forward into the ensuing fiscal year, and have already been built into the FY 2013-14 budgets proposed by the Governor and the Legislature. Table 16 provides the details of the SFA's estimate of a $592.5 million FY 2012-13 GF/GP budget surplus. On the revenue side of the FY 2012-13 GF/GP budget ledger, the SFA now believes that current-law GF/GP revenue will total $9.2 billion. This projected level of FY 2012-13 GF/GP revenue represents a $21.0 million or 0.2% decrease from the final level of FY 2011-12 GF/GP revenue. The May 2013 SFA estimate of current-law GF/GP revenue is up $452.0 million from the January 2013 consensus revenue estimate. The FY 2012-13 estimated GF/GP revenue total of $9.85 billion includes $979.2 million of surplus revenue carried forward from FY 2011-12, adjustments of $370.6 million to reflect statutory State revenue sharing payments, the shifting of $3.2 million

42
in short-term borrowing costs to the School Aid Fund, and $2.0 million of revenue from the lapse of liquor purchase revolving funds. On the expenditure side of the FY 2012-13 GF/GP budget ledger, the SFA now believes that final GF/GP expenditures will total $9.3 billion which includes $140.0 million in GF/GP appropriations to the State's Budget Stabilization Fund. This projected level of FY 2012-13 GF/GP expenditures reflects a $652.5 million or 7.6% increase from the final level of FY 2011-12 GF/GP expenditures. It should be noted that over $200.0 million of this increase is due to an increase in the GF/GP grant to the School Aid budget. The projected level of FY 2012-13 GF/GP expenditures includes enacted appropriations, pending supplemental appropriations, projected caseload and cost estimates in the Departments of Community Health and Human Services, and a potential estimated $137.0 million shortfall in Health Insurance Claims Assessments (HICA) revenue that could be replaced with GF/GP revenue. The Governor recommended replacing the HICA revenue with revenue from the Medicaid Benefits Trust Fund and the Merit Award Trust Fund.
Table 16 FY 2012-13
GENERAL FUND/GENERAL PURPOSE REVENUE, EXPENDITURES, AND YEAR-END BALANCE
(Millions of Dollars) SFA Estimate
Revenue: Beginning Balance .............................................................................................................. $979.2
Ongoing Revenue: May 2013 Senate Fiscal Agency Estimate .................................................................... $9,244.2 Revenue Sharing Payments .......................................................................................... (350.6) One-Time Appropriation for Revenue Sharing .............................................................. (20.0) Shift of Short-Term Borrowing Costs to School Aid Fund ............................................. 3.2 Subtotal Ongoing Revenue ................................................................................................ $8,876.8 Non-Ongoing Revenue: Reduction of Liquor Purchase Revolving Fund Lapse to General Fund ....................... (2.0) Subtotal Non-Ongoing Revenue ........................................................................................ ($2.0) Total Estimated GF/GP Revenue .................................................................................... $9,854.0
Expenditures: Initial Ongoing Appropriations ............................................................................................ $8,628.5 Initial One-Time Appropriations .......................................................................................... 365.7 Subtotal Initial Ongoing and One-Time Appropriations ...................................................... $8,994.2 Other Adjustments: Estimated Debt Service Savings-Refinancing of SBA Bonds ....................................... ($17.4) One-Time Appropriation to Budget Stabilization Fund .................................................. 140.0 Caseload and Cost Adjustments for DCH (SFA Estimate) ........................................... (30.2) Caseload and Cost Adjustments for DHS (SFA Estimate) ............................................ (19.6) Health Insurance Claims Assessment Revenue Shortfall ............................................. 137.0 Public Act 305 of 2012 (Agriculture Loan Program) ...................................................... 15.0 Public Acts 348 and 349 of 2012 (Right-to-Work) ......................................................... 2.0 Public Act 436 of 2012 (Emergency Manager) .............................................................. 5.8 Public Act 518 of 2012 (Indigent Burial/PILT) ............................................................... 5.2 Public Act 9 of 2013 (Vets Service Delivery/Harbor Dredging) ..................................... 14.5 Pending Supplementals (Treasury/Community Colleges' MPSERS) ........................... 15.0 Subtotal Other Adjustments ............................................................................................... $267.3 Total Estimated GF/GP Expenditures ............................................................................. $9,261.5
Projected Year-End GF/GP Balance ............................................................................... $592.5

43
Table 17 provides a summary of the SFA estimate of a $146.8 million FY 2012-13 SAF budget surplus. This surplus estimate is based on a comparison of estimated revenue, enacted appropriations, and estimated final SAF expenditures.
Table 17 FY 2012-13
SCHOOL AID FUND REVENUE, EXPENDITURES, AND YEAR-END BALANCE
(Millions of Dollars) SFA Estimate
Revenue: Beginning Balance ........................................................................................................... $254.1
May 2013 Senate Fiscal Agency Estimate ...................................................................... $11,217.6 Other Revenue Adjustments: General Fund/General Purpose Grant ......................................................................... 282.4 Federal Ongoing Aid .................................................................................................... 1,701.0 Subtotal Ongoing Revenue .............................................................................................. $13,201.0 Total Estimated School Aid Fund Revenue ................................................................. $13,455.1
Expenditures: Ongoing Appropriations: Initial Ongoing K-12 Appropriations (Public Act 201 of 2012) ..................................... $12,750.2 Cost Adjustments (SFA Estimate) ............................................................................... (54.5) Partially Fund Community Colleges with School Aid Fund .......................................... 197.6 Partially Fund Higher Education with School Aid Fund ............................................... 200.5 Subtotal Ongoing Appropriations ..................................................................................... $13,093.8 One-Time Appropriations: Best Practices Grants .................................................................................................. $80.0 Technology Grants ....................................................................................................... 50.0 Consolidation Innovation Grants .................................................................................. 10.0 MPSERS Retirement Obligation Reform Reserve Fund ............................................. 41.0 Class-Size Grants ........................................................................................................ 13.3 Public Act 465 of 2012 (PILT Supplemental) ............................................................... 0.2 Pending Supplemental Request (MPSERS) ................................................................ 20.0 Subtotal One-Time Appropriations ................................................................................... $214.5 Total Estimated School Aid Fund Expenditures ......................................................... $13,308.3
Projected Year-End School Aid Fund Balance ........................................................... $146.8
On the revenue side of the FY 2012-13 SAF budget ledger, the SFA now believes that current-law SAF revenue will total $11.2 billion. This projected level of SAF revenue represents a $338.7 million or 3.1% increase from the final level of FY 2011-12 SAF revenue. The May 2013 SFA estimate of current-law SAF revenue is $89.9 million above the January 2013 consensus revenue estimate. The FY 2012-13 estimated SAF revenue total of $13.5 billion includes $254.1 million of surplus revenue carried forward from FY 2011-12, $11.2 billion of restricted SAF revenue, a $282.4 million GF/GP grant, and $1.7 billion of ongoing Federal aid. On the expenditure side of the FY 2012-13 SAF budget ledger, the SFA now believes that final SAF expenditures will total $13.3 billion. This projected level of FY 2012-13 SAF expenditures reflects essentially no change from the final level of FY 2011-12 SAF expenditures. The $13.3 billion of projected SAF expenditures includes $12.9 billion of K-12 funding in the original enacted appropriation bill, enacted supplemental funding of $200,000 for payments in lieu of taxes for school

44
districts, a pending supplemental for $20.0 million, and a reduction of $54.5 million due to other formula cost adjustments. As in the prior year, Community Colleges and Higher Education received appropriations of $197.6 million and $200.5 million, respectively, from the School Aid Fund. FY 2013-14 YEAR-END BALANCE The Legislature has been considering Governor Snyder's FY 2013-14 State budget recommendation since the budget was presented to the Legislature on February 7, 2013. To date, the Senate and House have acted on all of the appropriation bills necessary to implement the budget, except the Senate has not yet passed the Department of Community Health (DCH) budget bill. The tables in this report reflect the Senate Appropriations Subcommittee recommendation for the DCH budget. Using the Senate-passed and the DCH Subcommittee appropriation bills as the basis of the FY 2013-14 budget, there will be positive ending balances for both the GF/GP and the SAF balance sheets. Table 18 provides a summary of the $252.7 million projected year-end balance in the FY 2013-14 GF/GP budget. This projected balance is based on the FY 2012-13 projected year-end balance carry-forward, the SFA estimate of current-law revenue, revenue adjustments that are part of the Senate-passed appropriation bills, and the Senate-passed appropriation levels.
Table 18
FY 2013-14 GENERAL FUND/GENERAL PURPOSE
REVENUE, EXPENDITURES, AND YEAR-END BALANCE (Millions of Dollars)
SFA Estimate
Revenue: Beginning Balance ............................................................................................... $592.5
Ongoing Revenue: May 2013 Senate Fiscal Agency Estimate ...................................................... $9,481.4 Revenue Sharing Payments ............................................................................ (358.6) Shift of Short-Term Borrowing Costs to School Aid Fund ............................... 6.0 Shift of Sales Tax Revenue from General Fund to Transportation Funds ...... (129.2) Subtotal Ongoing Revenue .................................................................................. $8,999.6 Non-Ongoing Revenue: One-Time Appropriation for Revenue Sharing ..................................................... (22.0) Total Estimated GF/GP Revenue ...................................................................... $9,570.1
Expenditures: Senate-Passed Appropriations ............................................................................ $9,213.3 Other Adjustments: Caseload and Cost Adjustments for DCH (SFA Estimate).............................. $2.4 Caseload and Cost Adjustments for DHS (SFA Estimate) .............................. (22.3) Health Insurance Claims Assessment Revenue Shortfall ............................... 124.0 Subtotal Other Adjustments ................................................................................. $104.1 Total Estimated GF/GP Expenditures .............................................................. $9,317.4
Projected Year-End GF/GP Balance ................................................................. $252.7

45
On the revenue side of the FY 2013-14 GF/GP budget ledger, the SFA now believes that current-law GF/GP revenue will total $9.5 billion. This projected level of FY 2013-14 GF/GP revenue reflects a $237.2 million or 2.6% increase from the estimated level of FY 2012-13 GF/GP revenue. The May 2013 SFA estimate of current-law revenue represents a $217.0 million increase from the January 2013 consensus revenue estimate. The Senate-passed GF/GP appropriation bills include statutory revenue sharing payments of $380.6 million, which reduce GF/GP revenue by that amount. The FY 2013-14 estimated GF/GP revenue total of $9.6 billion assumes enactment of Senate Bill 6, which redirects an estimated $129.2 million of sales tax revenue from the State's General Fund to transportation funds. The total estimated GF/GP revenue also reflects the shifting of $8.0 million in short-term borrowing costs to the School Aid Fund and includes $40.0 million of insurance tax revenue from Blue Cross Blue Shield, which was recently authorized to convert to a nonprofit mutual insurer subject to taxation. The Senate-passed appropriation bills together with the DCH Senate Subcommittee recommendation provide total GF/GP appropriations of $9.2 billion. The Senate bills do not include the Governor's proposal for $1.2 billion of increased revenue in the Department of Transportation for the repair of the State's infrastructure of roads and bridges. The Senate does include sufficient revenue in the Transportation budget to meet Federal match requirements by redirecting (via the intent to enact Senate Bill 6) approximately $129.2 million of sales tax revenue from the State's General Fund to transportation funds. The Senate DCH Subcommittee did not include the Governor's proposed $1.3 billion reform and expansion of the Medicaid program, which would have saved an estimated $181.7 million GF/GP. The DCH appropriation bill assumes an estimated $400.0 million in HICA revenue. If the December 31, 2013, sunset for the HICA statute is not removed or delayed, there would be a $400.0 million revenue shortfall in the DCH budget. If the HICA sunset is removed or delayed, but there are no new provisions for HICA revenue enhancement, there would be an estimated $124.0 million HICA revenue shortfall. Based on revised SFA estimates, caseload and cost adjustments in the Department of Community Health will lead to a $2.4 million GF/GP appropriation increase and caseload and cost changes in the Department of Human Services (DHS) will reduce GF/GP appropriations by $22.3 million. The Senate-passed budget does not include the Governor's proposed $75.0 million GF/GP appropriation to the State's Budget Stabilization Fund or the Governor's $103.0 million GF/GP appropriation (half of the savings from the Medicaid reform plan) to a Michigan Health Savings Fund. Table 19 provides a summary of the Governor's FY 2013-14 Adjusted Gross and GF/GP budget recommendations compared with the Senate-passed and DCH Subcommittee appropriation bills. The Senate-passed and DCH Subcommittee-recommended appropriation bills are $2.6 billion Adjusted Gross, and $1.2 million GF/GP, below the Governor's recommendations. This does not account for the $129.2 million of GF/GP revenue that is proposed to be redirected to transportation funds. Table 20 provides the details of the SFA estimate of a $165.9 million balance in the FY 2013-14 SAF budget. This projected budget balance is based on the SFA's estimate of current-law revenue and the Senate-passed K-12 School Aid, Community Colleges, and Higher Education appropriation bills. On the revenue side of the FY 2013-14 SAF budget, the SFA now believes that current-law SAF revenue will total $11.5 billion. This projected level of FY 2013-14 SAF revenue is $241.3 million or 2.2% above the estimated level of FY 2012-13 SAF revenue. The May 2013 SFA estimate of restricted SAF revenue represents a $26.4 million increase from the January 2013 consensus revenue estimate. The estimate of total SAF revenue of $13.7 billion includes $146.8 million of surplus SAF revenue carried forward from FY 2012-13, a $229.6 million GF/GP grant to the SAF budget, $1.8 billion of ongoing Federal aid, and $150.0 million from the Michigan Public School Employees Retirement System (MPSERS) Retirement Obligation Reform Reserve Fund.
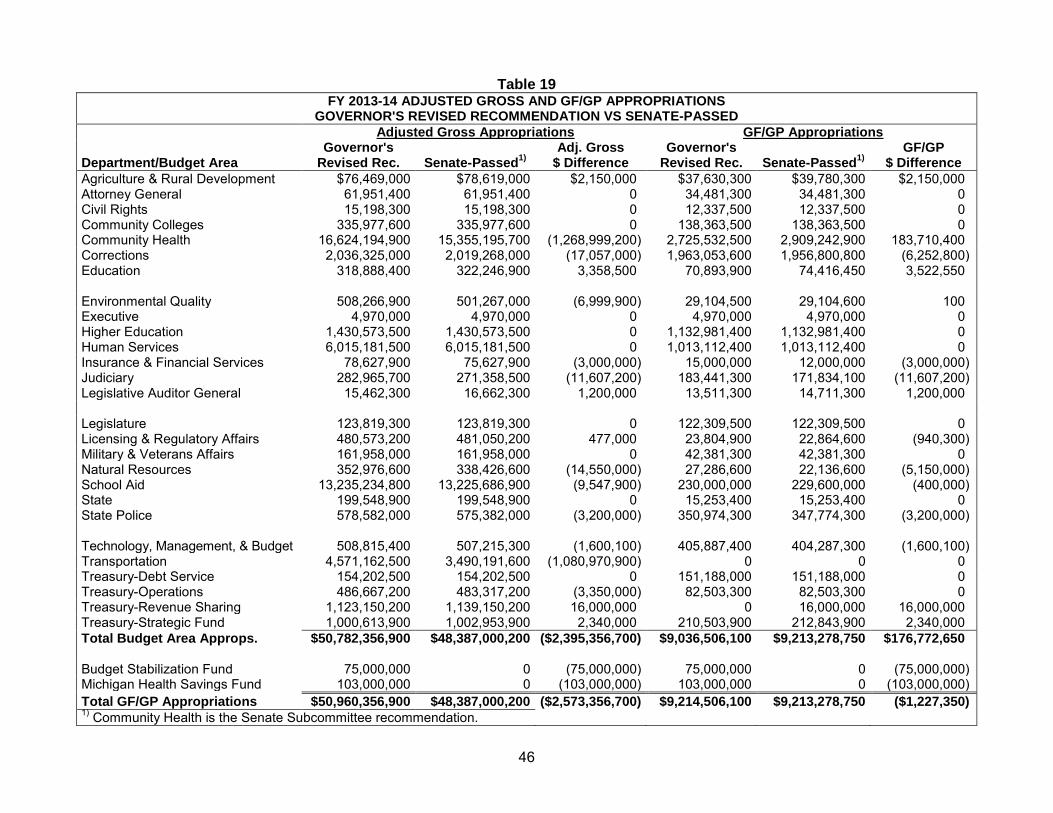
46
Table 19 FY 2013-14 ADJUSTED GROSS AND GF/GP APPROPRIATIONS
GOVERNOR'S REVISED RECOMMENDATION VS SENATE-PASSED
Adjusted Gross Appropriations GF/GP Appropriations
Department/Budget Area Governor's
Revised Rec. Senate-Passed1)
Adj. Gross $ Difference
Governor's Revised Rec. Senate-Passed
1)
GF/GP $ Difference
Agriculture & Rural Development $76,469,000 $78,619,000 $2,150,000 $37,630,300 $39,780,300 $2,150,000 Attorney General 61,951,400 61,951,400 0 34,481,300 34,481,300 0 Civil Rights 15,198,300 15,198,300 0 12,337,500 12,337,500 0 Community Colleges 335,977,600 335,977,600 0 138,363,500 138,363,500 0 Community Health 16,624,194,900 15,355,195,700 (1,268,999,200) 2,725,532,500 2,909,242,900 183,710,400 Corrections 2,036,325,000 2,019,268,000 (17,057,000) 1,963,053,600 1,956,800,800 (6,252,800) Education 318,888,400 322,246,900 3,358,500 70,893,900 74,416,450 3,522,550 Environmental Quality 508,266,900 501,267,000 (6,999,900) 29,104,500 29,104,600 100 Executive 4,970,000 4,970,000 0 4,970,000 4,970,000 0 Higher Education 1,430,573,500 1,430,573,500 0 1,132,981,400 1,132,981,400 0 Human Services 6,015,181,500 6,015,181,500 0 1,013,112,400 1,013,112,400 0 Insurance & Financial Services 78,627,900 75,627,900 (3,000,000) 15,000,000 12,000,000 (3,000,000) Judiciary 282,965,700 271,358,500 (11,607,200) 183,441,300 171,834,100 (11,607,200) Legislative Auditor General 15,462,300 16,662,300 1,200,000 13,511,300 14,711,300 1,200,000 Legislature 123,819,300 123,819,300 0 122,309,500 122,309,500 0 Licensing & Regulatory Affairs 480,573,200 481,050,200 477,000 23,804,900 22,864,600 (940,300) Military & Veterans Affairs 161,958,000 161,958,000 0 42,381,300 42,381,300 0 Natural Resources 352,976,600 338,426,600 (14,550,000) 27,286,600 22,136,600 (5,150,000) School Aid 13,235,234,800 13,225,686,900 (9,547,900) 230,000,000 229,600,000 (400,000) State 199,548,900 199,548,900 0 15,253,400 15,253,400 0 State Police 578,582,000 575,382,000 (3,200,000) 350,974,300 347,774,300 (3,200,000) Technology, Management, & Budget 508,815,400 507,215,300 (1,600,100) 405,887,400 404,287,300 (1,600,100) Transportation 4,571,162,500 3,490,191,600 (1,080,970,900) 0 0 0 Treasury-Debt Service 154,202,500 154,202,500 0 151,188,000 151,188,000 0 Treasury-Operations 486,667,200 483,317,200 (3,350,000) 82,503,300 82,503,300 0 Treasury-Revenue Sharing 1,123,150,200 1,139,150,200 16,000,000 0 16,000,000 16,000,000 Treasury-Strategic Fund 1,000,613,900 1,002,953,900 2,340,000 210,503,900 212,843,900 2,340,000 Total Budget Area Approps. $50,782,356,900 $48,387,000,200 ($2,395,356,700) $9,036,506,100 $9,213,278,750 $176,772,650 Budget Stabilization Fund 75,000,000 0 (75,000,000) 75,000,000 0 (75,000,000) Michigan Health Savings Fund 103,000,000 0 (103,000,000) 103,000,000 0 (103,000,000) Total GF/GP Appropriations $50,960,356,900 $48,387,000,200 ($2,573,356,700) $9,214,506,100 $9,213,278,750 ($1,227,350) 1) Community Health is the Senate Subcommittee recommendation.
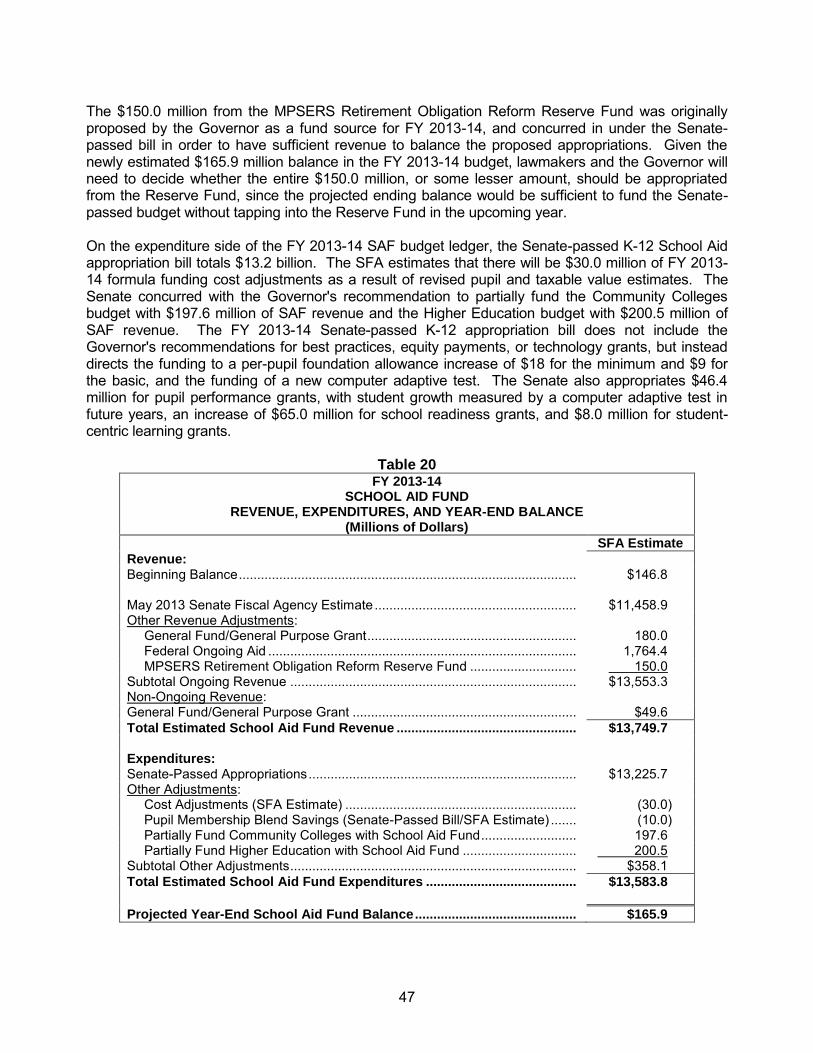
47
The $150.0 million from the MPSERS Retirement Obligation Reform Reserve Fund was originally proposed by the Governor as a fund source for FY 2013-14, and concurred in under the Senate-passed bill in order to have sufficient revenue to balance the proposed appropriations. Given the newly estimated $165.9 million balance in the FY 2013-14 budget, lawmakers and the Governor will need to decide whether the entire $150.0 million, or some lesser amount, should be appropriated from the Reserve Fund, since the projected ending balance would be sufficient to fund the Senate-passed budget without tapping into the Reserve Fund in the upcoming year. On the expenditure side of the FY 2013-14 SAF budget ledger, the Senate-passed K-12 School Aid appropriation bill totals $13.2 billion. The SFA estimates that there will be $30.0 million of FY 2013-14 formula funding cost adjustments as a result of revised pupil and taxable value estimates. The Senate concurred with the Governor's recommendation to partially fund the Community Colleges budget with $197.6 million of SAF revenue and the Higher Education budget with $200.5 million of SAF revenue. The FY 2013-14 Senate-passed K-12 appropriation bill does not include the Governor's recommendations for best practices, equity payments, or technology grants, but instead directs the funding to a per-pupil foundation allowance increase of $18 for the minimum and $9 for the basic, and the funding of a new computer adaptive test. The Senate also appropriates $46.4 million for pupil performance grants, with student growth measured by a computer adaptive test in future years, an increase of $65.0 million for school readiness grants, and $8.0 million for student-centric learning grants.
Table 20
FY 2013-14 SCHOOL AID FUND
REVENUE, EXPENDITURES, AND YEAR-END BALANCE (Millions of Dollars)
SFA Estimate
Revenue: Beginning Balance ............................................................................................ $146.8
May 2013 Senate Fiscal Agency Estimate ....................................................... $11,458.9 Other Revenue Adjustments: General Fund/General Purpose Grant ......................................................... 180.0 Federal Ongoing Aid .................................................................................... 1,764.4 MPSERS Retirement Obligation Reform Reserve Fund ............................. 150.0 Subtotal Ongoing Revenue .............................................................................. $13,553.3 Non-Ongoing Revenue: General Fund/General Purpose Grant ............................................................. $49.6 Total Estimated School Aid Fund Revenue ................................................. $13,749.7
Expenditures: Senate-Passed Appropriations ......................................................................... $13,225.7 Other Adjustments: Cost Adjustments (SFA Estimate) ............................................................... (30.0) Pupil Membership Blend Savings (Senate-Passed Bill/SFA Estimate) ....... (10.0) Partially Fund Community Colleges with School Aid Fund .......................... 197.6 Partially Fund Higher Education with School Aid Fund ............................... 200.5 Subtotal Other Adjustments .............................................................................. $358.1 Total Estimated School Aid Fund Expenditures ......................................... $13,583.8
Projected Year-End School Aid Fund Balance ............................................ $165.9

48
FY 2014-15 BUDGET OUTLOOK When Governor Snyder presented his FY 2013-14 budget on February 7, 2013, he also proposed anticipated appropriations for FY 2014-15. The FY 2013-14 appropriation bills passed by the House and the Senate include references to anticipated FY 2014-15 appropriations, which are only expressions of an intent to appropriate those funds for FY 2014-15. Table 21 provides a summary of the $60.3 million projected year-end balance in the FY 2014-15 GF/GP budget. This projected balance is based on carrying forward the FY 2013-14 projected year-end balance, the SFA estimate of current-law revenue, appropriations continued at the FY 2013-14 Senate-passed level, adjusted for Senate caseload estimates and a 1.8% economic increase, and revised caseload and cost estimates for the DCH and DHS.
Table 21
FY 2014-15 GENERAL FUND/GENERAL PURPOSE
REVENUE, EXPENDITURES, AND YEAR-END BALANCE (Millions of Dollars)
SFA Estimate
Beginning Balance .............................................................................................. $252.7
Ongoing Revenue: May 2013 Senate Fiscal Agency Estimate ..................................................... $9,785.2 Revenue Sharing Payments ........................................................................... (358.6) Shift of Short-Term Borrowing Costs to School Aid Fund .............................. 8.0 Shift of Sales Tax Revenue from General Fund to Transportation Funds ..... (129.2) Subtotal Ongoing Revenue ................................................................................. $9,305.4 Non-Ongoing Revenue: One-Time Appropriation for Revenue Sharing .................................................... (22.0) Total Estimated GF/GP Revenue ..................................................................... $9,536.1
Expenditures: FY 2013-14 Senate-Passed Appropriations ....................................................... $9,213.3 Other Adjustments: Economic/Cost Adjustment of 1.8% ............................................................... 165.8 Caseload and Cost Adjustments for DCH (SFA Estimate)............................. 2.4 Caseload and Cost Adjustments for DHS (SFA Estimate) ............................. (15.7) Health Insurance Claims Assessment Revenue Shortfall .............................. 110.0 Subtotal Other Adjustments ................................................................................ $262.6 Total Estimated GF/GP Expenditures ............................................................. $9,475.8
Projected Year-End GF/GP Balance ................................................................ $60.3 On the revenue side of the FY 2014-15 GF/GP budget ledger, the SFA now believes that GF/GP current-law revenue will total $9.8 billion. This projected level of GF/GP FY 2014-15 revenue reflects a $303.8 million or 3.2% increase from estimated current-law GF/GP revenue for FY 2013-14. The May 2013 SFA estimate of current-law GF/GP revenue represents an increase of $145.3 million from the January 2013 consensus revenue estimate. The FY 2014-15 estimated GF/GP revenue total of $9.5 billion assumes a $380.6 million GF/GP cost for statutory State Revenue Sharing payments, a continuation of the $129.2 million earmark of sales tax revenue to transportation funds, and the shifting of $8.0 million in short-term borrowing costs to the School Aid Fund. On the expenditure side of the FY 2014-15 budget ledger, if the Senate's FY 2013-14 appropriation recommendations are increased by an economic factor of 1.8% and are adjusted for caseload and

49
cost revisions for the Departments of Community Health and Human Services, and the estimated HICA revenue shortfall of $110.0 million continues to be recognized, then total FY 2014-15 GF/GP expenditures are estimated to be $9.5 billion. Table 22 provides a summary of the $122.4 million projected year-end balance in the FY 2014-15 SAF budget. This projected balance is based on the FY 2013-14 projected year-end carry-forward balance, the SFA estimate of current-law revenue, and the continuation of the FY 2013-14 Senate appropriation levels, adjusted for pupil counts and other costs. On the revenue side of the FY 2014-15 SAF budget ledger, the SFA now believes that current-law SAF revenue will total $11.8 billion. This projected level of FY 2014-15 SAF revenue reflects a $347.0 million or 3.0% increase from estimated current-law SAF revenue for FY 2013-14. The May 2013 SFA estimate of current-law SAF revenue represents a $37.1 million increase from the January 2013 consensus revenue estimate. The FY 2014-15 estimated SAF revenue total of $14.0 billion also assumes a GF/GP grant of $230.0 million, and $1.8 billion in ongoing Federal aid. The Governor's budget recommendation for FY 2014-15 further appropriated $100.0 million from the MPSERS Retirement Obligation Reform Reserve Fund; however, with the May revenue estimates and an assumption of a continuation budget, this fund source appropriation would not be necessary. On the expenditure side of the FY 2014-15 budget ledger, when the Senate's FY 2013-14 recommendations are continued into FY 2014-15 and adjusted for the MPSERS rate cap, funding formula, and other baseline costs totaling $220.0 million, total FY 2014-15 SAF expenditures are estimated to be $13.8 billion. The Senate's FY 2014-15 SAF budget estimate continues to fund Community Colleges at $197.6 million and Higher Education at $200.5 million, from SAF revenue.
Table 22
FY 2014-15 SCHOOL AID FUND
REVENUE, EXPENDITURES, AND YEAR-END BALANCE (Millions of Dollars)
SFA Estimate
Beginning Balance ............................................................................................ $165.9
May 2013 Senate Fiscal Agency Estimate ....................................................... $11,805.9 Other Revenue Adjustments: General Fund/General Purpose Grant ........................................................ 230.0 Federal Ongoing Aid .................................................................................... 1,764.4 MPSERS Retirement Obligation Reform Reserve Fund ............................. 0.0 Subtotal Ongoing Revenue .............................................................................. $13,800.3 Total Estimated School Aid Fund Revenue ................................................. $13,966.2
Expenditures: FY 2013-14 Senate-Passed Appropriations ..................................................... $13,225.7 Other Adjustments: Cost Adjustments (SFA Estimate) ............................................................... 220.0 Partially Fund Community Colleges with School Aid Fund ......................... 197.6 Partially Fund Higher Education with School Aid Fund ............................... 200.5 Subtotal Other Adjustments .............................................................................. $618.1 Total Estimated School Aid Fund Expenditures ......................................... $13,843.8
Projected Year-End School Aid Fund Balance ............................................ $122.4

50
CONCLUSION Although the FY 2012-13 estimated GF/GP and SAF year-end balances are reasonably healthy, at $592.5 million and $146.8 million, respectively, those funds will be needed to help balance the FY 2013-14 GF/GP and SAF budgets. When these FY 2012-13 year-end balance amounts are carried forward and combined with Senate budget recommendations, the estimate for the FY 2013-14 GF/GP year-end balance is $252.7 million, with an FY 2013-14 SAF year-end balance of $165.9 million. The SFA estimates an FY 2014-15 GF/GP year-end balance of only $60.3 million, with $122.4 million estimated as the SAF year-end balance for FY 2014-15. Currently, none of the SFA year-end balances described in this report include any estimates for year-end lapses of funds that could increase the levels of the year-end balances. All of the estimated year-end balances in this report are based on the Senate Fiscal Agency's revenue projections (presented in "The Forecast for State Revenue" section of this report) which the SFA will take to the May 15, 2013, Consensus Revenue Estimating Conference. At that time, a consensus is expected to be reached among the SFA, the House Fiscal Agency, and the State Treasurer regarding the revenue estimates to be used to develop the final appropriation targets for the FY 2013-14 State budget.