Michigan’s Budget Crisis and the Outlook for School Funding
64
Michigan’s Budget Crisis and the Outlook for School Funding Lenawee ISD September 14, 2006 Adrian Tom Clay, Director of State Affairs Citizens Research Council of Michigan www.crcmich.org
-
Upload
tucker-avila -
Category
Documents
-
view
26 -
download
0
description
Michigan’s Budget Crisis and the Outlook for School Funding. Lenawee ISD September 14, 2006 Adrian Tom Clay, Director of State Affairs Citizens Research Council of Michigan www.crcmich.org. Citizens Research Council of Michigan. Founded in 1916 Statewide Non-partisan - PowerPoint PPT Presentation
Transcript of Michigan’s Budget Crisis and the Outlook for School Funding
Michigan’s Budget Crisis and the Outlook for School Funding
Lenawee ISDSeptember 14, 2006
Adrian
Tom Clay, Director of State AffairsCitizens Research Council of Michigan
www.crcmich.org
Citizens Research Council of Michigan
• Founded in 1916
• Statewide
• Non-partisan
• Private Not-for-profit
• Promotes sound policy for state and local governments through factual research
• Relies on charitable contributions of Michigan businesses, foundations, and individuals
The Central Message
• The State of Michigan has a structural deficit affecting:• Public K-12 Education• General Fund financed programs
• Its causes have both spending and revenue components
• We will not grow out of it• Only structural policy changes will fix the
problem
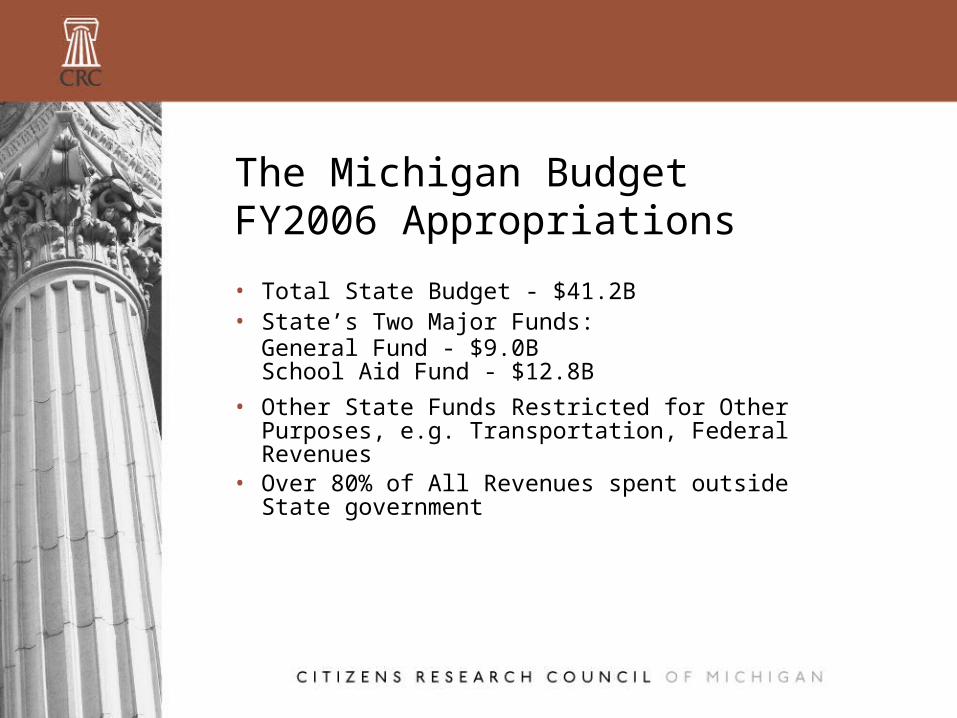
• Total State Budget - $41.2B• State’s Two Major Funds:
General Fund - $9.0BSchool Aid Fund - $12.8B
• Other State Funds Restricted for Other Purposes, e.g. Transportation, Federal Revenues
• Over 80% of All Revenues spent outside State government
The Michigan BudgetFY2006 Appropriations
Six Years of Budget Problems
• Worst Budget Problems since World War II
• Declining General Fund Revenues
• Slow Growth in School Aid Fund Revenues
• Structural and Cyclical Deficits at play
Deficits Defined
Cyclical — Caused by Economic Downturn - Revenues worsen - Some spending pressures increase - Deficit erased when economy recovers
Structural — Caused by cost increases to maintain current policies outpacing revenue growth, Even in Good Economic Times
Budget Deficit Pressures
• Both funds outspending “Regular Revenues”
• Operating deficits for 6 straight years• Significant one-time resources used
• $6.8 Billion
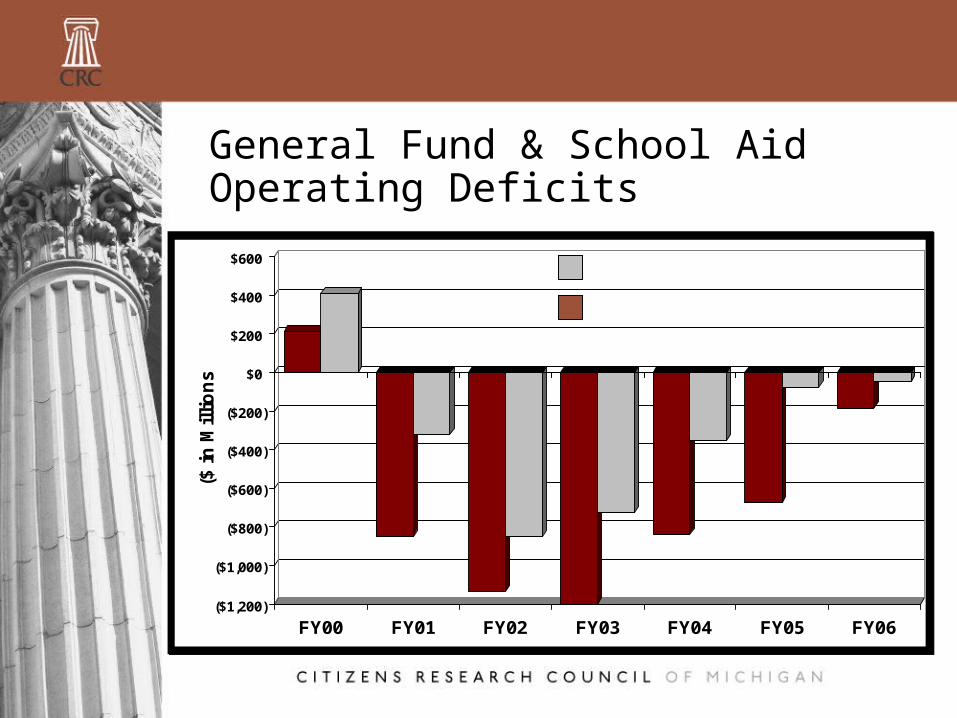
General Fund & School Aid Operating Deficits
($1,200)
($1,000)
($800)
($600)
($400)
($200)
$0
$200
$400
$600
($ i
n M
illi
on
s)
FY00 FY01 FY02 FY03 FY04 FY05 FY06
School Aid Fund
General Fund
($1,200)
($1,000)
($800)
($600)
($400)
($200)
$0
$200
$400
$600
($ i
n M
illi
on
s)
FY00 FY01 FY02 FY03 FY04 FY05 FY06
School Aid Fund
General Fund

Summary of One-Time Resources FY2001-FY2006(in Millions)
Rainy Day Fund $1,363 FY2000 School Aid Fund Surplus 984
FY2000 General Fund Surplus 212
Medicaid Benefits Trust Fund 561
Advance State Education Tax collection date 455
Tobacco Settlement/Merit Award Revenues 324
Temporary Federal Fiscal Assistance 655
Bond for pay-as-you-go capital projects 211
Revenue Sharing accounting change 181
Refinance Bonds 250
Employee Wage concessions 186
Other 1,443
$6,825
Causes of Michigan’s Budget Problems
• Weak Economy• Tax Cuts• Stock Market Decline• Michigan’s deteriorating share of auto
and light truck market• Structural imbalance between
revenues and spending
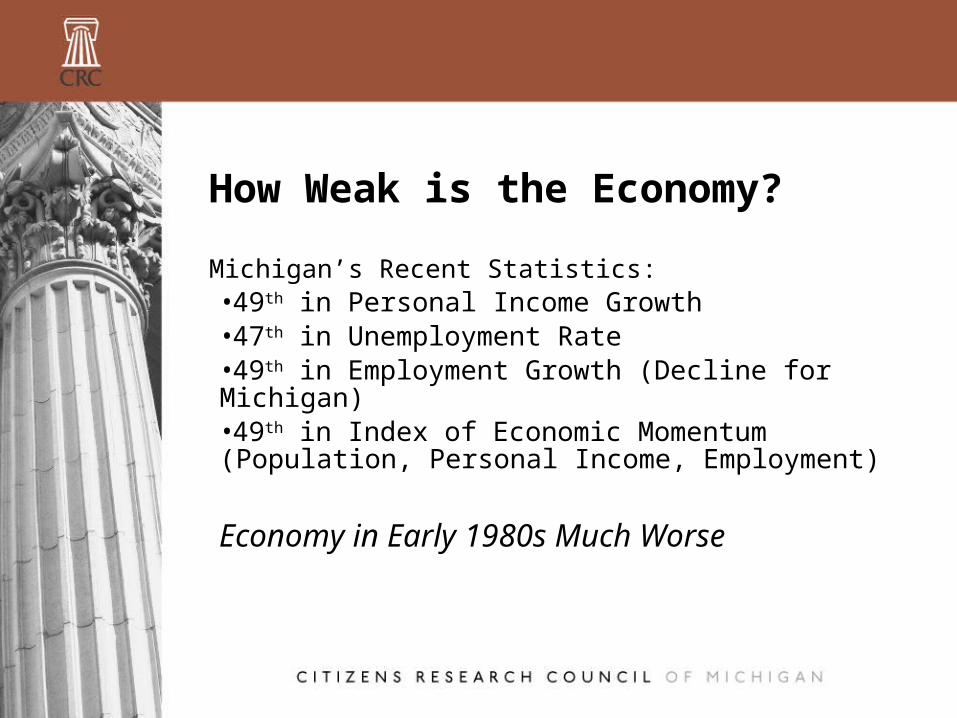
How Weak is the Economy?
Michigan’s Recent Statistics:•49th in Personal Income Growth•47th in Unemployment Rate•49th in Employment Growth (Decline for Michigan)•49th in Index of Economic Momentum (Population, Personal Income, Employment)
Economy in Early 1980s Much Worse

Big 3 Losing Market Share
12.913.9
15.1 14.8 15.1 15.2 15.617.0 17.4 17.2 16.8 16.6 16.9 16.9
02468
101214161820
1992 1995 1998 2001 2004
Mill
ions
of U
nits
40%
45%
50%
55%
60%
65%
70%
75%
U.S. Light Vehicle Sales Big 3 Share
Source: Automotive News.
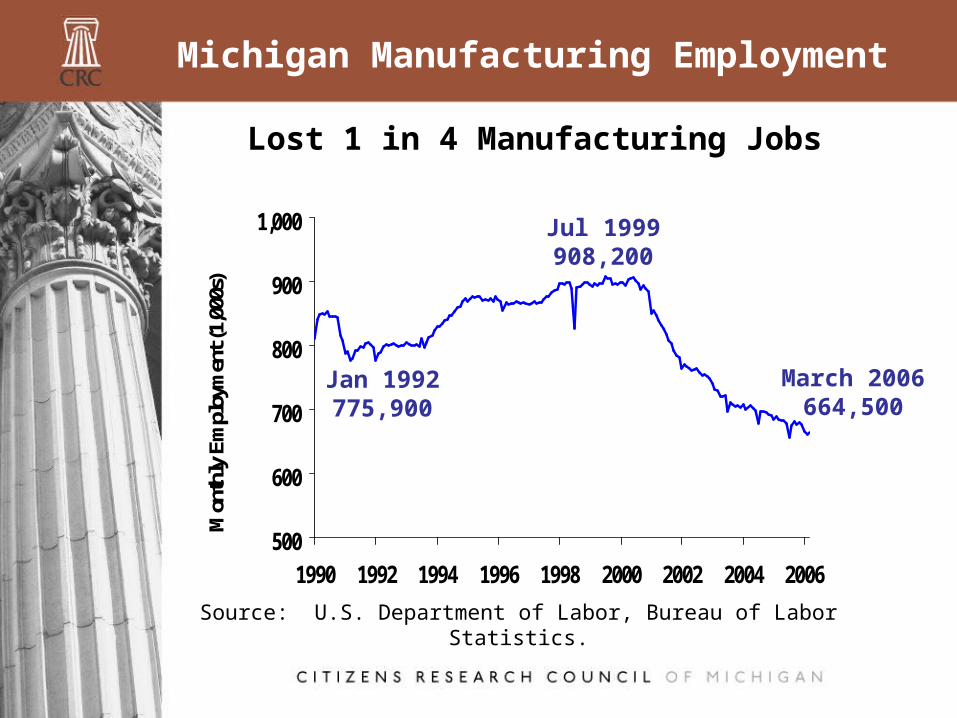
Michigan Manufacturing Employment
500
600
700
800
900
1,000
1990 1992 1994 1996 1998 2000 2002 2004 2006
Mon
thly
Em
ploy
men
t (1,
000s
)
Source: U.S. Department of Labor, Bureau of Labor Statistics.
March 2006664,500
Lost 1 in 4 Manufacturing Jobs
Jan 1992775,900
Jul 1999908,200
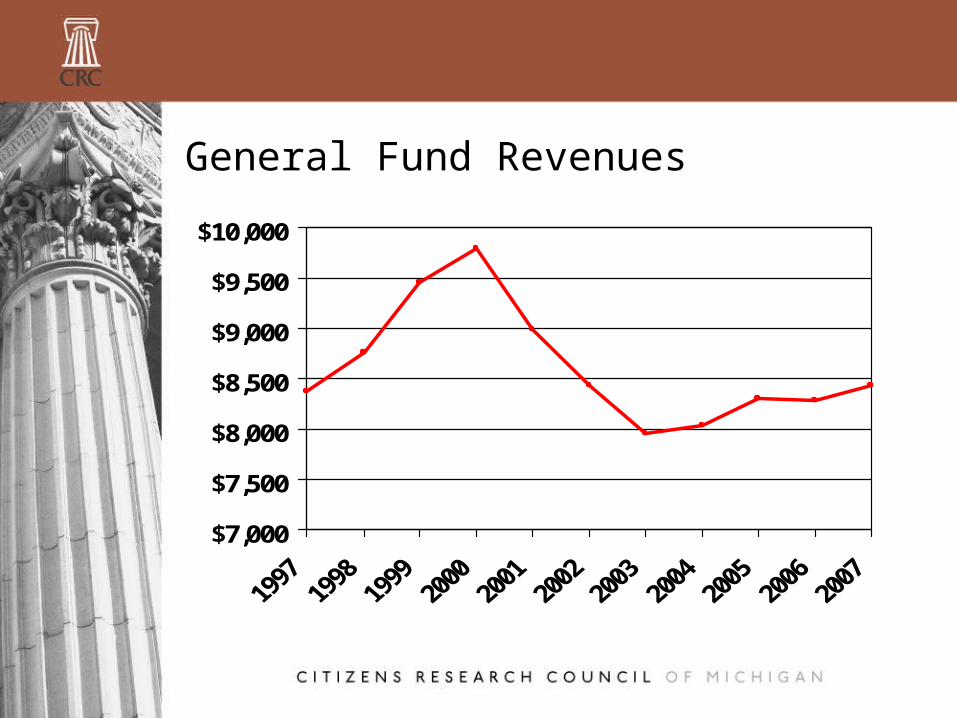
Perspective On Revenues
• General Fund revenues in FY03, FY04, & FY05 below FY1995
• Inflation-Adjusted General Fund Revenues below 1972 level
• General Fund revenue problems adversely affecting School Aid allocations

General Fund Revenues
$7,000
$7,500
$8,000
$8,500
$9,000
$9,500
$10,000
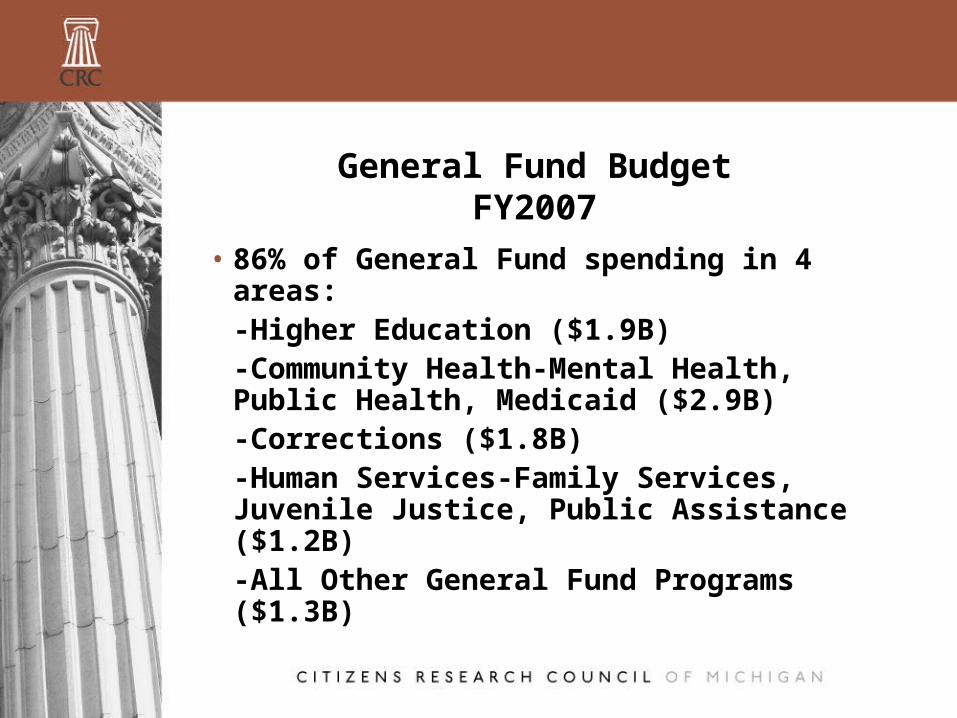
General Fund BudgetFY2007
• 86% of General Fund spending in 4 areas:-Higher Education ($1.9B)-Community Health-Mental Health, Public Health, Medicaid ($2.9B)-Corrections ($1.8B)-Human Services-Family Services, Juvenile Justice, Public Assistance ($1.2B)-All Other General Fund Programs ($1.3B)
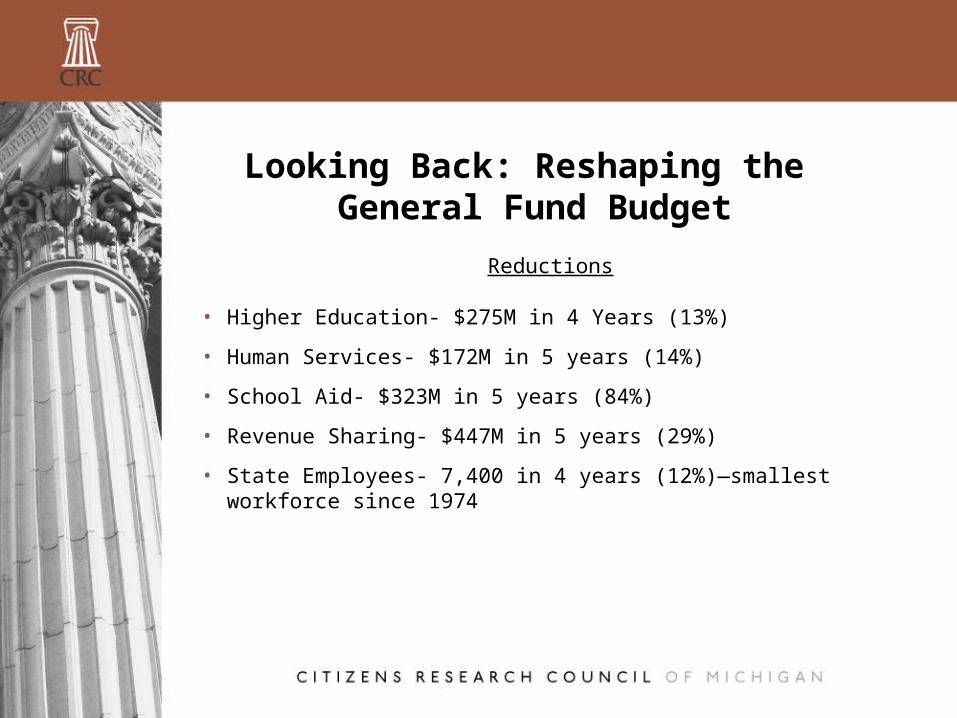
Looking Back: Reshaping the General Fund Budget
Reductions
• Higher Education- $275M in 4 Years (13%)
• Human Services- $172M in 5 years (14%)
• School Aid- $323M in 5 years (84%)
• Revenue Sharing- $447M in 5 years (29%)
• State Employees- 7,400 in 4 years (12%)—smallest workforce since 1974
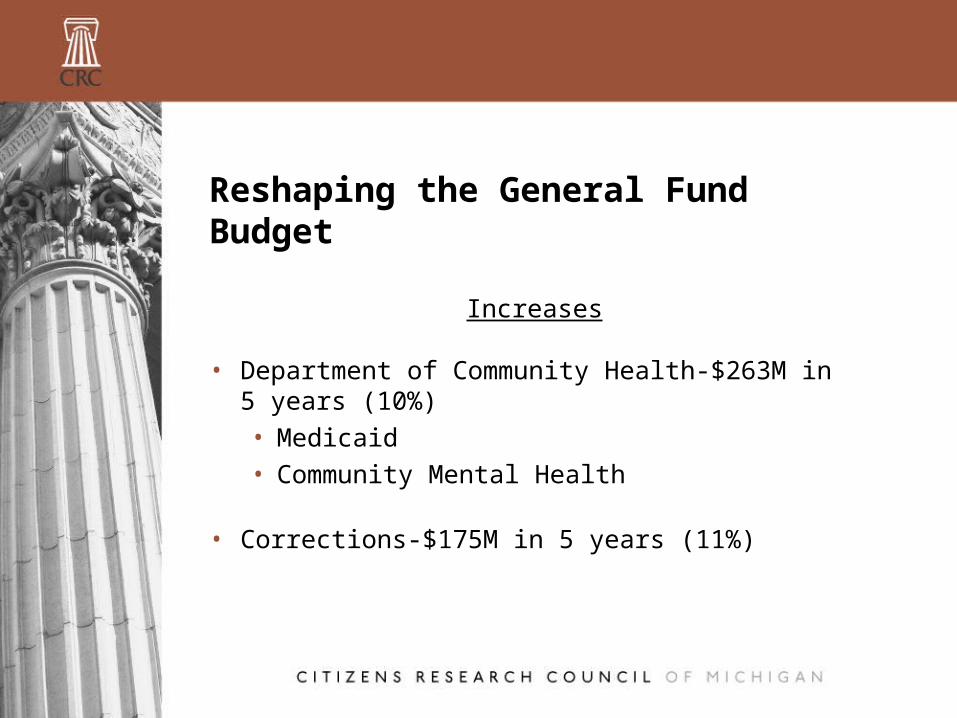
Reshaping the General Fund Budget
Increases
• Department of Community Health-$263M in 5 years (10%)• Medicaid• Community Mental Health
• Corrections-$175M in 5 years (11%)
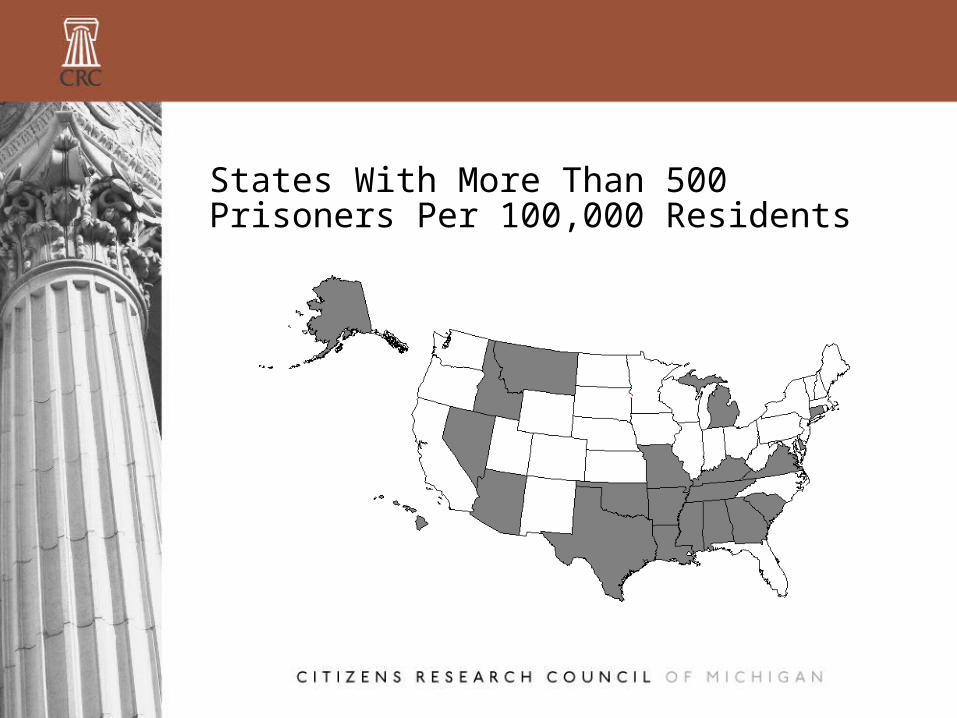
States With More Than 500 Prisoners Per 100,000 Residents
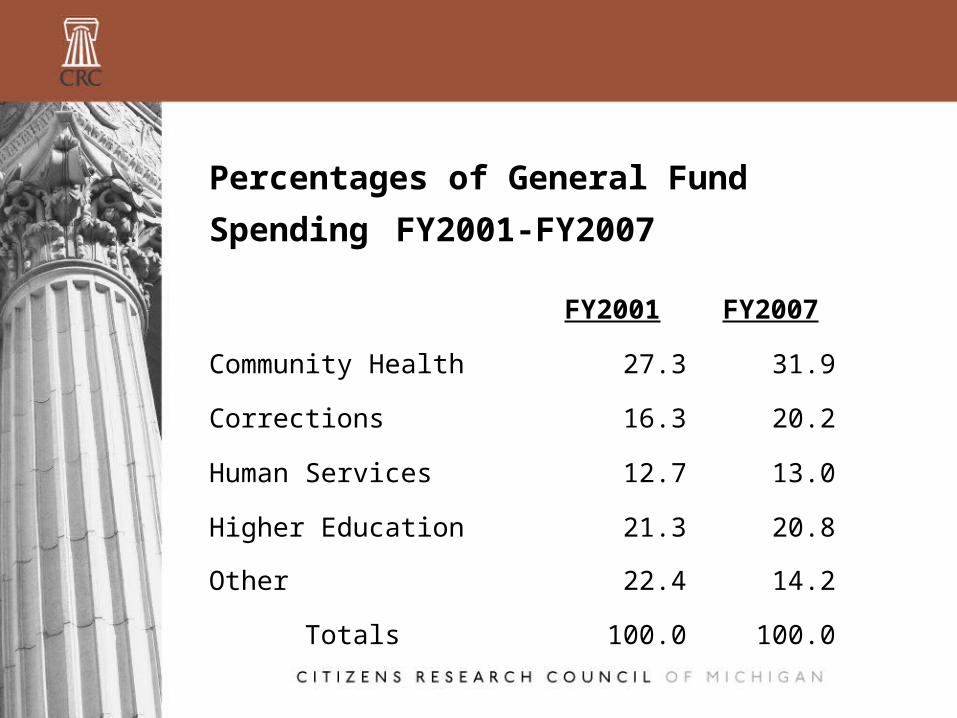
Percentages of General Fund
Spending FY2001-FY2007
FY2001 FY2007
Community Health 27.3 31.9
Corrections 16.3 20.2
Human Services 12.7 13.0
Higher Education 21.3 20.8
Other 22.4 14.2
Totals 100.0 100.0
• Community Health and Corrections now claim 52.1 percent of General Fund spending
• Increased from 43.6 Percent in FY2001
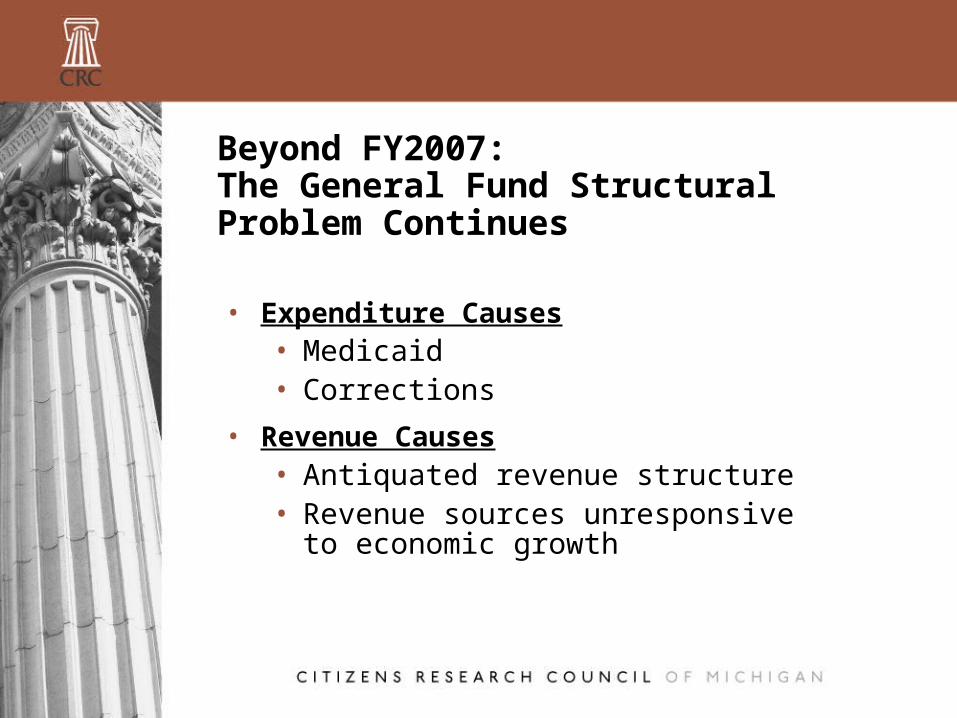
Beyond FY2007: The General Fund Structural Problem Continues
• Expenditure Causes• Medicaid• Corrections
• Revenue Causes• Antiquated revenue structure• Revenue sources unresponsive to
economic growth
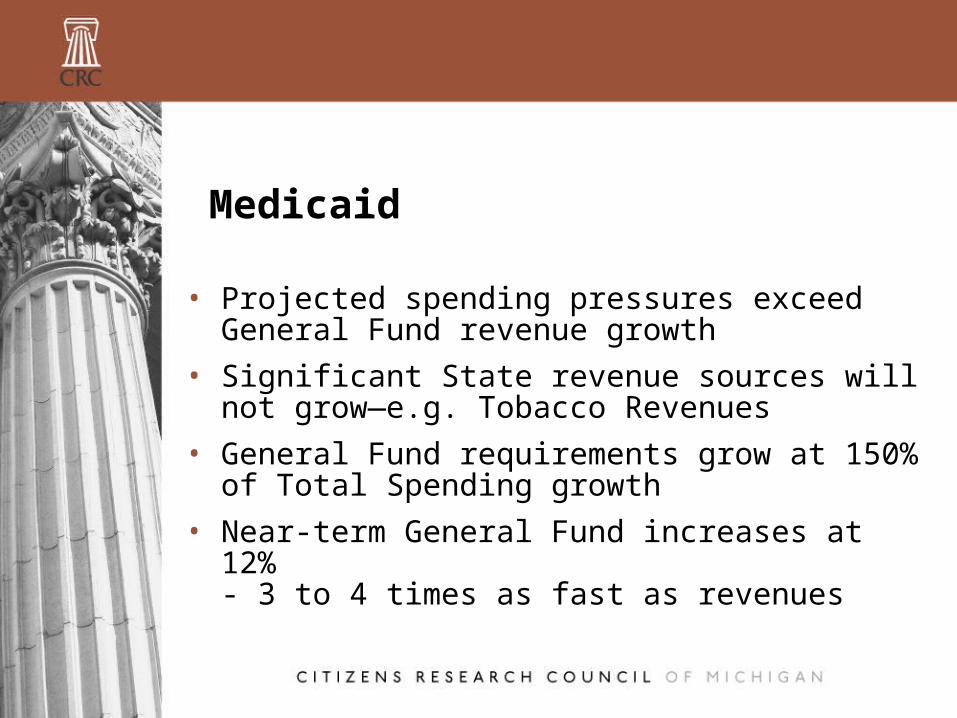
Medicaid
• Projected spending pressures exceed General Fund revenue growth
• Significant State revenue sources will not grow—e.g. Tobacco Revenues
• General Fund requirements grow at 150% of Total Spending growth
• Near-term General Fund increases at 12% - 3 to 4 times as fast as revenues
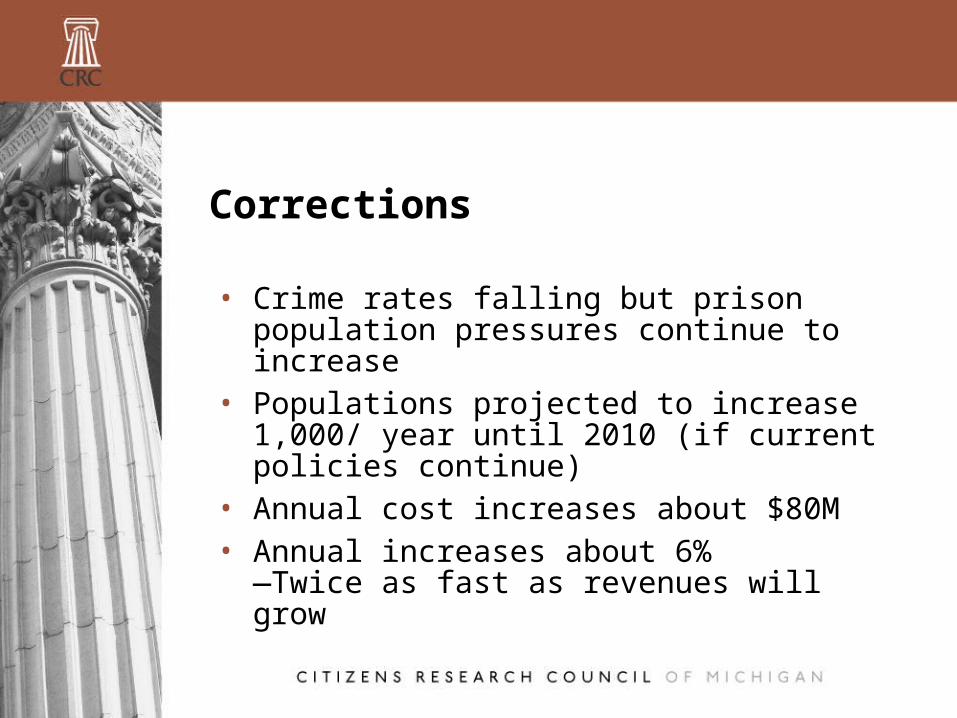
Corrections
• Crime rates falling but prison population pressures continue to increase
• Populations projected to increase 1,000/ year until 2010 (if current policies continue)
• Annual cost increases about $80M• Annual increases about 6%
—Twice as fast as revenues will grow
Structural Revenue Issues
• Revenue system reflects economy of the 50s, 60s, and 70s
• Revenues grow more slowly than economy
• Consumption taxes goods-oriented• Relatively few services are taxed• Services are over half of private sector
economic activity
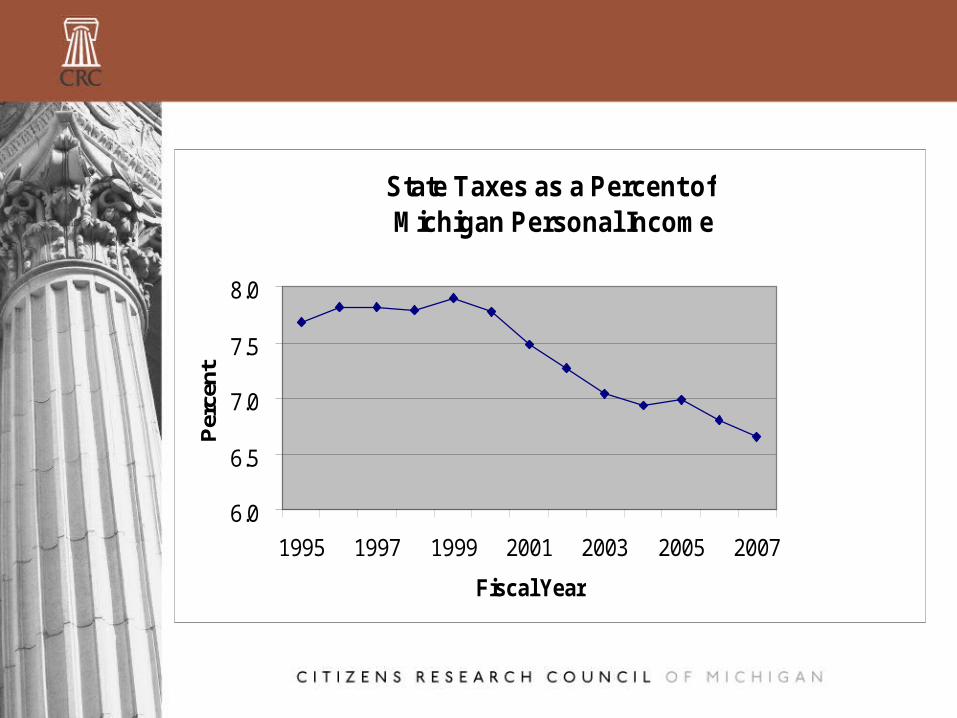
State Taxes as a Percent of Michigan Personal Income
6.0
6.5
7.0
7.5
8.0
1995 1997 1999 2001 2003 2005 2007
Fiscal Year
Per
cent
General Fund Budget Scenario
• Medicaid & Corrections projections growing faster than revenues
• Other areas of general fund spending assumed to increase at 3%/year
• Revenues grow about 3%/year• Major revenue sources with no growth —Retard overall growth
Combining Revenues and Spending Pressures
• State Will have balanced budgets—Constitutionally Required
• Incremental problem each year will exceed $300M (Over 3% of spending base) after FY2007
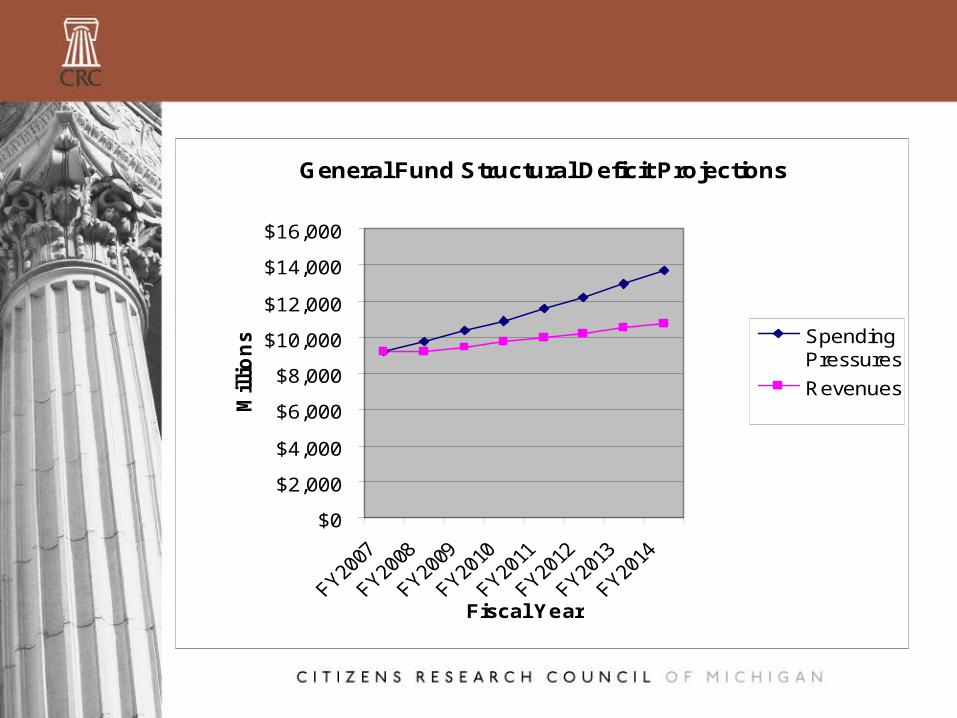
General Fund Structural Deficit Projections
$0
$2,000
$4,000
$6,000
$8,000
$10,000
$12,000
$14,000
$16,000
Fiscal Year
Mil
lio
ns Spending
Pressures
Revenues
Current Issues
• Business Taxes• Health Care cost pressures throughout the budget -Health Insurance—school and state • Employees -Health Care for retirees -Medicaid• Low Taxes vs. Quality of Life

Single Business Tax Eliminated (Effective December 31, 2007)
• Law change initiated by petition• Primary Advocate: L. Brooks Patterson—
Oakland County Executive• Legislature enacted the law• Impervious to gubernatorial veto• SBT is gone and with it $1.9 billion of
General Fund revenue (22%)
The Remaining Business• What will replace the revenues?• New taxes on business?• New taxes on individuals?• Full or partial replacement• Revenue neutrality implies winners and losers• Nearly 30% of businesses pay no SBT (41,000)—
45% below $1000 in liability• Potential for plenty of losers
What Role Will Spending Cuts Play?
• 86% of General Fund spending in 4 areas:-Higher Education ($1.9B)-Community Health-Mental Health, Public Health, Medicaid ($2.9B)-Corrections ($1.8B)-Human Services-Family Services, Juvenile Justice, Public Assistance ($1.2B)-All Other General Fund Programs ($1.3B)
Taxes Not Only Concern of Business
Others Include• Skilled Workforce• Energy Costs• Legacy Costs—Pensions and Retiree Health Care• Health Insurance for Working Employees• Workers’ Compensation• Infrastructure• Quality Public Services
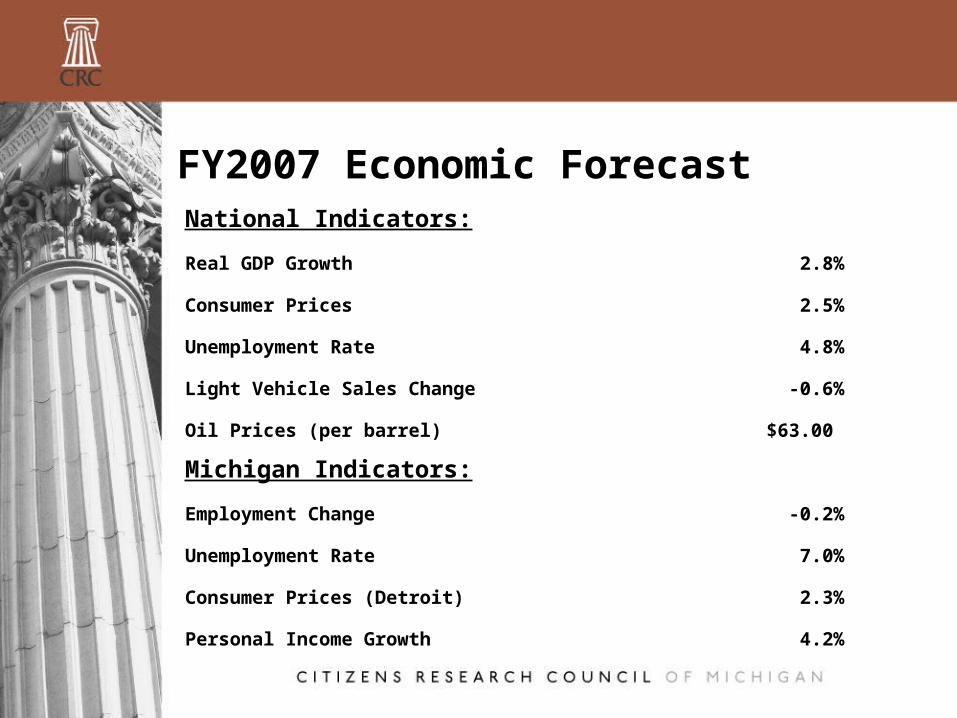
FY2007 Economic ForecastNational Indicators:
Real GDP Growth 2.8%
Consumer Prices 2.5%
Unemployment Rate 4.8%
Light Vehicle Sales Change -0.6%
Oil Prices (per barrel) $63.00
Michigan Indicators:
Employment Change -0.2%
Unemployment Rate 7.0%
Consumer Prices (Detroit) 2.3%
Personal Income Growth 4.2%
School Aid
• Outlook for 2007
• Structural Deficit beyond 2007
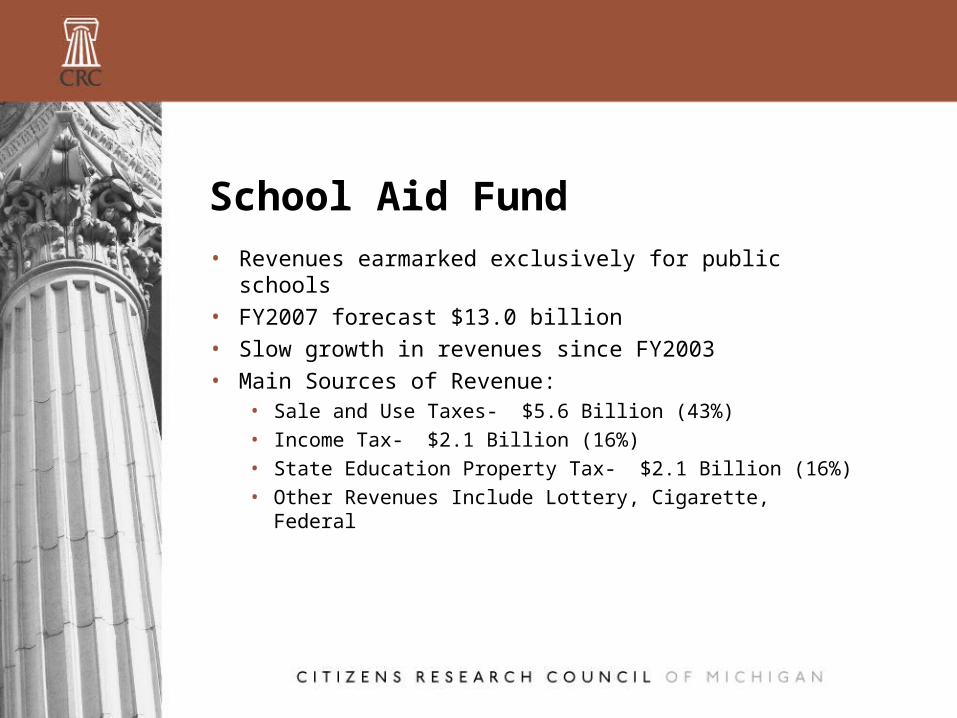
School Aid Fund• Revenues earmarked exclusively for public schools• FY2007 forecast $13.0 billion• Slow growth in revenues since FY2003• Main Sources of Revenue:
• Sale and Use Taxes- $5.6 Billion (43%)• Income Tax- $2.1 Billion (16%)• State Education Property Tax- $2.1 Billion (16%)• Other Revenues Include Lottery, Cigarette, Federal

School Aid Fund Revenues
$8,000
$9,000
$10,000
$11,000
$12,000
General Fund Revenues
$7,000
$7,500
$8,000
$8,500
$9,000
$9,500
$10,000
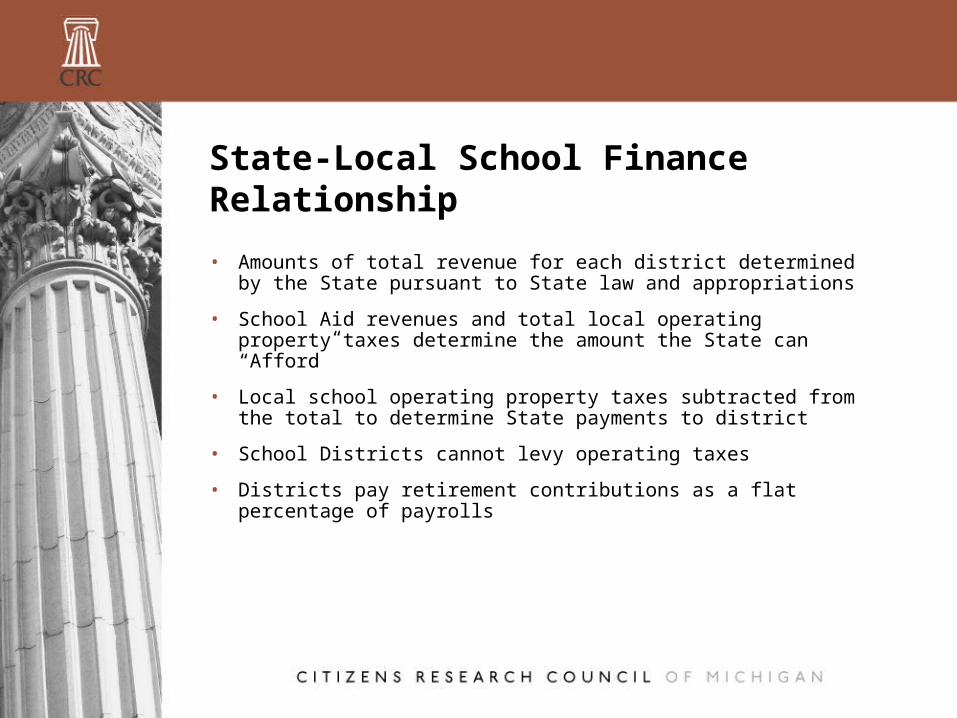
State-Local School Finance Relationship
• Amounts of total revenue for each district determined by the State pursuant to State law and appropriations
• School Aid revenues and total local operating property taxes determine the amount the State can “Afford”
• Local school operating property taxes subtracted from the total to determine State payments to district
• School Districts cannot levy operating taxes
• Districts pay retirement contributions as a flat percentage of payrolls
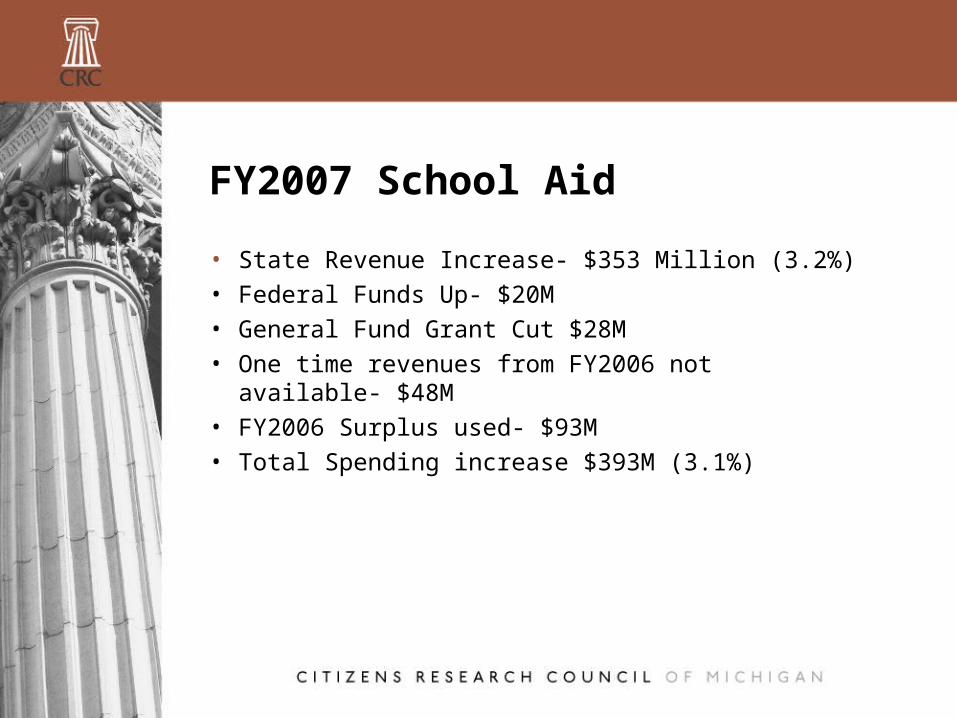
FY2007 School Aid
• State Revenue Increase- $353 Million (3.2%)• Federal Funds Up- $20M• General Fund Grant Cut $28M• One time revenues from FY2006 not
available- $48M• FY2006 Surplus used- $93M• Total Spending increase $393M (3.1%)

School Aid Spending Increases
• Foundation Allowance increase ($210/student)- $168M
• Special Education- $73M• Equity Payment- $20M• Engineering Michigan’s Future- $20M• Great Start- $10M• School Lunch Program- $16M (Federal)• ISDs ($2.4M) and Adult Education ($3M)-$5.4M
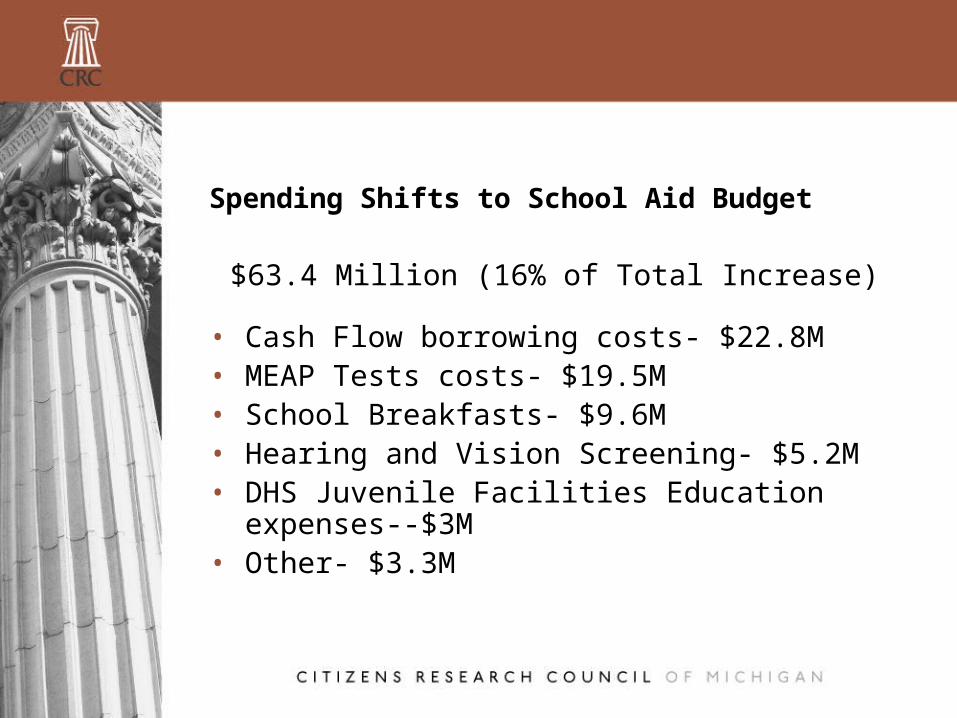
Spending Shifts to School Aid Budget
$63.4 Million (16% of Total Increase)
• Cash Flow borrowing costs- $22.8M • MEAP Tests costs- $19.5M • School Breakfasts- $9.6M• Hearing and Vision Screening- $5.2M• DHS Juvenile Facilities Education expenses--
$3M• Other- $3.3M
General Fund Spending Pressures Spill Over to School Aid
• General Fund support down $357 million since FY2000
• FY2007 reduces grant to “Irreducible Minimum”• Shifts of spending to School Aid Fund in FY2007
Appropriations- $63 Million• Total Effect- $420 million ($250 per pupil)• Will Higher Education be next?
FY2007 Spending Pressures
• Retirement—Increases 16.34% to 17.74% —about $80 per pupil on average
• Employee Health Insurance averages about $1200 per student likely will rise by more than $50 per student
• Pay and Step Raises cost nearly $60 per student on average—4% = $240 per student
• Other—Fuel, Utilities, Supplies—$50 per student
• Total could exceed $400 per student
• Not enough growth in total School Aid resources ($230) to cover all cost pressures
Proposal 2006-05:Educational Funding Guarantee Law
“The K-16 Proposal”• Proposed initiated law • Not subject to veto by governor
• Requires vote of people or 3/4 of each house to amend
• Amends State School Aid Act (PA 94 of 1979) – appropriations and policy
Summary of Proposal
• Funding guarantees for Universities, Community Colleges, and K-12
• Reduces per pupil funding gap from $1,300 to $1,000 by FY12
• Caps employer contribution at 80% of Total Contribution percentage or 14.87% of Payroll, whichever is less, with the State picking up the difference
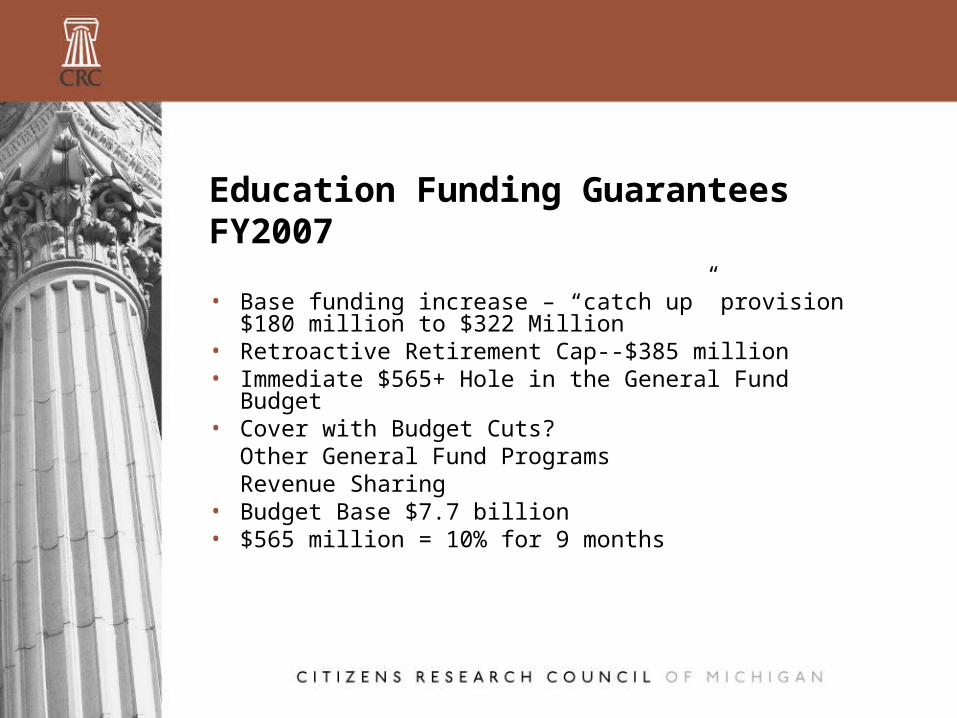
Education Funding GuaranteesFY2007
• Base funding increase – “catch up” provision $180 million to $322 Million
• Retroactive Retirement Cap--$385 million• Immediate $565+ Hole in the General Fund Budget• Cover with Budget Cuts?
Other General Fund ProgramsRevenue Sharing
• Budget Base $7.7 billion• $565 million = 10% for 9 months
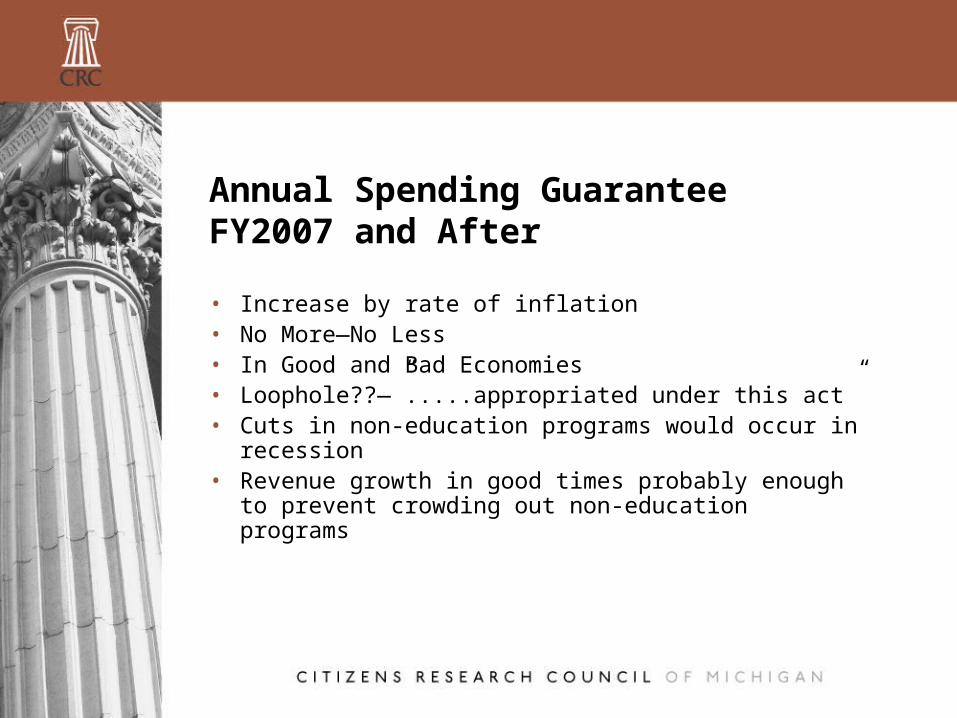
Annual Spending Guarantee FY2007 and After
• Increase by rate of inflation• No More—No Less• In Good and Bad Economies• Loophole??—”.....appropriated under this act”• Cuts in non-education programs would occur in
recession• Revenue growth in good times probably enough
to prevent crowding out non-education programs

Retirement Funding Guarantee
• FY07 rate is 17.74% of payroll• Employer share: 14.19% of payroll• State share: 3.55% of payroll
• FY08 rate (projected) would result in employer share capped at 14.87%
• FY07 state costs: $385 million• FY13 state costs: $1 billion• State responsible for entire annual marginal cost
associated with rate change
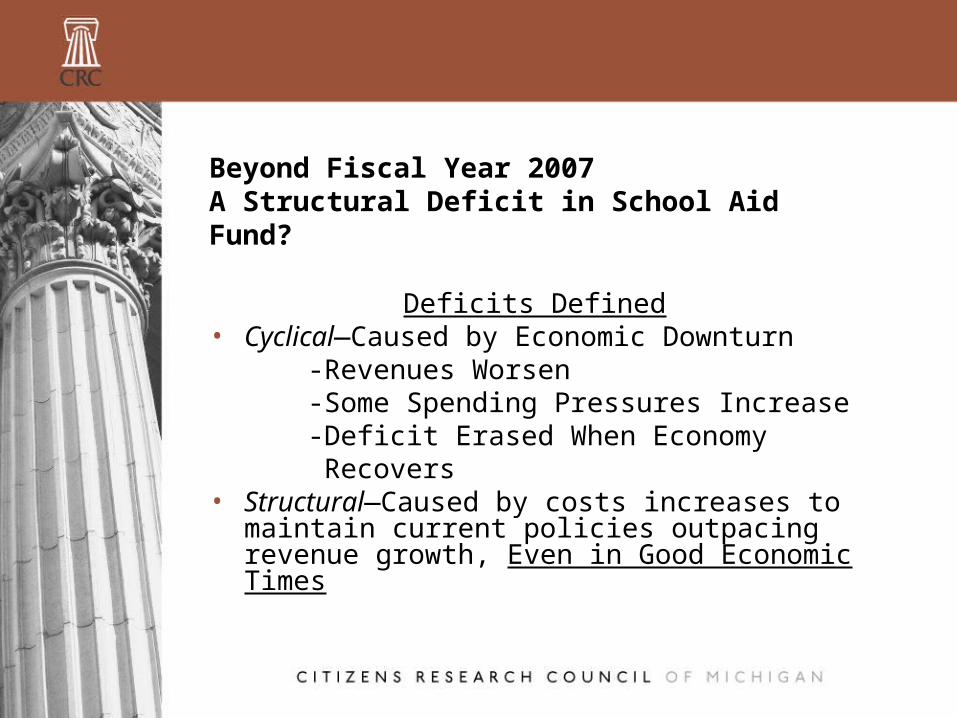
Beyond Fiscal Year 2007A Structural Deficit in School Aid Fund?
Deficits Defined• Cyclical—Caused by Economic Downturn -Revenues Worsen -Some Spending Pressures Increase -Deficit Erased When Economy Recovers• Structural—Caused by costs increases to
maintain current policies outpacing revenue growth, Even in Good Economic Times
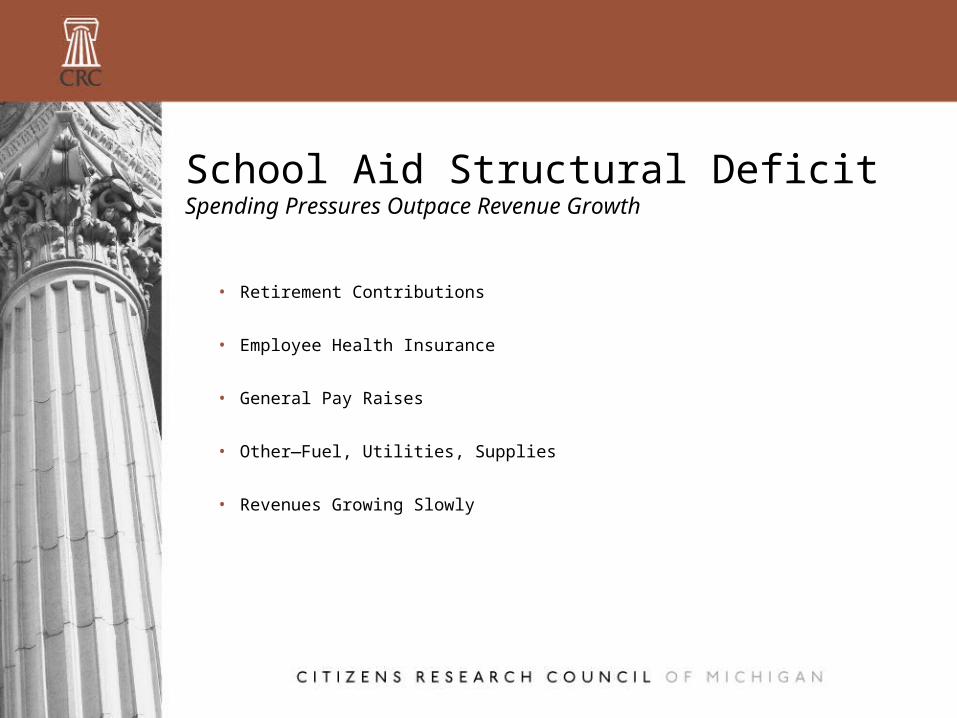
School Aid Structural DeficitSpending Pressures Outpace Revenue Growth
• Retirement Contributions
• Employee Health Insurance
• General Pay Raises
• Other—Fuel, Utilities, Supplies
• Revenues Growing Slowly
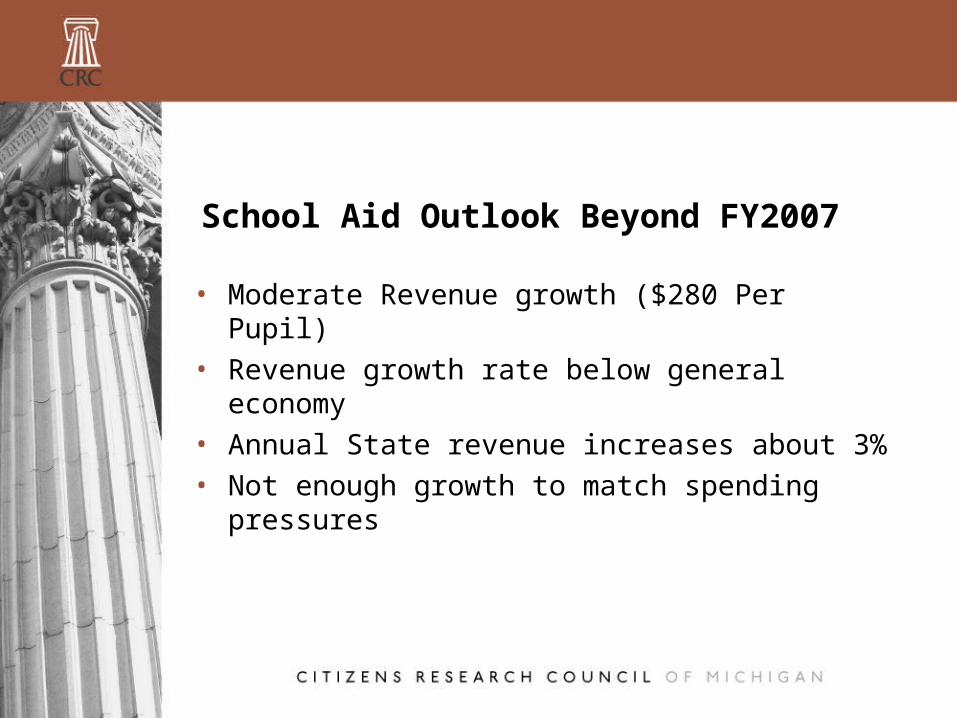
School Aid Outlook Beyond FY2007
• Moderate Revenue growth ($280 Per Pupil)• Revenue growth rate below general
economy• Annual State revenue increases about 3%• Not enough growth to match spending
pressures
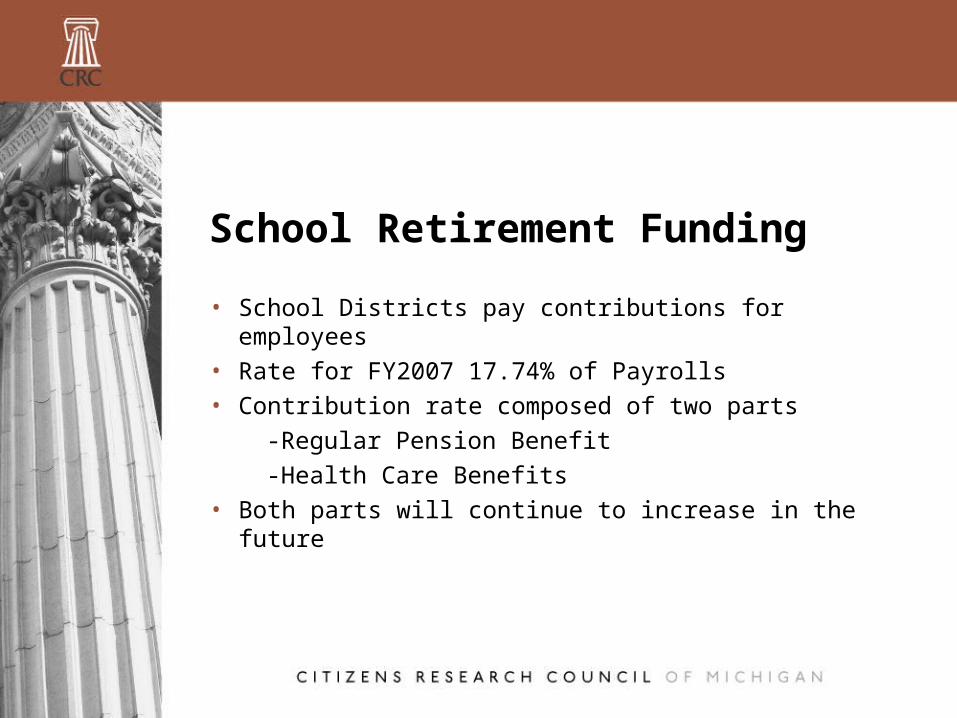
School Retirement Funding
• School Districts pay contributions for employees• Rate for FY2007 17.74% of Payrolls• Contribution rate composed of two parts -Regular Pension Benefit -Health Care Benefits• Both parts will continue to increase in the future
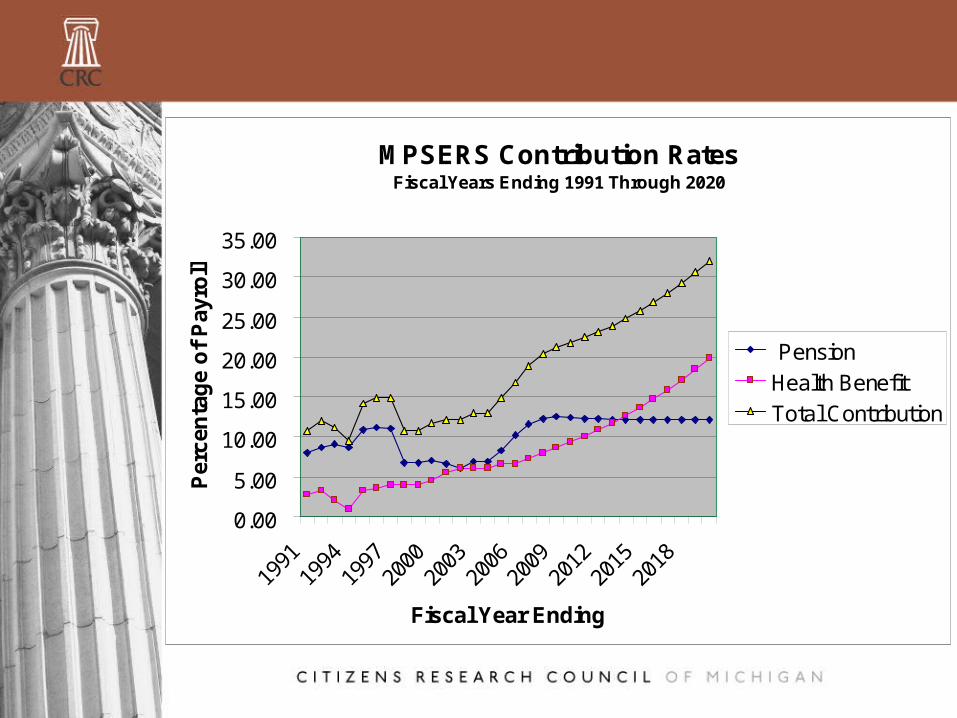
MPSERS Contribution RatesFiscal Years Ending 1991 Through 2020
0.00
5.00
10.00
15.00
20.00
25.00
30.00
35.00
1991
1994
1997
2000
2003
2006
2009
2012
2015
2018
Fiscal Year Ending
Per
cen
tag
e o
f P
ayro
ll
Pension
Health Benefit
Total Contribution

Financial Significance
• School District contributions exceeded $1.35 billion in FY2005
• Costs will likely average $1000 per student in FY2007
• Incremental increases exceed $90 per pupil after FY2008
• Rising contribution rates will continue to claim significant share of future revenue increases
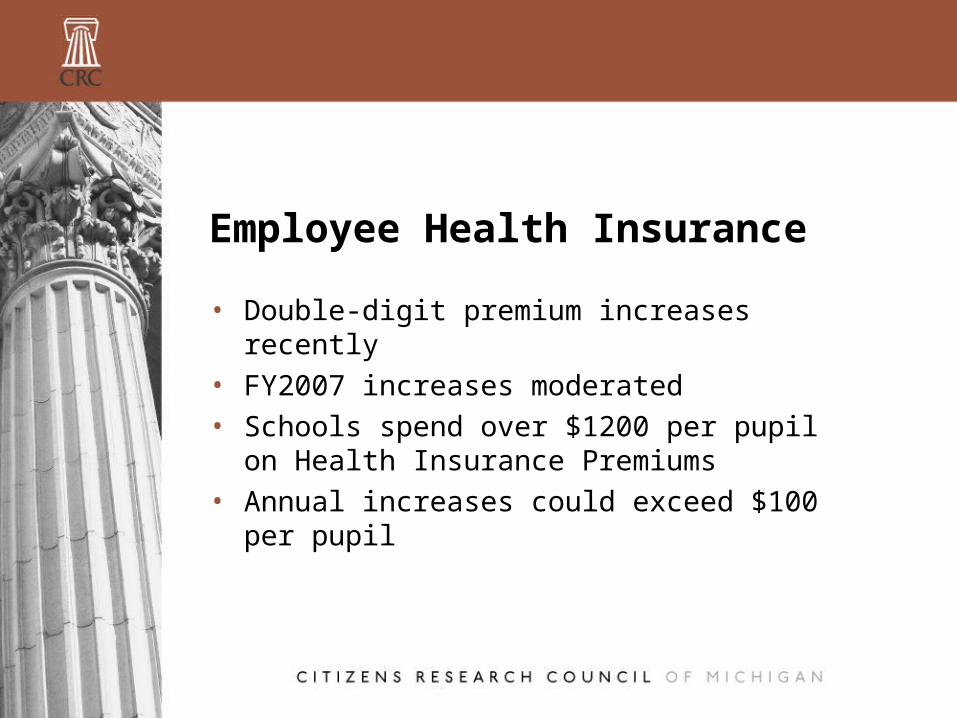
Employee Health Insurance
• Double-digit premium increases recently• FY2007 increases moderated• Schools spend over $1200 per pupil on
Health Insurance Premiums• Annual increases could exceed $100 per
pupil
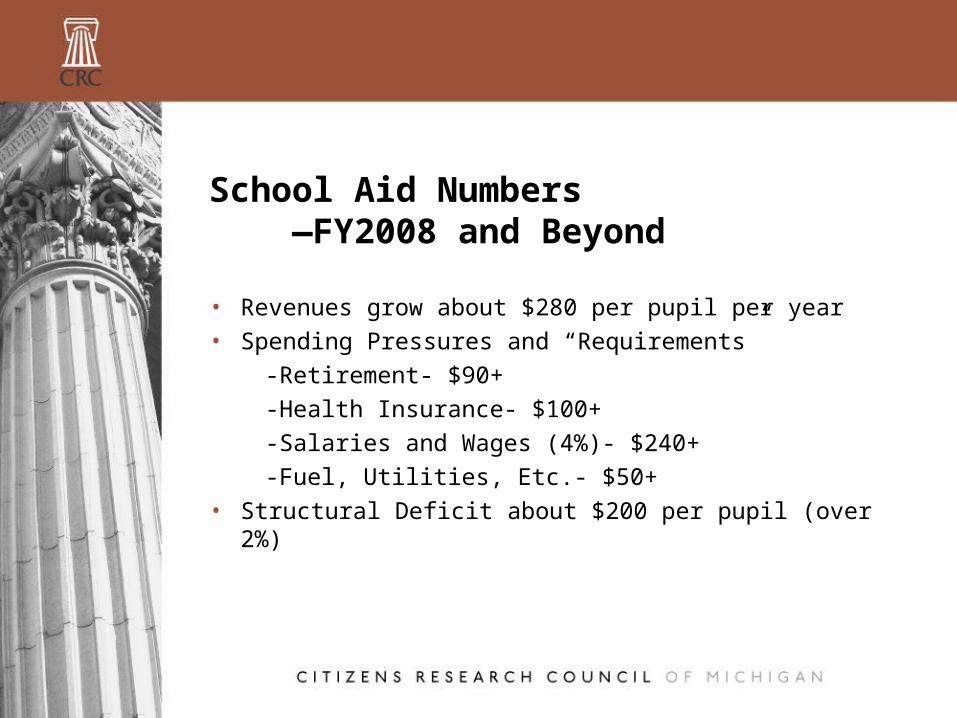
School Aid Numbers —FY2008 and Beyond
• Revenues grow about $280 per pupil per year• Spending Pressures and “Requirements” -Retirement- $90+ -Health Insurance- $100+ -Salaries and Wages (4%)- $240+ -Fuel, Utilities, Etc.- $50+• Structural Deficit about $200 per pupil (over 2%)
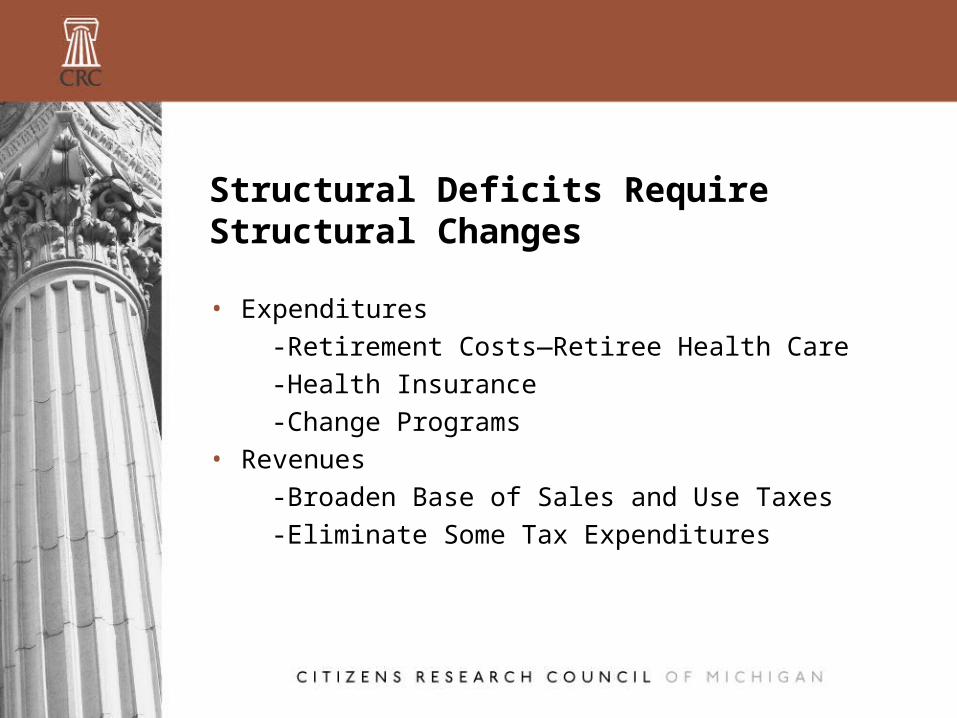
Structural Deficits Require Structural Changes
• Expenditures -Retirement Costs—Retiree Health Care -Health Insurance -Change Programs• Revenues -Broaden Base of Sales and Use Taxes -Eliminate Some Tax Expenditures
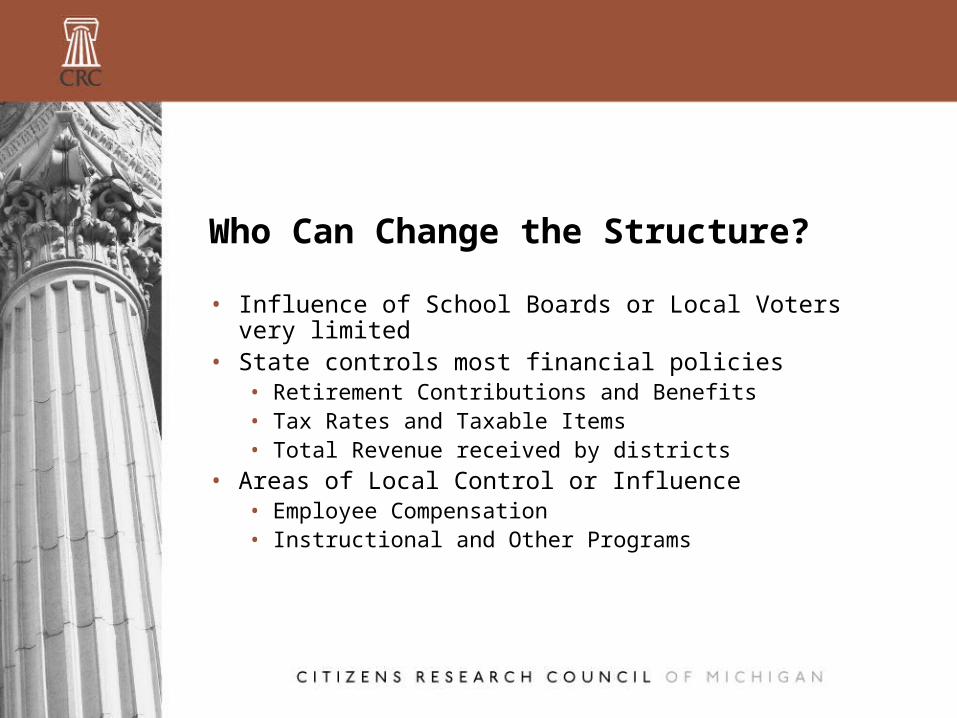
Who Can Change the Structure?
• Influence of School Boards or Local Voters very limited
• State controls most financial policies• Retirement Contributions and Benefits• Tax Rates and Taxable Items• Total Revenue received by districts
• Areas of Local Control or Influence• Employee Compensation• Instructional and Other Programs
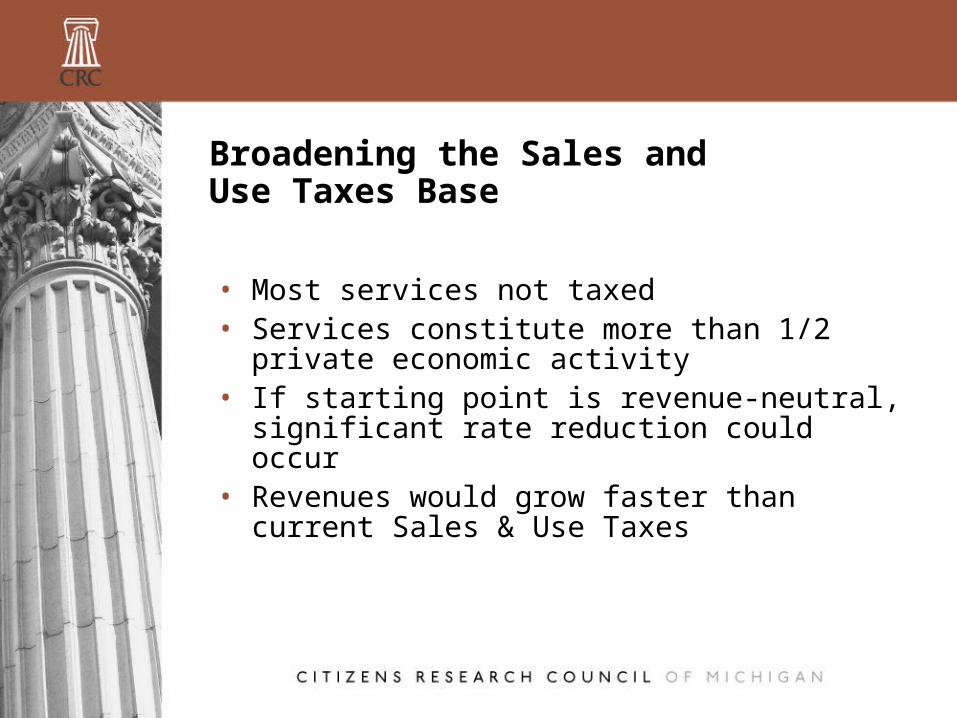
Broadening the Sales and Use Taxes Base
• Most services not taxed• Services constitute more than 1/2 private
economic activity• If starting point is revenue-neutral,
significant rate reduction could occur• Revenues would grow faster than current
Sales & Use Taxes
Issues With Services Taxation
• Would socially valuable services such as Medical Care and Education be exempt?
• Business to Business Services — Pyramiding could create multiple taxation problem
Retirement Changes Being Considered in Lansing
• Earn retiree Health Benefits based on years of service
• Defined Contribution program for pension benefits
• Both changes would likely only affect new employees
• Financial effects would be negligible at first
Citizens Research Council of Michigan Citizens Research Council of Michigan
CRC Publications Available at
www.crcmich.org
Providing Independent, Nonpartisan Public Policy Research Providing Independent, Nonpartisan Public Policy Research Since 1916Since 1916
CRC Publications Available at
www.crcmich.org
Providing Independent, Nonpartisan Public Policy Research Providing Independent, Nonpartisan Public Policy Research Since 1916Since 1916