Michigan Technological University Characterization of Unpaved Road Condition Through the Use
50
Prepared By: Michigan Tech Research Institute Michigan Tech Center for Technology & Training Michigan Technological University Characterization of Unpaved Road Condition Through the Use of Remote Sensing Deliverable 2-A: State of the Practice of Unpaved Road Condition Assessment Submitted version of: November 30, 2011 Authors: Colin Brooks, [email protected] Tim Colling, Ph.D., P.E., [email protected] Melanie J. Kueber, P.E [email protected] Chris Roussi, [email protected] Arthur Endsley, [email protected] www.mtri.org/unpaved
Transcript of Michigan Technological University Characterization of Unpaved Road Condition Through the Use
Prepared By: Michigan Tech Research Institute Michigan Tech Center for Technology & Training
Michigan Technological University
Characterization of Unpaved Road Condition Through the Use of
Remote Sensing
Deliverable 2-A: State of the Practice of Unpaved Road
Condition Assessment Submitted version of:
November 30, 2011
Authors: Colin Brooks, [email protected] Tim Colling, Ph.D., P.E., [email protected] Melanie J. Kueber, P.E [email protected]
Chris Roussi, [email protected] Arthur Endsley, [email protected]
www.mtri.org/unpaved

Deliverable 2-A: State of the Practice of Unpaved Road Condition Assessment
2
Acknowledgements ....................................................................................................................................... 4 Introduction ................................................................................................................................................... 4 Definition of Terms ....................................................................................................................................... 5 Methods ........................................................................................................................................................ 7
Visual ...................................................................................................................................................... 7 Combination (Visual and Direct Measurement) ..................................................................................... 7 Indirect Data Acquisition ........................................................................................................................ 7
Visual Methods ............................................................................................................................................. 8 VISUAL: Unimproved PASER & Gravel PASER ................................................................................. 8
Overview .............................................................................................................................................. 8 The Unimproved Earth PASER System ............................................................................................... 8 The Gravel PASER System .................................................................................................................. 9 Record Keeping .................................................................................................................................. 10 Data Collection Rate and Equipment ................................................................................................. 11 Michigan Modifications of the PASER System ................................................................................. 12 Wyoming Modifications of the PASER System ................................................................................ 14 Summary ............................................................................................................................................ 15
VISUAL: Road Surface Management System, University of New Hampshire & FHWA ................... 15 Overview ............................................................................................................................................ 15 Record Keeping .................................................................................................................................. 17 Data Collection Rate and Equipment ................................................................................................. 18 Summary ............................................................................................................................................ 20
VISUAL: Standard Visual Assessment Manual for Unsealed Roads, TMH12 .................................... 20 Overview ............................................................................................................................................ 20 Rating System Range ......................................................................................................................... 21 Record Keeping & Equipment ........................................................................................................... 26 Data Collection Rate, Speed, & Cost ................................................................................................. 27 Data & Applications ........................................................................................................................... 28 Summary & Costs .............................................................................................................................. 28
VISUAL: Subjective Rating System - Central Federal Lands Highway Division ................................ 29 Overview ............................................................................................................................................ 29 Subjective Rating System ................................................................................................................... 29 Record Keeping, Data Collection Rate, and Equipment .................................................................... 30 Summary ............................................................................................................................................ 30
Combination (Visual and Direct Measurement) Methods .......................................................................... 31 COMBINATION: Objective Rating System - Central Federal Lands Highway Division ................... 31
Overview ............................................................................................................................................ 31 Objective Rating System .................................................................................................................... 31 Record Keeping, Data Collection Rate, and Equipment .................................................................... 33 Summary ............................................................................................................................................ 34
COMBINATION: Unsurfaced Road Condition Index (URCI) ............................................................ 34

Deliverable 2-A: State of the Practice of Unpaved Road Condition Assessment
3
Overview ............................................................................................................................................ 34 Record Keeping .................................................................................................................................. 36 Equipment, Cost, Speed, Record Keeping ......................................................................................... 38 Summary ............................................................................................................................................ 39
Indirect Data Acquisition Methods ............................................................................................................. 40 INDIRECT DATA ACQUISITION: Road Roughness Using Accelerometer Technology by Opti-Grade® .................................................................................................................................................. 40
Overview ............................................................................................................................................ 40 Data Collection Rate and Equipment ................................................................................................. 40 Similar Systems .................................................................................................................................. 41 Summary ............................................................................................................................................ 41
INDIRECT DATA ACQUISITION: Ground Penetrating Radar ......................................................... 41 Overview ............................................................................................................................................ 41 Equipment, Record Keeping .............................................................................................................. 41 Cost..................................................................................................................................................... 42 Data & Applications: Summary ......................................................................................................... 42
INDIRECT DATA ACQUISITION: Remote Sensing – Unmanned Aerial Vehicle (UAV) ............... 43 Overview ............................................................................................................................................ 43 Equipment, Record Keeping, Data, & Application ............................................................................ 43 Costs ................................................................................................................................................... 43 Summary ............................................................................................................................................ 43
INDIRECT DATA ACQUISITION: Survey – Ultralight Aircraft ....................................................... 43 Overview ............................................................................................................................................ 43 Method, Equipment, Record Keeping ................................................................................................ 44 Time & Costs ..................................................................................................................................... 44 Time & Costs ..................................................................................................................................... 45
Summary ..................................................................................................................................................... 45 References ................................................................................................................................................... 46

Deliverable 2-A: State of the Practice of Unpaved Road Condition Assessment
4
Acknowledgements
This work is supported by the Commercial Remote Sensing and Spatial Information program of the Research and Innovative Technology Administration (RITA), U.S. Department of Transportation (USDOT), Cooperative Agreement RITARS-11-H-MTU1, with additional support provided by The South East Michigan Council of Governments (SEMCOG), the Michigan Transportation Asset Management Council (TAMC), the Road Commission for Oakland County (RCOC), and the Michigan Tech Transportation Institute. The views, opinions, findings, and conclusions reflected in this paper are the responsibility of the authors only and do not represent the official policy or position of the USDOT, RITA, or any state or other entity. Additional information regarding this project can be found at www.mtri.org/unpaved.
Introduction
The first step in solving any problem is to understand it fully; this ensures that any solution builds upon existing knowledge. This document details the current state of the practice in unpaved road condition assessment. It complements the Deliverable 1-A report, "Requirements for Remote Sensing Assessment of Unpaved Road Conditions", submitted to USDOT RITA on 10/31/2011 and available in its current form at www.mtri.org/unpaved (specifically, at http://geodjango.mtri.org/unpaved/media/doc/deliverable_Del1-A_RequirementsDocument_MichiganTechUnpavedRoadsr1.pdf ). Determining how to manage unpaved roads has been an ongoing problem for road-owning agencies in the United States as well as in other parts of the world. Unlike condition assessment methods for paved roads, unpaved road assessment methods are not well understood by most transportation professionals (Skorseth, 2002). The following factors not present in paved roads complicate unpaved road condition assessment methods, contributing to their lack of use: design and construction variability, rapidly changing road conditions, and disproportionate maintenance to management costs. Unpaved roads vary significantly in their design, construction, and use which impacts the maintenance practices performed on them. For example, a forest access road that is “cut in” to the surrounding terrain and has no structural layer of aggregate will perform significantly different than a full-width gravel county road that is designed and operated similarly to its paved counterparts.
Unpaved road conditions change rapidly in comparison to paved roads. The condition of an unpaved road may change significantly from month to month, whereas the condition of a paved road typically remains relatively static over long periods of time. This necessitates more frequent inspections than are typical on paved roads.
Unpaved roads are typically lower-cost assets than their higher-cost paved counterparts. Maintenance interventions for unpaved roads tend to cost significantly less per mile than those performed on asphalt or

Deliverable 2-A: State of the Practice of Unpaved Road Condition Assessment
5
concrete pavements. However, management of unpaved roads requires routine collection of condition data which can become expensive, potentially outweighing any cost savings that could have been achieved through good management. For example, an assessment method that helps determine the optimum times to grade an unpaved road, but requires condition data that costs several thousand dollars a mile to collect, may prove more costly to implement than simply performing the grading activity more frequently than necessary. In addition, highly traveled unpaved roads may be more costly to manage over their life cycle than a paved road in the same setting.
Several methods for assessing unpaved road conditions and managing their maintenance have been established and are used by road-owning agencies, while other rating techniques are still considered current research. The assessment methods can be classified into the following categories: visual, combination (visual and direct measurement), and indirect data acquisition with specialized equipment. The techniques that use specialized equipment to indirectly acquire road data were initially developed for use on paved roads, but are now gradually making their way into use for unpaved road assessment. These include laser profilometer, ground penetrating radar (GPR), accelerometers, and digital video. Others, such as using a remote sensing system in an manned or unmanned aerial vehicle for data acquisition, are more on the cutting edge. Some of the rating methods have established processes that can incorporate the acquired data into asset management plans, while other techniques must still be detailed for use on unpaved roads.
Definition of Terms
The unpaved road assessment methods outlined in this report are described by their authors using an array of definitions and terms; many of which are synonymous with different terms used by other methods. Definitions for the most commonly used terms and their synonyms are provided below.
Characteristics, also referred to as conditions or attributes, are the aspects of a road that define its physical structure (individual condition types defined below) (Skorseth, 2000). A road cross-section, also referred to as cross slope or crown, is the steepness of the slope of a road from its centerline to the edge of the shoulder (Skorseth, 2000; Jones, 2003).
Drainage, or road side drainage performance, is based on the suitability of drainage ditches and culverts (if any) present, and the amount of debris and overgrowth (Department of the Army, 1995; Jones, 2003).
The gravel quality of a road is based on gradation (which relies on the correct mixture of sand, aggregate, and fines) and plasticity. The presence of excessive silt or clay, unbound sand, and oversized aggregates help to identify gravel deficiency (Skorseth, 2003).

Deliverable 2-A: State of the Practice of Unpaved Road Condition Assessment
6
Gravel roads typically have a gravel thickness, or surface course thickness, of six inches (150mm) that wears away over use and time. A deficiency of gravel in this layer exposes the sub base to environmental conditions and traffic (Jones, 2003). Distresses, also referred to as defects (van der Gryp, 2007), are a characterization of the types of damage (individual distress types defined below) that have developed on a roadway. Distresses are typically the outcomes of road condition problems or can be a result of traffic loading (Skorseth, 2003). Corrugations, also referred to as washboarding, on an unpaved road are caused by traffic and are compounded by dry conditions and low quality gravel (Skorseth, 2003). Washboarding typically results in ridges that have spacing as little as eight inches (20.3 cm) crest to crest, to as large as 40 inches (1.02 m) crest to crest (Department of the Army, 1995). Washboarding tends to result in corrugations that have similar crest to crest spacing (period) and depths (magnitude) (Department of the Army, 1995).
Fine material loss or dust on a roadway is an indicator of the gravel layer quality. Particles that are most susceptible for loss as dust are responsible for the gravel layer plasticity which is a desirable quality (Skorseth, 2003).
Erosion on a roadway is a crack, crevice, or channel that can appear in the longitudinal and transverse directions. Erosion occurs because material washes away in areas such as those that experience heavy acceleration and deceleration such as the bottom and top sections of steep hills (WCPA, 2007).
Loose aggregate on a roadway is typically caused by heavy traffic or poor materials and forms linear berms of segregated loose aggregate particles. Typically, loose aggregate berms are six to 24 inches (15.2 cm - 61.0 cm) in width (perpendicular to the road direction) and run longitudinally with the direction of the road for significant distances (Department of the Army, 1995).
Potholes are roughly bowl shaped depressions in the surface of a pavement and are typically less than three feet (0.91 m) in diameter. Water can accelerate pothole growth by collecting in these depressions and weakening the surrounding surface making it susceptible to further damage by traffic (Department of the Army, 1995; Skorseth, 2003; WCPA, 2007).
Ruts, also referred to as rutting, are longitudinal depressions in the wheel path of a roadway that are caused by excessive vehicle tire loads. Ruts can fill with water causing it to drain along the road instead of away from the road (Department of the Army, 1995; Skorseth, 2003). Minimum width of a typical vehicle tire is six to seven inches wide (15.2 cm - 17.8 cm) and can be as large as the wheel path travel area of the lane, approximately 24 inches wide (0.61 m) (Department of the Army, 1995).

Deliverable 2-A: State of the Practice of Unpaved Road Condition Assessment
7
Methods
Several methods for assessing unpaved road conditions have been developed. These methods range from very simple, low-cost inspection methods to very complex and involved methods, some of which are still being researched. Each assessment method outlined in this report can be broadly classified as one of the following methods: visual, combination (visual and direct measurement), and indirect data acquisition.
Visual In visual methods, trained personnel observe the type and severity of road conditions and distresses. No physical measurement equipment (rulers, hand level, measuring tape) is used. Visual methods include:
• Unimproved PASER & Gravel PASER • Road Surface Management System • Standard Visual Assessment Manual for Unsealed Roads, TMH12 • Central Federal Lands, Highway Division - Subjective Rating System
Combination (Visual and Direct Measurement) Combination methods rely on trained personnel to use direct measurement, performed through the use of basic measuring equipment (rulers, hand level, measuring tape), in addition to their visual observations, to determine the type and severity of road conditions and distresses. Combination methods include:
• Central Federal Lands, Highway Division - Objective Rating System • Unsurfaced Road Condition Index (URCI)
Indirect Data Acquisition Indirect data acquisition methods use specialized equipment to indirectly acquire road condition data. These include laser profilometers, ground penetrating radar (GPR) units, accelerometers, and digital video recorders. These methods were initially developed for paved road assessment and are now making their way into use for unpaved road assessment. Indirect data acquisition methods include:
• Ground Penetrating Radar • Remote Sensing – Unmanned Aerial Vehicle (UAV) • Survey – Ultralight Aircraft • Road Roughness Using Accelerometer Technology by Opti-Grade®

Deliverable 2-A: State of the Practice of Unpaved Road Condition Assessment
8
The following sections provide a more detailed overview of all of the methods. Where available, the costs and speed of data collection, record keeping approaches, and data application are also included. Additionally, limitations of each technique or method are discussed.
Visual Methods
VISUAL: Unimproved PASER & Gravel PASER
Overview The PASER system was developed to allow road managers to quickly and cost-effectively assess conditions that can guide road maintenance decisions, and at the same time be easily communicated to elected officials and the public. The Pavement Surface Evaluation and Rating (PASER) system was developed by the Wisconsin Transportation Information Center, University of Wisconsin-Madison (PASER manuals are available online at http://tic.engr.wisc.edu/Publications.lasso). This system has separate evaluation methods and rating criteria for each discrete pavement type that include unimproved earth pavements and gravel pavements. The PASER system is used extensively throughout Michigan and Wisconsin for state-wide data collection efforts because its use is mandated. The system is also used by other agencies throughout the United States on an agency by agency basis, mostly at the local agency level rather than by state departments of transportation (Walker, 2002b; Walker, 2001). The PASER system is a visual assessment method that allows users to classify a pavement into numerically labeled categories based on the type, extent, and severity of distresses and includes assessment of road attributes such as drainage, surface material makeup, and ride. Because PASER is a visual assessment method, there is an emphasis on the rater’s ability to estimate the severity and extent of road characteristics and distresse, rather than focusing on physical measurements. Road segments are broken by project segments with aid of historical records or where distress patterns change in the field. The PASER rating method is intended to be applied to all of the road segments in a road network, rather than relying on samples of the road network to be representative of larger areas. Assessment of road segments is typically completed in a slow-moving vehicle that stops periodically to allow raters to more closely inspect questionable road characteristics and distresses (Walker, 2002b; Walker, 2001).
The Unimproved Earth PASER System The Unimproved Earth (PASER) system was developed by the Wisconsin Transportation Information Center in 2001. The system classifies roads into one of four rating categories (rating of 1 to 4) with a rating of 1 being very poor and a rating of 4 being very good. Rating categories are defined based on the presence or absence of five characteristics, and the extent and severity of four distress types. Road characteristics and distresses considered during a PASER condition assessment are defined in Table 1 and rating category descriptions are shown in Table 2 (Walker, 2001). Table 1. Unimproved Earth PASER System – Road characteristics and distresses assessed (Walker, 2001).

Deliverable 2-A: State of the Practice of Unpaved Road Condition Assessment
9
Road Characteristics and Distresses
Assessment Criteria
Surface Material Makeup Assessed based on the quality of the surface material, with more granular material being considered favorable and material with a high silt or clay content being consider less favorable.
Crown Segments possessing a cross slope that allows positive drainage from the centerline of the road to its edge are considered favorable, and segments with no cross slope considered unfavorably for rating.
Drainage Road segments that have been constructed to include provisions for drainage ditches and culverts where necessary are considered favorably, while segments that do not have provisions for drainage are considered negative.
Profile and Ride This factor is assessed based on the longitudinal profile of the road and the comfortable speed that users can operate on the road. Road segments that have been graded to include cut and fill sections and have higher comfortable operating speeds (>25 mph) are considered favorably while road segments that follow the natural terrain and require low speeds are considered negatively.
Access This factor is assessed based on the span of time the road can be used for vehicle traffic during the year, with road segments that have year round access being considered favorably, and road segments that are untraversable during parts of the year considered negatively (Walker, 2002b; Walker, 2001).
Ruts Ruts have a minimum of width of a typical vehicle tire (six to seven inches wide / 15.2 cm to 17.8 cm) and can be as large as the wheel path travel area of the lane (approximately 24 inches wide / 0.61 m). Ruts are classified based on their depth.
Potholes Potholes are classified based on the frequency of their occurrence. Rocks and Roots The presence of large stones, boulders and tree roots are considered a distress in the PASER unimproved
earth assessment system. This factor is assessed based on its presence. However, no guidance or metrics for rating this distress are given with the method.
Washboarding Washboarding is assessed based on its extent (Walker, 2002b; Walker, 2001).
Table 2. Surface ratings adapted from the Unimproved Pavement Surface Evaluation and Rating (PASER) Manual visual method (Walker, 2001).
Surface Rating
General Description General condition, distress, and improvement
4 Very Good
Graded, cut & fills. Crown present. Drainage: ditches & culverts. Ride: > 25 mph comfortable.
Ruts & potholes: not significant. Surface material: sandy, stable. Access: available year around. Improvement: not needed.
3 Good
Grading: limited. Crown: limited. Drainage: limited. Ride: 15 – 20 mph comfortable.
Ruts: < 3” deep. Potholes: few. Washboarding: scarce. Access: available year around except in severe weather. Improvement: routine maintenance, spot grading.
2 Fair
Grading: ungraded, cut & fills. Crown: little to none. Drainage: little to none. Ride: < 15 mph comfortable.
Ruts & potholes: occasional. Access: limited during & after rain. Improvement: required to improve drainage, repair distresses, and improve condition to good.
1 Poor Recreational trail. Ride: < 10 mph comfortable.
Ruts & potholes: severe. Access: may be restricted extensively. Improvement: reconstruction needed to improve access, repair distresses, improve road to good.
The Gravel PASER System The Gravel PASER system was developed by the Wisconsin Transportation Information Center in 1989 (Walker, 2001). The system classified roads in to one of five categories (ratings of 1 to 5) with a rating of 1 being very poor and a rating of 5 being very good. Rating categories are defined based on the presence or absence of three road characteristics, and the extent and severity of five distress types. Characteristics and distresses considered during a Gravel PASER condition assessment are shown below in Table 3 and rating category descriptions are shown in Table 4 (Walker, 2002b).

Deliverable 2-A: State of the Practice of Unpaved Road Condition Assessment
10
Table 3. Gravel PASER System - Road characteristics and distresses assessed (Walker, 2002b).
Road Characteristics and Distresses
Assessment Criteria
Crown Estimation of the elevation difference between the centerline of the road and the edge of the pavement crown measurements are used to classify this attribute into three bins: six to three inch (15.2 cm to 7.6 cm), less than three inch (<7.6 cm) crown, and zero to negative crown.
Gravel Layer Aggregate thickness measurement guidelines to determine suitability are not provided beyond indicating that a high quality pavement will have ten to six inches (25 cm to 17.6 cm) of aggregate. Surface area coverage guidelines are provided for lower rating classifications.
Drainage Road segments that have been constructed to include provisions for drainage ditches and culverts where necessary are considered favorably while segments that do not have provisions for drainage are considered negatively (Walker, 2001).
Ruts Ruts are classified based on their depth in ranges of: less than one inch (2.5 cm), one inch to three inches (2.5 cm to 7.6 cm), and over three inches (>76 cm).
Potholes Potholes are classified based on the frequency of their occurrence and depth with ranges of: less than two inches (<5.1 cm), two to four inches (5.1 cm to 10.5 cm), and over four inches (>10.5 cm).
Dust Dust is assessed on its presence or absence and is only a determinant factor for the highest two ratings in this system.
Loose Aggregate Loose aggregate is assessed based on the depth of loose material present with ranges of: less than two inches (< 5.2 cm), and over four inches (>10.6 cm) deep (Walker, 2001).
Washboarding Washboarding is assessed based on the depth of its corrugations in ranges of: one to two inches (2.5 cm to 5.1 cm), and over three inches (> 7.6 cm) deep. (Walker, 2001)
The Gravel PASER Manual and the Unimproved PASER Manual provide full details of the criteria for each condition category with descriptions and pictures of the distresses as well as examples of typical conditions that exist in each rating category (Walker, 2002b).
Record Keeping There are minimal data fields necessary to record PASER data, because the system emphasizes the use of judgment in estimating distress extent and severity, rather than physical measurements. Typical PASER records consist of location information for the segment of road being rated, the pavement type for the segment, and the PASER number. In some instances, raters may also provide notes on the types of distresses that are present as a basis for their rating category decision (Walker, 2002b; Walker, 2001).

Deliverable 2-A: State of the Practice of Unpaved Road Condition Assessment
11
Table 4. Surface ratings adapted from the Gravel Pavement Surface Evaluation and Rating (PASER) Manual visual method (Walker, 2002b).
Surface Rating
General Description Visible Distress General condition/
treatment measures
5 Excellent No visible distresses or dust. Excellent: surface and ride.
New construction/total reconstruction. Excellent drainage. Little/no maintenance required.
4 Good Dry conditions: dust. Loose aggregate: moderate. Minor washboarding.
Recently regraded. Good crown and drainage throughout. Adequate gravel for traffic. Maintenance: routine grading, dust control may be needed.
3 Fair
Crown: 3”- 6”. Adequate ditches: > 50% of roadway. Some additional aggregate may be necessary in some areas to correct washboarding/isolated potholes/ruts. Some culvert cleaning needed. Washboarding: 1”-2” deep, 10%-25% of roadway. Dust: partial obstruction of vision. Rutting: None or less than 1” deep. Potholes: occasional, less than 2” deep. Loose aggregate: some, 2” deep.
Visible traffic effects. Maintenance: regarding, ditch improvement, culvert maintenance. Areas may require additional gravel.
2 Poor
Crown: < 3”. Adequate ditches: < 50% of roadway. Ditches may be filled, overgrown, show erosion in areas. 25% or area: little or no aggregate. Culverts partially full of debris. Washboarding: > 3” deep, > 25% of area, moderate to severe. Rutting: 1”-3”, > 10%-25% of area. Potholes: 2”-4”, > 10%-25% of area. Severe loose aggregate (over 4”).
Less than 25 mph travel speed required. Additional new aggregate needed. Maintenance: major ditch and culvert construction required.
1 Failed
Roadway crown: nonexistent or road is bowl shaped. Extensive ponding. Ditching: little, or none. Filled or damaged culverts. Rutting: > over 3” deep, > 25% of the area, severe. Potholes (over 4” deep), over 25% of area. No aggregate: > 25% of areas.
Travel: difficult Frequent road closures. Needs complete rebuilding and/or new culverts.
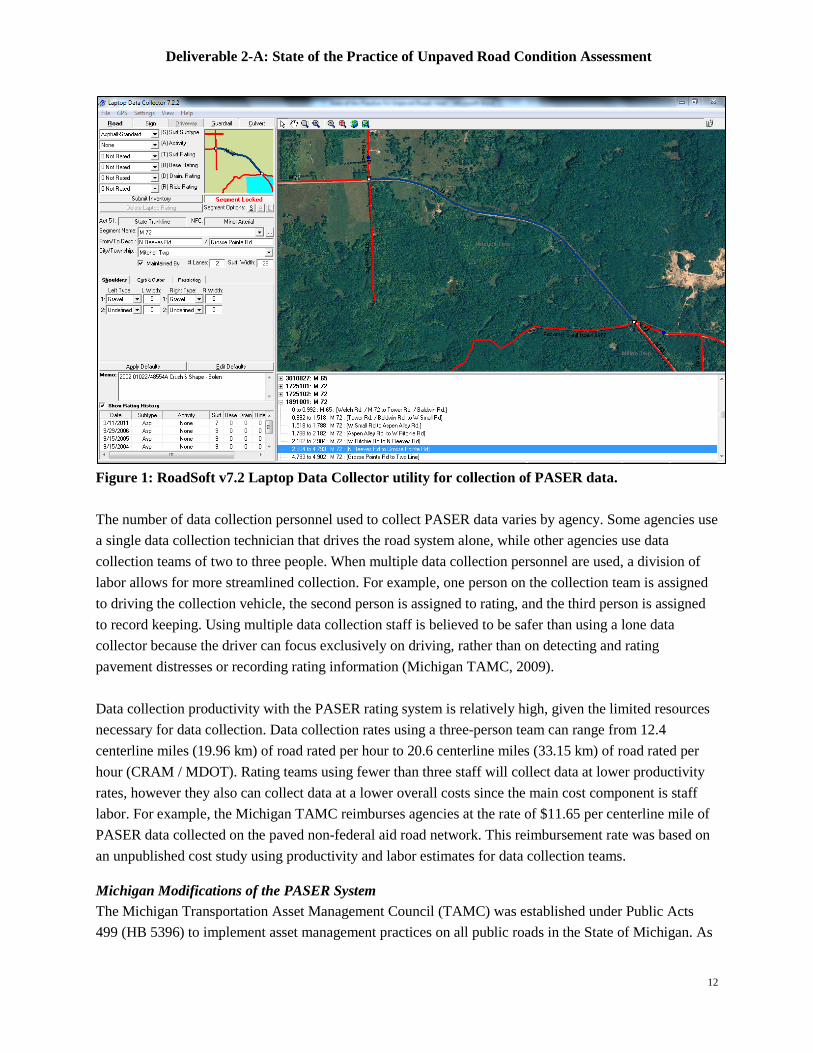
Data Collection Rate and Equipment PASER data collection requires minimal collection equipment. At a minimum, PASER data collection requires: a data entry sheet to record the location of ratings and pavement type, a data collection survey vehicle that can be any type of automobile, and a trained rating technician. Many agencies choose to use some form of GPS-enabled data collection equipment to simplify data record keeping, reduce collection time, and reduce road segment location error. This data collection equipment can include commercially available handheld survey units and/or specialized software designed to run on a GPS enabled laptop. RoadSoft asset management software (see Figure 1) from Michigan Tech's Center for Technology & Training (http://www.roadsoft.org/ ) is one example of a software package that includes a laptop data collection utility that reduces the time necessary to collect PASER data.
Deliverable 2-A: State of the Practice of Unpaved Road Condition Assessment
12
Figure 1: RoadSoft v7.2 Laptop Data Collector utility for collection of PASER data. The number of data collection personnel used to collect PASER data varies by agency. Some agencies use a single data collection technician that drives the road system alone, while other agencies use data collection teams of two to three people. When multiple data collection personnel are used, a division of labor allows for more streamlined collection. For example, one person on the collection team is assigned to driving the collection vehicle, the second person is assigned to rating, and the third person is assigned to record keeping. Using multiple data collection staff is believed to be safer than using a lone data collector because the driver can focus exclusively on driving, rather than on detecting and rating pavement distresses or recording rating information (Michigan TAMC, 2009). Data collection productivity with the PASER rating system is relatively high, given the limited resources necessary for data collection. Data collection rates using a three-person team can range from 12.4 centerline miles (19.96 km) of road rated per hour to 20.6 centerline miles (33.15 km) of road rated per hour (CRAM / MDOT). Rating teams using fewer than three staff will collect data at lower productivity rates, however they also can collect data at a lower overall costs since the main cost component is staff labor. For example, the Michigan TAMC reimburses agencies at the rate of $11.65 per centerline mile of PASER data collected on the paved non-federal aid road network. This reimbursement rate was based on an unpublished cost study using productivity and labor estimates for data collection teams.
Michigan Modifications of the PASER System The Michigan Transportation Asset Management Council (TAMC) was established under Public Acts 499 (HB 5396) to implement asset management practices on all public roads in the State of Michigan. As

Deliverable 2-A: State of the Practice of Unpaved Road Condition Assessment
13
part of that mission TAMC funds the annual collection of PASER data for public roads in the State and provides training for road raters and sets requirements for members of data collection teams (Michigan TAMC, 2009). TAMC requires the use of the PASER system for condition ratings on asphalt, concrete, and sealcoat pavements. Initially TAMC also required the use of the PASER system for gravel and unimproved earth roadways. However, after experimenting with the use of the PASER rating system on gravel and unimproved earth, TAMC determined the unimproved earth and gravel PASER rating systems were not adequate for their needs. Currently, TAMC does not collect pavement condition data on gravel or unimproved earth roads, because a suitable rating system that can be deployed cost-effectively is not available. The interest of TAMC in this project and their willingness to provide data as their main cost-share contribution is based in part on their experience with attempting to use the PASER rating systems for unpaved roads. For a brief period, TAMC used a modification of the original PASER rating system that was developed by Mr. Ron Young, P.E., the Alcona County Road Commission Engineer. The Michigan Modified PASER Gravel system has five rating categories that are numerically labeled from 2 to 10 which allow rating of 2,4,6,8, and 10. This change was completed to make the Michigan Modified Gravel rating system similar to the PASER system for asphalt and concrete pavements, where a 10 point scale (10 discrete categories) is used. The Michigan Modified PASER Gravel rating system also includes other defining criteria in an attempt to make categories more discrete (Table 5) (Young, 2003). Table 5. Michigan Modified PASER Gravel Rating System Guide (Young, 2003).
PASER Rating Description Condition/Defects Remedy/Action
10 Excellent
New gravel surface. Well Crowned with excellent drainage. Surface tight and stable. Dust controlled. Roadside likely open.
None.
8 Very Good
Adequate gravel, well crowned, and well drained. Moderate loose aggregate but maintains shape for significant time after grading. Dust may be controlled or dusty when dry. Roadside likely open.
Routine grading.
6 Good
Adequate gravel (4” minimum), well crowned, at least 50% well drained. Surface loose but maintains shape for limited time after grading. Dusty when dry. Roadside at least 50% open.
Routine grading with spot applications of gravel and/or binder required over less than 50% of length. Some drainage improvement and culvert maintenance may be needed.
4 Fair
Limited gravel. Little to no crown. Less than 50% well drained. Roadside may be heavily vegetated and encroaching on roadway. Frequent low speed required.
Substantial grading with additional gravel and/or binder needed over more than 50% of length. Drainage improvement and/or ditch and culvert cleanout or replacement needed. May require roadside clearing.
2 Very Poor
Very limited gravel, little to no crown, little to no drainage. May be impassable for extended periods and/or over extended length. Very low speed and/or special vehicle frequently required.
Extensive grade improvements including: roadside clearing, base drainage, and gravel improvements needed over fully or nearly full length.
0 Not Rated

Deliverable 2-A: State of the Practice of Unpaved Road Condition Assessment
14
Note: Performance and stability will vary considerably with traffic volume and type, drainage, and sub base.
Wyoming Modifications of the PASER System Wyoming Technology Transfer Center at the University of Wyoming developed a gravel roads assessment system that has been proposed as a solution for management of rural gravel roads. The system was developed as part of a study that evaluated road characteristics and distresses, in an effort to predict the deterioration of gravel roads in rural Wyoming. Following the study, the assessment method was formalized and implemented on a county scale as a pilot project. The system has been used subsequently for studies to assess the damage on the Wyoming gravel road network caused by increased heavy truck traffic (WTTC, 2010). The Wyoming gravel assessment system is a modification of the PASER gravel road assessment system that is similar in application, method, and record keeping. The Wyoming system uses similar evaluation criteria as the PASER system for rutting, dust, loose aggregate, potholes and washboarding, but does not consider crown, drainage, and gravel quality as criteria. The Wyoming system also includes additional criteria for rating that includes an assessment of comfortable riding speed (WTTC, 2010). The authors of this study were contacted to obtain information regarding data collection costs. Costs could not be obtained in time for submission of this document, but will included in later reporting when available. The Wyoming system has 10 rating categories that are ordered from 1 to 10, with 10 being the best rating and 1 being the worst. The Wyoming rating scale is essentially a doubling of the five point gravel PASER rating scale. It includes five intermediate condition categories that have similar distress criteria to the traditional five PASER condition categories, but differentiates ratings by travel speed (Table 6). For example, a Gravel PASER rating of 4 is similar in distress to a Wyoming system rating of 7 or 8, with the determining factor between a rating of 7 or 8 being the travel speed (WTTC, 2010). Table 6. Wyoming rating scale (WTTC, 2010).
Rating Descriptor Speed mph* Distresses** Adapted from the Gravel - PASER manual
10 Excellent 60+ 9 Very Good 50-60 8 Good 45-50 Dust under dry conditions; Moderate loose aggregate; Slight
washboarding 7 Good 40-45 6 Fair 32-40 Moderate washboarding (1”- 2” deep) over 10%-25% of area;
Moderate dust, partial obstruction of vision; None or slight rutting (less than 1” deep); An occasional small pothole (less than 2” deep); Some loose aggregate (2” deep)
5 Fair 25-32
4 Poor 20-25 Moderate to severe washboarding (over 3” deep) over 25% of area; Moderate rutting (1”-3”) over 10% - 25% of area; Moderate potholes (2”-4” deep) over 10%-25% of area; Severe loose aggregate (over 4”)
3 Poor 15-20
2 Very Poor 8-15 Severe rutting (over 3” deep) over 25% of area; Severe potholes (2”-4” deep) over 25% of area; Many areas (over 25%) with little or no aggregate 1 Failed 0-8

Deliverable 2-A: State of the Practice of Unpaved Road Condition Assessment
15
Summary The PASER data collection system is a well-established condition rating system with a large user base in the Midwest, specifically in Michigan and Wisconsin. The system has been shown to work well with asphalt, concrete, and sealcoat pavements for both large area network level assessments, and more detailed project level assessments. The PASER system for these pavement types produces data at a low per mile cost because there is no specialized equipment and limited actual field measurement necessary. However, several concerns exist with the use of the Unimproved Earth and Gravel PASER system. Unimproved Earth and Gravel PASER system categories are not as well defined as the concrete and asphalt PASER systems. This can lead to ambiguity when rating these pavement types. For example, in the Gravel PASER rating system, a pavement exhibiting washboarding between one and two inches deep is indicative of a PASER rating 3. However, the next rating down in the scale (PASER 2) has an acceptable washboarding depth of greater than four inches (10.16 cm) deep. These criteria create an ambiguity for pavements that exhibit washboarding of three inches (7.62 cm) deep because the distress level does not fit into either of the two categories. VISUAL: Road Surface Management System, University of New Hampshire & FHWA
Overview The Road Surface Management System (RSMS) and its accompanying software, RSMS®, was developed for use by local agencies to create road network maintenance plans and to assist in the prioritization of road projects. The method was developed by the University of New Hampshire, in conjunction with the USDOT Federal Highway Administration (FHWA) in 1992 for small and medium sized municipalities for paved and unpaved roads (Goodspeed, 1994). According to the University of New Hampshire, the RSMS method currently has approximately 5,000 users in seven countries. The system is especially popular in the New England states near where it was originated. It is estimated that over 100 agencies within New Hampshire use the RSMS system (Goodspeed, 2011). The RSMS system is used to rate homogenous road segments that are segregated by the rater’s judgment based on having similar construction and maintenance histories, as well as similar distress patterns. Ratings are developed for the entire unpaved road network on a segment-by-segment basis. Each rating is representative of the predominant condition of the road segment. Assessment of road segments is typically completed from a slow moving vehicle that stops periodically, to allow raters to more closely inspect conditions (Goodspeed, 2011). The RSMS rating system assesses seven road characteristics and distresses. Four distress criteria (corrugations, potholes, rutting, and loose aggregate) are classified by severity and extent. Severity is categorized as either low, medium, or high, based on distress depth. Extent is categorized as low, medium, or high, based on the percent of the surface area that is covered by the distress. Low extent indicates less than 10% of the surface area is covered with the distress, medium extent indicates 10% to 30% of the surface area is covered with the distress, and high extent indicates greater than 30% of the

Deliverable 2-A: State of the Practice of Unpaved Road Condition Assessment
16
surface area is covered with the distress. The other three rating criteria (cross section, drainage, and dust) are classified only by qualitative condition, and are rated as good, fair, or poor. Criteria considered during an RSMS condition assessment for unpaved roads are shown in Tables 7 and 8 below (Goodspeed, 1994). Table 9 describes how the road characteristics and distresses are assessed. Road Surface Management System (RSMS): Unpaved roads (Goodspeed, 1994).
Table 7. Severity and extent. Table 8. Condition. Distress Severity Extent Distress Condition
Corrugations Low Medium High
Low: <10% Medium: 10% - 30% High: >30%
Cross-section
Good Fair Poor
Potholes Low Medium High
Low: <10% Medium: 10% - 30% High: >30%
Drainage
Good Fair Poor
Rutting Low Medium High
Low: <10% Medium: 10% - 30% High: >30%
Dust
Light Medium Heavy
Loose Aggregate Low Medium High
Low: <10% Medium: 10% - 30% High: >30%

Deliverable 2-A: State of the Practice of Unpaved Road Condition Assessment
17
Table 9. Road Surface Management System (RSMS) - Road characteristics and distresses assessed (UNH TTC, 2011; UNH, n.d.)
Road Characteristics and Distresses
Assessment Criteria
Corrugations Corrugation severity is rated as low, medium, or high based on depth: low severity indicates corrugations are less than one inch (2.54 cm) deep; medium severity indicates corrugations are one to three inches (2.54 cm - 7.62 cm) deep; and high severity indicates corrugations are over three inches (>7.62 cm) deep. Corrugation extent
Potholes
is rated as low, medium, or high based on the percentage of surface area they cover: low extent indicates corrugations cover less than 10% of the area; medium extent indicates corrugations cover 10% to 30% of the area; and high extent indicates corrugations cover greater than 30% of the area. Pothole severity is rated as low, medium, or high based on depth and diameter: low severity indicates potholes are less than one inch (2.54 cm) deep and/or are less than one foot (30.48 cm) in diameter; medium severity indicates potholes are one to three inches (2.54 cm - 7.62 cm) deep and/or are one to two feet (30.48 cm - 60.96 cm) in diameter; and high severity indicates potholes are over three inches (>7.62 cm) deep and/or are over two feet (>60.96 cm) in diameter. Pothole extent
Rutting
is rated as low, medium, or high based on the percentage of surface area covered and by the number of potholes present: low extent indicates potholes cover less than 10% of the area and/or that there are less than five potholes present in a 100 foot (30.48 m) area; medium extent indicates potholes cover 10% to 30% of the area and/or that there are five to ten potholes present in a 100 foot (30.48 m) area; and high extent indicates potholes cover greater than 30% of the area and/or that there are greater than 10 potholes present in a 100 foot (30.48 m) area. Rut severity is rated as low, medium, or high based on depth: low severity indicates ruts are less than one inch (2.54 cm) deep; medium severity indicates ruts are one to three inches (2.54 cm - 7.62 cm) deep; and high severity indicates ruts are over three inches (>7.62 cm) deep. Rut extent
Loose aggregate
is rated as low, medium, or high based on the percentage of surface area covered: low extent indicates ruts cover less than 10% of the area; medium extent indicates ruts cover 10% to 30% of the area; and high extent indicates ruts cover greater than 30% of the area. Loose aggregate severity is rated as low, medium, or high based on depth: low severity indicates loose aggregate berms are less than two inches (5.08 cm) deep; medium severity indicates loose aggregate berms are two to four inches (5.08 cm - 10.16 cm) deep; and high severity indicates loose aggregate berms are over four inches (>10.16 cm) deep. Loose aggregate extent
Cross-section
is rated as low, medium, or high based on the percentage of surface area covered: low extent indicates loose aggregate berms cover less than 10% of the area; medium extent indicates loose aggregate berms cover 10% to 30% of the area; and high extent indicates loose aggregate berms cover greater than 30% of the area. Cross-section condition
Drainage
is rated as good, fair, or poor based on the crown or slope of a road (if any) and how it moves water: good condition indicates there is little to no ponding water, therefore there is a good crown; fair condition indicates there is some ponding water, therefore little or no crown; and poor condition indicates there is extensive ponding water, therefore depressions. Drainage condition
Dust
is rated as good, fair, or poor based on the presence of water: good condition indicates clear, clean ditches and gutters; fair condition indicates some ponding water or erosion on the side of the road; and poor condition indicates there is running water on the road and ponding water on the side of the road. Dust condition
is rated as good, fair, or poor based on visibility obstruction: good condition indicates dust forms a thin cloud but does not obstruct visibility; fair condition indicates a moderately thick cloud of dust forms that partially obstructs visibility; and poor condition indicates a thick cloud of dust forms that severely obstructs visibility.
Record Keeping Paper records can be used to record severity, extent, and condition data for each road segment. Alternately, the RSMS software can be used to store data during collection with use of a light pen and

Deliverable 2-A: State of the Practice of Unpaved Road Condition Assessment
18
data sheet overlay on a touch sensitive tablet. The RSMS software incorporate a geographic information system (GIS) to store data associated with specific road segments (Goodspeed, 2011). The RSMS system is intended to be used with a decision tree to help map out a potential maintenance option for a road segment, based on the type and extent of distresses. An example decision tree for alligator cracking on an asphalt surface is shown in Figure 2 below. Similar decision trees can be formed with individual agencies’ decision policies; however, the system does not dictate the form of these trees, so individual application is left to the end user (Goodspeed, 1994).
Figure 2. RSMS: Example decision Tree (Goodspeed, 1994). Alligator Cracking
High SeverityLow Severity
Mod
erat
e Se
veri
tyExtent Extent Extent
< 10% < 10% < 10%> 30% > 30% > 30%
10%
- 30
%
10%
- 30
%
10%
- 30
%
Cra
ck S
eal
Cra
ck S
eal
Surf
ace
Coa
t
Patc
h
Ove
raly
Reb
uild
Reb
uild
Reb
uild
Patc
h
Data Collection Rate and Equipment RSMS data collection requires minimal collection equipment. At a minimum, data collection requires the data sheets to record start and end mileage of the road segment and the particular distresses and characteristics described by the severity, extent, and condition (Goodspeed, 1994). The use of the RSMS software allows the collection of data via a handheld computer tablet for direct entry into a GIS database which speeds data entry. According to the University of New Hampshire, a trained rating team using hand held GIS devices can collect rating data for a town of approximately 50 road miles in approximately two days (Goodspeed, 2011).

Deliverable 2-A: State of the Practice of Unpaved Road Condition Assessment
19
Figure 3. RSMS hand held data collection unit (UNHTT, 2010).
Figure 4. RSMS inventory summary screen shot (UNH TTC, 2011).
Figure 5. RSMS unpaved road inventory screen shot (PWS Solutions, 2011).
Deliverable 2-A: State of the Practice of Unpaved Road Condition Assessment
20
Summary The RSMS system has many users in the United States and other countries. The assessment system is quick to deploy and provides a full census of the entire length of the road system and, as such, is not subject to the limitations of sampling. Criteria used to assess road characteristic and distress severity and extent are quantitative and easy to use. Other road condition criteria are based on qualitative descriptions which may lead to subjective ratings for these factors. VISUAL: Standard Visual Assessment Manual for Unsealed Roads, TMH12
Overview The Standard Visual Assessment Manual for Unsealed Roads (TMH12) was developed by CSIR Transportek for the Committee of Land Transport Officials (of South Africa) in 2000. This system was created to standardize ratings for maintenance requirements across provinces of South Africa, to allow a basis of comparison between jurisdictions (Jones, 2003). This distress identification system is used by the South African National Society, Ltd. to maintain the South African road network (SANRAL, n.d). A South African Act of Parliament established SANARL in 1998 as an independent company to manage, maintain, and develop roads for its sole shareholder, the Minister of Transport (SANRAL, n.d). CSIR Transportek developed the Standard Visual Assessment Manual for Unsealed Roads system to provide guidelines that can be used nationally to rate an entire network of gravel roads. This system presents the user with three levels of assessment from which to choose, depending on their needs. The basic level of data acquisition for network level management assesses eight distresses that are evaluated visually to determine their severity or “degree” as it is referred to in this system. In the intermediate assessment level, users can collect additional information on the extent of these distresses by estimating the percentage of the road segment that they cover. The advanced level of data collection for this system includes additional parameters, so the user can tailor the assessment to their needs for use in a gravel road management system, for project management, or research. Users acquire data for this system from periodic assessments of road distresses and material properties using a combination of visual assessment, field examination, and testing (Jones, 2000; Jones, 2003; WCPA, 2007). The assessment method requires the road network to be divided into segments using fixed points such as bridges, intersections, or installed markers (Jones, 2003). This method of segmentation allows for easy field identification of segment beginning and ending points, by relying on physical landmarks. However, it may reduce the homogeneity of rating segments since landmark placement is driving segmentation rather than road characteristic. The length of segments is recommended to be between 1.5 to three miles (2.5 km - 5 km) long (Jones, 2003). Road segments are rated as one contiguous segment (one rating per segment) with the rater allowed to make observation notes about locations that don’t conform to the overall condition of that segment(Jones, 2000).

Deliverable 2-A: State of the Practice of Unpaved Road Condition Assessment
21
Rating System Range At the basic level in this system, road segment distresses are classified the by their severity (referred to as “degree”) for network level management. The eight distresses evaluated for the basic assessment include potholes, corrugations, rutting, loose material, stoniness, erosion, loss of gravel, and dust. Potholes, corrugations, rutting, loose material, stoniness, and erosion are classified into numbered categories from 0 through 5, with 0 indicating the distress is not present and 5 indicating a high level of distress. Loss of gravel and dust are classified into named categories with three levels of severity. These categories are: thickness of the gravel layer, quality of the gravel layer, shape of the road profile, ability to drain water and roadside drainage, ability of traffic to navigate the road, quality of ride, and the amount of moisture present in the road. In the advanced level of this system, additional assessment categories are added. (Jones, 2000; Jones, 2003). Distress severity information is primarily collected through visual assessment. Raters can stop and exit the vehicle to perform direct measurements when necessary. Specifics describing how the severity level for each distress is determined are shown in Tables 10 through 19 below (Jones 2000; Jones, 2003).
1. Potholes: Potholes are assessed based on their average depth in the road segment according to Table 10 below.
Table 10. Pothole degree (adapted from Jones, 2000). Degree Description
0 Not present 1 Depressions are slightly visible but cannot be felt while riding. 2 < 1 in (< 20 mm) deep 3 Large depressions that affect safe travel, ~1 to 2 in (20 to 50 mm) 4 ~ 1 to 3 in (50 to 75 mm) deep 5 Pothole are dangerous requiring action, > 3 in (>75 mm)
2. Corrugations: The degree of severity of corrugations determined by riding in a vehicle traveling
at an average speed and determining their effect of rider comfort. Additionally, a pick can be used to scrape corrugations and information should be noted whether they are fixed or loose. Table 11 below shows the criteria used for rating this distress.
Table 11. Corrugation degree (adapted from Jones, 2000). Degree Description
0 Not present 1 Cannot be felt while riding. 2 Can be heard and felt while riding but no reduction in vehicle speed is necessary. 3 Can be heard and felt while riding and reduction in vehicle speed is necessary. 4 Significant speed reduction is necessary. 5 Path of least resistance on the roadway is chosen because safety is compromised.
3. Ruts: Rut depth can be determined visually from a visual assessment or a straight edge and
measuring tape can be used, depending on the accuracy desired. Rut severity is classified based on their average depth as shown in Table 12 below.

Deliverable 2-A: State of the Practice of Unpaved Road Condition Assessment
22
Table 12. Rutting degree (adapted from Jones, 2000).
Degree Description 0 Not present 1 Ruts are slightly visible. 2 < 1 in (20 mm) deep 3 1 to 1.5 in (20 to 40 mm) 4 1.5 to 2.5 in (40 to 60 mm) 5 Rutting affects directional stability of the vehicle, > 2.5 in (60 mm)
4. Loose material: Aggregate berms of loose materials can be directly measured using a pick to
scrape paths through the material to allow thickness to be measured. The severity of loose material is classified based on the thickness of the material on the road surface. Table 13 below illustrates the criteria for evaluating loose material.
Table 13. Loose Material degree (adapted from Jones, 2000). Degree Description
0 Not present 1 Loose material is just visible. 2 Loose material < 1 in (20 mm) deep 3 Loose material 1 to 1.5 in (20 to 40 mm) 4 Loose material 1.5 to 2.5 in (40 to 60 mm) 5 Loose material > 2.5 in (60 mm)
5. Stoniness: Stoniness is the measure of oversize stones that are left on the roadway when fines
have migrated elsewhere. Stones can be fixed or loose as shown in Table 14 and 15. Assessment is most commonly conducted within a vehicle traveling at an average speed.
Table 14. Stoniness degree - fixed (adapted from Jones, 2000).
Degree Description 0 Not present 1 Slightly visible but cannot be heard or felt while riding.
2 Protruding stones can be felt and heard, but speed reduction is not necessary. Blading is not affected.
3 Speed reduction necessary. Road is bladed with difficulty. 4 Protruding stones require evasive action 5 Vehicles avoid protruding stones or drive slowly. Road cannot be effectively bladed.
Table 15. Stoniness degree - loose (adapted from Jones, 2000).
Degree Description 0 Not present 1 Few loose stones 1 to 2 in (26 – 50 mm). Vehicle can change lanes safely.
3 Many loose stones 1 to 2 in (26 - 50 mm) or few loose stones 2 in (> 50 mm). Stones influence the vehicle when changing lanes.
5 Rows of loose stones 1 to 2 in (26 – 50 mm) or many loose stones 2 in (> 50 mm). Any lateral movement of the vehicle poses a significant safety hazard.
6. Erosion: Erosion depth of the road surface can be determined visually, by ride quality, or by
using a straight edge and ruler, depending on the accuracy desired by the user. Erosion length

Deliverable 2-A: State of the Practice of Unpaved Road Condition Assessment
23
(longitudinal erosion) and width (transverse erosion) are both recorded. Erosion severity is evaluated in each direction independently and is classified as shown in Table 16.
Table 16. Erosion degree (adapted from Jones, 2000).
Degree Longitudinal Erosion Description Transverse and Diagonal Erosion Description 0 Not present Not present 1 Evidence of water damage Minor evidence of water damage
2 Channels < 1 in (20 mm) deep Seen, but not felt or heard - channels ¼ in deep x 2 in wide (10 mm deep x 50 mm wide)
3 Channels 1 to 1.5 in (20 to 40 mm) deep
Can be felt and heard – speed reduction necessary – 1 in x 3 in (30 mm x 75 mm)
4 Channels 1.5 to 2.5 in (40 to 60 mm) deep
Significant speed reduction necessary - 2 in x 6 in (50 mm x 150 mm)
5 Channels > 2.5 in (60 mm) deep Vehicles drive very slowly and attempt to avoid them > 2.5 in x 10 in (> 60 mm x 250 mm)
7. Loss of gravel: Loss of gravel is assessed by noting the percentage of road surface that the
subgrade is exposed, as shown in Table 17.
Table 17. Loss of gravel degree (adapted from Jones, 2000). Degree Description
None No general stone protrusion or no exposure of subgrade. Isolated Less than 20% exposure of the subgrade over the length of the segment. General 20 to 100% exposure of the subgrade over length of segment.
8. Dust: Degree of dust is assessed by viewing visibility conditions created from a traveling
vehicle at 40 mph (60 km/hr) in the rear view mirror or by a fixed observer viewing a passing vehicle. Criteria for assessing the degree of this distress are shown in Table 18 below.
Table 18. Dust degree (adapted from Jones, 2000). Degree Description
None No loss of visibility. Minor Some loss of visibility – no discomfort. Severe Dangerous loss of visibility – significant discomfort.
The intermediate level of this system records the extent of the eight distresses discussed above in the basic level assessment. The extent of a distress gives a visual representation of where specific distresses are present and can be used to monitor the spread of the distress on the road segment. The extent of distress on the road segment is assessed by percentage of coverage in levels 1 through 5, where 1 signifies isolated occurrences and 5 signifies extensive occurrences. Distress locations can be marked on a drawing of the road segment and the extent can be determined by referencing Figure 6. Table 19 associates the visual descriptions of extent as shown in Figure 1 to percentage of occurrence (Jones, 2000).

Deliverable 2-A: State of the Practice of Unpaved Road Condition Assessment
24
Extent = 1: isolated occurrence
Extent = 3: scattered occurrence over most of the length
Or extensive occurrence over a limited portion of the length
Extent = 5: extensive occurrence
Figure 6. Distress extent (adapted from Jones, 2000).
Table 19. Distress extent (adapted from Jones, 2000). Extent Distress Description % of Extent
1
The distress occurs as isolated instances. The distress is not represented throughout the entire segment length being evaluated. Distresses are caused by localized changes in the material, subgrade or drainage conditions. Distresses may be located at points of heavy wear: intersections, steep grades or sharp curves.
< 5%
2 5% to 20%
3
The distress occurs as intermittent instances, over most of the segment length, or occurs extensively over a limited portion of the segment length. When the distress occurs over most of the segment length, problems are usually associated with the material quality or maintenance procedures. When the distress occurs over limited portions, the problem is usually a result of local material variations or drainage problems.
20% to 60%
4 60% to 80%
5 The distresses occur extensively usually because of poor quality or insufficient wearing course material, or inadequate maintenance. 80% to 100%
In the advanced level of this system, additional road characteristic are assessed including thickness of the gravel layer, quality of the gravel layer, shape of the road profile, ability to drain water and roadside drainage, ability of traffic to navigate the road, quality of ride, and the amount of moisture present in the road (Jones, 2003).

Deliverable 2-A: State of the Practice of Unpaved Road Condition Assessment
25
9. Gravel quantity/ thickness: This parameter is assessed on a 1 to 5 scale based on the coverage and thickness of the gravel surface as shown in Table 20.
Table 20: Visual assessment of gravel quantity and thickness (adapted from Jones, 2000). Extent Distress Descriptor Description in (mm) 1 Plenty Good shape, and no stone protrusion > 5 in (>125 mm) 2 Sufficient No exposures of subgrade, but some stone protrusion 4 – 5 in (100 – 125 mm) 3 Isolated exposures Less than 25 per cent exposure of the subgrade 2 – 4 in (50 – 100 mm) 4 Extensive exposures Up to 75 per cent exposure of the subgrade 1 – 2 in (25 – 50 mm) 5 None 75 to 100 per cent exposure* 0 - 1 in (0 - 25 mm) *Complete subgrade exposure should be carefully examined so it is not confused with the adequacy of the gravel layer.
10. Gravel quality: The gravel quality factor is assessed on a 1 to 5 scale based on the criteria listed in Table 21.
Table 21: Visual assessment of gravel quality (adapted from Jones, 2000).
Rating Descriptor Description
1 Very good Evenly distributed range of particle sizes and sufficient plasticity that the material will leave a shiny streak when scratched with a pick. No significant cracking, raveling and/or excessive oversize
2 Good Minor raveling or cracking and/or minimal 3 Average Cracking, loose material or stones clearly visible.
4 Poor Poor particle size distribution with excessive oversize. Plasticity high enough to cause slipperiness. Raveling is sufficient to cause loss of traction.
5 Very poor Poorly distributed range of particle sizes and/or zero or excessive plasticity. Cracking and/or quantity of loose material/stones are significant and affect safety of road user. Excessive oversize.
11. Road profile/shape: This factor can be classified in to a 1 to 5 scale using the criteria shown in
Table 22 below. Table 22: Visual assessment of road profile (adapted from Jones, 2000).
Rating Descriptor Description 1 Very good shape Well-formed camber (about 3 – 4%) 2 Good shape Good camber (about 2 %) 3 Flat Some unevenness with camber mostly less than 2%
4 Uneven Obvious development of irregularities that will impede drainage and form depressions
5 Very uneven Development of severe irregularities impeding drainage and likely to cause extensive localized ponding. Water tends to flow to the center of the road or individual lanes
12. Road drainage: Drainage is classified into one of five categories (rating 1 to 5) by using the
criteria shown in Table 23.

Deliverable 2-A: State of the Practice of Unpaved Road Condition Assessment
26
Table 23: Visual assessment of drainage (adapted from Jones, 2000). Extent Descriptor Description 1 Well above ground level Edges of road are at least 300 mm* above natural ground level with effective side
drains 2 Slightly above ground level Road is between 50 and 300 mm above natural ground level. Side drains are present.
Stormwater could cross in isolated places. 3 Level with ground Road is generally at ground level with ineffective side drains. Stormwater could
cross in most places. 4 Slightly beneath ground level Isolated areas of the road are below natural ground level. No side drains are present
and localized ponding of water will occur. 5 Canal Road is the lowest point and serves to drain the entire area. *If the road structure has drainage pipes in the subgrade, the road structure should be at least 500 mm above the ditch flowline.
13. Trafficability (the ability of traffic to navigate the road) is subjectively rated with either a 1 or a 5
as summarized in Table 24below. Table 24: Trafficability (adapted from Jones, 2000).
Rating Descriptor Description 1 Acceptable Traffic can pass the road at reasonable speeds. 5 Unacceptable Traffic speed is hampered by potholes, areas of ponding, debris and vegetation.
14. Riding quality/safety: Raters subjectively determine ride quality by evaluating roughness during
travel at a range of speeds and classifying the road segment into a 1 to 5 rating as shown in Table 25. Roughness is a function of maintenance, material, traffic, and weather.
Table 25. Riding quality/safety (adapted from Jones, 2003).
Rating Descriptor Description 1 Very good Estimated comfortable/safe speed in excess of 60 mph (100 km/h) 2 Good Estimated comfortable/safe speed between 50 – 60 mph (80 and 100 km/h) 3 Average Estimated comfortable/safe speed between 40 – 50 mph (60 and 80 km/h) 4 Poor Estimated comfortable/safe speed between 25 – 40 mph (40 and 60 km/h) 5 Very poor Estimated comfortable/safe speed less than 40 km/h (25 mph)
15. Moisture condition: Moisture condition is a qualitative assessment of the overall level of soil
moisture in road materials. This parameter is rated either dry or wet. This parameter can be used to provide context for other rating factors.For example if a road segment was rated as wet, one would not expect dust to be significant. No direct guidance is given for rating criteria for this factor, however the system does indicate that the parameter can either be visually assessed or determined from field tests where more accurate assessments are required.
Record Keeping & Equipment The Standard Visual Assessment data collection requires minimal collection equipment. When data are collected, they are recorded on assessment forms with spaces for recording the presence and degree of each distress. An example assessment form is included as Figure 7 below. If data are to be collected for use in a gravel road management system, project, or research assessment, it is suggested that they be

Deliverable 2-A: State of the Practice of Unpaved Road Condition Assessment
27
collected when road segments are dry and that the date be recorded for consistency if data are collected annually (Jones, 2003).
Figure 7. Sample assessment form for the Visual Assessment Manual for Unsealed Roads (TMH12) method (Jones, 2000).
Data Collection Rate, Speed, & Cost Data collection per day should not exceed approximately 80 miles (130 km) of road or approximately three 3-mile (5 km) segments per hour for 8 hours. Data collection speed should be approximately 25 mph (40 km/h) or less, unless otherwise specified as in the case of dust collection where the recommended speed is approximately 37 mph (60 km/h). Raters should exit the vehicle for observations at least one time per segment. A ruler, straight edge, and pick are necessary for directly measuring the degree of some distresses as indicated in the Rating System Range section above. It is possible that raters may want to travel as slow as 12.5 mph (20 km/h) so they can stop and exit the vehicle more frequently to collect more data that can increase data quality (Jones 2000; Jones, 2003). The authors of this study were contacted to

Deliverable 2-A: State of the Practice of Unpaved Road Condition Assessment
28
obtain information regarding data collection costs. Costs could not be obtained in time for submission of this document but will be included in later documentation when available. Data collection for network level management should be collected as specified by the road owning agency. It is recommended that data for a gravel road management system be collected annually and as specified for projects or research (Jones 2000; Jones, 2003).
Data & Applications The Standard Visual Assessment Manual for Unsealed Roads (TMH12) was written to collect data for use at several levels. Applications include network level management, gravel road management systems, projects, and research. Data collected can be used for a distress and extent rating as discussed here (Jones 2000; Jones, 2003). Severity ratings are collected for use in various gravel road management systems. However, instructions on data use are not given in detail. Road raters can document data on forms provided in the manual or forms can be developed by the agency. It is suggested that users be trained prior to rating roads due to the amount of the data being collected and the complexity of the forms. This method recommends that training sessions be held annually and after the road network is rated, quality control should be performed on 10% to 15% of the rated segments (Jones, 2000).
Summary & Costs The method is very detailed and suggests a large quantity of detailed information be collected using visual identification. The system does not require any sophisticated data collection equipment and suggests that data can be collected relatively quickly. The rating manual indicates that data from this method are intended to be used in a number of management systems; however, there are no concrete examples for management system use of the data, leaving the user to formulate their own. The system lacks key criteria to allow a rater to discern between rating levels for many of the distresses, so the user is left to make their own criteria or rate subjectively. The recommended road segmentation method (by landmark) is attractive because it does not require a developed mile post system or the use of GPS equipment. , However, because road segments are divided based on geographic features, they may not be homogenous causing difficulty in producing a representative rating. The basic framework of this system has been modified and adapted to satisfy needs of other South African transportation agencies such as the Visual Assessment of Gravel Roads system used by the Provincial Government of the Western Cape of South Africa. Both of these assessment systems are nearly identical (WCPA, 2007). The authors of this study were contacted to obtain information regarding data collection costs. Costs could not be obtained in time for submission of this document but will be included in later documentation when available.

Deliverable 2-A: State of the Practice of Unpaved Road Condition Assessment
29
VISUAL: Subjective Rating System - Central Federal Lands Highway Division
Overview The Federal Lands Highway Technology Program (FLHTP) was developed by the Central Federal Lands Highway Division of the Federal Highway Administration (FHWA) to monitor unpaved road stabilization products to determine which were the most effective and least costly (Surdahl, 2005). This program studied conditions on several stabilized road test sections at the Buenos Aires National Wildlife Refuge and the Seedskadee National Wildlife Refuge over a two-year period to determine the effectiveness of stabilization products (Surdahl, 2005; Woll, 2008). The Central Federal Lands Highway Division of the Federal Highway Administration (FHWA) published the studies relating to these projects in 2005 and 2008 respectively (Surdahl, 2005; Woll, 2008). As part of these studies the Federal Lands Highway Technology Program developed a subjective assessment system and an objective rating system to assess the quality test sections of unpaved roads by dividing them into half a mile to one mile segments (0.80 km - 1.6 km) for analysis (Surdahl, 2005; Woll, 2008).
Subjective Rating System The subjective assessment system includes a visual rating system which evaluates five distress parameters for each segment of road. Road segments are rated for each of the five distresses (dust, washboarding, raveling, rutting, and potholing) by comparing them to a control segment. Ratings are in the form of an 11 point (0 to 10) rating scale for each distress parameter, where a rating of 5 indicates identical distress levels when compared to the control segment. Ratings above a 5 indicate less distress than the control section, while lower ratings indicate higher distress than the control segment. The rating system is entirely subjective with no criteria for determining specific rating levels other than a rater's professional opinion. The assessment activities are duplicated, with four or more raters independently evaluating the same road sections for all of the parameters. Scores from all raters are averaged to create a single set of distress scores for each road segment. An overall average rating is created by averaging the scores of all the distresses. Descriptions of distress parameters are included below. An example compilation of distress parameters to create a visual overall average score is shown in Table 26. Table 26. Federal Lands Highway Technology Program – Road conditions and distresses assessed (adapted from Surdahl, 2005).
Road Characteristics and Distresses Assessment Criteria Dust The dust level of each section is rated relative to the baseline section. A two-vehicle caravan is used
to monitor dust with the raters riding in the trailing vehicle. Washboarding Washboard ratings are visually assessed by comparing them with a baseline road section on a 1to10
scale. Raveling Raveling ratings are visually assessed in comparison with the baseline road section on a 1 to 10 scale. Rutting Rutting ratings are collected in comparison with the baseline road section on a 1 to 10 scale. Potholes Pothole ratings are collected in comparison with the baseline road section on a 1 to 10 scale.
Table 27 illustrates an example of the objective rating system the data collected from the Buenos Aires National Wildlife Refuge study. It illustrates how the average score is determined from the combination of the individual distress scores. In this example, test section IV served as the baseline which was given a

Deliverable 2-A: State of the Practice of Unpaved Road Condition Assessment
30
rating of 5. The ratings reported for each test section in this study were averaged from ratings acquired independently by three raters every six months (Surdahl, 2005; Woll, 2008). Table 27. Rating parameter summary (adapted from Surdahl, 2005).
Test Section
Dust Overall Average
Value
Washboard Overall Average
Value
Ravel Overall Average
Value
Rutting Overall Average
Value
Pothole Overall Average
Value
Visual Overall Average
Value I 7.0 7.3 7.2 6.1 5.0 6.5 II 8.2 8.5 8.3 6.5 5.0 7.3 III 5.8 5.8 5.3 5.5 5.0 5.5
IV (control) 5.0 5.0 5.0 5.0 5.0 5.0 V 5.5 6.0 5.8 5.3 5.0 5.5 VI 6.0 5.8 5.8 5.4 5.0 5.6 VII 5.8 5.2 5.3 5.8 5.0 5.4
Record Keeping, Data Collection Rate, and Equipment Three or four data collectors ride together for each visual assessment survey to determine subjective ratings for each distress. This system uses a visual survey, so assessment is accomplished from a slow-moving vehicle. Two vehicles are used for dust assessments. The lead vehicle travels at 25 mph to simulate traffic while a following vehicle caries the rating crew. Data collection equipment is minimal. The primary need is a method for storing data, which can consist of rating sheets or forms that allow raters to record the control segment that they are comparing segments against along with the ratings collected for the subject section (Surdahl, 2005; Woll, 2008). The authors of this study were contacted to obtain information regarding data collection costs. Costs could not be obtained in time for submission of this report but will be included in later documentation when available..
Summary The Central Federal Lands Highway Division's subjective rating system was designed specifically to complete a comparative study for stabilization products on unpaved roads, although the system could be applied to any repeated measures research design. The system provides a complete method to compare multiple field test sections to determine qualitatively which treatments produce superior results. This system produced satisfactory data for a comparative research study. It is not a practical assessment system for use as an everyday tool for managing unpaved roads, due to the fact that its ratings are all relative to a control section.

Deliverable 2-A: State of the Practice of Unpaved Road Condition Assessment
31
Combination (Visual and Direct Measurement) Methods
COMBINATION: Objective Rating System - Central Federal Lands Highway Division
Overview The Central Federal Lands Highway Division of the USDOT FHWA studied the impact of stabilizing products on unpaved roads in the Buenos Aires National Wildlife Refuge and the Seedskadee National Wildlife Refuge in 2005 and 2008 respectively (Surdahl, 2005; Woll, 2008). As part of these studies the Federal Lands Highway Technology Program developed an objective rating system in addition to the previously described subjective rating system for assessing the quality test sections of unpaved roads.
Objective Rating System Road sections are divided into half a mile to one mile segments (0.80 km - 1.6 km) for analysis. Each segment has four, 25 foot (7.6 m) long test areas assigned randomly to it that represent the road segment (Surdahl, 2005; Woll, 2008). Physical measurements of five distresses (dust, washboarding, raveling, rutting, and potholing) are collected on each test area. An average physical measurement is calculated for each distress on the road segment using the results from each test area. The average physical measurement for each distress is converted into an eleven-point (0 to 10) scale, then the resulting scores are averaged to create an overall Objective Rating. Table 28 below shows an example of data collected using the objective system (Woll, 2008). Table 28. Objective Ratings from Field Measurements (Woll, 2008).
Event
Dust Washboard Raveling Rutting Potholing Objective Overall Rating (x10)
Agreed Rating
Overall Rating
Avg. Depth (mm)
Rating Overal Rating
Avg. Depth (mm)
Rating Overal Rating
Avg. Depth (mm)
Rating Overal Rating
Avg. Depth (mm)
Rating Overal Rating
8-mo. 6
5.3
0.0 10
8.8
18.6 6
6.3
0.0 10
8.5
0.0 10
9.3 76 11-mo. 5 6.0 8 9.8 8 2.8 9 17.0 7
20-mo. 4 3.9 9 16.4 6 10.4 7 0.0 10
23-mo. 6 7.7 8 20.4 5 7.9 8 0.0 10
8-mo. 8
7.3
0.0 10
9.3
8.8 8
7.5
0.0 10
9.0
0.0 10
10.0 86 11-mo. 8 0.5 9 6.6 8 1.7 9 0.0 10
20-mo. 4 0.5 9 12.3 7 5.0 8 0.0 10
23-mo. 9 4.7 9 12.7 7 1.3 9 0.0 10
8-mo. 7
6.0
0.0 10
9.3
14.8 7
6.8
12.4 7
8.3
0.0 10
10.0 81 11-mo. 5 4.4 9 12.8 7 8.2 8 0.0 10
20-mo. 5 3.6 9 16.1 6 7.0 8 0.0 10
23-mo. 7 4.4 9 12.7 7 0.0 10 0.0 10
8-mo. 5
4.3
0.0 10
7.8
16.8 6
5.8
0.0 10
8.5
0.0 10
10.0 73 11-mo. 3 6.9 8 15.2 6 5.6 8 0.0 10
20-mo. 4 10.4 7 23.3 5 8.9 8 0.0 10
23-mo. 5 17.2 6 16.2 6 8.6 8 0.0 10
8-mo. 6
6.5
0.0 10
9.5
17.8 6
6.8
0.0 10
8.0
0.0 10
10.0 82 11-mo. 5 0.0 10 9.3 8 5.5 8 0.0 10
20-mo. 8 1.0 9 17.8 6 10.3 7 0.0 10
23-mo. 7 0.8 9 12.8 7 14.1 7 0.0 10
8-mo. 8
8.0
0.0 10
9.3
12.3 7
7.3
0.0 10
8.8
0.0 10
10.0 87 11-mo. 8 0.0 10 7.8 8 1.9 9 0.0 10
20-mo. 7 3.8 9 14.8 7 2.6 8 0.0 10
23-mo. 9 7.0 8 10.9 7 8.6 8 0.0 10

Deliverable 2-A: State of the Practice of Unpaved Road Condition Assessment
32
Distress Parameters: 1. Dust: This parameter is assessed by a two vehicle team, with the lead vehicle traveling at 25 mph and the following vehicle completing the condition assessment.
Rating Description (Woll, 2008): 0 - Vehicle generating dust cannot be seen - Must stop for dust to clear 1 - Dangerous loss of visibility - Significant uneasiness at driving 25 mph 2 - Dangerous loss of visibility - Significant uneasiness at driving 25 mph 3 - Significant loss of visibility – Some uneasiness at driving 25 mph 4 - Significant loss of visibility – Some uneasiness at driving 25 mph 5 - Some loss of visibility – Little to no uneasiness at driving 25 mph 6 - Some loss of visibility – Little to no uneasiness at driving 25 mph 7 - Very little loss of visibility – No uneasiness at driving 25 mph 8 - Very little loss of visibility – No uneasiness at driving 25 mph 9 - A little low rising dust but no loss of visibility 10 - No Dust
2. Washboarding: This parameter is assessed by measuring the depth of six corrugations in a test area and averaging the depth. The average physical measurement for a test section is converted to a rating score based on the following criteria:
Rating Description (Woll, 2008): 0 - Wash boarding troughs are > 60 mm deep 1 - Wash boarding troughs are between 50 mm and 60 mm deep 2 - Wash boarding troughs are between 40 mm and 50 mm deep 3 - Wash boarding troughs are between 30 mm and 40 mm deep 4 - Wash boarding troughs are between 25 mm and 30 mm deep 5 - Wash boarding troughs are between 20 mm and 25 mm deep 6 - Wash boarding troughs are between 15 mm and 20 mm deep 7 - Wash boarding troughs are between 10 mm and 15 mm deep 8 - Wash boarding troughs are between 5 mm and 10 mm deep 9 - Wash boarding troughs are barely visible (< 5 mm deep) 10 - Wash boarding is not visible
3. Raveling: Sometimes referred to a loose aggregate, raveling results in the formation of linear berms of segregated loose aggregate particles in the less traveled areas adjacent to wheel paths, and typically run longitudinally along the road for significant distances. Raveling is measured on the aggregate berms on the outside of the wheel paths on both sides of a road test area. Depth measurements of the loose aggregate are averaged for the road segment. The average physical measurement for a test section is converted to a rating score based on the following criteria:
Rating Description (Woll, 2008) 0 - Loose material > 60 mm thick 1 - Loose material between 50 mm and 60 mm thick 2 - Loose material between 40 mm and 50 mm thick 3 - Loose material between 30 mm and 40 mm thick 4 - Loose material between 25 mm and 30 mm thick

Deliverable 2-A: State of the Practice of Unpaved Road Condition Assessment
33
5 - Loose material between 20 mm and 25 mm thick 6 - Loose material between 15 mm and 20 mm thick 7 - Loose material between 10 mm and 15 mm thick 8 - Loose material between 5 mm and 10 mm thick 9 - Loose material is barely visible (< 5 mm thick) 10 - Loose material is not visible
4. Rutting: Rutting is measured on the inside and outside wheel paths in a road test area using a straight edge and ruler. Depth measurements are averaged for the road segment. The average physical measurement for a test section is converted to a rating based on the following criteria:
Rating Description (Woll, 2008): 0 - Rutting is > 60 mm thick 1 - Rutting is between 50 mm and 60 mm thick 2 - Rutting is between 40 mm and 50 mm thick 3 - Rutting is between 30 mm and 40 mm thick 4 - Rutting is between 25 mm and 30 mm thick 5 - Rutting is between 20 mm and 25 mm thick 6 - Rutting is between 15 mm and 20 mm thick 7 - Rutting is between 10 mm and 15 mm thick 8 - Rutting is between 5 mm and 10 mm thick 9 - Rutting is barely measurable (< 5 mm thick) 10 - Rutting is not measurable
5. Potholes: This parameter is measured by recording the number of potholes in a test area and recording the average depth. Depth measurements are completed using a straight edge and ruler. The average physical measurement for a test section is converted to a rating based on the following criteria:
Rating Description (Woll, 2008): 0 - Road is not passable for most passenger cars 1 - Many potholes are evident > 100 mm deep 2 - Many potholes are evident ranging from 80 to 100 mm deep 3 - Many potholes are evident ranging from 65 to 80 mm deep 4 - Some potholes are evident ranging from 50 to 65 mm deep 5 - Some potholes are evident ranging from 35 to 50 mm deep 6 - Some potholes are evident ranging from 20 to 35 mm deep 7 - A few potholes are evident ranging from 10 to 20 mm deep 8 - A few potholes are evident ranging from 5 to 10 mm deep 9 - A few potholes are evident < 5 mm deep 10 - Potholes are not evident
Record Keeping, Data Collection Rate, and Equipment This system uses precise measurements of distresses on a series of test areas within a road segment, so it is necessary to stop the survey vehicle frequently to complete the assessment. Two vehicles are used for dust assessments. The lead vehicle travels at 25 mph to simulate traffic while a following vehicle caries the rating crew. Distress measurements can be accomplished by a single data collector;but it may be necessary to have a traffic spotter for the safety of the data collection crew. Data collection equipment is

Deliverable 2-A: State of the Practice of Unpaved Road Condition Assessment
34
minimal, and it includes basic straight edges and rulers to measure the depth of distresses, and some method for storing data, which can consist of rating sheets or forms that allow raters to record the measurements collected for the subject section (Woll, 2008).
Summary The subjective rating system was designed specifically to complete a comparative study for stabilization products on unpaved roads. The system could be applied to any research project where precise measurements of distress propagation is of interest. This system could also prove practical as an assessment system used for managing unpaved roads, because it has very well defined rating and measurement criteria that are likely to produce a high degree of repeatability. Subjective rating is effective for use on both gravel and unimproved earth roads. Its average physical measurement is a combined distress measure that can be used as an overall network level metric to easily compare different road segments. The only drawback of this system for daily management is the degree of precision that is required (+/- 5 mm in most cases) for the distress measurement. This level of precision may not be required for daily management decisions, depending on the road condition indicator being assessed (see Deliverable 1-A for more information on measurement requirements, available at http://geodjango.mtri.org/unpaved/media/doc/deliverable_Del1-A_RequirementsDocument_MichiganTechUnpavedRoadsr1.pdf). COMBINATION: Unsurfaced Road Condition Index (URCI)
Overview The Unsurfaced Road Condition Index (URCI) method was developed by the Department of the Army to manage roads on military facilities and to provide a basis for selecting and prioritizing maintenance activity. While the system was developed specifically for unpaved roads on military installations, this method has gained wide use for local and state government agencies and is used throughout the United States for asphalt and concrete pavements (Pavement Condition Index – PCI) (Eaton, 1987; Eaton 1987a; Department of the Army, 1995). The UCRI method uses a sampling approach by segregating roads into distinct segments or branches that have similar characteristics including structure, traffic volume, construction history and road rank. The conditions of road segments are determined by analyzing representative sample units ranging in size from 1,500 to 3,500 square feet (140 to 325 square meters). Sample units are approximately 100 feet (30 meters) in length and one sample unit is required for every half of a mile (0.8 kilometer) of road (Department of the Army, 1995). The UCRI method uses a combination of a visual assessment of road characteristics and a physical measurement of specific distresses to quantify the condition of gravel and earth roads. Unsurfaced road conditions change quickly, so it is recommended that data be collected at least four times per sampling unit per year during each season. This method measures seven characteristics and distresses.. The two

Deliverable 2-A: State of the Practice of Unpaved Road Condition Assessment
35
road characteristics that are assessed visually can either be collected from a slow-moving vehicle or manually measured.The other five distresses must be measured manually, using a wheeled distance meter, surveying tape, or ruler (to measure depth). The UCRI method specifies procedures for measuring each distress (Eaton, 1987; Eaton 1987a; Department of the Army, 1995). The five distresses used by the UCRI method each have measurable criteria that allow a user to classify the distress into either low, medium, or high severity bins. Unique curves are provided for each distress so users can determine a deduction value for each distress from a combination of its frequency and severity (low, medium or high) on the test segment. An example of a deduct value curve for the improper cross section factor is shown in Figure 8 below. Distresses higher in severity and frequency (density) accumulate more deduct values (Eaton, 1987; Eaton 1987a; Department of the Army, 1995).
Figure 8. Improper cross section factor deduct value curves (Eaton 1987a). Deduct values for each of the seven factors are combined and then subtracted from 100 total possible points to create a combined index score. The UCRI system has a maximum score of 100 points for a perfect road segment and a minimum score of zero for completely failed sections of road. The combined index score can be used as a network level metric to compare different sections of road, while the individual scores for each of the seven road characteristics and distresses, shown in Table 29 below, can

Deliverable 2-A: State of the Practice of Unpaved Road Condition Assessment
36
be used to determine appropriate maintenance or rehabilitation options for the specific road segment (Department of the Army, 1995). Table 29. Department of the Army (UCRI) – Road conditions and distresses assessed (Department of the Army, 1995).
Road Characteristics and Distresses Assessment Criteria Improper Cross Section Minimal evidence of ponded surface water warrants a low severity rating while large amounts of
ponded water or severely depresses cross sections warrant either medium or high severity rating in this category. The length of roadway exhibiting each of the three severity levels of this factor is recorded and used as a measure of density.
Drainage Drainage features that allow water to pond, are eroded, or are overgrown with vegetation are classified into either low, medium or high severity. The length of roadway exhibiting each of the three severity levels of this factor is recorded as a measure of the factor’s density.
Corrugations Corrugated surface areas are classified into the following three bins: corrugations up to one inch (2.5 cm) deep are low severity, corrugations one inch to three inches deep (2.5 cm - 7.6 cm) are medium severity, and corrugations greater than three inches (>7.6 cm) are high severity. The square area of each bin of corrugated surface is measured to determine density.
Dust If dust is present but visibility is not obscured, the factor is considered low severity. Potholes Potholes are classified as either low, medium or high severity based on a matrix of the frequency of
their occurrence and classified into diameter and depth ranges of: less than two inches (5.1cm) , two to four inches (5.1 cm - 10.2 cm) , and over four inches ( >10.2 cm).
Ruts Ruts are classified based on their depth in the following three bins: ruts up to one inch deep (2.5 cm) are low severity, ruts one inch to three inches deep (2.5 cm - 7.6 cm) are medium severity, and ruts greater than three inches (>7.6 cm) are high severity. The total surface area is measured for each rutting depth bin for the sample unit.
Loose Aggregate Loose aggregate berms are classified into three bins: berms of loose aggregate less than two inches deep (<5.1 cm) are low severity, berms of loose aggregate two to four inches (5.1 cm - 10.2 cm) are medium severity, and berms of loose aggregate over four inches ( >10.2 cm) deep are high severity.
Record Keeping Information collected on each sample unit is recorded on the Unsurfaced Road Inspection Sheet or form DA 7348-R. An example of DA 7348-R is shown below in Figure 9. Measurements on the extent and severity of the seven road characteristics and distresses (cross section, drainage, corrugations, dust, potholes, ruts, and loose aggregate) are retained individually for each test section. The total calculated deduct values and resulting UCRI are also recorded for each road section (Department of the Army, 1995).

Deliverable 2-A: State of the Practice of Unpaved Road Condition Assessment
37
Figure 9: UCRI calculation sheet – US Army form DA 7348-R (Department of the Army, 1995). Data acquired can be managed with a paper filing system outlined by the method that consists of a file for each test section organized by road section name. Records for the UCRI system can also be recorded using the Micro PAVER program for unsurfaced roads (Eaton, 1987; Eaton 1987a; Department of the Army, 1995) (note that this is an old DOS-compatible program). Distress data can be used to determine the appropriate maintenance repair for a specific segment of road using a condition matrix that relates specific distresses and severities to an appropriate repair. Table 30 below illustrates the basic decision support system that can be used with the UCRI method.

Deliverable 2-A: State of the Practice of Unpaved Road Condition Assessment
38
Table 30. Maintenance alternatives and corresponding distress categories, severity codes determined from UCRI, and cost codes adapted from the Unsurfaced Road Maintenance Management method (Eaton, 1987; Eaton 1987a; Department of the Army, 1995). Distress Number
Distress Severity code Cost code* Description
81 Improper cross section L B Grade only.
M B/C Grade only/grade and add material (water or both), and compact. Bank curve. Adjust transitions.
H C Cut to base, add aggregate, shape, water, and compact.
82 Improper roadside drainage L B Clear ditches every 1-2 years.
M A Clean out culverts. B Reshape, construct, compact or flare out ditch. H C Install underdrain, larger culvert, ditch dam, rip rap, or geotextiles.
83 Corrugations L B Grade only.
M B/C Grade only/grade and add material (water or aggregate or both), and compact.
H C Cut to base, add aggregate, shape, water, and compact. 84 Dust stabilization L C Add water.
M C Add stabilizer.
H C Increase stabilizer use. Cut to base, add stabilizer, water, and compact. Cut to base, add aggregate and stabilizer, shape, water, and compact.
85 Potholes L B Grade only.
M B/C Grade only/grade and add material (water, aggregate, or 50/50 mix of calcium chloride and crushed gravel), and compact.
H C Cut to base, add aggregate, shape, water, and compact. 86 Ruts L B Grade only.
M B/C Grade only/grade and add material, and compact. H C Cut to base, add aggregate, shape, water, and compact.
87 Loose aggregate L B Grade only. M B/C Grade only/grade and add material, and compact. H C Cut to base, add aggregate, shape, water, and compact.
*Cost code guide: A = labor, overhead; B = labor, equipment, overhead, C = labor, equipment, materials, overhead.
Note: Performance and stability will vary considerably with traffic volume and type, drainage, and subbase.
Equipment, Cost, Speed, Record Keeping Pavement test sections can be rated visually at 25 mph (40.2 km/h). Direct measurements should be taken using a hand odometer or measuring wheel to acquire lengths of distresses and areas to be calculated, as necessary. Straight edges and rulers are necessary to measure pothole depths, ruts, and loose aggregate. The URCI guide and Unsurfaced Road Inspection Sheet or form DA 7348-R is needed (Department of the Army, 1995). Estimates suggest that data can be collected for the average 100 foot (30.5 m) test section by conducting a windshield survey at 25 mi/hr (40 km/hr with a one person data collection team. The vehicle speed may be adjusted depending on the condition of the road (Eaton, 1987; Eaton 1987a; Department of the Army, 1995). The counterpart to the UCRI rating system used for paved roads is called the Pavement Condition Index (PCI) that was developed by the Army Corps of Engineers. Automated systems have been developed that use sensor mounted vans to collect PCI data on asphalt and concrete pavements. Automated data collection has been proven to collect PCI data on paved surfaces at the same cost or less than manual data collection, as well as increasing safety (Cline, 2003). Three technologies have advanced data collection
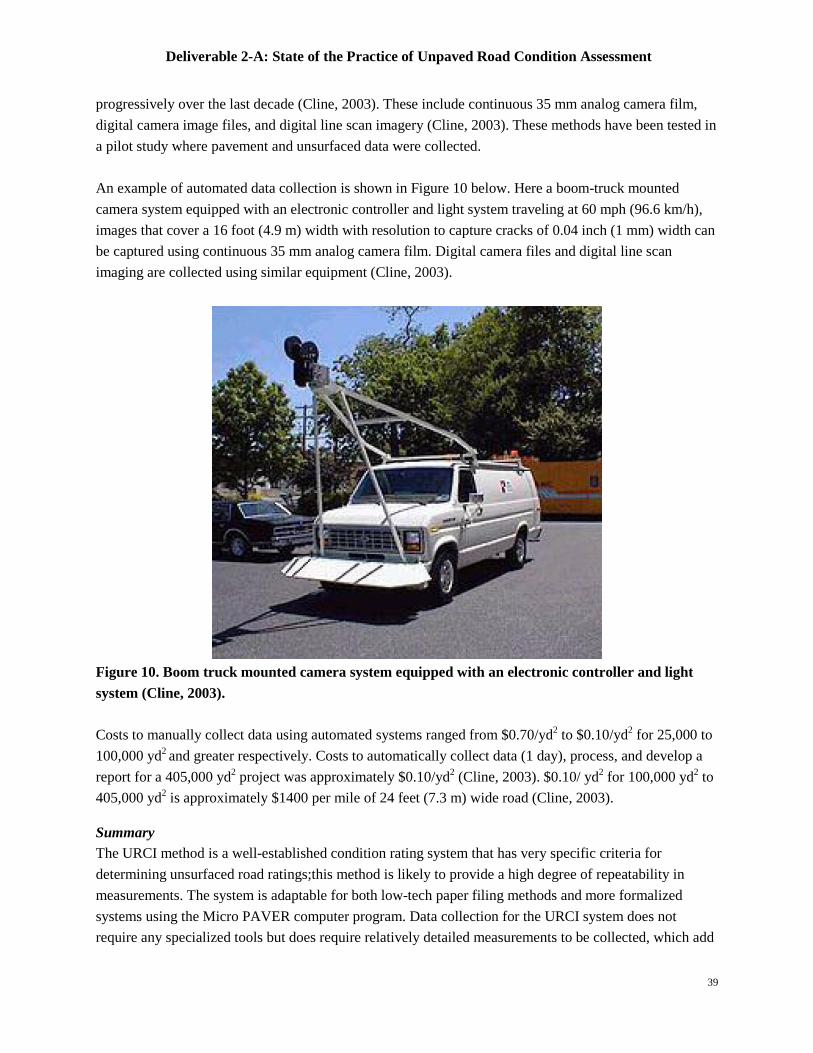
Deliverable 2-A: State of the Practice of Unpaved Road Condition Assessment
39
progressively over the last decade (Cline, 2003). These include continuous 35 mm analog camera film, digital camera image files, and digital line scan imagery (Cline, 2003). These methods have been tested in a pilot study where pavement and unsurfaced data were collected. An example of automated data collection is shown in Figure 10 below. Here a boom-truck mounted camera system equipped with an electronic controller and light system traveling at 60 mph (96.6 km/h), images that cover a 16 foot (4.9 m) width with resolution to capture cracks of 0.04 inch (1 mm) width can be captured using continuous 35 mm analog camera film. Digital camera files and digital line scan imaging are collected using similar equipment (Cline, 2003).
Figure 10. Boom truck mounted camera system equipped with an electronic controller and light system (Cline, 2003). Costs to manually collect data using automated systems ranged from $0.70/yd2 to $0.10/yd2 for 25,000 to 100,000 yd2 and greater respectively. Costs to automatically collect data (1 day), process, and develop a report for a 405,000 yd2 project was approximately $0.10/yd2 (Cline, 2003). $0.10/ yd2 for 100,000 yd2 to 405,000 yd2 is approximately $1400 per mile of 24 feet (7.3 m) wide road (Cline, 2003).
Summary The URCI method is a well-established condition rating system that has very specific criteria for determining unsurfaced road ratings;this method is likely to provide a high degree of repeatability in measurements. The system is adaptable for both low-tech paper filing methods and more formalized systems using the Micro PAVER computer program. Data collection for the URCI system does not require any specialized tools but does require relatively detailed measurements to be collected, which add

Deliverable 2-A: State of the Practice of Unpaved Road Condition Assessment
40
to the data collection time. The system relies on a sample unit to represent the condition of approximately one half mile of road. The use of sample units greatly reduces the data collection requirements when compared to data collection for the entire road segment. However, it also adds a degree of risk in the sampling selection, since poor sample selection can result in data that are not representative of the overall road segment.
Indirect Data Acquisition Methods
INDIRECT DATA ACQUISITION: Road Roughness Using Accelerometer Technology by Opti-Grade®
Overview The Forest Engineering Research Institute of Canada (FERIC) developed the Opti-Grade® system to collect roughness data on unsealed roads for management of grading operations of forest industry logging roads. The FERIC is a research institute that provides the forest industry with research on forest operations and safety. Eighteen FERIC members in five Canadian provinces took part in the Opti-Grade study in 2001. Since the study the Opti-Grade system has become commercially available. The Opti-Grade system includes the installation of an acceleration sensor, a GPS unit, and data logging system that is mounted on haul trucks. The system uses the acceleration sensor to detect the vehicle’s response to road roughness by detecting vibrations. This allows the system to continuously collect roughness data while the vehicle is in service traveling its normal haul route. Data recovered from the system are used for maintenance analysis through a proprietary software system that interprets the roughness and position data and produced schedules to direct motor graders to roads that require maintenance based on a pre-selected roughness threshold (Brown, 2003).
Data Collection Rate and Equipment The Opti-Grade technology consisted of an acceleration sensor for acquiring roughness, a GPS unit, and a data logging device. The equipment is installed on vehicles that routinely travel the road network to be monitored. The number of vehicles equipped with the data collection technology depends on the size of the network to be monitored and the desired data collection interval. Because the system collects data using in-service vehicles, the data collection speed can effectively be very high and is limited only by the operation speed of the collection vehicle. Operation costs were not available for the Opti-grade system; however, the purchase price of the system was quoted at $20,000 Canadian dollars in 2003 (Brown, 2003). The Opti-Grade system records peak acceleration (roughness) data for the highest one second interval in a five second group. This provides a peak roughness value for every 165 feet (50 m) to 575 feet (175 m) of road depending on vehicle speed The Opti-Grade system also collects position, travel direction, speed and time data for each roughness measurement that allows the road network to be analyzed for areas in need of maintenance (Brown, 2003).

Deliverable 2-A: State of the Practice of Unpaved Road Condition Assessment
41
Data from the Opti-Grade vehicle units are recovered and stored on a personal computer. The Opti-Grade system includes proprietary software to plot the location of roughness data on a base map and to evaluate the data sets to determine areas where road roughness exceeds a user specified parameter. The software develops candidate projects for grading operations by determining the location and length of road segments that require a maintenance intervention. The software also includes tools to compare driver speed with roughness to determine threshold conditions where road roughness is impacting driver speed (Brown, 2003).
Similar Systems The Longitudinal Profiling System from International Cybernetics Corporation is used to collect roughness data for the Saskatchewan Highways and Transportation agency on paved an unpaved roads in during annual data collection events. This system consists of infrared laser sensors, accelerometers, and a distance measuring instrument mounted to the front of a data collection van. The system collects modified International Roughness Index (IRI) data as described by the National Cooperative Highway Research Programs (NCHRP) Report 228 for two simultaneous wheel tracks (Smith, 1997, Lazic, 2003).
Summary The Opti-Grade system collects large volumes of road roughness and vehicle speed data using in service vehicles. The system has proved useful in realizing savings for unpaved maintenance by precise direction of road grading activities (Brown, 2003). The system appears to work well on a small road network that is routinely travelled by instrumented vehicles, such as the case of logging haul roads; however, it is not apparent how this system would be utilized in larger road networks where the frequency of travel by instrumented vehicles may be less frequent, such as a typical county road system. INDIRECT DATA ACQUISITION: Ground Penetrating Radar
Overview The City of Saskatoon uses the current pavement management system of Saskatchewan Highways and Transportation where data is collected with the INO Laser Rut Measurement System and the Longitudinal Profiling System on their urban system, but studies have shown use of GPR is necessary to acquire additional structural data to make decisions on a project or semi-network basis (Prang, 2007). One case study included a road surface of ‘in situ composite granular surface with spot overlays’ (Berthelot, 2008). GPR use has been tested on the project and network levels for the Finnish National Road Association (Saarenketo, 2000).
Equipment, Record Keeping Materials possess dielectric permittivity properties that GPR is able to measure. The GPR apparatus used in the Saskatoon study was a 1GHz pulsed transmitter with air-coupled antennae mounted on a truck. It collected the dielectric permittivity at different points along the road surface (Prang, 2007). The data acquired were translated by comparing it to reference information to provide layer differences such as moisture content and amount of fines in conjunction with thicknesses (Saarenketo, 2000; Prang, 2007;

Deliverable 2-A: State of the Practice of Unpaved Road Condition Assessment
42
Prang, 2007). Some example dielectric values and their corresponding descriptions of the quality of a wearing course surface are listed in Table 31 (Saarenketo, 2000). Table 31. Gravel road wearing course classification and corresponding dielectric constant values (Saarenketo, 2000).
Dielectric Value General condition/proposed treatment
< 8 Dusty material, wearing course erosion. Fines or dust treatment needed.
8 - 12 The wearing course is in the optimum moisture content window with low moisture. Additional gravel and fines for preservation could be added.
12 - 16 The wearing course is in the optimum moisture content window with highest moisture and highest amount of fines. Road drainage should be evaluated. New material could be added with the proper amount of fines.
> 16 Material contains too many fines, water adsorption is apparent. Problems may occur during thaw, surface may be slick during rain. Road drainage should be evaluated.
Other techniques used in conjunction with GPR can provide a more complete analysis of the structural health of the road. When a falling weight deflectometer (FWD) is used in conjunction with GPR data, peak deflection and structural index can be computed for road segments (Prang, 2007). Comparing GPR with maps created using GPS data in the Saskatoon study confirmed moisture and drainage conditions of the road (Saarenketo, 2000). GPR systems must be connected to acquisition software and configured correctly. Additionally if GPS is used in conjunction with the GPR, synchronization is necessary. Signal characteristics and calibration for error reduction make a considerable difference in quality data acquisition and translation (Pereira, 2006).
Cost GPR and FWD surveys provide data with additional structural benefits for approximately the same cost per unit as visual and automated (semi-automated) surface condition rating (Pang, 2007).
Data & Applications: Summary Benefits: The City of Saskatoon uses GPR and FWD to accurately measure structural damage allowing more accurate structural deterioration to be predicted by network models. Pavement and structural preservation can be performed at accurate times increasing service life for the system. Network preservation costs are reduced (Berthelot, 2008). Limitations: The most significant variability in a gravel road is in the wearing course surface thickness in the transverse direction. Data must be collected on a road section long enough to statistically overcome the variability that is inherent in the road (Saarenketo, 2000).

Deliverable 2-A: State of the Practice of Unpaved Road Condition Assessment
43
INDIRECT DATA ACQUISITION: Remote Sensing – Unmanned Aerial Vehicle (UAV)
Overview South Dakota State University conducted a study in conjunction with the US Department of Transportation to develop a remote sensing system using an unmanned aerial vehicle that would support cost effective acquisition of unpaved road surface distress data for transportation agencies (Zhang, 2011). The UAV system had the ability to gather high resolution imagery and measure unpaved road surface distresses using feature point extraction techniques and threshold algorithms that corresponded to known actual distresses (Zhang, 2011).
Equipment, Record Keeping, Data, & Application The system used for acquiring data included an unmanned helicopter, GPS, an inertial measurement unit (IMU),and a digital camera. The images were processed to reconstruct a 3D road surface model which was used to derive distresses and report them to a road management system (Zhang, 2011). The study showed promise, but did not serve as a complete evaluation of the capabilities of a UAV to assess unpaved road condition.
Costs Although this was a low-cost system, theactual cost and time for were not documented (Zhang, 2011).
Summary While not commercially available, the system demonstrated the potential to collect quantitative assessment measures in an automated fashion. This method may be faster, less expensive, and generally more reliable (and repeatable) than other methods. The technology is mature, but undeveloped. Benefits: Accurate and detailed unpaved road surface distress information was provided. This system could be used to acquire other road information such as geometrics. Limitations: Image processing to extract the 3D models can be time consuming depending on the size of the road network. Once the 3D data are available, extracting distress depends on adequate lighting and contrast. Some features were hard to observe from the air, such as ditches covered with grass. It was suggested that an additional sensors be used to penetrate grass (Zhang, 2011). INDIRECT DATA ACQUISITION: Survey – Ultralight Aircraft
Overview An ultralight aircraft method for surveying was developed and pilot studies conducted by the Council of Scientific and Industrial Research (CSIR) Transportek for road agencies in Africa (Jones, 2006). Surveying using ultralight aircraft was developed to ease access to remote locations for corridor studies. Previously, conditions such as harsh terrain combined with available time availability have hindered studies for new route corridors in southern Africa. Two pilot studies were conducted using ultralight aircraft. One included collecting data for a 1700 mile (2,750 km) corridor route for the Trans Kalaharia

Deliverable 2-A: State of the Practice of Unpaved Road Condition Assessment
44
Highway in Botswana with the ultimate route planned to go through Mozambique, South Africa, and Nambia. The other included collecting data for a 90+ mile (145 km) M1 Highway corridor through Mozambique (Jones, 2006). These corridor studies not only surveyed the possible routes, but also material that could be possibly available for construction use (Jones, 2006).
Method, Equipment, Record Keeping To collect data, the investigator must first become familiar with the topography, roadway plan, vegetation, location of the route, etc. Then,an ultralight aircraft flown at an altitude of from 650 feet to 1640 feet (200 m - 500 m) , is used to observe important features. These are verified (and locations recorded) with GPS coordinates. Locations are described and rated by the investigator using a tape recorder so they can be prioritized for the best possible route location. Photos are taken as necessary. An ultralight aircraft is shown in Figure 11 below (Jones, 2006).
Figure 11. Ultralight aircraft for collection of survey data (Jones, 2006).
Time & Costs In one pilot study, a 37 mile (60 km) road section was surveyed during a three hour flight with an additional two day field inspection necessary to verify information. No costs were incurred in takeoff and landing in this case because existing infrastructure was used for takeoff and landing. To compare costs and time, a ground survey was conducted in the same location with duration of two months. An example cost comparison of a ground survey versus the ultralight survey is shown in Table 32 below.

Deliverable 2-A: State of the Practice of Unpaved Road Condition Assessment
45
Table 32. Cost comparison: ground survey versus ultralight data collection (adapted from Jones, 2006). Ground Survey Ultralight Survey Ground
Survey ($) Ultralight Survey ($) Units $/day Units $/day
Geologist 60 560 3 560 33,600 1,680 Assistants 120 280 6 280 33,600 1,680 Vehicle 60 50 3 50 3,000 150 Backhoe loader 30 100 2 100 3,000 200 Subsistence 180 80 12 80 14,400 960 Ultralight 0 200 3 200 0 600 Ultralight pilot 0 500 3 500 0 1,500 Total 87,600 6,770 A suitable location with material was not located during the ground survey. Eleven sites with material available for construction were located during the aerial survey (Jones, 2006).
Time & Costs Ultralight survey methods significantly reduce data collection time and scouting time. Additionally, these methods significantly reduce costs according to the 2006 Jones study.
Summary This report on the state of the practice of unpaved road assessment has reviewed and described several currently available methods and more research-based methods used in the U.S. as well as other countries. Included were visual, combined visual and direct measurement methods, and indirect data acquisition methods. Visual methods described in this report are the unimproved PASER and gravel PASER methods, the Road Surface Management System, the Standard Visual Assessment Manual for Unsealed Roads, and the Central Federal Lands Highway Division subjective rating system. Combined visual and direct measurement systems described here are the Central Federal Lands Highway Division objective rating system and the Department of the Army's Unsurfaced Road Condition Index. Indirect data acquisition methods described here are an accelerometer-based method (road roughness using Opti-Grade accelerometer technology), ground penetrating radar, the Zhang unmanned aerial vehicle study, and an ultralight aircraft survey example.
The purpose of this report was to describe the current state of the practice rather than to recommend a particular assessment method. However, while writing the Requirements Definition report (Deliverable 1-A), the project team found the Department of the Army's URCI method to be a good candidate method to focus on for this project because it offers: a clear set of measurement requirements, the realistic possibility of collecting most of the condition indicator parameters, and the potential applicability to a wide variety of U.S. unpaved roads. The project team looks forward to feedback on this method and the others described in this state of the practice report.

Deliverable 2-A: State of the Practice of Unpaved Road Condition Assessment
46
References Berthelot, C.; Podborochynski, D.; Stuber, E.; Prang, C.; Marjerison, B. (2008). Saskatchewan Case
Studies of Network and Project Level Applications of a Structural Asset Management System. 7th International Conference on Managing Pavement Assets. TRB Committee AFD10 on Pavement Management Systems, Transportation Research Board, Washington, D.C. Retrieved October 18, 2011 from http://pavementmanagement.org/ICMPfiles/2008067.pdf
Burger, A.; Henderson, M.; Rooyen, G. (1989). Development of Scheduling Algorithms for Routine Maintenance of Unsealed Roads in Western Cape Province, South Africa. Vol. 1, p. 240-249. Transportation Research Board, Washington, D.C.
Brown, M.; Mercier, S.; Provencher, Y. (2003). Road Maintenance with Opti-Grade: Maintaining Road Networks to Achieve the Best Value. Transportation Research Record 1819, Volume 1, pp. 282 – 286, Transportation Research Board, Washington, DC.
Cambridge Systematics, Inc. (2007). Asset Management Guide for Local Agencies in Michigan. Michigan Transportation Asset Management Council and Michigan’s Local Technical Assistance Program.
Cline, G.; Shahin, M.Y.; Burkhalter, J.A. (2003). Automated Data Collection for Pavement Condition Index Survey. United States Army Core of Engineer and United States Navy.
Coyle (2010). Fundamentals and Methods of Terrain Classification Using Proprioceptive Sensors. Dissertation, Florida State University College of Engineering, Tallahassee, FL. Retrieved October 14, 2011 from http://etd.lib.fsu.edu/theses/available/etd-09202010-131618/unrestricted/Coyle_E_Dissertation_2010.pdf
Department of the Army (1995). Technical Manual No. 5-626: Unsurfaced Road Maintenance Management. Washington, D.C. Retriever May 5, 2011 from http://armypubs.army.mil/eng/DR_pubs/DR_a/pdf/tm5_626.pdf
Eaton, R.; Gerard, S.; Dattilo, R. (1987). A Method for Rating Unsurfaced Roads. Transportation Research Board, Washington, D.C. Retrieved from http://pubsindex.trb.org/view.aspx?id=288161 http://trid.trb.org/view.aspx?id=285510
Eaton, R.; Gerard, S.; Dattilo, R. (1987a). A Rating System for Unsurfaced Roads to be Used in Maintenance Management. 2nd North American Pavement Management Conference, TRB Committee AFD10 on Pavement Management Systems, Transportation Research Board, Washington, D.C. Retrieved from http://pavementmanagement.org/ICMPfiles/1987058.pdf
Goodspeed, C.; Schmeckpeper, E. (1994). Road Surface Management System. University of New Hampshire and Federal Highway Administration. 3rd International Conference on Managing Pavements, Transportation Research Board, Washington, D.C. Additionally, fiddle sheets and software are located here: http://www.t2.unh.edu/road-surface-management-system-rsms
Goodspeed, C. (2011). Phone Interview. Director of the Transportation Technology Transfer Center and Associate Professor of Civil Engineering, University of New Hampshire. November 7, 2011.
Huhns, M.; Mendoza, B.; Ruvinsky, A.; McCants, D. (2006). Technical Report CSE TR-2006-13: The Jidoka System for Multiple-Sensor Terrain Classification. Center for Information Technology

Deliverable 2-A: State of the Practice of Unpaved Road Condition Assessment
47
University of South Carolina. Retrieved October 14, 2011 http://www.cse.sc.edu/~huhns/techreports/JidokaFinalReport.pdf
Huntington, G.; Ksaibati, K. (2010). Gravel Roads Management. Report prepared for the Wyoming Department of Transportation and the Mountain-Plains Consortium, Wyoming Technology Transfer Center (T2/LTAP). Retrieved October 21, 2011 from http://www.ndltap.org/events/conference/downloads/2010GRMfinal.pdf
Huntington, G.; Ksaibati, K. (2010a). Unsealed Gravel Roads Management: State-of-the-Practice in American Counties. Transportation Research Board,Washington, D.C.
Johansson, S.; Kosonen, S.; Mathisen, E.; McCulloch, F.; Saarenketo, T. (2005). Road Management Policies for Low Volume Roads – Some Proposals. ROADEX II, Northern Periphery; European Regional Development Fund, European Union. Retrieved October 13, 2011 from http://www.roadex.org/uploads/publications/docs-RII-EN/3_1%20Road%20Management%20Policies_l.pdf
Johansson, S.; Johansson, K. (2007). Road Condition Management Policies for Low Volume Roads – Tests and Development of Proposals. ROADEX II, Northern Periphery; European Regional Development Fund, European Union. Retrieved October 14, 2011 from http://www.roadex.org/uploads/publications/docs-RIII-EN/Road%20condition%20management%20policies%20for%20public%20roads.pdf
Jones, D.; Paige-Green, P. (2000). Draft TMH12: Pavement Management Systems: Standard Visual Assessment Manual for Unsealed Roads Version 1. Contract Report CR-2000/66. Committee of Land Transport Officials and CSIR Transportek. Pretoria, South Africa. Retrieved on October 13, 2011 from http://asphalt.csir.co.za/tmh/tmh12.pdf
Jones, D.; Paige-Green, P.; Sadzik E. (2003). Development of Guidelines for Unsealed Road Assessment. Transportation Research Record 1819. Paper No. LVR8-1179. Transportek, Council for Scientific and Industrial Research; Gauteng Department of Transport and Public Works.
Jones, D. (2006). The Use of Ultralight Aircraft for Material Location and Road Surveys in Remote Rural Areas. Proceedings from the 22nd Australian Road Research Board. Retrieved November 15, 2011 from http://researchspace.csir.co.za/dspace/bitstream/10204/1244/1/Jones_2006.pdf
Lazic, Z. (2003). From Road Condition Data Collection to Effective Maintenance Decision Making. 2003 Annual Conference of the Transportation Association of Canada, St. John’s, Newfoundland and Labrador, Canada. Retrieved from http://www.tac-atc.ca/english/resourcecentre/readingroom/conference/conf2003/pdfs/lazic1.pdf
Michigan Transportation Asset Management Council (TAMC) (2009). Policy for Collection of Roadway Condition Data on Federal-Aid Eligible Roads & Streets. Michigan Transportation Asset Management Council. Retrieved on May 13, 2011 from http://tamc.mcgi.state.mi.us/MITRP/Council/Policies.aspx
Palli, A.; Aho, S.; Pesnon, E. (2010). Ground Penetrating Radar as a Quality Assurance Method for Paved and Gravel Roads in Finland. IEEE. Retrieved on October 14, 2011 from http://ieeexplore.ieee.org/stamp/stamp.jsp?arnumber=01487863
PAVER (n.d.). Photo: Field Inspector & Field Manual. Retrieved November 18, 2011 from http://www.paver.colostate.edu/upcoming.php http://www.cecer.army.mil/paver/Documents/AboutPaver65.pdf

Deliverable 2-A: State of the Practice of Unpaved Road Condition Assessment
48
Pereira, M.; Rial, F.; Lorenzo, H.; Arais, P.; Novo, A. (2006). Setting Up a GPR System for Road Evaluation. 11th International Conference on Ground Penetrating Radar, Columbus Ohio, USA. Retrieved October 18, 2011 from http://webs.uvigo.es/grupotf1/research/GPR06_105.pdf
Prang, C.; Berthelot, C.; Stuber, E. Fair, J. (2007). Development of a Structural Asset Management System for Urban Pavements. 2007 Annual Conference of the Transportation Association of Canada Saskatoon, Saskatchewan. Retrieved October 18, 2011 from http://www.tac-atc.ca/english/resourcecentre/readingroom/conference/conf2007/docs/s15/prang.pdf
RoadSoft (n.d). About RoadSoft. Center for Technology & Training, Michigan Tech. Retrieved October 19, 2011 from http://www.roadsoft.org/about
Saarenketo, T.; Vesa, H. (2000). The Use of GPR Technique in Surveying Gravel Road Wearing Course. Eighth International Conference on Ground Penetrating Radar. SPIE, Vol. 4084.
Saarenketo, T. (2005). Monitoring, Communication and Information Systems & Tools for Focusing Actions. ROADEX II, Northern Periphery; European Regional Development Fund, European Union. Retrieved October 13, 2011 from http://www.roadex.org/uploads/publications/docs-RII-EN/3_2%20Monitoring%20and%20Focusing%20Tools_l.pdf
Saarenketo, T. (2006). Electrical Properties of Road Materials and Subgrade Soils and the Use of Ground Penetrating Radar in Traffic and Infrastructure Surveys. Academic Dissertation, University of Oulu, Finland. Retrieved October 18, 2011 from http://herkules.oulu.fi/isbn9514282221/isbn9514282221.pdf
Sayers, M.; Gillespie, T.; Paterson, W. (1986). World Bank Technical Paper Number 46: Guidelines for Conducting and Calibrating Road Roughness Measurements. The World BankWashington, D.C., U.S.A. Retrieved October 17, 2011 from http://deepblue.lib.umich.edu/bitstream/2027.42/3133/2/72764.pdf
Seppä, J.; Heikkilä, R. (2009). Automation of Road Maintenance – Development of a Roughness Measurement System for the Quality Control of Gravel Roads. 26th International Symposium on Automation and Robotics in Construction (ISARC 2009). Retrieved October 13, 2011 from http://www.iaarc.org/publications/fulltext/Automation_of_ROAD_Maintenance_C_Development_of_a_Roughness_Measurement_System_for_the_Quality_Control_of_Gravel_Roads.pdf
Skorseth, K.; Selim, A. (2000). Gravel Roads Maintenance and Design Manual. South Dakota Local Transportation Assistance Program (SD LTAP), Federal Highway Administration, Washington, D.C. Retrieved on September 2, 2011 from http://water.epa.gov/polwaste/nps/gravelroads_index.cfm
Smith, K.L.; Smith, K.D.; Evans, L.D.; Hoerner, T.E.; Darter, M.I.; Woodstrom, J.H. (1997). Project 1-31, Report 228: Smoothness Specifications for Pavements. National Cooperative Highway Research Program, Transportation Research Board, National Research Council. Web only document: http://www.nap.edu/openbook.php?record_id=6337&page=R1
South African National Society, Ltd. (SANRAL) (n.d ). History. Retrieved on November 9, 2011 from http://www.nra.co.za/live/content.php?Category_ID=21
Surdahl, R.; Woll, J.H.; Marquez, R. (2005). Road Stabilizer Product Performance: Buenos Aires National Wildlife Refuge. Publication No. FHWA-CFL/TD-05-011. U.S. Central Federal Lands Highway Division, Lakewood, CA. Department of Transportation, Federal Highway Administration.

Deliverable 2-A: State of the Practice of Unpaved Road Condition Assessment
49
http://www.cflhd.gov/programs/techDevelopment/materials/buenosaires/documents/01_road_stabilizers_buenos_aires_entire_document.pdf
University of New Hampshire (UNH) (n.d.). Field Manual: Identification of Road Surface Conditions. University of New Hampshire and Federal Highway Administration. Retrieved November 7, 2011 from http://union.govoffice2.com/vertical/Sites/%7B45C83186-1E71-4F7C-A6A6-4C9EBBC99C05%7D/uploads/%7BB03A7142-BDC2-4158-B1F3-8E604F2AFA1B%7D.PDF
University of New Hampshire Technology Transfer Center (2011). Inventory and Assessment of Road Surfaces: Town of Greenfield, NH. Report by University of New Hampshire Technology Transfer Center, Durham, NH. Retrieved November 8, 2011 from http://www.t2.unh.edu/sites/t2.unh.edu/files/documents/RSMS/110914_Greenfield_Inventory_and_Assessment_of_Roads.pdf
van der Gryp, A.; van Zyl, G. (2007). Variability and Control of Gravel Road Visual Assessments. Transportation Research Board, Washington, D.C.
Walker, D.; Entine, L.; Kummer, S. (2002). Pavement Surface Evaluation and Rating (PASER) Asphalt Roads Manual. Wisconsin Transportation Information Center, Local Technical Assistance Program. University of Wisconsin-Madison. University of Wisconsin-Madison. Federal Highway Associations support. Retrieved on October 11, 2011 from http://epdfiles.engr.wisc.edu/pdf_web_files/tic/manuals/Asphalt-PASER_02.pdf
Walker, D.; Entine, L.; Kummer, S. (2002a). Pavement Surface Evaluation and Rating (PASER) Concrete Roads Manual. Wisconsin Transportation Information Center, Local Technical Assistance Program. University of Wisconsin-Madison. University of Wisconsin-Madison. Federal Highway Associations support. Retrieved on October 11, 2011 from http://epdfiles.engr.wisc.edu/pdf_web_files/tic/manuals/Concrete-PASER_02.pdf
Walker, D.; Entine, L.; Kummer, S. (2002b). Pavement Surface Evaluation and Rating (PASER) Gravel Roads Manual. Wisconsin Transportation Information Center, Local Technical Assistance Program. University of Wisconsin-Madison. University of Wisconsin-Madison. Federal Highway Associations support. Retrieved on October 11, 2011 from http://www.dot.state.il.us/blr/p022.pdf
Walker, D.; Entine, L.; Kummer, S. (2001). Pavement Surface Evaluation and Rating (PASER) Unimproved Roads Manual. Wisconsin Transportation Information Center, Local Technical Assistance Program. University of Wisconsin-Madison. Federal Highway Associations support. Retrieved on October 2011 from http://epdfiles.engr.wisc.edu/pdf_web_files/tic/manuals/Unimproved-PASER_01.pdf
Weaver, B.; Huntington, G.; Ksaibati, K. (2006). Performance and Evaluation of Gravel Roads. Transportation Research Board,Washington, D.C.
Western Cape Provincial Administration (WCPA) (2007). Version 1.11: Draft Manual for the Visual Assessment of Gravel Roads. Road Infrastructure Branch, Western Cape Provincial Administration. Retrieved November 11, 2011 from http://rnis.pgwc.gov.za/rnis/rnis_web_reports.main
Woll, J.H.; Surdahl, R.; Marquez, R.; Everett, R.; Andresen, R. (2008). Road Stabilizer Product Performance: Seedskadee National Wildlife Refuge. Publication No. Seedskadee National Wildlife Refuge. U.S. Central Federal Lands Highway Division, Lakewood, CA. Department of Transportation, Federal Highway Administration. Retrieved November 23, 2011 from

Deliverable 2-A: State of the Practice of Unpaved Road Condition Assessment
50
http://www.cflhd.gov/programs/techDevelopment/materials/seedskadee/documents/01_road_stabilizer_product_performance_seedskadee_nwr.pdf
Wyoming Technology Transfer Center (WTTC) (2010). Ride Quality Rating Guide. Retrieved from http://www.ndltap.org/events/conference/downloads/2010rideQuality.pdf
Young, R. (2003). Gravel – Revised Rating Guide. Alcona County Highway Department. Zhang, C. (2011). Monitoring the Condition of Unpaved Roads with Remote Sensing and Other
Technology. Final Report for US DOT DTPH56-06-BAA-0002. Geographic Information Science Center of Excellence, South Dakota State University; Transportation Research Board, Washington, D.C. Retrieved September 27, 2011 from http://ncrst.org/ArchivePages/SD-SDSU/FinalReport.pdf, http://trid.trb.org/view.aspx?id=1100717