Michigan Natural Resources: An Exploration through ...
41
Michigan Natural Resources: A survey of Production Statistics Presented by Dr. Peter Voice with contributions from Dr. Bill Harrison and Mr. John Yellich
Transcript of Michigan Natural Resources: An Exploration through ...

Michigan Natural Resources: A survey of Production Statistics
Presented by Dr. Peter Voice with contributions from Dr. Bill Harrison and Mr. John Yellich

Where did this data come from?
• Sifted through:• U.S. Bureau of Mines Annual Reports (pre-1900 data)• Michigan Geological Survey Annual Statistical Summaries (and
predecessor series) – 1900-1940 and 1950-1980 data• Note most pre-1938 data was compiled into a volume by O. Poindexter in 1940
– this was used as the main source for these years (save for Gold data – which relied on US Bureau of Mines reports)
• U.S. Geological Survey Mineral Yearbooks – 1940-1950 and post-1980 data
• All coal data pre-1950 was from Cohee et al. 1950 (USGS Circular 77)
• Because of the vintage of many of the sources – had to be very careful with units
• Salt – sold by the barrel (~250 lbs), then in short tons, then in metric tons!
• Note – we do have some confidential mineral statistics data – to protect the data, we are not releasing the annual data, but we have added it into the total production of the commodity.

Types of Resources
• Mineral Resources• Metallic Minerals
• Nonmetallic Minerals
• Aggregate Resources
• Energy Resources
• Groundwater

Metallic Minerals
• Western Upper Peninsula resources • Gold (+ Silver) – associated with peridotite (olivine-rich
rock) – very minor resource
• Copper (± Silver; Nickel, Zinc, Platinum Group Elements)• Keweenaw area and west
• New Eagle Mine (Cu-Ni, PGE)
• Back Forty Project (at permitting stage – also has some Zn)
• Iron Ore (± Manganese)• Three major trends – Marquette Range (just one mine left –
the Tilden Mine); Crystal Falls-Menominee Range; Gogebic Range

Banded Iron FormationJasper Knob, Ishpeming, MI

Modified from Ojakangas, 1994

0
10,000,000
20,000,000
30,000,000
40,000,000
50,000,000
60,000,000
1840 1860 1880 1900 1920 1940 1960 1980 2000 2020
An
nu
al P
rod
uct
ion
(M
etri
c To
ns)
Iron Ore Production in Michigan
Crude Ore
Processed Ore
Structural Steel –first skyscrapers!
Automobiles
Direct Shipping Ores (~70% Fe2O3)
Beneficiation of lower grade ores
http://www.lselectric.com/

Mostly Cu-sulfides
Mostly Native Cu ± Cu-oxides, ±Cu-carbonates
Modified from Mitchell and Sheldon, 2016
0
20,000
40,000
60,000
80,000
100,000
120,000
140,000
1840 1860 1880 1900 1920 1940 1960 1980 2000 2020
An
nu
al P
rod
uct
ion
(M
etri
c To
ns)
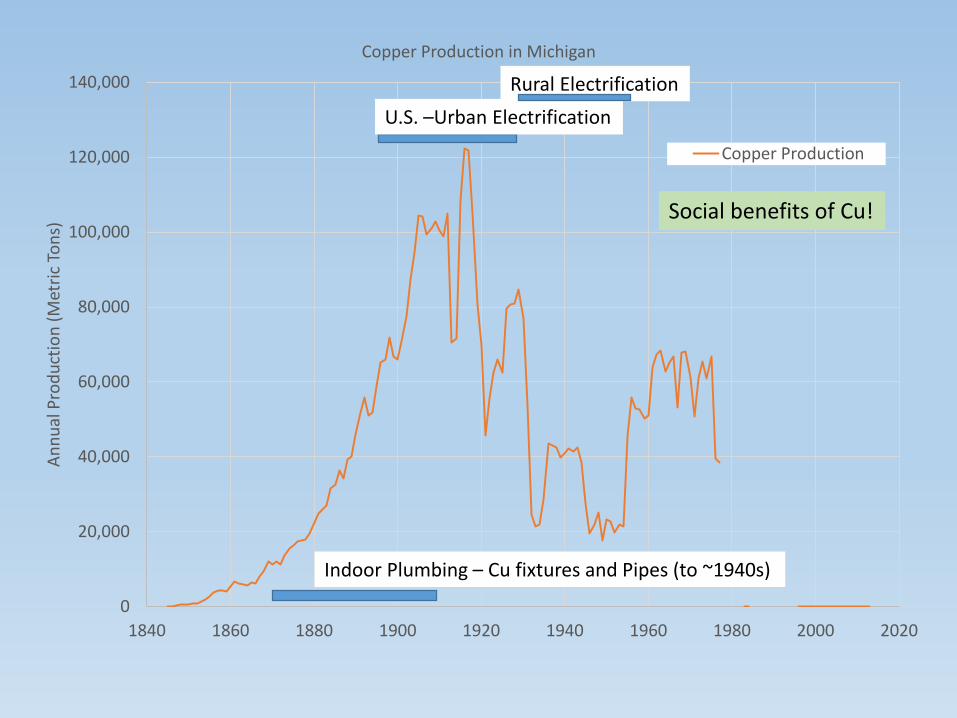
Copper Production in Michigan
Copper Production
Indoor Plumbing – Cu fixtures and Pipes (to ~1940s)
U.S. –Urban Electrification
Rural Electrification
Social benefits of Cu!

0
20,000
40,000
60,000
80,000
100,000
120,000
140,000
0
5
10
15
20
25
30
35
1840 1860 1880 1900 1920 1940 1960 1980 2000 2020
An
nu
al C
op
pe
r P
rod
uct
ion
(m
etri
c To
ns)
An
nu
al S
ilve
r P
rod
uct
ion
(M
etri
c To
n)
Comparison of Silver and Copper Production
Silver Production Copper Production
1980-1997 – Cu+Ag production at White Pine – data Withheld

0
500
1000
1500
2000
2500
3000
3500
4000
4500
5000
1840 1860 1880 1900 1920 1940 1960 1980 2000 2020
Go
ld p
rod
uct
ion
(tr
oy
oz.
)Annual Gold Production (troy oz.) - Composite data
Ropes Gold Mine production (primarily)
Reprocessed Ropes Gold Mine Tailings

Associated with the Ropes Gold Mine area are serpentinized dolomitic marbles, called Verde Antique. This was quarried for an attractive dimension stone off and on from the 1880’s to 1920’s.
http://dayoopers.com/

Estimated Total Production: Metallic Resources
Commodity Production Value (2013 $)
Processed Iron Ore 1,500,000,000 metric tons $157 billion
Copper 6,510,000 metric tons $44 billion
Silver 29,704,000 troy oz. (~923 metric tons)
$500 million
Ferruginous manganese ore
820,000 metric tons $3.8 million
Manganiferous iron ore 516,000 metric tons $2.4 million
Gold 33,600 troy oz. (~1.1 metric tons)
$47 million

Nonmetallic Mineral Resources
• Mostly LP production – though historic gypsum production in several rock units in the UP
• Rock Gypsum
• Rock Salt• Halite – NaCl salt• Sylvite – KCl salt (no active production today; historic
production ~160,000 tons per year)
• Brines (Mg, I, Br, Ca, Cl)– data generally withheld –as few operators extract these (different magnitudes of production as well – focus on Mg and CaCl2 compounds)


Sample of the C Shale (Salina Group) with secondary red halite cements filling a fracture

Samples of the F Salt (Salina Group) – the unit commercially mined in Detroit

0
1,000,000
2,000,000
3,000,000
4,000,000
5,000,000
6,000,000
1840 1860 1880 1900 1920 1940 1960 1980 2000 2020
An
nu
al S
alt
Pro
du
ctio
n (
Met
ric
Ton
s)Annual Michigan Salt Production
Salt extracted from saline aquifers - brines
Detroit Salt Mine begins operations
Temporary closure of salt mine

Satin Spar Gypsum – secondary precipitant in the Cabot Head Shale, UP

Anhydrite in the Lucas Formation, Detroit River Group

Anhdyrite in the Michigan Formation –the Michigan Formation was commercially mined in Grand Rapids and is stilled mine at Alabaster.

0
500,000
1,000,000
1,500,000
2,000,000
2,500,000
3,000,000
1860 1880 1900 1920 1940 1960 1980 2000 2020
An
nu
al G
ypsu
m P
rod
uct
ion
(M
etri
c To
ns)
Annual Michigan Gypsum Production
2000 drop-off in production – does not correspond to any recession. So what happened?

Estimated Total Production: Nonmetallic MineralsCommodity Production Value (2013 $)
Rock Salt 308,000,000 metric tons $14.5 billion
Rock Gypsum 110,000,000 metric tons $1 billion
Brine data – withheld

Aggregate Resources
• Mined statewide – though different qualities, and types of materials quarried at different parts of the state
• Sand and Gravel (fill, glass sands, injection mold sands, brick filler, etc.)
• Clay and Shale (bricks and tiles, ceramics)
• Cement
• Lime (flux, FGD Gypsum)
• Crushed Stone – mostly limestone and dolomite (fill)
• Dimension Stone (~10,000 tons per year)

0
10,000,000
20,000,000
30,000,000
40,000,000
50,000,000
60,000,000
70,000,000
80,000,000
1840 1860 1880 1900 1920 1940 1960 1980 2000 2020
An
nu
al P
rod
uct
ion
(M
etri
c To
ns)
Aggregate Production in Michigan
Sand and Gravel Stone Clay Portland Cement
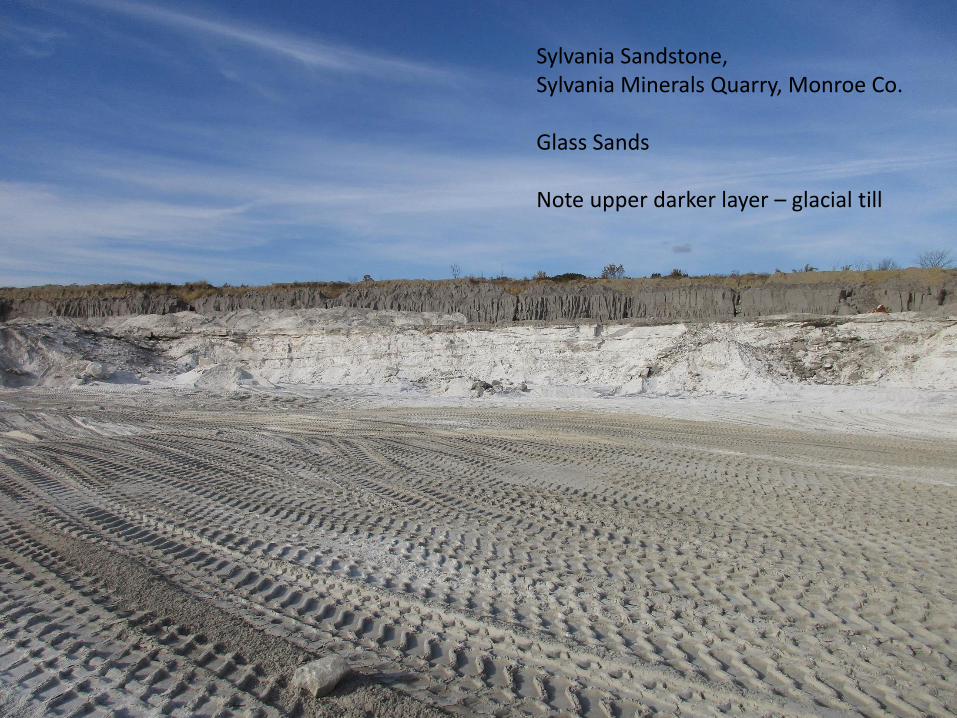
Sylvania Sandstone, Sylvania Minerals Quarry, Monroe Co.
Glass Sands
Note upper darker layer – glacial till
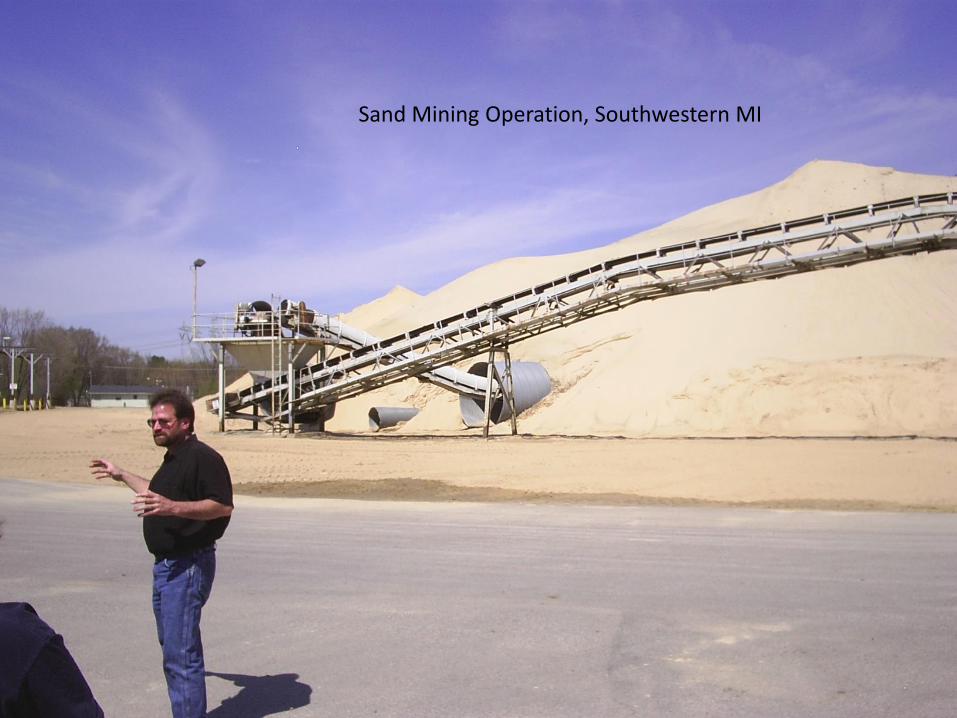
Sand Mining Operation, Southwestern MI

Traverse Group Limestones – Quarried at Charlevoix

Sawheidle Quarry, near Manistique, MI
Crushed Rock – Dolomite from the Burnt Bluff Group

Bayport Limestone,Bellevue, MI

Stromatoporoid sponge,Engadine DolomiteDrummond Island Quarry – crushed stone
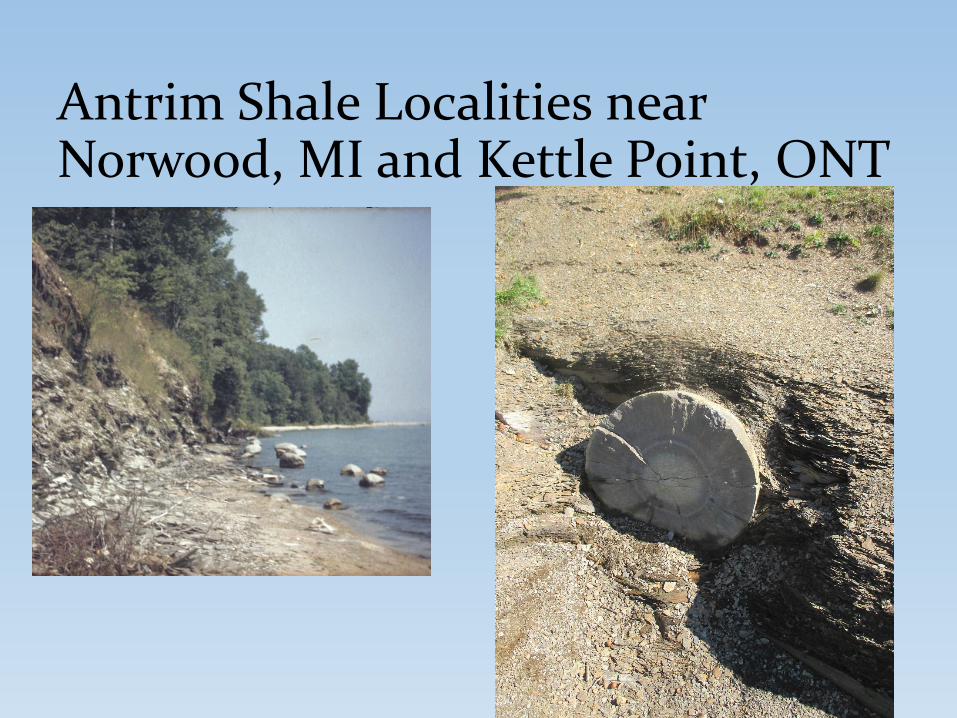
Antrim Shale Localities near Norwood, MI and Kettle Point, ONT

Ruins of Lincoln Brick Factory,Lincoln Brick ParkGrand Ledge, MI

Estimated Total Aggregate Production
Commodity Production Value (2013 $)
Masonry Cement 10,500,000 metric tons $1.5 billion
Portland Cement 307,000,000 metric tons $27.7 billion
Clay 91,000,000 metric tons $1 billion
Lime 45,295,000 metric tons $5 billion
Sand and Gravel 3,326,000,000 metric tons $25 billion
Stone (Crushed +Dimension)
2,200,000,000 metric tons $10.4 million

Energy Resources
• Lower Peninsula Resources – some exploration in the UP – but nothing productive
• Oil
• Natural Gas
• Coal (historic production – none today)
0
50,000,000
100,000,000
150,000,000
200,000,000
250,000,000
300,000,000
1920 1930 1940 1950 1960 1970 1980 1990 2000 2010 2020
An
nu
al N
atu
ral G
as P
rod
uct
ion
(M
CF)
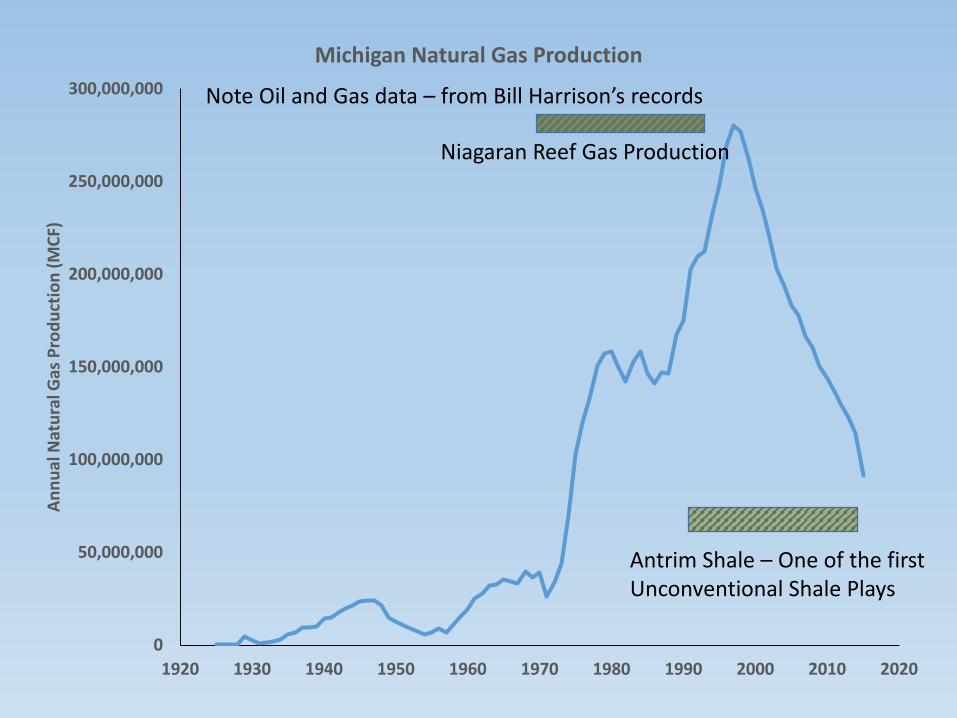
Michigan Natural Gas Production
Note Oil and Gas data – from Bill Harrison’s records
Antrim Shale – One of the first Unconventional Shale Plays
Niagaran Reef Gas Production

0
5,000,000
10,000,000
15,000,000
20,000,000
25,000,000
30,000,000
35,000,000
40,000,000
1920 1930 1940 1950 1960 1970 1980 1990 2000 2010 2020
An
nu
al O
il P
rod
uct
ion
(B
bls
)Michigan Oil Production
Note Oil and Gas data – from Bill Harrison’s records
Dundee and Traverse Group
Trenton-Black River(Albion-Scipio)
Niagaran Reefs
Renewed Trenton-Black River

0
200,000
400,000
600,000
800,000
1,000,000
1,200,000
1,400,000
1,600,000
1,800,000
2,000,000
1840 1860 1880 1900 1920 1940 1960 1980 2000 2020
Co
al P
rod
uct
ion
(m
etri
c to
ns)
Michigan Annual Coal Production
Jackson area, Saginaw Valley, and Thumb Region – lots of mines
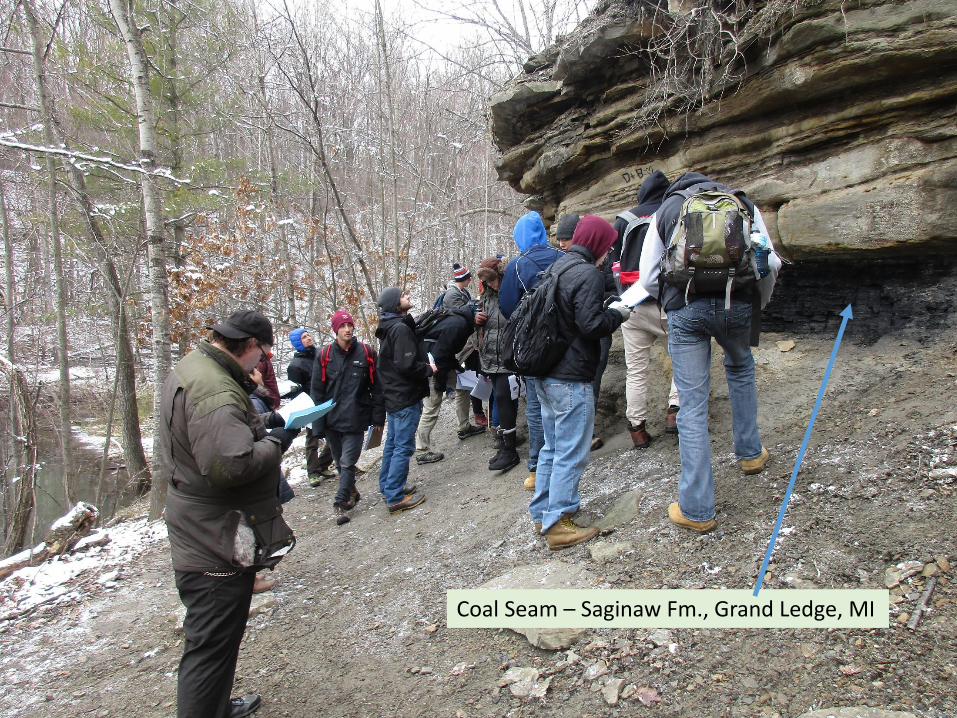
Coal Seam – Saginaw Fm., Grand Ledge, MI

Estimated Energy Resources ProductionCommodity Production Value (2013 $)
Oil 1,336,000,000 barrels $116 billion
Natural Gas 8,086,000,000 cubic feet $33.6 billion
Coal 42,000,000 metric tons $3.5 billion
Peat 10,000,000 metric tons $250 million
Final Thought
• If we had to go back and mine these resources again – at 2013 prices, they would be worth approximately $558,000,000,000