Michigan Exploratory Study
34
1 Michigan Exploratory Study August 28, 2006 Dale Osborn, Jeffrey L. Wilson
Transcript of Michigan Exploratory Study

1
Michigan Exploratory Study
August 28, 2006Dale Osborn, Jeffrey L. Wilson

2
Project Footprint-

3
Topics
Answers to questions about the CNF runs using PROMOD• HVDC• 765 kV• Equivalent CT generation constructed where the HVDC line would
terminate.
Need for LOLP and Transmission Service with CEP ForecastStrategist information
• Most of the benefits over a 20 year period for a 2500 Mw transmission line are from the deferral of generation and not production cost savings.
• Benefits determined with Strategist runs using CNF assumptions• Questions and Answers• Benefits determine with Strategist runs using
CNF assumptions and the revised 21st Century Energy Plan forecast.
Questions and Answers

4
Production Cost Benefits2011 Study Year- MTEP forecast ( CNF)
PC Difference adjusted for sales- what the Michigan load would see as a benefit• HVDC- $32 M
• 765 kV-$13 M
• CT-$17 M
• The differences are not significant from an Adjusted Production Cost viewpoint. The total production cost for Michigan is about $3,200M.

5
Economic Results for HVDC vs. Base Case
Positive - cost reduction, good for load customers
Positive - cost reduction, good for load customers
Positive - a reduction less market power
Positive - cost reduction, good for load customers
$47M$180M$69M$33MTOTAL
$9M($39M)($47M)($39M)Non-MICH MISO
$32M$136M$84M$133MMICH
$0.8M$37M$40M($24M)OTHER*
($8M)$20M$32M$27MIESO
$14M$26M($40M)($64M)PJM*
$41M$97M$36M$93MMISO
∆ Adjusted ProductionCost Savings∆ Load LMP Cost∆ Net Generation
Revenue∆ Production Cost
SavingsSYSTEM
BASECASE minus HVDC CaseConvention is:

6
Economic Results for 2720MW CTs vs. Base Case
Positive - cost reduction, good for load customers
Positive - cost reduction, good for load customers
Positive - a reduction less market power
Positive - cost reduction, good for load customers
$29M$325M$306M$11MTOTAL
$17M$104M$97M$20MNon-MICH MISO
$17M$45M$22M($19M)MICH
($2M)$56M$56M$4MOTHER*
($3M)($5M)$10M$2MIESO
$1M$125M$121M$5MPJM*
$33M$149M$119M$0.5MMISO
∆ Adjusted ProductionCost Savings∆ Load LMP Cost∆ Net Generation
Revenue∆ Production Cost
SavingsSYSTEM
BASECASE minus Combustion Turbine CaseConvention is:

7
Economic Results for 765kVAC vs. Base Case
Positive - cost reduction, good for load customers
Positive - cost reduction, good for load customers
Positive - a reduction less market power
Positive - cost reduction, good for load customers
$32M$183M$137M$9MTOTAL
$19M$55M$25M($2M)Non-MICH MISO
$13M$134M$121M$83MMICH
$1M$33M$30M($14M)OTHER*
($5M)($13M)$4M$12MIESO
$4M($27M)($42M)($70M)PJM*
$32M$189M$146M$82MMISO
∆ Adjusted ProductionCost Savings∆ Load LMP Cost∆ Net Generation
Revenue∆ Production Cost
SavingsSYSTEM
BASECASE minus HVDC CaseConvention is:
8
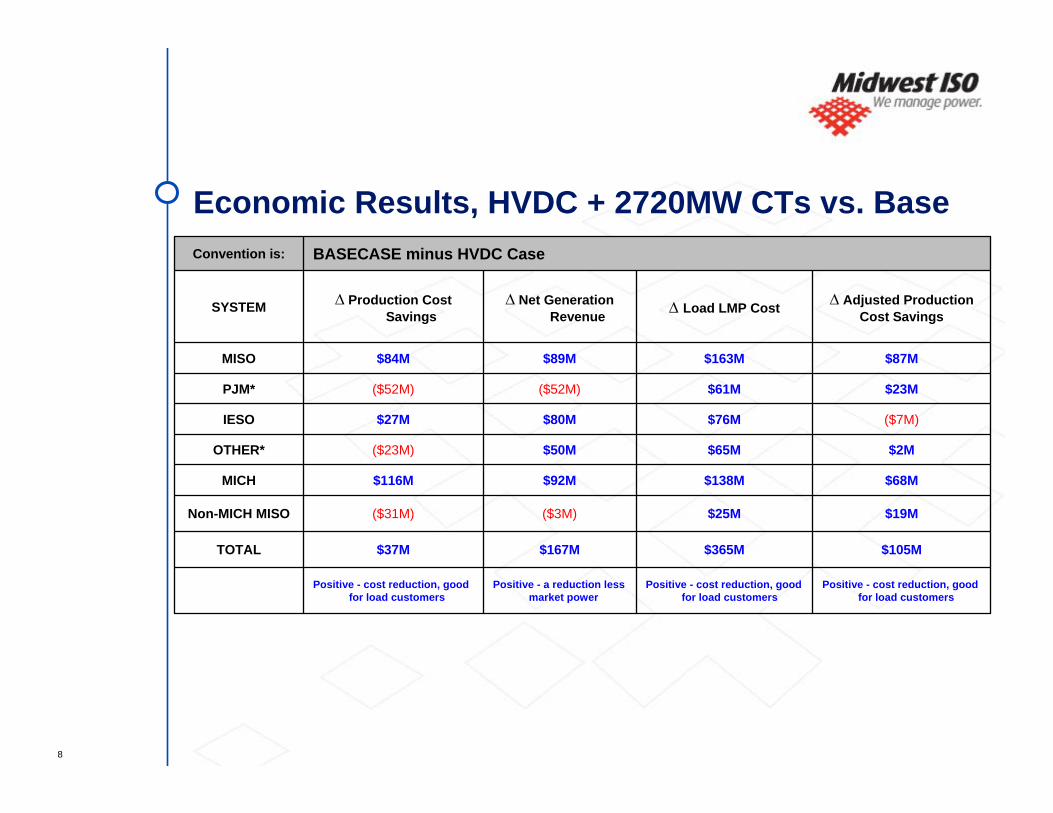
Economic Results, HVDC + 2720MW CTs vs. Base
Positive - cost reduction, good for load customers
Positive - cost reduction, good for load customers
Positive - a reduction less market power
Positive - cost reduction, good for load customers
$105M$365M$167M$37MTOTAL
$19M$25M($3M)($31M)Non-MICH MISO
$68M$138M$92M$116MMICH
$2M$65M$50M($23M)OTHER*
($7M)$76M$80M$27MIESO
$23M$61M($52M)($52M)PJM*
$87M$163M$89M$84MMISO
∆ Adjusted ProductionCost Savings∆ Load LMP Cost∆ Net Generation
Revenue∆ Production Cost
SavingsSYSTEM
BASECASE minus HVDC CaseConvention is:

9
Strategist RunsUsed CNF generation list and fuel assumptions
Used PROMOD 2011 case to establish the transaction base price from a 2500 Mw transmission line
Ran both a CNF and a CEP forecast
CEP forecast results are presented with an indication of the differences
Generation capital deferment is the major long term factor
Short term production cost is dominate

10

11
Need in 2009The CNF Forecast need for transmission capacity or equivalent generation was• 2450 Mw
The CEP Forecast need for transmission capacity or equivalent generation is• 1500 Mw
There is a need in 2009 for either transmission or generation for LOLP considerations and Transmission Service.

12
Delay reduces benefits $80M/yr to 2012

13
CNF Forecast

14
CEP Forecast
6% Reduced benefit due to CEP versus CNF forecast

15
9) Base Case with Load Adjustments and no generation forced in CAPACITY CTLO CTSE CTUP CCLO CCSE CCUP BCLO BCSE BCUPYEAR MW 160 160 160 500 500 500 500 500 500 2005 0 0 0 0 0 0 0 0 2006 0 0 0 0 0 0 0 0 0 0 2007 0 0 0 0 0 0 0 0 0 0 2008 0 0 0 0 0 0 0 0 0 0 2009 0 0 0 0 0 0 0 0 0 0 2010 160 0 1 0 0 0 0 0 0 0 2011 500 0 0 0 0 0 0 0 1 0 2012 500 0 0 0 0 0 0 0 1 0 2013 500 0 0 0 0 0 0 0 1 0 2014 1,000 0 0 0 0 0 0 1 1 0 2015 500 0 0 0 0 0 0 0 1 0 2016 500 0 0 0 0 0 0 1 0 0 2017 500 0 0 0 0 0 0 0 1 0 2018 500 0 0 0 0 0 0 0 1 0 2019 500 0 0 0 0 0 0 0 1 0 2020 1,082 0 0 0 0 0 0 1 1 0 2021 500 0 0 0 0 0 0 1 0 0 2022 1,000 0 0 0 0 0 0 1 1 0 2023 660 1 0 0 0 0 0 0 1 0 2024 820 1 1 0 0 0 0 0 1 0 Total 9,222 2 2 0 0 0 0 5 12 0
Base Case with CEP Forecast

16
Base - 2009 HVDC in service CAPACITY CTLO CTSE CTUP CCLO CCSE CCUP BCLO BCSE BCUP YEAR MW 160 160 160 500 500 500 500 500 5002005 0 0 0 0 0 0 0 0 0 0
2006 0 0 0 0 0 0 0 0 0 0 2007 0 0 0 0 0 0 0 0 0 0 2008 0 0 0 0 0 0 0 0 0 0 2009 0 0 0 0 0 0 0 0 0 0 2010 160 0 1 0 0 0 0 0 0 0 2011 500 0 0 0 0 0 0 0 1 0 2012 500 0 0 0 0 0 0 0 1 0 2013 500 0 0 0 0 0 0 0 1 0 2014 1,000 0 0 0 0 0 0 1 1 0 2015 0 0 0 0 0 0 0 0 0 0 2016 0 0 0 0 0 0 0 0 0 0 2017 0 0 0 0 0 0 0 0 0 0 2018 0 0 0 0 0 0 0 -1 1 0 2019 -500 0 0 0 0 0 0 -1 0 0 2020 500 0 0 0 0 0 0 1 0 0 2021 0 0 0 0 0 0 0 1 -1 0 2022 0 0 0 0 0 0 0 0 0 0 2023 -340 1 0 0 0 0 0 -1 0 0 2024 320 1 1 0 0 0 0 0 0 0 Total 2,640 2 2 0 0 0 0 0 4 0
Base- 2009 Transmission
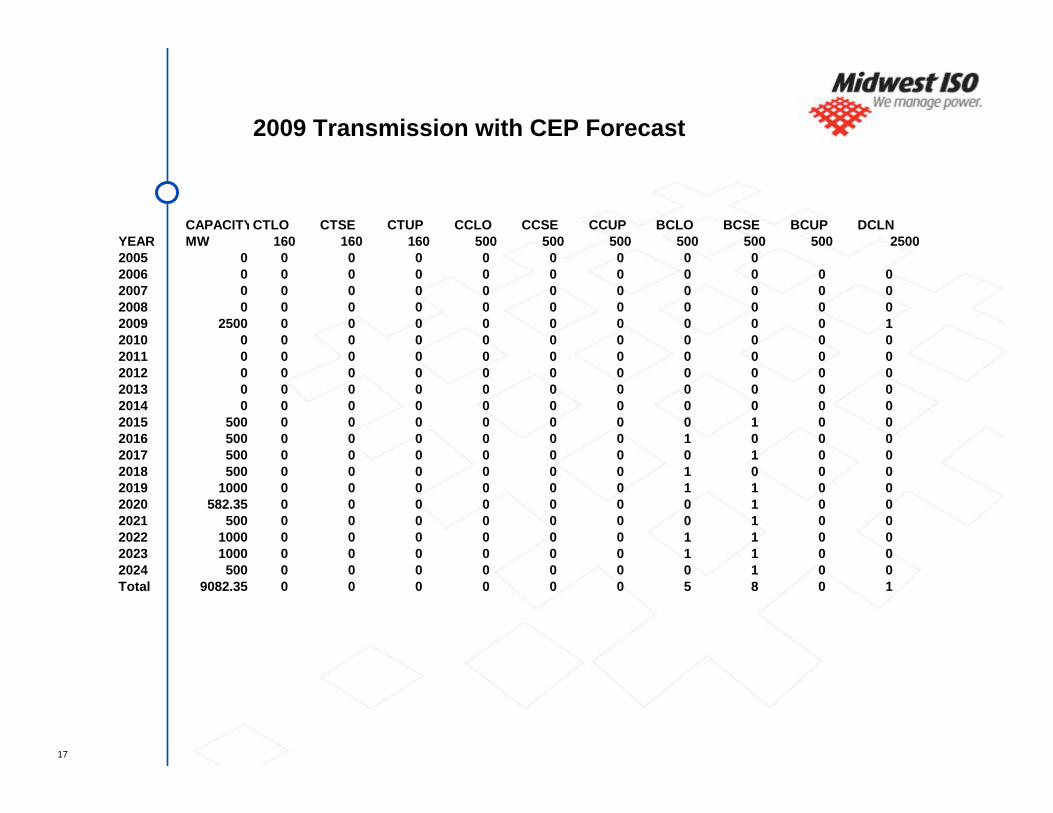
17
CAPACITYCTLO CTSE CTUP CCLO CCSE CCUP BCLO BCSE BCUP DCLNYEAR MW 160 160 160 500 500 500 500 500 500 25002005 0 0 0 0 0 0 0 0 02006 0 0 0 0 0 0 0 0 0 0 02007 0 0 0 0 0 0 0 0 0 0 02008 0 0 0 0 0 0 0 0 0 0 02009 2500 0 0 0 0 0 0 0 0 0 12010 0 0 0 0 0 0 0 0 0 0 02011 0 0 0 0 0 0 0 0 0 0 02012 0 0 0 0 0 0 0 0 0 0 02013 0 0 0 0 0 0 0 0 0 0 02014 0 0 0 0 0 0 0 0 0 0 02015 500 0 0 0 0 0 0 0 1 0 02016 500 0 0 0 0 0 0 1 0 0 02017 500 0 0 0 0 0 0 0 1 0 02018 500 0 0 0 0 0 0 1 0 0 02019 1000 0 0 0 0 0 0 1 1 0 02020 582.35 0 0 0 0 0 0 0 1 0 02021 500 0 0 0 0 0 0 0 1 0 02022 1000 0 0 0 0 0 0 1 1 0 02023 1000 0 0 0 0 0 0 1 1 0 02024 500 0 0 0 0 0 0 0 1 0 0Total 9082.35 0 0 0 0 0 0 5 8 0 1
2009 Transmission with CEP Forecast

18
New Capacity CTLO CTSE CTUP CCLO CCSE CCUP BCLO BCSE BCUP DCLNYEAR MW 160 160 160 500 500 500 500 500 500 2000
2005 0 0 0 0 0 0 0 0 0 0 02006 0 0 0 0 0 0 0 0 0 0 02007 320 0 2 0 0 0 0 0 0 0 02008 660 1 0 0 0 1 0 0 0 0 02009 820 2 0 0 0 1 0 0 0 0 02010 980 1 2 0 0 1 0 0 0 0 02011 1000 0 0 0 0 0 0 1 1 0 02012 1000 0 0 0 0 0 0 1 1 0 02013 1000 0 0 0 0 0 0 1 1 0 02014 1000 0 0 0 0 0 0 1 1 0 02015 500 0 0 0 0 0 0 0 1 0 02016 1160 1 0 0 0 0 0 1 1 0 02017 1000 0 0 0 0 0 0 1 1 0 02018 660 1 0 0 0 0 0 1 0 0 02019 1160 1 0 0 0 0 0 1 1 0 02020 1242.3 1 0 0 0 0 0 1 1 0 02021 820 1 1 0 0 0 0 1 0 0 02022 1160 0 1 0 0 0 0 1 1 0 02023 1320 1 1 0 1 1 0 0 0 0 02024 1160 1 0 0 0 1 0 1 0 0 0
Mw 16962.3 1760 1120 0 500 2500 0 6000 5000 0 0
BASE CASE CNF Forecast

19
PROMOD StudyDiscussion Overview

20
Study Methodology
Transmission expansion studies • 765kVAC line from AEP-Cook to ITC-Blackfoot
• 500kVDC line from AEP-Cook to ITC-Blackfoot
Capacity expansion studies• 2720MW CTs installed @ ITC-Blackfoot
• 500kvDC line and 2720MW CTs @ ITC-Blackfoot

21
Study Methodology
Perform preliminary studies maximizing import into study area to determine limits
Cross reference these limits with work done by MISO & Stakeholder planning groups
Modify security constrained data using new ACCC transfer study results, required interfaces, etc.
Identify economically unresolved constraints & their impact (duration, shadow costs)

22
Study Footprint - Geography-

23
Study Footprint – MISO Footprint-

24
Study Base Case
MISO MTEP06 2011 CASE 01242006
Michigan CNF Resource Planning Study load forecast
Stakeholder developed list of constraints

25
Basecase Production Cost 2011
$ 11,576,427,840 non MICH MISO$ 32,644,599,851 OTHER*$ 3,198,226,557 MICH$ 14,774,654,397 MISO$ 2,469,145,297 IESO$ 16,990,484,247 PJM*Basecase Prod CostREGION
*PJM includes Exelon and AEP. OTHER refers to companies outside of the MISO-IESO-PJM footprint, namely companies in the South/Southeast regions

26
2011 ITC Interface Flow vs. DETED Load Factor
2011 DETED %PeakLoad vs ITC Interface Flow -Base, HVDC, 765kV Cases
20%
30%
40%
50%
60%
70%
80%
90%
100%
-5000 -4000 -3000 -2000 -1000 0 1000 2000 3000 4000 5000 6000 7000 8000ITC Interface (MW)
DET
ED %
Pea
k Lo
ad (M
W) ITC Interface + HVDC
ITC Interface HVDC
ITC Interface Base
ITC Interface 765kV
27
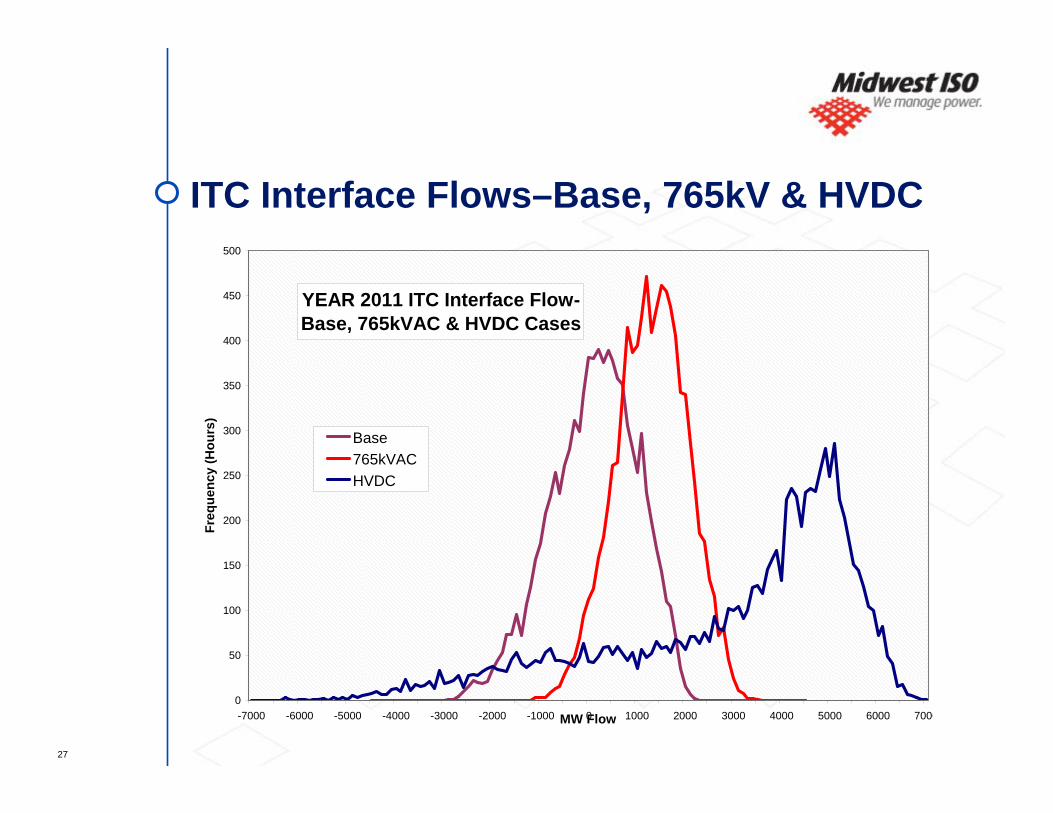
ITC Interface Flows–Base, 765kV & HVDC
YEAR 2011 ITC Interface Flow- Base, 765kVAC & HVDC Cases
0
50
100
150
200
250
300
350
400
450
500
-7000 -6000 -5000 -4000 -3000 -2000 -1000 0 1000 2000 3000 4000 5000 6000 7000MW Flow
Freq
uenc
y (H
ours
)
Base765kVACHVDC

28
Hourly ITC Interface Flow
HVDC case encompasses full range of operation of the base and 765kV cases• Illustrates the “dispatchable” nature of the
HVDC line’s operation
765kVAC facilitates a less volatile interface flow• Illustrates the network supporting
characteristics of the AC line’s operation

29
HVDC Line Flow HourlyYEAR 2011 Hourly HVDC Line Flow
-5000
-2500
0
2500
5000
1 745 1489 2233 2977 3721 4465 5209 5953 6697 7441 8185Year-Hour
HVD
C F
low
(MW
)

30
HVDC Line Flow HistogramYEAR 2011 Histogram of Flow Cook - Blackfoot HVDC
4237 Hours @Max
0
500
1000
1500
2000
2500
3000
3500
4000
4500-2
500
-230
0
-210
0
-190
0
-170
0
-150
0
-130
0
-110
0
-900
-700
-500
-300
-100 10
0
300
500
700
900
1100
1300
1500
1700
1900
2100
2300
2500
MW Flow
Freq
uenc
y (H
ours
)

31
ITC Interface Flow
HVDC line is limited to 2,500 MW• Line is at max (into ITC) for >50% of the 2011 hours
• MI needs would support a 4000MW HVDC line
765kVAC is rated @ 3975MVA• Line facilitates greater interface flow @ high load
due to this ~1500MVA difference
Recommend future analysis @ higher rated HVDC line
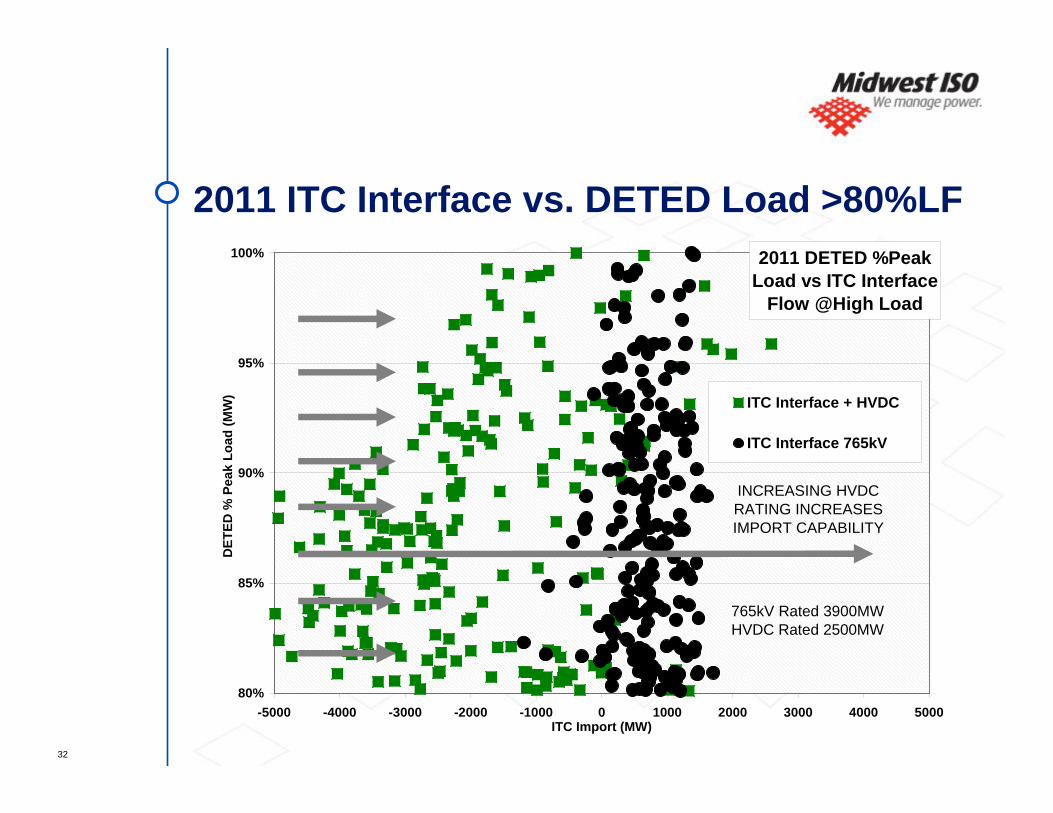
32
2011 ITC Interface vs. DETED Load >80%LF2011 DETED %Peak
Load vs ITC InterfaceFlow @High Load
80%
85%
90%
95%
100%
-5000 -4000 -3000 -2000 -1000 0 1000 2000 3000 4000 5000ITC Import (MW)
DET
ED %
Pea
k Lo
ad (M
W) ITC Interface + HVDC
ITC Interface 765kV
INCREASING HVDC RATING INCREASES IMPORT CAPABILITY
765kV Rated 3900MWHVDC Rated 2500MW

33
Hourly ITC Interface FlowYEAR 2011 Hourly ITC Interface Flow
Base, 765kV & HVDC Cases
-7500
-5000
-2500
0
2500
5000
7500
10000
1 745 1489 2233 2977 3721 4465 5209 5953 6697 7441 8185Year-Hour
ITC
Inte
rfac
e M
W
ITC Interface + HVDCITC Interface 765kVITC Interface Base
34
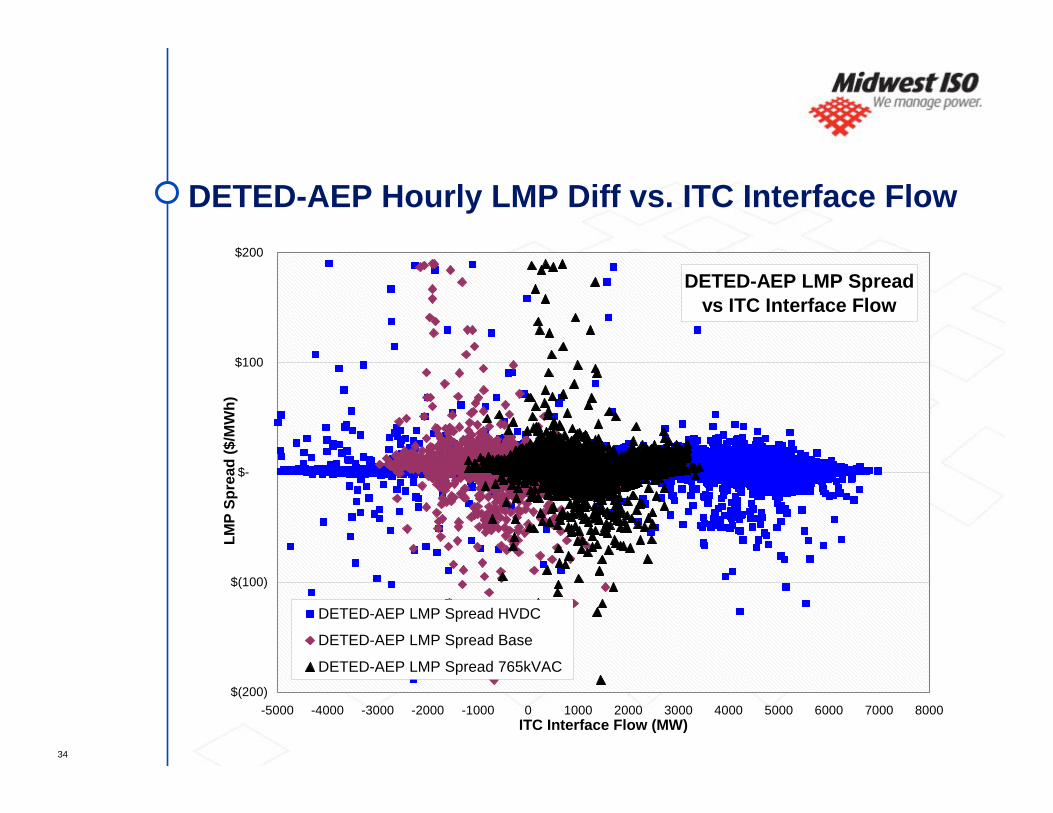
DETED-AEP Hourly LMP Diff vs. ITC Interface Flow
DETED-AEP LMP Spreadvs ITC Interface Flow
$(200)
$(100)
$-
$100
$200
-5000 -4000 -3000 -2000 -1000 0 1000 2000 3000 4000 5000 6000 7000 8000ITC Interface Flow (MW)
LMP
Spre
ad ($
/MW
h)
DETED-AEP LMP Spread HVDC
DETED-AEP LMP Spread Base
DETED-AEP LMP Spread 765kVAC