Parent Engagement Information and Tools - SOM - State of Michigan
Upload
samuel-ramseyCategory
view
218download
3
Michigan Accountability Data Tools
February 1, 2013
I can use data tools developed by MDE related to school improvement, school rankings, and accountability to understand state level data and use it to ensure students’ needs are being met.
I can facilitate discussions around the tools and data with building staff as a part of the ongoing school improvement process.
Learning Targets
Top-to Bottom Individual School Look-Up Tool Individual Focus School Look-Up Tool Identifying Your Top and Bottom 30% Accountability Scorecard/The Future of AYP
and EdYES! Favorite IGOR Reports
Agenda
Michigan Accountability Systems
TTB, Priority, and Focus
Or:
Where does THAT number come from???
MDE applied for “waivers” from certain requirements under the No Child Left Behind act (ESEA).
Approved in July, 2012 Went into effect immediately
Flexibility Waiver
http://www.michigan.gov/documents/mde/ESEA_Flexibility_Request_FINAL_377829_7.pdf
Three Principles Principle 1: College- and Career-Ready
Expectations for All Students Principle 2: State-Developed
Differentiated Recognition, Accountability, and Support
Principle 3: Supporting Effective Instruction and Leadership
MDE Flexibility Waiver
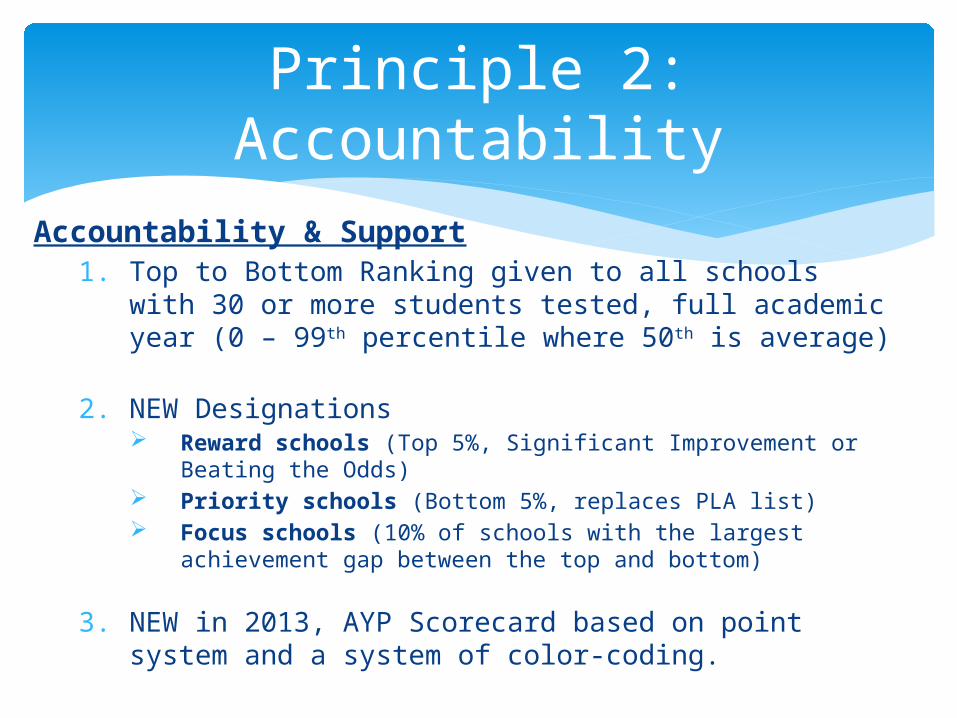
Accountability & Support1. Top to Bottom Ranking given to all schools with 30
or more students tested, full academic year (0 – 99th percentile where 50th is average)
2. NEW Designations Reward schools (Top 5%, Significant Improvement or
Beating the Odds) Priority schools (Bottom 5%, replaces PLA list) Focus schools (10% of schools with the largest
achievement gap between the top and bottom)
3. NEW in 2013, AYP Scorecard based on point system and a system of color-coding.
Principle 2: Accountability
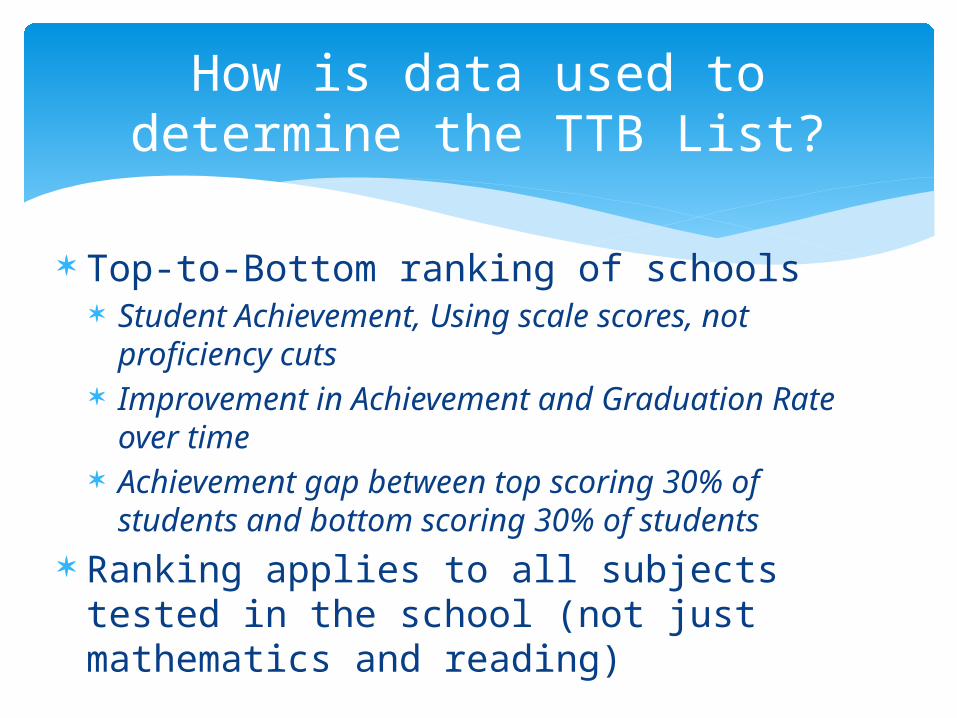
Top-to-Bottom ranking of schools Student Achievement, Using scale scores, not
proficiency cuts Improvement in Achievement and Graduation
Rate over time Achievement gap between top scoring 30% of
students and bottom scoring 30% of students Ranking applies to all subjects tested in
the school (not just mathematics and reading)
How is data used to determine the TTB List?
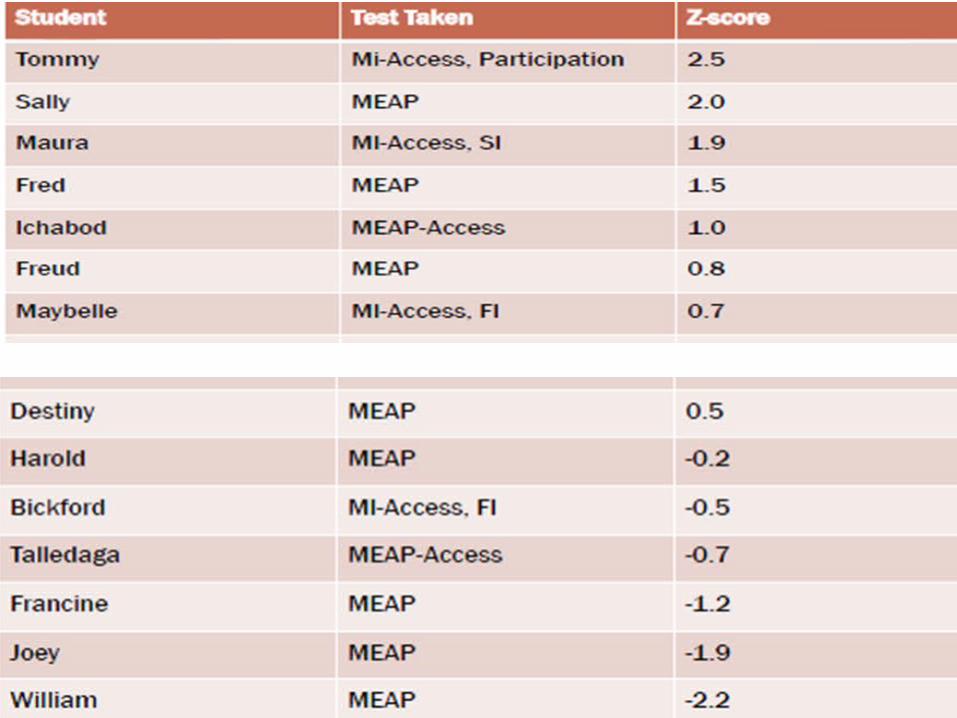
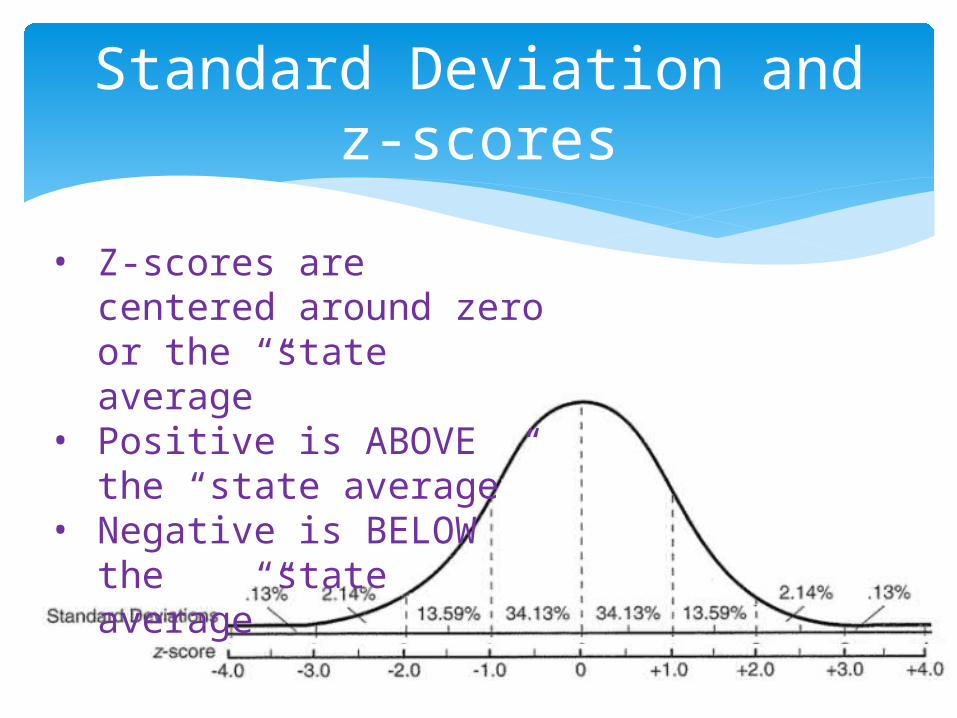
Standard Deviation and z-scores
• Z-scores are centered around zero or the “state average”
• Positive is ABOVE the “state average”
• Negative is BELOW the “state average”
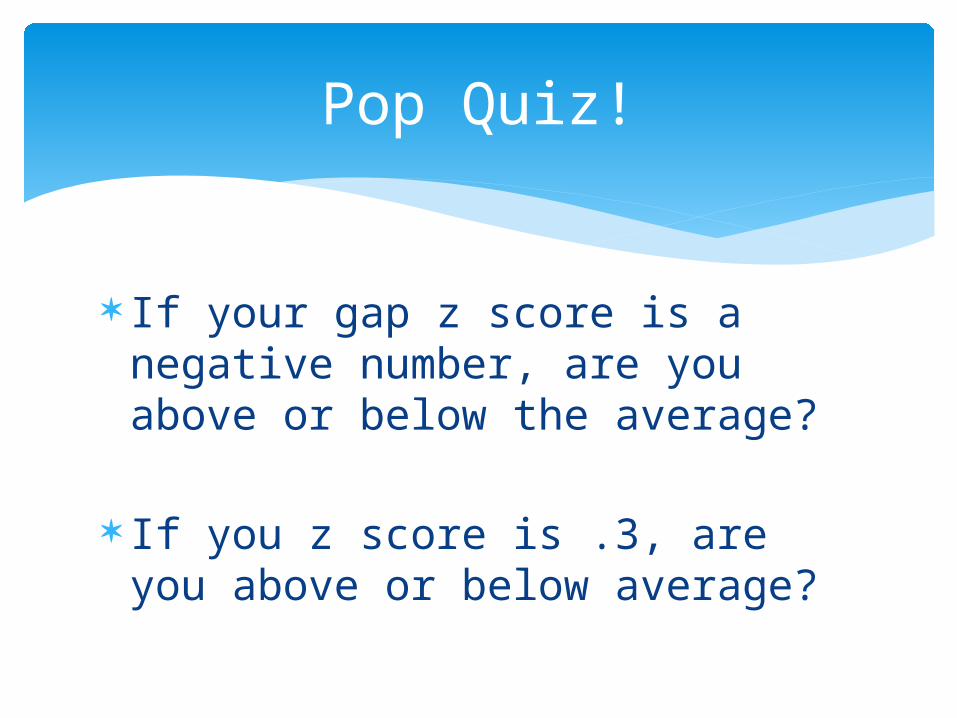
If your gap z score is a negative number, are you above or below the average?
If you z score is .3, are you above or below average?
Pop Quiz!
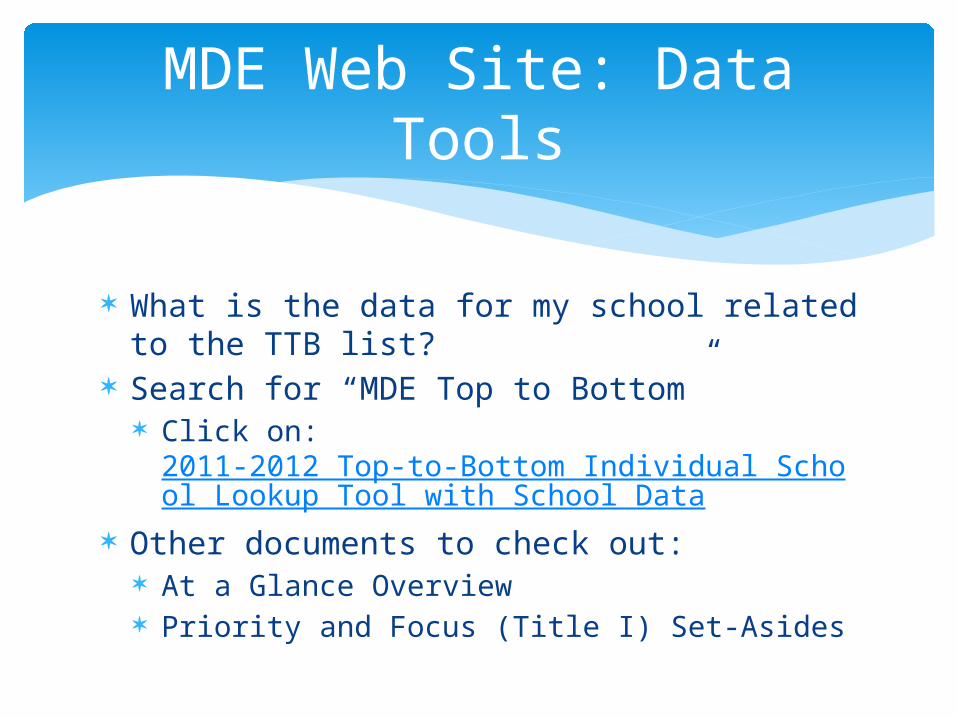
What is the data for my school related to the TTB list?
Search for “MDE Top to Bottom” Click on:
2011-2012 Top-to-Bottom Individual School Lookup Tool with School Data
Other documents to check out: At a Glance Overview Priority and Focus (Title I) Set-Asides
MDE Web Site: Data Tools
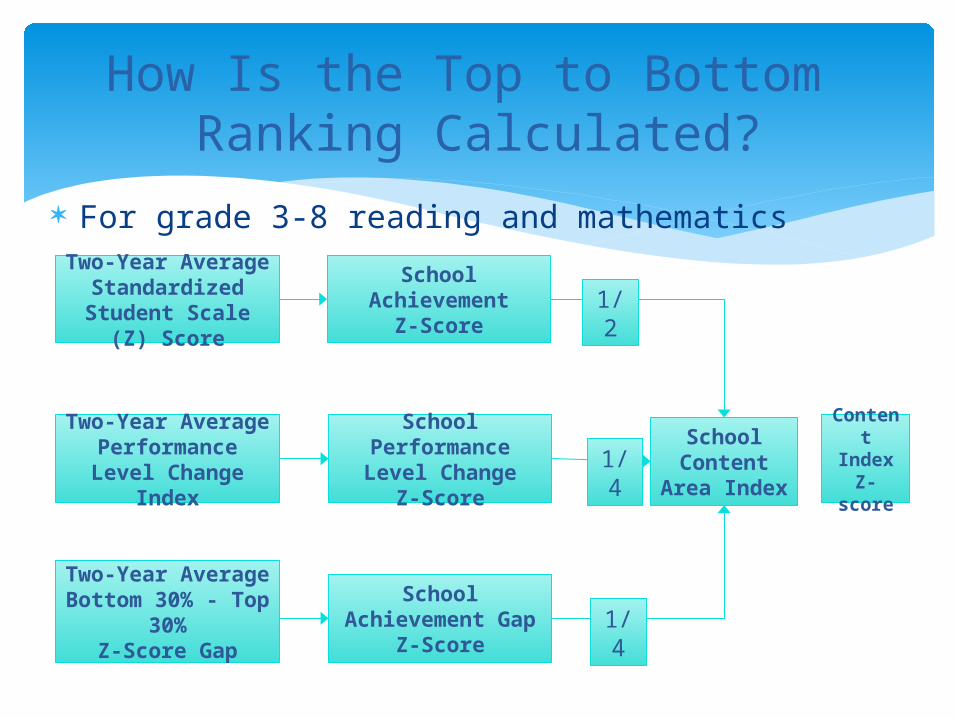
How Is the Top to Bottom Ranking Calculated?
For grade 3-8 reading and mathematics
Two-Year Average Standardized Student
Scale (Z) Score
Two-Year Average Performance Level
Change Index
Two-Year Average Bottom 30% - Top 30%
Z-Score Gap
School AchievementZ-Score
School Performance Level Change
Z-Score
School Achievement Gap Z-Score
School Content
Area Index
1/2
1/4
1/4Content Index Z-
score
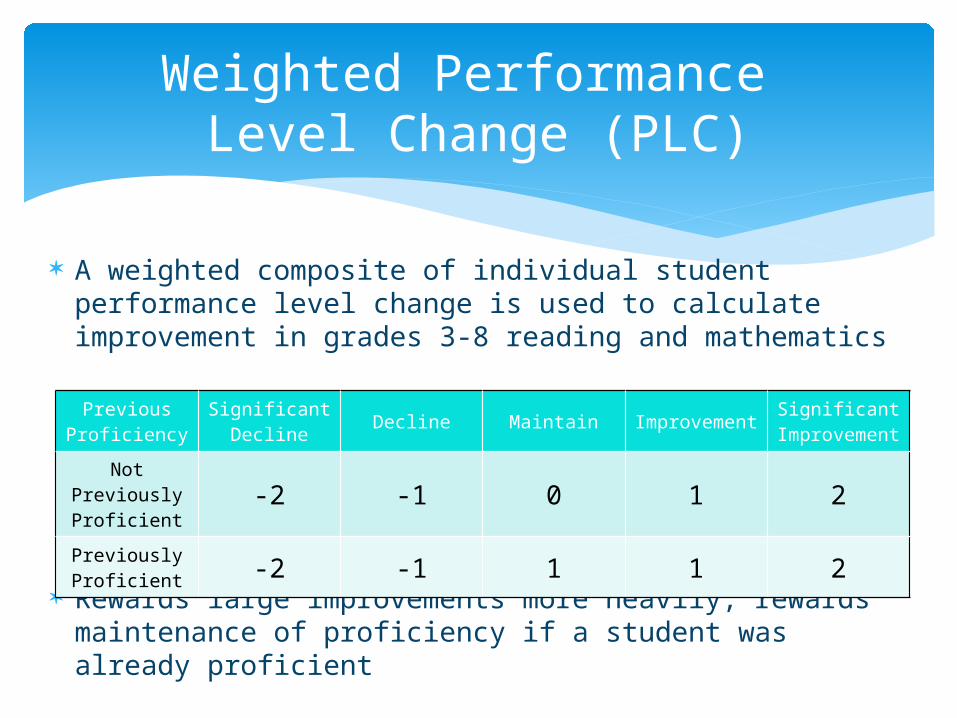
Weighted Performance Level Change (PLC)
A weighted composite of individual student performance level change is used to calculate improvement in grades 3-8 reading and mathematics
Rewards large improvements more heavily, rewards maintenance of proficiency if a student was already proficient
Previous Proficiency
Significant Decline
Decline MaintainImprovemen
t
Significant Improvemen
t
Not Previously Proficient
-2 -1 0 1 2
Previously Proficient -2 -1 1 1 2

Chew . . .
What is the data for my school related to the “Gap?”
Search for “MDE Focus Schools” or click the Focus button on the Priority page Click on: Individual Focus School Lookup Tool
to download the data file and see your gap data.
Other documents to check out: At a Glance Overview Facts and Figures document
MDE Web Site: Data Tools
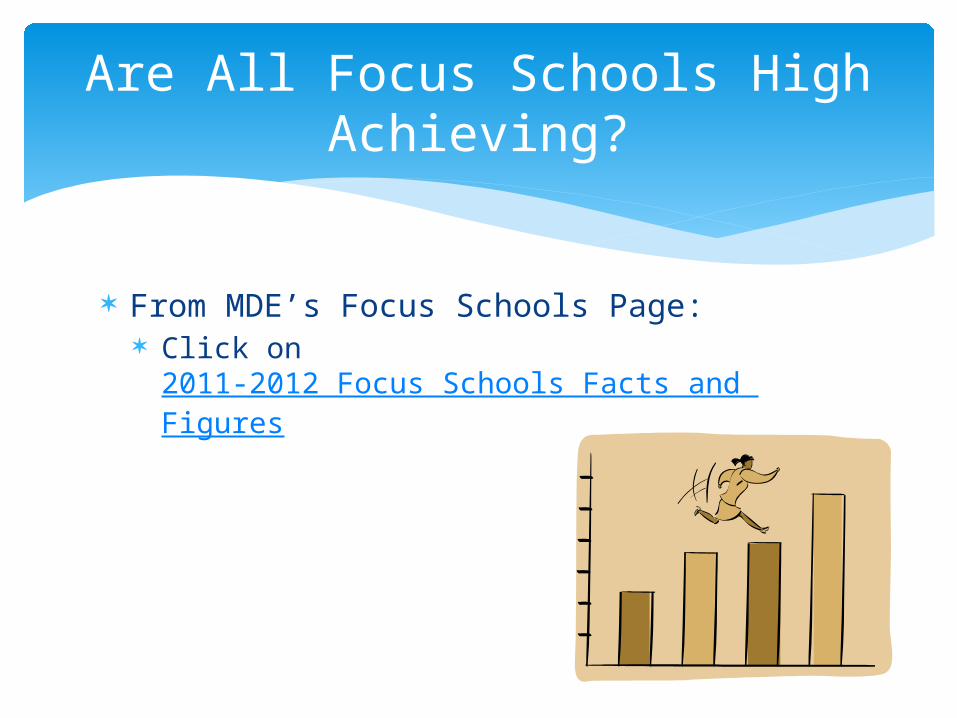
From MDE’s Focus Schools Page: Click on 2011-2012 Focus Schools Facts and
Figures
Are All Focus Schools High Achieving?
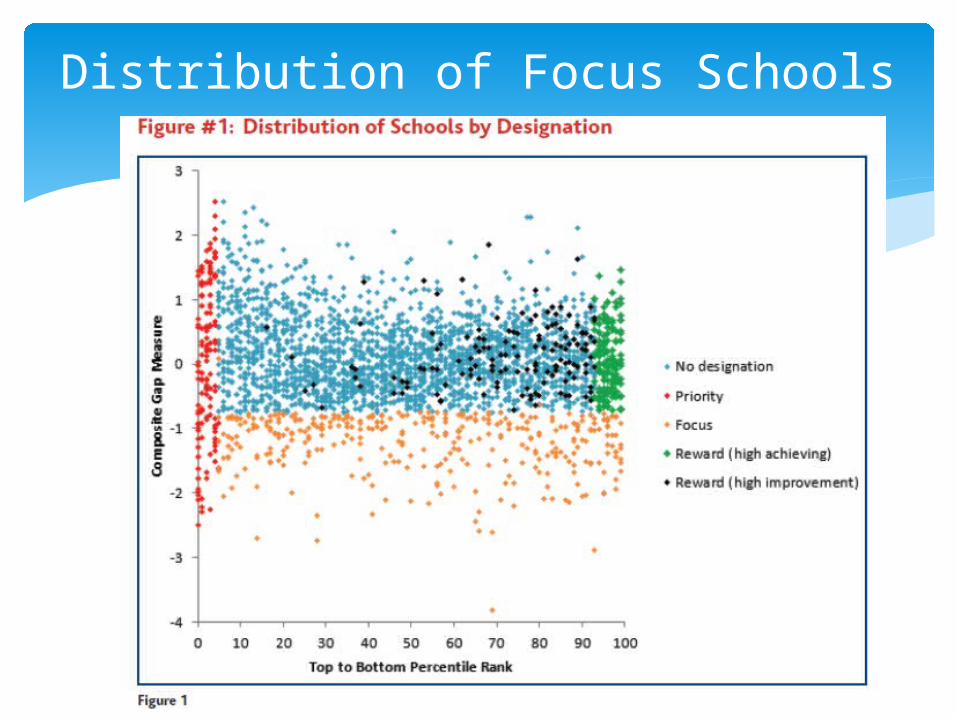
Distribution of Focus Schools

Chew . . .
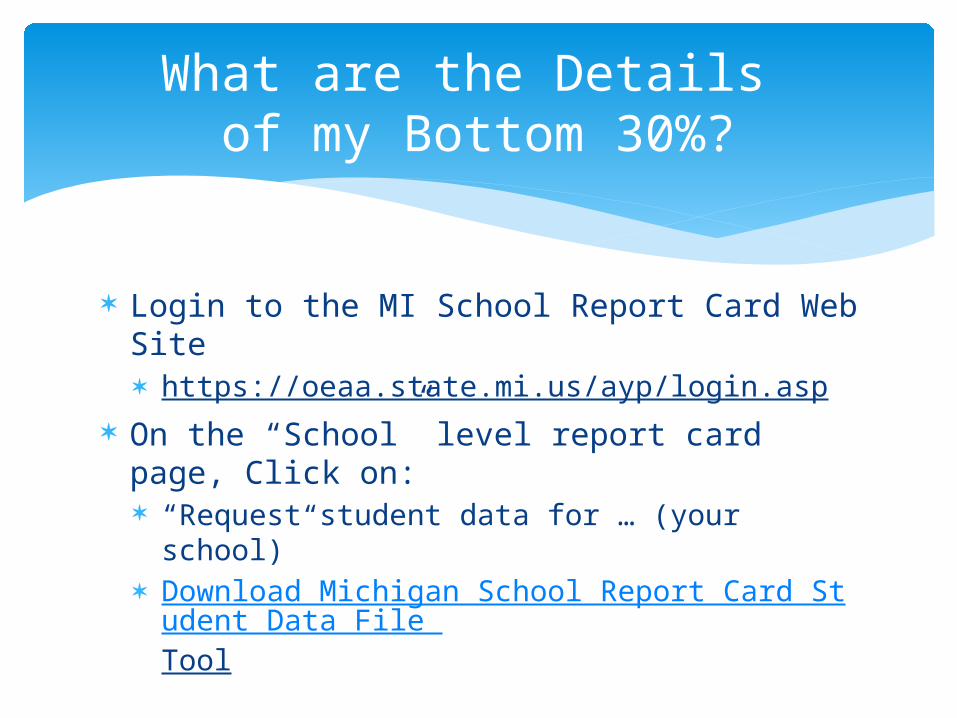
Login to the MI School Report Card Web Site https://oeaa.state.mi.us/ayp/login.asp
On the “School” level report card page, Click on: “Request student data for … (your school)” Download Michigan School Report Card Studen
t Data File Tool
What are the Details of my Bottom 30%?

From the Report Card Site you will need your Report Card Student Data
File: https://oeaa.state.mi.us/ayp/guide.asp On the MDE Focus Schools page
Click on Tool for Identifying Bottom 30% Students for School Use
Click on How to Filter your AYP Student Data File to Identify Bottom 30% Students
And follow the directions!
Who are my Bottom 30%?
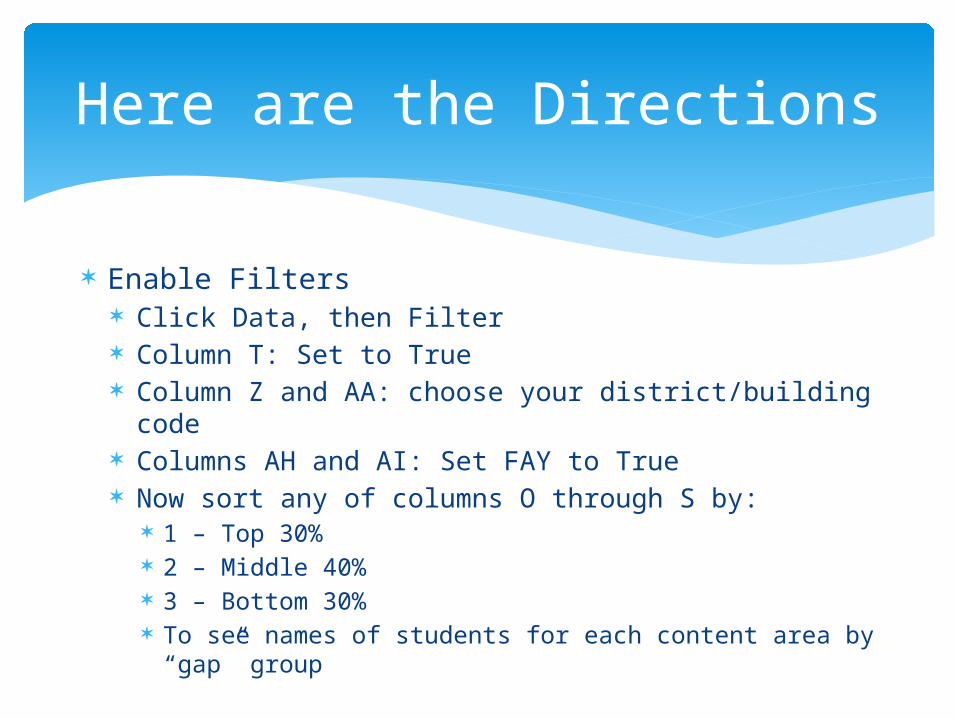
Enable Filters Click Data, then Filter Column T: Set to True Column Z and AA: choose your district/building code Columns AH and AI: Set FAY to True Now sort any of columns O through S by:
1 – Top 30% 2 – Middle 40% 3 – Bottom 30% To see names of students for each content area by
“gap” group
Here are the Directions

Chew . . .
Accountability Scorecards
An Early Orientation to the Future of Michigan School Accountability

Background Information• Michigan applied and was approved for ESEA
flexibility for 2012-13 school year and onward.• MDE worked extensively with stakeholder groups
and negotiations with USED to determine necessary changes and a new direction for Michigan’s School Report Cards.
• The preliminary and public accountability results for the 2012-13 school year will look and feel brand new but have familiar pieces and parts.
• The new report cards will be known as the: “Michigan School Accountability Scorecards”
Logistics Preliminary Scorecards for 2012-13 will
reside on the newly-redesigned BAA Secure Site (set to launch July 2013). Users will have to be authorized and login to the
site using their MEIS account. Permissions to view the report cards will be
handled in the district. Any appeals to the preliminary scorecards will
be handled through the new BAA Secure Site, similar to previous years.
Public Scorecards will reside on MISchoolData.org with the other accountability designation results such as the Top-to-Bottom Rankings.
Overview• Two “levels” of Accountability Scorecards:
District Scorecards & School Scorecards
• Scorecards will use a color coding system (green, lime, yellow, orange, and red) to indicate school performance.
• Combines traditional accountability metrics with Top-to-Bottom labels and other state/federal requirements.
• Overall STATUS color in the top right corner is determined by Top to Bottom status as well as points earned by meeting traditional AYP requirements.• Individual “cells” use red/yellow/green coding scheme• Points-based system where full points earned for meeting
a target, half points earned for meeting safe harbor
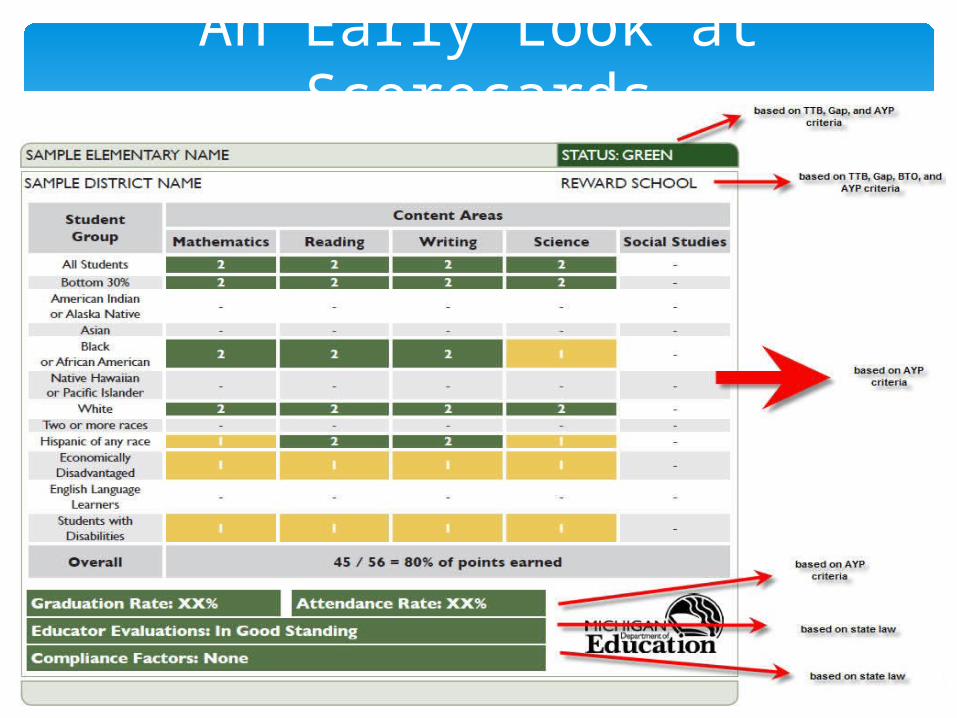
An Early Look at Scorecards
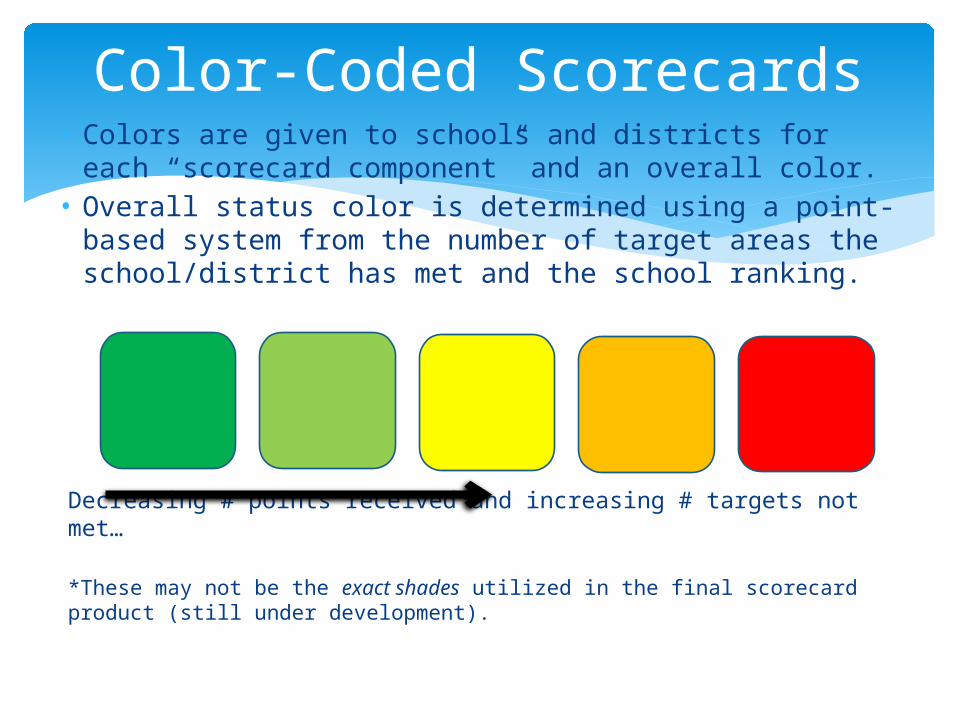
Color-Coded Scorecards• Colors are given to schools and districts for each
“scorecard component” and an overall color.• Overall status color is determined using a point-
based system from the number of target areas the school/district has met and the school ranking.
Decreasing # points received and increasing # targets not met…
*These may not be the exact shades utilized in the final scorecard product (still under development).
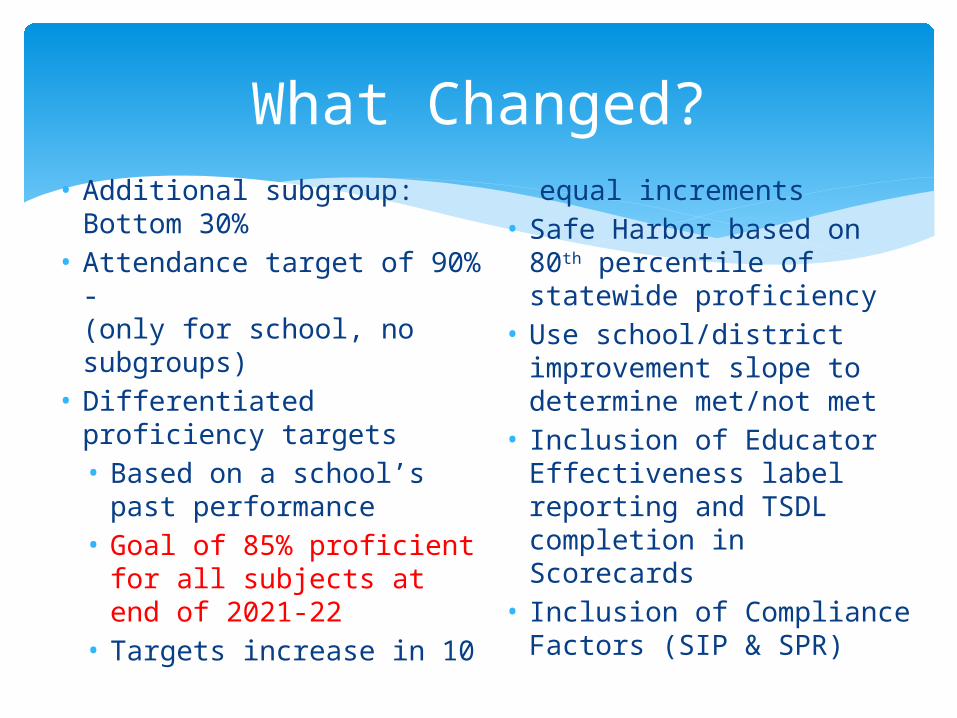
What Changed?• Additional subgroup:
Bottom 30%• Attendance target of 90%
-(only for school, no subgroups)
• Differentiated proficiency targets• Based on a school’s
past performance• Goal of 85% proficient
for all subjects at end of 2021-22
• Targets increase in 10
equal increments• Safe Harbor based on
80th percentile of statewide proficiency
• Use school/district improvement slope to determine met/not met
• Inclusion of Educator Effectiveness label reporting and TSDL completion in Scorecards
• Inclusion of Compliance Factors (SIP & SPR)

Most of the nuts and bolts of AYP have remained the same!
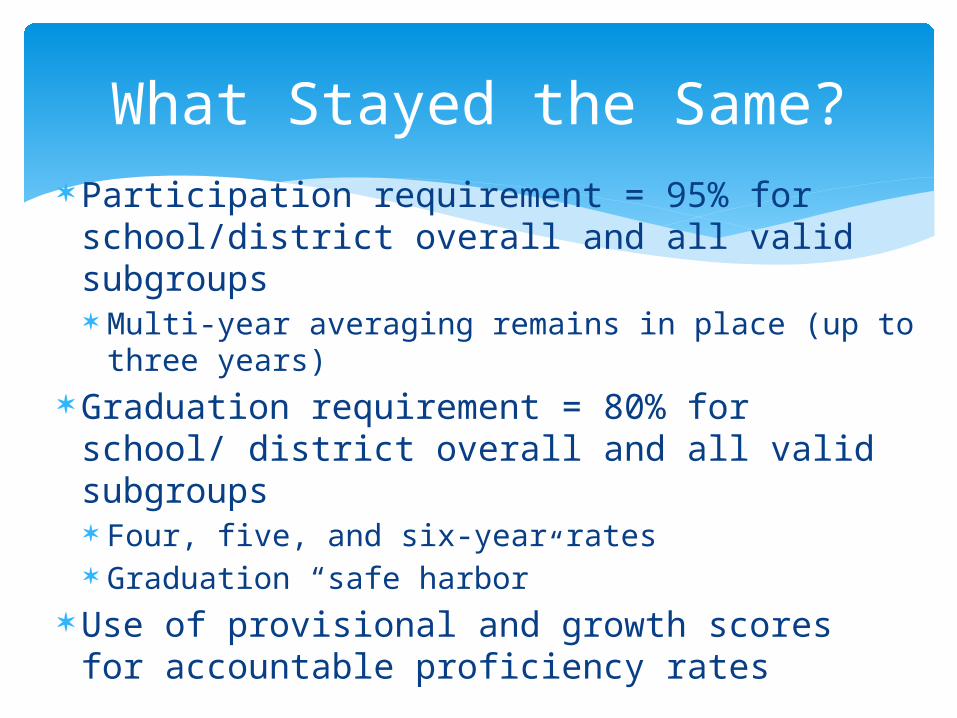
What Stayed the Same? Participation requirement = 95% for
school/district overall and all valid subgroups Multi-year averaging remains in place (up to
three years) Graduation requirement = 80% for school/
district overall and all valid subgroups Four, five, and six-year rates Graduation “safe harbor”
Use of provisional and growth scores for accountable proficiency rates
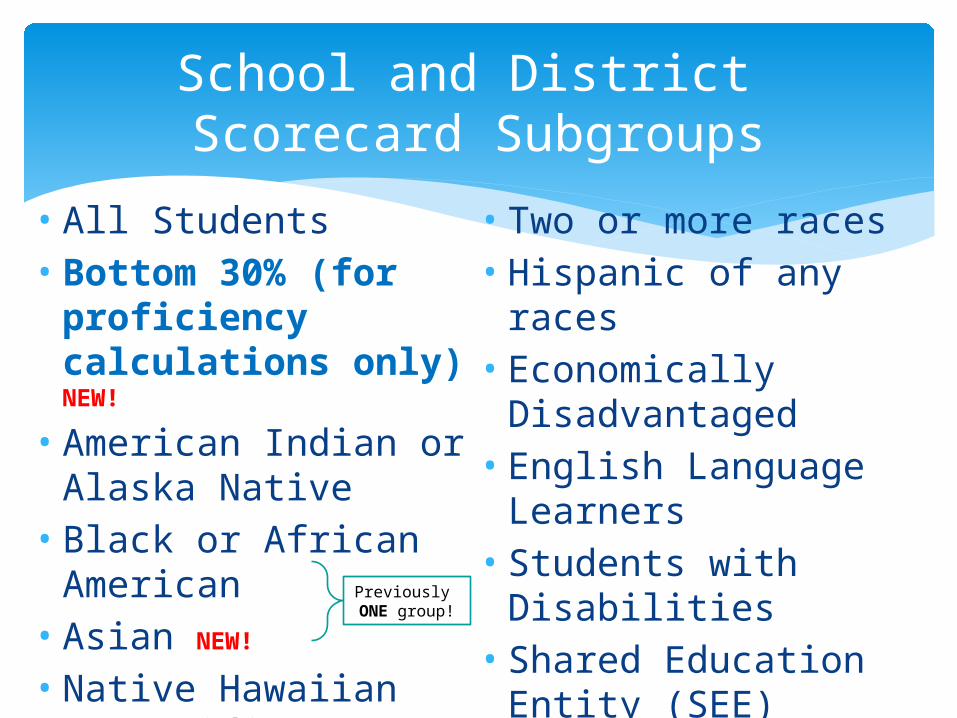
School and District Scorecard Subgroups
• All Students• Bottom 30% (for
proficiency calculations only) NEW!
• American Indian or Alaska Native
• Black or African American
• Asian NEW!
• Native Hawaiian or Pacific Islander NEW!
• White• Two or more races• Hispanic of any races• Economically
Disadvantaged• English Language
Learners• Students with
Disabilities• Shared Education
Entity (SEE) (district-level only)
Previously ONE group!

Participation
95% of students are still required to be tested to meet the assessment participation target for the scorecard. If student group size is 30-39, target is no more than
two non-participants (this makes it so that a single student cannot result in not meeting the target participation rate).
If student group size is 40 or more, target is 95% participation
Participation rate is rounded to nearest hundredth If the “All Students” group does not have at least 30
students in one test cycle, a participation average will be calculated using up to three years of data in order to accumulate at least 30 students
Multi-year averaging used help meet the participation requirement
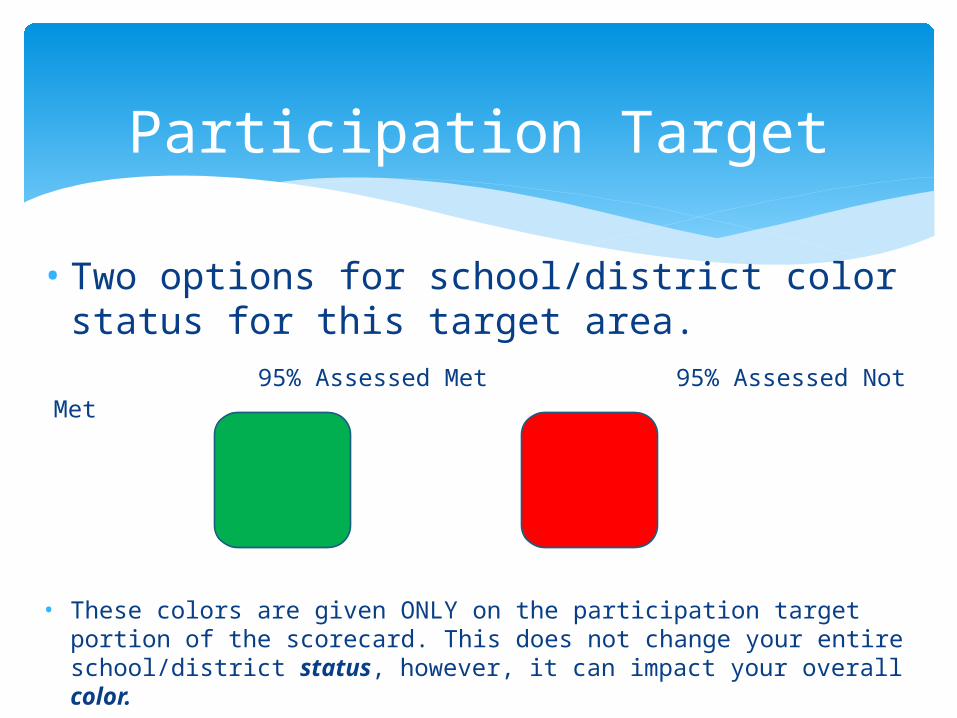
Participation Target
• Two options for school/district color status for this target area.
95% Assessed Met 95% Assessed Not Met
• These colors are given ONLY on the participation target portion of the scorecard. This does not change your entire school/district status, however, it can impact your overall color.
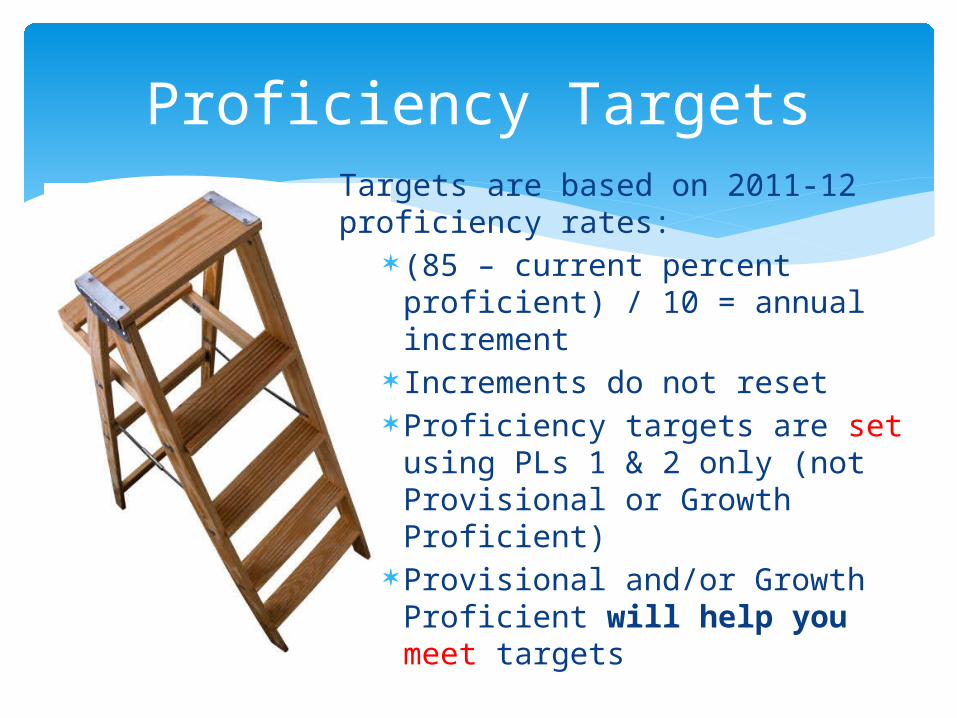
Proficiency TargetsTargets are based on 2011-12 proficiency rates:
(85 – current percent proficient) / 10 = annual increment
Increments do not reset Proficiency targets are set using
PLs 1 & 2 only (not Provisional or Growth Proficient)
Provisional and/or Growth Proficient will help you meet targets
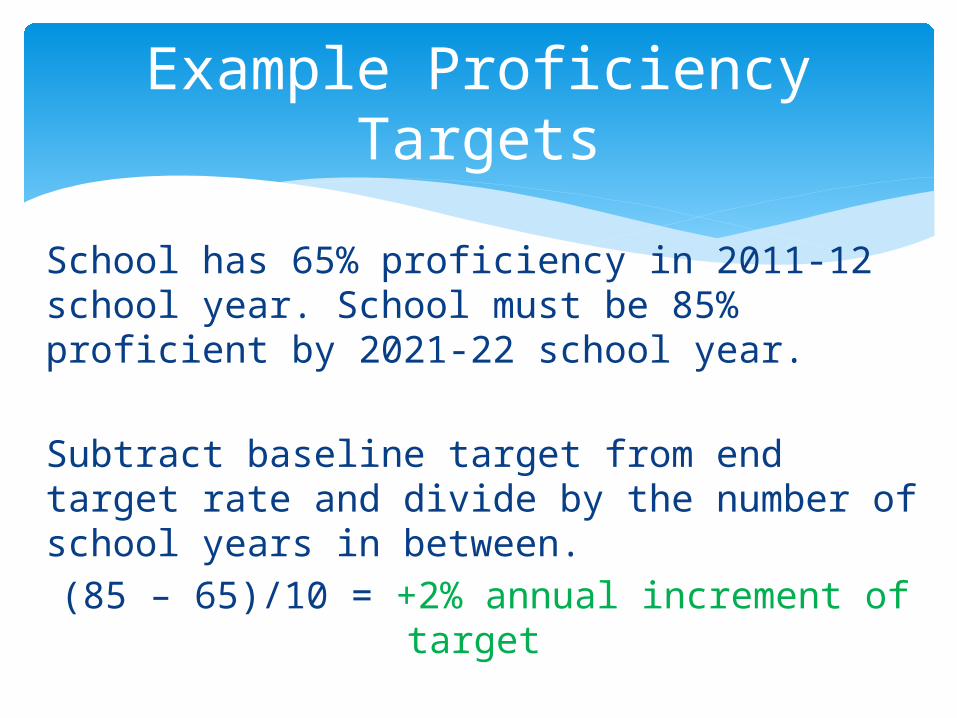
Example Proficiency Targets
School has 65% proficiency in 2011-12 school year. School must be 85% proficient by 2021-22 school year.
Subtract baseline target from end target rate and divide by the number of school years in between.
(85 – 65)/10 = +2% annual increment of target
The school’s target would be 67% in 2012-13, 69% in 2013-14, 71% in 2014-15, and so on.
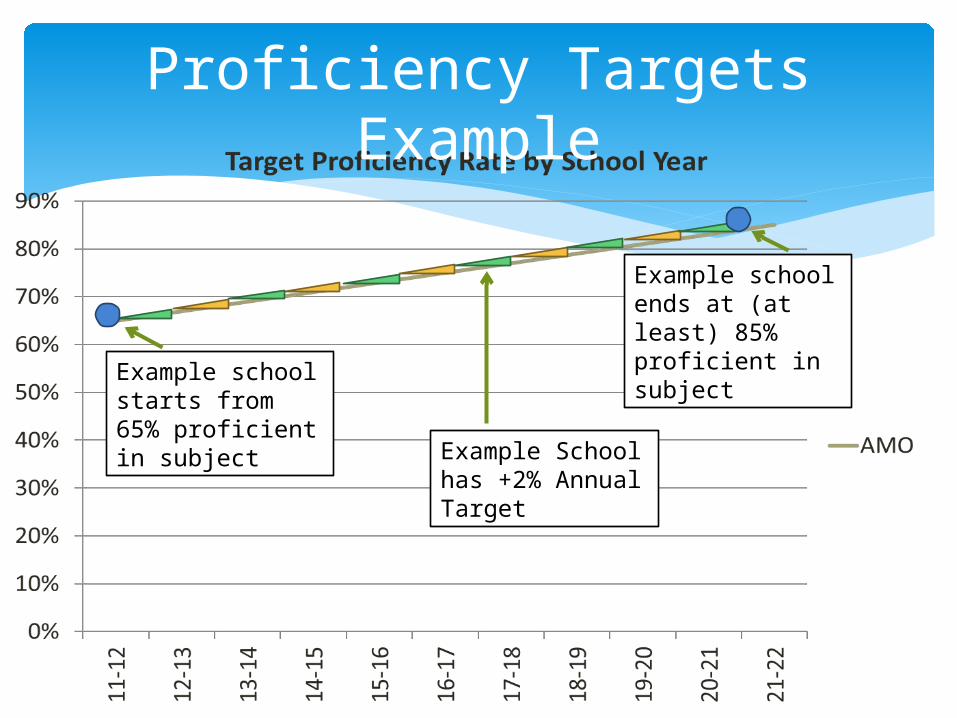
Proficiency Targets Example
Example school starts from 65% proficient in subject
Example school ends at (at least) 85% proficient in subject
Example School has +2% Annual Target
Multi-year Proficiency Calculations
Multi-year weighted proficiency averages are used in cases where a single year’s proficiency rate is not meeting the school’s target
Weighting is based on the school’s assessed enrollment in each year
Up to three years are used in this sequence:1. Calculate single year proficiency rate. Go to 2 if target is not met.2. Calculate weighted two year proficiency rate. Go to 3 if target is not met.3. Calculate weighted three year proficiency rate. Go to 4 if target not met.4. Calculate Safe Harbor. If not met, cell is red (0 points).
Proficiency “Cell” Basics
All valid subgroups will have a proficiency cell with possible points
Districts will potentially have a SEE subgroup if they are a SEE member district with at least 30 FAY SEE students
Schools and districts will always have an “All Students” group, even with one FAY student
All assessed content areas will have cells (Reading, Mathematics, Writing, Science, and Social Studies)
Proficiency Cell Colors and Points
Green cells are worth two points and are earned by meeting the school’s or district’s proficiency target
Yellow cells are worth one point and are earned by meeting the Safe Harbor target (instead of meeting the proficiency target)
Red cells are worth zero points and are earned by not meeting proficiency or Safe Harbor targets
The Bottom 30% subgroup will earn a green cell and two points by meeting the Safe Harbor target
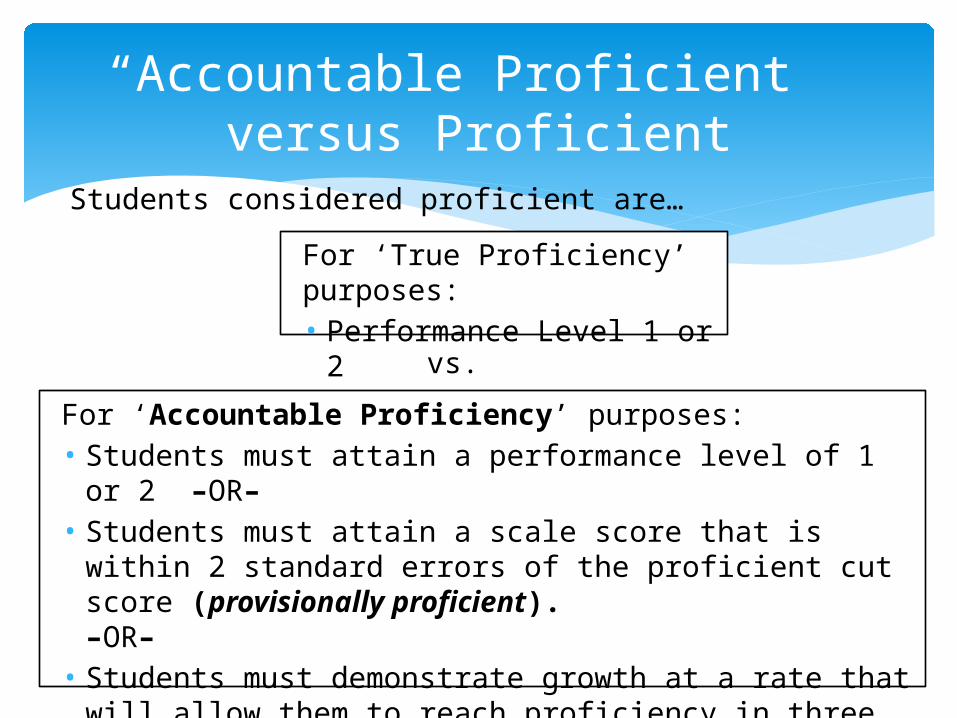
Students considered proficient are…
vs.
“Accountable Proficient” versus Proficient
For ‘True Proficiency’ purposes:• Performance Level 1 or 2
For ‘Accountable Proficiency’ purposes:• Students must attain a performance level of 1 or 2 –
OR– • Students must attain a scale score that is within 2
standard errors of the proficient cut score (provisionally proficient). –OR–
• Students must demonstrate growth at a rate that will allow them to reach proficiency in three years (growth proficient).
“Accountable Proficient” versus Proficient
Considerations:
Provisional proficiency and growth proficiency are helpful in meeting proficiency target rates but do not match your MEAP/MME raw reports and MISchoolData.
Proficiency rates in MISchoolData and on MME/MEAP reports will also be different from accountable proficiency rates because the accountable rates only reflect Full Academic Year (FAY) students at the appropriate feeder schools.
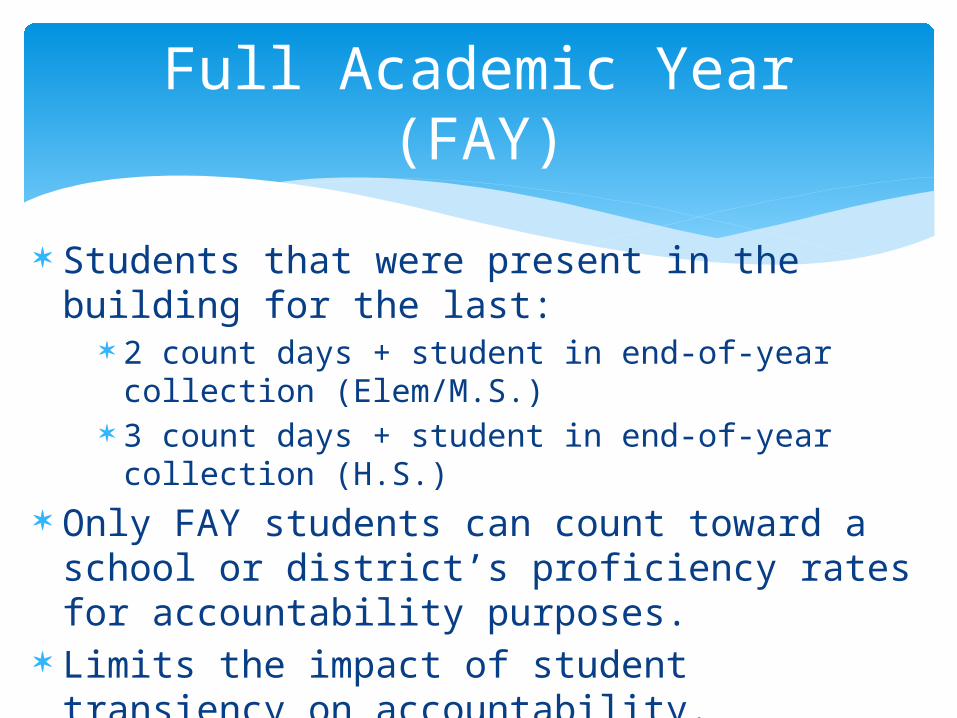
Full Academic Year (FAY)
Students that were present in the building for the last:
2 count days + student in end-of-year collection (Elem/M.S.)
3 count days + student in end-of-year collection (H.S.)
Only FAY students can count toward a school or district’s proficiency rates for accountability purposes.
Limits the impact of student transiency on accountability.
Ensures that only students that have been educated by the school/district count for proficiency.
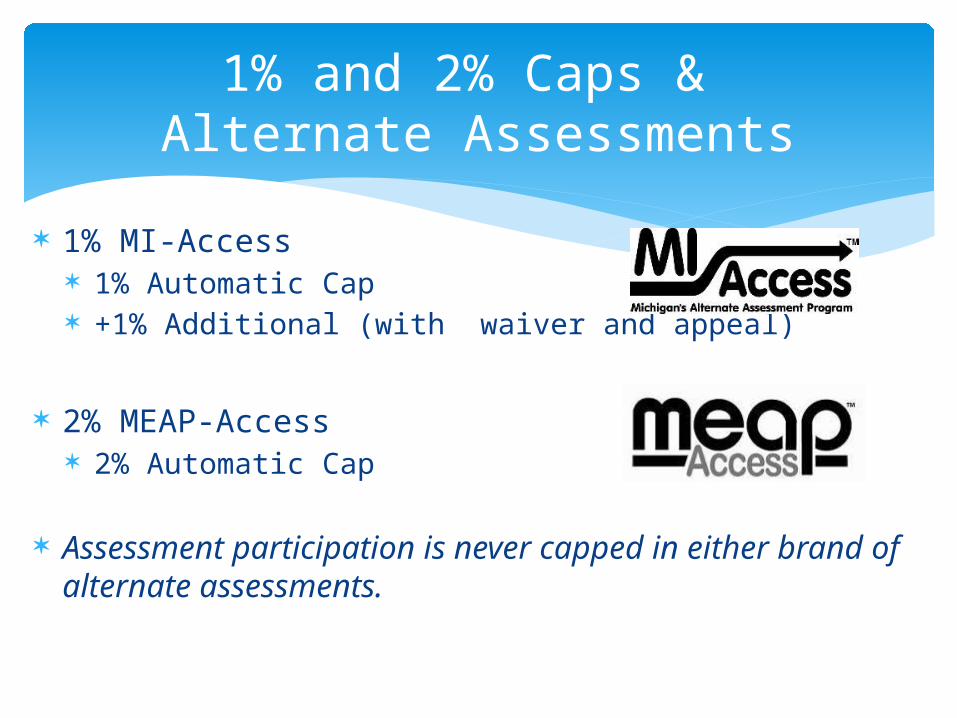
1% and 2% Caps & Alternate Assessments
1% MI-Access 1% Automatic Cap +1% Additional (with waiver and appeal)
2% MEAP-Access 2% Automatic Cap
Assessment participation is never capped in either brand of alternate assessments.
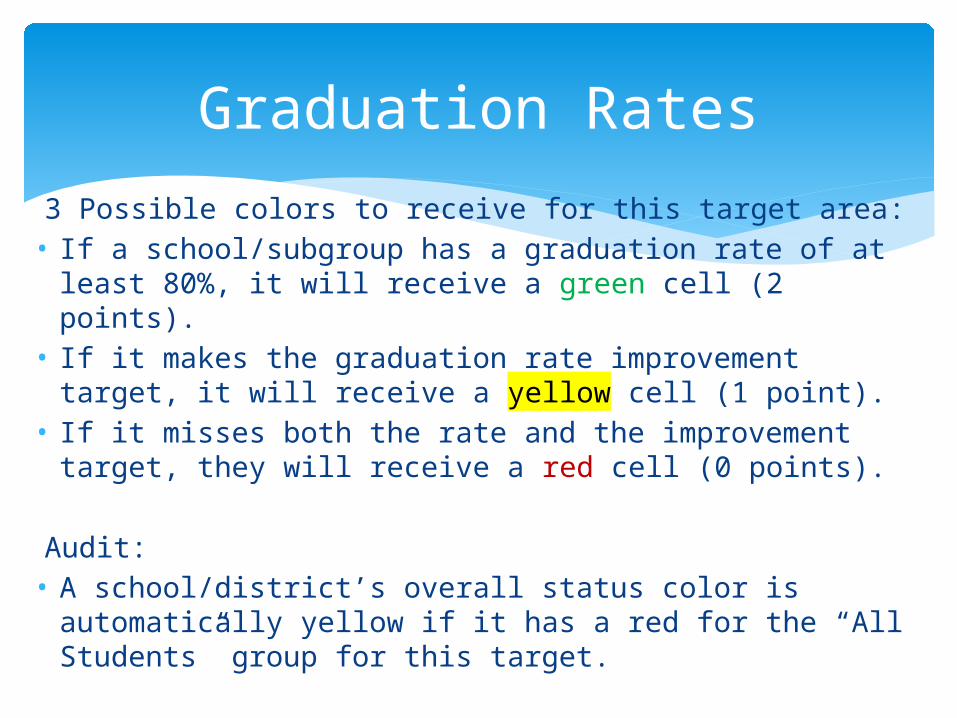
Graduation Rates
3 Possible colors to receive for this target area:• If a school/subgroup has a graduation rate of at least
80%, it will receive a green cell (2 points).• If it makes the graduation rate improvement target,
it will receive a yellow cell (1 point).• If it misses both the rate and the improvement
target, they will receive a red cell (0 points).
Audit:• A school/district’s overall status color is automatically
yellow if it has a red for the “All Students” group for this target.
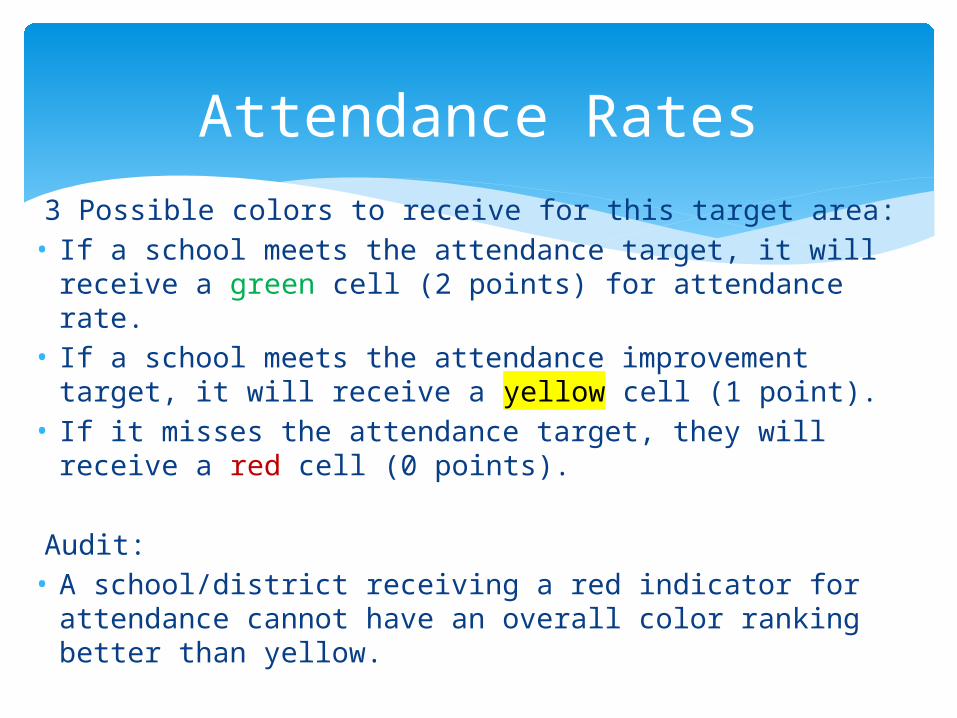
Attendance Rates
3 Possible colors to receive for this target area:• If a school meets the attendance target, it will
receive a green cell (2 points) for attendance rate.• If a school meets the attendance improvement
target, it will receive a yellow cell (1 point).• If it misses the attendance target, they will receive
a red cell (0 points).
Audit:• A school/district receiving a red indicator for
attendance cannot have an overall color ranking better than yellow.
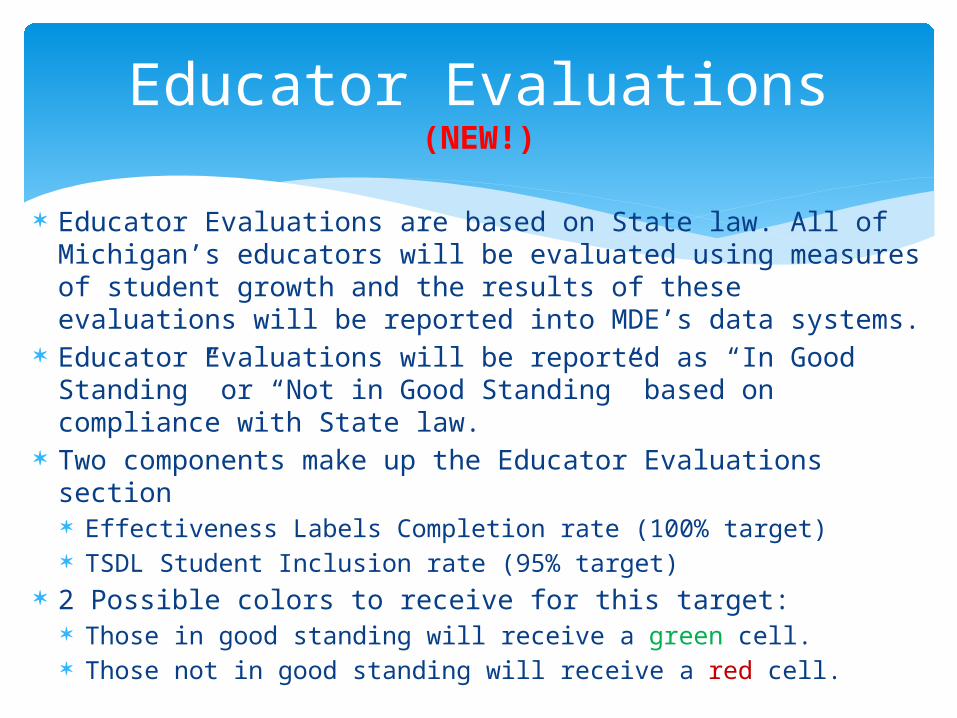
Educator Evaluations (NEW!)
Educator Evaluations are based on State law. All of Michigan’s educators will be evaluated using measures of student growth and the results of these evaluations will be reported into MDE’s data systems.
Educator Evaluations will be reported as “In Good Standing” or “Not in Good Standing” based on compliance with State law.
Two components make up the Educator Evaluations section Effectiveness Labels Completion rate (100% target) TSDL Student Inclusion rate (95% target)
2 Possible colors to receive for this target: Those in good standing will receive a green cell. Those not in good standing will receive a red cell.
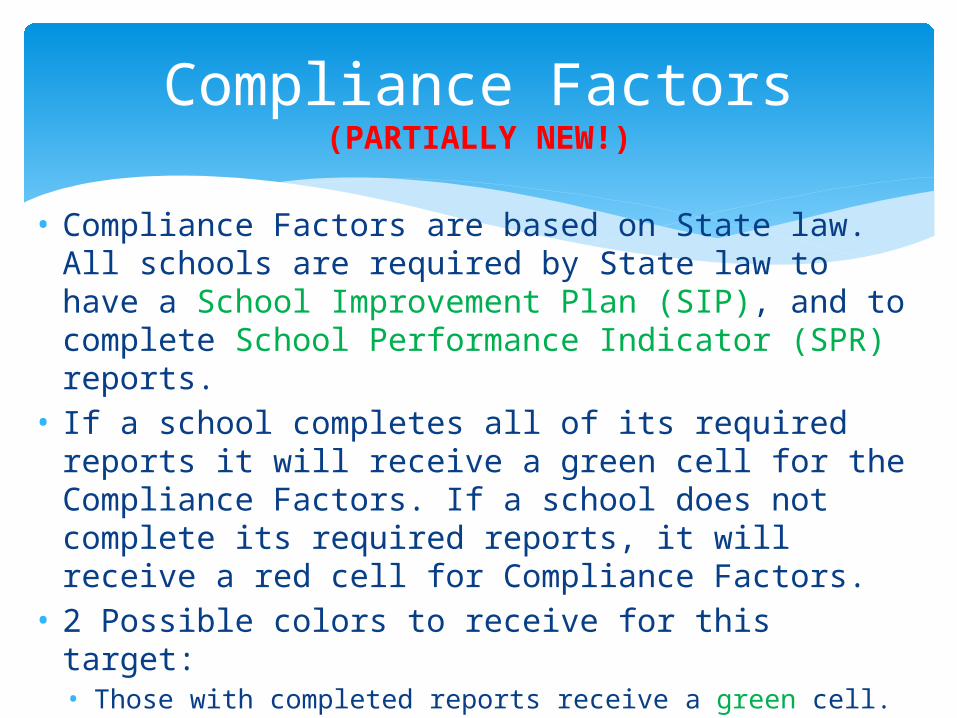
Compliance Factors (PARTIALLY NEW!)
• Compliance Factors are based on State law. All schools are required by State law to have a School Improvement Plan (SIP), and to complete School Performance Indicator (SPR) reports.
• If a school completes all of its required reports it will receive a green cell for the Compliance Factors. If a school does not complete its required reports, it will receive a red cell for Compliance Factors.
• 2 Possible colors to receive for this target:• Those with completed reports receive a green cell.• Those with incomplete reports receive a red cell.
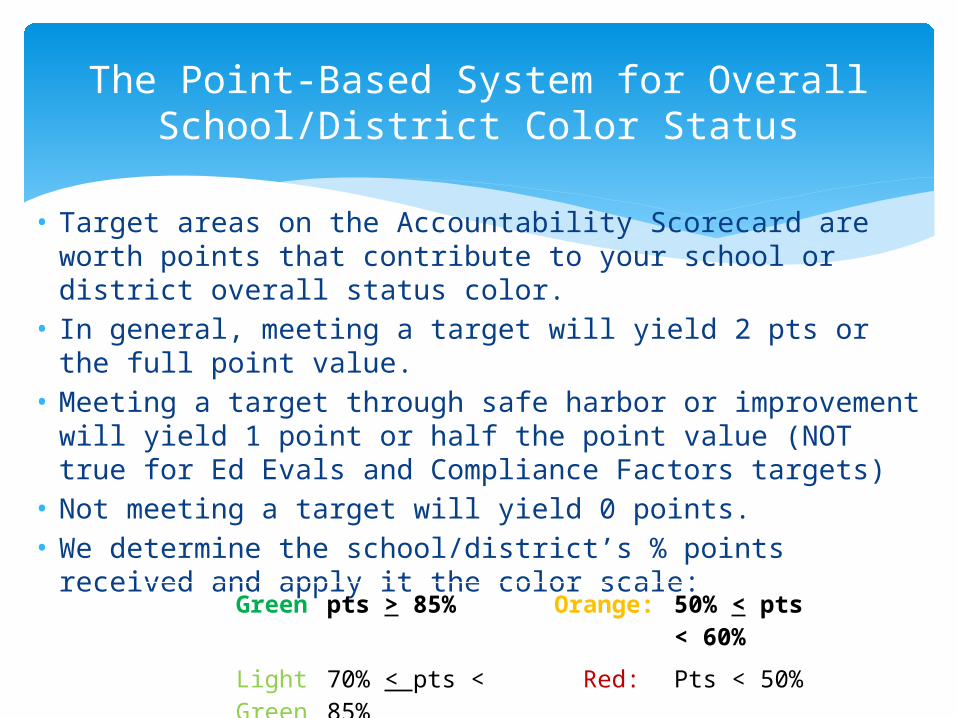
The Point-Based System for Overall School/District Color Status
• Target areas on the Accountability Scorecard are worth points that contribute to your school or district overall status color.
• In general, meeting a target will yield 2 pts or the full point value.
• Meeting a target through safe harbor or improvement will yield 1 point or half the point value (NOT true for Ed Evals and Compliance Factors targets)
• Not meeting a target will yield 0 points.• We determine the school/district’s % points received and
apply it the color scale: Green pts > 85% Orange: 50% < pts < 60%
Light Green 70% < pts < 85%
Red: Pts < 50%
Yellow: 60% < pts <70%
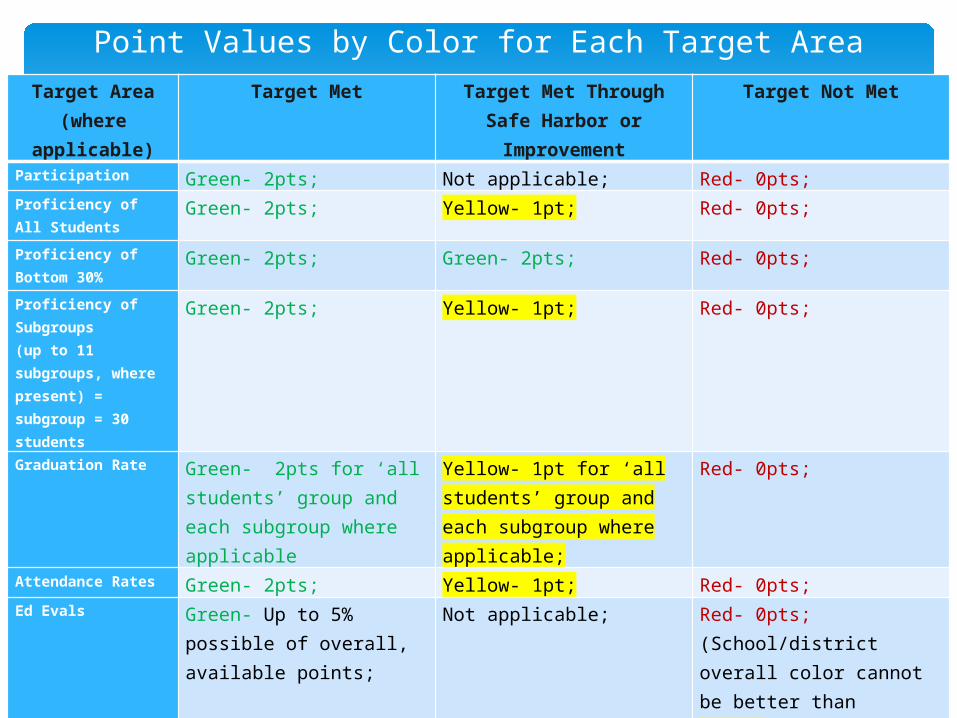
Point Values by Color for Each Target AreaTarget Area
(where applicable)
Target Met Target Met Through Safe Harbor or Improvement
Target Not Met
Participation Green- 2pts; Not applicable; Red- 0pts; Proficiency of All Students
Green- 2pts; Yellow- 1pt; Red- 0pts;
Proficiency of Bottom 30%
Green- 2pts; Green- 2pts; Red- 0pts;
Proficiency of Subgroups(up to 11 subgroups, where present) = subgroup = 30 students
Green- 2pts; Yellow- 1pt; Red- 0pts;
Graduation Rate Green- 2pts for ‘all students’ group and each subgroup where applicable
Yellow- 1pt for ‘all students’ group and each subgroup where applicable;
Red- 0pts;
Attendance Rates Green- 2pts; Yellow- 1pt; Red- 0pts; Ed Evals Green- Up to 5% possible
of overall, available points;
Not applicable; Red- 0pts; (School/district overall color cannot be better than yellow)
Compliance Factors
Green- Up to 5% possible of overall, available points;(schools/districts w/o reporting req's will receive green and 0pts)
Not applicable; Red- 0pts; (School/district overall color cannot be better than yellow)
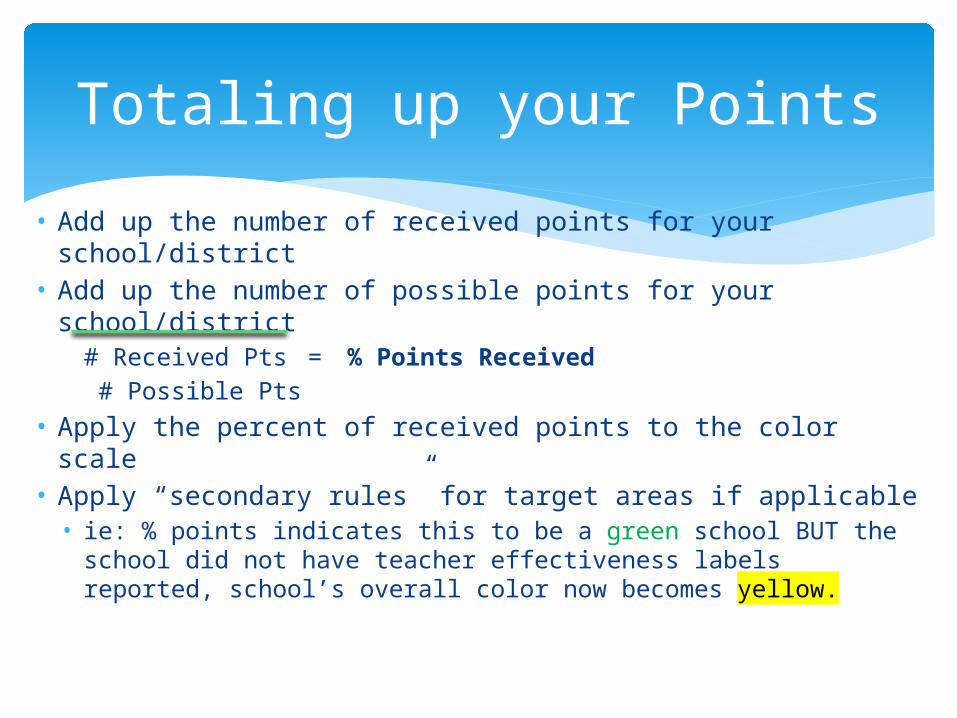
Totaling up your Points
• Add up the number of received points for your school/district
• Add up the number of possible points for your school/district # Received Pts = % Points Received # Possible Pts
• Apply the percent of received points to the color scale• Apply “secondary rules” for target areas if applicable• ie: % points indicates this to be a green school BUT the
school did not have teacher effectiveness labels reported, school’s overall color now becomes yellow.
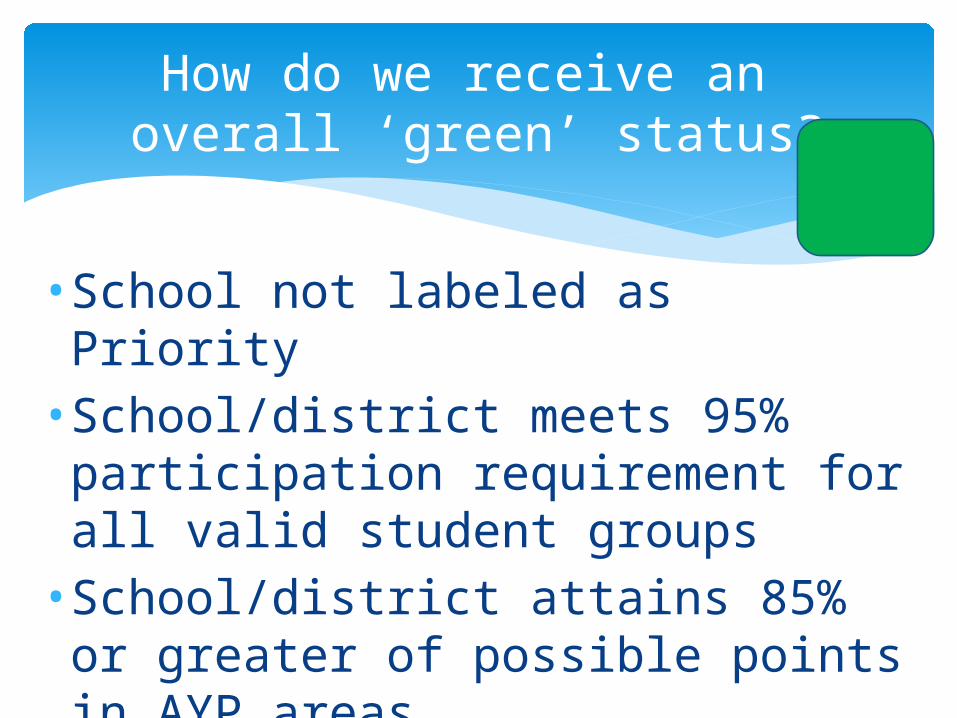
How do we receive an overall ‘green’ status?
• School not labeled as Priority• School/district meets 95% participation requirement for all valid student groups• School/district attains 85% or greater of possible points in AYP areas
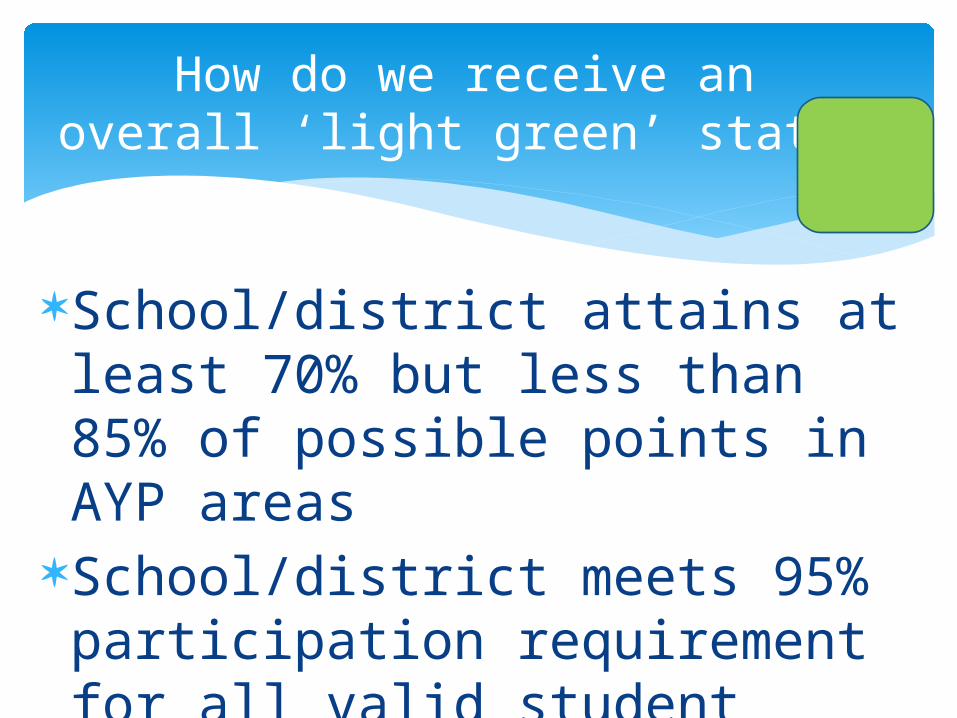
How do we receive an overall ‘light green’ status?
School/district attains at least 70% but less than 85% of possible points in AYP areas
School/district meets 95% participation requirement for all valid student groups
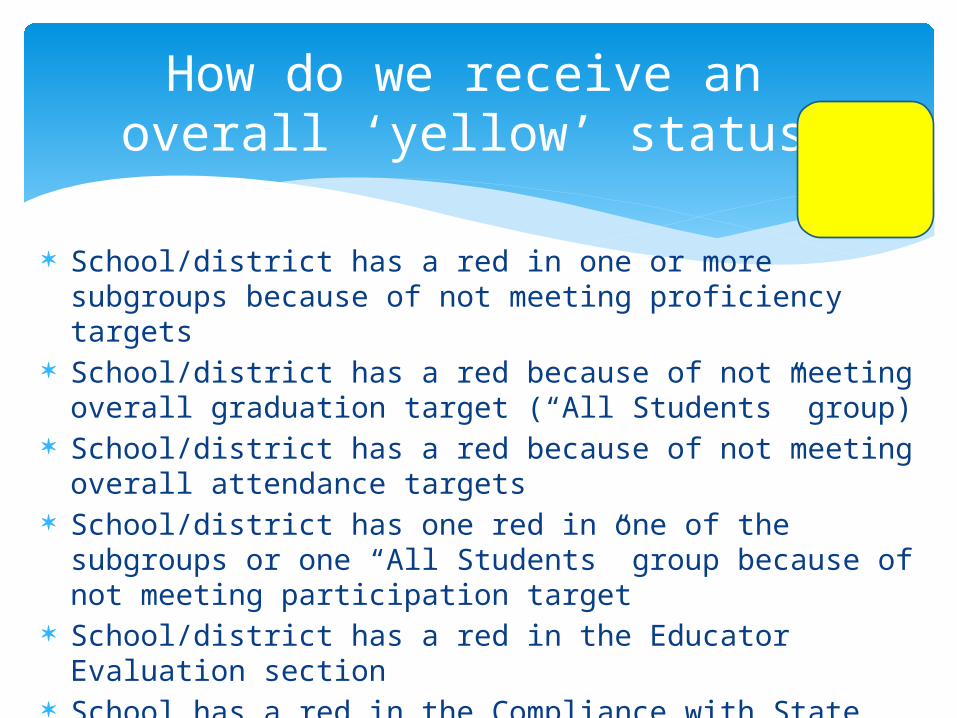
How do we receive an overall ‘yellow’ status?
School/district has a red in one or more subgroups because of not meeting proficiency targets
School/district has a red because of not meeting overall graduation target (“All Students” group)
School/district has a red because of not meeting overall attendance targets
School/district has one red in one of the subgroups or one “All Students” group because of not meeting participation target
School/district has a red in the Educator Evaluation section
School has a red in the Compliance with State Law section
School/district attains 60% but less than 70% of possible points in AYP areas
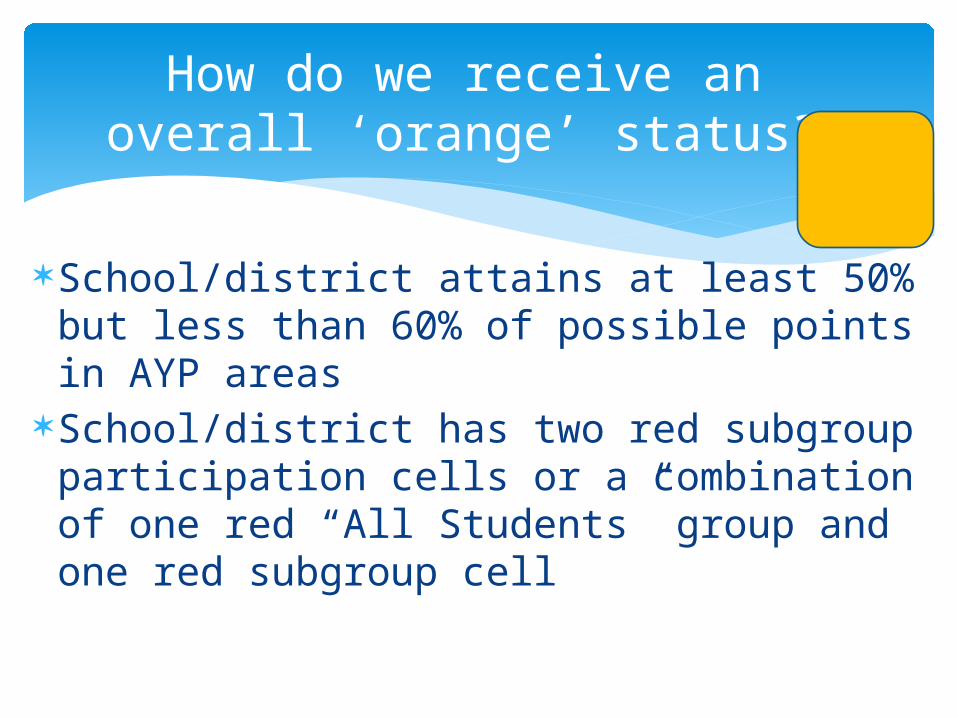
How do we receive an overall ‘orange’ status?
School/district attains at least 50% but less than 60% of possible points in AYP areas
School/district has two red subgroup participation cells or a combination of one red “All Students” group and one red subgroup cell
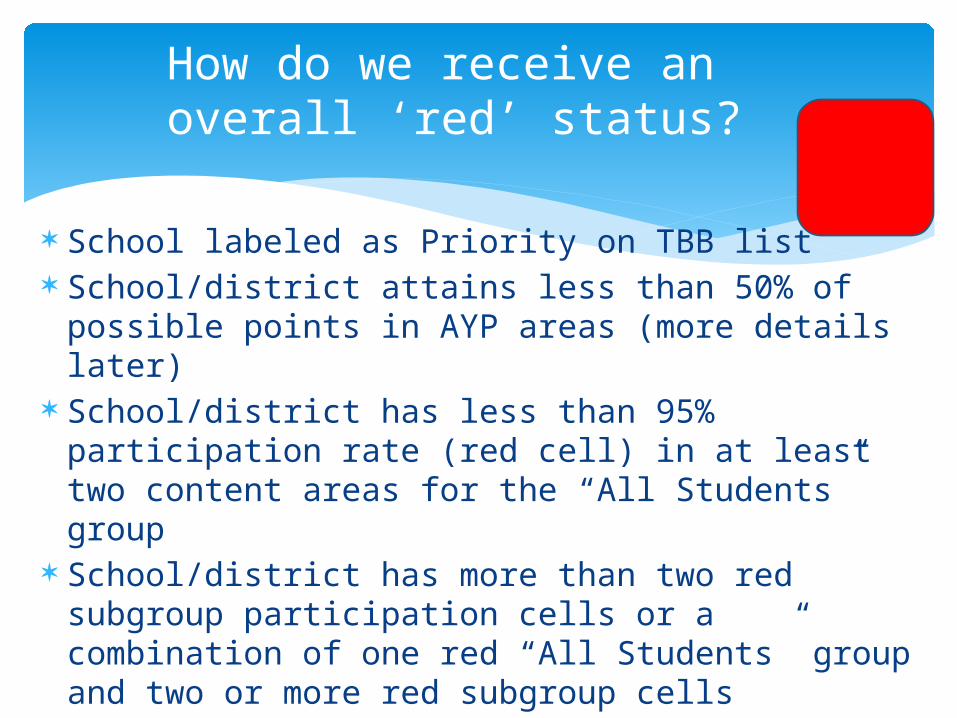
How do we receive an overall ‘red’ status?
School labeled as Priority on TBB list School/district attains less than 50% of
possible points in AYP areas (more details later)
School/district has less than 95% participation rate (red cell) in at least two content areas for the “All Students” group
School/district has more than two red subgroup participation cells or a combination of one red “All Students” group and two or more red subgroup cells
Timeline for the Accountability Scorecards
Winter 2013 – Continued development of Scorecard Website
Spring 2013 – Staff Training and Support Materials Development
Summer 2013 – Release of Preliminary and then Public Results in late June/early July
IGOR reports MEAP Item Analysis by Student either classroom or school: organizes
items by % correct and by student percentage correct MEAP AYP Targets: shows achievement for all sub groups MEAP Items by GLCE: shows strongest to weakest GLCEs by school,
district MEAP Strand Performance Across Test Cycles MEAP Strands by Proficiency MEAP Performance Level Growth MEAP Performance Levels – All Grades By Subject MEAP Performance Levels – Multi Year MME Strand Performance Across Test Cycles
BAA Reports: MEAP School Summary Report MME School Summary Report
ACT Reports: Item Analysis Reports from ACT on Plan and Explore.
Data Reports

Chew . . .

Questions? Comments?
We’re here to help!
Ask us today or contact: Lynn Batchelder
[email protected] 231.767.7223
Alecia Hoppa [email protected] 231.767.7340
Pam Varga [email protected] 231.767.7220


![PRAISE FOR CRUCIAL ACCOUNTABILITY€¦ · [Crucial confrontations] Crucial accountability: tools for resolving violated expectations, broken commitments, and bad behavior/by Kerry](https://static.fdocuments.in/doc/165x107/5f0cf5d07e708231d437fb96/praise-for-crucial-accountability-crucial-confrontations-crucial-accountability.jpg)