Michael Cueva Andrew Dartez Audrey...
127
1 Michael Cueva Andrew Dartez Audrey Guazzone Dylan Mclaughlin
-
Upload
duongkhanh -
Category
Documents
-
view
216 -
download
1
Transcript of Michael Cueva Andrew Dartez Audrey...

1
Michael Cueva Andrew Dartez
Audrey Guazzone Dylan Mclaughlin

2
Table of Contents Executive Summary 4
Industry Analysis 5
Accounting Analysis 6
Financial Analysis, Forecast Financials, and Cost of Capital Estimation 7
Valuations 9
Southwest Airlines and the Airline Industry 10
Company Overview 11
Industry Overview 13
Industry Analysis: five factors model 16
Rivalry amongst existing firms 17
Threat of new Entrants 27
Threat Of Substitutes 30
Bargaining Power of Customers 33
Bargaining Power of Suppliers 37
Value Chain Analysis 40
Firm Competitive Advantage 43
Accounting Analysis 46
Key Accounting Policies 47
Potential Accounting Flexibility 51
Actual Accounting Strategy 55
Quality of Disclosure 57
Qualitative Analysis of Disclosure 60
Potential Red Flags 69
Accounting Distorsions 72
Financial Analysis, Forecasting Financials and Cost of Capital Estimation 73
Financial Analysis 73
Liquidity Ratio Analysis 73
3
Profitability Ratio Analysis 79
Capital Structure Analysis 86
Internal Growth Rate and Sustainable Growth Rate Analysis 90
Financial Statement Forecasting 93
Cost of Capital Estimation 104
Intrinsic Valuations 109
Appendices 117
References 127
4
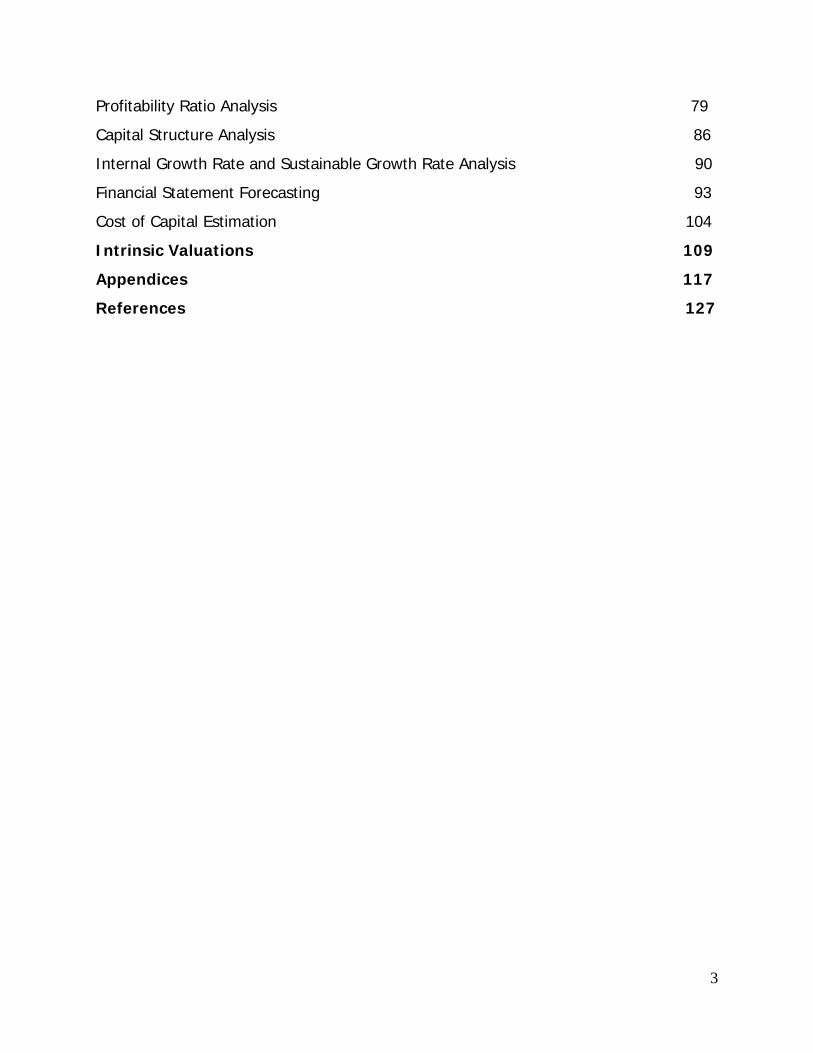
Executive Summary Investment Recommendation: Fairly Valued, Hold or Buy (6/1/2008)
SNA-NYSE (6/1/2008) Altman Z-Scores52 Week Range $11.02-$16.96 2003 2004 2005 2006 2007Revenue $10,190 M. Initial 3.01 2.42354 2.05 2.4 1.77Market Capitalization $9,750 M.Shares Oustanding 731.76 M.
Market Price (6/1/2008) $13.06
Book Value Per Share 9.819 Comparable Base Valuations Initial ROE 8.53% Trailing P/E 19.22ROA 4.35% Forward P/E 43.533
P.E.G. 1.3729Cost of Capital P/B 1480Estimated R- Squared Beta KE P/EBITDA 1.109453-Month 0.142768602 0.8382854 0.0091812 P/FCF 0.011256-Month 0.142720361 0.8382393 0.0091977 EV/EBITDA 11.03232-Year 0.14258317 0.8376626 0.00920852 D/P 7405-Year 0.142314764 0.836673 0.0093056510-Year 0.142012366 0.8356908 0.00940268 Intrinsic Valuations
Price Range on Initial Dividends $0.02Alternative Estimate 10.44% (Backdoor Method) Free Cash Flows -Published Beta 0.83828544 Residual Income 8.44Cost of Debt 4.66% L.R. ROE RI 9.45WACC (BT) 7.05% A.E.G. 8.56

5
Industry Analysis
Southwest Airlines Company is a major domestic airline that provides point to
point, low fare service. Southwest is headed by Gary C Kelly. It employs a relatively
simple fare structure, featuring low, unrestricted, unlimited, everyday coach fares, as
well as lower fares available on a restricted basis. Southwest currently flies to 64
destinations throughout the United States with more than 3,300 flights a day. The firm
is the primary example of an airline that still uses the point to point transit model.
Currently, however, Southwest Airlines actually uses a hybrid system, flying point to
point routes, but also connecting passenger through several smaller hubs. The company
and its third-party maintenance providers are subject to the jurisdiction of the Federal
Aviation Administration with respect to maintenance and operations.
Southwest was incorporated in Texas in 1967 but obtained the right to fly after a
three year legal battle, which is considered by many to be the beginning of deregulation
in the airline industry. Southwest commenced Customer Service on June 18, 1971, with
three Boeing 737 aircraft serving three cities- Dallas, Houston and San Antonio.
Southwest turned its first annual profit in 1973, and has done so every year since.
Southwest has used financial techniques such as fuel hedging to bolster its profitability
and counteract many of the fiscal disadvantages of operating an airline.
Existing firms compete in an almost cost control industry with a minimal level of
differentiation. The success and profitability of Southwest’s overall cost leadership
strategy led to a common trend being named the Southwest Effect. Indeed, Southwest
entered the airline market, and the market itself changed. The number of customers
augmented significantly. Direct competitors of Southwest Airlines include JetBlue,
American Airlines and Continental.
The airline industry is extremely competitive. Rivalry is intense. The U.S. airline
industry has been in a chaotic state for a number of years. It is now a stagnant industry

6
where the concentration is changing according to the recent mergers and alliances.
Companies face increased exposure to the raw oil market every year. This is not a good
sign for the airlines, which are also facing tough competition for US legacy carriers that
have lowered cost through bankruptcy. With the market already over-saturated,
operating limits, and the start up costs being high, the threat of new entrants is low.
However, the threat of substitutes is medium because advantages like speed, service,
and routes provided by planes seem to be considerable compared to substitutes.
However, the relative price performance of trains could be a major threat in a decade
for regional airlines. Buyers’ power is medium/high due to low switching costs, price
sensitivity, standard product, information access, a large number of buyers and low
volume purchases. Finally, suppliers’ power is very high because only Boeing and Airbus
provide planes, and the oil price is increasing.
To be successful, an airline must be effective in three general areas. They need
to attract customers and the ticket price is by far the most significant factor in
attractiveness. Managing its fleet with a cost efficiency control system is essential.
Finally airlines have to be very innovative to try to differentiate themselves from their
competitors.
Accounting Analysis
In order to evaluate a company properly, it is important to look meticulously at
the company’s financial statements. To provide a precise valuation, it is essential to
question how transparent these financials are. The degree of disclosure by the company
is important when evaluating the financial statements. Full disclosure will give a more
accurate picture of the company. Many companies try to hide key information in order
to make the company more appealing to potential investors. There are many ways a
company can manipulate their financials even though they are regulated by the SEC.
This practice makes it complicated for investors or shareholders to have a clear
accurate view of the company. It also makes it difficult for an analyst to have a clear
outlook of the firm in order to make a fair valuation of it.

7
Southwest had a high-level of disclosure when it came to their information on
their 10k. They key accounting policies for Southwest Airlines include: revenue
recognition, fuel hedging, capital and operating leases, and retirement and pension
plans. Accounting policies that directly correlate with the identified success factors are
revenue recognition, fuel hedging practices, capital and operating leases, and
retirement and pension plans. Southwest recorded unearned revenue as air traffic
liabilities on the balance sheet before it records it as passenger revenue on the income
statement. It is finally allocated when the passenger is on the plan and the plane has
taken off. Southwest along with many of its competitors practice this accounting when
recording unearned revenue. This accounting practice is in accordance with GAAP, but
can be distorted by managers in order to make their financials look attractive. They
accounted for rising price of fuel in their fuel hedging analysis. They stated their prices
and how they were going to deal with them now and in the future. In the case of
capital and operating leases, it is straight forward; 86 of the 95 planes Southwest leases
are classified as operating leases while the other 9 are classified with capital leases.
The overall accounting strategy for Southwest’s financial statements was fairly
conservative. The accounting had little or no room for any discrepancies leaving no
information out. They explained why they placed line items on their financials.
Financial Analysis, Forecast Financials, and Cost of Capital Estimation
Financial Analysis
When analyzing a firm, potential shareholders look at three main areas to predict
the strength of any given firm. These areas include: a firm’s liquidity, profitability, and
capital structure. With applying useful ratios and trends that can be determined from
past as well as current transactions, the potential shareholder can therefore be able to
make a better and well informed decision on his/her upcoming investment.

8
Liquidity
Southwest’s current ratio and quick ratio have been decreasing since 2006. The
impact on liquidity is not favorable. With a current ratio of less than 1 and a quick ratio
of .63 it seems that the company has more difficulty covering its current liabilities from
the cash realized on the current asset account. However, the entire industry is affected
by low current and quick ratios, but Southwest seems to stand alone by having a higher
365/receivables turnover which helps it receive cash realized on credit accounts faster
than its competitors.
Profitability
Like the liquidity ratios, the airline industry all follows the same trends in
profitability ratios. The Net profit margin, gross profit margin, and the operating profit
margin are all very low. However, Southwest seems to always stay on top of the
competition by their superior operating efficiency. The reason they continually best the
other competitors in the industry is due to their primary focus on cost reduction.
Keeping costs down creates the potential for greater profit margins, which is
Southwest’s main competitive advantage.
Capital Structure
The three capital structure ratios that Southwest was evaluated on were the debt to
equity ratio, times interest earned, and the debt service margin. Overall, Southwest
usually tends to follow the industry average when it comes to these ratios as pertaining
too closely relating its financial activities through debt and equity outsourcing. However,
they by far exceed their competition in the debt to equity category by generating large
surpluses of cash (from operations) than needed to cover their liabilities.
Forecast Financials/Cost of Capital Estimation
9
To forecast Southwest’s financial accounts for the following ten years ending in
2017, we used our financial ratios, industry averages and trends, and growth rates
within the company pertaining to patterns that we saw fit. Along with these three
forecasting techniques, we used our extensive knowledge of the company’s future
strategies pertaining to cost efficiency tactics and fuel hedging techniques. This
information also played a vital role in our predictions of forecasting growth stunts and
rapid expansions.
To find the cost of equity we used an alternative method which resulted
in10.44% for both before and after taxes. We then calculated the cost of debt to be
4.66% for both before and after taxes. In secession we concluded the weighted
average cost of capital before tax to be 7.05% and after tax to be 5.99%.
Valuations
The purpose of an equity valuation is to value a company’s stock price,
determining if it is under, over, or fairly valued. By using financial ratios, accounting
skills and an exquisite knowledge of the industry to be possibly invested in, potential
stockholders can help better their chances of profitable investments.
After valuing Southwest Airlines through the use of intrinsic valuation models, we
determined there were three particular models that were appropriate for the valuation
of the company. The models used were; the residual income model, the long-term
residual income, and the abnormal earnings growth model. Through the use of these
models we were able to value Southwest’s share price with the respective models as
follows; $8.44, $9.45, and $8.56. Each of Southwest’s share prices was determined
using a cost of equity of 10.44% and a 0% perpetuity growth rate. Comparing the
values of the intrinsic valuations models to the June 1, 2008 share price of $13.06 it can
be concluded that Southwest Airlines is overvalued, and the option is to sell.
10
Southwest Airlines and the Airlines Industry
Southwest Airlines (LUV) is a Dallas, Texas based airlines. The airline was
established in 1971by Rollin King and Herb Kelleher with the notion of cheap, no-frills
flights. The airlines had originally three destinations; San Antonio, Houston, and Dallas.
Southwest’s objective market was and still is medium to high frequency business
travelers (grabers.com). Southwest operates in the national category of the Airline
industry, which means it only flies nationally not internationally. Southwest’s home
base is still Dallas, Texas; it has not changed from the 1970’s. Southwest flies to 64
destinations in 32 states and has a fleet of 532 planes, 95 of which are leased.
Competitors of Southwest are American Airlines, Continental, and JetBlue. The
rivalry amongst firms is high for this industry. Firms are competing for brand image
whether it be cheaper flights, state of the art planes, or faster check-in time. The airline
industry has a very high level of competition between existing firms with low or no
switching costs for the customer. Threat of new entrants is low for this industry
because of large economies of scale with low or no exit barriers. Price drives customers
in this industry, this leads to high threat of substitute products. The firms try to create
competitive advantages over one another in order to be number one.
Southwest has had to focus on numerous tactics in order to stay a competitor in
this industry. They looked at their customer base, which is mostly made up of one day
business travelers, and thought what was most important to them. After giving it some
thought, Southwest came to realize that convenience is a very important factor to its
travelers, so they felt it was important to implement that in their airports and on their
website. Now a customer can check-in online so they can avoid the checking lines, pay
a little extra and get seated first on the plane, or even charge their mp3 player while
waiting to board their plane. It also helps that Southwest puts a huge of emphases on
price, which helps them stay ahead of the curve. Southwest is trying to build a

11
competitive advantage so it can distinguish itself easily from other firms in the airline
industry.
Company Overview
Southwest Airlines (LUV) is a competitor in the National airline industry. “Based
on the most recent data available from the U.S. Department of Transportation (“DOT”),
Southwest is the largest air carrier in the United States, as measured by the number of
originating passengers boarded and the number of scheduled domestic departures
(Southwest 10K).” Southwest is a Texas-Based airline that was developed in the late
1960’s on the grounds of offering customers discounted flights. Rollin King and Herb
Kelleher founded Southwest Airlines, the airline had originally been named Air
Southwest but changed shortly after in 1970. In the early days, the airline only flew to
and from three cities in Texas; Dallas, Houston, and San Antonio. The airline offered a
no frill, short flight to three destinations, this business approach has helped with the
continuing growth of Southwest. Today, Southwest flies to and from 64 cities in 32
states, with a fleet size of 532. In 2007 Southwest has recommenced service to and
from San Francisco. However, Southwest has recently slowed their growth plan in 2008
because of the rising fuel costs.
(www.wikinvest.com/stock/southwest_airlines)

12
The total sales growth of southwest for 2007 was 8.5% (AOL Finance).
(In Thousands) 2002 2003 2004 2005 2006 2007
Assets
8,954.00
9,878.00
11,337.00
14,218.00
13,460.00
16,772.00
Sales
5,522.00
5,937.00
6,530.00
7,584.00
9,086.00
9,816.00
Stock Price
13.90
16.14
16.28
16.43
15.31
12.20
Southwest competes with many other companies in the airline industry. Competitors
with southwest include American Airlines (AMR), Continental (CAL), and JetBlue (JBLU).
Southwest competes more directly with JetBlue because both airlines are more regional
than international. Both are similar when it comes to flight destinations.

13
Industry Overview
The airline industry changed the way people traveled the world. The airline industry is
made up of four different types of categories. These categories include
• International - 130+ seat planes that have the ability to take passengers just
about anywhere in the world. Companies in this category typically have annual
revenue of $1 billion or more.
• National - Usually these airlines seat 100-150 people and have revenues
between $100 million and $1 billion.
• Regional - Companies with revenues less than $100 million that focus on short-
haul flights.
• Cargo - These are airlines whose main purpose is to transport goods
This industry exists in a highly competitive market (Investopedia.com). The airline
industry is also affected by other factors. These factors can range from bad weather to
the rising costs of fuel, to government regulations on safety or noise pollution.
Southwest competes for the most part in the national category of the airline industry.
The international category would classify airlines similar to American Airlines and United
Airlines. The regional category would classify airlines similar to JetBlue. The cargo
category would classify companies similar to FedEx and UPS. All of these categories that
classify the airline industry are highly competitive with themselves and with each other.
They each intertwine with each other in way or another.
14
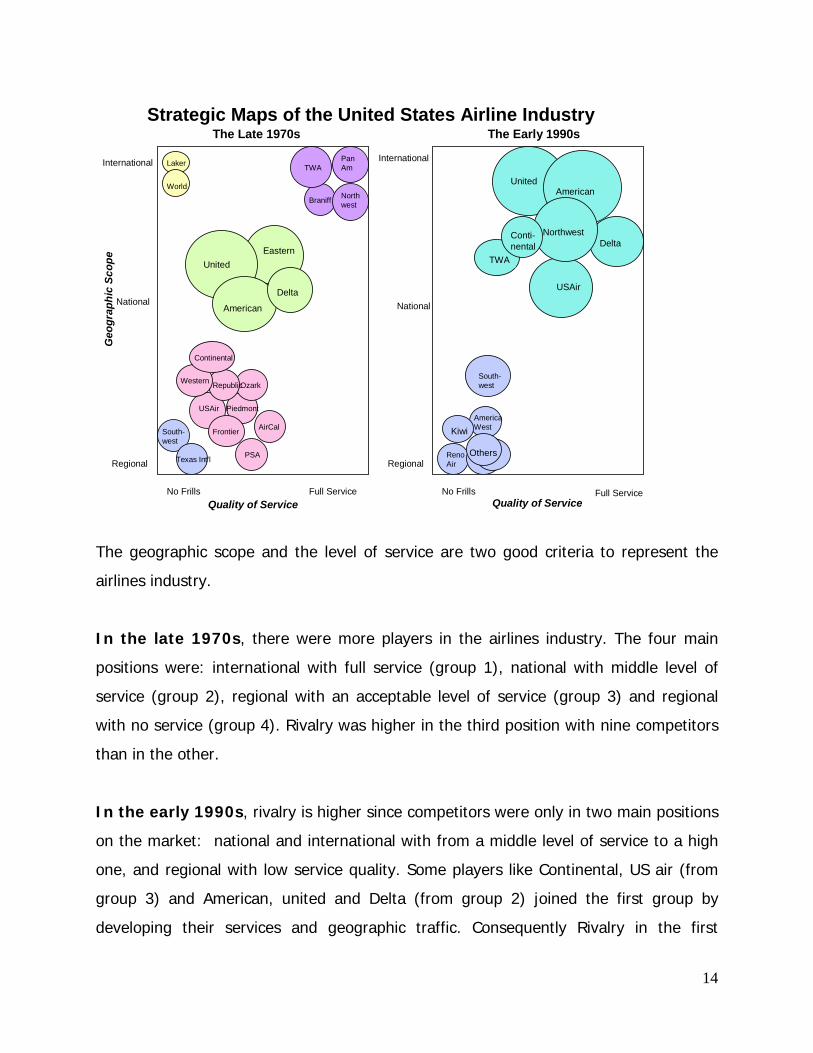
The geographic scope and the level of service are two good criteria to represent the
airlines industry.
In the late 1970s, there were more players in the airlines industry. The four main
positions were: international with full service (group 1), national with middle level of
service (group 2), regional with an acceptable level of service (group 3) and regional
with no service (group 4). Rivalry was higher in the third position with nine competitors
than in the other.
In the early 1990s, rivalry is higher since competitors were only in two main positions
on the market: national and international with from a middle level of service to a high
one, and regional with low service quality. Some players like Continental, US air (from
group 3) and American, united and Delta (from group 2) joined the first group by
developing their services and geographic traffic. Consequently Rivalry in the first
Strategic Maps of the United States Airline Industry
Braniff
TWA
EasternUnited
American
Delta
Western RepublicOzark
USAir Piedmont
Frontier AirCal
PSA
South-west
Texas Int’l
United
South-west
AmericaWest
International International
National National
Regional Regional
No Frills No FrillsFull Service Full ServiceQuality of Service Quality of Service
Geo
grap
hic
Scop
e
The Late 1970s The Early 1990s
RenoAir
Continental
PanAm
Northwest
Laker
World American
TWA
Delta
USAir
NorthwestConti-nental
Kiwi
Others

15
position became higher with a total of seven players. Some players disappeared from
the 70s to the 90s. Western airlines was purchased by Delta Air Lines in 1986 and after
the merger, Delta released the name Western airlines. Another example is Texas Air
Corporation which had been spilt up with parts sold to Scandinavian Airlines System,
Ross Perot's EDS (Electronic Data Systems), and an Air Canada-led investment group.
New players also, like Kiwi travel international Airlines, came in the industry. Rivalry in
the second group in the 90s became also very strong. Cost leadership was the main
strategy for those firms that provided short air travels. Southwest airlines tried to create
a gap with a more expanded network geographically and a higher level of service than
the group 2 competitors. It was this same strategy that made the firm able to join the
group 2 in the early 90s. In fact, differences in management styles, skills set and
strategic perspectives create advantages and disadvantages. Southwest airlines has
become phenomenally successful and an industry leader. For year q it went virtually
unchallenged. But Southwest costs have crept up, and now start up airlines such as jet
blue are challenging the industry leader with their own low cost strategies. This is
indicative of the competitive dynamic cycle.
16
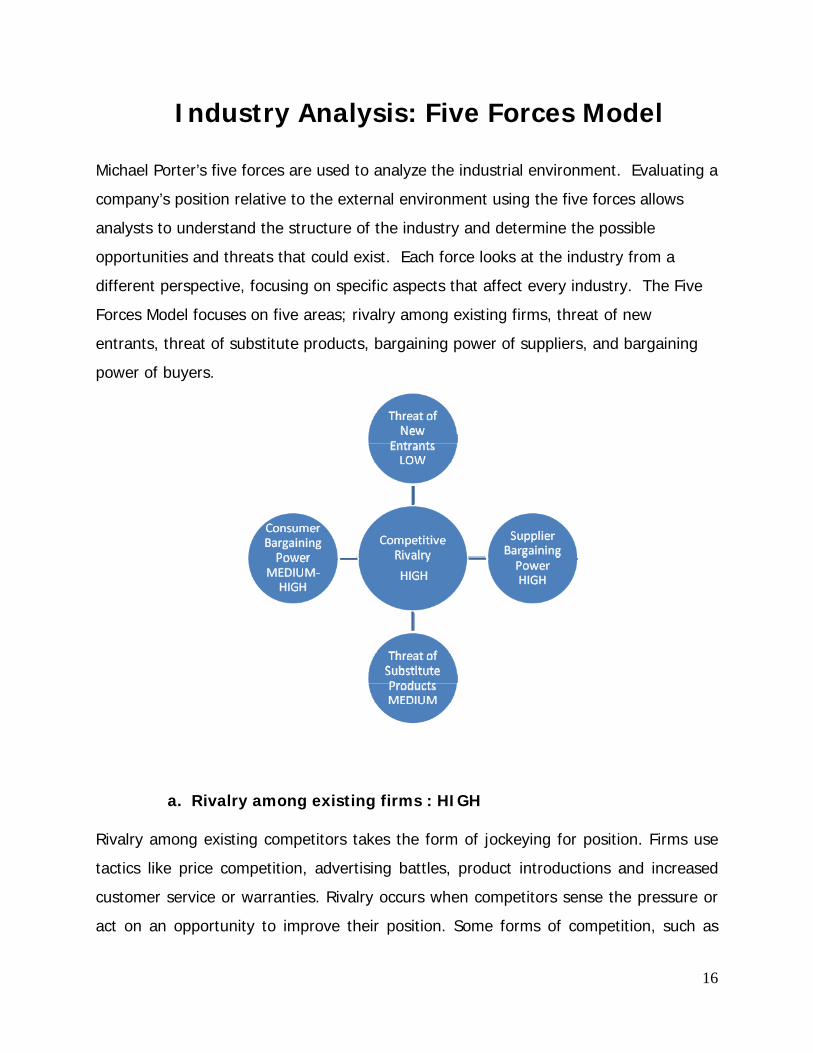
Industry Analysis: Five Forces Model Michael Porter’s five forces are used to analyze the industrial environment. Evaluating a
company’s position relative to the external environment using the five forces allows
analysts to understand the structure of the industry and determine the possible
opportunities and threats that could exist. Each force looks at the industry from a
different perspective, focusing on specific aspects that affect every industry. The Five
Forces Model focuses on five areas; rivalry among existing firms, threat of new
entrants, threat of substitute products, bargaining power of suppliers, and bargaining
power of buyers.
a. Rivalry among existing firms : HIGH Rivalry among existing competitors takes the form of jockeying for position. Firms use
tactics like price competition, advertising battles, product introductions and increased
customer service or warranties. Rivalry occurs when competitors sense the pressure or
act on an opportunity to improve their position. Some forms of competition, such as

17
price competition, are typically highly destabilizing and are likely to erode the average
level of profitability in an industry. Rivals easily match price cuts, an action that lowers
profits for all firms. On the other hand, advertising battles expand overall demand or
enhance the level of profit differentiation for the benefit of all firms in the industry.
The US airline industry is a highly competitive and sensitive market. Recently the
merger between Delta and Northwest airlines has heightened the level of
competition in the fight for market share. Competition in the industry has also been
altered by the creation of larger airplanes, a slowing economy and the demand for
cheaper airfare, as well as developing technology, including onboard Wi-Fi internet
access (WSJ 2008). Competitive rivalry is affected by many different factors, these
include: Industry growth, level of concentration, differentiation, switching costs,
economies of scale, fixed and variable costs, excess capacity, and exit barriers.
Industry Growth
The level of industry growth determines whether or not a firm must seek to obtain
market share or not. The airline industry in the United States has grown to become
one of the major modes of transportation for many Americans. According to the
Bureau of Transportation Statistics, there were 735 million passengers on US
domestic flights, up 11.4% from the previous year. With such a large increase in
the number of passengers each year revenues have also increased.

18
The chart above shows a constant growth in sales revenues for the past five years.
Each year has been greater than the next, which is a good indicator of growth
within the industry. While the number of flights is increasing, the relative growth in
sales has not increased at such a strong rate.
0
10000
20000
30000
40000
50000
60000
70000
80000
90000
100000
2003 2004 2005 2006 2007
Airline Industry Operating Revenue (millions)
0
2
4
6
8
10
12
2003 2004 2005 2006 2007
Industry Sales Growth (%)

19
Industry revenues have increased by an average of 7.67% each year for the last 5
years. While each company’s increase varies from year to year the average rate of
increase has started to slow. However the overall growth rates are still strong and
there has been no sign that sales will start declining. Although revenues increase
over recent years so have expenses.
Expenses across the industry over the past 4 years have increased by an average
9.9% per year. With operating expenses increasing at the same rate as operating
revenues creating increased profits is made difficult. As expenses increase the
industry looks toward cost cutting methods in order to increase profit potential.
With jet fuel prices on the rise expenses for airlines are increasing drastically. Just
this year the price of jet fuel has increased from $850 per metric ton to $1300.
With such a large increase in price jet fuel is the second largest expense for most
airline companies, consisting of an average 34% of all expenses (WSJ 2008).
With high ticket prices and a dismal economy, airliners are looking at alternative
ways to cut cost rather than just making the consumer pay for the difference.

20
Recently UAL announced that it will be cutting 70 jetliners from its fleet in lou of
the jet fuel price increase. UAL also announced that it would be cutting routes that
it deemed no longer profitable, a strategy that AMR Corp. already acted upon (WSJ
2008).
With expenses so high, losses in the airline industry are expected to hit $2.3 billion
(Dallas Morning News 2008). Such loses aren’t uncharacteristic in the airline
industry.
In the case of most airlines profits have occurred with similar frequency to losses.
Such an industry could only be described as stagnant. The graph above shows an
income curve that is virtually horizontal, meaning that the level of growth in the
industry is very small. With the exception of Southwest Airlines, every airline
company has reported a loss at year end in a least one of the past 5 years. With
such unstable earnings it makes it hard for an industry to strive. Such factor lead to
price wars, these have been evident in the airline industry for quite some time.
Recent mergers are evidence that the industry is stagnant also, because they

21
intend to take market share, the only way to grow in such an industry.
Concentration
Concentration within an industry compares the number of firms in an industry as
well as their relative size to the market. The concentration level in the Domestic
airline industry is reasonably low; market share is divided by many different
companies, neither having any considerable control over the majority. The result is
high price competition because there are a large number of competitors all
competing for the same customers.
The information above reveals that there are four dominant companies in the
industry; Delta and Northwest (after merger), AMR (American), Southwest, and
UAL (United). These four companies only control about 56% of the market, which
only goes to show how fragmented the industry really is. Another indicator of the
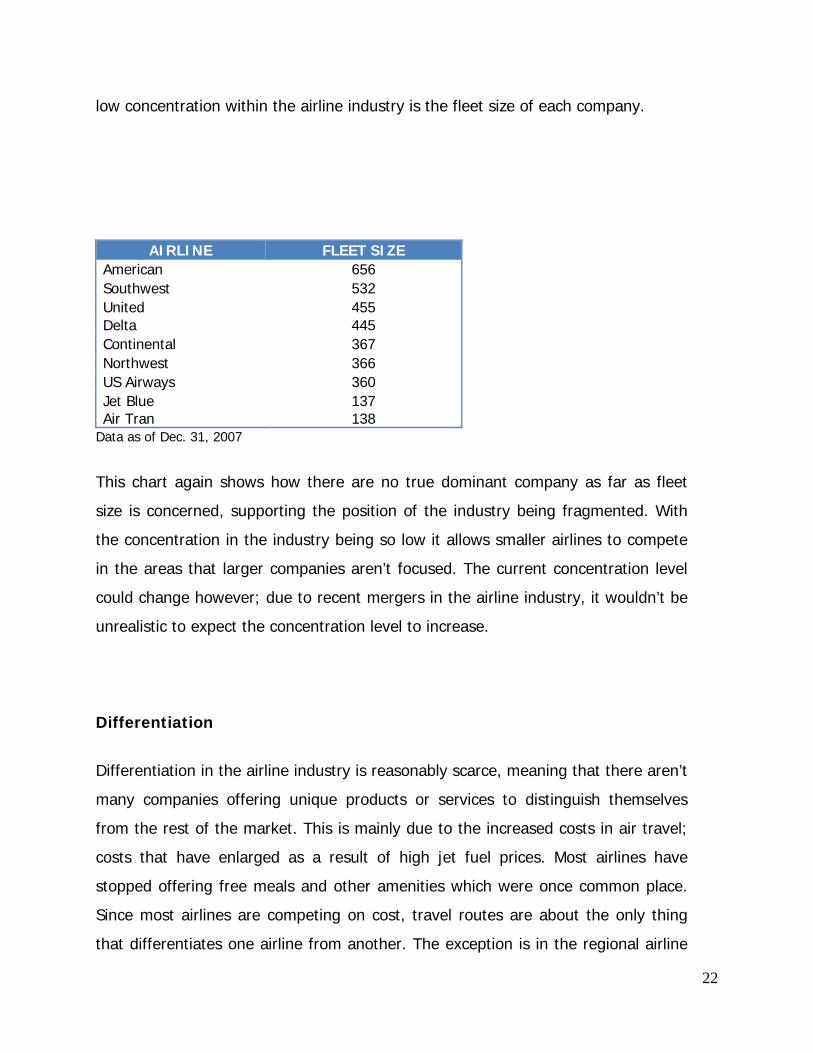
22
low concentration within the airline industry is the fleet size of each company.
AIRLINE FLEET SIZEAmerican 656Southwest 532United 455Delta 445Continental 367Northwest 366US Airways 360Jet Blue Air Tran
137138
Data as of Dec. 31, 2007
This chart again shows how there are no true dominant company as far as fleet
size is concerned, supporting the position of the industry being fragmented. With
the concentration in the industry being so low it allows smaller airlines to compete
in the areas that larger companies aren’t focused. The current concentration level
could change however; due to recent mergers in the airline industry, it wouldn’t be
unrealistic to expect the concentration level to increase.
Differentiation
Differentiation in the airline industry is reasonably scarce, meaning that there aren’t
many companies offering unique products or services to distinguish themselves
from the rest of the market. This is mainly due to the increased costs in air travel;
costs that have enlarged as a result of high jet fuel prices. Most airlines have
stopped offering free meals and other amenities which were once common place.
Since most airlines are competing on cost, travel routes are about the only thing
that differentiates one airline from another. The exception is in the regional airline
23
industry: Many of these airlines provide unique travel routes not offered by some of
the major airlines. Other examples of the differentiation offered by some of these
airlines include: First come first served seating, offered by Southwest, Jet Blue
offers personal entertainment and data systems for every passenger, and Frontier
Airlines goes one step beyond by offering satellite TV. One form of differentiation
which is now almost an industry standard is the offering of rewards for
accumulated miles flown on a certain airline, as well as the purchase of items on a
credit card affiliated by an airline. Overall the airline industry competes in an almost
pure cost control industry with a very minimal level of differentiation.
Switching Costs
Switching cost refers to the degree of ease a company can produce a different
product using the current resources of the company. The cost of one Boeing 737
can range from $50-85 million, making switching costs in the airline industry
incredibly high. Another factor making the switching cost in the airline industry so
high, is that it is almost impossible to use an airplane for anything else than flying
passengers. The only exception would be switching into the cargo freight industry;
however most commercial airlines already transport cargo and is factored into their
operating revenues. Therefore switching costs are barely diminished. This means
that companies within the airline industry are “stuck” with high competitive
pressures.
Economies of Scale
Economies of scale result due to the relative size of a company and its ability to
purchase large amounts of product at cheaper prices, creating an advantage over
smaller companies. Companies with large economies of scale should be able to sell
their commodity at a lower price than any competitor. As discussed in the
concentration section, there isn’t any single dominant market share holder and
therefore it would make it hard for any large economies of scale to exist in the
24
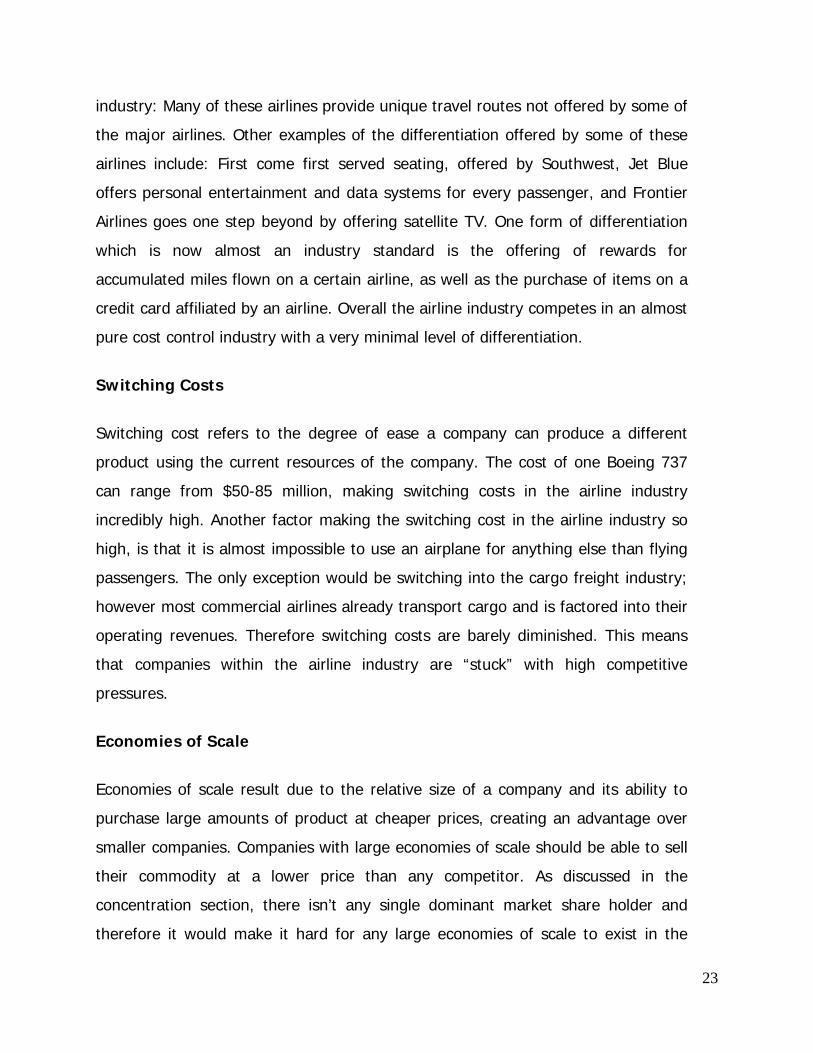
industry. Also the fact that there are so many airlines with a large number of
planes, that it doesn’t give any one airline a great advantage in terms of economies
of scale.
The chart above shows total assets held by firms in the airline industry. Although
certain airlines purchase more in assets then others they aren’t necessarily able to
control their costs as tightly as some competitors, resulting in higher prices. Firms such
as Southwest and Jet Blue have much lower total assets and still offer lower prices to
consumers than larger firms. Although economies of scale do exist the fact that those
companies that hold more in assets aren’t able to offer lower prices than certain
competitors results in a reduction in the economies of scale in the industry.
0
5000
10000
15000
20000
25000
30000
35000
2003 2004 2005 2006 2007
Airline Industry Total Assets (millions)
Southwest
AMR
UAL
Delta
Jet Blue
Continental

25
Fixed-Variable Costs
The relation between fixed cost and variable cost defines how a firm goes about pricing
items in relation to competition. The higher the fixed-variable cost ratio, the higher the
level of price competition. Because airlines fixed costs are so great compared to most
other industries, each company must compete at a higher level to gain customers in
order to pay off its sunk costs with the goal of making a profit
The graph above illustrates Southwest’s fixed-variable cost relationship, a ratio which is
quite consistent across the industry. Fixed cost in the airline industry are high mainly
because the costs of owning and/or renting aircrafts are extremely high. Even if the
aircraft is leased, contracts are often for 15 to 20 years, resulting in an expense
whether the planes are flying or not. Recent surges in the cost of jet fuel as well as
increased maintenance costs have led to increasing variable costs. With already high
fixed costs, and ever increasing variable costs, competition between airlines becomes
increasingly important.
0
0.5
1
1.5
2
2.5
3
3.5
4
4.5
5
2003 2004 2005 2006 2007
Axis Title
Southwest's Operating Expenses per ASM (¢)
Variable Costs
Fixed Costs

26
Excess Capacity
Excess capacity relates to the rule of supply and demand. With excess capacity, supply
is greater than demand and in order to reach equilibrium, prices must decrease, thus
filling capacity. Excess capacity in the airline industry is a result in high prices charged
by companies battling the increased fuel costs, as well as the inability of airlines to fill
their planes do to high route frequency.
The chart above shows the average capacity load function for each airline over five
years. Capacity load function is equal to the revenue passenger miles (RPM) divided by
available seat miles (ASM); this function provides the average percentage capacity of
operation for each airline. Filling excess capacity is made hard in the airline industry
because each plane is limited to a certain size and number of passengers. The
relatively similar excess capacity that exists across the industry is evident to the high
degree of price competition that exists, in companies both large and small.
71.75 74.57 78 78.85 79.12
28.25 25.43 22 21.15 20.88
0%
10%
20%
30%
40%
50%
60%
70%
80%
90%
100%
2003 2004 2005 2006 2007
Airline Industry Capcity Load Factor (%)
Excess Capacity
Occupancy Load

27
Exit Barriers
Exit barriers refer to the degree of difficulty a firm faces when trying to exit an industry.
Barriers are increased when the assets owned by the firm are costly and/or specialized.
Exit barriers in the airline industry are extremely high. Airplanes are highly specialized
pieces of equipment and cannot be sold easily. Due to the tremendous exit barriers of
the airline industry companies are forced to become even more competitive in order to
survive.
Conclusion
The rate of rivalry amongst existing firms in the airline industry is high, creating an
industry that is extremely competitive and sensitive. Most companies with the
exception of only a few share very similar changes in profit. These similarities are due
to a very low growth rate, low concentration, very little differentiation within the
industry, high switching costs, moderate economies of scale, high fixed costs, and high
exit barriers. High rivalry keeps the airlines industry dynamic and creates pressure on all
firms to improve and innovate.
b. Threat of new Entrants: LOW
The threat of new entrants refers to the possibility that the profits of the established
firms in the airline industry may be eroded by new competitors. The extent of the
threats depends upon existing barriers to entry and the combined reactions from
existing competitors. The more new airlines that enter the market, the more saturated
it becomes for everyone.

28
Deregulation of the airline industry has eased the establishment of new airlines such as
low cost carriers. The increased use of the internet has made it easier for new
companies to find distribution channels and to sell their tickets over the Internet.
Upstart Jet Blue and Southwest Airlines were among the few to earn a profit in recent
years. However, there are several barriers to potential entrants.
Hubs and landing slots
Hubs and landing slots are a barrier to entry in the airline industry. Researches, from
the General Accounting Office (GAO), show that ticket prices at airports dominated by a
single airline are higher than at more competitive airports. Opportunities for establishing
new service continue to be limited in some airports by restrictive gate leases. These
leases permit an airline exclusive right to use most of an airport’s gates over a long
period of time, commonly 20 years. To gain access to an airport in which most gates
are exclusively leased, a company must sublet gates from the incumbent airlines, often
at none preferred times and at a higher cost than the incumbent. This system leads to a
low threat of new entrants in the airline industry.
Federal restrictions
Federal restrictions prevent foreign ownership of US airlines and block foreign airlines
from offering connecting service between US cities.
Economies of scale
Perhaps the most important barrier to entry is economies of scale. If a firm’s minimum
efficient scale is relatively large compared to industry output, then only a few firms are
needed to satisfy industry demand. To compete with existing airlines companies, a new
entrant must sell enough air tickets to reach a competitive scale of operation.
29
The high cost of entry in a competitive industry
The total investment needed to reach the minimum efficient size is gigantic. High start
up costs and established brand names create substantial barriers to entry. The fact that
the new carriers don’t have a well known name and don’t have any long term
relationships with companies which can offer them loyal business consumers could
make it hard for the new actors to grow. The prospect of such losses discourages many
potential entrants.
Another barrier to entry would be the intense competition a starter company would
face. With most potential customers already loyal to their airline of their choice,
whether through lower prices, reward programs, or differentiated quality, it would be
almost impossible for a new company to come in and find a niche that could steal these
customers from the airlines of choice. For example, the biggest airlines fly more
national and international routes, so they offer more opportunities both to accumulate
frequent flyer miles and to use them. Thus, the biggest airlines have the most attractive
programs.
Thus, operating limits in the form of slot controls, scarce hubs and gates, and
restrictions against foreign competition create barriers to entry in the airline industry.
Likewise, several marketing strategies, including special incentives for travel agents and
frequent flyer programs, give an advantage to the established carriers. These strategies
continue to deter new airlines from entering the market. Seven airlines account for
over 80 percent of all passenger service; the threat of new entrants is consequently
low.

30
c. Threat Of Substitutes : MEDIUM
All firms within an industry compete with industries producing substitute products and
services. Substitutes limit the potential returns of an industry by placing a ceiling on the
prices that firms in that industry can profitably charge. The more attractive the
price/performance ratio of substitute products, the tighter the lid on an industry’s
profits. The existence of close substitute products increases the propensity of customers
to switch to alternatives in response to price increases (high elasticity of demand).
Substitutes
Travel services, like train and private transportation (cars), are substitutes because they
perform the same function. People who need to travel can choose between those
different travel means. As digital technology has improved and wireless and other forms
of telecommunication have become more efficient, new substitutes have become a
viable substitute for business travel for many executives. Videoconferencing and
groupware allow two or more locations to interact simultaneously via two way video
and audio transmissions. There are consequently two main types of substites,
transportation providers and high technology telecommunication products.
Relative price and performance
Teleconferencing can be a very important threat. It can save both time and money and
affect the number of business travellers. The rate of improvement in the price-
performance relationship of the substitute product is high.
Trains are not a good substitute for airlines because they don’t provide enough routes
in the US to provide a good transportation system. However, with airports and
highways more congested than ever, there are now plenty of plans for next-generation
passenger rail, from upgrading existing lines to building super-high tech tracks. Given

31
the expense, the technical challenges and the political complexity of these projects,
trains have the potential to substitute airplanes in at least a decade.
popularmechanics.com
In this map, we can see the proposed North American High Speed Train Project. The
threat to the airlines here yet but it will be soon when it comes to travel over medium
distances. Regional airlines would be the first affected because soon most of the train
routes would provide fast transportation between cities adjoining states very fast,
particularly on the east coast. The threat looks lower when it comes to large distances
in the US. Even if it would be possible to travel by train from Boston to Houston, we
don’t imagine a lot of people doing that. Airplanes will be always more time and money
efficient. Moreover, the major connections between the east and west coasts would be
still via airlines. On the map, we can’t see any routes crossing the entire country.
As for trains in more than a decade, cars are already a reliable substitute for regional
airplanes, when it comes to short distances. In an attempt to provide a long term
perspective in this report, we will assume that the project mapped above will be
implemented and consequently we will compare the time and energy required for all
travel options within a 400 mile trip. A 400 mile trip is appropriate to evaluate the
highest threat of substitutes, which is, as we said before, regional airlines. A 400 mile
trip corresponds to the distance from Boston to Baltimore.
High-Speed Rail Amtrak (Diesel)Travel time: 2 hours, 54 minutes (maglev); 4 hours, 35 minutes (steel-wheel)
Travel time: 7 hours, 5 minutesEnergy used per passenger mile: 2709

32
Energy used per passenger mile: 1180 Btu* (maglev); 1200 Btu (steel-wheel) CO2 emissions per passenger mile: 0.47 pounds (maglev); 0.48 pounds (steel-wheel)
Btu CO2 emissions per passenger mile: 0.46 pounds
Airplane CarTravel time: 2 hours, 20 minutes (including 1-hour check-in time) Energy used per passenger mile: 3264 Btu CO2 emissions per passenger mile: 1.06 pounds
Travel time: 7 hours, 6 minutesEnergy used per passenger mile: 3445 Btu CO2 emissions per passenger mile: 0.77 pounds
*Btu stands for British thermal unit. One gal. of gasoline yields about 114,000 Btu.
Trains are a significant threat for airplanes because there is only a 30 minute time
difference between an airplane and a maglev (a train that suspends, guides, and
propels vehicles, using electromagnetic force). The energy used per passenger mile is
lower for trains which represents therefore a lower cost for trains than for airplanes.
Contrary to airplanes or cars, high-speed trains draw power from the electrical grid,
which is fueled primarily by domestically produced energy sources, such as coal.
However, it seems that cars are not a key threat due to the time difference. It is
imperative that airlines take into account the cost of automobile travel in order to fix
their prices and discourage people from driving. Furthermore, with oil cracking $130 a
barrel, driving has become very expensive.
Buyers’ willingness to switch
Air transport is traditionally very reliable for people. But it’s apparent that, in some
areas, this system is reaching capacity. For example, for short distances, air travellers
are spending more time in security lines and waiting on the runway before they ever
get into the air. According to the Department of Transportation, 2007 was the worst
year in the past decade for airport delays, with 25 percent of flights arriving late.
According to these facts, buyers’ propensity to substitute could increase significantly,
particularly with the emergence of reliable train routes. Key criteria for customers are
the amount of money people are willing to spend to travel. As a consequence, such
substitutes are easy to counter by determining airline ticket prices according to the

33
equivalent price of the substitute product. For the same amount of money, people
prefer to fly in general. But, since trains will be cheaper and more environmentally
friendly, people may adopt the train instead of the car. They will value the fact that
they don’t need to wait for planes or for luggage, they don’t have to go through the
security or they can still use their cell phones.
However, it seems that customers perceive a higher level of service for airlines and
travel more comfortably in a plane than in a car or a train. Differentiation is also high
when we consider the highest number of routes for airlines.
Currently, the threat of substitutes for airlines is medium. Advantages like speed,
service, and routes provided by planes seem to be considerable compared to
substitutes. However, the relative price performance of trains could be a major threat in
a decade for regional airlines. Airlines need to define themselves as transportation
providers in order to avoid marketing myopia.
d. Bargaining Power of Customers : MEDIUM / HIGH
The power of buyers is the impact that customers have on a producing industry. This is
how much pressure customers can place on business. Customers threaten an industry
by forcing down prices, bargaining for higher quality or more services, and playing
competitors against each other. These actions erode industry profitability.
The largest proportion of revenue is derived from regular and business passengers. For
this reason, it is important that one takes consumer and business confidence into
account on top of the regular factors that one should consider. Main customers in the
airline industry are: Travel Agents, Business Travellers, Federal Government, Pleasure
Travellers, Charter Service, the US military.
34
Switching costs.
It’s very easy for customers to switch to another product and company because they
are extremely price sensitive. For example, travelers will choose to drive if they consider
it cheaper than flying. Students, for example almost always adopt this kind of behavior.
Some customers, in general, can do without flying for a period of time if they think that
prices are too high. In times of economic uncertainty or sharp decline in consumer
confidence, one can expect the number of leisure travelers to decline.
Even business travellers become more sensitive to prices, according on the Business
Travel News’ Corporate Travel 100 Report. This year, 22 percent of more than 60
companies that spend a total of more than $44 million in U.S.-booked air travel said
they are seeking air savings by becoming more restrictive in business class policies. Last
year, 28 percent did so. Moreover, these companies don’t have a preference in a
particular airline. They will choose the best price.
However, in some case, consumers value speed more than saving. For example,
Business travellers can’t waste time driving when they can fly. Business travellers are
important to airlines because they are more likely to travel several times throughout the
year and they still tend to purchase the upgraded services that have higher margins for
the airline.
Ticket Price
Also, buyers tend to buy a round trip ticket only, so they can’t negotiate discount for
their purchase volume. Fares are going up and will continue to grow. Average published
airfares next year will rise 6 to 10 percent from 2007 levels, said Bob Brindley, vice
president for the Americas for BCD Travel's consulting subsidiary Advito. However, the
demand should remain at least stable since the airlines tend to give customers some
discounts. Phil Dunphy. director of global travel, said: "If the airlines raise fares 5
percent, they'll give you back 3 percent, but they still net that additional 2

35
percent.”(www.btnonline.com) Obviously, discounts may not be sufficient to recover
airline’s previous price but this practice would not decrease demand fundamentally.
Also, airlines product is highly perishable. Once an airplane takes off, the empty seats
lose all value, so airlines need to do what they can to fill them. That means that airlines
companies need to decrease ticket prices daily depending up how full the flights are.
Number of buyers
As American Airlines senior vice president of global sales David Cush said, travel
demand and corporate spending remain robust this year: "I think less about what
people are saying and more about what they're doing. What they're doing is continuing
to travel at a very strong level," he said. "Our July figures for corporate travel show no
decrease in demand there and forward-looking bookings look very strong, so everything
we see points to a robust travel market." It seems that the airlines industry would have
to wait to see "the fallout from some of this financial market turmoil," but international
travel remains strong. Indeed companies have globalized, and they can't just stop
travelling internationally. International demand is going to remain strong. Consequently,
it appears that individual buyers don’t have a lot of power.
Differentiation
Customers appreciate services and airlines companies have to improve them as much
as they can. Indicators that are used in survey such as the “BTN annual airline survey
2007” are flexibility in negotiating pricing; flexibility in negotiating services and
amenities; availability of timely; accurate contract performance data; complaint problem
resolution; quality of airline communication; value of relationships with managers; sales
representatives; quality of customer service; and overall price value. However, it is
quite hard to compete on service. Consumers realize that there is now virtually no
differentiation between airlines in terms of product, even in the upper travel classes. Air
36
travel is mostly standard and there is little opportunity for sustainable differentiation. Is
the seat in one airline more comfortable than another? Probably not, unless you are
analyzing a luxury liner like the Concord Jet.
Airlines try to differentiate travel but the problem is that there is simply not enough
product differentiation to go around. Product packages, like air ticket and hotel or car,
used to work; they no longer always do because they can more often be copied or
improved by competitors at an increasing speed. For example, in the mid 1980s, AMR (
American Airlines) introduced AAvantage. This differentiating concept was a great
success until most other competitors realized that they could do likewise. As a
differentiator, the effective life-cycle of frequent flyer miles/points and their
differentiating power were much shorter than the airlines originally anticipated.
Access to information
Another key element of high buyer power is that buyers have access to information.
They can easily compare online hours, prices, connections to decide which flight they
want and therefore the company they want to choose. Tickets can be purchased
through common online venues like Orbitz and Travelocity or are issued directly by
airlines over the phone or through the company’s website. A minority are booked
through travel agents. In the Economist, published June 14th 2007, we find that: “The
web has made it possible for passengers to be their own travel agents by comparing
fares and schedules and booking flights—and at prices much lower than a decade ago.”
The access to information increase buyers’ power.
In conclusion, buyers’ power is medium/high due to low switching costs, price
sensitivity, a standard product, information access, a large number of buyers and low
volume purchases.

37
e. Bargaining Power of Suppliers : HIGH The bargaining power of suppliers is how much pressure suppliers can place on a
business. Suppliers can exert bargaining power over participants in an industry by
threatening to raise prices or reduce quality of purchased goods and services. If one
supplier has a large enough impact to affect a company's margins and volumes, then
they hold substantial power.
The airline industry is extremely sensitive to costs such as fuel, labor and borrowing
costs. The airline industry’s main suppliers are aircraft manufacturers, aircraft leasing
companies, labor unions, food service companies, fuel companies, airports, the federal
Aviation Administration (FAA), hotels.
Aircraft makers
The airline supply business is mainly dominated by Boeing and Airbus. For this reason,
there isn't a lot of cutthroat competition among suppliers. As a consequence aircraft
makers are powerful. Even if there is an intensive war between Airbus and Boeing (cf:
graph) gain a higher percentage of the world market, prices are comparable for similar
planes, which allow no breathing space for airlines. Furthermore, aircraft makers’ power
could be higher in the future because they won’t offer identical aircrafts. Indeed,
Boeing’s strategy now is to focus more on small aircrafts for regional lines whereas
Airbus’s strategy is more oriented towards big international planes. The negotiation with
suppliers would be harder to airlines companies. Suppliers’ products are an important
input to the buyers business. Airlines company need to renew their fleet regularly and
Boeing and Airbus are the only providers. Without sufficient planes, an airlines company
loses power. Plane investments are critical and airlines firms don’t have any substitute
products to offer.
The only element that tends to reduce supplier power is that the airlines industry is an
important customer and that the rivalry between Boeing and Airbus is very high.

38
Labor supply power (labor unions)
The initial changes in the airline industry created by the Airline Deregulation Act of 1978
seem to have increased union bargaining power. Airline unions have considerable strike
threat power, but are constrained by the financial health of carriers. Since airline
deregulation, compensation has waxed and waned in response to the industry’s
economic environment. Airline workers capture sizable rents following good times and
provide concessions following lean times. Evidence from the CPS for 1995-2006 shows
that wage premiums for airline industry workers remain, particularly for pilots, with
existing premiums almost entirely a union phenomenon. Because unions retain
bargaining power at the major carriers, wages are likely to head upward as carriers’
financial health returns. Such wage levels may or may not be sustainable in the
inevitable next downturn.
Fuel suppliers
Fuel suppliers are very powerful. Indeed, some of the major players in the airline
industry attribute 10-20% of their costs to jet fuel. Fuel prices have been known to
fluctuate 5-10% or more on a monthly basis, so paying close attention to these costs is
crucial. That’s why airlines companies had been interested in reducing the volatility of
oil prices. For example, Southwest Airlines has a long-time program to hedge fuel
prices. It has purchased fuel options years in advance to smooth out fluctuations in fuel
costs. The use of these hedges helped airlines maintain their profitability during oil
shocks like the Iraq War and Hurricane Katrina. However, the rapid increase in fuel
prices this year has a strong impact on airlines profits. Record jet-fuel prices are making
50-seat regional jets unprofitable to fly. For example, with fuel prices at $3.15 a gallon,
the Embraer ERJ-145’s total operating cost has increased 39%, making it, a money-
loser on its routes.
39
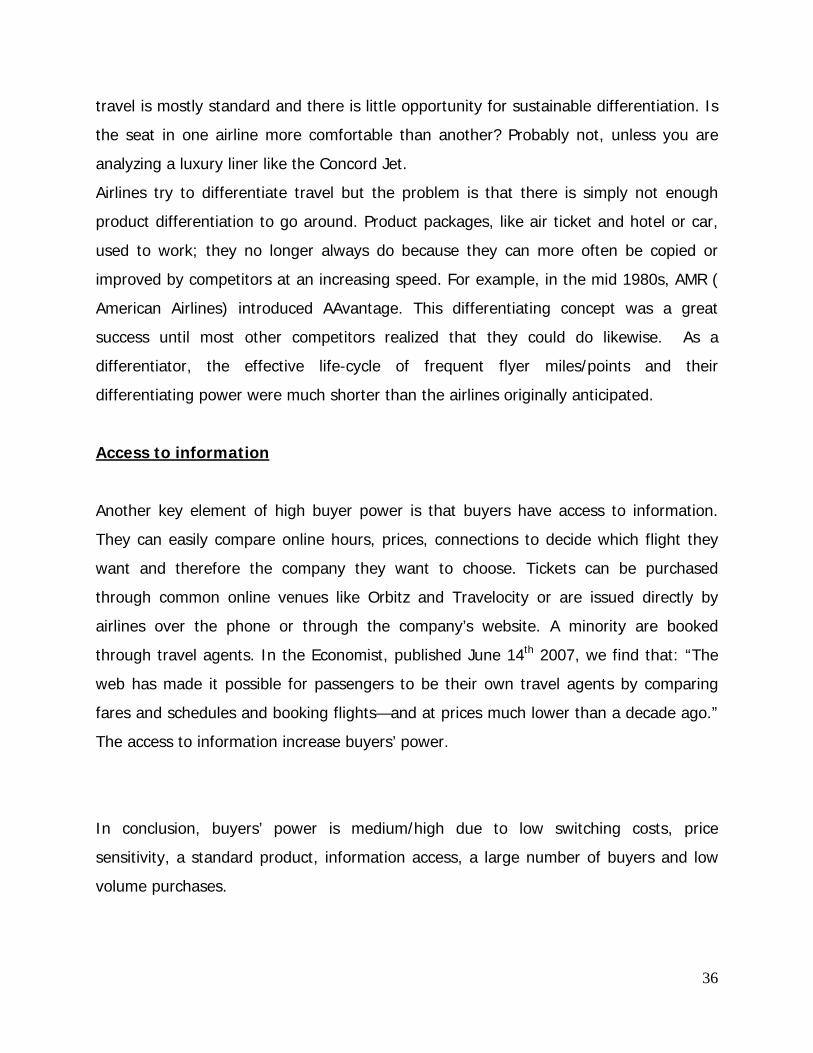
In those graphs from an article in www.nationalpost.com (April 17, 2008), we can see
the fuel prices increase and their impact on the net income for three main competitors.
Labor costs are also represented. However, there are stable.
In conclusion, Suppliers power is very high. As discussed, only two main aircraft
makers, labor unions are still quite strong, and the increase in fuel makes airlines
companies very weak. Airlines companies need to mitigate rising costs.

40
Value Chain Analysis
Competitive strategies-
The airline industry firmly believes that the three main areas of competition is
Cost Control/ Efficiency, frequency and convenience of schedules/routes, and ultimately
fares. With highly competitive price wars, each firm must use its own competitive
advantage to try to increase profitability. Each firm uses its own economies of scale
and cost structures to try to establish the maximum share of the market it can obtain.
Cost Control/Efficiency
Unlike Southwest, the 9/11 aftermath has sent many of the airline firms into
bankruptcy. Recently some of the firms have just climbed out of this negative profit
whole by cutting costs by renegotiating labor, supply, and financial contracts. Through
new deals with labor unions, fuel suppliers, and insurance companies, each firm is
finding new ways to become more cost efficient in day-to-day activities. In addition to
cutting costs through the above stated new venture, many of the other airline
companies are beginning to form new “alliances” to help spread efficiency. Ones such
alliance is Continental’s train-to-plane alliance with Amtrak. (Continental’s 2007 Annual
Report) This alliance allows an easily accessible eight-minute shuttle service for
commuters from Manhattan to Continental’s New York Liberty hub. Other alliances
include SkyTeam, which allows all of its members to share airport lounge
accommodations and helps offer greater destination coverage, as well as an ever
expanding network alliance with various travel agencies to help promote sales of the
individual airline’s ticket sales. These ways are all important in cutting costs to try to
find a competitive advantage in the domestic travels, but as for Southwest’s main
competitors, they have to find additional and alternative strategies to try to help control
cost in their international travels. Along with domestic factors the competitors must face
41
additional factors such as currency exchange, war difficulties, and different weather
patterns in international territories.
Frequency and convenience of schedules/routes
Before 9/11 the airline industry seemed to have two main market-share seeking
strategies. One of which was Southwest’s, in seeking the most efficient way of
optimizing domestic route patterns and cost control, and the alternate used by almost
all of Southwest’s competitors, of having a larger fleet to increase route frequency
domestically and internationally, as well as increasing route volume by establishing
codesharing alliances, and obtaining brand recognition. After the terrorist attacks of
9/11, the entire industry had to incur higher fuel prices and a lesser volume of willing
flyers. Southwest continued to maintain its competitive advantage with a smaller and
efficient fleet, but almost all other airlines had to shrink capacity, cut labor, and cease
certain operations.
Fares
All of the airline companies fiercely compete in price competition of lowering their
individual fares. However, each company must face its own factors that deal with the
adjusting of these fares. Besides the main differences of international travel vs domestic
travel and large fleet vs small fleet, each airline must face the same economic and other
conditions that could possibly have them adjust their prices. Some of these conditions
include: fuel prices, union problems, threatened political instability, environmental
issues, changes in consumer preferences, and potential problems in the air traffic
control system. One such factor that had a substantial increase in individual fare prices
were the terrorist attacks of 9/11. This event caused all TSA (Transportation Security
Administration) to increase personnel in all U.S. domicile airports. For example,
Continental’s per enplanement ticket tax went from a $10 per passenger roundtrip cap
to an $18 per passenger roundtrip cap. (Continental’s 2007 Annual Report)

42
Along with these factors, the entire airline industry is also faced with competition
from surface transportation, pertaining to shorter travel. In economic regressions, this
form of travel could seem more appropriate.
43
Firm Competitive Advantage
Economies of Scale-
Southwest Airlines Co. focuses on targeting a very simplistic market segment. It
focuses principally on customers that are traveling on shorter-route trips that want low-
fares and non-stop frequent flights. These types of customers range from the everyday
traveling businessman to possibly vacationing families. Southwest achieves reaching
these arrays of customers by its efficient cost-structure, differentiated strategies, and
future goal setting techniques.
Cost Efficiency/Control System
Southwest’s main competitive advantage is its superb cost structure. This low
cost-structure is reached through only using one type of aircraft, efficient route
structures, and high moral employees.
By using only one aircraft type, the Boeing 737, Southwest is able to simplify
scheduling, maintenance, flight operations, and training activities. This in turn greatly
reduces costs of having to hire additional workers/trainers that would have to require
additional skill sets.
Southwest’s main low-cost driver would be its efficient route-structure. “Point-to-
point service allows for more direct nonstop routing than the hub and spoke system,
minimizing connections, delays, and total trip time.” (Southwest’s 2007 Annual Report)
As of this year, Southwest now has over 400 nonstop city pairs. Also helping in
Southwest’s efficient routing schedule are conveniently located downtown and
secondary airports. These airports are generally less crowded and congested, which
helps minimize the time the aircraft has to stay on the ground. This asset utilization
helps reduce costs by avoiding flying time in the air waiting too land, and cabbing time
waiting to depart in crowded airports. This reduction in aircraft usage also helps add

44
additional routes to increase profitability. Another cost reduction strategy to
compensate for the raising of fuel prices is eliminating shorter less profitable flights to
help utilize the already existing fleet in more profitable ventures. This in turn keeps the
company from expensing additional aircraft and fuel, while increasing its turnover.
Differentiation strategies
-Fare Structure-
“Southwest was the first major airline to introduce a Ticketless travel option,
eliminating the need to print and then process a paper ticket altogether, and the first to
offer Ticketless travel through the Company’s website at www.southwest.com”
(Southwest’s 2007 Annual Report) This innovative strategy helped bring new clientele
that did not want to have to wait in airport terminals to receive their travel vouchers. At
the end of 2007 over 90 % of all Southwest customers chose the ticketless confirmation
method. In addition to this fare distribution channel, Southwest is better trying to reach
the everyday businessman traveler by adding on to its fare distribution web. To help
show available fares in the future, Southwest announced an expansion of its Global
Distribution System to help with corporate travel. Also, to help better compensate these
frequent flyers, Southwest has recently created their rapid rewards frequent flyer
program. This program is based on the number of trips the customer has taken rather
than the mileage flown. For every 16 credits (flights) within 24 months, the flyer will
receive one free round-trip award to any destination on Southwest.
-Enhanced Boarding Method and Updated Gate Design-
To help with efficient boarding, Southwest has created a method that greatly
reduces customer wait time standing in line at the gate. In addition to adding their
“Business Select” class, which basically means frequent flyers that automatically receive
A class status upon arrival at the gate, the new method arranges customers in a fashion
45
of A, B, and C boarding groups with assigned numbers. This boarding method allows for
the flyer to have a reserved spot in line, depending on when he/she checked in
electronically or at the terminal, as early as 24 hours in advance. With this new
boarding method, Southwest updated its gate design to have columns with letters and
numbers to help facilitate the order in which to board. Along with these columns, to
help indulge the Southwest experience, they included “(i) a business focused area with
padded seats, tables with power outlets, power stations with stools, and a flat screen
television for news programming; and (ii) a family area with smaller tables and chairs,
“kid friendly” programming on a flat screen television, and power stations for charging
electrical devices.”
Looking into the future
To help become more efficient and to help differentiate itself from its
competitors, Southwest plans to replace its existing Ticketless system and revenue
accounting system with new technology. This new technology will help create easier
data flow, which will in turn increase operational efficiencies and Customer Service
capabilities.
As a member of the low concentration airline industry, Southwest engages in
high price competition with its rivals. With having very closely related rival firms, to
emerge successful a firm must have excellent cost-efficiency strategies. By creating a
superior cost-efficient structure, innovative differentiated strategies, and implementing
useful future goal setting techniques, Southwest seems to be able to sustain its top of
the industry status.

46
Accounting Analysis
The purpose of performing an accounting analysis on this firm is to analyze the
firms accounting practices. The analysis will also highlight if the firm, in fact, exercised
acceptable accounting practices that mirror accurate information about the firm. The
degree of financial reporting is regulated in the United States by GAAP, Generally
Accepted Accounting Principles. The Security Exchange commission (SEC) requires
managers of firms to follow GAAP in order to provide a clear picture of the company for
their shareholders and potential investors. GAAP give managers numerous alternative
options in accounting so they can show how their company succeeds or falls short; also
how it competes within its industry. GAAP provides a degree of flexibility to the
managers of the firms rather than using accounting principles that do not represent
accurate conditions of the company and its industry. This accounting flexibility has good
intentions, but accounting can still be manipulated by management.
Structuring an accounting analysis begins with identifying the company’s key
accounting policies that deal directly with its key success factors. Also to look at would
be important information on the financial statements as well. Information like capital
and operating leases, pension plans, and fuel hedging costs should be investigated for
possible manipulation. Assessing the degree of accounting flexibility will help determine
if the firm’s managers distorted the financials in some way to make the company look
financially sound. The accounting strategy phase of the accounting analysis process
allows us to evaluate the accounting policies the company used. From there we need to
compare them with the industry norm and identify if there are any irregularities in our
firm or that of any of the competitors. During the accounting analysis; we will have to
assess the quality of information we are disclosed in the company’s 10K. After
completing the analysis, we will be able to determine how transparent this firm’s
financial statements are. If there are any inconsistencies with reporting, we must

47
identify the potential “Red Flags” or other abnormalities. Lastly, we must then undo any
abnormalities in the firm’s accounting in order to properly value the firm.
Key Accounting Policies
The initial step in Accounting Analysis is to identify the firm’s key accounting
policies. In order to analyze this, Southwest’s key accounting policies must be directly
related to its key success factors. These factors include industry growth, level of
concentration, differentiation, switching costs, economies of scale, fixed and variable
costs, excess capacity, and exit barriers. “The airline industry is highly competitive. The
company believes the principal competitive factors in the industry are, fares, customer
service, costs, frequency and convenience of scheduling, frequent flyer benefits, and
Efficiency and productivity, including effective selection and use of aircraft (Southwest
10K)”. This allows Southwest to help differentiate itself, allowing it to have some
competitive advantage over other airlines in the industry. Every firm wants the
advantage to differ itself from the competition in one way or another to have the upper
hand in the industry. We found in draft one that Southwest’s key success factors are
price competition, differentiated strategies, and future goal setting techniques. The firm
can clearly present these factors, or give their own account of their competitive
advantages.
Southwest also utilizes GAAP when they prepare their financial statements. This
allows Southwest’s management to make assumptions and estimations that affect
amounts stated on their Consolidated Financial Statements. “The Company’s estimates
are based on historical experience and changes in the business environment (Southwest
10K).” Southwest’s assumptions are most important when it comes to the portrayal of
the company’s financial condition; they require the best judgment from managers. The
accounting policies that are directly linked to Southwest’s key success factors are the
following: revenue recognition, fuel hedging, operating leases, and retirement and
pension plans.

48
Revenue Recognition
In the airline industry companies like JetBlue, American, Continental, and
Southwest emphasize the importance of price competition, but also have to follow
GAAP’s policies in recording such entries accordingly. The SEC instructs all U.S. based
companies to use GAAP when preparing their financials. Price competition is important
to southwest because it enables them to be the “low cost leader” in the airline industry.
How they maintain low prices in an uncertain economy is a big question. Southwest
achieves this by adjustments made first on the balance sheet, that then affect the
income statement. Southwest like many of its competitors use revenue recognition
when estimating revenue. Southwest initially records all ticket sales to the “Air Traffic
Liability” line of the balance sheet before it allocates the sale to the “Passenger
Revenue” line on the income statement. The air plane has to actually take off before
the sale is adjusted on the Income Statement. An argument can be made that the ticket
sale should be viewed as a revenue not a liability, and have line for doubtful accounts.
Other airlines face the same disadvantage when recording revenues from ticket sales.
Air traffic liability accounted for $931 million in 2007 versus $799 million in 2006.
Fuel Hedging
”Southwest is a pioneer when it comes to the low-cost business model, but high
oil prices are a growing threat (Morningstar.com).” Southwest Airlines has incurred
more costs in 2007 because of rising fuel costs, but those are not the only costs
Southwest has. “Southwest’s business is dependent on the price and availability of
aircraft fuel. Continued periods of high fuel costs and/or significant disruptions in the
supply of fuel could adversely affect the Company’s results of operations (Southwest
10K)”. Fuel cost have risen from $2,119,520 in 2006 to $2,539,600 in 2007, the
average cost per gallon of jet fuel has risen from $1.53 in 2006 to $1.70 in 2007 with
the expected rate to be in the $2.60 to $2.65 range.

49
2007 2006
(In millions)
Mark-to-market impact from fuel contracts settling in future periods — included in
Other (gains) losses, net . . . . . . . . . . . . . . . . . . . . . . . . . . . . . . . . . . . . . . . . . . . $(219) $ 42
Ineffectiveness from fuel hedges settling in future periods —included in Other (gains)
losses, net . . . . . . . . . . . . . . . . . . . . . . . . . . . . . . . . . . . . . . . . . . . . . . . . . . . . . . (51) 39
Realized ineffectiveness and mark-to-market (gains) or losses — included in Other
(gains) losses, net . . . . . . . . . . . . . . . . . . . . . . . . . . . . . . . . . . . . . . . . . . . . . . . . (90) 20
Premium cost of fuel contracts included in Other (gains) losses, net . . . . . . . . . . . . . . 58 52
Other . . . . . . . . . . . . . . . . . . . . . . . . . . . . . . . . . . . . . . . . . . . . . . . . . . . . . . . . . . . 10 (2)
$(292) $151
(Southwest 10K)
Southwest’s profit for 2007 was $645 million compared to 2006 with $499 million, a
29.3% increase (Southwest 10K). “Jet fuel and oil consumed for fiscal 2007 and 2006
represented approximately 28 percent and 26 percent of Southwest’s operating
expenses, respectively (Southwest 10)”.
Capital and Operating Leases
Southwest believes that having a single type of aircraft, Boeing 737, contributes
to its low cost structure. Some believe that having a single type of aircraft can be
damaging to the firm. The maker of the aircraft may at sometime not be able to provide
adequate assistance to the aircraft. However, Southwest believes that the advantages
outweigh the negative risks when it comes to having a single aircraft strategy
(Southwest 10K). Out of Southwest’s fleet of 520 planes 95 of them are leased, 86 were
under operating leases and 9 were under capital leases (Southwest 10K). The total
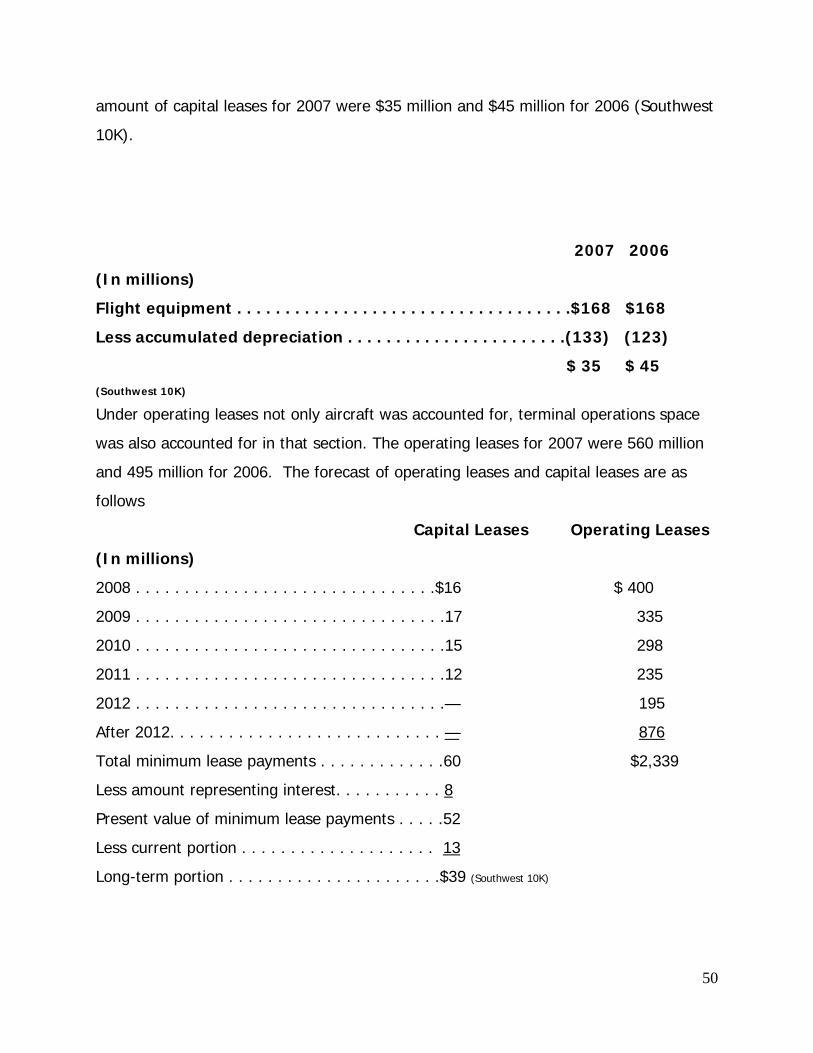
50
amount of capital leases for 2007 were $35 million and $45 million for 2006 (Southwest
10K).
2007 2006
(In millions)
Flight equipment . . . . . . . . . . . . . . . . . . . . . . . . . . . . . . . . . . .$168 $168
Less accumulated depreciation . . . . . . . . . . . . . . . . . . . . . . .(133) (123)
$ 35 $ 45 (Southwest 10K)
Under operating leases not only aircraft was accounted for, terminal operations space
was also accounted for in that section. The operating leases for 2007 were 560 million
and 495 million for 2006. The forecast of operating leases and capital leases are as
follows
Capital Leases Operating Leases
(In millions)
2008 . . . . . . . . . . . . . . . . . . . . . . . . . . . . . . .$16 $ 400
2009 . . . . . . . . . . . . . . . . . . . . . . . . . . . . . . . .17 335
2010 . . . . . . . . . . . . . . . . . . . . . . . . . . . . . . . .15 298
2011 . . . . . . . . . . . . . . . . . . . . . . . . . . . . . . . .12 235
2012 . . . . . . . . . . . . . . . . . . . . . . . . . . . . . . . .— 195
After 2012. . . . . . . . . . . . . . . . . . . . . . . . . . . . — 876
Total minimum lease payments . . . . . . . . . . . . .60 $2,339
Less amount representing interest. . . . . . . . . . . 8
Present value of minimum lease payments . . . . .52
Less current portion . . . . . . . . . . . . . . . . . . . . 13
Long-term portion . . . . . . . . . . . . . . . . . . . . . .$39 (Southwest 10K)

51
Retirement and Pension Plans
Southwest records retirement and pension plans under the balance sheet. It
records them as other differed liabilities. The company contribution each plan was six
million in 2007. Like any other company Southwest offers a 401K plan and benefits to
their employees. The age for a pilot to retire went from 60 to 65, this allowed a
decrease in the company’s projected future post retirement obligation. The also assume
the health care cost trend to decline to 5% from 7.50% in the next seven years. The
company’s contribution for retirement plans was 279 million in 2007.
Conclusion
A company’s key accounting policies should match their key success factors. If
everything does not match up the analyst should see that as a “red flag”, in that case
the analyst has to go back and correct the company’s mistake. In the case of Southwest
Airlines, we have discovered that their financials are transparent, with a normal level of
company disclosure.
Assess Degree of Potential Accounting Flexibility
Some firms try to distort their financial information by the degree of accounting
flexibility they use. The SEC (Securities Exchange Commission) tries to regulate firm’s
accounting so they are reported to investors as transparent as they can be. GAAP
provides standards and rules that the FASB requires firms to abide by when they are
preparing their financial statements.
Revenue Recognition
When a passenger purchases a ticket for air travel, it is initially deferred as “Air
Traffic liability” (Southwest 10K). When a service is provided (when the flight leaves the

52
ground) passenger revenue is recognized and air traffic liability is reduced. “Air traffic
liability” fluctuates throughout the year; it depends on seasonal travel and fare prices.
“Air traffic liability” balance at December 31, 2007 was $931 million, compared to $799
million as of December 31, 2006 (Southwest 10K).” During this process, estimating how
many tickets will be subject to refunds or forfeits require some degree of bias and
reasoning. It helps when the majority of Southwest’s tickets are sold as non-refundable,
but they do offer the customer use of the ticket up to a year of the purchase if they do
decide to cancel their reservation. The ticket can also be refunded if the ticket was
purchased as “refundable”. Air traffic liability includes all the estimates of future refunds
and exchanges, net forfeited tickets, for all unused tickets once the flight date has
elapsed. The precision of estimation are based on historical information. Southwest and
its competitors have exercised this accounting method to estimate revenue from
forfeited tickets at the date of travel.
Capital & Operating Leases
In Southwest’s case costs would be where they could have some flexibility with
their accounting. When Southwest reports leases they first report them separately
under Capital and Operating leases, under Capital leases they have categorized only
nine planes out of the 95 they lease, and under Operating leases they categorized the
remaining 86 aircraft and also land fees and other rentals, meaning terminal space in
the airport. Out of the 95 lease aircraft, only 86 of them are recognized and affect the
balance sheet. If the Operating leases are not portrayed correctly on the balance sheet,
assets or liabilities can be seriously understated, causing a chain reaction to the rest of
the balance sheet. Net income and retained earnings can be classified as overstated
causing the firm to look more lucrative to investors than it really is.
In the case of the capital lease it is different because it does not affect the
balance sheet. It is categorized as a liability and an asset to the firm, because the

53
owner assumes some risk and benefits while owning the lease. Southwest has a lot of
flexibility when it comes to leases.
Fuel Hedging
Accounting flexibility also applies to the hedging Southwest applies towards jet
fuel costs. “Changes in the Company’s overall fuel hedging strategy, the ability of the
commodities used in fuel hedging (principally crude oil, heating oil, and unleaded
gasoline) to qualify for special hedge accounting, and the effectiveness of the
Company’s fuel hedges pursuant to highly complex accounting rules, are all significant
factors impacting the Company’s results of operations (Southwest 10K)”. Southwest has
implemented SFAS 133, Accounting for Derivative Instruments& Hedging Activities, to
address fuel derivatives expiring in forthcoming periods. Southwest’s net income
increase in 2007 from 2006 with gains and losses, its operating income decreased 15.3
% from 2006 due to the rising fuel costs which they were not able to recover with the
year’s revenues. The average jet fuel cost has increased by 2% from 2006 to 2007. The
increase has gone from $1.53 a gallon in 2006 to $1.70 a gallon in 2007. Southwest
expects fuel to rise between $2.60 and $2.65 later in 2008 (non-hedging prices).
“Based on current growth plans, the Company also has fuel derivative contracts in place
for over 55 percent of its expected fuel consumption for 2009 at approximately $51 per
barrel, nearly 30 percent for 2010 at approximately $63 per barrel, over 15 percent for
2011 at $64 per barrel, and over 15 percent in 2012 at $63 per barrel (Southwest
10K)”.
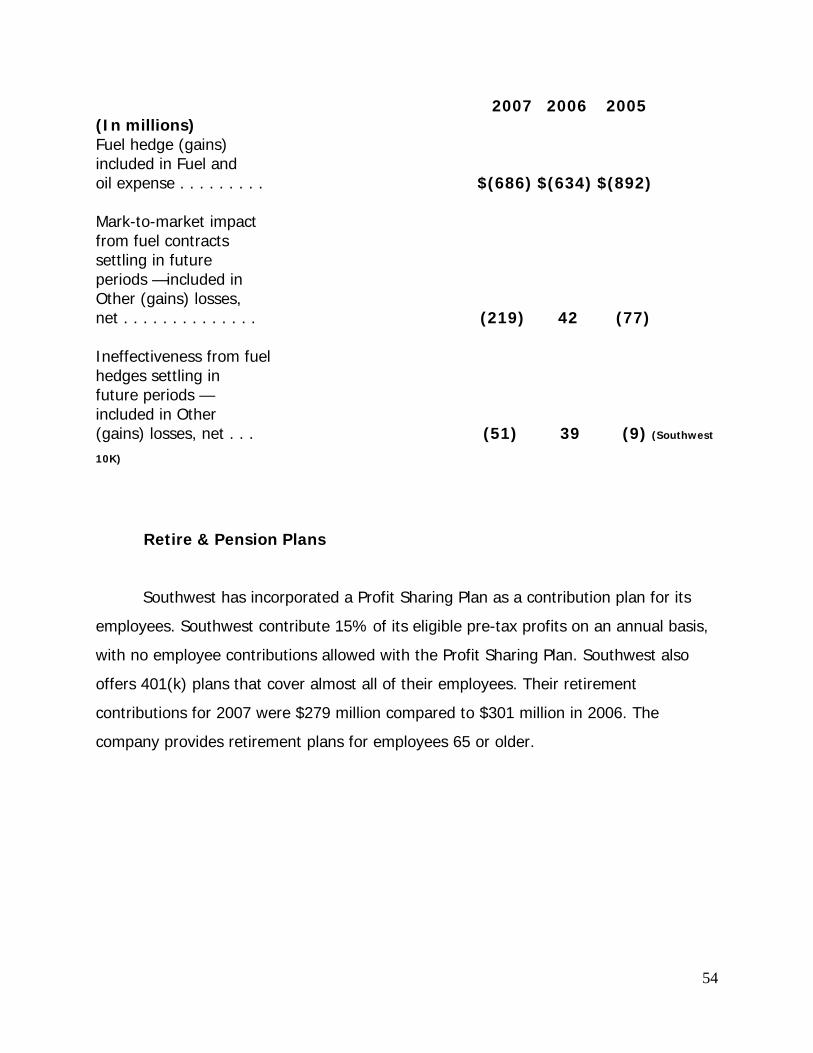
54
2007 2006 2005 (In millions) Fuel hedge (gains) included in Fuel and oil expense . . . . . . . . . $(686) $(634) $(892) Mark-to-market impact from fuel contracts settling in future periods —included in Other (gains) losses, net . . . . . . . . . . . . . . (219) 42 (77) Ineffectiveness from fuel hedges settling in future periods — included in Other (gains) losses, net . . . (51) 39 (9) (Southwest
10K)
Retire & Pension Plans
Southwest has incorporated a Profit Sharing Plan as a contribution plan for its
employees. Southwest contribute 15% of its eligible pre-tax profits on an annual basis,
with no employee contributions allowed with the Profit Sharing Plan. Southwest also
offers 401(k) plans that cover almost all of their employees. Their retirement
contributions for 2007 were $279 million compared to $301 million in 2006. The
company provides retirement plans for employees 65 or older.
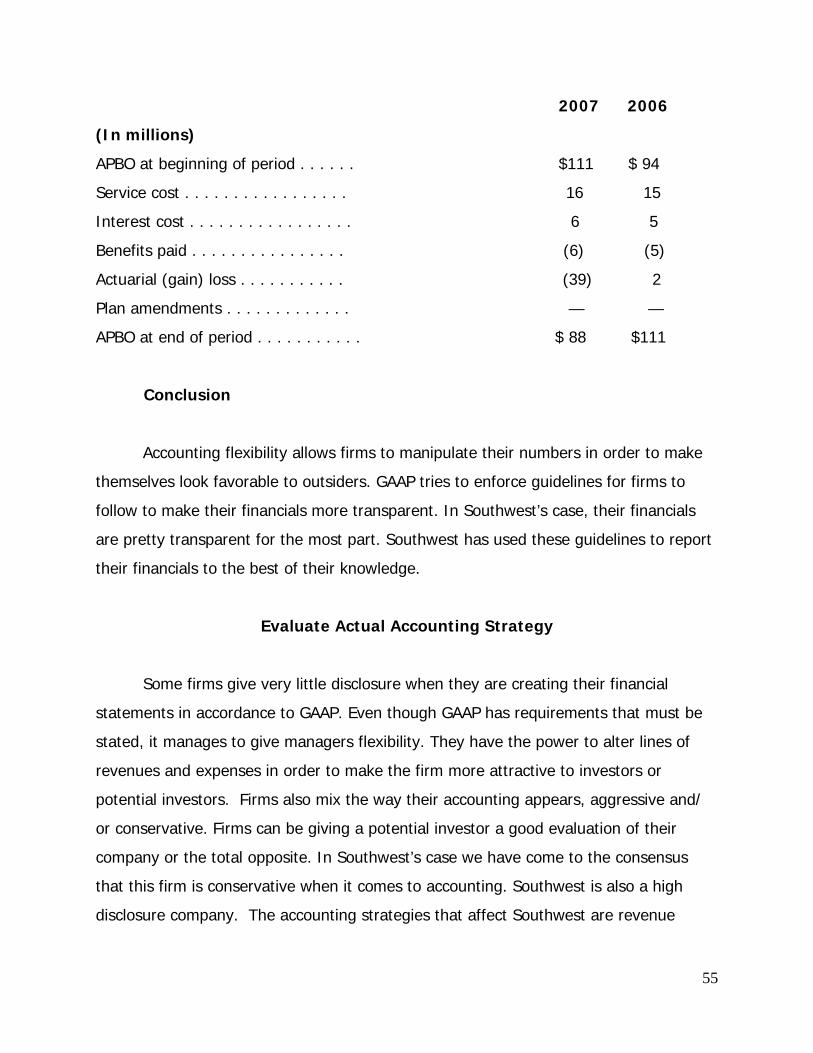
55
2007 2006
(In millions)
APBO at beginning of period . . . . . . $111 $ 94
Service cost . . . . . . . . . . . . . . . . . 16 15
Interest cost . . . . . . . . . . . . . . . . . 6 5
Benefits paid . . . . . . . . . . . . . . . . (6) (5)
Actuarial (gain) loss . . . . . . . . . . . (39) 2
Plan amendments . . . . . . . . . . . . . — —
APBO at end of period . . . . . . . . . . . $ 88 $111
Conclusion
Accounting flexibility allows firms to manipulate their numbers in order to make
themselves look favorable to outsiders. GAAP tries to enforce guidelines for firms to
follow to make their financials more transparent. In Southwest’s case, their financials
are pretty transparent for the most part. Southwest has used these guidelines to report
their financials to the best of their knowledge.
Evaluate Actual Accounting Strategy
Some firms give very little disclosure when they are creating their financial
statements in accordance to GAAP. Even though GAAP has requirements that must be
stated, it manages to give managers flexibility. They have the power to alter lines of
revenues and expenses in order to make the firm more attractive to investors or
potential investors. Firms also mix the way their accounting appears, aggressive and/
or conservative. Firms can be giving a potential investor a good evaluation of their
company or the total opposite. In Southwest’s case we have come to the consensus
that this firm is conservative when it comes to accounting. Southwest is also a high
disclosure company. The accounting strategies that affect Southwest are revenue

56
recognition, fuel hedging, operating and capital leases, and retirement and pension
plans.
Revenue Recognition
Costs have a lot to do with Southwest’s reporting’s for the year. Revenue
recognition helps Southwest keep revenues because it is not stated as un-earned
revenue but as an air traffic liability until the plane has left the runway. Many other
competitors in the industry also record these unearned revenues as “liabilities” also.
Southwest explains why they record them as liabilities first in the 10K.
Operating and Capital Leases
Leases are a big part of Southwest’s cost. They incorporate both capital and
operating costs when they allocate leases. When we analyzed the balance sheet, they
have everything in order even though capital leases are not included on the balance
sheet. Southwest combined 86 of the 95 leased aircraft with the majority of the
company’s terminal operations space to operating leases in December of 2007, the 9
remaining aircraft were put under capital leases. They also have a purchasing option at
the end of the lease date.
Fuel Hedging
Fuel costs were difficult because of the hedging that has to be incorporated with
it. After reading the SFAS 133 amendment section of Southwest’s 10K and reading how
they are expected to deal with the rising fuel costs. We also analyzed from year to year
the operating expenses and saw how much of it was allocated to rising fuel costs and it
all balanced out.

57
Retirement and Pension Plans
Southwest does offer a 401k plan like all of its major competitors. The U.S.
congress increased the retirement age for pilots from 60 to 65, which decreased the
company’s projected future retirement obligation. Southwest expects healthcare cost to
decrease from 7.50% in 2008 to 5% in 2014 and remain at the rate thereafter.
Conclusion
Firms can be flaky when it comes to disclosures and make their accounting really
aggressive where everything looks great on the outside but is really crumbling on the
inside. Southwest’s financials have been transparent enough to understand what is
going on in the firm. Their accounting is conservative and their disclosure is high.
Qualitative Analysis
A qualitative analysis involves the examination of financial statements in order to
understand, in essence, the business of a particular company. The information is
analyzed within the company’s audited annual report, in which all the consolidated
financial statements are held, as well as in the management’s discussion and analysis;
which together makes up a 10-K.
The quality of disclosure within Southwest’s 10-K is quite good, especially when
compared to that of its competitors. Information disclosed within the 10-K is straight
forward, the airline describes the overall nature of its market risk and then in the notes
addresses in detail the risk of its business strategy including key accounting policies and
assumptions. The description of southwest’s lease information is an example of the
level of disclosure provided by Southwest Airlines. Within the disclosure of risk

58
Southwest presents the number of airplanes that are under operating and capital leases
which is 95. Within the notes Southwest then provides the number of airplanes under
both capital leases (9) and operating leases (86). Southwest also provides the exact
amount paid on capital and operating leases as well as offering future minimum lease
payments and expected future payments for the next five years and beyond. Included
in the lease information are the possible lease renewal options which can come into
effect toward the end of the lease term.
Within the footnotes the accounting assumptions are revealed with great detail.
Each of the notes seems to clarify any discrepancies that may exist in the market risk
disclosures. The only risk that could be apparent and unaccounted for are two different
interest rates swaps for $350 and $385 million in unsecured notes. The two different
notes are paid at the London InterBank Offered Rate (LIBOR). Recently the validity of
the LIBOR has been under question; a study performed by the Wall Street Journal casts
doubt on the key rate, stating that it is much lower than it should be because banks
have been reporting lower than actual borrowing costs. If these rates are understated
Southwest could be vulnerable to a large increase in the amount of interest owed. It is
understandable that these risks would not have been addressed on the 2007 balance
sheet because only recently has the LIBOR been under question for understated rates.
The firm gives interesting information about its geographic segments. Indeed, in the
10k, Southwest gives a system map where we can see all the cities where Southwest is
present. The company also provides the top ten airports classified by the number of
daily departures. Outsiders can easily quantify the company’s activity and localize where
the key airports are. Moreover, pie graph on the report shows Southwest’s capacity by
region. This is very useful for outsiders to identify market geographic segments.
However, the firm doesn’t share disaggregated performance data with the public. For
example, outsiders have no clue about firm improvements in those geographic
segments during the last years and the objective in that area. The firm does not explain
the intensity of competition in some large cities and consequently, we think that some

59
markets must not be cost effective for Southwest. Southwest just emphasizes the fact
that it returned to San Francisco International Airport and mentions its improving
position in California. The firm’s quality geographic segment disclosure reinforces the
company’s good position in its key areas but is not sufficient to explain its lack of
network or its geographic goals. The main reason must be that it is risky to disclose its
strategic goals to competitors.
Southwest management is very optimistic and likes challenges. In the report, the
firm always shows effective and preventing measures that Southwest took to limit the
extent of the bad news… Southwest is very proud of its 35th consecutive year of
profitability. The firm adopts a very realistic approach by providing the industry specific
data: increase in the unit cost by 3.3 percent, rise of jet fuel for the last five years,
$100 a barrel by fourth quarter 2007, higher fares… But the report shows that the
firm’s performance was not affected “our performance was among the best in the
industry and as good as the year before”. It is a way to emphasize its success against
competitors, and make outsiders see the company as a leader in the industry. It looks
reasonable because the report gives measures that enabled and will enable the firm to
maintain its position. The hedge for 2007 and 2008 with approximately 70 percent of its
fuel needs protected at $51 barrel, the changes in the flight schedule, and the brand
capacity to offer low fares are relevant. The firm provides an Excellent Customer
Service and shows its interest in keeping improving this area with customer research as
she did in 2007 by creating a new way to board. Finally, Southwest offers a concrete
strategy which is to drive more revenue per flight by maintaining its low fare brand. The
firm adopts a very innovative customer focus and anticipating approach to face bad
times. Its long-term outlook is enthusiastic and restores confidence for outsider readers.
The quality of disclosure is very transparent compared to Southwest’s main
competitors. The information was made very clear and provides sufficient decision
useful data that satisfies the needs of financial analysis.
60
Quantitative Analysis
The Generally Accepted Accounting Principle (GAAP) allows some flexibility for
managers responsible for producing the financial statements. As a result, managers can
determine how the information is disclosed and how much information is disclosed in
the financial statements. The purpose of the Quantitative Analysis is to question the
depth and the quality of a firm’s disclosure to evaluate the degree to which a firm’s
accounting captures the underlying business reality. Revenue and Expense diagnostic
screening ratios can inform investors if the company is manipulating the numbers to
make them look better off than they really are and provide a distorted view of actual
revenues or expanses. We will compare the ratios to Southwest competitors’ ratios over
a five year span to determine trends, accounting strategies, and investigate
discrepancies in the airline industry. The following graphs incorporate the diagnostic
ratios for Southwest, AMR, Continental, and Jet Blue. We will analyse first Sales
Manipulation Diagnostic and then Expense Manipulation diagnostics.
Sales Manipulation Diagnostics
These diagnostics involve the affect of several factors on net sales. By dividing net sales
by different line items, we will determine their affects on a firm. By comparing ratios of
Southwest to a sample of the industry, we can see if patterns occur and whether or not
there are immediate differences in industry patterns. Ratio analysis would be useful to
decide if the company has manipulated these numbers to appear more productive. We
will examine three ratios (Net Sales/Cash from sales, Net Sales/Net Accounts
Receivable, and Net Sales/Inventory) to explain the sales fluctuations and help analysts
to attempt to find discrepancies. These ratios will add value to the overall accounting
research and will give a visual indication of “red flags” if they occur.

61
Net Sales/Cash from Sales
This ratio is used to determine if the cash from sales is equal to the sales we had, less
increase in account receivable or plus decrease in account receivable. This is a very
important ratio because it reveals whether management is manipulating sales. Very
often, managers have an incentive to overstate or understate their sales, which is
totally against any business ethics. The idea of the “big bath theory” for example, is to
understate sales when a company has good performance in order to transport those
unreported earnings to another year corresponding to a bad performance year for the
company. The ideal situation for any company would be a ratio around 1.1, thus
indicating that increasing and decreasing sales are supported by cash collected on
sales.
Having a ratio above 1 means that there are more sales than there is cash being
collected for those sales, with the leftover portion of sales remaining on accounts
receivable. Southwest is consistent in their relation to amount of cash from sales as
well as their relation to the industry as a whole. Southwest’s percentage of sales
receipts from cash over the last five years have been higher than most competitors
0.99
1
1.01
1.02
1.03
1.04
1.05
1.06
1.07
2003 2004 2005 2006 2007
Sales/Cash from Sales
Southwest
AMR
Continental
Jet Blue
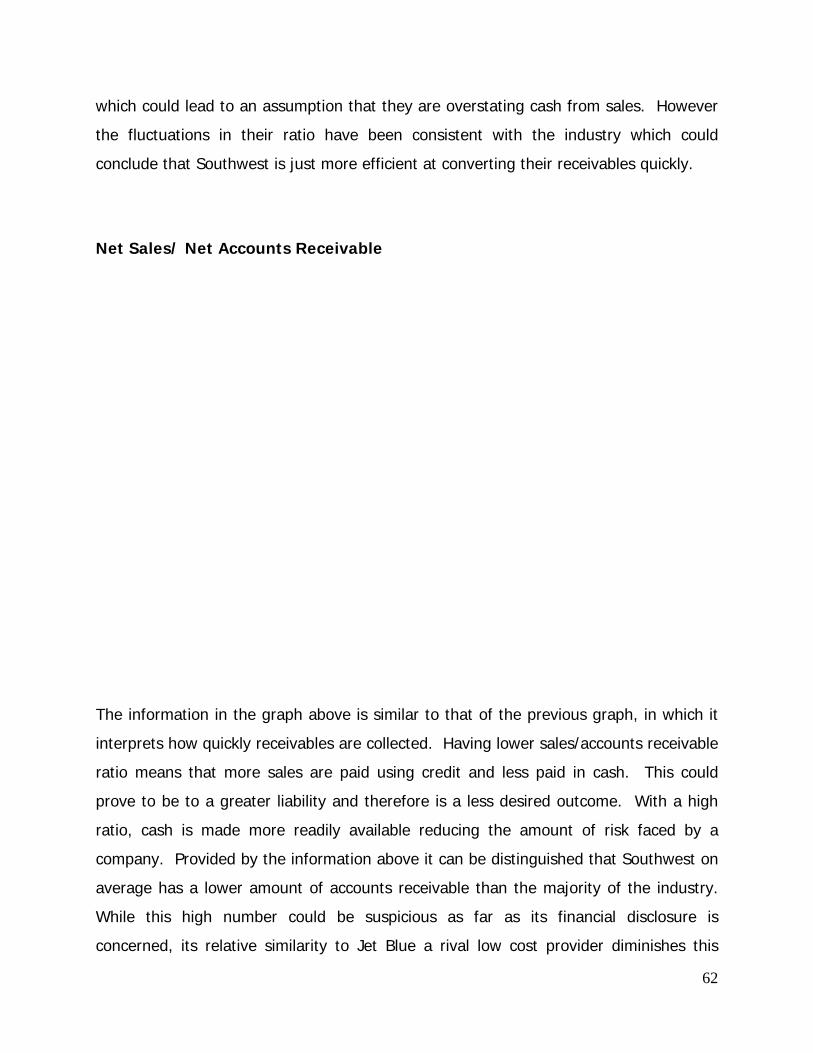
62
which could lead to an assumption that they are overstating cash from sales. However
the fluctuations in their ratio have been consistent with the industry which could
conclude that Southwest is just more efficient at converting their receivables quickly.
Net Sales/ Net Accounts Receivable
The information in the graph above is similar to that of the previous graph, in which it
interprets how quickly receivables are collected. Having lower sales/accounts receivable
ratio means that more sales are paid using credit and less paid in cash. This could
prove to be to a greater liability and therefore is a less desired outcome. With a high
ratio, cash is made more readily available reducing the amount of risk faced by a
company. Provided by the information above it can be distinguished that Southwest on
average has a lower amount of accounts receivable than the majority of the industry.
While this high number could be suspicious as far as its financial disclosure is
concerned, its relative similarity to Jet Blue a rival low cost provider diminishes this

63
concern as far as quality of disclosure.
Net Sales/Inventory
This ratio shows how many times a company’s inventory is sold and replaced over a
period. A low turnover implies poor sales and, therefore, excess inventory. A high ratio
implies either strong sales or ineffective buying.
The chart above shows that the inventory turnover ratio in the airline industry is quite
high. This is due to the fact that the amount inventory relative to the rest of the airline
business is quite low, consisting largely of jet fuel and maintenance equipment.
Southwest’s amount of sales relative to inventory is reasonably consistent with the rest
of the industry with the exception of Jet Blue. The comparative similarities demonstrate
Southwest’s high quality of disclosure, and may point out some aggressive accounting

64
policies used by Jet Blue, as its level of net sales to inventory are drastically higher than
its competitors.
Expense Manipulation Diagnostics
Expense Diagnostics Ratios also help to uncover discrepancies from the financial
statements. These ratios will help to verify if the company has unexplained increase or
decrease in its reported expenses by comparing Southwest Airlines to that of its
competitors within the industry. If this is the case, we would raise a potential red flag in
the accounting policies chosen by the management. Red flags could affect the overall
value of the company. There will be three ratios used in the expense manipulation
diagnostics: Asset turnover, Changes in CFFO/OI and Total Accruals/Sales.

65
Asset Turnover (Net Sales/ Total Assets)
Asset turnover can be used in determining whether a firm is depreciating its assets
properly according to FASB. It also indicates pricing strategy. Companies with low profit
margins tend to have high asset turnover, while those with high profit margins have low
asset turnover.
The ratio of Southwest is under the average of the industry. This financial ratio is
correctly related to Southwest pricing strategy which is to be profitable with low prices.
From one year to another, Southwest’s ratio variation is alternatively negative and
positive. While the fluctuations aren’t significant, remaining close to the overall trend of
the company, it could be a sign of Southwest’s want to either overstate or understate
either sales or assets. In 2005 Southwest’s assets didn’t grow much in comparison to
2004 because there was a very small increase in aircraft lease payments, which were
outweighed by the increase in sales. The reason for the decline from 2006 to 2007 was
due partially to the fact that fuel derivative contracts rose 190%. This is consistent
66
with the dramatic increase in fuel prices for the year, and probably explains why the
industry as a whole experienced reduction in turnover for the year. Consequently, the
ratio, the strategy and the information disclosure in the 10K are related adequately. No
discrepancies are detected.
CFFO / OI (Cash Flow from Operations / Operating Income)
This ratio is highly valuable in determining if a company had any discrepancies within its
operating expenses. When the ratio increases it usually means that are expenses are
increasing, thus making operating income smaller. Operating income is calculated by
subtracting operating expense from gross profit, therefore operating income and
operating expenses have an inverse relationship. CFFO is a measure of the cash
generated by the operating activities. This is an important ratio for the purposes of
expense diagnostics because it communicates how a firm is controlling expenses in
relation to the rest of the industry.

67
Contrary to American airlines and continental tremendous ratios’ variations, Southwest’s
ratio is stable. The ratio reflects the company’s ability to generate its income in the form
of cash. The rise in 2005 is a result of reasonably stable operating expenses and a 92%
increase of cash flow from operations. The drastic increase is due mostly impart to a
decrease in net income between 2003 and 2004, that increased back to its expected
growth rate. This is the result of a constant cost anticipation and proactive financial
management of cash in a changing environment. The close relationship between
Southwest and Jet Blue enforces Southwest’s high level of disclosure, because the two
airlines are very similar in strategy.
Total Accruals/ Sales
Total Accruals represent expenses and revenue that have not been accounted for.
Relating accruals to sales can be used to determine whether a company is either under
or overstating its expense. In general accrued expense on the balance sheet should be
much lower than recorded sales on the income statement.
0
0.05
0.1
0.15
0.2
0.25
0.3
0.35
2003 2004 2005 2006 2007
Total Accruals / Sales
Southwest
AMR
Continental
Jet Blue

68
The graph above illustrates with the exception of Southwest Airlines how much lower
total accruals are in relation to sales in the airline industry. The drastic changes in
numbers shown by Southwest look suspicious and could be the result of a low level of
disclosure, especially when compared to the rest of the industry. Conversely, in the
notes of the in financial it is explained that fuel contracts cause the drastic hike in
Southwest’s ratio. As already discussed fuel prices are quite high and have a large
effect on expenses. The comparative flat lines shown by AMR, Continental and Jet Blue
would appear proper in most industries, however understanding the sensitive nature of
the airline industry these numbers seem quite skeptical as far as the level of disclosure
is concerned. Therefore it would be reasonable to conclude that Southwest doesn’t
have any accounting discrepancies, and that the large fluctuations are a result of the
sensitive nature of the airline industry.
Conclusion
After the analysis of both qualitative and quantitative of the quality of disclosure, we
are able to determine the integrity and accuracy of the figures in the financial
statements produced by the firm’s management. We don’t really notice any major
discrepancy. The quality of disclosure is elevated in general and in comparison to most
of the firms in the airlines industry.
69
Potential Red Flags
In accounting analysis, red flags are areas in which the analyst can determine
questionable areas of accounting quality. These potential disaster areas could help lead
the reader as to the quality of the disclosure principles of the company’s management.
Southwest seems to be a very efficiently ran firm with very little potential problem
sectors in their financials. However there were a few areas of concern that led us to
believe of a few quantitative discrepancies in their balance sheet report.
Changes in accounting
As of September 2006, the FASB introduced a new type of accounting disclosure.
Statement No. 157, “Fair Value measurements”, defines a new framework of accurately
judging an entity’s value measurements. This statement plans to be enacted on Jan 1st
2008. As far as South west is concerned, this statement will not have a large impact on
its financial condition. The FASB also introduced statement No. 159, “The Fair Value
Option for Financial Assets and Financial Liabilities.” This new accounting disclosure
principle also appears to have little effect on Southwest’s financials. They believe that
their financial instruments are updated frequently to fair market value.
Conservatism approach
Southwest applies the Conservatism type of policy to a couple different issues.
Revenues are usually greatly understated due to Southwest’s initial ticket sales being
classified as an “air traffic liability.” These fair amounts that could be purchased as far
as months ahead of time are places into the company’s liability portion of the balance
sheet. These funds are not transferred to the sales revenue side of the balance sheet
until the physical act of transportation takes place. However, even though initially
recorded as a liability Southwest is reassured that these revenues will be recognized at

70
a later date due to their “non-refundable” ticket policy. Another policy that greatly
understates Southwest’s Balance sheet is their allowance by the flexibility principle to
not disclose and obligations associated with the company’s 95 leased aircraft. Even
though Southwest does include an expense account that is responsible for the aircraft’s
maintenance, insurance, and operating costs, there is no recording of any asset
addition to the tangible fleet section, except for 2 aircraft for 2007. These leased
aircraft also shows an type of conservatism in Southwest’s accounting policy.
Hedging techniques as well as Derivative and Financial Instruments
The airline industry today is focused on keeping their airline fuel costs as low as
possible. In the year 2007 these fuel costs represented approximately 28 percent of
Southwest’s operating costs alone. With the ever rising fuel and oil/gas prices changing
every day, each airline entity is approaching this dilemma with their own respected cost
efficient approach. We found that an enormous difference in assets was recorded from
the fiscal year or 2006 to 2007. Southwest went from spending 630 million dollars in
2006 to 1,318,000,000 in 2007 on noncurrent fuel contracts. This amount of dollar
increase definitely posed to be a bold move on Southwest’s behalf and definitely posed
to be an accounting red flag.
Operating Expenses with regards to Operating Leases
Surprisingly enough, we believe that there were no potential red flags in
accounting with regards to Southwest’s operating leased aircraft. As for 2007,
Southwest added 39 aircraft, of which only 2 were leased. This helped to increase
revenue capacity by 7.5%, but was slightly outweighed by a cumulative operating cost
increase of 11.3%. (Southwest’s 2007 Annual report) This outweighing operating cost
was not due to the increase expenses of leased and owned aircraft, but was due to the
substantial increase in gas and oil. On Southwest’s per-ASM dollar basis, their fuel and
71
oil expense increased a staggering 46.2% from 2006 t0 2007. (Southwest’s 2007
Annual Report)

72
Undoing Accounting Disclosures
As far as the new accounting policies that were enacted as of this year, and
Southwest’s somewhat form of conservatism in recognizing revenues and recordings of
leased aircraft, these red flags are very minute in the overall financial picture. We
believe that Southwest’s way of disclosing this information is very efficient pertaining to
the specific time periods that they are recorded as well as the costs that are estimated
with these activities.
With regards to their hedging/derivative techniques we believe that there could
be some discrepancies in their estimated costs for future contracts. Along with their
estimated 1,318,000,000 dollars in spending on noncurrent fuel contracts, they have
also recorded spending 1,069,000,000 on jet fuel contracts. The main difficulty that we
see with these numbers are that even with their closer to perfect information than we
can obtain, there will still be estimation errors with any hedging/derivative technique.
Due to “dirty hedging” for jet fuels Southwest cannot guarantee a long term contract to
keep their purchases of jet fuel low. Therefore they use the “clean” hedging technique
to invest in non jet fuel assets such as crude oil, heating oil, and unleaded gasoline. To
suffice for the ever rising fuel costs, Southwest hopes that this return on investment will
be able to keep their jet fuel prices at around $63 a barrel. The problem that we have
with this “fair swap” of money, is that there will always be estimation errors in these
contractual agreements due to spikes in demand, as well as other economic forces.
As per the balance sheet change from 2006-2007, there was actually a .01%
decrease in operating leased aircraft, and no change in the Depreciation and
amortization, as well as the Other line accounts. This helps us believe that there is no
distortion in Southwest’s conservative approach to recording its operating leased
aircraft accounts.

73
Financial Ratio Analysis
Financial ratio analysis assesses past and present data in order to help determine a
firm’s financial performance. The ratios used help analyze a firm’s value in three
different areas: Liquidity, profitability, and capital structure. Ratio analysis is an easy
way to compare different firms, as well as benchmarking a particular firm against the
industry as a whole. The comparison of a firm against the rest of the industry helps in
determining both positive and negative characteristics of a particular firm; these
characteristics can be made obvious when they vary from the results of the industry.
The ratios used can illustrate a change in a particular firm’s strategy, as well as the
systematic effects of an industry. These ratios also allow for the forecasting of future
performance of both a particular firm and the industry.
Liquidity Analysis
Liquidity refers to the cash equivalence of assets and the firm’s ability to maintain
sufficient near-cash resources to meet its current obligations in a timely manner. In
general, if a company’s ratio value is high, it will have a larger margin of safety to cover
short-term debt. Five ratios will be used in the calculation of liquidity, which include:
Current ratio, quick ratio, receivables turnover, days sales outstanding, and working
capital turnover. The ability of a company to convert short-term liabilities in to cash is
particularly important to companies seeking debt financing because it shows a
company’s ability to payoff its debt.
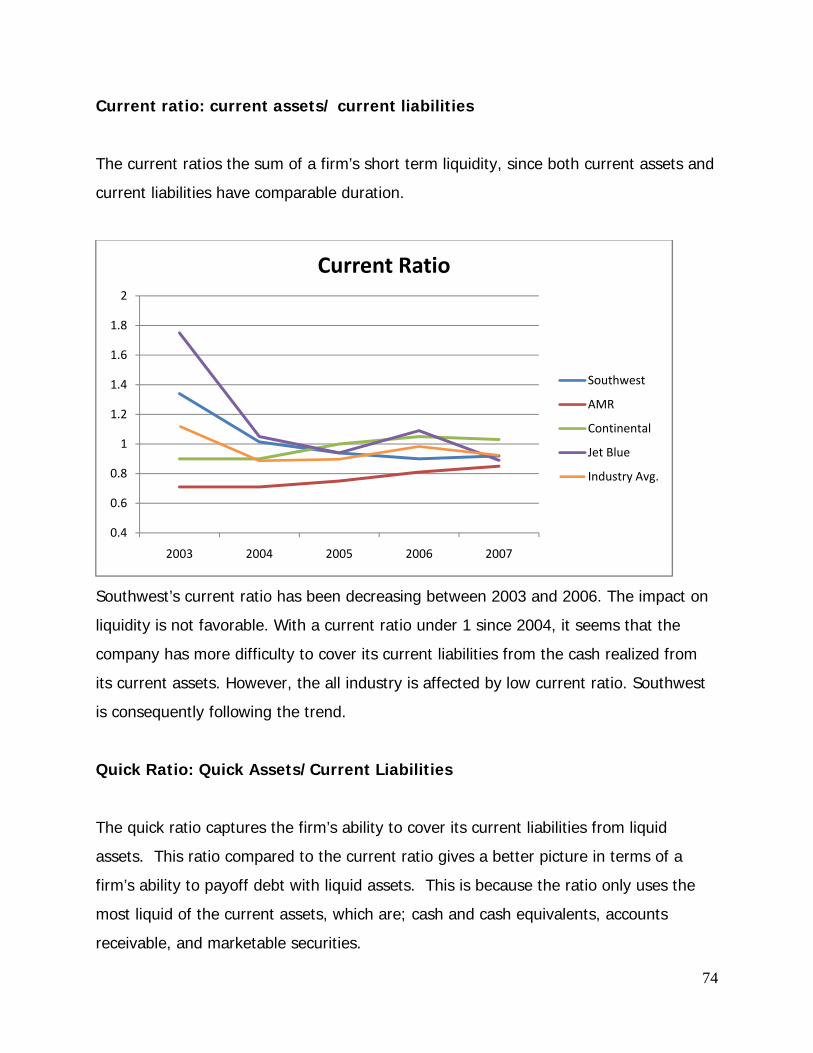
74
Current ratio: current assets/ current liabilities
The current ratios the sum of a firm’s short term liquidity, since both current assets and
current liabilities have comparable duration.
Southwest’s current ratio has been decreasing between 2003 and 2006. The impact on
liquidity is not favorable. With a current ratio under 1 since 2004, it seems that the
company has more difficulty to cover its current liabilities from the cash realized from
its current assets. However, the all industry is affected by low current ratio. Southwest
is consequently following the trend.
Quick Ratio: Quick Assets/Current Liabilities
The quick ratio captures the firm’s ability to cover its current liabilities from liquid
assets. This ratio compared to the current ratio gives a better picture in terms of a
firm’s ability to payoff debt with liquid assets. This is because the ratio only uses the
most liquid of the current assets, which are; cash and cash equivalents, accounts
receivable, and marketable securities.
0.4
0.6
0.8
1
1.2
1.4
1.6
1.8
2
2003 2004 2005 2006 2007
Current Ratio
Southwest
AMR
Continental
Jet Blue
Industry Avg.

75
The quick ratio tends to be the same for all the firms in the industry. We explain this
trend by the high part of inventory in the current liabilities which decreases the ratio
and increases the similarity between airlines firms. We notice with this ratio the
decreasing degree of differentiation in the industry and the limited number of strategy
in this competitive industry. Southwest has the lowest quick ratio but it does not mean
anything particular.
Receivables Turnover: Sales/Accounts Receivable
This ratio measures the number of times, on average; receivables are collected during
the period. The ability to collect receivables relates to how efficient a company is in
using its assets. The higher a company’s turnover, the quicker it collects cash. With
more cash on had the quicker a company can cover its debts and increase its liquidity.
0
0.2
0.4
0.6
0.8
1
1.2
1.4
1.6
1.8
2003 2004 2005 2006 2007
Quick Ratio
Southwest
AMR
Continental
Jet Blue
Industry Avg.
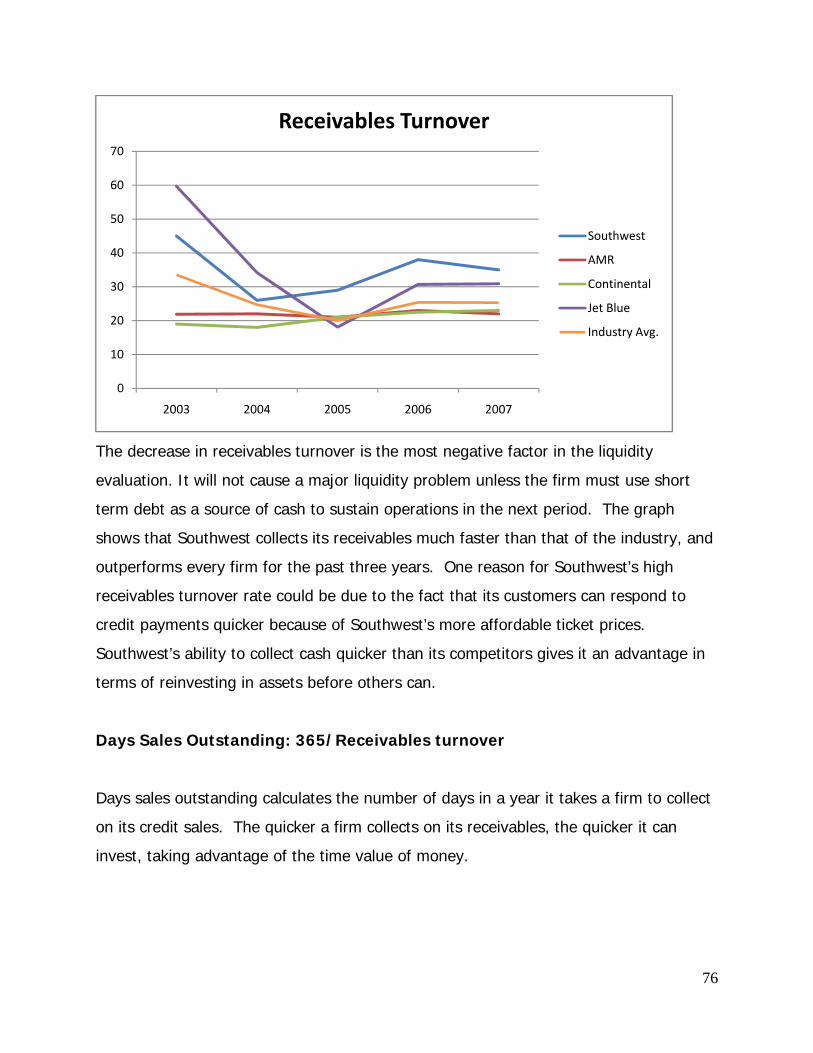
76
The decrease in receivables turnover is the most negative factor in the liquidity
evaluation. It will not cause a major liquidity problem unless the firm must use short
term debt as a source of cash to sustain operations in the next period. The graph
shows that Southwest collects its receivables much faster than that of the industry, and
outperforms every firm for the past three years. One reason for Southwest’s high
receivables turnover rate could be due to the fact that its customers can respond to
credit payments quicker because of Southwest’s more affordable ticket prices.
Southwest’s ability to collect cash quicker than its competitors gives it an advantage in
terms of reinvesting in assets before others can.
Days Sales Outstanding: 365/Receivables turnover
Days sales outstanding calculates the number of days in a year it takes a firm to collect
on its credit sales. The quicker a firm collects on its receivables, the quicker it can
invest, taking advantage of the time value of money.
0
10
20
30
40
50
60
70
2003 2004 2005 2006 2007
Receivables Turnover
Southwest
AMR
Continental
Jet Blue
Industry Avg.
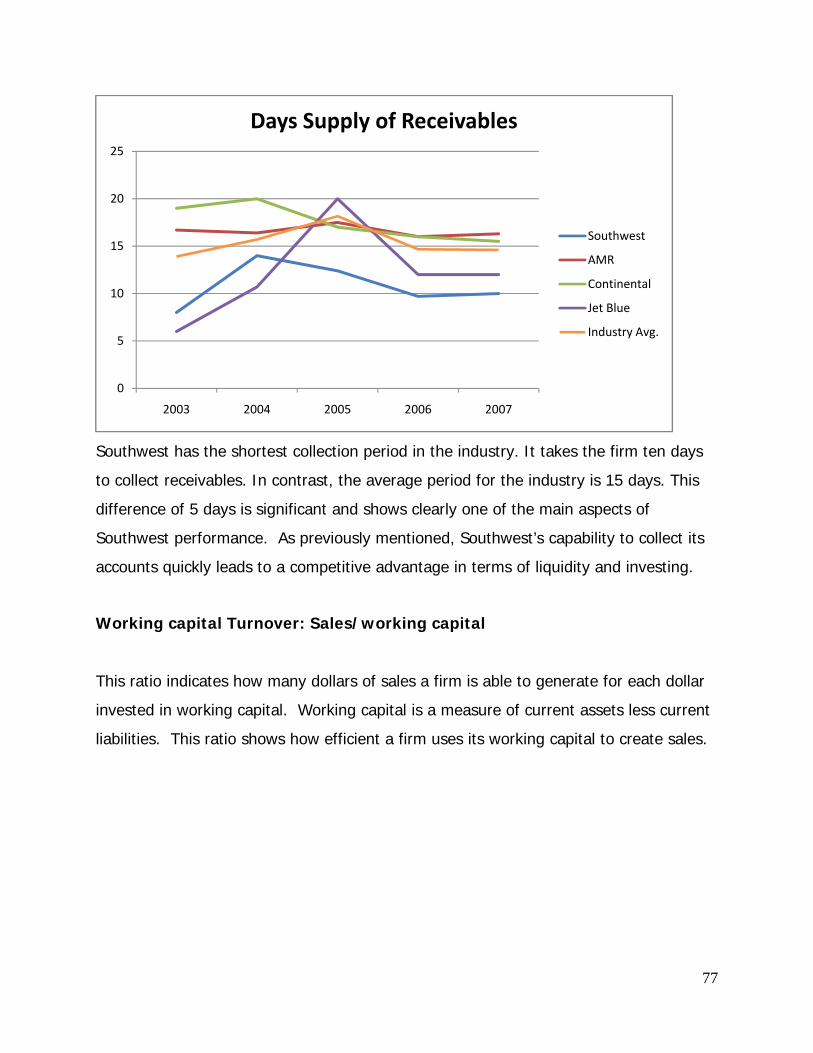
77
Southwest has the shortest collection period in the industry. It takes the firm ten days
to collect receivables. In contrast, the average period for the industry is 15 days. This
difference of 5 days is significant and shows clearly one of the main aspects of
Southwest performance. As previously mentioned, Southwest’s capability to collect its
accounts quickly leads to a competitive advantage in terms of liquidity and investing.
Working capital Turnover: Sales/working capital
This ratio indicates how many dollars of sales a firm is able to generate for each dollar
invested in working capital. Working capital is a measure of current assets less current
liabilities. This ratio shows how efficient a firm uses its working capital to create sales.
0
5
10
15
20
25
2003 2004 2005 2006 2007
Days Supply of Receivables
Southwest
AMR
Continental
Jet Blue
Industry Avg.

78
This ratio is very low compared to the industry average. Southwest doesn’t seem to
use its working capital effectively to generate sales. Southwest previously outperformed
the industry before 2005 in which it dropped below that of the industry. While
Southwest’s turnover is negative it doesn’t mean that the amount of sales have gone
down, in fact Southwest’s sales have gone up each year consecutively. The negative
ratio demonstrates a liquidity risk in terms of paying back debt. This is a negative
aspect of Southwest, however most of the industry either has or have had negative
turnovers, thus making Southwest’s performance close to that of the industry where it
is not alone.
Conclusion
Southwest liquidity performance is generally better than the average industry.
Southwest’s ability to obtain enough liquidity contributes towards the firm’s position as
a main player in the industry, even if the ratios are usually low compared to other
industries with a lowest degree of competition and pressure. Southwest’s higher than
average performance may be some of the contributing factors to its ability to keep costs
so low and hedge fuel better than its competitors.
‐75
‐25
25
75
125
175
225
275
325
375
425
2003 2004 2005 2006 2007
Working Capital Turnover
Southwest
AMR
Continental
Jet Blue
Industry Avg.

79
Profitability Analysis
The principal objectives of this part are to evaluate four critical factors related to
profits: operating efficiency, asset productivity, rate of return on assets, and rate of
return on equity. Each factor looks at different areas of a firm’s financials and relates
them to the overall profitability of that firm. The profitability analysis will also compare
different firms in the industry in order to ascertain where a particular firm sits in relation
to other firms.
Operating efficiency
By relating all income statement items to sales, the analysis permits comparison of
expense levels and profit measures on a relative basis. We can easily see areas of
improvement or deterioration in profitability.

80
Gross profit margin: gross profit/sales
This ratio is an indication of the extent to which revenues exceed direct costs
associated with sales. It Gross profit margin serves as the source for paying additional
expenses and future savings
The graph above demonstrates the low procurement rate that exists in the airline
industry. This is because the cost of flying is increasingly more expensive for airlines.
The largest factors being affecting the high cost of revenue (cost of goods sold) are jet
fuel and aircraft maintenance, both of which have risen dramatically in price.
Southwest’s gross profit margin is low, but when compared within the airline industry
Southwest’s margin is higher than its competitors. Southwest’s success in comparison
to its competitors could be attributed to its excellent fuel hedging strategy, their ability
to fill seats on planes, and of course their low cost strategy.
0.00%
5.00%
10.00%
15.00%
20.00%
25.00%
30.00%
35.00%
40.00%
45.00%
2003 2004 2005 2006 2007
Gross Profit Margin
Southwest
AMR
Continental
Jet Blue
Industry Avg.

81
Operating Profit Margin: Operative income/Sales
Operating margin is a measurement of what proportion of a company's revenue is left
over after paying for variable costs of production such as wages, raw materials, etc. It
gives an idea of how much a company makes on each dollar of sales. If a company’s
margin is increasing, it is earning more per dollar of sales.
Like that of gross profit margin, operating profit margin in the airline industry is also
very low. This is due to all of the additional costs attributed to the industry. After cost
of revenue a firm must take into account operating expenses, for Southwest these
include; salaries, wages, and benefits, as well as depreciation and amortization costs.
While Southwest’s operating profit margin isn’t very high it is once again greater than
that of its competitors. This may be attributed to Southwest’s low employee turnover
rate and its ability to buy planes cheaper because of the company’s moderate
economies of scale and the fact that it only buys one model of plane, the Boeing 737.
‐10.00%
‐5.00%
0.00%
5.00%
10.00%
15.00%
20.00%
2003 2004 2005 2006 2007
Operating Profit Margin
Southwest
AMR
Continental
Jet Blue
Industry Avg.

82
Net Profit Margin: Net income/Sales
It measures how much out of every dollar of sales a company actually keeps in
earnings. A higher profit margin indicates a more profitable company that has better
control over its costs compared to its competitors.
The chart above illustrates how efficient at cutting costs Southwest is in contrast with
the rest of the industry. Southwest is the only firm that has not had a negative net
profit margin in the past five years, making it the most profitable airline in terms
collecting on sales. Another positive aspect that can be observed by this graph is
Southwest’s relatively constant net profit margin; over the last five years Southwest has
stayed around a 6% margin with only one slight drop which was common within the
entire industry.
‐8.00%
‐6.00%
‐4.00%
‐2.00%
0.00%
2.00%
4.00%
6.00%
8.00%
10.00%
12.00%
2003 2004 2005 2006 2007
Net Profit Margin
Southwest
AMR
Continental
Jet Blue
Industry Avg.

83
Conclusion
Southwest’s operating efficiency is well above that of the industry. The reason is
probably due to the fact that Southwest’s primary focus is on cost reduction. Keeping
costs down creates the potential for greater profit margins, which is something
Southwest obviously takes advantage of. Southwest is able to gain more net income
because it is consistent in keeping other expenses down, consistency that is less
evident with other companies, which is the reason for both positive and negative
profits.
Asset productivity
Asset Turnover: sales/total assets
This ratio measures the revenue productivity of resources employed by a company. The
revenue productivity of total resources is an important factor in evaluating profitability.
The ratio measures the amount of sales dollars that were generated for every dollars
worth in assets.
0.4
0.5
0.6
0.7
0.8
0.9
1
1.1
1.2
1.3
1.4
2003 2004 2005 2006 2007
Asset Turnover
Southwest
AMR
Continental
Jet Blue
Industry Avg.

84
The asset turnover ratio is low in the airlines industry because airplanes are very
expensive. Southwest owns the majority of its planes whereas its competitors lease the
majority of their planes. Southwest’s total assets are consequently very high, which
explains why Southwest has a low asset turnover. Southwest situation is not alarming
and follows the general trend of the industry.
Return on Assets: Net Income/Total Assets
This is a comprehensive measure of profitability that considers both profits and
resources employed to earn profits. The ratio measures how efficient a firm is at
converting its assets into profit. The higher the ratio, the better the firms is at earning
money on its investment.
Southwest’s ROA is above the average of the industry. This ratio tells that Southwest is
able to generate more profit than its competitors for each dollar of assets invested. We
already know that Southwest has more assets than its competitors, but this ratio
permits to assert now that Southwest investment strategy in assets is working and is
participating actively in profit creation. Southwest is also following the general trend of
‐6.00%
‐4.00%
‐2.00%
0.00%
2.00%
4.00%
6.00%
8.00%
10.00%
2003 2004 2005 2006 2007
Return on Asset
Southwest
AMR
Continental
Jet Blue
Industry Avg.

85
the industry making its efficiency look sustainable rather than just something sporadic
and unattainable in the long-run.
Return on Equity: Net Income/ Equity
ROE measures the profitability of the owners’ interest in total assets. ROE is a
comprehensive indicator of a firm’s performance because it provides an indication of
how well managers are employing the funds invested by the firm’s shareholders to
generate returns.
2003 2004 2005 2006 2007Southwest 0.1 0.043 0.088 0.075 0.1AMR -1.28 -16.3 1.47 -0.16 -0.832Continental 0.037 -0.560 -0.439 1.518 1.323Jet Blue 0.251 0.069 -0.03 0 0.019
Southwest ROE is similar to JetBlue ROE but differs heavily from other competitors with
respect to ROE fluctuations. Southwest shows less volatility than the industry but is
‐16.3‐200.00%
‐150.00%
‐100.00%
‐50.00%
0.00%
50.00%
100.00%
150.00%
2003 2004 2005 2006 2007
Return on Equity
Southwest
AMR
Continental
Jet Blue
Industry Avg.

86
consistent with the overall linear trend of the industry. The consistency will allow
managers to better predict the amount of equity financing they will have to work with,
which could prove to be beneficial in the long-run. Southwest has a low ROE because it
is much more equity financed than the majority of its competitors.
Conclusion
Southwest’s performance in utilizing its assets is good. While it has a large amount of
assets and isn’t able to gain as much revenue as all of its competitors, it is efficient in
turning its assets into net income, which is what really matters. While Southwest
doesn’t outperform its competitors in each area, it is always in line with the industry
trend.
Capital Structure Analysis
The capital structure of a company refers to the sources of financing used to acquire
assets. In analyzing capital structure, there are two main concerns: The amount of
debt relative to the owners’ equity; the ability to service the principal and interest
requirements on debt.
Debt to Equity ratio: Total liabilities/Owners’ equity
This ratio is an indicator of the credit risk to which a company is exposed. It indicates
what proportion of equity and debt the company is using to finance its assets. The
higher the ratio, the more a company is financed in debt compared to equity.

87
Southwest Airlines has a low debt to equity ratio. This is positive because it means that
Southwest uses both sources of financing. It is a good way to deal with the advantages
and disadvantages of each king of financing. For example, the existence of debt
financing shows that Southwest is a reliable company because it is able to pay interests.
Equity financing can be important for generating high returns for example but dilutes
ownership. Overall, Southwest follows the general trend of the industry, and in 2007
each company appears to have approximately the same debt equity ratio, leaving no
outliers.
Times interest earned: NIBIT/ Interest expense
This ratio indicates the adequacy of income from operations to cover required interest
charges. In this case companies would prefer to have a high ratio because it would
mean that a company’s interest expenses are relatively lower, allowing for a greater net
income after interest expense is paid.
636.6
‐60
‐40
‐20
0
20
40
60
80
2003 2004 2005 2006 2007
Debt to Equity ratio
Southwest
AMR
Continental
JetBlue
Industry Avg.

88
Southwest Airlines has a ratio more elevated than its industry. This means that
Southwest is able to cover required interest charges better than its competitors.
Therefore, Southwest is able to keep a higher part of its NIBIT than its competitors to
finance activities unrelated to interest charges. This ratio associated with the debt to
equity ratio indicates that Southwest appeals to debt financing in adequate proportions
to be able to cover the interest expense successfully.
Debt service margin: CFFO/ CLTD
This ratio measure the adequacy of cash provided by operations to cover required
annual payments on the principal amount of long term liabilities. A margin equal to or
greater than 1.0 allows firms to pay off current long-term debt payments. The higher
the ratio, the more cash a firm has available for other business operations.
‐20
‐10
0
10
20
30
40
50
60
70
80
2003 2004 2005 2006 2007
Times interest earned
Southwest
AMR
Continental
JetBlue
Industry Avg.

89
There is a huge variation for the Southwest debt service margin. It can illustrate the
change in cash every year provided by operations to cover long term liabilities. The
ratio is always positive and above the industry level which means that Southwest
provides enough cash every year to cover liabilities. The high ratio in 2005 and 2007
illustrates the firm’s performance and capacity to generate more cash (from operations)
than needed to cover liabilities.
Credit Risk Analysis
The Altman Z-Score is used in order to determine bankruptcy risk of a particular firm.
Edward Altman’s Z-Score determines a company’s financial health by forecasting its risk
and measuring its score. There are two important numbers in the Z-Score: 1.81 and
2.67, these numbers are used to differ between high and low risk of bankruptcy. If a
firm’s value is below 1.81 its risk of bankruptcy is high. If a firm’s value is above 2.67
then its risk of bankruptcy is considerably low. Between these numbers is referred to
as the grey area, in this region a firms bankruptcy risk is unclear.
0
5
10
15
20
25
2003 2004 2005 2006 2007
Debt service Margin
Southwest
AMR
Continental
JetBlue
Industry Avg.

90
It isn’t any secret that companies in the airline industry are highly susceptible to
bankruptcy, in fact most airlines in the US have filed for bankruptcy at least once. With
that in mind the Z-Score results were anything but a surprise. The only score that was
reasonable when compared to that of the industry was Southwest’s. While the score is
less than desirable the positive note is that it is consistently above its competitors and it
barely dips below the bankruptcy in an industry that averages very high bankruptcy
risk.
Internal Growth Rate: ROA[1-(Div./NI)]
Internal growth rate is the maximum amount a firm can grow without the use of any
external financing. The growth rate measured is dependent on the amount of earnings
a firm can retain. The internal growth rate is a function of return on assets and
retained earnings.
0
0.5
1
1.5
2
2.5
3
3.5
2003 2004 2005 2006 2007
Z‐Score
Southwest
AMR
Continental
Jet Blue
Industry Avg.
2.67
1.81

91
Southwest’s internal growth rate is higher and more consistent than its competitors.
This shows the strength of Southwest’s capital structure, that if the industry was no
longer able to receive outside funding, Southwest would grow at the fastest rate. The
negative rate in the industry can be explained by the negative net income that is
prevalent in the airline industry.
Sustainable Growth Rate: IGR[1+(D/E)]
Sustainable growth rate is the maximum amount a firm can grow without having to
borrow more money. This ratio calculates the growth in firm assets with both internal
and external financing.
‐0.06
‐0.04
‐0.02
0
0.02
0.04
0.06
0.08
0.1
2003 2004 2005 2006 2007
Internal Growth Rate
Southwest
AMR
Continental
Jet Blue
Industry Avg.

92
The two low-cost competitors Southwest and Jet Blue have reasonably similar and
consistent growth rates of around zero. The low to almost non-existent growth rate
found must mean that both of these firms must rely on leverage in order to increase
their capital structure. The rest of the firms, like the results found from the internal
growth rate analysis fluctuate between negative and positive.
Conclusion
Southwest’s capital structure is quite efficient when compared to the industry average
as well as individual firms. Southwest either outperforms the industry or is along the
same trend, in which most cases the company is less volatile than the average firm.
‐16
‐3.5
‐3
‐2.5
‐2
‐1.5
‐1
‐0.5
0
0.5
1
1.5
2
2003 2004 2005 2006 2007
Sustainable Growth Rate
Southwest
AMR
Continental
Jet Blue
Industry Avg.

93
Financial Statement Forecasting
By analyzing a company’s income, balance, and cash-flow statements, a financial
analyst can better determine a company’s future well being. The documents report to
the analyst historical data, as well as up to date information to help better his/her
decision. First off the analyst must contract important data into a common-size
statement in terms of percentages. Here he/she can use different ratios, growth rates,
and averages to help better forecast the performance of the chosen company. Our
choice was to forecast the next ten years of these financial statements to help give us a
better view of the future cash flows to come.

94
Income Statement
The income statement is the first set of financials that we used in order to help
us forecast a more accurate valuation of later revenues and expenses. To further assist
our predictions, we used the last six years of historic income financials of Southwest.
The spread of years selected were 2002-2007. Along with computing average
percentage growth/deteriating rates, we also used current/future economic factors as
well as enabling new future strategies to help us in our future forecasts. With this
approach our selected forecastable items were: Total Revenue, Total Cost of Revenue,
Gross Profit, Depreciation/Amortization, Total Operating Expenses, and Net Income
Before Extra. Items.
The first line item in our forecastable approach was Total Revenue. We first
decided to take the percent average of which the Total Revenue was increasing from
year to year. In the first 5 years, Southwest’s Total Revenue was growing at an average
of almost 14% each year. However recently, their Total Revenue growth rate has
slightly declined back down to 8.5%. This is largely affected by the raise in jet fuel
prices, which has greatly increased our expense account. Even though Southwest has
major strategic plans of acquiring additional planes for its fleet in 2009, we believe that
with the economy raising fuel prices and the somewhat inefficient short-term hedging
strategies of acquiring cheaper fuel for longer periods of time, to go with a 10.5%
growth rate to Total Revenue each additional year.
The next line item that we forecasted was the Cost of Total Revenue. These
numbers almost followed a uniform increasing percent increase with regards to the
increasing Total Revenue. However, there were some years that did not follow this
pattern, so we believed that the best approach to predicting this growth rate would be
to go with the average percent of Total Revenue. This approach deems acceptable to
us due to the range of the percentiles no more differentiating from each other than

95
more than 3%. Our final conclusion came to 69.2%. In immediate succession to this
conclusion, we concurred that it would deem fit to have our Gross Profit equate to the
remaining 30.8%, seeing that the Cost of Revenue and Gross Profit must equal 100%
of the Total Revenue. This Gross Profit percentage also fit to set with our estimates by
closely correlating with the 6 year GPavg of 28.36%
Our fourth item line to forecast is the Depreciation/Amortization line. These
expenses have been increasing year to year at a very steady rate. This is due to
Southwest’s slight addition each year to their fleet to compensate for older planes,
along with the continuing form of straight-line depreciation that they keep constant with
their accounting policies. This policy allows for each plane to have a useful life of 25
years with a 15% salvage value that helps pay for new additional inventory. However,
Southwest has us suspect to believe that their will be a greater addition to the fleet in
2009, “The largest low-fare airline may keep as many as 10 older planes set to be retired in 2008
and then add 14 new jets in 2009,” (Mary Schlangenstein, Bloomberg.com) As for 2008, we
have decided that the best estimate will be to continue with the continuing trend of
decrease to 5.5% and then to slightly increase this series percent to 5.9% in 2009 to
compensate for additional depreciation cost.
Another trend series that we picked to forecast was the Total Operating Expense.
This will be our greatest differentiation from the norm avg. percent of Total Revenue.
For the first five years of our financials, 2002-2006, Southwest has shown their
competitive advantage in showing on a constant basis of lowering their Total Operating
Expense percentage of Total Revenue. However, for the 2007 annual report the
increase in these total expenses is helpful in foreshadowing our beliefs on what is to
come. We believe that with Southwest’s short term derivative hedging strategies, the
inevitability of raising fuel prices, and the soon to come acquisition of additional aircraft,
will all greatly increase their Total Operating Expenses. Therefore, with this knowledge
of future events we believe that this series percentage of Total Revenue will forever
96
increase at some nominal rate. With our ability of limited information, we therefore will
have this series trend increase to 93.5% of Total Revenue.
Even with this great discrepancy in raising Total Operating Expenses, we decided
to analyze Southwest’s Net Income Before Extra. Items with a conservative approach.
We realize that with these forever increasing Operating Costs that this account series
should be forecasted to be lower. However with Southwest’s strong knowledge of the
industry, and their ability to always have a profitable competitive advantage over their
competing firms in multiple areas, (see Firm Competitive Advantage section for further
details) we believe that the Net Income Before Extra. Items will stay stable over time.
Therefore we used the 6 year average of 5.58% to further continue our forecasted
estimation for the company’s future 10 years of operation.

97
Income Statement
Income Statement
In Millions of (except for per share items)12/31/2002 12/31/2003 12/31/2004 12/31/2005 12/31/2006 12/31/2007 12/31/2008 12/31/2009 12/31/2010 12/31/2011 12/31/2012 12/31/2013 12/31/2014 12/31/2015 12/31/2016 12/31/2017
Total Revenue 5,521.77 5,937.00 6,530.00 7,584.00 9,086.00 9861.00 10896.405 12040.52753 13304.78292 14701.78512 16245.47256 17951.24718 19836.12813 21918.92159 24220.40835 26763.55123Cost of Revenue, Total 3,731.12 4,087.00 4,637.00 5,186.00 6,311.00 7081 7540.31226 8332.045047 9206.909777 10173.6353 11241.86701 12422.26305 13726.60067 15167.89374 16760.52258 18520.37745Gross Profit 1,694.91 1,748.00 1,760.00 2,226.00 2,573.00 2506 3356.09274 3708.482478 4097.873138 4528.149817 5003.605548 5528.984131 6109.527464 6751.027848 7459.885772 8243.173778Selling/General/Admin. Expenses, Total ‐ ‐ ‐ ‐ ‐ ‐Research & Development ‐ ‐ ‐ ‐ ‐ ‐Depreciation/Amortization 356.30 384.00 431.00 469.00 515.00 555 599.302275 710.391124 784.982192 867.4053222 958.482881 1059.123583 1170.33156 1293.216374 1429.004093 1579.049522Interest Expense(Income) ‐ Net Operating ‐ ‐ ‐ ‐ ‐ ‐Unusual Expense (Income) ‐ ‐ ‐ ‐ ‐ ‐Other Operating Expenses, Total 1,017.01 983.00 1,058.00 1,204.00 1,326.00 1,434.00 Total Operating Expense 5,104.43 5,454.00 6,126.00 6,859.00 8,152.00 9070 10188.13868 11257.89324 12439.97203 13746.16909 15189.51684 16784.41611 18546.7798 20494.19168 22646.08181 25023.9204Operating Income 417.34 483.00 404.00 725.00 934.00 791.00 Interest Income(Expense), Net Non‐Operating ‐52.34 ‐34.00 ‐28.00 ‐36.00 7.00 ‐25.00 Gain (Loss) on Sale of Assets ‐ ‐ ‐ ‐ ‐ ‐Other, Net 27.68 259.00 ‐37.00 90.00 ‐151.00 292.00 Income Before Tax 392.68 708.00 339.00 779.00 790.00 1,058.00 Income After Tax 240.97 442.00 215.00 484.00 499.00 645.00 Minority Interest ‐ ‐ ‐ ‐ ‐ ‐Equity In Affiliates ‐ ‐ ‐ ‐ ‐ ‐Net Income Before Extra. Items 240.97 442.00 215.00 484.00 499.00 645.00 Accounting Change ‐ ‐ ‐ ‐ ‐ ‐Discontinued Operations ‐ ‐ ‐ ‐ ‐ ‐Extraordinary Item ‐ ‐ ‐ ‐ ‐ ‐Net Income Before Extra. Items 240.97 442.00 215.00 484.00 499.00 645 608.019399 671.8614359 742.4068867 820.3596098 906.4973688 1001.679593 1106.85595 1223.075824 1351.498786 1493.406159
In Millions of (except for per share items)12/31/2002 12/31/2003 12/31/2004 12/31/2005 12/31/2006 12/31/2007 12/31/2008 12/31/2009 12/31/2010 12/31/2011 12/31/2012 12/31/2013 12/31/2014 12/31/2015 12/31/2016 12/31/2017
Total Revenue 100% 100% 100% 100% 100% 100% 100% 100% 100% 100% 100% 100% 100% 100% 100% 100%Cost of Revenue, Total 67.57 68.84 71.01 68.38 69.46 71.81 69.2 69.2 69.2 69.2 69.2 69.2 69.2 69.2 69.2 69.2Gross Profit 30.7 29.44 26.95 29.35 28.32 25.41 30.8 30.8 30.8 30.8 30.8 30.8 30.8 30.8 30.8 30.8Selling/General/Admin. Expenses, Total ‐ ‐ ‐ ‐ ‐ ‐Research & Development ‐ ‐ ‐ ‐ ‐ ‐Depreciation/Amortization 6.45 6.47 6.6 6.18 5.67 5.63 5.5 5.9 5.9 5.9 5.9 5.9 5.9 5.9 5.9 5.9Interest Expense(Income) ‐ Net Operating ‐ ‐ ‐ ‐ ‐ ‐Unusual Expense (Income) ‐ ‐ ‐ ‐ ‐ ‐Other Operating Expenses, Total 18.42 16.56 16.2 15.88 14.59 14.54Total Operating Expense 92.44 91.86 93.81 90.44 89.72 91.98 93.5 93.5 93.5 93.5 93.5 93.5 93.5 93.5 93.5 93.5Operating Income 7.56 8.14 6.19 9.56 10.28 8.02Interest Income(Expense), Net Non‐Operating ‐0.95 ‐0.57 ‐0.43 ‐0.47 0.08 ‐.25Gain (Loss) on Sale of Assets ‐ ‐ ‐ ‐ ‐ ‐Other, Net 0.5 4.36 ‐0.57 1.19 ‐1.66 2.96Income Before Tax 7.11 11.93 5.19 10.27 8.69 10.73Income After Tax 4.36 7.44 3.29 6.38 5.49 6.54Minority Interest ‐ ‐ ‐ ‐ ‐ ‐Equity In Affiliates ‐ ‐ ‐ ‐ ‐ ‐Net Income Before Extra. Items 4.36 7.44 3.29 6.38 5.49 6.54Accounting Change ‐ ‐ ‐ ‐ ‐ ‐Discontinued Operations ‐ ‐ ‐ ‐ ‐ ‐Extraordinary Item ‐ ‐ ‐ ‐ ‐ ‐Net Income Before Extra. Items 4.36 7.44 3.29 6.38 5.49 6.54 5.58 5.58 5.58 5.58 5.58 5.58 5.58 5.58 5.58 5.58

98
Balance Sheet Forecasting
In order to forecast the balance sheet we first need to complete forecasting the income statement. By linking
important key information from the income statement and adding specific financial ratios derived from the financial
statements, we believe to be able to forecast a fairly accurate common sized balance sheet.
We looked at the ratios we had for Southwest and thought it would be the best fit to link assets first. We did that
by incorporating the asset turnover ratio. The six year average of the ATO ratio was 73%. After we calculated the asset
turnover ratio, we divided the ratio by net sales to find the total amount of assets for the next ten years. With this new
basis of forecasted assets, we can now easily determine the rest of the asset section as well as liabilities.
To forecast our current asset section, we used an average trend, along with internal information to help forecast
our growth rate. We determined that an average growth rate of 23% would suffice to help forecast future years. The only
discrepancy with this estimate is the initial reduction of current assets in the year of 2008. We did expect a 10-15%
reduction in the first place due to Southwest releasing some of its sub-leased contracts, but not to this extent. However,
at the end of 2008 to the beginning of 2009, Southwest plans to add on 19 additional aircraft. This counteracts the quick
drop off to bring our forecast back to accuracy of additional growth of 23% a year. As for out inventory and accounts
receivable accounts, we decided to use the corresponding ratios appropriate. For our inventory account we used our
inventory ratio of 27 and for our accounts receivable account we used the accounts receivable ratio of 35.
99
In addition to the asset account, we believed that the flight equipment, along with the ground and property
equipment would move smoothly along as a percentage of Total assets. For the flight equipment account, seeing that this
is a majority of our total assets, we used a percentage of 93% of Total assets. As per the ground equipment account, we
followed the trend of assuming 10% of the recorded Total assets.
After the asset portion of the balance sheet, Retained Earnings must fist be calculated to determine Total
Stockholder’s equity. Retained earnings were calculated by taking the forecasted current year Net Income plus the
retained earnings from the previous year minus dividends paid. The dividends were an easy account to forecast, seeing
that Southwest has always paid out the same amount of dividends each year of 14 million. Therefore we decided this
would be an accurate amount to carry out for the next 10 years.
The only measurable variable to base any judgment of forecasted Total Stockholder’s equity was the retained
earnings line account. The difference between 2007’s and 2008’s retained earnings plus the previous year’s stockholders
equity equated to the new forecasted stockholders equity. This translates to the stockholders equity line account changes
directly with regards to retained earnings. In addition to this section, we decided to forecast the total current liabilities
line account by dividing it by the current ratio of .92.
We were able to forecast the balance sheet through using ratios pre-determined from our financials, as well as
determining certain growth trends. The balance sheet is a good representation of the company by showing the different
allocations of their assets and how they are financed through different forms of debt and equity.

100
Balance Sheet
SOUTHWEST AIRLINES CO.(In Millions, Except Share Data) CONSOLIDATED BALANCE SHEET
ASSETS 2002 2003 2004 2005 2006 2007 2008 2009 2010 2011 2012 2013 2014 2015 2016 2017Current assets:Cash and cash equivalents $1,815 $1,865 $1,048 $2,280 $1,390 $2,213Short-term investments N/A N/A 257 251 369 566Accounts and other receivables 175 132 248 258 241 279 311.326 344.015 380.137 420.051 464.156 512.893 566.747 626.255 692.012 764.673Inventories of parts and supplies, at cost 86 93 137 150 181 259 279.271 308.594 340.997 376.801 416.365 460.084 508.393 561.774 620.76 685.94Fuel derivative contracts 113 164 428 641 369 1069Prepaid expenses and other current assets 43 59 54 40 51 57Total current assets 2232 2313 2172 3620 2601 4443 3433.11 3793.59 4191.92 4632.07 5118.44 5655.87 6249.74 6905.96 7631.09 8432.35Property and equipment, at cost:Flight equipment 8025 8646 10037 10999 11769 13019 12239.8 13525 14945.1 16514.3 18248.3 20164.4 22281.7 24621.3 27206.5 30063.2Ground property and equipment 1042 1117 1202 1256 1356 1515 1492.66 1649.39 1822.57 2013.94 2225.41 2459.07 2717.28 3002.59 3317.86 3666.24Deposits on flight equipment purchase contracts 389 787 682 660 734 626
9456 10550 11921 12915 13859 15160Less allowance for depreciation and amortization 2810 3107 3198 3488 3765 4286
6646 7443 8723 9427 10094 10874 10150.1 11215.8 12393.5 13694.8 15132.8 16721.7 18477.5 20417.6 22561.5 24930.4Other assets 76 122 442 1171 765 1455Total Assets 8954 9878 11337 14218 13460 16772 14926.6 16493.9 18225.7 20139.4 22254.1 24590.7 27172.8 30025.9 33178.6 36662.4
LIABILITIES AND STOCKHOLDERS’ EQUITYCurrent liabilities:Accounts payable 362 405 420 524 643 759Accrued liabilities 529 650 1047 2074 1323 3107Air traffic liability 412 462 529 649 799 931Current maturities of long-term debt 131 206 146 601 122 41Total current liabilities 1434 1723 2142 3848 2887 4838 5258.7 5715.97 6213.01 6753.28 7340.52 7978.82 8672.64 9426.78 10246.5 11137.5Long-term debt less current maturities 1553 1332 1700 1394 1567 2050Deferred income taxes 1227 1420 1610 1896 2104 2535Deferred gains from sale and leaseback of aircraft 184 168 152 136 120 106Other deferred liabilities 134 183 209 269 333 302Commitments and contingenciesStockholders’ equity:Common stock, $1.00 par value: 2,000,000,000 shares authorized; 807,611,634 sharesissued in 2007 and 2006 777 789 790 802 808 808Capital in excess of par value 136 258 299 424 1142 1207Retained earnings 3455 3883 4089 4557 4307 4788 5419 6013.02 6670.88 7399.29 8205.65 9098.14 10085.8 11178.7 12387.8 13725.3Accumulated other comprehensive income 54 122 417 892 582 1241Treasury stock, at cost,respectively N/A N/A -71 0 -390 -1103Total stockholders’ equity. 4422 5052 5524 6675 6449 6941
8954 9878 11337 14218 13460 16772 17403 17997 18654.9 19383.3 20189.6 21082.1 22069.8 23162.7 24371.8 25709.3

101
Balance Sheet
SOUTHWEST AIRLINES CO.(In Millions, Except Share Data) CONSOLIDATED BALANCE SHEET
ASSETS 2002 2003 2004 2005 2006 2007 2008 2009 2010 2011 2012 2013 2014 2015 2016 2017Current assets:Cash and cash equivalents $1,815 $1,865 $1,048 $2,280 $1,390 $2,213Short-term investments N/A N/A 257 251 369 566Accounts and other receivables 175 132 248 258 241 279Inventories of parts and supplies, at cost 86 93 137 150 181 259Fuel derivative contracts 113 164 428 641 369 1069Prepaid expenses and other current assets 43 59 54 40 51 57Total current assets 2232 2313 2172 3620 2601 4443 23% 23% 23% 23% 23% 23% 23% 23% 23% 23%Property and equipment, at cost:Flight equipment 8025 8646 10037 10999 11769 13019 82% 82% 82% 82% 82% 82% 82% 82% 82% 82%Ground property and equipment 1042 1117 1202 1256 1356 1515 10% 10% 10% 10% 10% 10% 10% 10% 10% 10%Deposits on flight equipment purchase contracts 389 787 682 660 734 626
9456 10550 11921 12915 13859 15160Less allowance for depreciation and amortization 2810 3107 3198 3488 3765 4286
6646 7443 8723 9427 10094 10874 68% 68% 68% 68% 68% 68% 68% 68% 68% 68%Other assets 76 122 442 1171 765 1455Total Assets 8954 9878 11337 14218 13460 16772 100% 100% 100% 100% 100% 100% 100% 100% 100% 100%
LIABILITIES AND STOCKHOLDERS’ EQUITYCurrent liabilities:Accounts payable 362 405 420 524 643 759Accrued liabilities 529 650 1047 2074 1323 3107Air traffic liability 412 462 529 649 799 931Current maturities of long-term debt 131 206 146 601 122 41Total current liabilities 1434 1723 2142 3848 2887 4838Long-term debt less current maturities 1553 1332 1700 1394 1567 2050Deferred income taxes 1227 1420 1610 1896 2104 2535Deferred gains from sale and leaseback of aircraft 184 168 152 136 120 106Other deferred liabilities 134 183 209 269 333 302Commitments and contingenciesStockholders’ equity:Common stock, $1.00 par value: 2,000,000,000 shares authorized; 807,611,634 sharesissued in 2007 and 2006 777 789 790 802 808 808Capital in excess of par value 136 258 299 424 1142 1207Retained earnings 3455 3883 4089 4557 4307 4788Accumulated other comprehensive income 54 122 417 892 582 1241Treasury stock, at cost,respectively N/A N/A -71 0 -390 -1103Total stockholders’ equity. 4422 5052 5524 6675 6449 6941
8954 9878 11337 14218 13460 16772

102
Cash Flow Statement
The Cash Flow Statement is one of the most important financial reports a
company has. It shows investors how much the company has profited or lost during the
fiscal year. It is also one of the most difficult an analyst can forecast. The cash flow
statement is separated in to thee sections; Income from Operations, Income from
Investments, and Income from financing.
We used three ratios to perform our forecast of the cash flow statement,
CFFO/OI, CFFO/Sales, and CFFO/NI. They seemed to be the most consistent ratios for
the cash flow statement. For CFFO/OI we calculated a five year average of 3.6. When
we calculated CFFO/Sales we arrived at a five year average of 29%. Thirdly, when we
calculated CFFO/NI we arrived at a five year average of 4.41.
As per our cash pertaining to investing activities, we decided to go with a 15%
growth rate. This was a very difficult account to forecast seeing that there was
absolutely no trend to follow. However, in the airline industry, investing activities are
usually fully concentrated in fuel hedging. So even though some years have only
increased by a couple percent in growth, we believe that with the information of
Southwest about to increase its fuel hedging strategies by over 50%, that this growth
rate will deem sufficient for future years.
Finally for our dividends account, the growth seemed inevitably to same the
same. Southwest has consistently paid the same amount of dividends annually, so we
deemed it fit to continue this pattern of 14 million a year in the future years to com
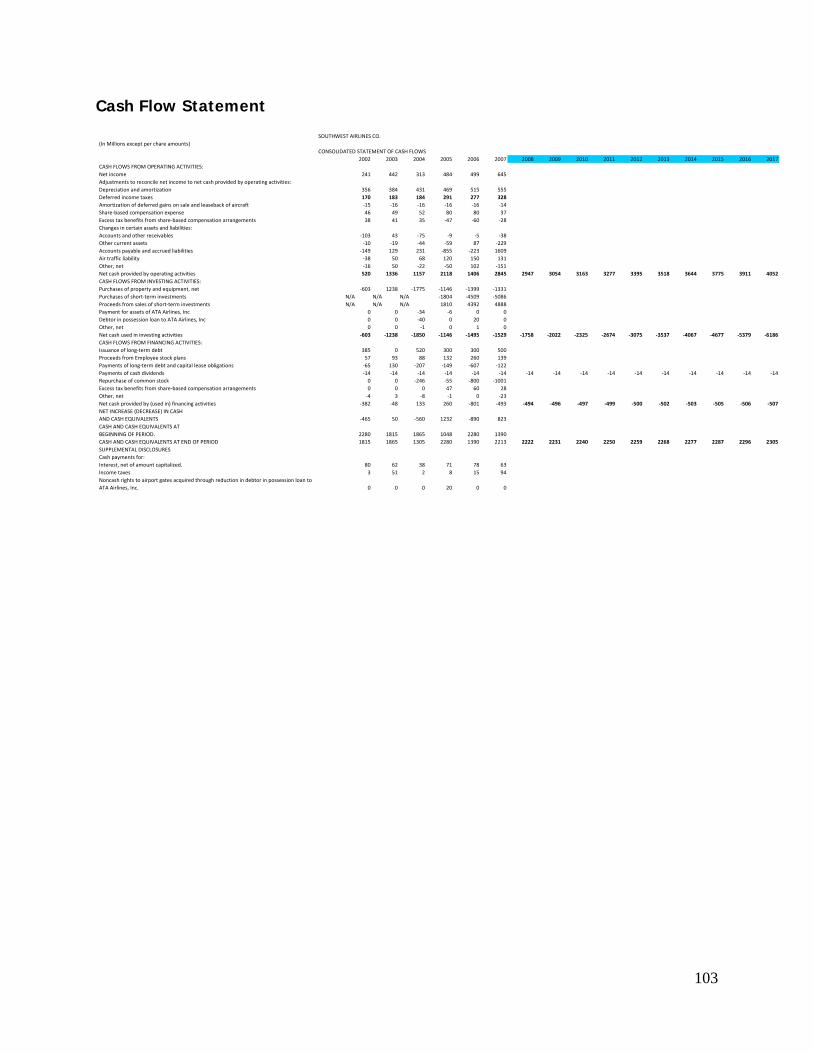
103
Cash Flow Statement
SOUTHWEST AIRLINES CO.(In Millions except per chare amounts)
CONSOLIDATED STATEMENT OF CASH FLOWS2002 2003 2004 2005 2006 2007 2008 2009 2010 2011 2012 2013 2014 2015 2016 2017
CASH FLOWS FROM OPERATING ACTIVITIES:Net income 241 442 313 484 499 645Adjustments to reconcile net income to net cash provided by operating activities:Depreciation and amortization 356 384 431 469 515 555Deferred income taxes 170 183 184 291 277 328Amortization of deferred gains on sale and leaseback of aircraft ‐15 ‐16 ‐16 ‐16 ‐16 ‐14Share‐based compensation expense 46 49 52 80 80 37Excess tax benefits from share‐based compensation arrangements 38 41 35 ‐47 ‐60 ‐28Changes in certain assets and liabilities:Accounts and other receivables ‐103 43 ‐75 ‐9 ‐5 ‐38Other current assets ‐10 ‐19 ‐44 ‐59 87 ‐229Accounts payable and accrued liabilities ‐149 129 231 ‐855 ‐223 1609Air traffic liability ‐38 50 68 120 150 131Other, net ‐16 50 ‐22 ‐50 102 ‐151Net cash provided by operating activities 520 1336 1157 2118 1406 2845 2947 3054 3163 3277 3395 3518 3644 3775 3911 4052CASH FLOWS FROM INVESTING ACTIVITIES:Purchases of property and equipment, net ‐603 1238 ‐1775 ‐1146 ‐1399 ‐1331Purchases of short‐term investments N/A N/A N/A ‐1804 ‐4509 ‐5086Proceeds from sales of short‐term investments N/A N/A N/A 1810 4392 4888Payment for assets of ATA Airlines, Inc 0 0 ‐34 ‐6 0 0Debtor in possession loan to ATA Airlines, Inc 0 0 ‐40 0 20 0Other, net 0 0 ‐1 0 1 0Net cash used in investing activities ‐603 ‐1238 ‐1850 ‐1146 ‐1495 ‐1529 ‐1758 ‐2022 ‐2325 ‐2674 ‐3075 ‐3537 ‐4067 ‐4677 ‐5379 ‐6186CASH FLOWS FROM FINANCING ACTIVITIES:Issuance of long‐term debt 385 0 520 300 300 500Proceeds from Employee stock plans 57 93 88 132 260 139Payments of long‐term debt and capital lease obligations ‐65 130 ‐207 ‐149 ‐607 ‐122Payments of cash dividends ‐14 ‐14 ‐14 ‐14 ‐14 ‐14 ‐14 ‐14 ‐14 ‐14 ‐14 ‐14 ‐14 ‐14 ‐14 ‐14Repurchase of common stock 0 0 ‐246 ‐55 ‐800 ‐1001Excess tax benefits from share‐based compensation arrangements 0 0 0 47 60 28Other, net ‐4 3 ‐8 ‐1 0 ‐23Net cash provided by (used in) financing activities ‐382 ‐48 133 260 ‐801 ‐493 ‐494 ‐496 ‐497 ‐499 ‐500 ‐502 ‐503 ‐505 ‐506 ‐507NET INCREASE (DECREASE) IN CASHAND CASH EQUIVALENTS ‐465 50 ‐560 1232 ‐890 823CASH AND CASH EQUIVALENTS ATBEGINNING OF PERIOD. 2280 1815 1865 1048 2280 1390CASH AND CASH EQUIVALENTS AT END OF PERIOD 1815 1865 1305 2280 1390 2213 2222 2231 2240 2250 2259 2268 2277 2287 2296 2305SUPPLEMENTAL DISCLOSURESCash payments for:Interest, net of amount capitalized. 80 62 38 71 78 63Income taxes 3 51 2 8 15 94Noncash rights to airport gates acquired through reduction in debtor in possession loan toATA Airlines, Inc. 0 0 0 20 0 0

104
Cost of Capital Estimation
Cost of Equity
The Cost of Equity is the rate of return in which an investor will receive when
buying a firm’s share of stock. One way of estimating the Cost of Equity is through
the CAPM model (Capital Asset Pricing Model). The CAPM model includes such
variables as: the Risk Free Rate, which is concluded from the rate of return of a
treasury bill, the Beta, which is the systematic risk specific to the firm, and the MRP
(Market Risk Premium), which is the difference between the S&P 500 market return
and the Risk Free Rate.
To start the CAPM model we first started with finding the monthly stock prices
of Southwest for the past seven years. Then we retrieved the market returns from
the S&P 500. Lastly we found different treasury constant maturity rates that included
the 3 month, 6 month, 2 year, 5 year, and 10 year rates. We then used 72, 60, 48,
36, and 24 month investment periods to try to estimate a Beta. Before trying to pick
a reasonable Beta, we tried to find the highest adjusted R², which infers the highest
explanatory power of Beta. We encountered the problem of having (-) R²s, for every
investment period but one, on every different Treasury bill rate. With this low to no
explanatory power, we could not find a suitable Beta to further our completion of the
CAPM model. Therefore, we decided that we would try to see if the Backdoor
Method cost of equity would better estimate Southwest’s cost of equity.

105
3 Month Rate REGRESSION ANALYSIS Month Beta Adj. R² t Stat
24 -0.201482433 -0.032925135 -0.516585523
36 -0.104047997 -0.026988266 -0.283255317
48 0.218960463 -0.013784637 0.600775649
60 0.13344328 -0.014473265 0.397819202
72 0.83828544 0.142768602 3.58116988
6 Month Rate
Month Beta Adj. R² t Stat
24 -0.201720638 -0.032910327 -0.516894417
36 -0.105358605 -0.026929295 -0.286689068
48 0.218264539 -0.013839407 0.598687606
60 0.132551476 -0.014510033 0.39516115
72 0.838239274 0.142720361 3.580519091
2 Year Rate
Month Beta Adj. R² t Stat
24 -0.206825795 -0.032293112 -0.529616405
36 -0.110377892 -0.026692631 -0.300078223
48 0.215155628 -0.014074167 0.589656511
60 0.130498294 -0.014605385 0.388184024
72 0.837662635 0.14258317 3.578668092
5 Year Rate
Month Beta Adj. R² t Stat
24 -0.207870413 -0.032088792 -0.533764317
36 -0.110822354 -0.026658754 -0.301946728
48 0.213339894 -0.014178258 0.58560898
60 0.12991139 -0.014634768 0.386008843
72 0.836672961 0.142314764 3.575045673
10 Year Rate
Month Beta Adj. R² t Stat
24 -0.207202436 -0.032093679 -0.533665458
36 -0.10967587 -0.026702048 -0.299556796
48 0.212860544 -0.014186462 0.585288802
60 0.129917387 -0.014634598 0.386021492
72 0.835690757 0.142012366 3.570962815

106
Alternative Cost of Equity Estimate (Back Door Method)
The back door method is an alternative way to calculate cost of equity. Its use is
particularly suitable in the case of Southwest, who’s CAPM is not very reliable
because of little explanatory power and a ineffective beta. The alternative method
uses the price to book ratio, return on equity, and sales growth ratios to calculate
cost of equity. Southwest’s price to book ratio according to finance.yahoo.com is
equal to 8.43, the long-term return on equity ratio equals 10%, and we calculated
the sales growth rate of 10.5%. Using the back door formulation method, we
computed a cost of equity equal to 10.44%.
Cost of Debt
The cost of debt is the effective rate a company pays on all of its liabilities. Debt is
in general less risky to debt holders than equity, therefore making the effective rate
or cost of capital for a company less than the cost of equity. Firms often prefer debt
financing rather than equity financing for a number of reasons: Debt financing is
easier, it shows a firms ability to pay off its debt, it doesn’t give up ownership to
others, and interest expenses are tax deductible.
For accounts payable, accrued liabilities, air traffic liabilities, and other deferred
liabilities the interest rate used is the short-term 3-month AA nonfinancial
commercial paper rate. This rate was obtained from the Federal Reserve Bank of St.
Louis (http://research.stlouisfed.org/fred2/categories/120). The interest rate for
current maturities of long-term debt was determined using the weighted average
rate of all long-term debt. For Long-term liabilities all of the interest rates were
found in the notes as stated below. The interest rate for French credit agreements
due 2012 were determined by finding the LIBOR rate minus 45 basis points. French
credit agreements due 2017 were determined by finding the LIBOR rate minus 67
basis points. After calculating the weighted average of all debt and multiplying it by
each interest rate the weighted average cost of debt was determined to be 4.66%

107
Cost of Debt Current Liabilities: Debt Interest Rate Weight WACD
Accounts Payable 759,000,000 0.0411 0.0647 0.0027
Accrued Liabilities: 3,107,000,000 0.0750 0.2650 0.0199
Air Traffic Liabilities 931,000,000 0.0370 0.0794 0.0029
Current Maturities of Long‐term Debt 41,000,000 0.0477 0.0035 0.0002
Total Current Liabilities 4,838,000,000 0.4126
Long‐term Debt less current maturities: 2,050,000,000 0.1748
French Credit Agreements due 2012 32,000,000 0.0323 0.0027 0.0001
6 1/2% Notes due 2012 386,000,000 0.0650 0.0329 0.0021
5 1/4% Notes due 2014 352,000,000 0.0525 0.0300 0.0016
5 3/4% Notes due 2016 300,000,000 0.0575 0.0256 0.0015
5 1/8% Notes due 2017 311,000,000 0.0512 0.0265 0.0014
French Credit Agreements due 2017 94,000,000 0.0361 0.0080 0.0003
Pass Through Certificates 480,000,000 0.0185 0.0409 0.0008
7 3/8% Debentures 103,000,000 0.0738 0.0088 0.0006
Capital Leases 52,000,000 0.0588 0.00443 0.0003
Total Liabilities 11,726,000,000 1 0.0342 Cost of Capital = 3.42%
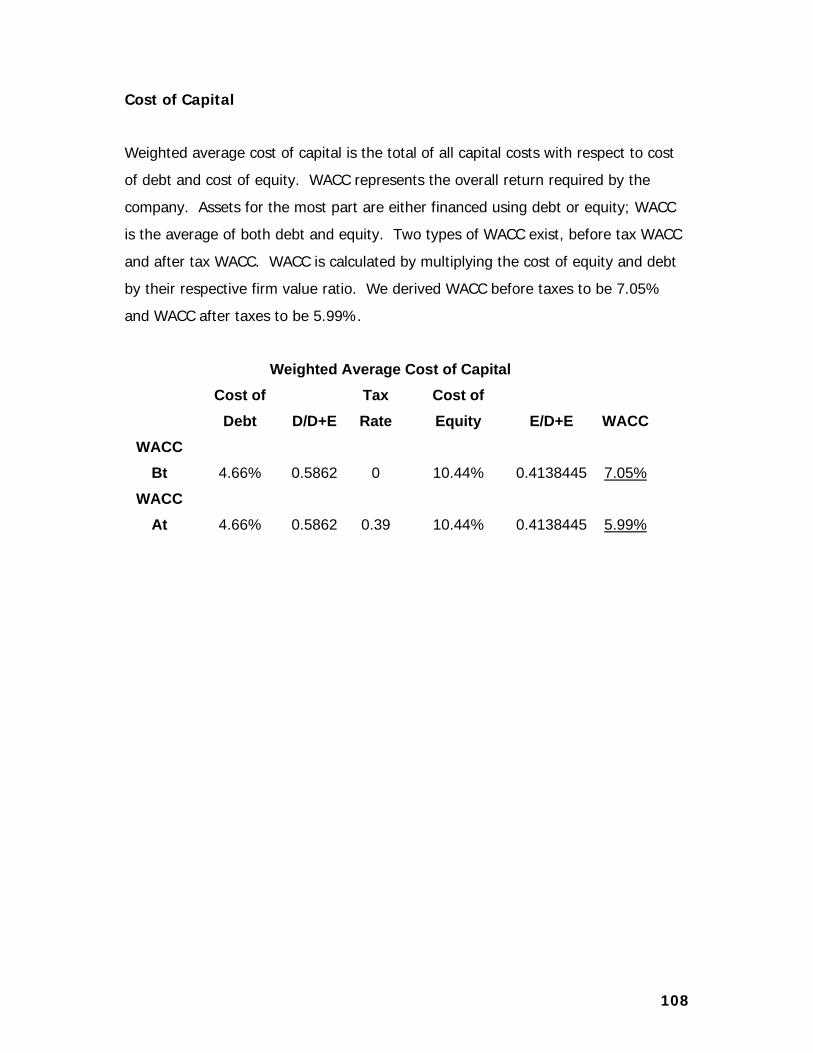
108
Cost of Capital
Weighted average cost of capital is the total of all capital costs with respect to cost
of debt and cost of equity. WACC represents the overall return required by the
company. Assets for the most part are either financed using debt or equity; WACC
is the average of both debt and equity. Two types of WACC exist, before tax WACC
and after tax WACC. WACC is calculated by multiplying the cost of equity and debt
by their respective firm value ratio. We derived WACC before taxes to be 7.05%
and WACC after taxes to be 5.99%.
Weighted Average Cost of Capital
Cost of
Debt D/D+ETax Rate
Cost of Equity E/D+E WACC
WACC Bt 4.66% 0.5862 0 10.44% 0.4138445 7.05%
WACC At 4.66% 0.5862 0.39 10.44% 0.4138445 5.99%

109
Intrinsic Valuation
Intrinsic valuation models use forecasts to value a particular firm’s assets or equity.
These models are very useful for analysts who want to create a picture of the firm’s
risk as it pertains to lending. Stock holders also benefit from intrinsic valuations
because they are more accurate in terms of valuing a company in contrast to a
comparables valuation. There will be five different models used in the intrinsic
valuation of Southwest Airlines: The discounted dividends model, the free cash
flows model, the residual income model, the abnormal earnings growth model, and
the long-run return on equity residual income model. Each of these models values a
specific area of the company by creating an implied share price that is weighted
against the actual market price.
Discounted Dividends Model
The discounted dividends model values a company based on the net present value
of all forecasted dividends. Due to the fact that this model expects the company has
an indefinite life and indefinite dividend growth rate the present value of all future
dividends must be determined through the use of a growing perpetuity. In order to
calculate the implied share price, all future dividends must be discounted to the
present value.
To find the implied share price of Southwest we forecasted 10 years of dividend
payments, growing at a rate of 0%. The forecast was determined by past dividend
payments of the company. All dividends for the forecasted 10 years were
discounted to the present time of June 1, 2008 in order to determine their present
value. The same was done to the value of the perpetuity to convert it to June 1,
2008 prices. All dividends were discounted at the cost of equity, which was
determined previously to equal 10.44%. Southwest’s implied share price was then
determined by adding the present values of forecasted dividends and the perpetuity,
equaling $.20.
The observed share price for Southwest on June 1, 2008 was $13.06. Obviously the
2 share prices are not very comparable to one another. The reason for such a

110
difference in the two prices is because Southwest only pays dividends at miniscule
amounts in order to claim that they actually pay dividends and not to add any real
shareholder value. As a result, the discounted dividend valuation model is not a very
accurate way to value Southwest Airlines, the inaccuracies of which can be observed
in the sensitivity analysis below.
The sensitivity analysis measures how sensitive the share prices are to fluctuations
in both the cost of equity and the growth rate of the perpetuity. The sensitivity
analysis for Southwest demonstrates how insensitive the airline’s share prices are to
the dividend growth. An example of the insensitivity of Southwest’s share prices
related to dividends can be shown by holding the growth rate at 0 and decreasing
the cost of equity form 10.44% to 4% the implied share price increased from $.20 to
$.51, increasing only $.51. This chart shows that Southwest is highly overvalued in
relationship to dividends.
Discounted Free Cash Flow Model
The free cash flow model is used to calculate a company’s intrinsic value of equity.
This valuation method is derived from the discounted dividends valuation model.
Firm value is calculated by discounting all forecasted future cash flows to their
present value. Since the model expects companies to have an indefinite life, a
growing perpetuity is also discounted back to their present value. Free cash flows
used in the model are derived by calculating the difference between cash flow from
0.00% 3.00% 6.50% 7.00% 7.50% 8.00% 8.50%4.00% $0.51 $1.54 ‐ ‐ ‐ ‐ ‐6.00% $0.34 $0.53 ‐ ‐ ‐ ‐ ‐8.00% $0.26 $0.33 $0.78 $1.10 $2.05 ‐ ‐
10.44% $0.20 $0.23 $0.32 $0.35 $0.39 $0.44 $0.5212.00% $0.17 $0.19 $0.24 $0.25 $0.27 $0.29 $0.3114.00% $0.15 $0.16 $0.19 $0.19 $0.20 $0.21 $0.2116.00% $0.13 $0.14 $0.15 $0.16 $0.16 $0.16 $0.17
PPS as of June 1, 2008 Undervalued Greater than $15.02$13.06 Overvalued Less than $11.10
Fairly Valued Between $15.02-$11.10within 15%
Cost
of
Equi
ty
Perpetuity Growth Rate (g)

111
operating activities (CFFO) and cash flow from investing activities (CFFI). Both CFFI
and CFFO are stated as after tax values, therefore the discount rate used is the
before tax weighted average cost of capital (WACC). Once all future cash flows is
discounted to present time values they are subtracted by the book value of liabilities
and divided into shares to determine the implied share value.
To determine implied share value for Southwest Airlines, net cash flow was
forecasted out 10 years along with a growing perpetuity use to forecast the infinite
long-term growth of the company. These values were discounted back to their
present time value of June 1, 2008 using a WACC equal to 7.05%. The sum of all
discounted future cash flows is negative $15.771 billion. Cash flows are then
subtracted by the book value of liabilities totaling $16.772 billion which equates the
market value of equity to be negative $31.836. Market value of equity divided by 2
billion authorized shares gives an implied share value of negative $44.76.
The sensitivity analysis shows that with a current weighted average cost of capital
of 7.05% Southwest would require a perpetuity growth rate of at least 8% to create
positive share prices. With a WACC of 7.05% and a growth rate of 10% the
company would be fairly valued. The same could be concluded if Southwest’s WACC
dropped to 5% and the growth rate was 8%. We assume that any price within 15%
of the current stock price is fairly valued. With a current implied share price less
than zero and fairly valued share prices only available at higher growth rates, it is
reasonable to conclude that Southwest is overvalued in relation to its free cash
flows.
0.00% 2.00% 4.00% 6.00% 8.00% 10.00% 12.00%4.00% ‐ ‐ ‐ $80.03 $28.47 $11.28 $2.695.00% ‐ ‐ ‐ $165.28 $39.02 $14.74 $3.996.00% ‐ ‐ ‐ ‐ $63.18 $20.23 $5.917.05% ‐ ‐ ‐ ‐ $141.97 $30.41 $9.008.00% ‐ ‐ ‐ ‐ ‐ $49.34 $13.439.00% ‐ ‐ ‐ ‐ ‐ $109.11 $21.45
10.00% ‐ ‐ ‐ ‐ ‐ ‐ $37.92
PPS as of June 1, 2008 Undervalued Greater than $15.02$13.06 Overvalued Less than $11.10
Fairly Valued Between $15.02-$11.10
WAC
C (B
T)
Perpetuity Growth Rate (g)
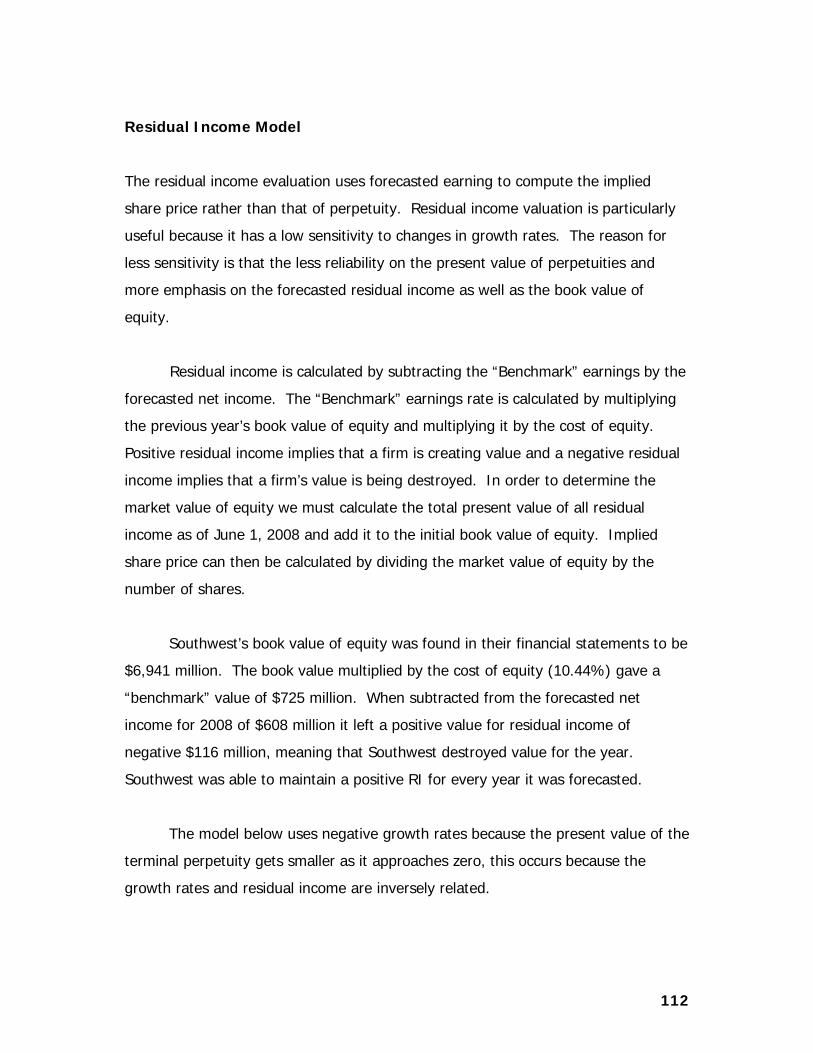
112
Residual Income Model
The residual income evaluation uses forecasted earning to compute the implied
share price rather than that of perpetuity. Residual income valuation is particularly
useful because it has a low sensitivity to changes in growth rates. The reason for
less sensitivity is that the less reliability on the present value of perpetuities and
more emphasis on the forecasted residual income as well as the book value of
equity.
Residual income is calculated by subtracting the “Benchmark” earnings by the
forecasted net income. The “Benchmark” earnings rate is calculated by multiplying
the previous year’s book value of equity and multiplying it by the cost of equity.
Positive residual income implies that a firm is creating value and a negative residual
income implies that a firm’s value is being destroyed. In order to determine the
market value of equity we must calculate the total present value of all residual
income as of June 1, 2008 and add it to the initial book value of equity. Implied
share price can then be calculated by dividing the market value of equity by the
number of shares.
Southwest’s book value of equity was found in their financial statements to be
$6,941 million. The book value multiplied by the cost of equity (10.44%) gave a
“benchmark” value of $725 million. When subtracted from the forecasted net
income for 2008 of $608 million it left a positive value for residual income of
negative $116 million, meaning that Southwest destroyed value for the year.
Southwest was able to maintain a positive RI for every year it was forecasted.
The model below uses negative growth rates because the present value of the
terminal perpetuity gets smaller as it approaches zero, this occurs because the
growth rates and residual income are inversely related.
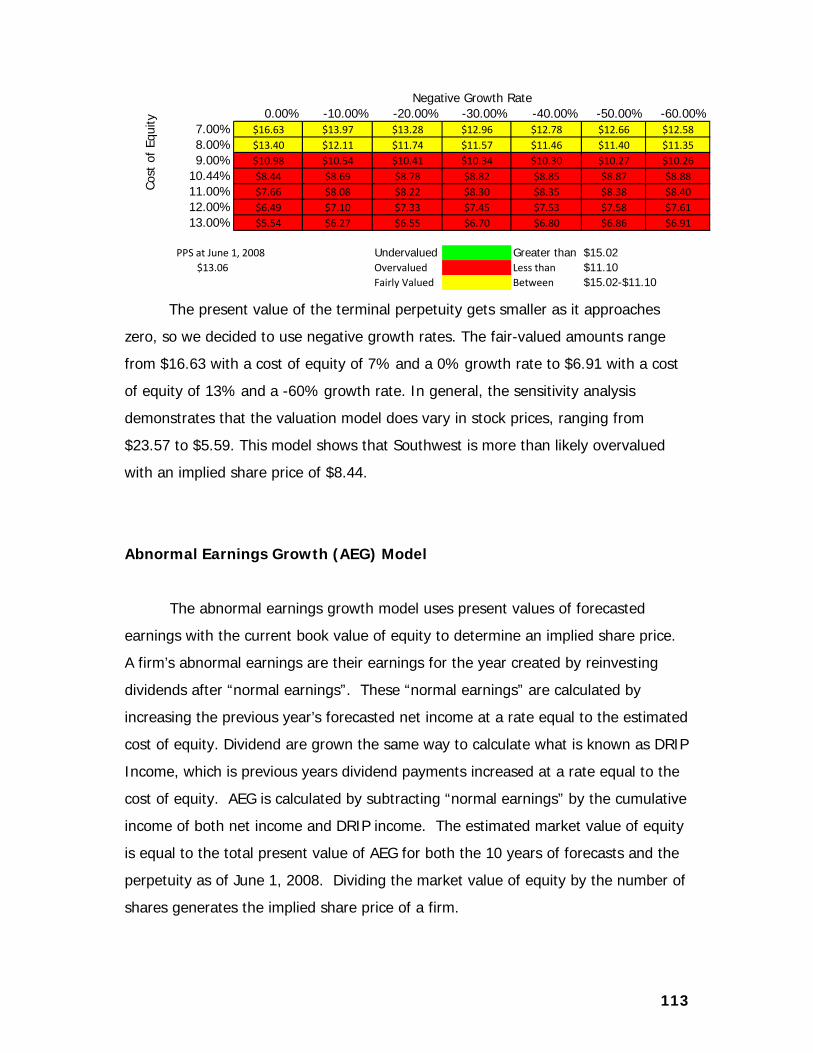
113
The present value of the terminal perpetuity gets smaller as it approaches
zero, so we decided to use negative growth rates. The fair-valued amounts range
from $16.63 with a cost of equity of 7% and a 0% growth rate to $6.91 with a cost
of equity of 13% and a -60% growth rate. In general, the sensitivity analysis
demonstrates that the valuation model does vary in stock prices, ranging from
$23.57 to $5.59. This model shows that Southwest is more than likely overvalued
with an implied share price of $8.44.
Abnormal Earnings Growth (AEG) Model
The abnormal earnings growth model uses present values of forecasted
earnings with the current book value of equity to determine an implied share price.
A firm’s abnormal earnings are their earnings for the year created by reinvesting
dividends after “normal earnings”. These “normal earnings” are calculated by
increasing the previous year’s forecasted net income at a rate equal to the estimated
cost of equity. Dividend are grown the same way to calculate what is known as DRIP
Income, which is previous years dividend payments increased at a rate equal to the
cost of equity. AEG is calculated by subtracting “normal earnings” by the cumulative
income of both net income and DRIP income. The estimated market value of equity
is equal to the total present value of AEG for both the 10 years of forecasts and the
perpetuity as of June 1, 2008. Dividing the market value of equity by the number of
shares generates the implied share price of a firm.
0.00% -10.00% -20.00% -30.00% -40.00% -50.00% -60.00%7.00% $16.63 $13.97 $13.28 $12.96 $12.78 $12.66 $12.588.00% $13.40 $12.11 $11.74 $11.57 $11.46 $11.40 $11.359.00% $10.98 $10.54 $10.41 $10.34 $10.30 $10.27 $10.26
10.44% $8.44 $8.69 $8.78 $8.82 $8.85 $8.87 $8.8811.00% $7.66 $8.08 $8.22 $8.30 $8.35 $8.38 $8.4012.00% $6.49 $7.10 $7.33 $7.45 $7.53 $7.58 $7.6113.00% $5.54 $6.27 $6.55 $6.70 $6.80 $6.86 $6.91
PPS at June 1, 2008 Undervalued Greater than $15.02$13.06 Overvalued Less than $11.10
Fairly Valued Between $15.02-$11.10
Cost
of
Equi
ty
Negative Growth Rate

114
Southwest’s forecasted dividend payments are constant over 10 years,
therefore the DRIP income is determined to be a flat income each year for the
company. Since net income each year is growing a faster rate than the “normal
income,” AEG also increases at a growing rate each year.
The AEG growth rate allows us to check the accuracy of our calculations by
comparing it to the residual income growth rate. These two rates are interrelated
due to the fact that both models use earnings benchmarks, net income, and
dividends to equate either income or earnings. The chart below illustrates the
correlation of the two growth rates, verifying the accuracy of our calculation.
2 3 4 5 6 7 8 9 10 Annual AEG
1.83 1.86 1.91 1.95 2.01 2.06 2.13 2.20 2.27
Change in RI
1.83 1.86 1.91 1.95 2.01 2.06 2.13 2.20 2.27
We used negative growth rates in order to get directly linked to the residual
income valuation model. The cost of equity we used stretched from 7% to 13% and
growth rates varied from 0% to -60%. The company had a stock price of $13.06 and
a change of 13%; these determined the over and undervalued amounts. Southwest
had fairly priced stocks when the cost of equity was at 9% and had a growth rate of
0%. As indicated in the above table Southwest is primarily overvalued the largest
part of the time.
0.00% -10.00% -20.00% -30.00% -40.00% -50.00% -60.00%7.00% $23.57 $19.22 $18.10 $17.58 $17.28 $17.09 $16.958.00% $16.86 $14.79 $14.19 $13.91 $13.75 $13.64 $13.569.00% $12.51 $11.63 $11.36 $11.22 $11.15 $11.09 $11.06
10.44% $8.56 $8.50 $8.48 $8.47 $8.47 $8.46 $8.4611.00% $7.49 $7.59 $7.63 $7.65 $7.66 $7.67 $7.6812.00% $9.71 $6.28 $6.39 $6.44 $6.48 $6.50 $6.5213.00% $4.90 $5.26 $5.41 $5.48 $5.53 $5.56 $5.59
PPS at June 1, 2008 Undervalued Greater than $15.02$13.06 Overvalued Less than $11.10
Fairly Valued Between $15.02-$11.10
Cost
of
Equi
ty
Negative Growth Rate

115
Long-Run Residual Income Model
The long-run residual income model is a valuation of the perpetuity of the
residual model. In order to determine the implied share price, long-run return on
equity, long-run growth rate on equity, cost of equity, and market capitalization
must be estimated. We assigned a long-run return on equity of 10% as determined
in the forecasted financial statements. It was also determined in the forecasting of
financial statements that the long-run growth rate on equity is equal to 0.65%. Cost
of equity was calculated using the alternative estimate of cost of capital equaling
10.44%. Computing the data into the long-run residual income model formula we
found the estimated MCAP to be $6.629 billion. Dividing the MCAP by the number
shares (731M) we estimated Southwest’s share price to be $9.45.
Long Run Return Growth Rate in Equity
long
run
ret
urn
on
equi
ty
0.00% 1.00% 2.00% 3.00% 4.00%6.00% $5.69 $5.24 $4.69 $3.99 $3.07 7.00% $6.64 $6.29 $5.86 $5.32 $4.61 8.00% $7.58 $7.34 $7.04 $6.65 $6.15 9.00% $8.53 $8.39 $8.21 $7.98 $7.68
10.00% $9.48 $9.44 $9.38 $9.31 $9.22 11.00% $10.43 $10.48 $10.55 $10.64 $10.76 12.00% $11.38 $11.53 $11.73 $11.97 $12.29
(Holding Ke constant at 10.44%) Undervalued Greater than $15.02 Overvalued Less than $11.10 Fairly Valued Between $15.02-$11.10
7.00% 8.00% 9.00% 10.00% 11.00%7.00% $9.77 $11.30 $12.84 $14.38 $15.928.00% $8.47 $9.80 $11.14 $12.47 $13.819.00% $7.48 $8.66 $9.84 $11.02 $12.20
10.44% $6.42 $7.43 $8.44 $9.45 $10.4611.00% $6.08 $7.04 $8.00 $8.96 $9.9212.00% $5.57 $6.45 $7.32 $8.20 $9.0813.00% $5.14 $5.95 $6.76 $7.56 $8.37
Undervalued Greater than $15.02Overvalued Less than $11.10Fairly Valued Between $15.02-$11.1
Long Run Return on Equity
Cost
of
Equi
ty
(Holding g constant at .65%)

116
9.00% 10.44% 12.00% 13.00% 14.00%0.00% $10.94 $9.48 $8.30 $7.69 $7.161.00% $11.07 $9.44 $8.40 $7.49 $6.942.00% $11.25 $9.38 $7.96 $7.27 $6.693.00% $11.48 $9.31 $7.74 $6.99 $6.384.00% $11.81 $9.22 $7.47 $6.66 $6.025.00% $12.30 $9.10 $7.11 $6.24 $5.576.00% $13.12 $8.92 $6.64 $5.71 $5.01
(Holding LR ROE constant at 10%)Undervalued Greater than $15.02Overvalued Less than $11.10Fairly Valued Between $15.02-$11.1
Cost of Equity
Long
Run
Gro
wth
Rat
e
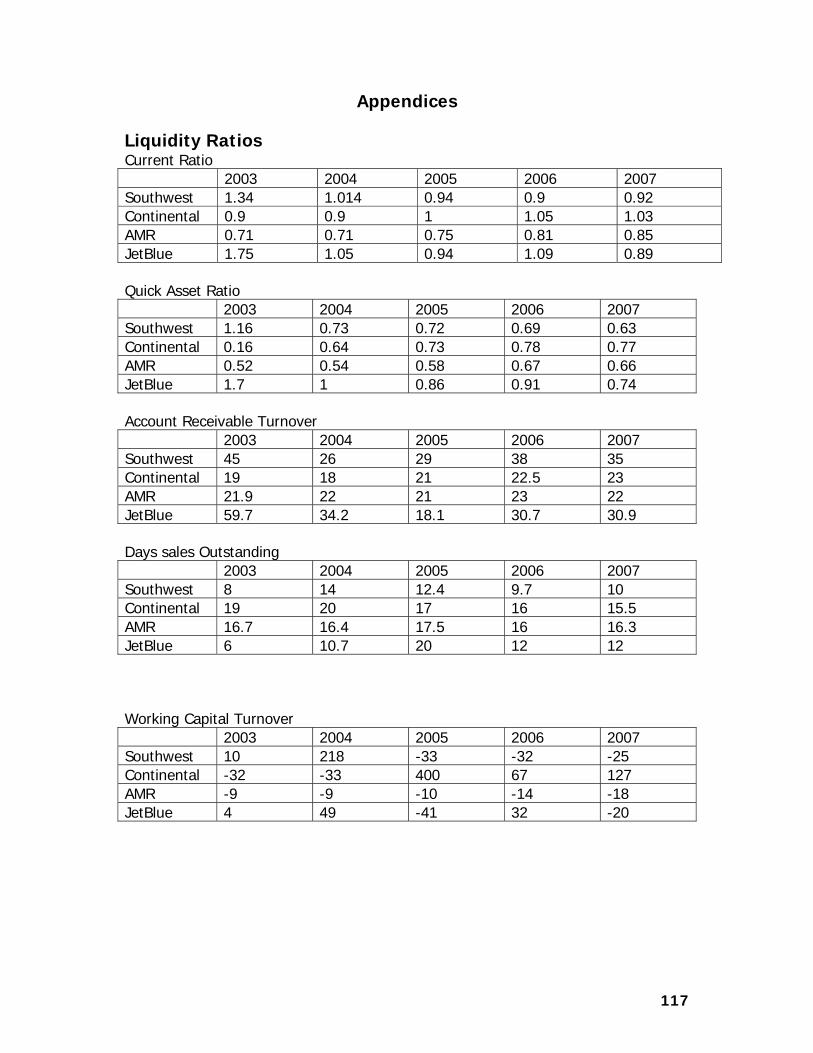
117
Appendices Liquidity Ratios Current Ratio 2003 2004 2005 2006 2007 Southwest 1.34 1.014 0.94 0.9 0.92 Continental 0.9 0.9 1 1.05 1.03 AMR 0.71 0.71 0.75 0.81 0.85 JetBlue 1.75 1.05 0.94 1.09 0.89 Quick Asset Ratio 2003 2004 2005 2006 2007 Southwest 1.16 0.73 0.72 0.69 0.63 Continental 0.16 0.64 0.73 0.78 0.77 AMR 0.52 0.54 0.58 0.67 0.66 JetBlue 1.7 1 0.86 0.91 0.74 Account Receivable Turnover 2003 2004 2005 2006 2007 Southwest 45 26 29 38 35 Continental 19 18 21 22.5 23 AMR 21.9 22 21 23 22 JetBlue 59.7 34.2 18.1 30.7 30.9 Days sales Outstanding 2003 2004 2005 2006 2007 Southwest 8 14 12.4 9.7 10 Continental 19 20 17 16 15.5 AMR 16.7 16.4 17.5 16 16.3 JetBlue 6 10.7 20 12 12 Working Capital Turnover 2003 2004 2005 2006 2007 Southwest 10 218 -33 -32 -25 Continental -32 -33 400 67 127 AMR -9 -9 -10 -14 -18 JetBlue 4 49 -41 32 -20

118
Profitability Ratios Gross Profit Margin 2003 2004 2005 2006 2007 Southwest 0.29 0.27 0.29 0.28 0.25 Continental 0.18 0.09 0.09 0.11 0.12 AMR 0.17 0.19 0.19 0.22 0.22 JetBlue 0.4 0.33 0.27 0.24 0.23 Operating Profit Ratio 2003 2004 2005 2006 2007 Southwest 0.081 0.062 0.096 0.103 0.08 Continental 0.021 -0.024 -0.004 0.036 0.048 AMR -0.05 -0.007 -0.004 0.047 0.042 JetBlue 0.169 0.088 0.028 0.054 0.059 Net Profit Margin 2003 2004 2005 2006 2007 Southwest 0.074 0.033 0.064 0.055 0.065 Continental 0.003 -0.041 -0.006 0.026 0.032 AMR -0.07 -0.04 -0.04 0.01 0.022 JetBlue 0.104 0.037 -0.012 -0.0004 0.006 Asset Turnover 2003 2004 2005 2006 2007 Southwest 0,66 0.66 0.67 0.65 0.73 Continental 0.85 0.93 1.07 1.25 1.26 AMR 0.58 0.64 0.72 0.76 0.81 JetBlue 0.72 0.58 0.61 0.61 0.59 Return on assets 2003 2004 2005 2006 2007 Southwest 0.049 0.022 0.043 0.036 0.048 Continental 0.003 -0.039 -0.0065 0.033 0.041 AMR -0.041 -0.026 -0.03 -0.008 0.018 JetBlue 0.075 0.021 -0.007 -0.0003 0.004 Return on Equity 2003 2004 2005 2006 2007 Southwest 0.1 0.043 0.088 0.075 0.1Continental 0.037 -0.560 -0.439 1.518 1.323AMR -1.28 -16.3 1.47 -0.16 -0.832JetBlue 0.251 0.069 -0.03 0 0.019
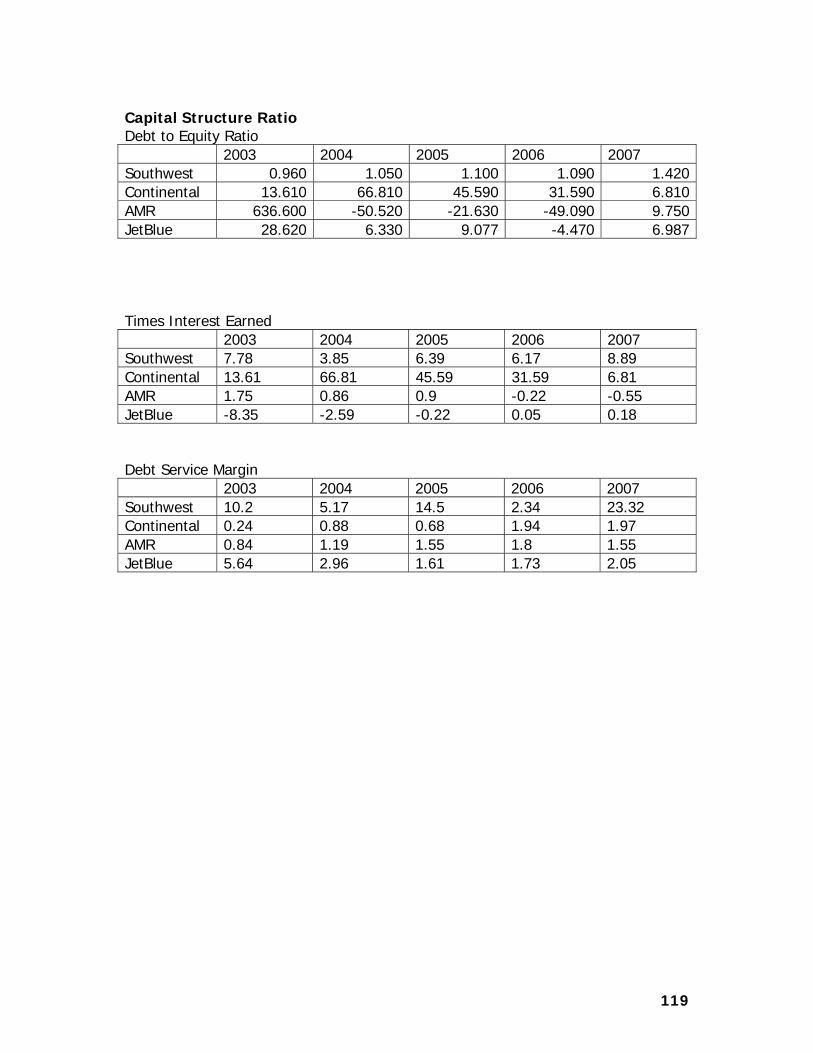
119
Capital Structure Ratio Debt to Equity Ratio 2003 2004 2005 2006 2007 Southwest 0.960 1.050 1.100 1.090 1.420Continental 13.610 66.810 45.590 31.590 6.810AMR 636.600 -50.520 -21.630 -49.090 9.750JetBlue 28.620 6.330 9.077 -4.470 6.987 Times Interest Earned 2003 2004 2005 2006 2007 Southwest 7.78 3.85 6.39 6.17 8.89 Continental 13.61 66.81 45.59 31.59 6.81 AMR 1.75 0.86 0.9 -0.22 -0.55 JetBlue -8.35 -2.59 -0.22 0.05 0.18 Debt Service Margin 2003 2004 2005 2006 2007 Southwest 10.2 5.17 14.5 2.34 23.32 Continental 0.24 0.88 0.68 1.94 1.97 AMR 0.84 1.19 1.55 1.8 1.55 JetBlue 5.64 2.96 1.61 1.73 2.05

120
Sales Diagnostics Net Sales/Cash from Sales 2003 2004 2005 2006 2007 Southwest 19.152 -197.88 33.558 35.217 26.943 Continental -20.36 -10.29 -18.649 -54.929 -96.82 AMR -8.617 -11.75 -11.23 -29.81 -43.853 JetBlue 11.452 137.01 -14.92 -30.29 -38.41 Net Sales / Account receivable 2003 2004 2005 2006 2007 Southwest 44.977 26.331 29.395 37.701 35.344 Continental 19.151 17.901 21.081 22.5567 23.485 AMR 21.91 22.303 20.09 22.837 22.332 JetBlue 59.71 34.178 18.096 30.688 30.891 Net Sales/ Inventory 2003 2004 2005 2006 2007 Southwest 63.839 47.664 50.56 50.199 38.073 Continental 47.126 46.257 55.7612 60.4977 52.517 AMR 33.798 38.207 40.217 44.591 38.161 JetBlue 120.43 126.46 81 87.519 109.31 Expense Diagnostics CFFO/OI 2003 2004 2005 2006 2007 Southwest 2.766 2.6386 2.9214 1.5054 3.5967 Continental 0.6223 -1567 -11.718 2.26068 1.6492 AMR -0.712 -5.351 -11.23 -29,81 -43.853JetBlue 1.696 1.7893 3.5417 2.1575 2.1183 Total Accruals/ Change in sales 2003 2004 2005 2006 2007 Southwest 1.5654 1.7656 1.9677 0.8808 4.0090 Continental 1.31184 0.5924 0.40642 0.36979 0.74 AMR 99.45 1.6813 1.1321 1.2431 6.0941 JetBlue 0.23386 0.353 0.2543 0.2477 0.480

121
Methods of Comparables Company EPS BPS DPS EBITDA CFFO CFFI FCF PPS
Southwest 0.77 0.01 0.02 13.34 2845.00-
1529.00 1316.00 14.8Continental 2.98 0.015 0 6.68 1133.00 -760.00 373.00 15.59AMR 0.1 0.01 0 7.55 1935.00 -234.00 1701.00 6.31JetBlue 0.18 0.005 0 12.49 358.00 -734.00 -376.00 4.3
Company Trailing P/E
Forward P/E P/B D/P
P/EBITDA P/FCF PEG
EV/EBITDA
Southwest 19.220
8 43.533
3 1480 740 1.10944
50.0112
5 1.3729 11.0323Continental
5.23154
-5.9306
1039.3 N/A
2.333832 0.0418
0.24912 4.78
AMR 63.1 -
1.3943 631 N/A 0.835760.0037
1 0 4.11656
JetBlue 23.889 -16.08 860 N/A 0.34427
5-
0.0114 0 15.13922 Industry Avg.
30.7401 -7.801
843,44 N/A 1.17129
0.01136
0.24912 8.013403
results2007
24.2847
-2.3405
8,4344 N/A
15.62501
14.9452
2.68553 14.54405
Z-score Southwest 2003 2004 2005 2006 2007 Working Cap/Total Assets 0.071674 0.003175 0 -0.0255 -0.02826 Retained Earn/Total Assets 0.550334 0.504948 0.401714 0.447979 0.399666 EBIT/Total Assets 0.161359 0.117597 0.170856 0.22899 0.155634 MV Equity/BV of Liablities 1.6256 1.221829 0.95537 1.073492 0.655017 Sales/Total Assets 0.601033 0.57599 0.541598 0.675037 0.587944 z score 3.01 2.42354 2.05 2.4 1.77
Z-SCORE 2003 2004 2005 2006 2007 Southwest 3.01 2.42354 2.05 2.4 1.77 Continental 1.04 0.94 1.18 1.47 1.61 AMR 0.43 0.52 0.55 0.88 0.94 JetBlue 3.29 1.82 1.2 0.96 0.86

122
REGRESSION ANALYSIS 3 month-
SUMMARY OUTPUT 72
Regression StatisticsMultiple R 0.39350004R Square 0.15484228Adjusted R Square 0.1427686Standard Error 0.0682514Observations 72
ANOVAdf SS MS F Significance F
Regression 1 0.059741071 0.059741 12.824778 0.000627152Residual 70 0.326077773 0.004658Total 71 0.385818844
Coefficients Standard Error t Stat P‐value Lower 95% Upper 95% Lower 95.0% Upper 95.0%Intercept ‐0.0026203 0.008058053 ‐0.32517 0.7460196 ‐0.018691546 0.013451014 ‐0.01869155 0.013451014X Variable 1 0.83828544 0.234081451 3.58117 0.0006272 0.371424714 1.305146167 0.371424714 1.305146167
SUMMARY OUTPUT 60
Regression StatisticsMultiple R 0.0521651R Square 0.0027212Adjusted R Square ‐0.0144733Standard Error 0.06343466Observations 60
ANOVAdf SS MS F Significance F
Regression 1 0.000636832 0.000637 0.1582601 0.692223936Residual 58 0.233389447 0.004024Total 59 0.234026279
Coefficients Standard Error t Stat P‐value Lower 95% Upper 95% Lower 95.0% Upper 95.0%Intercept ‐0.0019117 0.008298775 ‐0.23035 0.8186273 ‐0.018523458 0.014700147 ‐0.01852346 0.014700147X Variable 1 0.13344328 0.335437001 0.397819 0.6922239 ‐0.538006824 0.804893384 ‐0.53800682 0.804893384
SUMMARY OUTPUT 48
Regression StatisticsMultiple R 0.08823406R Square 0.00778525Adjusted R Square ‐0.0137846Standard Error 0.06219827Observations 48
ANOVAdf SS MS F Significance F
Regression 1 0.001396308 0.001396 0.3609314 0.55093831Residual 46 0.177956732 0.003869Total 47 0.17935304
Coefficients Standard Error t Stat P‐value Lower 95% Upper 95% Lower 95.0% Upper 95.0%Intercept ‐0.0020159 0.009006457 ‐0.22383 0.8238795 ‐0.020144987 0.016113127 ‐0.02014499 0.016113127X Variable 1 0.21896046 0.364462947 0.600776 0.5509383 ‐0.514665387 0.952586314 ‐0.51466539 0.952586314
SUMMARY OUTPUT 36
Regression StatisticsMultiple R 0.04852067R Square 0.00235426Adjusted R Square ‐0.0269883Standard Error 0.0550195Observations 36
ANOVAdf SS MS F Significance F
Regression 1 0.000242879 0.000243 0.0802336 0.778698715Residual 34 0.102922927 0.003027Total 35 0.103165806
Coefficients Standard Error t Stat P‐value Lower 95% Upper 95% Lower 95.0% Upper 95.0%Intercept ‐0.0012892 0.009184906 ‐0.14036 0.8892051 ‐0.019955153 0.017376797 ‐0.01995515 0.017376797X Variable 1 ‐0.104048 0.36732937 ‐0.28326 0.7786987 ‐0.850551087 0.642455093 ‐0.85055109 0.642455093
SUMMARY OUTPUT 24
Regression StatisticsMultiple R 0.10947444R Square 0.01198465Adjusted R Square ‐0.0329251Standard Error 0.05211306Observations 24
ANOVAdf SS MS F Significance F
Regression 1 0.000724732 0.000725 0.2668606 0.610599682Residual 22 0.059746962 0.002716Total 23 0.060471694
Coefficients Standard Error t Stat P‐value Lower 95% Upper 95% Lower 95.0% Upper 95.0%Intercept ‐0.0070703 0.010645429 ‐0.66416 0.5134877 ‐0.029147563 0.015006974 ‐0.02914756 0.015006974X Variable 1 ‐0.2014824 0.390027253 ‐0.51659 0.6105997 ‐1.010349445 0.60738458 ‐1.01034945 0.60738458
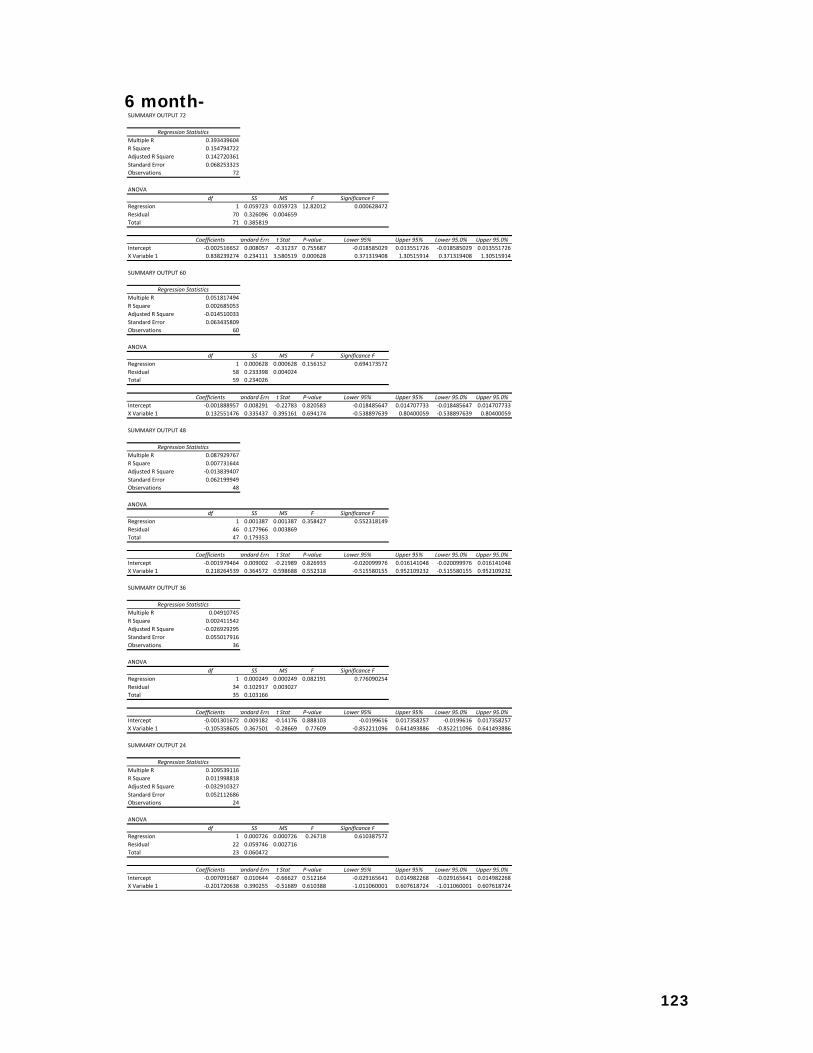
123
6 month-
SUMMARY OUTPUT 72
Regression StatisticsMultiple R 0.393439604R Square 0.154794722Adjusted R Square 0.142720361Standard Error 0.068253323Observations 72
ANOVAdf SS MS F Significance F
Regression 1 0.059723 0.059723 12.82012 0.000628472Residual 70 0.326096 0.004659Total 71 0.385819
Coefficients tandard Erro t Stat P‐value Lower 95% Upper 95% Lower 95.0% Upper 95.0%Intercept ‐0.002516652 0.008057 ‐0.31237 0.755687 ‐0.018585029 0.013551726 ‐0.018585029 0.013551726X Variable 1 0.838239274 0.234111 3.580519 0.000628 0.371319408 1.30515914 0.371319408 1.30515914
SUMMARY OUTPUT 60
Regression StatisticsMultiple R 0.051817494R Square 0.002685053Adjusted R Square ‐0.014510033Standard Error 0.063435809Observations 60
ANOVAdf SS MS F Significance F
Regression 1 0.000628 0.000628 0.156152 0.694173572Residual 58 0.233398 0.004024Total 59 0.234026
Coefficients tandard Erro t Stat P‐value Lower 95% Upper 95% Lower 95.0% Upper 95.0%Intercept ‐0.001888957 0.008291 ‐0.22783 0.820583 ‐0.018485647 0.014707733 ‐0.018485647 0.014707733X Variable 1 0.132551476 0.335437 0.395161 0.694174 ‐0.538897639 0.80400059 ‐0.538897639 0.80400059
SUMMARY OUTPUT 48
Regression StatisticsMultiple R 0.087929767R Square 0.007731644Adjusted R Square ‐0.013839407Standard Error 0.062199949Observations 48
ANOVAdf SS MS F Significance F
Regression 1 0.001387 0.001387 0.358427 0.552318149Residual 46 0.177966 0.003869Total 47 0.179353
Coefficients tandard Erro t Stat P‐value Lower 95% Upper 95% Lower 95.0% Upper 95.0%Intercept ‐0.001979464 0.009002 ‐0.21989 0.826933 ‐0.020099976 0.016141048 ‐0.020099976 0.016141048X Variable 1 0.218264539 0.364572 0.598688 0.552318 ‐0.515580155 0.952109232 ‐0.515580155 0.952109232
SUMMARY OUTPUT 36
Regression StatisticsMultiple R 0.04910745R Square 0.002411542Adjusted R Square ‐0.026929295Standard Error 0.055017916Observations 36
ANOVAdf SS MS F Significance F
Regression 1 0.000249 0.000249 0.082191 0.776090254Residual 34 0.102917 0.003027Total 35 0.103166
Coefficients tandard Erro t Stat P‐value Lower 95% Upper 95% Lower 95.0% Upper 95.0%Intercept ‐0.001301672 0.009182 ‐0.14176 0.888103 ‐0.0199616 0.017358257 ‐0.0199616 0.017358257X Variable 1 ‐0.105358605 0.367501 ‐0.28669 0.77609 ‐0.852211096 0.641493886 ‐0.852211096 0.641493886
SUMMARY OUTPUT 24
Regression StatisticsMultiple R 0.109539116R Square 0.011998818Adjusted R Square ‐0.032910327Standard Error 0.052112686Observations 24
ANOVAdf SS MS F Significance F
Regression 1 0.000726 0.000726 0.26718 0.610387572Residual 22 0.059746 0.002716Total 23 0.060472
Coefficients tandard Erro t Stat P‐value Lower 95% Upper 95% Lower 95.0% Upper 95.0%Intercept ‐0.007091687 0.010644 ‐0.66627 0.512164 ‐0.029165641 0.014982268 ‐0.029165641 0.014982268X Variable 1 ‐0.201720638 0.390255 ‐0.51689 0.610388 ‐1.011060001 0.607618724 ‐1.011060001 0.607618724

124
2 year-
SUMMARY OUTPUT 72
Regression StatisticsMultiple R 0.393267673R Square 0.154659463Adjusted R Square 0.14258317Standard Error 0.068258784Observations 72
ANOVAdf SS MS F Significance F
Regression 1 0.059670535 0.059671 12.80687 0.000632241Residual 70 0.326148309 0.004659Total 71 0.385818844
Coefficients Standard Error t Stat P‐value Lower 95% Upper 95% Lower 95.0% Upper 95.0%Intercept ‐0.00231901 0.008054321 ‐0.28792 0.774258 ‐0.018382846 0.013744827 ‐0.018382846 0.013744827X Variable 1 0.837662635 0.23407106 3.578668 0.000632 0.370822631 1.304502639 0.370822631 1.304502639
SUMMARY OUTPUT 60
Regression StatisticsMultiple R 0.050904976R Square 0.002591317Adjusted R Square ‐0.014605385Standard Error 0.06343879Observations 60
ANOVAdf SS MS F Significance F
Regression 1 0.000606436 0.000606 0.150687 0.699301034Residual 58 0.233419843 0.004024Total 59 0.234026279
Coefficients Standard Error t Stat P‐value Lower 95% Upper 95% Lower 95.0% Upper 95.0%Intercept ‐0.001856003 0.008282207 ‐0.2241 0.823471 ‐0.018434641 0.014722636 ‐0.018434641 0.014722636X Variable 1 0.130498294 0.336176366 0.388184 0.699301 ‐0.54243181 0.803428399 ‐0.54243181 0.803428399
SUMMARY OUTPUT 48
Regression StatisticsMultiple R 0.086613388R Square 0.007501879Adjusted R Square ‐0.014074167Standard Error 0.06220715Observations 48
ANOVAdf SS MS F Significance F
Regression 1 0.001345485 0.001345 0.347695 0.558306265Residual 46 0.178007556 0.00387Total 47 0.17935304
Coefficients Standard Error t Stat P‐value Lower 95% Upper 95% Lower 95.0% Upper 95.0%Intercept ‐0.001955958 0.00900111 ‐0.2173 0.828934 ‐0.020074253 0.016162337 ‐0.020074253 0.016162337X Variable 1 0.215155628 0.364882985 0.589657 0.558306 ‐0.519315715 0.949626971 ‐0.519315715 0.949626971
SUMMARY OUTPUT 36
Regression StatisticsMultiple R 0.051394978R Square 0.002641444Adjusted R Square ‐0.026692631Standard Error 0.055011576Observations 36
ANOVAdf SS MS F Significance F
Regression 1 0.000272507 0.000273 0.090047 0.765944573Residual 34 0.102893299 0.003026Total 35 0.103165806
Coefficients Standard Error t Stat P‐value Lower 95% Upper 95% Lower 95.0% Upper 95.0%Intercept ‐0.001287753 0.009182213 ‐0.14024 0.889294 ‐0.019948255 0.017372749 ‐0.019948255 0.017372749X Variable 1 ‐0.110377892 0.367830397 ‐0.30008 0.765945 ‐0.857899192 0.637143408 ‐0.857899192 0.637143408
SUMMARY OUTPUT 24
Regression StatisticsMultiple R 0.112201594R Square 0.012589198Adjusted R Square ‐0.032293112Standard Error 0.052097114Observations 24
ANOVAdf SS MS F Significance F
Regression 1 0.00076129 0.000761 0.280494 0.601682216Residual 22 0.059710404 0.002714Total 23 0.060471694
Coefficients Standard Error t Stat P‐value Lower 95% Upper 95% Lower 95.0% Upper 95.0%Intercept ‐0.007056563 0.010642799 ‐0.66304 0.514195 ‐0.029128376 0.01501525 ‐0.029128376 0.01501525X Variable 1 ‐0.206825795 0.390519993 ‐0.52962 0.601682 ‐1.016714688 0.603063098 ‐1.016714688 0.603063098

125
5 year-
SUMMARY OUTPUT 72
Regression StatisticsMultiple R 0.392931085R Square 0.154394838Adjusted R Square 0.142314764Standard Error 0.068269467Observations 72
ANOVAdf SS MS F Significance F
Regression 1 0.059568438 0.059568 12.78095 0.000639678Residual 70 0.326250406 0.004661Total 71 0.385818844
Coefficients Standard Error t Stat P‐value Lower 95% Upper 95% Lower 95.0% Upper 95.0%Intercept ‐0.00190818 0.008050703 ‐0.23702 0.813333 ‐0.017964801 0.014148439 ‐0.017964801 0.014148439X Variable 1 0.836672961 0.234031405 3.575046 0.00064 0.369912048 1.303433873 0.369912048 1.303433873
SUMMARY OUTPUT 60
Regression StatisticsMultiple R 0.050620464R Square 0.002562431Adjusted R Square ‐0.01463477Standard Error 0.063439708Observations 60
ANOVAdf SS MS F Significance F
Regression 1 0.000599676 0.0006 0.149003 0.70090246Residual 58 0.233426603 0.004025Total 59 0.234026279
Coefficients Standard Error t Stat P‐value Lower 95% Upper 95% Lower 95.0% Upper 95.0%Intercept ‐0.00180308 0.008263949 ‐0.21819 0.82805 ‐0.018345168 0.014739015 ‐0.018345168 0.014739015X Variable 1 0.12991139 0.336550296 0.386009 0.700902 ‐0.543767216 0.803589996 ‐0.543767216 0.803589996
SUMMARY OUTPUT 48
Regression StatisticsMultiple R 0.08602327R Square 0.007400003Adjusted R Square ‐0.01417826Standard Error 0.062210342Observations 48
ANOVAdf SS MS F Significance F
Regression 1 0.001327213 0.001327 0.342938 0.561000543Residual 46 0.178025827 0.00387Total 47 0.17935304
Coefficients Standard Error t Stat P‐value Lower 95% Upper 95% Lower 95.0% Upper 95.0%Intercept ‐0.00190829 0.008996482 ‐0.21211 0.832954 ‐0.020017267 0.01620069 ‐0.020017267 0.01620069X Variable 1 0.213339894 0.364304341 0.585609 0.561001 ‐0.519966699 0.946646487 ‐0.519966699 0.946646487
SUMMARY OUTPUT 36
Regression StatisticsMultiple R 0.051714147R Square 0.002674353Adjusted R Square ‐0.02665875Standard Error 0.055010668Observations 36
ANOVAdf SS MS F Significance F
Regression 1 0.000275902 0.000276 0.091172 0.76453199Residual 34 0.102889904 0.003026Total 35 0.103165806
Coefficients Standard Error t Stat P‐value Lower 95% Upper 95% Lower 95.0% Upper 95.0%Intercept ‐0.00129764 0.00918018 ‐0.14135 0.888426 ‐0.019954013 0.01735873 ‐0.019954013 0.01735873X Variable 1 ‐0.11082235 0.367026181 ‐0.30195 0.764532 ‐0.856709291 0.635064583 ‐0.856709291 0.635064583
SUMMARY OUTPUT 24
Regression StatisticsMultiple R 0.113069156R Square 0.012784634Adjusted R Square ‐0.03208879Standard Error 0.052091958Observations 24
ANOVAdf SS MS F Significance F
Regression 1 0.000773108 0.000773 0.284904 0.598856893Residual 22 0.059698586 0.002714Total 23 0.060471694
Coefficients Standard Error t Stat P‐value Lower 95% Upper 95% Lower 95.0% Upper 95.0%Intercept ‐0.00708249 0.010639797 ‐0.66566 0.512548 ‐0.02914808 0.014983098 ‐0.02914808 0.014983098X Variable 1 ‐0.20787041 0.389442317 ‐0.53376 0.598857 ‐1.015524342 0.599783517 ‐1.015524342 0.599783517
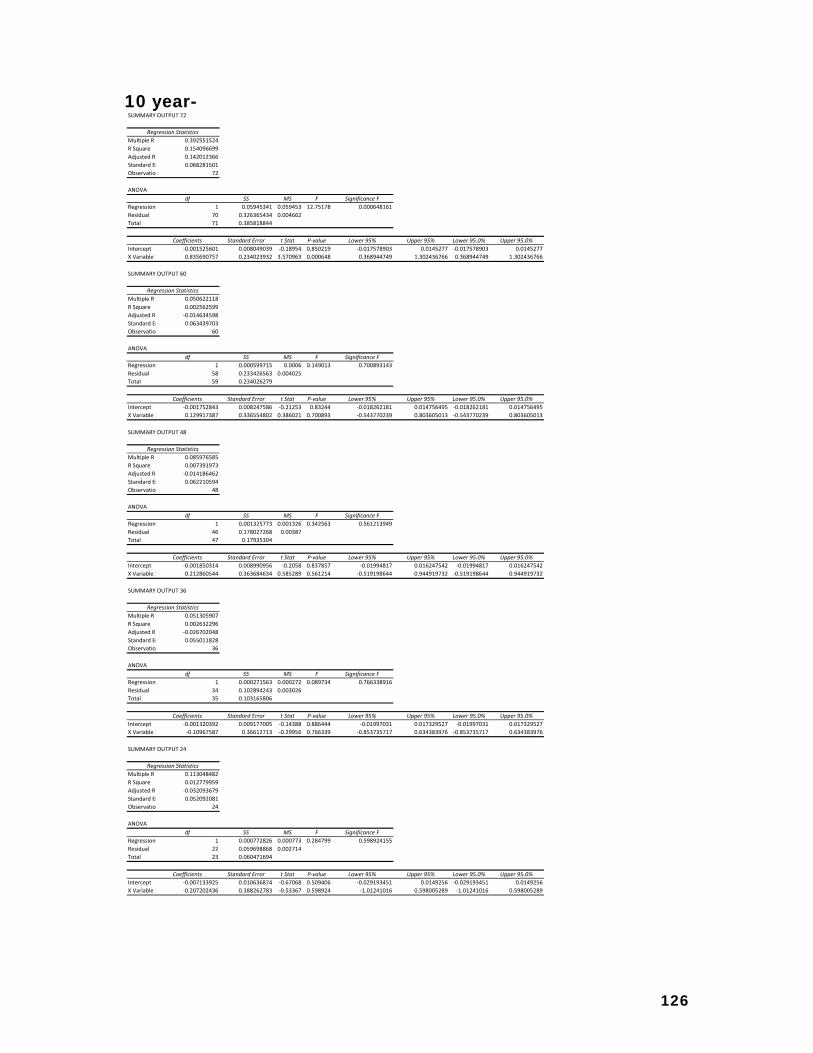
126
10 year-
SUMMARY OUTPUT 72
Regression StatisticsMultiple R 0.392551524R Square 0.154096699Adjusted R 0.142012366Standard Er 0.068281501Observatio 72
ANOVAdf SS MS F Significance F
Regression 1 0.05945341 0.059453 12.75178 0.000648161Residual 70 0.326365434 0.004662Total 71 0.385818844
Coefficients Standard Error t Stat P‐value Lower 95% Upper 95% Lower 95.0% Upper 95.0%Intercept ‐0.001525601 0.008049039 ‐0.18954 0.850219 ‐0.017578903 0.0145277 ‐0.017578903 0.0145277X Variable 1 0.835690757 0.234023932 3.570963 0.000648 0.368944749 1.302436766 0.368944749 1.302436766
SUMMARY OUTPUT 60
Regression StatisticsMultiple R 0.050622118R Square 0.002562599Adjusted R ‐0.014634598Standard Er 0.063439703Observatio 60
ANOVAdf SS MS F Significance F
Regression 1 0.000599715 0.0006 0.149013 0.700893143Residual 58 0.233426563 0.004025Total 59 0.234026279
Coefficients Standard Error t Stat P‐value Lower 95% Upper 95% Lower 95.0% Upper 95.0%Intercept ‐0.001752843 0.008247586 ‐0.21253 0.83244 ‐0.018262181 0.014756495 ‐0.018262181 0.014756495X Variable 1 0.129917387 0.336554802 0.386021 0.700893 ‐0.543770239 0.803605013 ‐0.543770239 0.803605013
SUMMARY OUTPUT 48
Regression StatisticsMultiple R 0.085976585R Square 0.007391973Adjusted R ‐0.014186462Standard Er 0.062210594Observatio 48
ANOVAdf SS MS F Significance F
Regression 1 0.001325773 0.001326 0.342563 0.561213949Residual 46 0.178027268 0.00387Total 47 0.17935304
Coefficients Standard Error t Stat P‐value Lower 95% Upper 95% Lower 95.0% Upper 95.0%Intercept ‐0.001850314 0.008990956 ‐0.2058 0.837857 ‐0.01994817 0.016247542 ‐0.01994817 0.016247542X Variable 1 0.212860544 0.363684634 0.585289 0.561214 ‐0.519198644 0.944919732 ‐0.519198644 0.944919732
SUMMARY OUTPUT 36
Regression StatisticsMultiple R 0.051305907R Square 0.002632296Adjusted R ‐0.026702048Standard Er 0.055011828Observatio 36
ANOVAdf SS MS F Significance F
Regression 1 0.000271563 0.000272 0.089734 0.766338916Residual 34 0.102894243 0.003026Total 35 0.103165806
Coefficients Standard Error t Stat P‐value Lower 95% Upper 95% Lower 95.0% Upper 95.0%Intercept ‐0.001320392 0.009177005 ‐0.14388 0.886444 ‐0.01997031 0.017329527 ‐0.01997031 0.017329527X Variable 1 ‐0.10967587 0.36612713 ‐0.29956 0.766339 ‐0.853735717 0.634383976 ‐0.853735717 0.634383976
SUMMARY OUTPUT 24
Regression StatisticsMultiple R 0.113048482R Square 0.012779959Adjusted R ‐0.032093679Standard Er 0.052092081Observatio 24
ANOVAdf SS MS F Significance F
Regression 1 0.000772826 0.000773 0.284799 0.598924155Residual 22 0.059698868 0.002714Total 23 0.060471694
Coefficients Standard Error t Stat P‐value Lower 95% Upper 95% Lower 95.0% Upper 95.0%Intercept ‐0.007133925 0.010636874 ‐0.67068 0.509406 ‐0.029193451 0.0149256 ‐0.029193451 0.0149256X Variable 1 ‐0.207202436 0.388262783 ‐0.53367 0.598924 ‐1.01241016 0.598005289 ‐1.01241016 0.598005289

127
References
• Southwest’s Website: www.southwest.com
2007 Annual Report
2003 10K- 2008 10K
• Continental’s Website www.continental.com
2007 Annual Report
2003 10K- 2008 10K
• AMR (American Airlines) Website: www.aa.com
2007 Annual Report
2003 10K- 2008 10K
• JetBlue’s Website www.jetblue.com
2007 Annual Report
2003 10K- 2008 10K
• Google Finance: www.finance.google.com
• Investopedia: www.investopedia.com
• Wall Street Journal: http://online.wsj.com
• Yahoo Finance: www.finance.yahoo.com
• The US Department of Transportation: www.dot.gov
• The federal Aviation Administration: www.faa.gov
• Business Travel news Magazine: www.btnonline.com
• Popularmechanics: www.Popularmechanics.com
• The economist: www.economist.com