Michael Bull - DMUG 2014
20
Dr Michael Bull – Director, Ove Arup and Partners Observed variations in modelling studies for cumulative impact assessment
-
Upload
institution-of-environmental-sciences -
Category
Environment
-
view
87 -
download
0
Transcript of Michael Bull - DMUG 2014
Dr Michael Bull – Director, Ove Arup and Partners
Observed variations in modelling studies for cumulative impact assessment

2
Cumulative Impact Assessment
• Recognised as a matter of concern, particularly for local authorities
• Problem is how should this be assessed when considering a single planning application
• Existing guidance does not address cumulative assessment in any detail
• There is reference to cumulative assessment in EPUK guidance but not in the context of single planning applications
• Generally cumulative impact assessment considered by including known committed deveopments in baseline traffic flows
• Is this adequate?

Not a critique of the merits of individual assessments undertaken

4
Variations in Air Quality Assessment
• Asked to examine cumulative impacts by a residents group in a small town who were concerned about the impacts from several different planning applications
• Individually each has a small impact – collectively a greater impact
• Each scheme application was accompanied by an air quality assessment the covered the same area
• Provided an opportunity to compare the results from four studies carried out independently but in the same area
• This presentation looks at two topics, a comparison of these studies and secondly whether we approach cumulative assessments correctly.
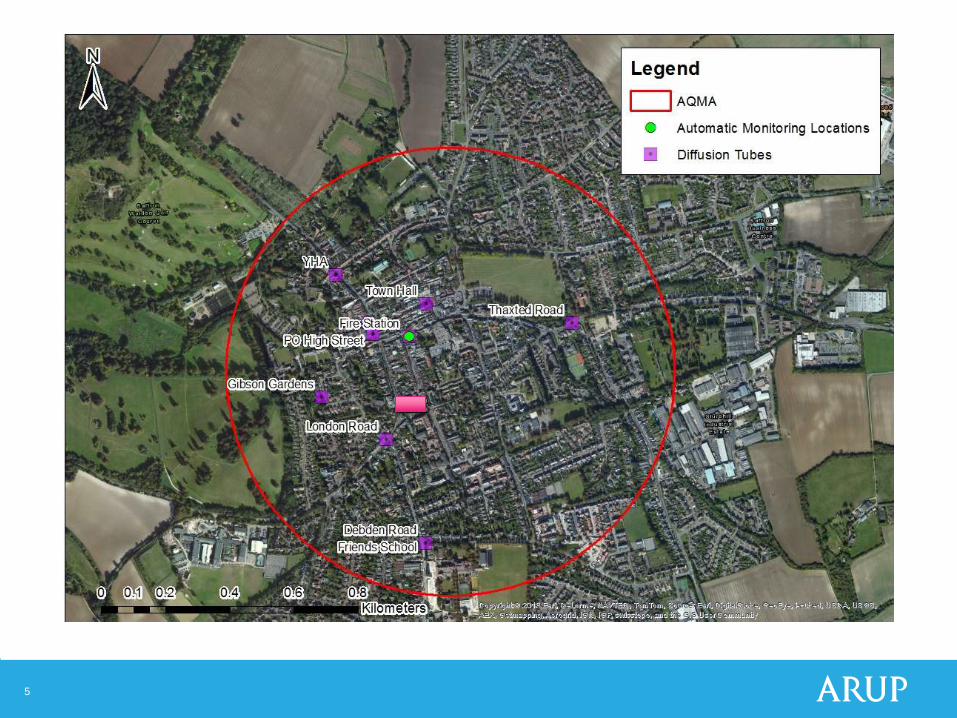
5

6
Study Area – three main proposals
• Housing proposal for 300 homes and school
• Mixed use/housing proposal for ~170 homes
• Care village (~100 units)/housing proposal for 200 homes
• Plus … already committed
- Extension to a supermarket
- Seven other residential schemes with another 350 units
- Retail development with supermarket, retail warehouse and garden centre
- Junior school
• So together more than 1000 units plus other development
7
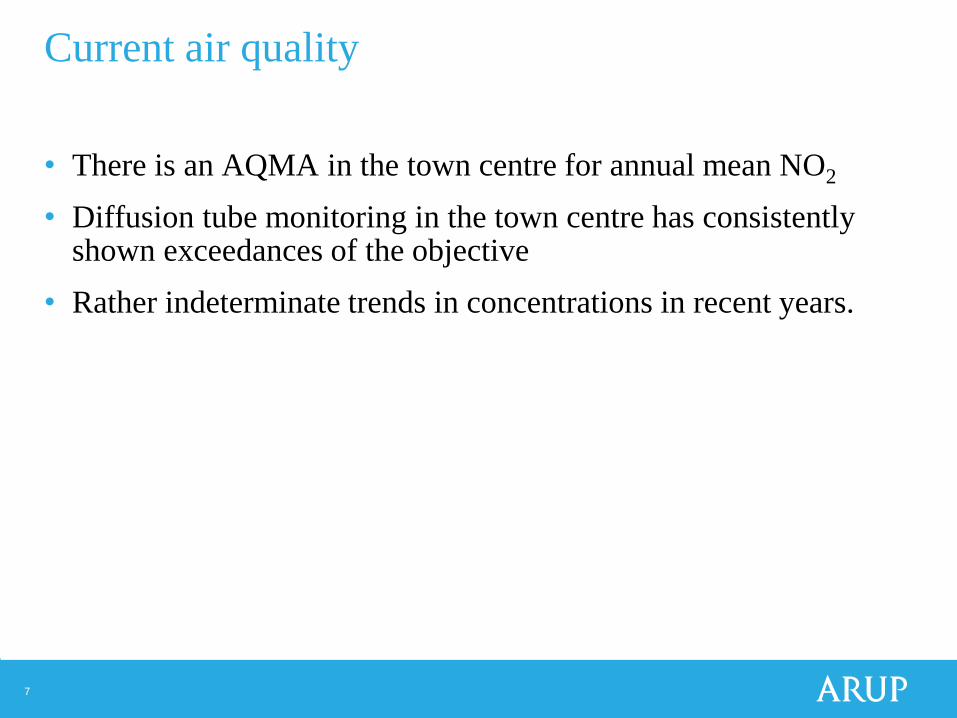
Current air quality
• There is an AQMA in the town centre for annual mean NO2
• Diffusion tube monitoring in the town centre has consistently shown exceedances of the objective
• Rather indeterminate trends in concentrations in recent years.

8
Monitored NO2 concentrations
Site ID
Annual mean NO2 concentration
(µg/m3)
2009 2010 2011 2012 2013
1 40 47.2 36.6 38.7 38.9
2 18 20.3 14.1 15.7 16.0
3 44 48.6 38.4 47.5 42.7
4 50 57.7 43.1 46.1 36.2*
5 37 41.5 30.7 33.6 34.6
6 22 25.4 18.2 21.2 21.0
7 25 29.1 21.2 22.7 25.0
8 43 50.0 40.7 45.8 41.3
9 - 32.8 23.0 30.0 27.3
10 - 36.9 25.3 26.9 30.7

9
Air quality assessments carried out
• Four difference consultancies carried out the assessments
• One for each of the main developments
• One was looking at the overall impact of development in the area – not specifically looking at the individual proposals
• Similar methods applied for each assessment, ADMS-Roads used for modelling, EfT emission factors, model verification and Defra background maps
• Varying assumptions made about future conditions either as a sensitivity test or as the main case
• Very similar years of assessment

10
Approaches to assessment
Cumulative Consultancy 1 Consultancy 2 Consultancy 3
Future
background
concentration
Defra 2010
reduced by
15%, minor
road
contribution
removed
Defra 2011 Defra 2011 Defra
2012/2013
Modelling Manual
modification of
vehicle speeds
Slowing near to
junctions
Slowing near to
junctions and
inclusion of
street canyons
Street canyons
but no account
of junction
speeds
Verification
Factor
3.147 2.2 1.012 1.3219

11
Approaches to assessment
Cumulative Consultancy 1 Consultancy 2 Consultancy 3
Uptake of Euro
VI
vehicles/Future
emissions
States won’t be
significant in
2018. Uses
TG09 and HA
LTT
methodology
Not discussed Sensitivity test
assuming no
reduction in
emissions to
account for any
over optimism.
Emission
factors for 2012
used in model
with 2018
traffic data
Cumulative
Assessment
Includes
proposed (but
not specific
developments)
Some
committed
development
omitted, no
assessment of
known
proposals
Some
committed
development
omitted, no
assessment of
known
proposals
Some
committed
developments
omitted
includes other
two main
developments,
but without
ECC Highways
adjustments
12
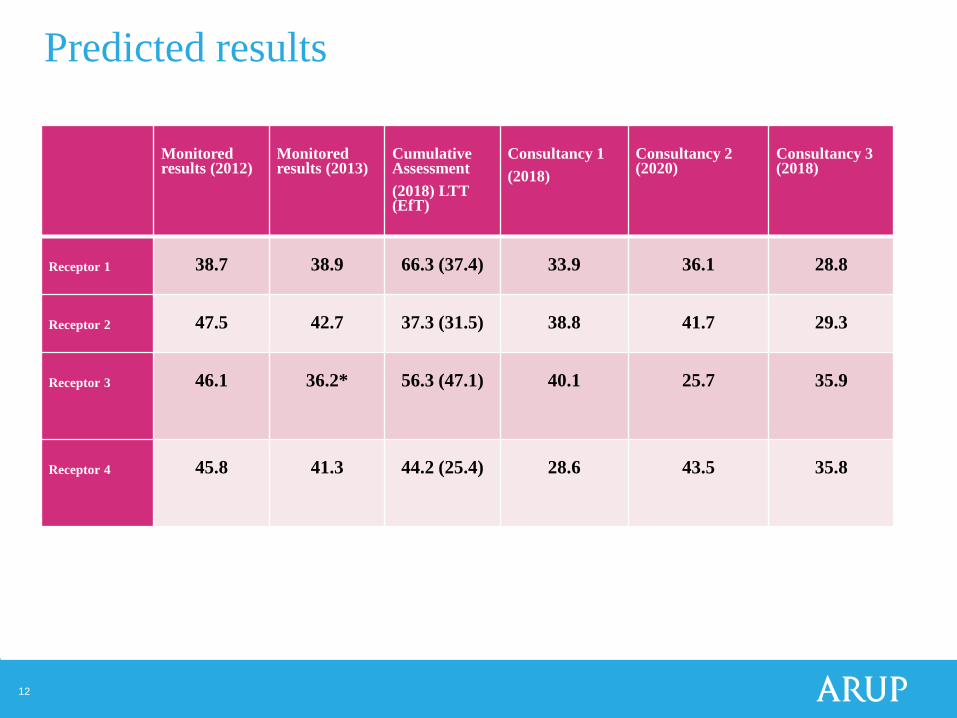
Predicted results
Monitored results (2012)
Monitored results (2013)
CumulativeAssessment
(2018) LTT(EfT)
Consultancy 1
(2018)
Consultancy 2 (2020)
Consultancy 3 (2018)
Receptor 1 38.7 38.9 66.3 (37.4) 33.9 36.1 28.8
Receptor 2 47.5 42.7 37.3 (31.5) 38.8 41.7 29.3
Receptor 3 46.1 36.2* 56.3 (47.1) 40.1 25.7 35.9
Receptor 4 45.8 41.3 44.2 (25.4) 28.6 43.5 35.8

13
Differences?
• Assumptions on future backgrounds and future emissions clearly have the greatest impact on the results
• Traffic behaviour in urban areas is important
• Assumptions around other developments may have minor impact
• Assumptions such as street canyons may have minor influences
• Variation in verification factor may be explained by the above (apart from future conditions) but that then suggests more examination of input data is required

14
Conclusions of the assessments
• Each assessment of an individual planning application concludes that
there’s no significant impact – changes in concentrations are
• Cumulative assessment however, identifies some properties with
substantial or moderate adverse impacts
• Could be expected to reasonably result in more weight on air quality
matters in the planning decision if the cumulative assessment was
presented
• Could be argued it’s reasonable for a local authority to consider they
have reached capacity (in terms of air quality)
• Are we providing stakeholders with useful or confusing information?
• Are we considering cumulative assessment properly?
• Do we provide too much flexibility in guidance for use of “professional
judgement”

15
Does policy/guidance help?
• NPPF - Planning policies should sustain compliance with and contribute towards EU limit values or national objectives for pollutants, taking into account the presence of Air Quality Management Areas and the cumulative impacts on air quality from individual sites in local areas.
• Planning Policy Guidance on Air Quality is silent
• EPUK Guidance – “For individual, unrelated developments controls on cumulative emissions or impacts are much less apparent”

16
Can we miss the impact?

17
Is the current approach acceptable?
• Normal approach (for traffic related impacts) is to include the transport impacts from the other developments in baseline traffic flows
• Development flows are then superimposed on top
• Does results in diminution of the impacts as baseline levels are increased and hence incremental change is less
• For cumulative effects, this approach only show a problem where an exceedance is predicted – incremental changes owing to cumulative effects are not considered
• Area where dispersion modelling results are weaker (see earlier results!)

18
How could we improve?
• Could an air quality assessment of a single development also look at the impact of all consented developments and inform the planning decision of the impacts of decisions made to date (but not evident in the traffic data used)?
• AQ assessments could report the incremental changes in air quality owing to the development and also a running total of the impact on AQ on all applications approved to date (that are not built out and included in data)
• Planning committees and EHOs could be better informed of the cumulative impacts and may have more evidence to refuse an application or wait until air quality had improved until implementation.
19
Some questions for the modelling community
• Is professional judgement providing too much flexibility?
• Should we change guidance to adopt a more rigid approach to reduce variation between approaches?
• Should LAs be very specific about the approach required in air quality assessment?
• Is our current approach to assessment of cumulative impacts adequate
• Should we provide an assessment of the impact of all consented schemes
• How would we determine significance when the absolute concentration is important and there is so much variation in results?