
mice: on the role of and Prdm9 allelic...
18
1 Supporting Information Genetic recombination variation in wild Robertsonian mice: on the role of chromosomal fusions and Prdm9 allelic background Laia Capilla 1,2 , Nuria Medarde 2 , Alexandra Alemany‐Schmidt 3 , Maria Oliver‐Bonet 3 , Jacint Ventura 2 , Aurora Ruiz‐Herrera 1,4 1 Institut de Biotecnologia i Biomedicina (IBB), Universitat Autònoma de Barcelona, Campus UAB, 08193, Barcelona, Spain. 2 Departament de Biologia Animal, Biologia Vegetal i Ecologia, Universitat Autònoma de Barcelona, Campus UAB, 08193, Barcelona, Spain. 3 Unitat d’Investigació, Hospital Universitari Son Espases, Ctra Valldemossa 79, 07010, Palma, Spain, 4 Departament de Biologia Cel∙lular, Fisiologia i Immunologia, Universitat Autònoma de Barcelona, Campus UAB, Barcelona, Spain. 1. Material and Methods ________________________ Page 2 2. Supplementary Tables ________________________ Page 5 3. Supplementary Figures ________________________ Page 8 4. References __________________________________ Page 18
Transcript of mice: on the role of and Prdm9 allelic...
1
Supporting Information
Genetic recombination variation in wild Robertsonian mice: on the role of chromosomal fusions and Prdm9 allelic background Laia Capilla1,2, Nuria Medarde2, Alexandra Alemany‐Schmidt3, Maria Oliver‐Bonet3, Jacint Ventura2, Aurora Ruiz‐Herrera1,4 1 Institut de Biotecnologia i Biomedicina (IBB), Universitat Autònoma de Barcelona, Campus UAB, 08193, Barcelona, Spain. 2 Departament de Biologia Animal, Biologia Vegetal i Ecologia, Universitat Autònoma de Barcelona, Campus UAB, 08193, Barcelona, Spain. 3Unitat d’Investigació, Hospital Universitari Son Espases, Ctra Valldemossa 79, 07010, Palma, Spain, 4Departament de Biologia Cel∙lular, Fisiologia i Immunologia, Universitat Autònoma de Barcelona, Campus UAB, Barcelona, Spain.
1. Material and Methods ________________________ Page 2 2. Supplementary Tables ________________________ Page 5 3. Supplementary Figures ________________________ Page 8 4. References __________________________________ Page 18
2
1. Material and Methods a) Animals and chromosomal characterization
A total of 31 wild male mice were live‐trapped in commensal habitats from 10 different
localities representatives of the Barcelona Rb system (Table S1 and Fig. S1). Three males from
the laboratory strain C57BL6 were also included in the analysis for comparison. Mitotic
metaphase spreads were obtained from fibroblast cultures and bone marrow cells. Cell
cultures were derived from fresh tissues samples and the harvesting of cells followed standard
procedures. Karyotypes were determined by analyzing G‐banded chromosomal preparations
[1]. When G‐banding identification was not sufficient for chromosomal identification, we used
commercial mouse chromosome‐specific painting probes (Cambio, Cambridge, UK) to confirm
G‐banding homologies following [2]. The Ethics Committee of the Universitat Autònoma de
Barcelona approved the animal treatment protocols adopted herein.
b) Immunoflourescence
Immunofluorescence (IF) of spermatocyte spreads was performed following [3]. Different sets
of antibodies were used: mouse monoclonal antibody against MLH1 (BD Pharmigen) for the
detection of crossovers (COs), rabbit polyclonal serum against central element protein of the
synaptonemal complex (SC) (SYCP3, Abcam), human calcinosis, Raynaud’s phenomenon,
oesophageal dysfunction, sclerodactyly and telangiectasia (CREST) serum for the detection of
the centromeres, mouse H2AX (Millipore), rabbit H3K9me3 (Abcam) and mouse RPA (Abcam).
Corresponding secondary antibodies were: anti‐mouse conjugated with FITC, anti‐mouse
conjugated with Cy3, anti‐rabbit Cy3 and anti‐human Cy5 (all purchased from Jackson
Immunoresearch).
c) Fluorescence in situ hybridization
With the aim of identifying the chromosomes implicated in Rb fusions, fluorescence in situ
hybridization (FISH) was performed on previously immunostained preparations using Bacterial
Artificial Chromosome (BAC) probes for specific mouse chromosomes (chromosomes 4, 9, 11,
12, 13 and 14). BAC clones where selected from the UCSC genome browser
(http://genome.ucsc.edu) and purchased from CHORI (http://bacpac.chori.org) (Table S3). DNA
3
was purified from bacterial pellets using a Midiprep extraction kit (Quiagen). FISH was
performed on both metaphase chromosomes and spermatocyte spreads as previously
described [2,3], with modifications. Briefly, 1 µg of the plasmid DNA was labeled with dUTP‐
digoxigenin using a nick translation kit (Abbot) and ethanol precipitated with competitor DNA
(Cot‐1 Mouse DNA, Invitrogen, 1 mg/ml), salmon sperm DNA (Invitrogen, 10 mg/ml) and 1/10
volume of 3 mol/L sodium acetate overnight at ‐20ºC. The slides were dehydrated in an
ethanol scale containing 70% formamide at 74ºC before, and after the denaturation. The probe
was precipitated and washed twice with 70% ethanol and then diluted in 15 ul of hybridization
buffer (50% deionized formamide, 10% dextran sulfate, 2xSSC and 0.5mol/L phosphate).
Chromosomes were denatured at 74º at which point the probe hybridization mix was placed
directly on the slides, which were cover‐slipped and incubated O/N at 37ºC in a humid
chamber. Washes were performed with 2X saline sodium citrate (SSC) and 50% formamide
solution before applying the anti‐digoxigenin conjugated with FITC.
d) Image processing and data analysis
Preparations were visualized using a Zeiss Axioskop epifluorescence microscope equipped with
the appropriate filters and a charged coupled device camera (ProgRes® CS10plus, Jenoptik).
Images were captured and produced by the ProgRes® software (2.7.7). Images for each
specimen were taken blindly (i.e., specimens were numerically assigned irrespectively of their
chromosomal composition) in order to avoid against unintentional biases in MLH1 scores.
The Micromeasure 3.3 software [4] was used for the analysis of recombination maps
(based on the distances between adjacent MLH1 and RPA foci). For each chromosome
analyzed, the position of each focus (MLH1 and RPA) was recorded as a relative position
(percentage of the synaptonemal complex total length) from the centromere, identified by the
CREST signal in each preparation. The positions of MLH1/RPA foci were calculated for each
chromosome using the centromere as reference point, (i.e., from the centromere to the
telomere in the q‐arm). Thus for comparison among chromosomes, the positions of MLH1 foci
were expressed as the relative position of each CO to the length of the chromosome (the
length of each SC was divided into 10% intervals). These data were used to construct
cumulative frequency distribution plots and we compared the different distributions using a
Kolmogorov‐Smirnov test (KS test). Moreover, we analyzed the frequencies of MLH1 foci along
4
SCs by dividing them in three regions depending on the relative distance from the centromere:
(i) proximal (from the centromere to 30% of the SC) (ii) interstitial (between 30%‐70% of SC)
and (iii) distal (from 70% to telomeric region). For the analysis of H3K9me3 chromosomal
distribution, the Micromeasure software was used to calculate the signal area (measured in
micrometers) overlapping the SC for each chromosomal arm analyzed.
The statistical analysis was carried out by means of PAWS Statistics 18© and JMP 7
software package. Given that the distribution of crossovers per specimen did not follow a
normal distribution (Shapiro‐Wilk test, p‐value≤0.001), we applied nonparametric analysis,
such as Mann–Whitney U test or Kruskal–Wallis test for mean comparison and Spearman test
for correlations.
e) Prdm9 genotyping
Genomic DNA was extracted and purified from cell cultures derived from mice of the Rb
polymorphism zone (n=27) following the standard phenol‐chloroform protocol. We sequenced
the Prmd9 exon 12, from Zn repeat +3 towards the c‐terminal domain. This exon contains the
Zn finger domain array that recognises and methylates the specific DNA sequences [5,6].
PRDM9 zinc finger arrays were amplified by PCR using ExTaq™ (Takara), with 4% DMSO,
primers fl1500U20 and 2848L23 [5] as follows: 95ºC (3 min), 30 cycles of 95ºC (30 s); 56ºC (30
s); 72ºC (90 s). PCR products were run in a 2% agarose gel in order to distinguish different
haplotypes (Fig. S5). When mice had alleles of the same length (length homozygotes, n=20),
PCR amplified fragments were purified with the GeneJET™ PCR purification kit (Fermentas). For
mice with alleles of two different lengths (length heterozygotes, n=7), bands were cut from the
agarose gel and purified using the GeneJET™ Gel Extraction Kit (Fermentas). In both cases,
purified gene products were subjected to bidirectional Sanger sequencing with primers
fl1822U24 and 2848L23 [6] and reads were subsequently analyzed using the CLCbio Main
Workbench program, version 6.8 (Aarhus, DK). For those animals found heterozygotes for
alleles of the same length, two different softwares were used in order to distinguish allelic
variants and define the haplotypes: Phase
(http://stephenslab.uchicago.edu/software.html#phase) and Champuru v1.0
(http://www.mnhn.fr/jfflot/champuru/). In any case, all new allelic variants were confirmed by
re‐sequencing and re‐analyzed.
5
Supplementary Tables
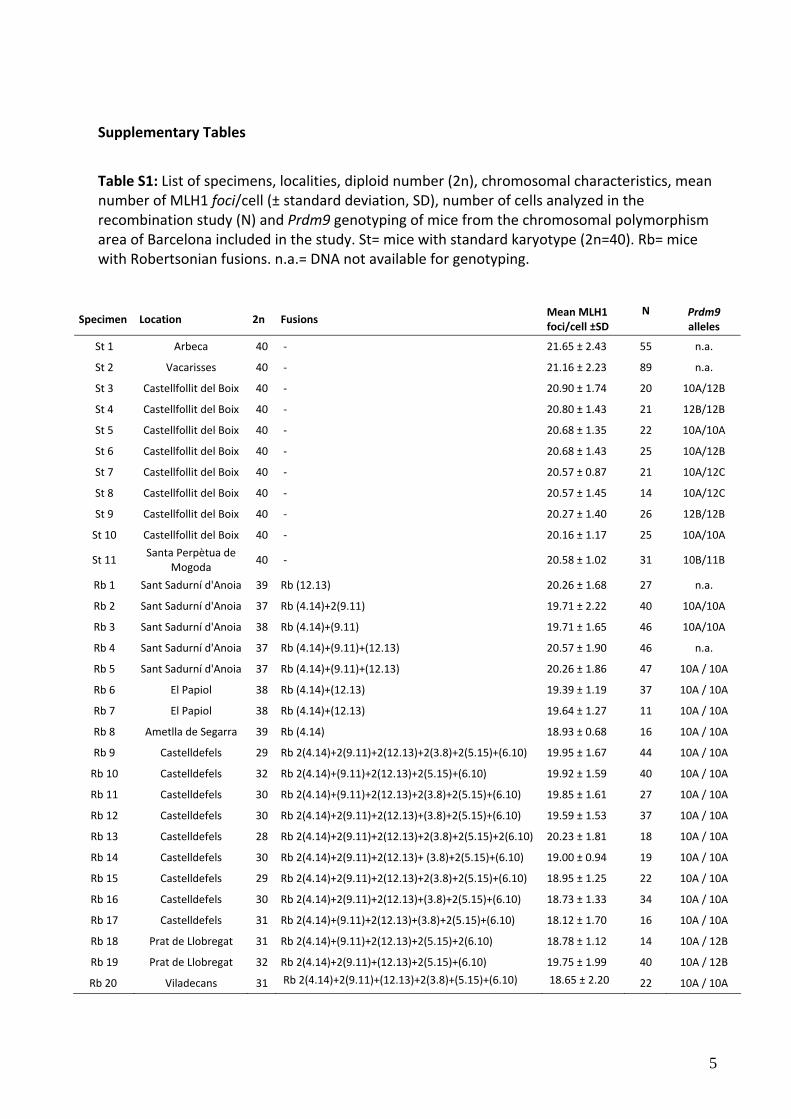
Table S1: List of specimens, localities, diploid number (2n), chromosomal characteristics, mean number of MLH1 foci/cell (± standard deviation, SD), number of cells analyzed in the recombination study (N) and Prdm9 genotyping of mice from the chromosomal polymorphism area of Barcelona included in the study. St= mice with standard karyotype (2n=40). Rb= mice with Robertsonian fusions. n.a.= DNA not available for genotyping.
Specimen Location 2n Fusions Mean MLH1 foci/cell ±SD
N Prdm9 alleles
St 1 Arbeca 40 ‐ 21.65 ± 2.43 55 n.a.
St 2 Vacarisses 40 ‐ 21.16 ± 2.23 89 n.a.
St 3 Castellfollit del Boix 40 ‐ 20.90 ± 1.74 20 10A/12B
St 4 Castellfollit del Boix 40 ‐ 20.80 ± 1.43 21 12B/12B
St 5 Castellfollit del Boix 40 ‐ 20.68 ± 1.35 22 10A/10A
St 6 Castellfollit del Boix 40 ‐ 20.68 ± 1.43 25 10A/12B
St 7 Castellfollit del Boix 40 ‐ 20.57 ± 0.87 21 10A/12C
St 8 Castellfollit del Boix 40 ‐ 20.57 ± 1.45 14 10A/12C
St 9 Castellfollit del Boix 40 ‐ 20.27 ± 1.40 26 12B/12B
St 10 Castellfollit del Boix 40 ‐ 20.16 ± 1.17 25 10A/10A
St 11 Santa Perpètua de
Mogoda 40 ‐ 20.58 ± 1.02 31 10B/11B
Rb 1 Sant Sadurní d'Anoia 39 Rb (12.13) 20.26 ± 1.68 27 n.a.
Rb 2 Sant Sadurní d'Anoia 37 Rb (4.14)+2(9.11) 19.71 ± 2.22 40 10A/10A
Rb 3 Sant Sadurní d'Anoia 38 Rb (4.14)+(9.11) 19.71 ± 1.65 46 10A/10A
Rb 4 Sant Sadurní d'Anoia 37 Rb (4.14)+(9.11)+(12.13) 20.57 ± 1.90 46 n.a.
Rb 5 Sant Sadurní d'Anoia 37 Rb (4.14)+(9.11)+(12.13) 20.26 ± 1.86 47 10A / 10A
Rb 6 El Papiol 38 Rb (4.14)+(12.13) 19.39 ± 1.19 37 10A / 10A
Rb 7 El Papiol 38 Rb (4.14)+(12.13) 19.64 ± 1.27 11 10A / 10A
Rb 8 Ametlla de Segarra 39 Rb (4.14) 18.93 ± 0.68 16 10A / 10A
Rb 9 Castelldefels 29 Rb 2(4.14)+2(9.11)+2(12.13)+2(3.8)+2(5.15)+(6.10) 19.95 ± 1.67 44 10A / 10A
Rb 10 Castelldefels 32 Rb 2(4.14)+(9.11)+2(12.13)+2(5.15)+(6.10) 19.92 ± 1.59 40 10A / 10A
Rb 11 Castelldefels 30 Rb 2(4.14)+(9.11)+2(12.13)+2(3.8)+2(5.15)+(6.10) 19.85 ± 1.61 27 10A / 10A
Rb 12 Castelldefels 30 Rb 2(4.14)+2(9.11)+2(12.13)+(3.8)+2(5.15)+(6.10) 19.59 ± 1.53 37 10A / 10A
Rb 13 Castelldefels 28 Rb 2(4.14)+2(9.11)+2(12.13)+2(3.8)+2(5.15)+2(6.10) 20.23 ± 1.81 18 10A / 10A
Rb 14 Castelldefels 30 Rb 2(4.14)+2(9.11)+2(12.13)+ (3.8)+2(5.15)+(6.10) 19.00 ± 0.94 19 10A / 10A
Rb 15 Castelldefels 29 Rb 2(4.14)+2(9.11)+2(12.13)+2(3.8)+2(5.15)+(6.10) 18.95 ± 1.25 22 10A / 10A
Rb 16 Castelldefels 30 Rb 2(4.14)+2(9.11)+2(12.13)+(3.8)+2(5.15)+(6.10) 18.73 ± 1.33 34 10A / 10A
Rb 17 Castelldefels 31 Rb 2(4.14)+(9.11)+2(12.13)+(3.8)+2(5.15)+(6.10) 18.12 ± 1.70 16 10A / 10A
Rb 18 Prat de Llobregat 31 Rb 2(4.14)+(9.11)+2(12.13)+2(5.15)+2(6.10) 18.78 ± 1.12 14 10A / 12B
Rb 19 Prat de Llobregat 32 Rb 2(4.14)+2(9.11)+(12.13)+2(5.15)+(6.10) 19.75 ± 1.99 40 10A / 12B
Rb 20 Viladecans 31 Rb 2(4.14)+2(9.11)+(12.13)+2(3.8)+(5.15)+(6.10) 18.65 ± 2.20 22 10A / 10A
6
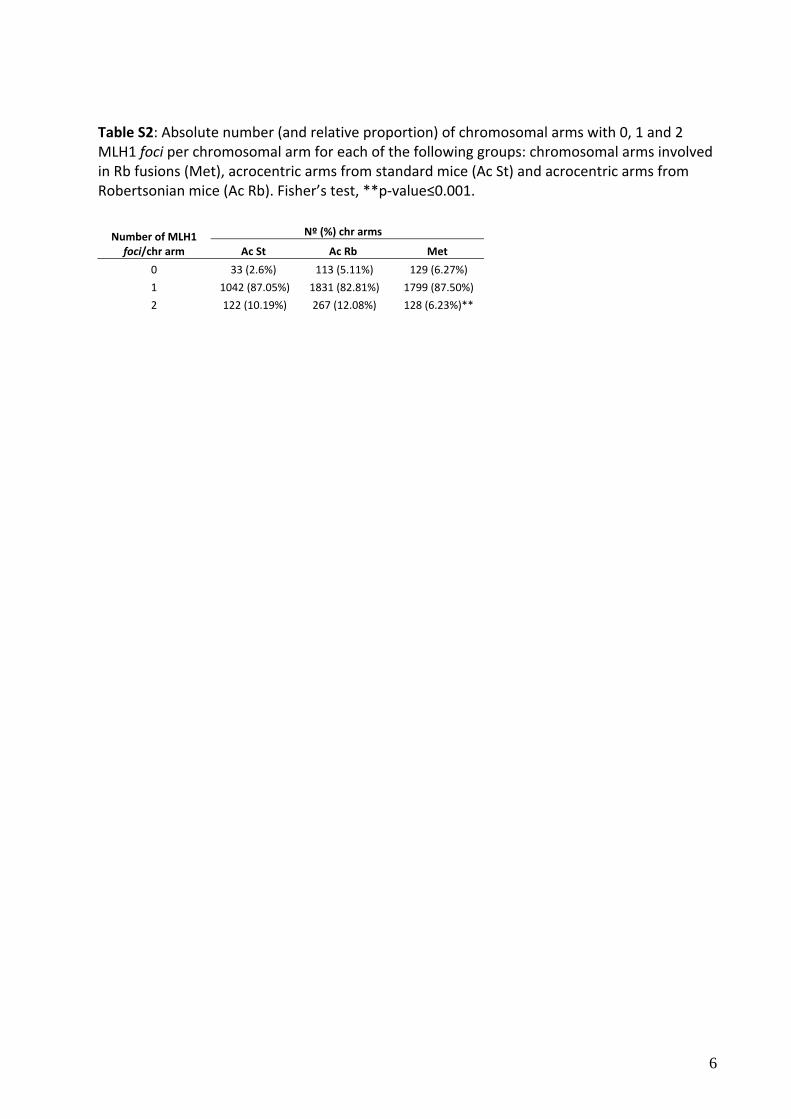
Table S2: Absolute number (and relative proportion) of chromosomal arms with 0, 1 and 2 MLH1 foci per chromosomal arm for each of the following groups: chromosomal arms involved in Rb fusions (Met), acrocentric arms from standard mice (Ac St) and acrocentric arms from Robertsonian mice (Ac Rb). Fisher’s test, **p‐value≤0.001.
Nº (%) chr arms Number of MLH1 foci/chr arm Ac St Ac Rb Met
0 33 (2.6%) 113 (5.11%) 129 (6.27%)
1 1042 (87.05%) 1831 (82.81%) 1799 (87.50%)
2 122 (10.19%) 267 (12.08%) 128 (6.23%)**
7
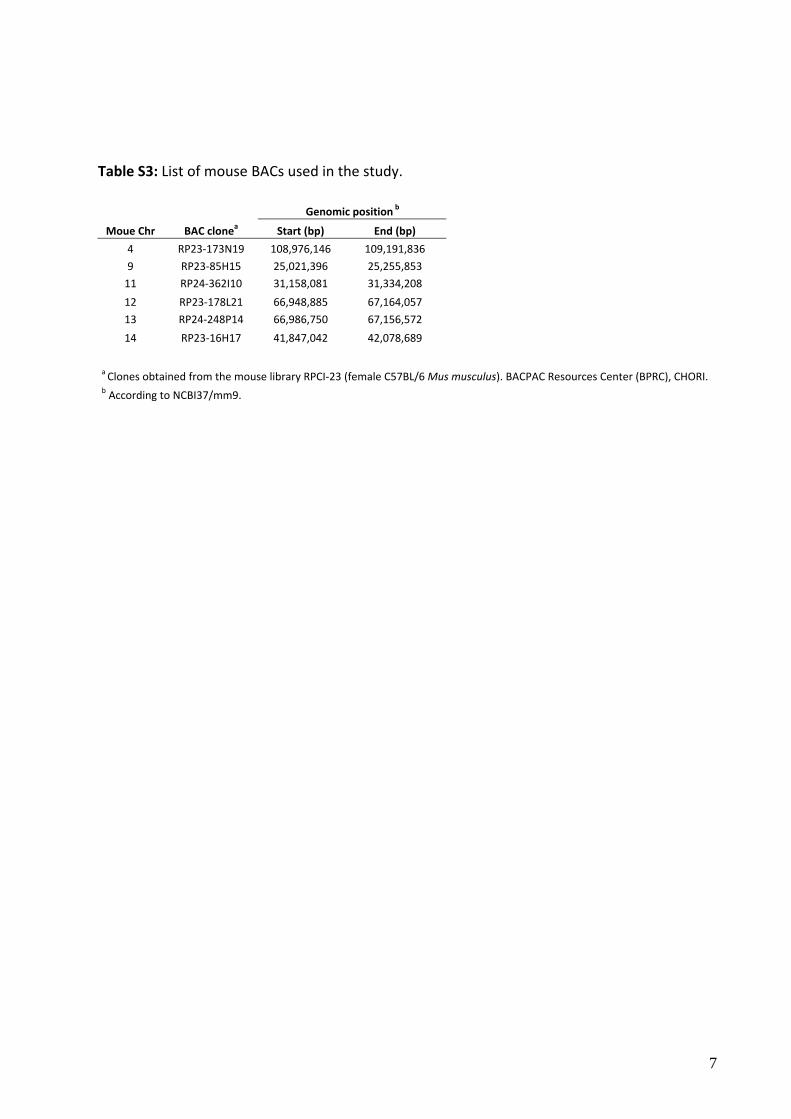
Table S3: List of mouse BACs used in the study.
Genomic position b
Moue Chr BAC clonea Start (bp) End (bp)
4 RP23‐173N19 108,976,146 109,191,836
9 RP23‐85H15 25,021,396 25,255,853
11 RP24‐362I10 31,158,081 31,334,208
12 RP23‐178L21 66,948,885 67,164,057
13 RP24‐248P14 66,986,750 67,156,572
14 RP23‐16H17 41,847,042 42,078,689
a Clones obtained from the mouse library RPCI‐23 (female C57BL/6 Mus musculus). BACPAC Resources Center (BPRC), CHORI. b According to NCBI37/mm9.
8
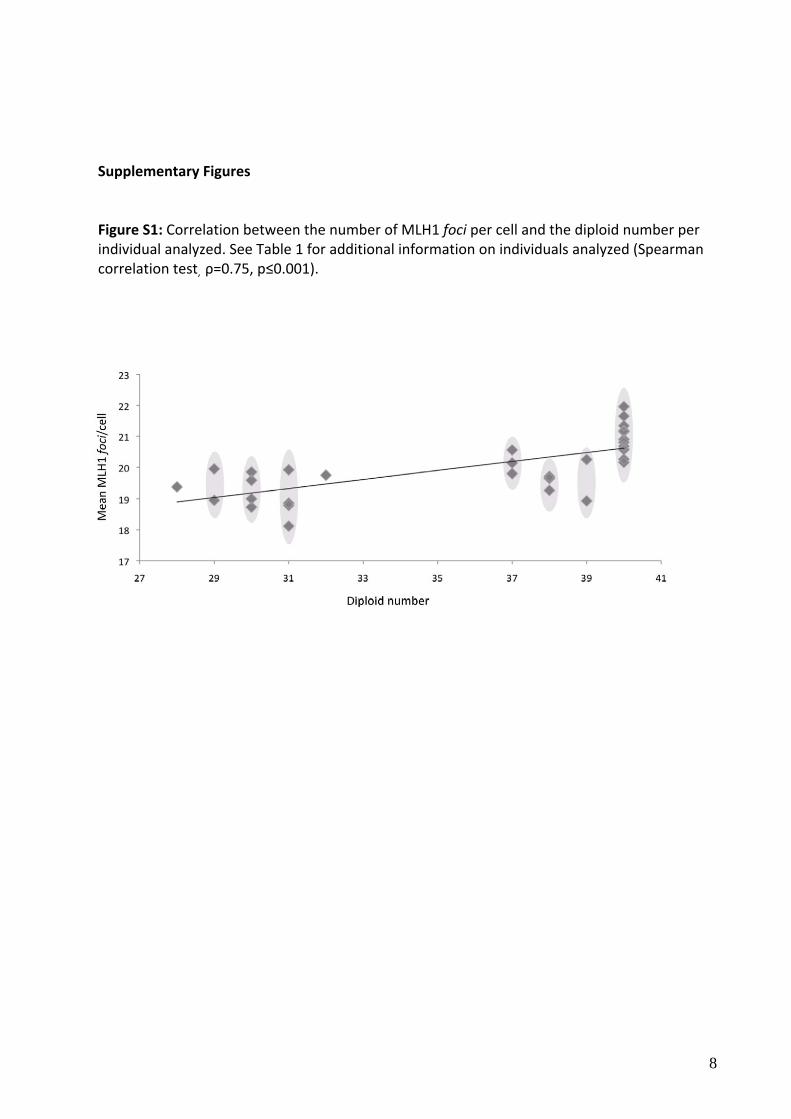
Supplementary Figures Figure S1: Correlation between the number of MLH1 foci per cell and the diploid number per individual analyzed. See Table 1 for additional information on individuals analyzed (Spearman correlation test, ρ=0.75, p≤0.001).
9
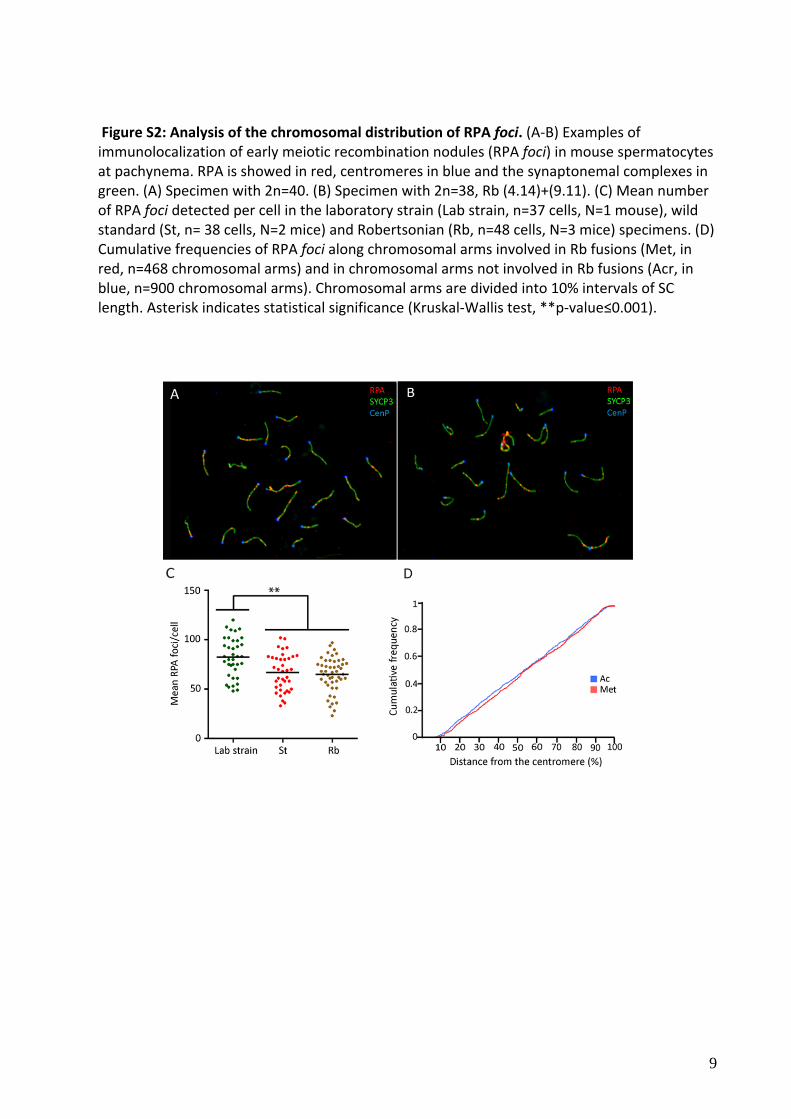
Figure S2: Analysis of the chromosomal distribution of RPA foci. (A‐B) Examples of immunolocalization of early meiotic recombination nodules (RPA foci) in mouse spermatocytes at pachynema. RPA is showed in red, centromeres in blue and the synaptonemal complexes in green. (A) Specimen with 2n=40. (B) Specimen with 2n=38, Rb (4.14)+(9.11). (C) Mean number of RPA foci detected per cell in the laboratory strain (Lab strain, n=37 cells, N=1 mouse), wild standard (St, n= 38 cells, N=2 mice) and Robertsonian (Rb, n=48 cells, N=3 mice) specimens. (D) Cumulative frequencies of RPA foci along chromosomal arms involved in Rb fusions (Met, in red, n=468 chromosomal arms) and in chromosomal arms not involved in Rb fusions (Acr, in blue, n=900 chromosomal arms). Chromosomal arms are divided into 10% intervals of SC length. Asterisk indicates statistical significance (Kruskal‐Wallis test, **p‐value≤0.001).
A B
10
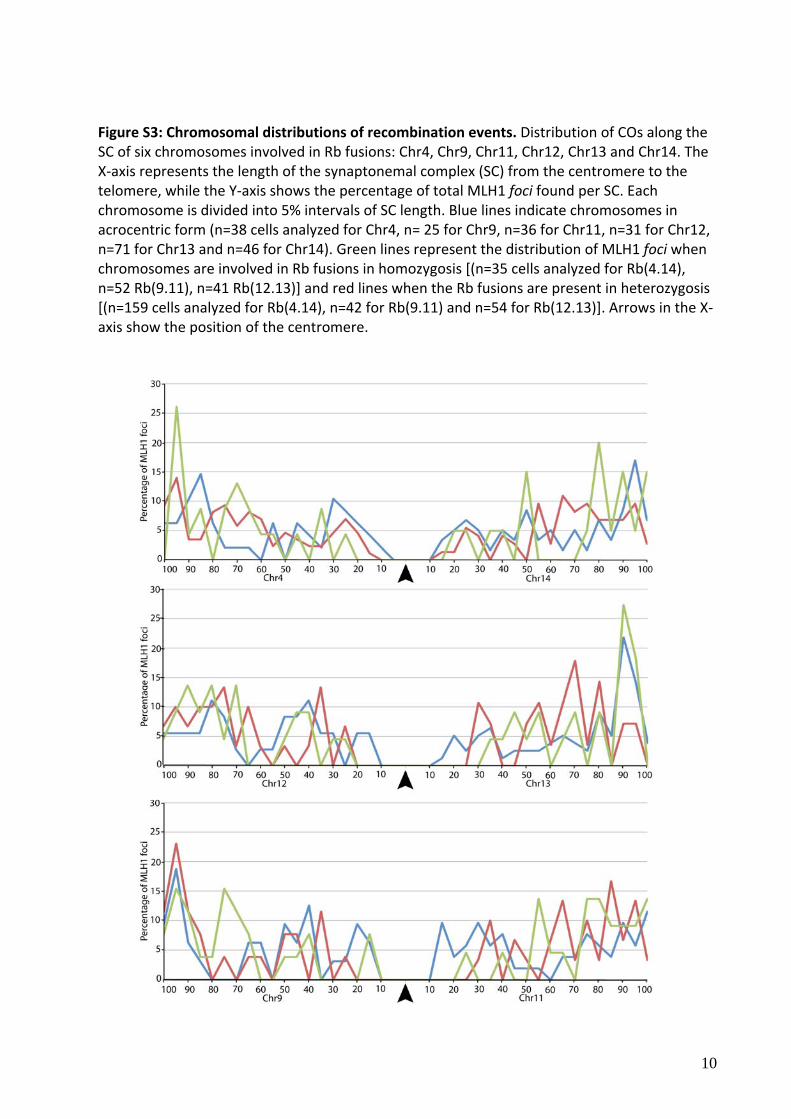
Figure S3: Chromosomal distributions of recombination events. Distribution of COs along the SC of six chromosomes involved in Rb fusions: Chr4, Chr9, Chr11, Chr12, Chr13 and Chr14. The X‐axis represents the length of the synaptonemal complex (SC) from the centromere to the telomere, while the Y‐axis shows the percentage of total MLH1 foci found per SC. Each chromosome is divided into 5% intervals of SC length. Blue lines indicate chromosomes in acrocentric form (n=38 cells analyzed for Chr4, n= 25 for Chr9, n=36 for Chr11, n=31 for Chr12, n=71 for Chr13 and n=46 for Chr14). Green lines represent the distribution of MLH1 foci when chromosomes are involved in Rb fusions in homozygosis [(n=35 cells analyzed for Rb(4.14), n=52 Rb(9.11), n=41 Rb(12.13)] and red lines when the Rb fusions are present in heterozygosis [(n=159 cells analyzed for Rb(4.14), n=42 for Rb(9.11) and n=54 for Rb(12.13)]. Arrows in the X‐axis show the position of the centromere.
11
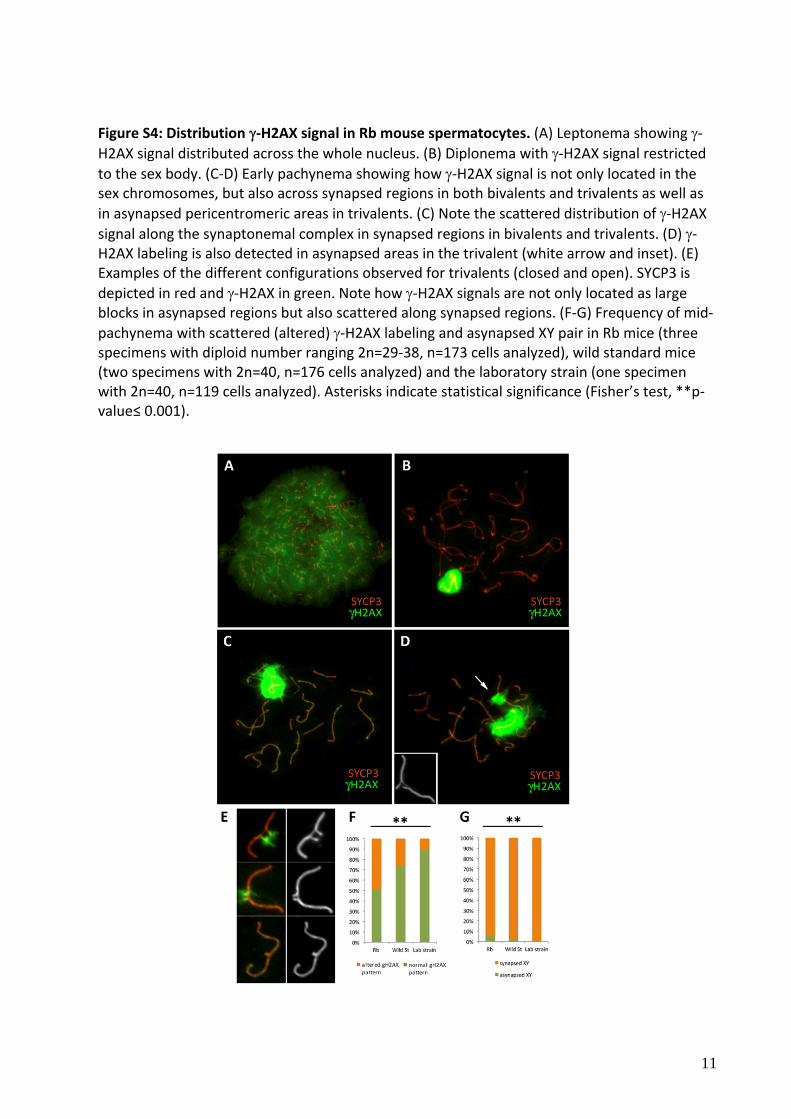
Figure S4: Distribution‐H2AX signal in Rb mouse spermatocytes. (A) Leptonema showing ‐H2AX signal distributed across the whole nucleus. (B) Diplonema with ‐H2AX signal restricted to the sex body. (C‐D) Early pachynema showing how ‐H2AX signal is not only located in the sex chromosomes, but also across synapsed regions in both bivalents and trivalents as well as
in asynapsed pericentromeric areas in trivalents. (C) Note the scattered distribution of ‐H2AX signal along the synaptonemal complex in synapsed regions in bivalents and trivalents. (D) ‐H2AX labeling is also detected in asynapsed areas in the trivalent (white arrow and inset). (E) Examples of the different configurations observed for trivalents (closed and open). SYCP3 is
depicted in red and ‐H2AX in green. Note how ‐H2AX signals are not only located as large blocks in asynapsed regions but also scattered along synapsed regions. (F‐G) Frequency of mid‐
pachynema with scattered (altered) ‐H2AX labeling and asynapsed XY pair in Rb mice (three specimens with diploid number ranging 2n=29‐38, n=173 cells analyzed), wild standard mice (two specimens with 2n=40, n=176 cells analyzed) and the laboratory strain (one specimen with 2n=40, n=119 cells analyzed). Asterisks indicate statistical significance (Fisher’s test, **p‐value≤ 0.001).
12
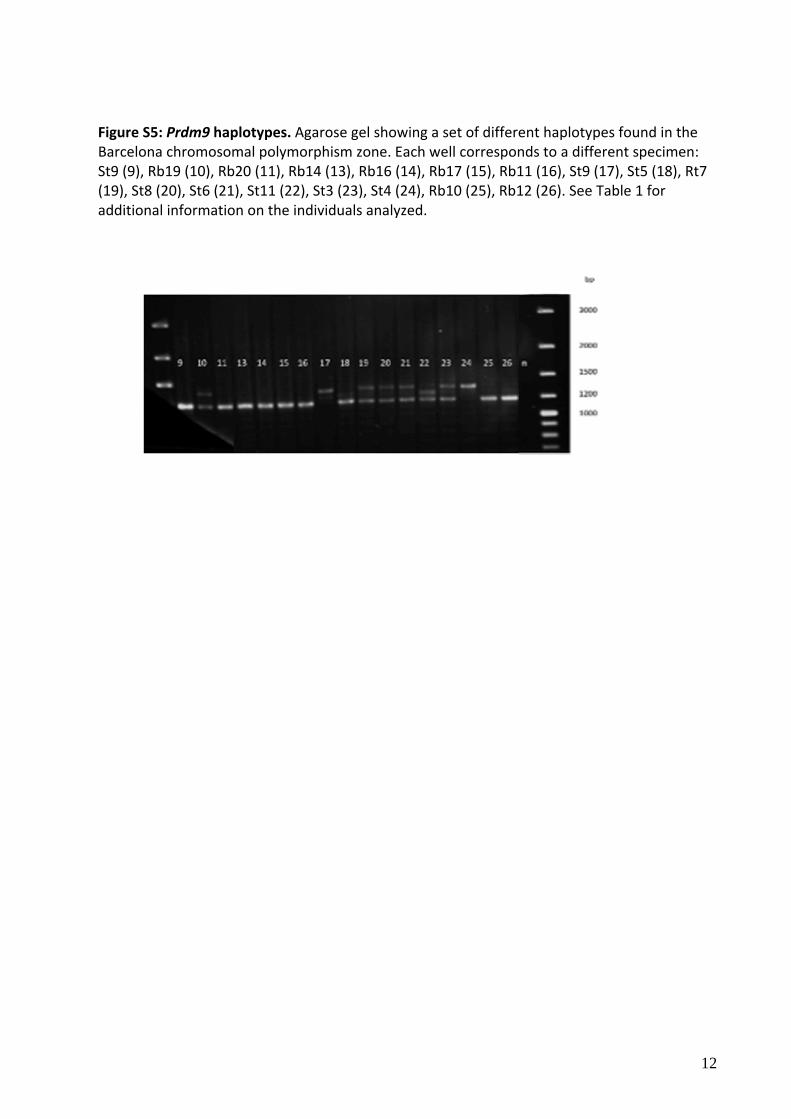
Figure S5: Prdm9 haplotypes. Agarose gel showing a set of different haplotypes found in the Barcelona chromosomal polymorphism zone. Each well corresponds to a different specimen: St9 (9), Rb19 (10), Rb20 (11), Rb14 (13), Rb16 (14), Rb17 (15), Rb11 (16), St9 (17), St5 (18), Rt7 (19), St8 (20), St6 (21), St11 (22), St3 (23), St4 (24), Rb10 (25), Rb12 (26). See Table 1 for additional information on the individuals analyzed.
13
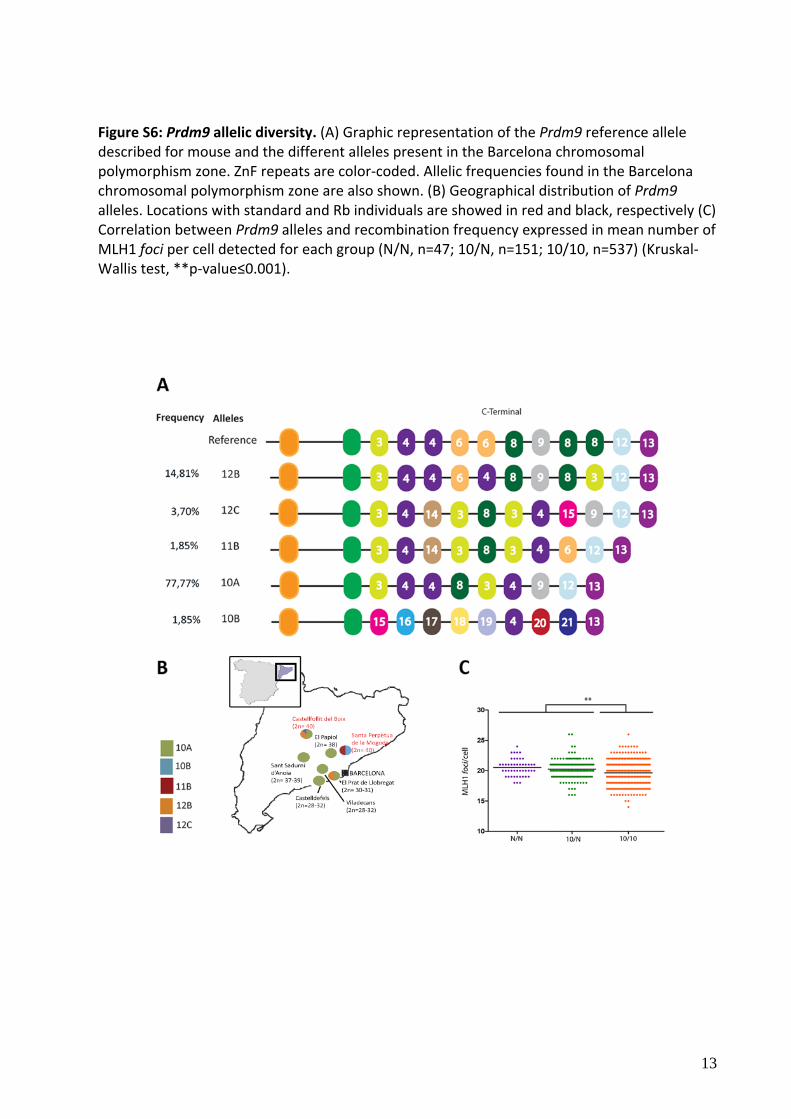
Figure S6: Prdm9 allelic diversity. (A) Graphic representation of the Prdm9 reference allele described for mouse and the different alleles present in the Barcelona chromosomal polymorphism zone. ZnF repeats are color‐coded. Allelic frequencies found in the Barcelona chromosomal polymorphism zone are also shown. (B) Geographical distribution of Prdm9 alleles. Locations with standard and Rb individuals are showed in red and black, respectively (C) Correlation between Prdm9 alleles and recombination frequency expressed in mean number of MLH1 foci per cell detected for each group (N/N, n=47; 10/N, n=151; 10/10, n=537) (Kruskal‐Wallis test, **p‐value≤0.001).
14
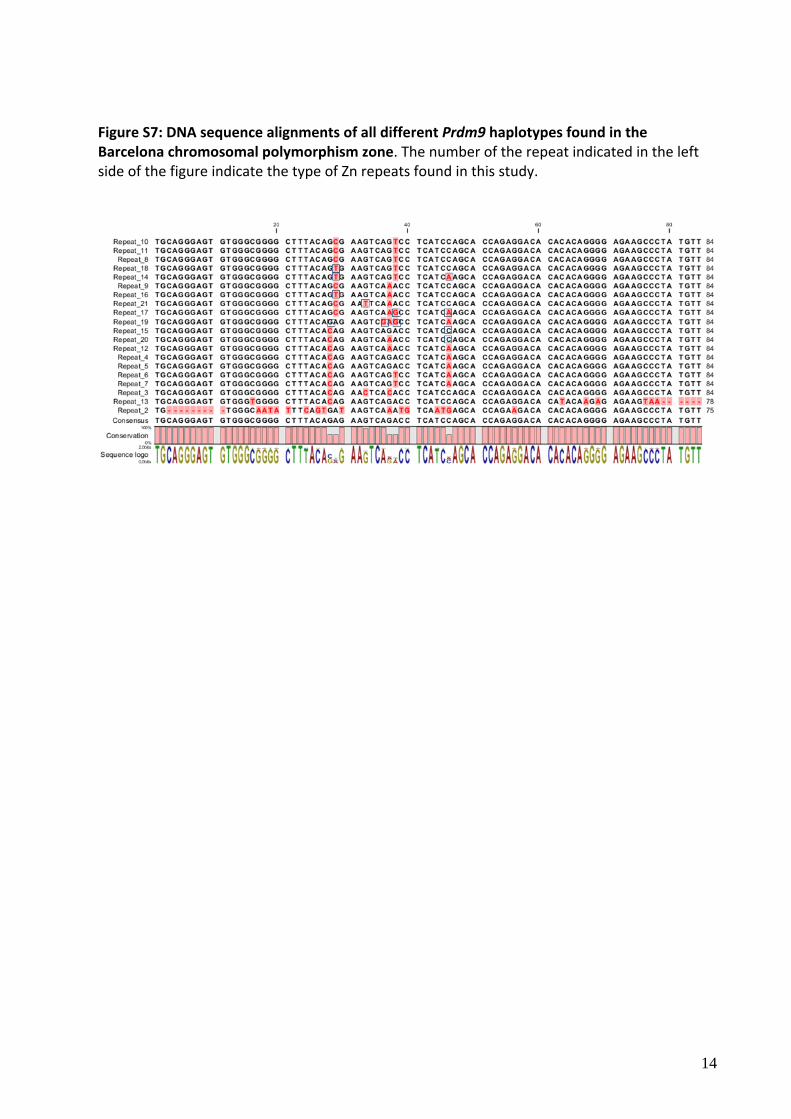
Figure S7: DNA sequence alignments of all different Prdm9 haplotypes found in the Barcelona chromosomal polymorphism zone. The number of the repeat indicated in the left side of the figure indicate the type of Zn repeats found in this study.
15
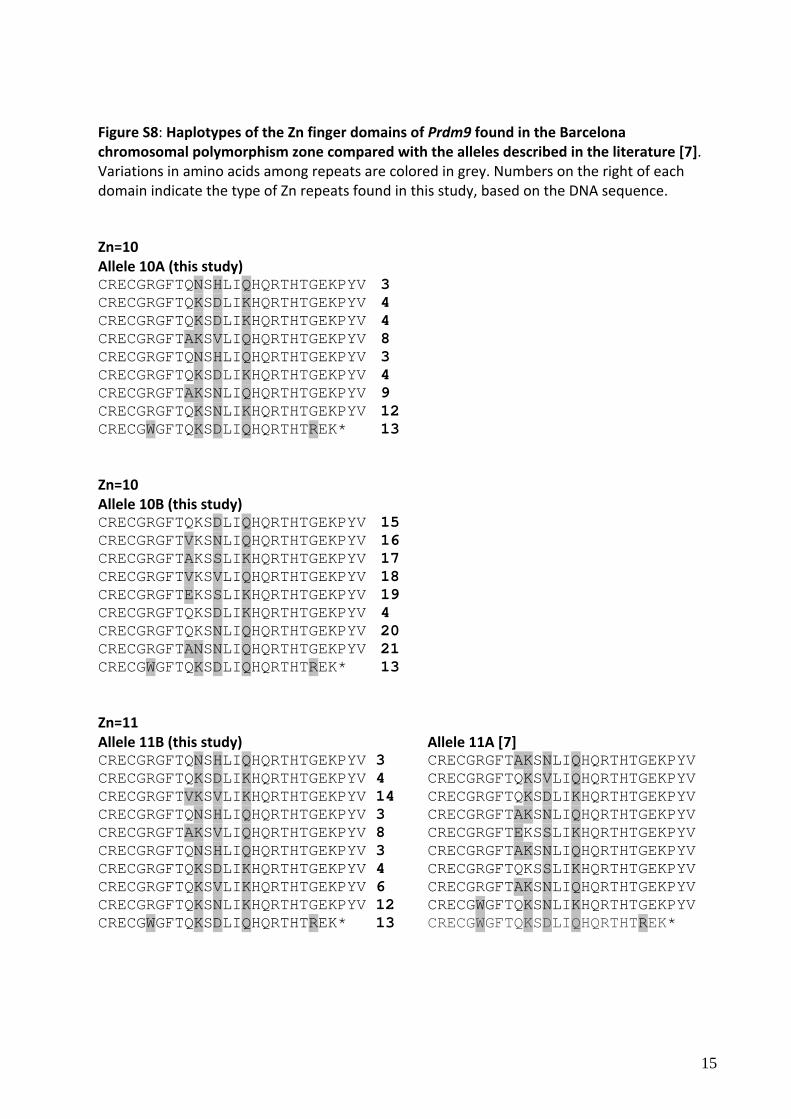
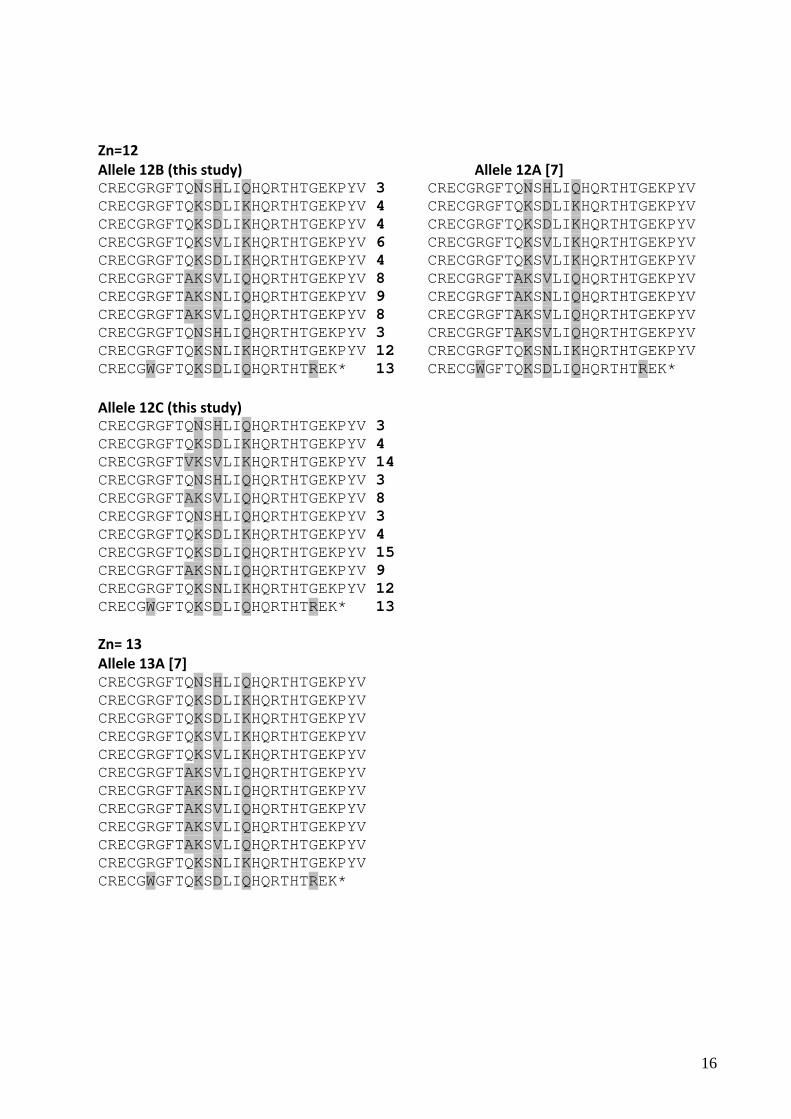
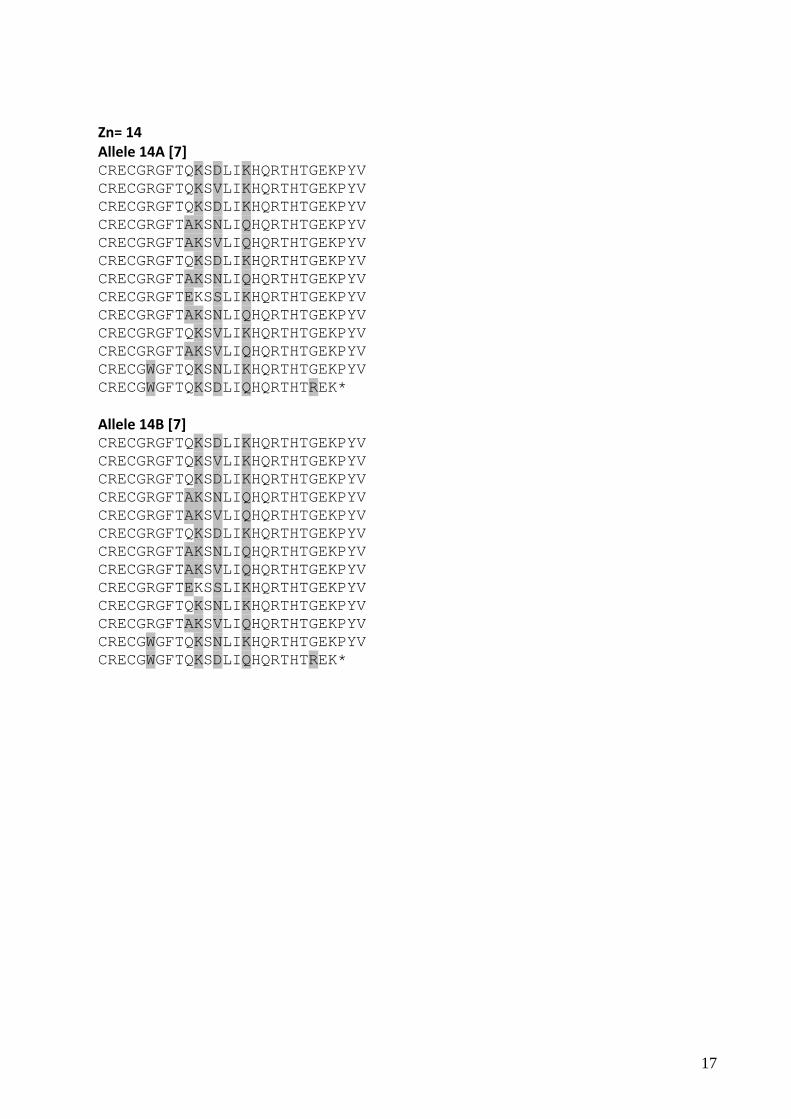
Figure S8: Haplotypes of the Zn finger domains of Prdm9 found in the Barcelona chromosomal polymorphism zone compared with the alleles described in the literature [7]. Variations in amino acids among repeats are colored in grey. Numbers on the right of each domain indicate the type of Zn repeats found in this study, based on the DNA sequence. Zn=10 Allele 10A (this study) CRECGRGFTQNSHLIQHQRTHTGEKPYV 3 CRECGRGFTQKSDLIKHQRTHTGEKPYV 4 CRECGRGFTQKSDLIKHQRTHTGEKPYV 4 CRECGRGFTAKSVLIQHQRTHTGEKPYV 8 CRECGRGFTQNSHLIQHQRTHTGEKPYV 3 CRECGRGFTQKSDLIKHQRTHTGEKPYV 4 CRECGRGFTAKSNLIQHQRTHTGEKPYV 9 CRECGRGFTQKSNLIKHQRTHTGEKPYV 12 CRECGWGFTQKSDLIQHQRTHTREK* 13 Zn=10 Allele 10B (this study) CRECGRGFTQKSDLIQHQRTHTGEKPYV 15 CRECGRGFTVKSNLIQHQRTHTGEKPYV 16 CRECGRGFTAKSSLIKHQRTHTGEKPYV 17 CRECGRGFTVKSVLIQHQRTHTGEKPYV 18 CRECGRGFTEKSSLIKHQRTHTGEKPYV 19 CRECGRGFTQKSDLIKHQRTHTGEKPYV 4 CRECGRGFTQKSNLIQHQRTHTGEKPYV 20 CRECGRGFTANSNLIQHQRTHTGEKPYV 21 CRECGWGFTQKSDLIQHQRTHTREK* 13 Zn=11 Allele 11B (this study) Allele 11A [7] CRECGRGFTQNSHLIQHQRTHTGEKPYV 3 CRECGRGFTAKSNLIQHQRTHTGEKPYV CRECGRGFTQKSDLIKHQRTHTGEKPYV 4 CRECGRGFTQKSVLIQHQRTHTGEKPYV CRECGRGFTVKSVLIKHQRTHTGEKPYV 14 CRECGRGFTQKSDLIKHQRTHTGEKPYV CRECGRGFTQNSHLIQHQRTHTGEKPYV 3 CRECGRGFTAKSNLIQHQRTHTGEKPYV CRECGRGFTAKSVLIQHQRTHTGEKPYV 8 CRECGRGFTEKSSLIKHQRTHTGEKPYV CRECGRGFTQNSHLIQHQRTHTGEKPYV 3 CRECGRGFTAKSNLIQHQRTHTGEKPYV CRECGRGFTQKSDLIKHQRTHTGEKPYV 4 CRECGRGFTQKSSLIKHQRTHTGEKPYV CRECGRGFTQKSVLIKHQRTHTGEKPYV 6 CRECGRGFTAKSNLIQHQRTHTGEKPYV CRECGRGFTQKSNLIKHQRTHTGEKPYV 12 CRECGWGFTQKSNLIKHQRTHTGEKPYV CRECGWGFTQKSDLIQHQRTHTREK* 13 CRECGWGFTQKSDLIQHQRTHTREK*
16
Zn=12 Allele 12B (this study) Allele 12A [7] CRECGRGFTQNSHLIQHQRTHTGEKPYV 3 CRECGRGFTQNSHLIQHQRTHTGEKPYV CRECGRGFTQKSDLIKHQRTHTGEKPYV 4 CRECGRGFTQKSDLIKHQRTHTGEKPYV CRECGRGFTQKSDLIKHQRTHTGEKPYV 4 CRECGRGFTQKSDLIKHQRTHTGEKPYV CRECGRGFTQKSVLIKHQRTHTGEKPYV 6 CRECGRGFTQKSVLIKHQRTHTGEKPYV CRECGRGFTQKSDLIKHQRTHTGEKPYV 4 CRECGRGFTQKSVLIKHQRTHTGEKPYV CRECGRGFTAKSVLIQHQRTHTGEKPYV 8 CRECGRGFTAKSVLIQHQRTHTGEKPYV CRECGRGFTAKSNLIQHQRTHTGEKPYV 9 CRECGRGFTAKSNLIQHQRTHTGEKPYV CRECGRGFTAKSVLIQHQRTHTGEKPYV 8 CRECGRGFTAKSVLIQHQRTHTGEKPYV CRECGRGFTQNSHLIQHQRTHTGEKPYV 3 CRECGRGFTAKSVLIQHQRTHTGEKPYV CRECGRGFTQKSNLIKHQRTHTGEKPYV 12 CRECGRGFTQKSNLIKHQRTHTGEKPYV CRECGWGFTQKSDLIQHQRTHTREK* 13 CRECGWGFTQKSDLIQHQRTHTREK* Allele 12C (this study) CRECGRGFTQNSHLIQHQRTHTGEKPYV 3 CRECGRGFTQKSDLIKHQRTHTGEKPYV 4 CRECGRGFTVKSVLIKHQRTHTGEKPYV 14 CRECGRGFTQNSHLIQHQRTHTGEKPYV 3 CRECGRGFTAKSVLIQHQRTHTGEKPYV 8 CRECGRGFTQNSHLIQHQRTHTGEKPYV 3 CRECGRGFTQKSDLIKHQRTHTGEKPYV 4 CRECGRGFTQKSDLIQHQRTHTGEKPYV 15 CRECGRGFTAKSNLIQHQRTHTGEKPYV 9 CRECGRGFTQKSNLIKHQRTHTGEKPYV 12 CRECGWGFTQKSDLIQHQRTHTREK* 13 Zn= 13 Allele 13A [7] CRECGRGFTQNSHLIQHQRTHTGEKPYV CRECGRGFTQKSDLIKHQRTHTGEKPYV CRECGRGFTQKSDLIKHQRTHTGEKPYV CRECGRGFTQKSVLIKHQRTHTGEKPYV CRECGRGFTQKSVLIKHQRTHTGEKPYV CRECGRGFTAKSVLIQHQRTHTGEKPYV CRECGRGFTAKSNLIQHQRTHTGEKPYV CRECGRGFTAKSVLIQHQRTHTGEKPYV CRECGRGFTAKSVLIQHQRTHTGEKPYV CRECGRGFTAKSVLIQHQRTHTGEKPYV CRECGRGFTQKSNLIKHQRTHTGEKPYV CRECGWGFTQKSDLIQHQRTHTREK*
17
Zn= 14 Allele 14A [7] CRECGRGFTQKSDLIKHQRTHTGEKPYV CRECGRGFTQKSVLIKHQRTHTGEKPYV CRECGRGFTQKSDLIKHQRTHTGEKPYV CRECGRGFTAKSNLIQHQRTHTGEKPYV CRECGRGFTAKSVLIQHQRTHTGEKPYV CRECGRGFTQKSDLIKHQRTHTGEKPYV CRECGRGFTAKSNLIQHQRTHTGEKPYV CRECGRGFTEKSSLIKHQRTHTGEKPYV CRECGRGFTAKSNLIQHQRTHTGEKPYV CRECGRGFTQKSVLIKHQRTHTGEKPYV CRECGRGFTAKSVLIQHQRTHTGEKPYV CRECGWGFTQKSNLIKHQRTHTGEKPYV CRECGWGFTQKSDLIQHQRTHTREK* Allele 14B [7] CRECGRGFTQKSDLIKHQRTHTGEKPYV CRECGRGFTQKSVLIKHQRTHTGEKPYV CRECGRGFTQKSDLIKHQRTHTGEKPYV CRECGRGFTAKSNLIQHQRTHTGEKPYV CRECGRGFTAKSVLIQHQRTHTGEKPYV CRECGRGFTQKSDLIKHQRTHTGEKPYV CRECGRGFTAKSNLIQHQRTHTGEKPYV CRECGRGFTAKSVLIQHQRTHTGEKPYV CRECGRGFTEKSSLIKHQRTHTGEKPYV CRECGRGFTQKSNLIKHQRTHTGEKPYV CRECGRGFTAKSVLIQHQRTHTGEKPYV CRECGWGFTQKSNLIKHQRTHTGEKPYV CRECGWGFTQKSDLIQHQRTHTREK*
18
References:
1. Seabright M 1971 A rapid banding technique for human chromosomes. Lancet 2, 971‐2.
2. Ruiz‐Herrera A, Garcia F, Frönicke L, Ponsà M, Egozcue J, Caldés MG, Stanyon R 2004 Conservation of aphidicolin‐induced fragile sites in Papionini (Primates) species and humans. Chromosome Res. 12, 683–90. (doi:10.1023/B:CHRO.0000045753.88789.ea)
3. Garcia‐Cruz R, Pacheco S, Brieño MA, Steinberg ER, Mudry MD, Ruiz‐Herrera A, Garcia‐Caldés M 2011 A comparative study of the recombination pattern in three species of Platyrrhini monkeys (Primates). Chromosoma 120, 521–30. (doi:10.1007/s00412‐011‐0329‐6)
4. Reeves A 2001 MicroMeasure: A new computer program for the collection and analysis of cytogenetic data. Genome 44, 439‐43. (doi:10.1139/gen‐44‐3‐439)
5. Mihola O, Trachtulec Z, Vlcek C, Schimenti JC, Forejt J 2009 A mouse speciation gene encodes a meiotic histone H3 methyltransferase. Science 323, 373‐5. (doi:10.1126/science.1163601)
6. Baudat F, Buard J, Grey C, Fledel‐Alon A, Ober C, Przeworski M, Coop G, de Massy B 2010 PRDM9 is a major determinant of meiotic recombination hotspots in humans and mice. Science 327, 836–40. (doi:10.1126/science.1183439)
7. Parvanov ED, Petkov PM, Paigen K 2010 Prdm9 controls activation of mammalian recombination hotspots. Science 327, 835. (doi:10.1126/science.1181495)