Micas
509
description
Micas
Transcript of Micas


REVIEWS in MINERALOGY
and GEOCHEMISTRY Volume 46 2002
MICAS: CRYSTAL CHEMISTRY AND METAMORPHIC PETROLOGY
Editors
Annibale Mottana Università degli Studi Roma Tre Francesco Paolo Sassi Università di Padova
James B. Thompson, Jr. Harvard University Stephen Guggenheim University of Illinois at Chicago
FRONT COVER: Perspective view of TOT layers in Biotite down [100] ([001] is vertical), produced by CrystalMaker, Red tetrahedra contain Si and A1, green and white octahedra contain Mg and Fe, respectively, and yellow spheres represents the K interlayer cations. Courtesy of Mickey Gunter, University of Idaho, Moscow. [Data: S.R. Bohlen et al. (1980) Crystal chemistry of a metamorphic biotite and its significance in water barometry. Am Mineral 65: 55-62]
BACK COVER: A view down [001] of lepitdolite-2M2, showing tetrahedrally coordinated Si,A1 (blue) joined with bridging oxygens (red thermal ellipsoids) in the T-Layer and ordered, octahedrally coordinated A1 (gray) and Li (yellow) in the O-layer. The interlayer cation I s12-coordinator K (green). Courtesy of Bob Downs, University of Arizona, Tucson. [Data: S. Guggenheim (1981) Cation ordering in lepidolite. Am Mineral 66: 1221-1232]
Series Editor for MSA: Paul H. Ribbe Virginia Polytechnic Institute and State University
MINERALOGICAL SOCIETY of AMERICA
Washington, D.C.
ACCADEMIA NATIONALE dei LINCEI
Roma, Italia

COPYRIGHT 2002
MINERALOGICAL SOCIETY OF AMERICA
The appearance of the code at the bottom of the first page of each chapter in this volume indicates the copyright owner’s consent that copies of the article can be made for personal use or internal use or for the personal use or internal use of specific clients, provided the original publication is cited. The consent is given on the condition, however, that the copier pay the stated per-copy fee through the Copyright Clearance Center, Inc. for copying beyond that permitted by Sections 107 or 108 of the U.S. Copyright Law. This consent does not extend to other types of copying for general distribution, for advertising or promotional purposes, for creating new collective works, or for resale. For permission to reprint entire articles in these cases and the like, consult the Administrator of the Mineralogical Society of America as to the royalty due to the Society.
REVIEWS IN MINERALOGY
AND GEOCHEMISTRY ( Formerly: REVIEWS IN MINERALOGY )
ISSN 1529-6466
Volume 46
MICAS: Crystal Chemistry and Metamorphic Petrology
ISBN 0-939950-58-8
** This volume is the eighth of a series of review volumes published jointly under the banner of the Mineralogical Society of America and the Geochemical Society. The newly titled Reviews in Mineralogy and Geochemistry has been numbered contiguously with the previous series, Reviews in Mineralogy.
Additional copies of this volume as well as others in this series may be obtained at moderate cost from:
THE MINERALOGICAL SOCIETY OF AMERICA
1015 EIGHTEENTH STREET, NW, SUITE 601 WASHINGTON, DC 20036 U.S.A.
iii
1529-6466/02/0046-0000$05.00 DOI: 10.2138/rmg.2002.46.0
MICAS: Crystal Chemistry and Metamorphic Petrology
Reviews in Mineralogy and Geochemistry Volume 46 2002
FORWARD The editors and contributing editors of this volume participated in a short course on
micas in Rome late in the year 2000. It was organized by Prof. Annibale Mottana and several colleagues (details in the Preface below) and underwritten by the Italian National Acadmey, Accademai Nationale dei Lincei (ANL). The Academy subsequently joined with the Mineralogical Society of America (MSA) in publishing this volume. MSA is grateful for their generous involvement.
I am particularly thankful to Prof. Mottana for Herculean efforts in supervising the editing of twelve manuscripts from six countries and submitting a single package containing everything needed to compile this volume! This was a uniquely positive experience fro me as Series editor for MSA. Assembling this volume was made tolerable by the exceptional efforts of Steve Guggenheim. During recovery from spinal surgery he spent three weeks painstakingly (no pun) correcting grammar and wording of the many authors from whom English is not their first language. Special thanks to him and the gracious and patient authors who suffered the extra work of assimilating both Steve’s suggestions and mine, above and beyond those of their reviewers and the editors. MSA’s Executive Director, Alex Speer, made all the contractual arrangements with ANL.
This is the second of what we hope will be many co-operative projects with international colleagues and members of MSA. The first was in the year 2000: “Transformation Processes in Minerals,” RiMG 39, the proceedings of a short course at Cambridge University in partnership with four European scientific societies.
Paul H. Ribbe, Series editor Blacksburg, Virginia
April 20, 2002
PREFACE Micas are among the most common minerals in the Earth crust: 4.5% by volume.
They are widespread in most if not all metamorphic rocks (abundance: 11%), and common also in sediment and sedimentary and igneous rocks. Characteristically, micas form in the uppermost greenschist facies and remain stable to the lower crust, including anatectic rocks (the only exception: granulite facies racks). Moreover, some micas are stable in sediments and diagenetic rocks and crystallize in many types of lavas. In contrast, they are also present in association with minerals originating from the very deepest parts of the mantle—they are the most common minerals accompanying diamond in kimberlites.
The number of research papers dedicated to micas is enormous, but knowledge of them is limited and not as extensive as that of other rock-forming minerals, for reasons mostly relating to their complex layer texture that makes obtaining crystals suitable for careful studies with the modern methods time-consuming, painstaking work.
Micas were reviewed extensively in 1984 (Reviews in Mineralogy 13, S.W. Bailey, editor). At that time, “Micas” volume covered most if not all aspects of mica knowledge, thus producing a long shelf-life for this book. Yet, or perhaps because of that
iv
excellent review, mica research was vigorously renewed, and a vast array of new data has been gathered over the past 15 years. These data now need to be organized and reviewed. Furthermore, a Committee nominated by the International Mineralogical Association in the late 1970s concluded its long-lasting work (Rieder et al. 1998) by suggesting a new classification scheme which has stimulated a new chemical and structural research on micas. To make a very long story short: - the extraordinarily large, but intrinsically vague, micas nomenclature developed
during the past two centuries has been reduced from >300 to just 37 species names and 6 series (see page xiii, preceding Chapter 1);
- the new nomenclature shows wide gaps that require data involving new chemical and structural work;
- the suggestion of using adjectival modifiers for those varieties that deviate away from end-member compositions requires the need fro new and accurate measurements, particularly fro certain light elements and volatiles;
- the use of polytype suffixes based on the modified Gard symbolism created better ways of determining precise stacking sequences. This resulted in new polytypes being discovered. Indeed, all this has happened over the past few years in an almost tumultuous way. It was on the basis of these developments that four scientists (B. Zanettin, A.
Mottana, F.P. Sassi and C. Cipriani) applied to Accademia Nazionale dei Lincei—the Italian National Academy—for a meeting on micas. An international meeting was convened in Rome on November 2-3, 2000 with the title Advances on Micas (Problems, Methods, Applications in Geodynamics). The topics of this meeting were the crystal-chemical, petrological, and historical aspects if the micas. The organizers were both Academy members (C. Cipriani, A. Mottana, F.P. Sassi, W. Schreyer, J.B. Thompson Jr., and B. Zanettin) and Italian scientist well-known for their studies on layer silicates (Professors M.F. Brigatti and G. Ferraris). Financial support in addition to that by the Academy was provided by C.N.R. (the Italian National Research Council), M.U.R.S.T. (the Italian Ministry for University, Scientific Research and Technology) and the University of Rome III. Approximately 200 scientists attended the meeting, most of them Italians, but, with a sizeable international participation. Thirteen invited plenary lectures and six oral presentations were given, and fourteen posters were displayed.
The amount of information presented was large, although the organizers made it very clear that the meeting was to be limited to only a few of the major topics of micas studies. Other studies are promised for a later meeting. Oral and poster presentations on novel aspects of mica research are being printed in the European Journal of Mineralogy, as apart of an individual thematic issue: indeed thirteen papers have appeared in the November 2001 issue. The plenary lectures, which consisted mostly of reviews, are presented in expanded detail in this volume.
This book is the first a co-operative project between Accademia Nazionale dei Lincei and Mineralogical Society of America. Hopefully, future projects will involve reviews of the remaining aspects of mica research, and other aspects of mineralogy and geochemistry.
The entire meeting was made successful through a co-operative effort. The editing of this book was achieved by a co-operative effort of two Italian Academy members from one side, and by two American scientists from the other side, one of them (JBT) being also a member of Lincei Academy. The entire editing process benefited from the goodwill of many referees, both from those attending Rome meeting and from several who did not. In all the reviewers were distinguished expert of the international

v
community of mica scholars. Their work, as well as our editing work, were aided greatly by RiMG Series Editor, Professor Paul Ribbe, who continuously supported the efforts with all his professional experience and friendly advice. We, the co-editors, thank them all very warmly, but take upon ourselves all remaining shortcomings: we are aware that some shortcomings may be present in spite of all our efforts to avoid them Moreover, we are aware that there are puzzling aspects of micas that are unresolved. Please consider all these possible avenues for future research!
Annibale Mottana (Rome) Francesco Paolo Sassi (Padua)
James B. Thompson, Jr. (Cambridge, Mass.) Stephen Guggenheim (Chicago)

Nomenclature of Micas
MICA SIMPLIFIED FORMULA: I M2-3 1-0 T4 O10 A2
where I = Cs, K, Na, NH4, Rb, Ba, Ca M = Li, Fe (2+, 3+), Mg, Mn, Zn, Al, Cr, V, Ti
= vacancy T = Be, Al, B, Fe(3+), Si A = Cl, F, OH, O, S
MICA SERIES NAMES: biotite glauconite illite lepidolite phengite zinnwaldite
TRUE MICAS BRITTLE MICAS INTERLAYER-DEFICIENT MICAS
Dioctahedral Trioctahedral Dioctahedral Trioctahedral Dioctahedral Trioctahedral
muscovite annite margarite clintonite illite wonesite aluminoceladonite phlogopite chernykhite bityite glauconite ferro-alumino-
celadonite siderophyllite anandite brammallite
celadonite eastonite kinoshitalite ferroceladonite hendricksite roscoelite montdorite chromphyllite tainiolite boromuscovite polylithionite paragonite trilithionite nanpingite masutomilite tobelite norrishite tetra-ferri-annite tetra-ferri-
phlogopite
aspidolite preiswerkite ephesite
iii
1529-6466/02/0046-0000$05.00 DOI: 10.2138/rmg.2002.46.0f
FORWARD The editors and contributing editors of this volume participated in a short course on micas in
Rome late in the year 2000. It was organized by Prof. Annibale Mottana and several colleagues (details in the Preface below) and underwritten by the Italian National Acadmey, Accademai Nationale dei Lincei (ANL). The Academy subsequently joined with the Mineralogical Society of America (MSA) in publishing this volume. MSA is grateful for their generous involvement.
I am particularly thankful to Prof. Mottana for Herculean efforts in supervising the editing of twelve manuscripts from six countries and submitting a single package containing everything needed to compile this volume! This was a uniquely positive experience fro me as Series editor for MSA. Assembling this volume was made tolerable by the exceptional efforts of Steve Guggenheim. During recovery from spinal surgery he spent three weeks painstakingly (no pun) correcting grammar and wording of the many authors from whom English is not their first language. Special thanks to him and the gracious and patient authors who suffered the extra work of assimilating both Steve’s suggestions and mine, above and beyond those of their reviewers and the editors. MSA’s Executive Director, Alex Speer, made all the contractual arrangements with ANL.
This is the second of what we hope will be many co-operative projects with international colleagues and members of MSA. The first was in the year 2000: “Transformation Processes in Minerals,” RiMG 39, the proceedings of a short course at Cambridge University in partnership with four European scientific societies.
Paul H. Ribbe, Series editor Blacksburg, Virginia
April 20, 2002
iii
1529-6466/02/0046-0000$05.00 DOI: 10.2138/rmg.2002.46.0p
PREFACE Micas are among the most common minerals in the Earth crust: 4.5% by volume.
They are widespread in most if not all metamorphic rocks (abundance: 11%), and common also in sediment and sedimentary and igneous rocks. Characteristically, micas form in the uppermost greenschist facies and remain stable to the lower crust, including anatectic rocks (the only exception: granulite facies racks). Moreover, some micas are stable in sediments and diagenetic rocks and crystallize in many types of lavas. In contrast, they are also present in association with minerals originating from the very deepest parts of the mantle—they are the most common minerals accompanying diamond in kimberlites.
The number of research papers dedicated to micas is enormous, but knowledge of them is limited and not as extensive as that of other rock-forming minerals, for reasons mostly relating to their complex layer texture that makes obtaining crystals suitable for careful studies with the modern methods time-consuming, painstaking work.
Micas were reviewed extensively in 1984 (Reviews in Mineralogy 13, S.W. Bailey, editor). At that time, “Micas” volume covered most if not all aspects of mica knowledge, thus producing a long shelf-life for this book. Yet, or perhaps because of that excellent review, mica research was vigorously renewed, and a vast array of new data has been gathered over the past 15 years. These data now need to be organized and reviewed. Furthermore, a Committee nominated by the International Mineralogical Association in the late 1970s concluded its long-lasting work (Rieder et al. 1998) by suggesting a new classification scheme which has stimulated a new chemical and structural research on micas. To make a very long story short: - the extraordinarily large, but intrinsically vague, micas nomenclature developed
during the past two centuries has been reduced from >300 to just 37 species names and 6 series (see page xiii, preceding Chapter 1);
- the new nomenclature shows wide gaps that require data involving new chemical and structural work;
- the suggestion of using adjectival modifiers for those varieties that deviate away from end-member compositions requires the need fro new and accurate measurements, particularly fro certain light elements and volatiles;
- the use of polytype suffixes based on the modified Gard symbolism created better ways of determining precise stacking sequences. This resulted in new polytypes being discovered. Indeed, all this has happened over the past few years in an almost tumultuous way. It was on the basis of these developments that four scientists (B. Zanettin, A.
Mottana, F.P. Sassi and C. Cipriani) applied to Accademia Nazionale dei Lincei—the Italian National Academy—for a meeting on micas. An international meeting was convened in Rome on November 2-3, 2000 with the title Advances on Micas (Problems, Methods, Applications in Geodynamics). The topics of this meeting were the crystal-chemical, petrological, and historical aspects if the micas. The organizers were both Academy members (C. Cipriani, A. Mottana, F.P. Sassi, W. Schreyer, J.B. Thompson Jr., and B. Zanettin) and Italian scientist well-known for their studies on layer silicates (Professors M.F. Brigatti and G. Ferraris). Financial support in addition to that by the

iv
Academy was provided by C.N.R. (the Italian National Research Council), M.U.R.S.T. (the Italian Ministry for University, Scientific Research and Technology) and the University of Rome III. Approximately 200 scientists attended the meeting, most of them Italians, but, with a sizeable international participation. Thirteen invited plenary lectures and six oral presentations were given, and fourteen posters were displayed.
The amount of information presented was large, although the organizers made it very clear that the meeting was to be limited to only a few of the major topics of micas studies. Other studies are promised for a later meeting. Oral and poster presentations on novel aspects of mica research are being printed in the European Journal of Mineralogy, as apart of an individual thematic issue: indeed thirteen papers have appeared in the November 2001 issue. The plenary lectures, which consisted mostly of reviews, are presented in expanded detail in this volume.
This book is the first a co-operative project between Accademia Nazionale dei Lincei and Mineralogical Society of America. Hopefully, future projects will involve reviews of the remaining aspects of mica research, and other aspects of mineralogy and geochemistry.
The entire meeting was made successful through a co-operative effort. The editing of this book was achieved by a co-operative effort of two Italian Academy members from one side, and by two American scientists from the other side, one of them (JBT) being also a member of Lincei Academy. The entire editing process benefited from the goodwill of many referees, both from those attending Rome meeting and from several who did not. In all the reviewers were distinguished expert of the international community of mica scholars. Their work, as well as our editing work, were aided greatly by RiMG Series Editor, Professor Paul Ribbe, who continuously supported the efforts with all his professional experience and friendly advice. We, the co-editors, thank them all very warmly, but take upon ourselves all remaining shortcomings: we are aware that some shortcomings may be present in spite of all our efforts to avoid them Moreover, we are aware that there are puzzling aspects of micas that are unresolved. Please consider all these possible avenues for future research!
Annibale Mottana (Rome) Francesco Paolo Sassi (Padua)
James B. Thompson, Jr. (Cambridge, Mass.) Stephen Guggenheim (Chicago)

MICAS: CRYSTAL CHEMISTRYand METAMORPHIC PETROLOGY
Editors: A Mottana, F P Sassi, J B Thompson, Jr & S Guggenheim
Table of Contents
1 Mica Crystal Chemistry and the Influence of Pressure,Temperature, and Solid Solution on Atonlistic Models
Maria Franca Brigatti, Stephen Guggenheim
OVERVIEW 1Treatment of the data and definition of the parameters used 3End-member crystal chemistry: New end members and new data since 1984 .4Synthetic micas with unusual properties 11
EFFECT OF COMPOSITION ON STRUCTURE ., 1ITetrahedral sheet 11Tetrahedral rotation and interlayer region 19Tetrahedral cation ordering 25Octahedral coordination and long-range octahedral ordering 27Crystal chemistry of micas in plutonic rocks 37
ATOMISTIC MODELS INVOLVING HIGH-TEMPERATURE STUDIES OF THE MICAS 39Studies of samples having undergone heat treatment 39Dehydroxylation process for dioctahedral phyllosilicates .41Dehydroxylation models for trans-vacant 2: 1 layers 43Dehydroxy lation models for cis-vacant 2: 1 layers 44Compalison of Na-rich vs. K-rich dioctahedral forms .49Heat-treated trioctahedral samples: The O,OH,F site and in situ high-temperature studies 50Heat-treated trioctahedral samples: Polytype comparisons 51
ACKNOWLEDGMENTS 51APPE~DIX I: DERIVATIONS 52
Derivation of "tetrahedral cation displacement", Tdi sp 52Derivation of f1E 1, f1E2, f1E3 52Derivation of ex 53Explanation of O[eor 54Explanation of EM - o(4) 54
APPENDIX II: TABLES 1-4 55Table 1a. Structural details of trioctahedral true micas-l M, space group C2/m 55Table 1b. Structural details of trioctahedral true micas-1M, space group C2 70Table Ie. Structural details of trioctahedral true micas-2M], space group C2/c 72Table Id. Structural details oftrioctahedral true micas-2M J , space groups Ce. Cl 74Table Ie. Structural details of trioctahedral true micas-2M2, space group C2!c 74Table I f. Structural details of trioctahedral true micas-3T, space group P3,12 74Table 2a. Structural details of trioctahedral true micas-I M, Mspace groups C2/m and C2 76Table 2b. Structural details of trioctahedral true micas-1M, space group C2/c 78Table 2c. Structural details of trioctahedral true micas-2M, space group C2/e 84Table 2d. Structural details of trioctahedral true micas-3T, space group P3 J 12 84Table 3a. Structural details of trioctahedral brittle micas 86Table 3b. Structural details of dioctahedral brittle micas 88Table 4. Structural details of boromuscovite-I M and -2M) calculated from the
Rietveld structure refinement by Liang et al. (1995) 88REFERENCES 90
Vll

2 Behavior of Micas at High Pressureand High Temperature
Pier Francesco Zanazzi, Alessandro Pavese
INTRODUCTION 99Investigati ve techniques for the study of the thennoelastic behavior of micas 100p- V and P- V- T equations of state 10 1Dioctahedral micas 103Trioctahedral micas 108
ACKNOWLEDGMENTS ] 14REFERENCES 114
3 Structural Features of MicasGiovanni Ferraris, Gabriella Ivaldi
INTRODUCTION 117NOMENCLATURE AND NOTATION 1] 7MODULARITY OF MICA STRUCTURE 118
The mica module 118CLOSEST-PACKING aspects ]20
Closest-packing and polytypism 121COMPOSITIONAL ASPECTS 122SYMMETRY ASPECTS 124
Metric (lattice) symmetry ]24Structural symmetry 124Symmetry and cation sites 125Two kinds of mica layer: Ml and M2Iayers 127The interlayer configuration 128Possible ordering schemes in the MDO polytypes 129The phengite case 130
DISTORTIONS 130The misfit 130Geometric parameters describing distortions 131Ditngonal rotation 131Other distortions 132Effects of the distortions on the stacking mode 133
FURTHER STRUCTURAL MODIFICATION 135Pressure, temperature and chemical influence 135Thickness of the mica module 135Ditrigonal rotation and interlayer coordination 137Effective coordination number (ECoN) 138
CONCLUSIONS 138APPENDIX I: MICA STRUCTURE AND POLYSOMATIC SERIES 140
Layer silicates as members of modular series? 140Mica modules in polysomatic series 140The heterophyllosicate polysomatic series 140The palysepiole polysomatic series 142Conclusions 143
APPENDIX II : OBLIQUE TEXTURE ELECTRON DIFFRACTION (OTED) 144ACKNOWLEDGMENTS 148REFERENCES 148
Vlll

4 Crystallographic Basis of Polytypism and Twinning in Micas
Massimo Nespolo, SlavomiJ Durovic
IN1RODUCTION 155NOTATION AND DEFINITIONS 156
The mica layer and its constituents 157Axial settings, indices and lattice parameters 158Symbols 158Symmetry and symmetry operations 159
THE UNIT LAYERS OF MICA 159Alternative unit layers 160
MICA POLYTYPES AND THEIR CHARACTERIZATION 164Micas as 0D structures 164
SYMBOLIC DESCRIPTION OF MICA POLYTYPES 172Orientational symbols 172Rotational symbols 175
RETICULAR CLASSIFICATION OF POLYTYPES: 178SPACE ORIENTATION AND SYMBOL DEFINITION 178LOCAL AND GLOBAL SYMME1RY OF MICA POLYTYPES
FROM THEIR STACKING SyMBOLS 180Derivation of MDO polytypes 180The symmetry analysis from a polytype symbol 184
RELATIONS OF HOMOMORPHY AND CLASSIFICATION OF MDO POLYTYPES 189BASIC S1RUCTURES AND POLYTYPOIDS. SIZE LIMIT FOR THE
DEFINITION OF "POLYTYPE" 191Abstract polytypes 192Basic structures _ 193H1REM observations and some implications 193
IDEAL SPACE-GROUP TYPES OF MICA POLYTYPES ANDDESYMME1RIZATION OF LAYERS IN POLYTYPES 193
CHOICE OF THE AXIAL SETTING 204GEOME1RICAL CLASSIFICATION OF RECIPROCAL LATTICE ROWS 206SUPERPOSITION S1RUCTURES,
FAMILY S1RUCTURE AND FAMILY REFLECTIONS 209Family structure and family reflections of mica polytypes 212
REFLECTION CONDITIONS 213NON-FAMILY REFLECTIONS AND ORTHOGONAL PLANES 214HIDDEN SYMME1RY OF THE MICAS: THE RHOMBOHEDRAL LATTICE 216TWINNING OF MICAS: THEORY 217
Choice of the twin elements 219Effect of twinning by selective merohedry on the diffraction pattern 220Diffraction patterns from twins 223Allotwinning 224Tessellation of the hp lattice 224Plesiotwinning 230
TWINNING OF MICAS. ANALYSIS OF THE GEOME1RY OFTHE DIFFRACTION PATTERN 233
Symbolic description of orientation of twinned mica individuals. Limiting symmetry 235Derivation of twin diffraction patterns 237Derivation of allotwin diffraction patterns 243
IDENTIFICATION OF MDO POLYTYPES FROM THEIR DIFFRACTION PATTERNS 244Theoretical background 244Identification procedure 245
IDENTIFICATION OF NON-MOO POLYTYPES:THE PERIODIC INTENSITY DISTRIBUTION FUNCTION 247
PID in tenns of TS unit layers 249Derivation of PID from the diffraction pattern 251
ix

5
EXPERIMENTAL INVESTIGATION OF MICA SINGLE CRYSTALS FORTWIN I POLYTYPE IDENTIFICATION 252
Morphological study 252Surface microtopography 252Two-dimensional XRD study 254Diffractometer study 256
APPLICATIONS AND EXAMPLES 25724-layer subfamily: A Series I Class b biotite from Ambulawa, Ceylon 2578A 2 (subfamily ~ Series O.Class a3) oxybiotit~ from Ruiz Peak, .New Mexico 2581M-2M] oxyblOtlte allotwm ZT= 4 from RUiZ Peak, New Mexlco 262{3,6}[7 {3,6}] biotite plesiotwin from Sambagawa, Japan 262
APPENDIX A. TWINNING: DEFINITION AND CLASSIFICATION 267APPENDIX B. COMPUTATION OF THE PID FROM A
STACKING SEQUENCE CANDIDATE 270Symlnetry of the PID 271
ACKNOWLEDGMENTS 272REFERENCES 272
Investigations of MicasUsing Advanced Transmission Electron Microscopy
Toshihiro Kogure
INTRODUCTION ,.281TEMS AND RELATED TECHNIQUES FOR THE INVESTIGATION OF MICA 281
Transmission electron microscopy 281New recording media for beam-sensitive specimens 286Sample preparation techniques ,.287Image processing and simulation ,288
ANALYSES OF POLYTYPES , , 289DEFECT STRUCTURES 299CONCLUSION 310ACKNOWLEDGMENTS 31 0REFERENCES 310
6 Optical and Mossbauer Spectroscopy of Iron in MicasM. Darby Dyar
INTRODUCTION 313OPTICAL SPECTROSCOPY 315
Current instrumentation 315Review of existing work 316Sunlmary 320
MOSSBAUER SPECTROSCOPY (MS) 320Current instrumentation 320Recoil-free fraction effects 320Thickness effects 321Texture effects and other sources of error 322Techniques for fitting Mossbauer spectra 323Review of existing Mossbauer data 325Sumlnary 333
COMPARISON OF TECHNIQUES 334CONCLUSIONS 336ACKNOWLEDGMENTS 337APPENDIX: Other techniques for measurement of Fe3+/LFe in Micas 337
X-ray ray photoelectron spectroscopy (XPS) 337Electron energy-loss spectroscopy (EELS) 338X-Ray absorption spectroscopy (XAS) 338
REFERENCES , 340
x
7 Infrared Spectroscopy of MicasAnton Beran
INTRODUCTION 351LATTICE VIBRATIONS 352
Far-IR region 352Mid-IR region 353
OH STRETCHING VIERATIONS 359Polarized measurements 359Quantitative water determination 360Hydrogen bonding 360Cation ordering 362OH-F replacement 365Dehydroxylation mechanisms 366Excess hydroxyl 367NH4 groups 367
ACKNOWLEDGMENTS 367REFERENCES 367
8 X-Ray Absorption Spectroscopy of the MicasAnnibale Mottana, Augusto Marcelli,
Giannantonio Cibin, and M. Darby Dyar
INTRODUCTION 371OVERVIEW OF THE XAS METHOD 373
EXAFS 375XANES 376Experimental spectra recording 384Optimizati on of spectra 387Systematics 395
ACKNOWLEDGMENTS .404REFERENCES .405
9 Constraints on Studies of Metamorphic K-Na White MicasCharles V. Guidotti, Francesco P. Sassi
INTRODUCTION 41 3EFFECTS OF PETROLOGIC FACTORS ON WHITE MICA CHEMISTRy .41 4
Important compOSitional vari ations 41 4Controls of mica composition by petrologic factors .41 8
MAXIMIZING INFORMATION FROM MICA STUDIES:SAMPLE SELECTION CONSTRAINTS .423
Petrologic studies 4 24Mineralogic studies .42 8
DISCUSSION 440Common failings in petrology studies .440Common failings in mineralogy studies 44I"Standard starting points" for the compositional variations of
rock-forming dioctahedral and trioctahedral micas 44 1ACKNOWLEDGMENTS 443REFERENCES 444
Xl

10 Modal Spaces for Pelitic Schists
James B. Thompson, Jr.
12
INTRODUCTION 449NOTATIONS AND CONVENTIONS .450THE ASSEMBLAGE QUARTZ-MUSCOVITE-BIOTITE-CHLORITE-GARNET. .451THE ASSEMBLAGE QUARTZ-MUSCOVITE-CHLORITE-
GARNET-CHLORITOID 454ASSEMBLAGES CONTAINING CHLORITOID AND BIOTITE .455OTHER MODAL SPACES .458ACKNOWLEDGMENTS .458APPENDIX: INDEPENDENT NET-TRANSFER REACTIONS .460REFERENCES 462
11 Phyllosilicates in Very Low-Grade Metamorphism:Transformation to Micas
Peter Arkai
I.NTRODUCTION 463MAIN METHODS OF STUDYING LOW-TEMPERATURE TRANSFORMATIONS OF
PHYLLOSILICATES 464XRD techniques 465TEM techniques .466
~AIN TRENDS OF PHYLLOSILICATE EVOLUTION AT LOW TEMPERATURE .467CURRENT PROBLEMS IN STUDYING PHYLLOSILICATE EVOLUTION AT
THE LOWER CRYSTALLITE-SIZE LIMITS OF MINERALS .469REACTION PROGRESS OF PHYLLOSILICATES THROUGH SERIES OF
METASTABLE STAGES 472CONCLUDING REMARKS .473ACKNOWLEDGMENTS .474REFERENCES .474
Micas: Historical PerspectiveCurzio Cipriani
INTRODUCTION 479PRESCIENTIFIC ERA 479THE EIGHTEENTH CENTURy .480THE NINETEENTH CENTURy .483
Physical properties 4 83Crystallography 485Chemical composition .486
THE TWENTIETH CENTURY 491Crystal chemistry 491Synthesis 494
POLYTYPES 494SYSTEMATICS 49 5CONCLUSIONS .496REFERENCES 497APPENDIX I
Present-day nomenclature of the mica group and its derivation .498APPENDIX II
Other works consulted in preparation of this historical review .499
XlI
1529-6466/02/0046-0001$10.00 DOI: 10.2138/rmg.2002.46.01
1 Mica Crystal Chemistry and the Influence of Pressure, Temperature, and Solid Solution on Atomistic Models
Maria Franca Brigatti Dipartimento di Scienze della Terra
Università di Modena e Reggio Emilia, Via S. Eufemia, 19
I-41100 Modena, Italy [email protected]
Stephen Guggenheim Department of Earth and Environmental Sciences
University of Illinois at Chicago 845 West Taylor Street, M/C 186
Chicago, Illinois 60607 [email protected]
OVERVIEW The 2:1 mica layer is composed of two opposing tetrahedral (T) sheets with an
octahedral (M) sheet between to form a “TMT” layer (Fig. 1a). The mica structure has a general formula of A M2-3 T4 O10 X2 [in natural micas: A = interlayer cations, usually K, Na, Ca, Ba, and rarely Rb, Cs, NH4, H3O, and Sr; M = octahedral cations, generally Mg, Fe2+, Al, and Fe3+, but other cations such as Li, Ti, V, Cr, Mn, Co, Ni, Cu, and Zn can occur also in mica species; T = tetrahedral cations, generally Si, Al and Fe3+ and rarely B and Be; X = (OH), F, Cl, O, S]. Vacant positions (symbol: ) are also common in the mica structure (Rieder et al. 1998). In the tetrahedral sheet, individual TO4 tetrahedra are linked with neighboring TO4 by sharing three corners each (i.e., the basal oxygen atoms) to form an infinite two-dimensional “hex agonal” mesh pattern (Fig. 1b). The fourth oxygen atom (i.e., the apical oxygen atom) forms a corner of the octahedral coordination unit around the M cations. Thus, each octahedral anion atom-coordination unit is comprised of four apical oxygen atoms (two from the upper and two from the lower tetrahedral sheet) and by two (OH) or F, Cl, O and S anions [the X anions, usually indicated as the OH or O(4) site]. The OH site is at the same level as the apical oxygen but not shared with tetrahedra. In the octahedral sheet, individual octahedra are linked laterally by sharing octahedral edges (Fig. 1c). The smallest structural unit contains three octahedral sites. Structures with all three sites occupied are known as trioctahedral, whereas, if only two octahedra are occupied [usually M(2)] and one is vacant [usually M(1)], the structure is defined as dioctahedral. The 2:1 layers, which are negatively charged, are compensated and bonded together by positively charged interlayer cations of the A site. The layer charge ideally is -1.0 for true micas and -2.0 for brittle micas. Thus, in true micas, the layer charge is compensated by monovalent A cations, whereas in brittle micas it is compensated primarily by divalent A cations.
In this section, we consider and discuss the structural and chemical features of more than 200 micas. Most are true micas (146 trioctahedral and 55 dioctahedral). Brittle-mica crystal-structure refinements number about twenty, of which only three are dioctahedral (Tables 1-4, at the end of the chapter). Of the six simple polytypes first derived by Smith and Yoder (1956) and reported by Bailey (1984a, p. 7), only five (i.e., 1M, 2M1, 3T, 2M2, and 2O) have been found and studied by three-dimensional crystal-structure refinements.

2 Brigatti & Guggenheim
Figure 1. (a) The 2:1 layer; (b) the “hexagonal” tetrahedral ring; (c) the octahedral sheet. For site nomenclature see text. a and b are unit cell parameters.
Most of the trioctahedral true-mica structures are 1M polytypes and a few are 2M1, 2M2, and 3T polytypes. In dioctahedral micas, the 2M1 sequence dominates, although 3T and 1M structures have been found. Brittle mica crystal-structure refinements indicate that the 1M polytype is generally trioctahedral whereas the 2M1 polytype is dioctahedral. The 2O structure has been found for the trioctahedral brittle mica, anandite (Giuseppetti and Tadini 1972; Filut et al. 1985) and recently was reported for a phlogopite from Kola Peninsula (Ferraris et al. 2000). The greatest number of the reported structures were refined from single-crystal X-ray diffraction data, with only a few obtained from electron and neutron diffraction experiments.
Subsequent sections of this paper present short reviews pertaining to the description of phyllosilicates, an emphasis of the literature since the publication of MICAS, Reviews in Mineralogy, Volume 13, edited by S.W. Bailey (1984a), and a new analysis of the crystal chemistry of the micas. New formulae are presented to clarify how crystal chemistry affects the mica structure. Derivations of these formulae are provided in Appendix I. Also, please refer to other chapters in this volume that cover related topics. For example, see Zanazzi and Pavese for the behavior of micas at high pressure and high temperature.

Mica Crystal Chemistry and Influence of P-T-X on Atomistic Models 3
Treatment of the data and definition of the parameters used To achieve standardization, all data in Tables 1-4 (Appendix II) were re-calculated
from unit-cell parameters and atomic coordinates reported by the authors of the original articles. Information concerning rock type and sample composition was obtained from the original works as well. Suspect refinements are discussed separately or not reported. Of more than 200 reported crystal-structure refinements, about twenty refinements show an agreement factor, R, greater that 9.0%. These structures are considered of poor quality and are not considered further.
Several authors used symbols and orientations that differ from convention to describe geometric arrangements of the layer and the stacking sequence of mica polytypes (e.g., Radoslovich 1961; Durovíc 1994; Dornberger-Schiff et al. 1982). To make inter-structure comparisons of features easier, however, it is advantageous to define briefly the site nomenclature adopted and the parameters used to describe and characterize layer geometry. The direction defined by the stacking of 2:1 units defines the [001] direction (i.e., the c axis), whereas the periodicity of the infinite two-dimensional sheets defines [100] and [010] directions (i.e., a and b translations). The actual value of the repeat distance in the [001] direction, as well as lateral a and b parameters, depends on several factors, such as the layer stereochemistry and polytypism (i.e., c ∼ 10 Å × n, where n identifies the number of layers involved in the stacking sequence). The site-nomenclature scheme adopted here starts from the nomenclature generally used for the 2:1 layer of the 1M polytype in C2/m symmetry: T denotes the four-coordinated site, M(1) and M(2) indicate six-coordinated sites with (OH) groups in trans- and cis-orientation, respectively, A refers to the interlayer cation, O(1) and O(2) represent the basal tetrahedral oxygen atoms, O(3) is the apical oxygen atom, and O(4) refers to the (OH), F, Cl, S or O anions (Fig. 1a). The number of sites per unit cell is: T = 8; M(1) = 2; M(2) = 4; A = 2; O(1) = 8; O(2) = 4; O(3) = 8; O(4) = 4. The site nomenclature for other structural variants can be derived from this nomenclature by changes that relate to space-group differences and to the number of 2:1 layers per unit cell.
The definition of parameters reported in Tables 1-4 (Appendix II) follows. For a more extensive review on definition and structural significance of these parameters, see Bailey (1984b) and references therein.
Cation-anion bond lengths: (i) tetrahedral ⟨T–O⟩; (ii) octahedral ⟨M–O,OH,F,Cl,S⟩ for both M(1) and M(2) sites; and (iii) interlayer ⟨A–O⟩. Mean bond lengths were compared to those of the original papers and vacant-site distances determined (i.e., vacancy-to-anion distances).
The tetrahedral Oapical–T–Obasal angles were used to obtain the tetrahedral flattening angle, τ = i=1
3∑ Oapical–T–Obasal)i/3.
The internal angles of the tetrahedral ring were used to determine the tetrahedral rotation angle, α = α ii=1
6∑ / 6 where αi = |120° – φi|/2 and φi is the angle between basal edges of neighboring tetrahedra articulated in the ring. Basal oxygen-plane corrugation, Δz, was determined by Δz = (zObasal(max) – zObasal(min)) × c sinβ.
The thickness of the tetrahedral and octahedral sheets was calculated from oxygen z coordinates of each polyhedron, including the OH group (or other X anions). The interlayer separation was obtained by considering the tetrahedral basal oxygen z coordinates of adjacent 2:1 layers.
The octahedral flattening angle ψ was calculated from

4 Brigatti & Guggenheim
ψ = cos−1 octahedral thickness2 × M − O,OH,F,Cl,S
⎛
⎝ ⎜
⎞
⎠ ⎟
Tetrahedral cation atomic coordinates, taken from the original reference, were transformed from fractional to Cartesian to calculate the Layer Offset, the Intralayer Shift, and the Overall Shift. The Layer Offset is based on the displacement of the tetrahedral sheet across the interlayer from one 2:1 layer to the next, which should be equal to zero in the ideal mica structure. The Intralayer Shift is the over-shift of the upper tetrahedral sheet relative to the lower tetrahedral sheet of the same 2:1 layer. The Overall Shift relates to both effects.
In true micas, the tetrahedral mean bond distance varies from 1.57(1) Å in boromuscovite-2M1 (Liang et al. 1995; Table 4) to 1.750(2) Å in an ordered (Al vs. Si) ephesite-2M1 (Slade et al. 1987; Table 1d); in brittle micas, the ⟨T–O⟩ mean bond distance varies from 1.620(2) to 1.799(2) Å, both values are from anandite-2O (Filut et al. 1985; Table 3a).
Octahedral mean bond length ranges from about 1.882(1) Å in an ordered ferroan polylithionite-1M (Guggenheim and Bailey 1977; Brigatti et al. 2000b; Table 1b) to 2.236(1) Å in anandite 2O (Filut et al. 1985; Table 3a). The radius of the vacant M(1) site in dioctahedral micas (⟨M(1)–O⟩) varies from 2.190 to 2.259 Å. The shortest ⟨A–O⟩inner distance occurs in clintonite (⟨A–O⟩inner = 2.397(2) Å; Alietti et al. 1997, Table 3a), whereas the longest distance occurs in nanpingite and synthetic Cs-tetra-ferri-annite (⟨A–O⟩ inner of ∼ 3.370 Å; Ni and Hughes 1996 and Mellini et al. 1996, Tables 1c and 1a, respectively). These data show the great variability in bond distances which may be ascribed not only to the local composition but also to the constraints of closest packing within the layer and the confinement of the octahedra between two opposing tetrahedral sheets. We consider the compositional and topological relationships in the following analysis. End-member crystal chemistry: New end members and new data since 1984
Boromuscovite. Boromuscovite was first reported by Foord et al. (1991). The mineral, precipitated from a late-stage hydrothermal fluid (T: 350-400°C; P: 1-2 kbar), occurred in the New Spaulding Pocket, Little Three Mine pegmatite dike (Ramona district, San Diego County, California), as a fine-grained coating of quartz, polylithionite, microcline and topaz. The mineral was found also in elbaite pegmatite at Recice near Mové Mesto na Morave, western Moravia, Czech Republic (Liang et al. 1995; Novák et al. 1999). Relatively high B contents were also reported for muscovite and polylithionite from polylithionite-rich pegmatites of Rozná and Dobrá Voda, Czech Republic (Cerny et al. 1995), for polylithionite-2M1 from Recice (Novák et al. 1999), and for muscovite from metapegmatite at Stoffhütte, Koralpe, Austria (Ertl and Brandstätter 1998).
Boromuscovite (Foord et al. 1991) has the general structural formula of KAl2 (Si3B) O10(OH)2, in which [4]Al is replaced by [4]B relative to muscovite. The composition of Little Three Mine boromuscovite is (K0.89Rb0.02Ca0.01)(Al1.93Li0.01Mg0.01)(Si3.06B0.77Al0.17) O9.82F0.16(OH)2.02, whereas the composition of Recice boromuscovite shows a slightly lower [4]B content: (K0.89Na0.01)(Al1.99Li0.01)(Si3.10B0.68Al0.22)O10F0.02(OH)1.98. The unit cell parameters, very similar in natural and synthetic crystals (Schreyer and Jung 1997), are significantly smaller than those reported for muscovite (a = 5.075(1), b = 8.794(4), c = 19.82(3) Å, β = 95.59(3)° and a = 5.077(1), b = 8.775(3), c = 10.061(2) Å, β = 101.31(2)° for Little Three Mine boromuscovite-2M1 and boromuscovite-1M, respectively).
A boromuscovite structure determination is complicated by the fine-grained nature

Mica Crystal Chemistry and Influence of P-T-X on Atomistic Models 5
of the mineral and by the presence of the mixture of 1M and 2M1 polytypes. Nonetheless the crystal-structure determination of a mixture of 83 wt % boromuscovite-2M1 and 17 wt % boromuscovite-1M from Recice was attempted using a coupled Rietveld-static-structure energy-minimization method (Liang et al. 1995). Although the high standard deviation for calculated parameters suggests caution in the analysis of crystal chemical details, Liang et al. (1995) indicated that: (i) boron is uniformly distributed between the two polytypes, (ii) ⟨T–O⟩ distances correspond well with the B-content at the corresponding T-sites, namely ⟨T–O⟩ distances linearly decrease as B occupancy increases, and (iii) in the 2M1 polytype, slight differences between ⟨T(1)–O⟩ and ⟨T(2)–O⟩ distances may imply a B preference for the T(1) site (Table 4). The 11B MAS NMR spectra showed a single, symmetric and narrow line (about 150 Hz wide) at 20.7 ppm. The width was interpreted as possibly relating to the coordination for B with a near-symmetrical disposition of anions (Novák et al. 1999).
Clintonite. Clintonite is the trioctahedral brittle mica with ideal composition of Ca(Mg2Al)(SiAl3)O10(OH)2. This structure violates the Al-avoidance principle of Loew- enstein (1954). It crystallizes in H2O-saturated Ca-, Al-rich, Si-poor systems under wide P-T conditions. Clintonite, usually found in metasomatic aureoles of carbonate rocks, is rare in nature because crystallization is limited to environments characterized by both alumina-rich and silica-poor bulk-rock chemistry and very low CO2 and K activities (Bucher-Nurminen 1976; Olesch and Seifert 1976; Kato et al. 1997; Grew et al. 1999). The 1M polytype and 1Md sequences are the most common forms. The 2M1 form is rare (Akhundov et al. 1961) and no 3T forms have been reported. Many 1M crystals are twinned by ±120° rotation about the normal to the {001} cleavage. Such twinning causes extra spots on precession photographs that simulate an apparent three-layer periodicity (MacKinney et al. 1988).
Subsequent to an extensive review of brittle micas (Guggenheim 1984), additional crystal-chemical details of clintonite-1M (space group C2/m) were reported by MacKinney et al. (1988) and Alietti et al. (1997). These studies confirmed that natural clintonite crystals do not vary extensively in composition: (i) the octahedral sites contain predominant Mg and Al with Fe2+ to ≤7% of the octahedral-site occupancy; (ii) the extent of the substitution [4]Al-1
[6]Mg-2 [4]Si [6](Al, ), which involves the solid solution of
trioctahedral with dioctahedral Ca-bearing brittle micas, is very limited; (iii) Fe3+ content involves tetrahedral site occupancy, but at low (<1%) concentrations; (iv) the substitution [12](Na, K)-1 [4]Si-1
[12]Ca [4]Al is unlikely. “Potassian clintonite” (e.g., Morandi et al. 1984) is believed to represent complex interstratifications or intergrowths between phlogopite and clintonite, and (v) significant F for (OH) substitution is common. Although the normal ordering pattern of a large M(1) site and two smaller M(2) sites was confirmed for all refined clintonite crystals, different octahedral Fe2+ ordering between green and brown crystals was detected by MacKinney et al. (1988): in green clintonite crystals, Fe2+ occupies the trans M(1) site only, whereas in brown crystals, Fe2+ is randomly distributed over M(1) and M(2) octahedra. These distributions probably occur because of the disordered substitution of F- for (OH)- and local Fe–F avoidance. Tetrahedral cations are disordered and the tetrahedra are flattened as a consequence of the large Al (plus Fe3+) content. The large lateral misfit of the tetrahedral and octahedral sheets is compensated by tetrahedral in-plane rotation (α varies approximately from 23 to 25°). The separation between two adjacent layers is inversely related to α. As observed by MacKinney et al. (1988), less tetrahedral rotation and less H+-Ca repulsion, which is consistent with F- for (OH)- substitution, allow the interlayer cation to enter more deeply in to the silicate ring, thereby reducing the c repeat distance and cell volume appreciably (Table 3a).
Chromphyllite and chromium-containing dioctahedral micas. A dioctahedral mica

6 Brigatti & Guggenheim
with [6]Cr3+ for [6]Al3+ substitution greater than 70% was described recently by Evsyunin et al. (1997). The crystal, from the Slyudyanka (Irkutsk region) Country, showed 2M1 stacking, and its structure was refined in space group C2/c (Table 2b). Tetrahedral mean bond distances for both T(1) and T(2) tetrahedra do not depart significantly from those of muscovite, whereas the octahedral ⟨M(2)–O⟩ mean bond length was found to be significantly longer, suggesting a Cr preference for the M(2) site.
Combined single-crystal structure refinements and X-ray absorption spectroscopy studies (Brigatti et al. 2001a) suggested that, in chromium-containing muscovite crystals, the chromium valence is trivalent and that the metal shows a distorted octahedral coordination. Cr substitution influences generally both lateral a and b axes, whereas the c periodicity is nearly unchanged. As the octahedral substitution of Cr for Al in the M(2) site increases, the match between tetrahedral and octahedral sheets improves, thus leading to a decrease in α. Residual areas of positive electron density close to the M(1) site suggest that M(1) is occupied partially, and as a consequence, the M(1) cavity is reduced in volume and is less distorted. The reduced difference between M(1) and M(2) octahedral volumes improves the co-planarity of tetrahedral basal oxygens.
Ephesite. Ephesite is a rare trioctahedral true mica with an ideal composition of NaLiAl2(Si2Al2)O10(OH)2. Ephesite has the maximum Al amount found in trioctahedral true micas. In the early literature, it was considered a brittle mica (Slade and Radoslovich 1985) because of the Al2Si2 tetrahedral content. Tetrahedral cation ordering pattern of ephesite-1M reported by Sokolova et al. (1979) was exhaustively discussed by Bailey (1984b). Later, two crystal-structure refinements of 2M1 crystals from Postmasburg district (South Africa) were completed in the acentric space groups Cc and C1, respectively. The tetrahedral and octahedral cation ordering of ephesite-2M1 in symmetry Cc (Slade and Radoslovich 1985) was found to be similar to that of margarite-2M1 (Guggenheim and Bailey 1975, 1978), i.e., compositionally similar tetrahedra in the lower and upper sheet of the same 2:1 layer are related by a pseudo two-fold axis normal to the direction of the intralayer shift, passing laterally through two M(2) (Al-rich) octahedral sites. The Al distribution between the two tetrahedral sheets is asymmetric with [4]Al content greater in the upper than in the lower sheet. M(1) octahedra are somewhat filled by Li, whereas M(2) octahedra are occupied by Al. However, Slade and Radoslovich (1985) indicated that the ephesite symmetry is probably lower. They found from Weissenberg photographs of ephesite-2M1, weak h0l reflections with l = 2n + 1, which violate the requirements of the c glide plane and which suggest triclinic C1 space group. In this latter space group, the tetrahedral cation ordering is more complete and accounts for the small differences in the composition of the tetrahedral sheets in the 2:1 layer (Slade et al. 1987). A slightly different occupancy of M(1) sites was also emphasized, owing to differences of both O–H vector orientation and the isotropic displacement factor.
Ferroceladonite and ferro-aluminoceladonite. Ferroceladonite and ferro-aluminoceladonite were found together in an altered crystal-vitric tuff from the Gavenwood Tuff, Murihiku Supergroup, Hokonui Hills, Southland, New Zealand (Li et al. 1997). The representative formula of ferroceladonite and alumino-ferroceladonite is KFe3+(Fe2+,Mg) Si4O10(OH)2 and KAl3+(Fe2+,Mg) Si4O10(OH)2, respectively, with [6]Mg/([6]Mg + [6]Fe2+) ≤ 0.5 and with [6]Al/([6]Al + [6]Fe3+) < 0.5 in ferroceladonite and from 0.5 to 1.0 in aluminoferroceladonite (Rieder et al. 1998). On the basis of analyses of homogeneous packets of ferroceladonite and alumino-ferroceladonite, Li et al. (1997) recognized a wide variation in octahedral occupancy. They emphasized that a complete or nearly complete solid solution exists among the four end-members of the “celadonite family” (i.e., aluminoceladonite, ferro-aluminoceladonite, celadonite, and ferro-

Mica Crystal Chemistry and Influence of P-T-X on Atomistic Models 7
celadonite). Lattice-fringe images of a selected-area electron diffraction pattern for both minerals indicated a well-ordered 10-Å periodicity consistent with the monoclinic 1M polytype. Unit cell parameters for a composite ferroceladonite-ferro-aluminoceladonite sample obtained by least-squares refinement of powder X-ray data are: a = 5.270(5); b = 9.106(7), c = 10.125(8) Å, β = 100.27(4)°.
Ferrokinoshitalite. Iron-rich kinoshitalite [ideally BaFe32+Si2Al2O10(OH)2 ] occurs in
silicate-rich bands within a high-grade, metamorphic banded iron formation enclosing massive sulfide bodies in the Broken Hill deposit, Namaqualand Metamorphic Complex (Aggeneys, northern Cape Province, South Africa). Ferrokinoshitalite formed at the peak of metamorphism (T: 670 ± 20°C, P: 4.5 ± 1kbar), at a pH below the muscovite + K-feldspar buffer, at a f(O2) buffered by quartz + fayalite + magnetite, and at f(S2) between 10-5 and 10-7 (Frimmel et al. 1995). Ferrokinoshitalite was described as a new species of brittle mica by Guggenheim and Frimmel (1999). The crystal structure of a ferro-kinoshitalite-1M crystal with a chemical formula of (Ba0.47K0.33Na0.04) Fe1.72
2+ Mg0.74Mn0.08Fe0.153+ Ti0.17( )(Si2.44Al1.56)O10(OH1.35F0.65)
showed: (i) disordered Si/Al distribution, (ii) the most common trioctahedral mica ordering with M(1) slightly larger than M(2) [⟨M(1)-O⟩ = 2.120; ⟨M(2)-O⟩ = 2.106 Å]; and (iii) low values of the tetrahedral rotation angle (α = 3.95°) because the relatively large Fe-containing octahedra allow a good fit with the Al-rich tetrahedral sheet. A relatively small tetrahedral rotation produces a larger size of the tetrahedral ring, thus allowing Ba to fit better within the silicate rings. The interlayer separation in ferrokinoshitalite, although smaller than in kinoshitalite, is still sufficient to minimize T–T electrostatic interaction between adjacent tetrahedral sheets across the interlayer to allow a complete Si / Al tetrahedral disorder.
Illite. The term “illite” is commonly used in several ways. The species “illite” (Bailey 1986) involves a 2:1 layer with a structure that is not expandable, a dioctahedral sheet that is aluminous, an interlayer that is primarily K, and a composition that differs from muscovite by substitutions of the type: [4]Si + [6](Mg,Fe2+) → [4]Al + [6]Al and [4]Si + [12]( ,H2O) → [4]Al + [12]K. A representative formula is
K0.75 Al1.75,R0.252+( )(Si3.50Al0.50)O10 (OH)2.
Bailey (1986) suggested that the layer charge may vary between -0.6 to -0.9, although the upper limit of -0.8 was extrapolated from the data of Hower and Mowatt (1966). The lower limit of -0.6 was judged as a reasonable minimum without leading to possible expandability of the structure. The general term “illite” (Grim et al. 1937) is for a clay mineral that is a discrete and non-expandable mica of detrital or authigenic origin, where the exact nature of the mica is unknown. Finally, the third use is for the micaceous component of an interstratified system, such as “illite-smectite”. Material that includes an expandable component is referred to as “illitic material” and not illite. Rieder et al. (1998) recognized the wide variation in possible compositions for illite and defined a series name for illite. The layer charge with an upper limit of -0.85 for illite was determined so that muscovite from metamorphic regimes, which generally has a layer charge from -0.85 to -1.0, does not require reassessment. Approximate variations in octahedral occupancy (per octahedral site) are Al/(Al + Fe3+) from 0.6 to 1.0 and R2+/(R2+ + R3+) of <0.25. Rieder et al. (1998) classified illite as “interlayer-cation deficient”.
The chemical composition of illite appears to be related to genesis. Srodon et al. (1992) found that hydrothermally altered igneous rocks have an illite component in interstratified illite-smectite represented by A0.89(Al1.85Fe0.05Mg0.10)(Si3.20Al0.80)O10(OH)2 where A represents fixed interlayer cations, primarily K. Note that layer charge alone

8 Brigatti & Guggenheim
should not be used to distinguish between illite and muscovite. In contrast, Lindgreen et al. (2000) found that illite components in shales and mudstones have a representative formula similar to that given above from Bailey (1986).
Zöller and Brockamp (1997) showed that coexisting illite-1M and illite-2M1 have different chemical compositions, with the 1M form lower in K and tetrahedral Al and higher in Si than the 2M1 form. The composition is K0.715(Al1.635Fe0.20Mg0.165)(Si3.45Al0.55) O10(OH)2 and K0.835(Al1.645Fe0.19Mg0.16)(Si3.34Al0.66)O10(OH)2 for the 1M and 2M1 forms, respectively. Although the octahedral composition of both forms is very similar, there is an apparent deficiency in charge in the octahedral sheet of the 1M structure relative to the 2M1 polytype, suggesting that a simple Si exchange for Al and K does not occur (Zöller and Brockamp 1997). Compositional control of stacking is common in the micas. For example, in general, trioctahedral micas favor the 1M polytype and dioctahedral micas favor 2M1 forms (Bailey 1984a, p. 10), and there are many other examples. To emphasize that structural relationships are not truly polytypic or polymorphic in the micas, the term “polytypoid” is used to describe these structures formally.
Although single crystal refinements of high quality have not been made for illite, a structural model involving octahedral-cation order has been developed by Drits and coworkers that accounts well for the thermal analysis of various illite samples and their powder diffraction patterns. Dioctahedral micas of high relative crystallinity generally form structures with the vacant site ordered at M(1), the trans site. Dioctahedral 2:1 layers with the vacant site located in the cis position, M(2), were suggested earlier for montmorillonite and other dioctahedral smectites (e.g., Méring and Glaeser 1954; Méring and Oberlin 1971; Besson 1980; Besson et al. 1982; Tsipursky and Drits 1984). Drits et al. (1984, 1993) predicted and outlined the powder X-ray diffraction features of illite with trans-vacant and cis-vacant sites and structures where there is a statistical distribution of cations over all three sites (simulating a trioctahedral arrangement). Bailey (1984b) and Drits et al. (1984) noted that there is a relationship between the intralayer shift (ideally -0.333a1) and octahedral site size: an undershift occurs where M(2) is the larger site and an overshift occurs where M(2) is the smaller site relative to M(1). Thus, a trans-vacant illite has a value of |c(cosβ)/a| greater than 0.333a1 ranging from 0.38 to 0.41 and a cis-vacant illite has a value of less than 0.333a1 ranging from 0.29 to 0.31 (Drits et al. 1993). The effect of these intralayer shifts is to displace significantly the 211 , 112 , and 311 reflections in powder diffraction patterns of the trans- vs. cis-vacant structures, thereby allowing the determination of the ordering pattern. Zvyagin et al. (1985), Drits et al. (1993), and Reynolds and Thompson (1993) described illite samples containing cis-vacant sites. Structures with cis-vacant configurations were identified also by oblique texture electron diffraction techniques. The occurrence of the trans-vacant and cis-vacant structures has important implications in the thermal decomposition of illite and illite-bearing interstratifications, which are discussed in more detail in the “Atomistic Models Involving High-Temperature Studies of the Micas” section.
Nanpingite. Nanpingite, ideally CsAl2 AlSi3O10(OH)2 is a dioctahedral mica, similar in composition to muscovite, with Cs replacing K in the interlayer site. The mineral occurs in the Nanping pegmatite field (Fujian Province, China) where it was found in a large pegmatite vein crystallized from a residual hydrothermal fluid (Yang et al. 1988). No other nanpingite occurrence has been reported to date. If compared to muscovite, the nanpingite crystal structure [space group: C2/c; unit cell parameters: a = 9.076(3), b = 5.226(2), c = 21.41(5) Å, β = 99.48(5)°, Table 2c] shows two unusual features, i.e, a 2M2 stacking sequence and a relatively small tetrahedral rotation angle (α = 5.5°) ( Ni and Hughes 1996). Both these features were attributed to the large cation in the interlayer. In nanpingite, Cs increases the interlayer separation between two
Mica Crystal Chemistry and Influence of P-T-X on Atomistic Models 9
adjacent layers, thus mitigating the energetically unfavorable conditions that hinder the formation of the 2M2 polytype in dioctahedral micas (i.e., repulsion between basal oxygen atoms of two adjacent layers which superimpose as a result of the 2M2 stacking; Güven 1971a). Because of the Cs coordination, the Cs polyhedron is elongated along c* relative to a K polyhedron, and it is not enlarged along the [100] and [010] directions. In nanpingite, the large c parameter reflects the unusual interlayer composition.
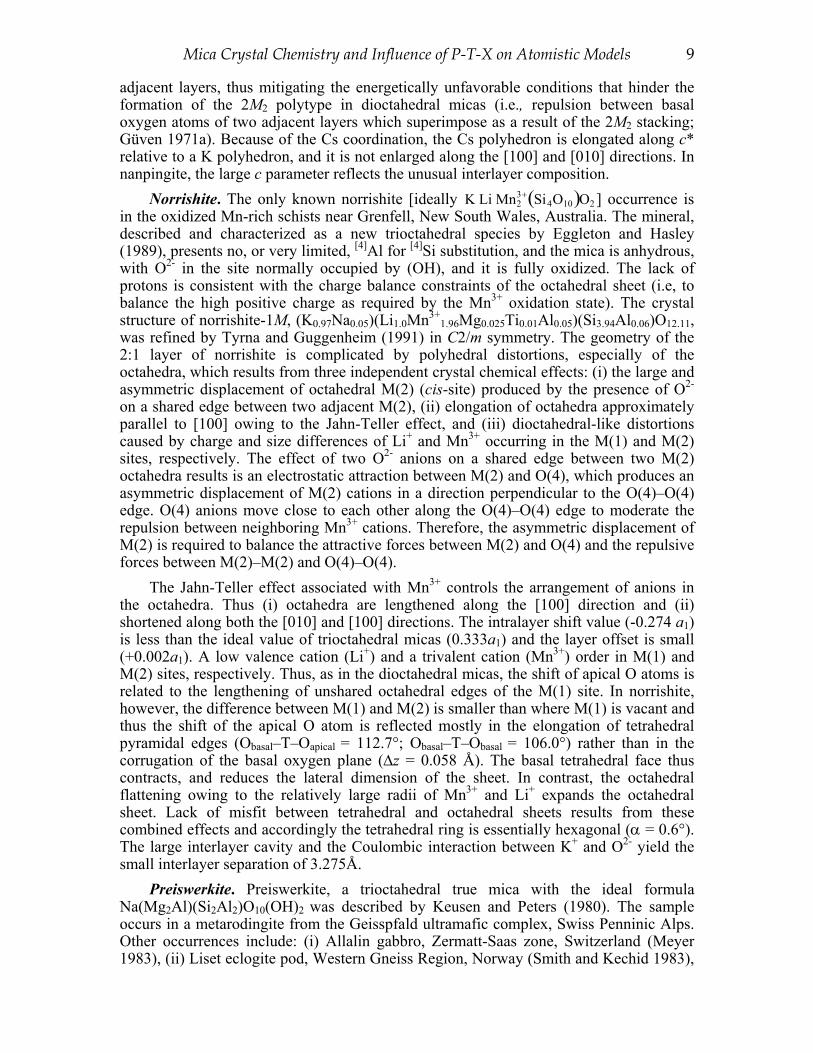
Norrishite. The only known norrishite [ideally K Li Mn23+ Si4O10( )O2 ] occurrence is
in the oxidized Mn-rich schists near Grenfell, New South Wales, Australia. The mineral, described and characterized as a new trioctahedral species by Eggleton and Hasley (1989), presents no, or very limited, [4]Al for [4]Si substitution, and the mica is anhydrous, with O2- in the site normally occupied by (OH), and it is fully oxidized. The lack of protons is consistent with the charge balance constraints of the octahedral sheet (i.e, to balance the high positive charge as required by the Mn3+ oxidation state). The crystal structure of norrishite-1M, (K0.97Na0.05)(Li1.0Mn3+
1.96Mg0.025Ti0.01Al0.05)(Si3.94Al0.06)O12.11, was refined by Tyrna and Guggenheim (1991) in C2/m symmetry. The geometry of the 2:1 layer of norrishite is complicated by polyhedral distortions, especially of the octahedra, which results from three independent crystal chemical effects: (i) the large and asymmetric displacement of octahedral M(2) (cis-site) produced by the presence of O2- on a shared edge between two adjacent M(2), (ii) elongation of octahedra approximately parallel to [100] owing to the Jahn-Teller effect, and (iii) dioctahedral-like distortions caused by charge and size differences of Li+ and Mn3+ occurring in the M(1) and M(2) sites, respectively. The effect of two O2- anions on a shared edge between two M(2) octahedra results is an electrostatic attraction between M(2) and O(4), which produces an asymmetric displacement of M(2) cations in a direction perpendicular to the O(4)–O(4) edge. O(4) anions move close to each other along the O(4)–O(4) edge to moderate the repulsion between neighboring Mn3+ cations. Therefore, the asymmetric displacement of M(2) is required to balance the attractive forces between M(2) and O(4) and the repulsive forces between M(2)–M(2) and O(4)–O(4).
The Jahn-Teller effect associated with Mn3+ controls the arrangement of anions in the octahedra. Thus (i) octahedra are lengthened along the [100] direction and (ii) shortened along both the [010] and [100] directions. The intralayer shift value (-0.274 a1) is less than the ideal value of trioctahedral micas (0.333a1) and the layer offset is small (+0.002a1). A low valence cation (Li+) and a trivalent cation (Mn3+) order in M(1) and M(2) sites, respectively. Thus, as in the dioctahedral micas, the shift of apical O atoms is related to the lengthening of unshared octahedral edges of the M(1) site. In norrishite, however, the difference between M(1) and M(2) is smaller than where M(1) is vacant and thus the shift of the apical O atom is reflected mostly in the elongation of tetrahedral pyramidal edges (Obasal–T–Oapical = 112.7°; Obasal–T–Obasal = 106.0°) rather than in the corrugation of the basal oxygen plane (Δz = 0.058 Å). The basal tetrahedral face thus contracts, and reduces the lateral dimension of the sheet. In contrast, the octahedral flattening owing to the relatively large radii of Mn3+ and Li+ expands the octahedral sheet. Lack of misfit between tetrahedral and octahedral sheets results from these combined effects and accordingly the tetrahedral ring is essentially hexagonal (α = 0.6°). The large interlayer cavity and the Coulombic interaction between K+ and O2- yield the small interlayer separation of 3.275Å.
Preiswerkite. Preiswerkite, a trioctahedral true mica with the ideal formula Na(Mg2Al)(Si2Al2)O10(OH)2 was described by Keusen and Peters (1980). The sample occurs in a metarodingite from the Geisspfald ultramafic complex, Swiss Penninic Alps. Other occurrences include: (i) Allalin gabbro, Zermatt-Saas zone, Switzerland (Meyer 1983), (ii) Liset eclogite pod, Western Gneiss Region, Norway (Smith and Kechid 1983),
10 Brigatti & Guggenheim
(iii) Amorican massif eclogite, France (Godard 1988, Godard and Smith 1999), (iv) serpentinite schist of Vumba schist belt, Botswana (Rammlmair et al. 1988); (v) jadeite of Montagua fault zone, Guatemala (Harlow 1994, 1995), and (vi) tourmaline-biotite-scapolite rock near the Blengsvatn, Bamble sector, southern Norway (Visser et al. 1999). Excluding the sample from Blengsvatn, which was formed in a silica-undersaturated, Na-Al-B-Cl-Mg-rich rock during prograde metamorphism, all reported occurrences of preiswerkite involve metabasic and meta-ultramafic rocks. Preiswerkite forms both during retrogression, following eclogite or amphibolite-granulite facies metamorphism, or during a late to retrograde-stage amphibolite facies overprint. The stability of preiswerkite is not restricted to extreme or unusual P-T conditions. Therefore, the rarity of this mica is probably related to an unusual host rock composition. Preiswerkite is relatively homogeneous in composition. Godard and Smith (1999) observed that the mineral, associated with Na-, (Fe,Mg)-rich margarite in two eclogite occurrences, displays slight solid solution toward aluminoceladonite and aspidolite, but no solid solution toward more aluminous compositions.
The crystal structure of preiswerkite-1M was determined by Oberti et al. (1993) in space group C2/m (Table 1a). Although the presence of only one independent tetrahedral site implies complete long-range Al, Si disorder, Raman and NMR studies on natural and synthetic preiswerkite crystals indicated the presence of strong short-range order (Tlili et al. 1989; Sanz and Robert 1992). Clusters of Si surrounded by three Al tetrahedra (SiAl3) together with AlSi3 clusters were recognized in Raman spectra; 29Si and 27Al NMR indicated also the presence SiAl3 clusters together with Al2Si environments but not with AlSi2 or Si3 environments. The Tschermak’s substitution ([4]Si-1 [6]Mg-1 [4]Al [6]Al) is associated with an increase in the size of the tetrahedra and a decrease in size of the octahedra. The resulting misfit is minimized by α values approching 20°. Oberti et al. (1993) suggested that the charge imbalance on the basal O atoms produced by the [4]Al content was compensated both by a shortening of the T–Obasal bond relative to the T–Oapical distance and by some H-bonding interactions, which prevent the replacement of OH by F. Complete cation disorder or partial Mg, Al ordering can occur between octahedral sites, with Al preferentially sited in M(2).
Tobelite. Tobelite, ideally (NH4)Al2Si3AlO10(OH)2, was described as a new diocta-hedral mica by Higashi (1982). The term tobelite is used to designate an illite-like species characterized by: (i) NH4 > K, in the interlayer, (ii) Si ≥ 3 atoms per formula unit (apfu) in tetrahedral sites, and (iii) a layer charge of less than one. Tobelite occurs as a hydrothermal alteration product of andesite and rhyolite tuffs in pottery clay (Ohgidani Toseki deposit, Tobe, Ehime Prefecture) and in pyrophyllite deposits (Horo, Hiroshima Prefecture) in Japan (Higashi 1982). Tobelite shows larger (001) spacing (~0.25 Å) and unit cell parameters [a = 5.219(3), b = 8.986(2), c = 10.447(2) Å, β = 101.31(1)°] than illite. Unfortunately reliable single-crystal refinements are at present not available for tobelite and illite.
NH4-rich phyllosilicates with K > NH4 and with (001) spacing values intermediate between illite and tobelite are referred to as “NH4-rich illite.” They occur in hydrothermal environments (Sterne et al. 1982; Higashi 1982; Von Damm et al. 1985; Wilson et al. 1992; Bobos and Ghergari 1999); in black-shales (Sterne et al. 1984); in regionally metamorphosed carbonaceous pelites (Juster et al. 1987; Daniels et al. 1996; Liu et al. 1996) and in diagenetic environments (Duit et al. 1986; Lindgreen et al. 1991; Drits et al. 1997).
Tobelite-like layers are often found in interstratified dioctahedral minerals having non-expandable (mica-like) and expandable (smectite-like and/or vermiculite-like) layers. Drits et al. (1997) demonstrated that, in interstratified illite-smectite minerals from North

Mica Crystal Chemistry and Influence of P-T-X on Atomistic Models 11
Sea oil-source rocks, the mica-like component contains both K-rich end-member (illite) and NH4-rich end-member (tobelite) layers. The amount and the distribution of fixed K and NH4 was determined by a peak profile-fitting procedure on experimental powder (X-ray) diffraction features (Drits et al. 1997; Sakharov et al. 1999). Synthetic micas with unusual properties
Cesian tetra-ferri-annite and cesian annite. Fe-rich micas have the capacity to contain radioisotopes, such as 135Cs and 137Cs. The study of these materials has been a promising direction of mica research over the last few years; see, for example, Mellini et al. (1996), Drábek et al. (1998), and Comodi et al. (1999). The cesian-tetra-ferri-annite crystal structure was studied by Mellini et al. (1996) and by Comodi et al. (1999) at ambient conditions and at high P-T conditions. Cs-tetra-ferri-annite crystallizes in the 1M polytype (C2/m space group). It has the largest unit-cell volume reported to date for 1M micas and coordination polyhedra are undistorted (Table 1a). The tetrahedral rotation angle (α = 0.2°), and the octahedral-distortion parameter, δ, involved with the counter-rotation of upper and lower oxygen triads are near 0° (δM(1) = 0; δM(2) = 0.2°), thus suggesting a nearly undistorted layer with limited internal strain. No detectable internal strain based on such parameters (e.g., α and δ) was observed at high pressure (to 47 Kbar) and temperature (to 582°C). Above 450°C, in air, the reduction of the unit cell volume is related to the loss of H atoms required to balance the layer charge after oxidation of octahedral iron in the M(2)-cis site.
Li for K exchange in interlayer sites. Volfiger and Robert (1979, 1980) and Robert et al. (1983) suggested that, in synthetic trioctahedral micas, anhydrous Li can exchange for K in interlayer sites. Although the crystal quality obtained from the run products did not allow a complete crystal structure determination, they indicated, on the basis of the results obtained by infrared and powder X-ray analyses, that Li is located in the interlayer in a pseudo-octahedral cavity. This cavity is partly defined by the hexagonal ring of one layer and by the basal oxygen atoms of two tetrahedra in the adjacent layer. The Li solubility limit was estimated to be a function of the relation: Li/(Li+K)max = 2 [4][Al/(Al+Si)]2. Tetrahedral Al for Si substitution is essential to minimize the electro-static repulsion between tetrahedral cations and Li, and therefore to create favorable cavities to host Li. Robert et al. (1983) found that the unit cell parameter, c, decreases with K for Li substitution whereas the b parameter slightly increases.
In Li-exchanged synthetic paragonite-2M1 and muscovite-2M1, repulsive forces between O atoms across the interlayer region cause an interlayer overshift, resulting in an anomalously high basal spacing and smaller monoclinic β angle (Keppler 1990). Complete and rapid Li exchange in the interlayer sites was obtained for natural phlogopite, ferroan phlogopite and muscovite using “cryptand [222]” as a complexing agent, and dioxane as a solvent (Bracke et al. 1995). Powder X-ray diffraction suggests that the interlayer spacing changes with replacement of K by Li + H2O. The original reflection at 9.93 Å loses intensity progressively and an additional reflection at 11.78 Å appears.
EFFECT OF COMPOSITION ON STRUCTURE Tetrahedral sheet
In some naturally occurring true micas, Si nearly fills all the tetrahedral sites (e.g., polylithionite, tainiolite, norrishite, and celadonite), whereas in the most common mica species (i.e., muscovite and phlogopite) Al substitutes for Si in a ratio near 1:3. In some true micas and brittle micas, the Al for Si substitution corresponds to a ratio of Al:Si = 1:1 (e.g., ephesite, preiswerkite, siderophyllite, margarite, and kinoshitalite), whereas the

12 Brigatti & Guggenheim
trioctahedral brittle mica, clintonite, has an unusually high Al content with a ratio of Al:Si of 3:1 (Bailey 1984a,b). Evidence of Fe3+ tetrahedral substitution was reported on the basis of optical observations (e.g., Farmer and Boettcher 1981; Neal and Taylor 1989), spectroscopic studies (e.g., Dyar 1990; Rancourt et al. 1992; Cruciani et al. 1995) and crystal-structure refinement (Guggenheim and Kato 1984; Joswig et al. 1986; Cruciani and Zanazzi 1994; Brigatti et al 1996a, 1999; Medici 1996). However, only in tetra-ferriphlogopite, tetra-ferri-annite and anandite is Fe3+ the only Si-substituting cation, with a Fe3+:Si ratio near 1:3 (e.g., Giuseppetti and Tadini 1972; Semenova et al. 1977; Hazen et al. 1981; Filut et al. 1985; Brigatti et al.1996a,b, 1999; Mellini et al. 1996). Thus, the 1:3 ratio appears to be the greatest Fe3+ tetrahedral substitution possible for the micas. Two mica end-members contain B (boromuscovite; Liang et al. 1995) and Be (bityite; Lin and Guggenheim 1983), and some synthetic micas contain Ge in the T site (Toraya and Marumo 1981; Toraya et al. 1978a,c). Most mica structures display a disordered distribution of tetrahedral cations, with the exception of some brittle mica species, such as margarite (Guggenheim and Bailey 1975, 1978; Kassner et al. 1993), anandite (Giuseppetti and Tadini 1972; Filut et al. 1985) and bityite (Lin and Guggen-heim 1983) and a few true micas (e.g., polylithionite-3T, Brown, 1978; muscovite-3T, Güven and Burnham 1967). Some true micas with an apparent ordered distribution of cations in the tetrahedra are those with a high R value and therefore these structures should be considered tentative.
Hazen and Burnham (1973) related ⟨T–O⟩ distances of trisilicic micas to tetrahedral composition by the linear relationship (xAl and xSi represent Al and Si apfu, respectively)
( ) 0.163 1.608Al
Al Si
xT O A
x x
⎛ ⎞⟨ − ⟩ = ⋅ +⎜ ⎟+⎝ ⎠
A more general relationship derived here including both trioctahedral and dioctahedral true and brittle micas (Tables 1-4, Appendix II) between tetrahedral mean bond distances ⟨T–O⟩ and tetrahedral chemistry (in apfu) is:
T −O (Å) = 1.607+ 4.201 ⋅ 10−2 [4] Al + 7.68 ⋅10−2[4]Fe (correlation coefficient, r = 0.965)
In the regression analysis, structures containing B, Be, and Ge in tetrahedral sites were not considered, as well as structures with symmetry lower than ideal owing to tetrahedral cation ordering (differences in ⟨T–O⟩ values greater than 5σ). Only structures containing tetrahedral Si, Al, and Fe were examined.
Geometrical considerations of tetrahedral distortion parameters have been considered earlier (e.g., Drits 1969, 1975; Takéuchi 1975; Appelo 1978; Lee and Guggenheim 1981; Weiss et al. 1992). We further discuss these relationships here and relate them to layer composition on the basis of data from a large number of structure determinations.
A crystal chemical study of the τ parameter is complex. In an ideal tetrahedron τ is equal to arcos (-1/3) ≅ 109.47°. For non-ideal cases, however, τ was found to be affected by tetrahedral content, increasing as Si increases (Takéuchi 1975) relative to Al. The τ value can deviate from its ideal value as a function of the relative position along c for the basal oxygen atoms with respect to the tetrahedral cation and with respect to the mean basal-edge length and the mean tetrahedral-edge value. These conclusions are based on the linearized topology of the tetrahedron. Several simple models of deformation are considered here (Fig. 2) and only modes (3) and (4) were found to affect the τ value. All dependences (over displacement from an ideal undeformed configuration) of order

Mica Crystal Chemistry and Influence of P-T-X on Atomistic Models 13
Figure 2. Geometrical considerations over the dependence of τ from tetrahedron vertex and center displacement. The relationships in the legend have been obtained from a linearized geometrical model. k and e indicate the displacement and the tetrahedron edge length, respectively.
greater than one are ignored. The model, thus, provides results in good agreement with structural data only if displacements are small relative to the characteristic length of the system (i.e., the tetrahedral edge).
Figure 3 shows the variations of τ vs. [4]Si content. Although the increase of τ with [4]Si is confirmed, there are two different linear trends, one trend for true and one trend for brittle micas. Brittle micas show τ values greater than expected if just the composition of the tetrahedron is considered. Although this simple model ignores cation ordering, on the basis of geometrical considerations derived before (Fig. 2), the higher τ values may be explained by the increase in the electrostatic attraction of basal oxygen atoms by the high-charge interlayer cation and by the concomitant increase in repulsion between the interlayer cation and the tetrahedral cation. Note, for example, that kinoshitalite usually tends to approach true micas in composition. Samples of kinoshitalite and ferrokino-shitalite (Guggenheim and Kato 1984; Brigatti and Poppi 1993; Guggenheim and Frimmel 1999) contain significant amounts of monovalent K in substitution for Ba, whereas, kinoshitalite refined by Gnos and Armbruster (2000), marked by an arrow in Figure 3, has nearly complete interlayer Ba occupancy and a larger τ value.
To better relate how the interlayer cation affects τ, we have developed a simple electrostatic model. The model is comprised of four tetrahedral oxygen atoms, with the tetrahedral and the interlayer cations located at the center of the tetrahedron and in the

14 Brigatti & Guggenheim
Figure 3. Relationships between the tetrahedral flattening angle, τ, and Si content in tetrahedral coordination as determined by microprobe analysis. Symbols used: filled circle = annite; filled circle, x-hair = magnesian annite; open circle = phlogopite; open circle, x-hair = ferroan phlogopite; filled circle, dotted = tetra-ferri-annite; open circle, dotted = tetra-ferriphlogopite; open square = polylithionite; filled square = trilithionite; filled square, x-hair = siderophyllite; open square, x-hair = ferroan polylithionite; filled hexagon, x-hair = norrishite; crosses = preiswerkite; open diamond = muscovite; open diamond, x-hair = nanpingite; filled diamond = paragonite; filled diamond x-hair = boromuscovite; open triangle up = clintonite; filled triangle up, x-hair = ferrokinoshitalite; filled triangle up = kinoshitalite. The sample arrowed is kinoshitalite by Gnos and Armbruster (2000). For details see text.
middle of the interlayer, respectively. The oxygen atoms were placed at the vertices of an undistorted tetrahedron with a tetrahedral volume equal to that as considered above. A uniform displacement along the [001] direction was then imposed on the basal oxygen atom plane and the electrostatic energy associated with the system was then derived as a function of this displacement. Finally, the displacement which minimizes the electrostatic energy of the system was calculated and compared with the value obtained for a system identical to that described, but differing in the formal charge of the interlayer cation which was arbitrarily set equal to one. Therefore, the model takes into consideration the differences in energy between the two configurations described, not the total energy.
The displacement obtained was used to “isolate” the τ value from the influence of the divalent interlayer cation. The τ values of tetrahedrally disordered brittle micas which was thus “isolated” (i.e., τ*) follow the same trend defined for true micas, confirming the influence of interlayer cations on τ (Fig. 4).
Unlike other models reported in the literature (e.g., Giese 1984), our model intro-duces only the Coulombic term and does not consider the repulsive energy or van der Waals interactions. This simplification, as Giese (1984) correctly noted, does not produce correct energy values. For this reason, energy differences between structural systems, which are characterized by the same repulsive energy, were considered. The charge at each position was determined from chemical data and from structural constraints.

Mica Crystal Chemistry and Influence of P-T-X on Atomistic Models 15
Figure 4. Relationship between τ* and Si tetrahedral content . τ* refers to the τ value “isolated” from the influence of the interlayer cation for the brittle micas clintonite and kinoshitalite. Regression equation: τ* (°) = 2.920 × [4]Si + 101.98, r = 0.950. Symbols and samples as in Figure 3.
Figure 5. Bond energy between tetrahedral cation and tetrahedral basal oxygen atoms compared with the bond energy between interlayer cation and tetrahedral basal oxygen atoms. Symbols and samples as in Figure 3.

16 Brigatti & Guggenheim
Figure 5 relates the bond energy between the tetrahedral basal oxygen atoms vs. tetrahedral cations (⟨T–Obasal⟩) and between the basal oxygen atoms vs. interlayer cations (⟨A–Obasal⟩), respectively. In brittle mica species, the distance between the tetrahedral cation and the basal oxygen atom plane increases, owing to the interaction with the interlayer cation. In this way the increase in ⟨T–Obasal⟩ bond energy is partly compensated by a decrease in bond energy between the cation and the oxygen atoms of the basal plane.
The displacement of the tetrahedral cation from its ideal position can be evaluated (see Appendix I for derivation) from the tetrahedral displacement parameter, Tdisp.:
Tdisp. = T − Obasal2
−O − Obasal
2
3−
T − Oapical( )3
Tdisp. was calculated for all structures starting from observed distances, and then plotted against the τ value observed (Fig. 6).
Figure 6. Mean τ value vs. the displacement of the T cation from the center of the tetrahedron mass (Tdisp.). Symbols and samples as in Figure 3.
The plane of basal oxygen atoms approaches the tetrahedral cation in flattened tetrahedra (the distance between the tetrahedral cation and the basal oxygen-atom plane decreases with respect to the T–Oapical distance), whereas the tetrahedral cation shifts toward the tetrahedral apex (the distance between the tetrahedral cation and basal-oxygen atom plane increases with respect to the T–Oapical distance) in elongated tetrahedra. In preiswerkite and in boromuscovite the tetrahedral cation shifts from its ideal position toward the plane of basal oxygen atoms (τ < 109.47°). In the brittle mica clintonite, the tetrahedral cation more closely approaches the center of the tetrahedron (τ ≈ 109.47°), whereas in other micas the cation shifts toward the tetrahedral apex (τ > 109.47°). The maximum shift was observed in norrishite (Tyrna and Guggenheim 1991) and in polylithionite (Takeda and Burnham 1969).

Mica Crystal Chemistry and Influence of P-T-X on Atomistic Models 17
Figure 7. Plot of τ vs. ⟨O-O⟩basal. Symbols and samples as in Figure 3.
In addition, τ reflects an adjustment for the misfit between the tetrahedral sheet and the octahedral sheet (the regression coefficient, r, of τ vs. the difference between mean basal tetrahedral edges and mean octahedral triads is r = 0.92). Furthermore, as the mean ⟨O–O⟩ basal distance decreases, the tetrahedral cation moves away from the basal oxygen-atom plane. Thus, τ increases in value (Fig. 7). The deviation of the parameters for clintonite and kinoshitalite from the trend for true micas further suggests that there is a significant influence of the interlayer cation on the value of τ.
In conclusion (i) τ increases as the distance between the tetrahedral cation and the basal oxygen-atom plane increases from its ideal value; (ii) τ increases as ⟨O–O⟩basal decreases, thus reflecting a dimensional adjustment between the tetrahedral sheet and octahedral sheet; and (iii) τ increases with [4]Si content. Differences between τ values of brittle micas from the true micas are related in part to electrostatic features. It is useful to understand why the tetrahedral cation moves from its ideal position. Drits (1969) stated that “the position of the tetrahedral cation depends not only on the degree of substitution of Si by Al in the tetrahedra (Brown and Bailey 1963), but also in the position and distribution in compensating positive charges.” This assumption is related to electrostatic forces in the following way (see Appendix I for derivation):
ΔE1 =−3 ⋅qT
dTπOb−
−9⋅ qT
T − Oapical
⎛
⎝ ⎜
⎞
⎠ ⎟ ΔE3 =
q T2
IS + 2 ⋅dTπOb−
qT2
IS + 2 / 3 ⋅ T − Oapical( )⎛
⎝ ⎜ ⎜
⎞
⎠ ⎟ ⎟
ΔE 2 =qT ⋅ qA / 4( )
IS / 2 + d TπOb( )2 + Oapical − Oapical2
⎛
⎝
⎜ ⎜ ⎜
⎞
⎠
⎟ ⎟ ⎟
−q T ⋅ q A / 4( )
IS / 2 + T − Oapical( )/ 3( )2+ Oapical − Oapical
2
⎛
⎝
⎜ ⎜ ⎜
⎞
⎠
⎟ ⎟ ⎟

18 Brigatti & Guggenheim
where qT and qA are the tetrahedral and interlayer charges, respectively; IS is the interlayer separation; dTπOb is the distance of the tetrahedral cation from the basal oxygen atom plane; ⟨Oapical–Oapical⟩ is the distance between apical oxygen atoms; and T–Oapical is the distance between the tetrahedral cation and apical oxygen atom. E1 relates the electrostatic energy between the tetrahedral cation and the basal oxygen atoms. E2 is the electrostatic energy between the tetrahedral cation and interlayer cation. E3 considers the repulsion between tetrahedral cations of two opposing tetrahedra across the interlayer (Fig. 8). ΔE1 (ΔE2, ΔE3) is the variation of E1 (E2, E3) values in the actual structure and in an ideal structure with the tetrahedral cation ideally spaced from the basal and apical oxygen atoms. ΔE1, ΔE2, and ΔE3 were derived by considering the set of charges represented in Figure 9. This specific arrangement of charges was developed to describe the electrostatic interactions between the basal oxygen atoms of the tetrahedron and interlayer cation. All planes of atoms (i.e., the plane of interlayer cations, the plane of basal oxygen atoms and the plane of tetrahedral cations) can be described through a rigid displacement of the simple charge distribution in Figure 9, thus the energy involving the oxygen-atom plane differs, to a first approximation, from the energy related to the distribution in Figure 9 by just a scale factor. The objective of our model is to describe the factors influencing the interlayer cation displacement from its “ideal” position. However, we consider the difference in energy between the actual structure configuration and that characterized by a tetrahedral cation-basal oxygen atom plane distance, which is equal to (T–Oapical)/3. All terms in energy which do not include that distance, are therefore excluded in this derivation because they must be equal in both the configurations considered. In conclusion, differences in energy among configurations which vary for very small displacements of charge can be very useful. Our model considers van der Waals and repulsion energies equal in both configurations to simplify the calculation.
Figure 8. Relationship between ΔE2 + ΔE3 vs. ΔE1. For the definition of energy E1, E2, and E3, see text. Regression equation [(ΔΕ2 + ΔΕ3) = -1.099 ΔΕ1 + 1.26 × 10⁻³ ; r = 0.997). Symbols and samples as in Figure 3.

Mica Crystal Chemistry and Influence of P-T-X on Atomistic Models 19
Figure 9. The set of charges used to derive ΔE1, ΔE2, and ΔE3.
Figure 8 clearly shows that an increase in the electrostatic energy associated with an
increase in the tetrahedral cation-basal oxygen atom distance is compensated by a reduction in the repulsion between the interlayer cation and the tetrahedral cation and the tetrahedral-tetrahedral cations (sited in adjacent layers). Given the high correlation coefficient (r = 0.997), the relation may be useful as a predictive tool.
The basal oxygen atom plane corrugation effect (Δz) produces an out-of-plane twisting of tetrahedra about the bridging basal oxygen atom in the [110] tetrahedral chain and a shortening of the distance between apical oxygens along the octahedral edge parallel to the (001) plane. Lee and Guggenheim (1981) demonstrated that the corruga-tion of the basal oxygen atom plane reflects differences in distance between apical oxygen atoms linked to octahedra of different size. Thus Δz is limited in trioctahedral micas with M(1) ≈ M(2) in size, whereas it shows higher values in dioctahedral micas with M(1) >> M(2) in size. Differences in Δz are related to the linkage of the tetrahedral sheet by apical oxygen with octahedral sites different in size.
A strong relationship between Δz and ΔM [ΔM = ⟨M–O⟩max – ⟨M–O⟩min] for a structure is evident in Figure 10. This result confirms that differences in octahedral site dimensions play an important role over tetrahedral basal oxygen-plane corrugation [regression equation: Δz (Å) = 0.647 × ΔM; r = 0.984].
Figure 11 shows the effect of Al octahedral content ([6]Al) on Δz. Where [6]Al occupancy is less than 1 apfu, Δz is approximately zero (trioctahedral true and trioctahedral brittle micas). In trioctahedral Li-rich micas (polylithionite, trilithionite and siderophillite) and in preiswerkite, [6]Al occupancy is nearly 1 apfu and Δz is as large as 0.15 Å. A Δz of ≤0.24 Å is observed for dioctahedral micas for which [6]Al occupancy reaches 2 apfu. Al is a cation of relatively small size. For micas with significant amounts of octahedral Al and where Al ordering occurs, differences in size between octahedral sites are enhanced and the value of Δz increases. Such differences also occur for micas with a low charge cation (e.g., Li+ in trioctahedral polylithionite) or by vacancies (i.e., in dioctahedral micas), where charge balance occurs within the octahedral sheet only. Tetrahedral rotation and interlayer region
The dimensions of an ideal octahedral sheet in the (001) plane are commonly less than those of an ideal and unconstrained tetrahedral sheet. Thus, to obtain congruence, the difference in size of the tetrahedral and octahedral sheets must be adjusted by any one or more of the following: (i) in-plane rotation of adjacent tetrahedra in opposite directions about c* (parameter α); (ii) thickening of the tetrahedra (parameter τ), and (iii) a flat-

20 Brigatti & Guggenheim
Figure 10. Relationship be-tween the tilting of the basal oxygen plane, Δz and ΔM [ = ⟨M–O⟩max – ⟨M–O⟩min ]. Regression equation: Δz (Å) = 0.647 × ΔM; r = 0.984. Symbols and samples as in Figure 3.
Figure 11. Δz (Å) vs. the octahedral Al content deter-mined by microprobe analysis. The arrow indicates the dioctahedral chromium-rich mica (Evsyunin et al. 1997) which presents an unusual chemical composi-tion characterized by an important [6]Cr for [6]Al substitution. Symbols and samples as in Figure 3.
tening of the octahedra (parameter ψ) to lengthen the octahedral edges (Mathieson and Walker 1954, Newnham and Brindley 1956; Zvyagin 1957; Bradley 1959; Radoslovich 1961; Radoslovich and Norrish 1962; Brown and Bailey 1963; Donnay et al. 1964, Bailey 1984b, Lee and Guggenheim 1981).
McCauley and Newnham (1971) specified by multiple regression analysis that, although the α value is largely controlled by the tetrahedral-octahedral sheet lateral misfit (∼90%), it also reflects the field strength of the interlayer cation. Toraya (1981) observed

Mica Crystal Chemistry and Influence of P-T-X on Atomistic Models 21
two linear relationships, between α and the difference in length of the octahedral and tetrahedral sheets along the b axis, i.e., α = c1 (2√3eb -3√2do) + c2 (where do is the mean octahedral cation-anion distance, eb is the mean basal edge length of a tetrahedron, 2√3eb and 3√2do are the lengths along the b axis, in the idealized form, of the tetrahedral and octahedral sheet, respectively; c1 and c2 are the regression coefficients, c1 = 35.44 and 12.58, c2 = -11.09 and 4.30 for silicate and germanate micas, respectively). Weiss et al. (1992) used a different dataset and the same assumption of Toraya and found, for Si-rich micas, different values for c1 and c2 (c1 = 25.9 and c2 = -5.0).
Figure 12. α determined by structure refinement vs. α calculated by regression equation α = 25.9 (2√3eb -3√2do) – 5.0 (Weiss et al. 1992). Symbols as in Figure 2. The plot reports only structures published after 1992, i.e., structures not considered in the predictive equation of Weiss et al. (1992).
The calculated α values using the equation of Weiss et al. (1992) and data published after 1992 (i.e., not used to derive the equation) vs. observed α values are consistent mostly in the range of 7-9°, whereas the correspondence is lower for smaller and larger angles (Fig. 12). Weiss et al. (1992) also predicted the α value from sheet composition using a vector-representation grid. They calculated a mean tetrahedral distance, d (T–O), and a mean octahedral bond distances, d (M–A) (where A is any anion), from equations
d (T–O) = Σ di (T–O)calc × xI d (M–O) = Σ di (M–O)calc × xi d (M–OH) = Σ dI (M–OH)calc × xi
where di (T–O), di (M–O) and di (M–OH) are the calculated mean bond lengths for cations in tetrahedral and octahedral coordination, respectively, and xi represents the atomic fraction of each cation.
To better understand the role of tetrahedral-octahedral lateral misfit for 1M, 2M1,
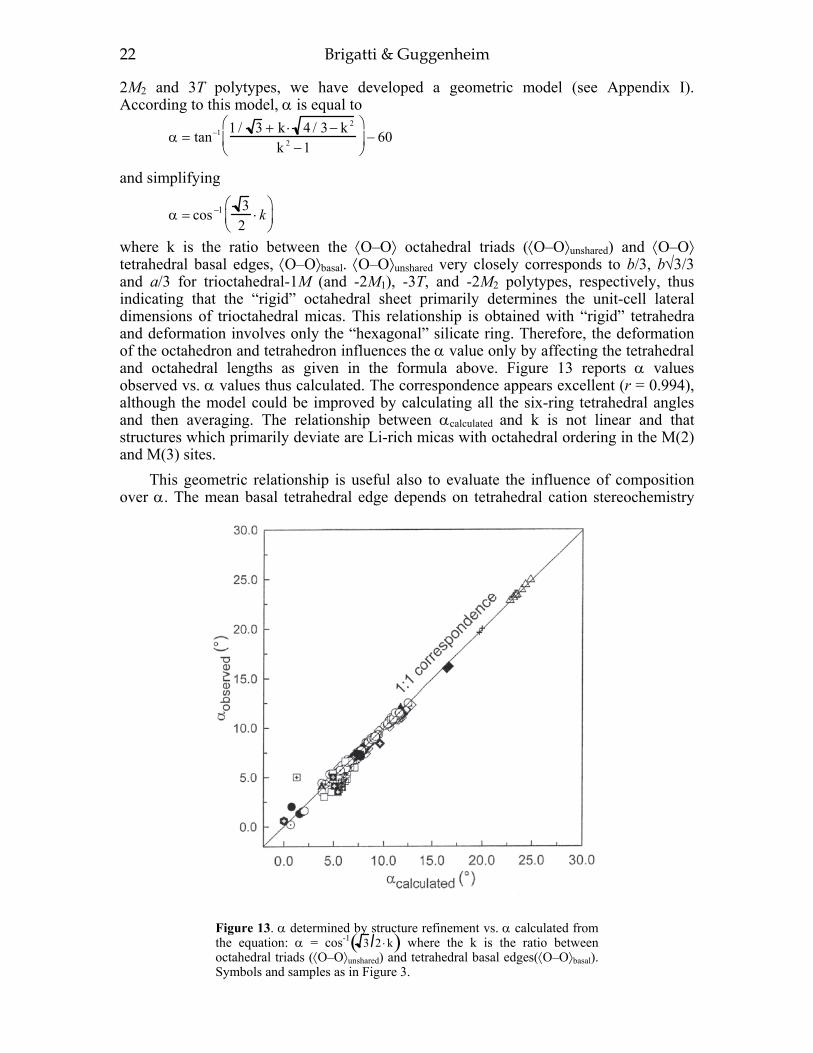
22 Brigatti & Guggenheim
2M2 and 3T polytypes, we have developed a geometric model (see Appendix I). According to this model, α is equal to
α = tan−1 1 / 3 + k ⋅ 4 / 3 − k 2
k 2 −1⎛
⎝ ⎜
⎞
⎠ ⎟ − 60
and simplifying
α = cos −1 32
⋅k⎛
⎝ ⎜
⎞
⎠ ⎟
where k is the ratio between the ⟨O–O⟩ octahedral triads (⟨O–O⟩unshared) and ⟨O–O⟩ tetrahedral basal edges, ⟨O–O⟩basal. ⟨O–O⟩unshared very closely corresponds to b/3, b√3/3 and a/3 for trioctahedral-1M (and -2M1), -3T, and -2M2 polytypes, respectively, thus indicating that the “rigid” octahedral sheet primarily determines the unit-cell lateral dimensions of trioctahedral micas. This relationship is obtained with “rigid” tetrahedra and deformation involves only the “hexagonal” silicate ring. Therefore, the deformation of the octahedron and tetrahedron influences the α value only by affecting the tetrahedral and octahedral lengths as given in the formula above. Figure 13 reports α values observed vs. α values thus calculated. The correspondence appears excellent (r = 0.994), although the model could be improved by calculating all the six-ring tetrahedral angles and then averaging. The relationship between αcalculated and k is not linear and that structures which primarily deviate are Li-rich micas with octahedral ordering in the M(2) and M(3) sites.
This geometric relationship is useful also to evaluate the influence of composition over α. The mean basal tetrahedral edge depends on tetrahedral cation stereochemistry
Figure 13. α determined by structure refinement vs. α calculated from the equation: α = cos-1 3 2 ⋅k( ) where the k is the ratio between octahedral triads (⟨O–O⟩unshared) and tetrahedral basal edges(⟨O–O⟩basal). Symbols and samples as in Figure 3.

Mica Crystal Chemistry and Influence of P-T-X on Atomistic Models 23
([4]Al and [4]Fe in apfu, r = 0.970) by: ⟨O − O⟩ basal = 2.581+ 8.836 ⋅10 −2 × [4 ]Al + 0.164 [4 ]Fe
whereas the mean length of the octahedral triads is well fitted by the following expression ([6]Al, [6]Fe2+ in apfu, r = 0.940):
⟨O − O⟩ unshared = 3.072 − 4.24 ×10 −2 × [ 6]Al + 2.14 ×10 −2 × [ 6]Fe2+ − 3.88 ×10 −2 × Ifs
where Ifs is the increase of the interlayer cation field strength (i.e., the charge of the interlayer cation divided by radius) in brittle micas with respect to true micas (both regression equations were obtained using chemical data reported in Tables 1-4, Appendix II). Note that the octahedral site composition is represented in a less accurate way than the tetrahedral composition because of the greater variability in the chemical composition of the octahedron.
The relationship between α-observed and that calculated from composition is shown in Figure 14. The fit is fair (r = 0.922) and this low correlation is related to the influence of octahedral, tetrahedral, and interlayer composition on α. In particular, the interlayer composition appears to affect the mean value of the octahedral triads (unshared O–O distances). This result confirms the influence of the interlayer site composition on the tetrahedral in-plane rotation.
Figure 14. α determined by single crystal structure refinement vs. α calculated by the formula
α = cos-1 3 2 ⋅k( ) where k value was obtained by calculating ⟨O–O⟩ octahedral unshared edges (⟨O–O⟩unshared) and ⟨O–O⟩ tetrahedral basal edges (⟨O–O⟩basal) from chemical composition (see text). Symbols and samples as in Figure 3.
For large cations such as Cs and Rb (e.g., Cs-tetra-ferri-annite, Rb-,Cs-rich phlogopite, and nanpingite) the small α value corresponds to a large interlayer separation, whereas for small cations such as Na and Ca (e.g., preiswerkite, paragonite, and

24 Brigatti & Guggenheim
Figure 15. Relationships between α and interlayer separation. Symbols and samples as in Figure 3.
clintonite) large α values correspond to small interlayer separations (Fig. 15). Thus, as previously noted (Radoslovich and Norrish 1962), the shape of the interlayer-cation cavity reflects the field strength of the interlayer cation. The cavity adjusts in size by tetrahedral rotation or by a shift in the cation toward or away from the plane defined by the three basal oxygen atoms (i.e., the basal plane).
In K-rich trioctahedral micas, both α and interlayer separation increase from norrishite to tetra-ferriphlogopite (and aluminian phlogopite) toward values for Fe-rich polylithionite, Fe-rich phlogopite, Mg-rich annite, and phlogopite. Annite deviates from the trend of trioctahedral true micas owing to a larger interlayer separation. In the Ba-rich brittle mica, ferrokinoshitalite (M sites mainly occupied by Fe2+), α- and interlayer-separation values are smaller with respect to those of kinoshitalite (M sites mostly occupied by Mg). With respect to trioctahedral micas, the interlayer separation in both muscovite and celadonitic muscovite is smaller, but α values are similar. To explain this behavior, the octahedral, tetrahedral, and O(4) site chemistry must be considered.
Compared to kinoshitalite, ferrokinoshitalite shows an enlargement of the octahedral sheet produced by the relatively large size of Fe2+ with respect to Mg and by F for OH substitution on O(4). Therefore, the smaller α value is attributed to the large size of Fe in the octahedra, which allows a better fit to the Al-rich tetrahedral sheet. Less rotation of the tetrahedra produces a larger size of the silicate ring, which allows Ba to better fit within the ring, thus reducing interlayer separation (Guggenheim and Frimmel 1999). In norrishite, the combined effects of a Si-rich tetrahedral sheet, which produces smaller individual tetrahedra within (001), and octahedral flattening owing to the relatively large Li and Mn3+, reduce the tetrahedral-octahedral sheet misfit, thus requiring limited tetrahedral rotation. In addition, the narrow interlayer region is partly related to the increase in the Coulombic interactions of O2- [in the O(4) site] and the interlayer K (Tyrna and Guggenheim 1991). In tetra-ferriphlogopite, the lateral extension of the

Mica Crystal Chemistry and Influence of P-T-X on Atomistic Models 25
tetrahedral sheet is related to Fe3+ and involves a large α value to fit the Mg-rich octahedra. The O(4) site is mostly occupied by OH-, which produces H+–K+ repulsion, thus requiring a greater interlayer separation (Brigatti et al. 1996a). A similar adjustment occurs also in aluminian phlogopite (Alietti et al. 1995) because the composition involving an exchange vector of [6 ]Al3+Mn1.96
3+ [ 4]Al3+ [4 ]Si−14 + creates larger tetrahedral-sheet
and smaller octahedral-sheet dimensions with respect to phlogopite. With respect to trioctahedral micas, dioctahedral muscovite and celadonitic
muscovite have smaller interlayer separations but similar α values. In dioctahedral micas, the proton position results in part from repulsion by the interlayer cation and the cations in the M(2) sites. Thus, the proton is located in that portion of the structure with minimal local positive-charge concentration, near the M(1) site (Radoslovich 1960; Guggenheim et al. 1987). The six-fold coordination of the interlayer cation with the basal inner O atom is distorted and elongated parallel to c*. Both effects (i.e., the distorted coordination of the interlayer cation and the smaller H+–K+ repulsion) thus control the interlayer separation.
McCauley and Newman (1971) and Weiss et al. (1992) related α to the coordination of the interlayer cation. In an ideal structure α = 0° and the interlayer cation is in 12-fold coordination. In non-ideal structures, α values of greater than 0° reduce the interlayer-cation coordination number from 12 to 6. Weiss et al. (1992) determined the coordination number of the interlayer cation using the equation of Hoppe (1979):
ECoN = Cjj=1j=12∑ ,
where ECoN is the Effective Coordination Number; Cj = exp[1.0 −(FIRj / MEFIR)6]( ); FIRj was calculated by dividing the A–Oj distance by the sum of anion and cation radii and then multiplying by the cation radii; MEFIR is a weighted mean of FIR, i.e.,
MEFIR = w jFIR jj=1
j=12∑wjj=1
j=12∑ ; 6
minjj )FIRFIR(1exp(w −= ;
FIRmin is the smallest FIRj in the interlayer cation coordination. They found that ECoN is close to 12 in tainiolite and annite, usually varies from 11 to 9 in polylithionite, ferroan polylithionite, phlogopite, and ferroan phlogopite, and is between 9 and 8 in muscovite and celadonitic muscovite, whereas paragonite and most brittle micas have the lowest ECoN (ECoN = 6). In addition to tetrahedral and octahedral site composition, the coordination of the interlayer cation was found to be affected by the stacking of the layers. In the most common polytypes (e.g., 1M, 2M1 and 3T, the polytypes of subfamily A, as defined by Backhaus and Durovíc 1984 and Durovíc et al. 1984) the coordination polyhedron of the interlayer cation varies from ditrigonal antiprism to octahedral, whereas in polytypes of subfamily B (e.g., 2M2 and 6H polytypes) it varies from ditrigonal to trigonal prismatic. Tetrahedral cation ordering
Ordering of tetrahedral cations is quite unusual in the common mica species such as muscovite-2M1, phlogopite-1M and annite-1M (Bailey 1975, 1984c), whereas it is common in brittle micas. Margarite, bityite and anandite are examples of minerals with Si,Al (or Fe3+) tetrahedral ordering (Guggenheim 1984).
Bailey (1984b) concluded that ordering of tetrahedral cations is favored for 3T structures (Güven and Burnham 1967; Brown 1978, Sidorenko et al. 1977b), for Si:Al ratios near to 1:1 (Guggenheim and Bailey 1975, 1978; Joswig et al. 1983; Lin and Guggenheim 1983) and for muscovite-1M, -2M1 and -2M2 crystals with a significant

26 Brigatti & Guggenheim
celadonite component (Güven 1971b; Zhoukhlistov et al. 1973; Sidorenko et al. 1975). In contrast, Amisano-Canesi et al. (1994) suggested that no long-range ordering of tetra-hedral cations is present in muscovite-3T crystals and concluded that the tetrahedral cation ordering previously found by Güven and Burnham (1967) may be an artifact produced by the small number of independent reflections used in the crystal-structure refinement. It is very unusual to obtain increased cation order at high temperature, where, in most cases increasing disorder is the norm, however the results of neutron powder diffraction studies suggest tetrahedral Si-Al ordering for celadonitic muscovite (referred as “phengite”) at high temperature (Pavese et al. 1997, 1999, 2000).
Guggenheim (1984) noted the importance of two factors in determining the degree of Si,Al ordering in crystals with Si:Al ratios of 1:1 that relate to octahedral- and the interlayer-site composition: (i) the charge of an apical oxygen that coordinates two Al3+ octahedral cations is undersaturated with respect to positive charge if the tetrahedral cation is Al3+, whereas it is balanced if the tetrahedral cation is Si4+; (ii) large cations in interlayer sites prop apart two adjacent 2:1 layers, thus minimizing electrostatic repulsions across the interlayer. Therefore Si,Al tetrahedral ordering seems to be favored in species with small, high-charged octahedral cations and small cations in interlayer sites. To date, long-range tetrahedral ordering has not been determined for preiswerkite and clintonite, but was found for ephesite, margarite, bityite and anandite.
Although Raman spectra suggest the presence of strong short-range ordering in preiswerkite-1M [NaMg2AlAl2Si2O10(OH)2], long range ordering in tetrahedral sites was not found by crystal-structure refinement (Oberti et al. 1993). In contrast, ephesite [NaLiAl2Al2Si2O10(OH)2], which differs in composition from preiswerkite only for octahedral composition, is strongly ordered in space group C1 (Slade et al. 1987). In the latter case, perhaps, the presence of monovalent and trivalent octahedral cations requires ordering of the tetrahedral cations to achieve a suitable local charge balance on shared apical oxygen atoms.
The possibility of tetrahedral cation ordering in kinoshitalite, characterized by a Si:Al ratio close to 1, was addressed by Guggenheim and Kato (1984), Guggenheim (1984), and Gnos and Armbruster (2000). Guggenheim (1984) related the lack of tetrahedral Si,Al ordering in kinoshitalite to the large interlayer separation (3.328 Å; Guggenheim and Kato 1984) caused by the large Ba interlayer cation which increases the separation between adjacent 2:1 layers, thus reducing any T–T electrostatic interactions across the interlayer. Lack of tetrahedral Si,Al ordering was also confirmed for ferrokinoshitalite (3.129 Å; Guggenheim and Frimmel 1999) which also has large interlayer separation but less than that of kinoshitalite.
According to Gnos and Armbruster (2000), Si,Al ordering in kinoshitalite may be masked by twinning. They assumed different twin models to explain the average structure of this brittle mica in space group C2/m starting from complete Si,Al tetrahedral ordering in C2 and C1 symmetries. The C2-space group model assumes that each Si tetrahedron is surrounded by three Al tetrahedra and vice-versa as consistent with Loewenstein’s (1954) Al-avoidance rule. The tetrahedral sheets of two adjacent 2:1 layers are arranged above and below the interlayer to produce the pattern along the c-axis for which Si is always adjacent to Si and Al adjacent to Al tetrahedra. The C1-space group model maintains the same Si,Al distribution within the tetrahedral sheets (i.e., one Si atom surrounded by three Al atoms and vice-versa), but differs for the Si,Al distribution along the c-axis. In this latter model, each Si tetrahedron is always opposed to an Al tetrahedron. Gnos and Armbruster (2000) concluded that the crystal-structure refinement is inconsistent with the twinning models that involve completely ordered Si,Al sheets. In contrast, the crystal-structure refinements of two disordered models to

Mica Crystal Chemistry and Influence of P-T-X on Atomistic Models 27
produce C2/m symmetry (i.e., three-dimensional Si,Al disorder and one-dimensional disorder along the c axis) suggested a pattern of one-dimensional disorder along the [001] direction of completely Si,Al ordered tetrahedral sheets.
In margarite [CaAl2 Al2Si2O10(OH)2], Al preferentially occupies two of the four symmetrically independent tetrahedra (Guggenheim and Bailey 1975, 1978; Joswig et al. 1983; Kassner et al. 1993). Kassner et al. (1993) found that mean tetrahedral Al–O and Si-O distances are identical in the two crystallographically independent tetrahedral sheets. Thus there is no asymmetry in the distribution of tetrahedral Al in these sheets as indicated by Guggenheim and Bailey (1975, 1978) based on an incompletely refined model. An ordering pattern similar to that of margarite occurs for tetrahedral sites of bityite with nearly complete ordering of Al, Be relative to Si (Lin and Guggenheim 1983). Octahedral coordination and long-range octahedral ordering
Three translationally independent octahedral cation sites characterize the 2:1 layer. One site is trans coordinated by OH (or by F and/or Cl, and rarely by S) and is called M(1), the remaining two sites are cis-coordinated and are referred to as M(2) where the layer contains a symmetry plane which relates the two M(2) sites. Otherwise, the two cis-sites are labeled M(2) and M(3), respectively. M(1) is usually vacant in dioctahedral micas, whereas all three octahedral sites are occupied in trioctahedral micas. The cation distribution in the octahedral sites may be summarized as: (i) all the octahedra are occupied by the same kind of “crystallographic entity” (i.e., the same kind of ion or by a statistical average of different kinds of ions, including voids, referred to as homo-octahedral micas by Durovíc 1981, 1994), (ii) two octahedra are occupied by the same kind of “crystallographic entity” and the third by a different entity in an ordered way (meso-octahedral micas), or (iii) each of the three sites is occupied by a different “crystallographic entity” in an ordered way (hetero-octahedral micas). The location of the origin of the octahedral sheet corresponds to: (i) the M(1) site for homo-octahedral micas; (ii) the site with different occupation for meso-octahedral micas; and (iii) the site with the smallest electron density for hetero-octahedral micas (Durovíc et al. 1984). As a consequence, two kinds of layers can be defined, namely, the “M(1) layer” and the “M(2) layer,” the first with the origin of the octahedral sheet in M(1), the latter in either the M(2) or M(3) site (Zvyagin 1967). The “M(1) layer” is the more common. Weiss et al. (1992) identified eight possible geometries of the octahedral sheet based on the size of octahedral sites. In particular, they derived four- and three-different geometries for meso-octahedral and for hetero-octahedral micas, respectively.
Toraya (1981) noted that the M(1) site is usually occupied by a cation of lower charge or by a vacancy. He explained this characteristic by considering the effect on the linkages of the polyhedra. An increase in the size of M(2) is energetically unfavorable because the O–O shared edge between two adjacent M(2) cations would be enlarged [increasing the repulsion between octahedral M(2) cations], the O–OH,F edge between M(1) and M(2) would be reduced [thus decreasing repulsion between octahedral M(1) and M(2) cations], and the increased repulsion between oxygen atoms on the unshared lateral edges of M(1) would occur owing to the smaller size of this site. In contrast, the only unfavorable factor created by an increase in M(1) would be an increase in repulsion between M(1) and M(2) cations, which would be mitigated by the decrease in charge of M(1). However, examples where three sites are all equal or each site differs are not unusual in trioctahedral micas. Several phlogopite and tetra-ferriphlogopite crystals (space group C2/m) show the same kind of cations (or a disordered cation distribution) in M(1) and M(2) octahedra, i.e., the difference between the mean bond lengths and mean electron counts (m.e.c.) of M(1) and M(2) sites are equal within the standard deviations

28 Brigatti & Guggenheim
(Δ ⟨M–O⟩ = |⟨M(1)–O⟩ – ⟨M(2)–O⟩| < 0.004 Å; Δ m.e.c = |m.e.c.M(1) – m.e.c.M(2)| < 1.0 e-; see, for example, in Tables 1-3 (end of chapter) the data by Semenova et al. 1977; Hazen et al. 1981; Brigatti et al. 1996a; Gnos and Armbruster 2000), whereas some Li-rich micas (space group C2) have different cation ordering in M(1), M(2) and M(3) sites; e.g., zinnwaldite-1M (Guggenheim and Bailey 1977), lepidolite-1M (Backhaus 1983), zinnwaldite-2M1 (Rieder et al. 1996), ferroan polylithionite-1M and lithian “sidero-phyllite”-1M (Brigatti et al. 2000b). The octahedral sheet may show different cation distributions in M(1), M(2), and M(3), but the size of each octahedron need not differ. For example, the zinnwaldite-1M (polylithionite-siderophyllite intermediate) structure refined by Guggenheim and Bailey (1977) shows M(1) ≠ M(2) ≠ M(3) on the basis of the site scattering power, whereas M(1) = M(3) ≠ M(2) on the basis of size of the polyhedra. Verification of ordering requires not only the analysis of cation-anion bond length but also the refinement of octahedral-site occupancies because mean bond lengths of octahedra with different occupancies may be similar. Therefore, this discussion of octahedral ordering is based only on samples for which the m.e.c. of each octahedral site is available.
For trioctahedral true micas of the phlogopite-annite join, the m.e.c. of both M(1) and M(2) sites increases from phlogopite to annite through ferroan phlogopite and magnesian annite. This suggests that an increase in the Mg-1 Fe exchange occurs and that Fe occupies both the M(1) and M(2) sites (Fig. 16). However, ferroan-phlogopite and magnesian-annite samples (Tables 1a and 1b) have differences in mean bond lengths (to 0.036 Å) and in m.e.c. (to 2.5 e-) for the M(1) and M(2) sites. Thus, a slight preference for cations with larger radii and atomic numbers for M(1) occurs. The greatest differences between M(1) and M(2) octahedral mean bond distances occur in Al-bearing magnesian annite from peraluminous granites where Al is ordered in M(2) (Brigatti et al. 2000a).
Figure 16. Mean electron count (m.e.c.) of M(2) [M(2) = M(3)] vs. m.e.c. of M(1) site. Symbols: filled circles = annite; filled circles, x-hair =magnesian annite; open circle, x-hair = ferroan phlogopite; open circles = phlogopite. Estimated average standard deviation: ±0.3 e-.

Mica Crystal Chemistry and Influence of P-T-X on Atomistic Models 29
Figure 17. Difference between M(1) and M(2) site mean bond distance in mica crystals of the phlogopite-annite join. Symbols and samples as in Figure 16. The average standard deviation on ⟨M(1)–O⟩ and ⟨M(2)–O⟩ bond distances was evaluated as ±0.002 Å.
Thus, ordering along this join seems to be enhanced where, in addition to Mg2+ and Fe2+, cations of different size and charge occur in octahedral coordination (Fig. 17).
Although the m.e.c. of M(1) and M(2) increases with the exchange vector of Mg-1Fe (Fig. 16), annite crystals have Δ ⟨M–O⟩ values much smaller than those for magnesian annite. For compositions intermediate between those of phlogopite and annite, exchange vectors that introduce cations of different charge (or vacancies) in octahedral sites significantly affect the layer topology. In fact, in phlogopite the octahedral sites are equal in size and m.e.c., annite shows octahedral sites with similar m.e.c. (Δ m.e.c. < 0.4 e-) and differences in Δ ⟨M–O⟩ bond lengths (Δ ⟨M–O⟩ < 0.02), whereas crystals of phlogopite-annite with intermediate compositions always have one larger octahedron and two smaller octahedra and usually differences in m.e.c. for M(1) and M(2).
The reduction of interlayer separation with Ti content (Fig. 18) is related to the decrease in the K-O(4) [ O(4) = OH, O, F, Cl ] distance, which is ascribed to “Ti-oxy” substitution, Ti-oxy = [6]Ti4 +O2
2 − [6] Mg−12+ (OH)−2
1− ). The interlayer cation is shifted deeper in- to the interlayer cavity owing to the deprotonation of the O(4) site; thus, the K–O(4) distance decreases with a decrease in interlayer separation. Cruciani and Zanazzi (1994) observed that the off-center shift of the cation at M(2) is associated with an increase in the proportion of [6]Ti, and this reveals a [6]Ti preference for the M(2) site.
Li-rich micas in the siderophlyllite-polylithionite join (Fig. 19) show different patterns of octahedral order. For example, in a synthetic polylithionite (space group C2/m) with octahedral composition Li2Al (Takeda and Burnham 1969) the ordering pattern results in a large M(1) site of composition Li0.89Al0.11 and two equivalent M(2) sites of composition (Li0.55Al0.45). A similar ordering pattern was observed in natural

30 Brigatti & Guggenheim
Figure 18. Interlayer separation vs. octahedral Ti4+ content for mica crystals along the phlogopite–annite join. Symbols and samples as in Figure 16. The average standard deviation on the interlayer separation was evaluated as ±0.004 Å.
Figure 19. Ternary [6]Al3+ – [6]Li+ -[6]Fe2+ diagram showing compositional data for Li-rich micas. Symbols: filled circles = Li-containing annite crystals; open squares, x-hair = ferroan polylithionite and crystals with composition intermediate between polylithionite and siderophyllite; open squares=polylithionite; filled squares, x-hair = siderophyllite; filled square = trilithionite. The open circles indicate the composition of the end members (from Brigatti et al. 2000b).

Mica Crystal Chemistry and Influence of P-T-X on Atomistic Models 31
trilithionite-1M (Sartori 1976; Guggenheim 1981) and in polylithionite-2M1 and 2M2 (Takeda et al. 1971; Sartori et al. 1973; Swanson and Bailey 1981).
In some Li-rich micas, the ideal layer symmetry is reduced from C2/m to C2, as a result of a different pattern in octahedral ordering in the cis-octahedral sites (Guggenheim and Bailey 1977; Guggenheim 1981; Backhaus 1983; Mizota et al. 1986; Rieder et al. 1996; Brigatti et al. 2000b). These minerals have ⟨M(1)–O⟩ ≅ ⟨M(3)–O⟩ > ⟨M(2)–O⟩ and occasionally ⟨M(1)–O⟩ ≅ ⟨M(2)–O⟩ > ⟨M(3)–O⟩ (Backhaus 1983; Brigatti et al. 2000b). The scattering efficiency for the M(1), M(2) and M(3) sites implies ordering with M(1) ≠ M(2) ≠ M(3), M(1) = M(3) <M(2); or M(2) = M(3) < M(1). Where all sites have different occupancies in Li-rich crystals, both “M(1) layers” and “M(2)- layers” are present.
Brigatti et al. (2000b) studied the crystal structure of 1M micas with composition in the polylithionite-siderophyllite-annite field. They showed that the variation in composition follows a near-continuous trend between polylithionite and siderophyllite. They defined the ordering parameter QM(2),M(3) as:
Using the ordering parameter, QM(2),M(3), differences in bond lengths between the M(2) and M(3) sites are nearly constant for polylithionite and ferroan polylithionite in the XSid-Pl range between 1.0 and 0.7 [XSid-Pl =
[6](Li + Al) / [6](Li+Al+Fe2+)]. However, the difference rapidly decreases starting at XSid-Pl ≅ 0.6 and the layer symmetry approaches that of space group C2/m rather than C2. The ordering parameter EM(2),M(3) is a measure of the m.e.c. in the M(2) and M(3) sites, and is defined as:
E M(2 ),M( 3) =e−M(2)− e−M(3)
12
e −M(2) + e −M(3)[ ] The ordering parameter, EM(2),M(3) indicates ordering in M(2) and M(3) for 0.6 ≥ XSid-
Pl ≥ 0.4. Therefore, the M(2) and M(3) sites appear to be completely disordered only when XSid-Pl < 0.4. Although examples of polylithionite with disordered cation distributions for M(2) and M(3) are not unusual, Brigatti et al. (2000b) concluded that Fe2+ controls the cis-site cation distribution and that order-disorder between M(2) and M(3) sites occurs in a narrow compositional interval (Fig. 20).
The ideal space group of polylithionite-3T allows all three octahedra to be of different composition. This occurs for polylithionite-3T (Brown 1978) and for lithian siderophyllite-3T (Weiss et al. 1993), which shows a different ordering pattern for each octahedron. Masutomilite (ideally KLiAlMn2+AlSi3O10F2), the Mn analogue of ferroan polylithionite (Mizota et al. 1986), has M(1) and M(3) sites which are nearly equal in size and scattering power. Both the M(1) and M(3) sites contain Li and Mn2+. The greater scattering efficiency and smaller size of the M(2) site indicate that M(2) contains Al and Fe. In contrast, the octahedral ordering pattern in norrishite (KLiMn3+
2Si4O12) is such that low-valence cations occur in M(1) (Li+) and trivalent cations (Mn3+) in M(2) [M(2) = M(3)] sites.
Several micas were described with total octahedral occupancy midway between dioctahedral and trioctahedral. However, in many cases, intermediate compositions may represent interstratified mixtures of dioctahedral and trioctahedral layers (or species). Li-rich muscovite crystals (Brigatti et al. 2001b) have a total octahedral occupancy of 2.24 apfu. The volume of the M(2) site increases sharply with an increase in Li. The M(1) cation site is partially occupied. These results seem to indicate a partial dioctahedral-trioctahedral solid solution.
In trioctahedral brittle micas, octahedral cation ordering was found for bityite and for anandite. No evidence of ordering, except for the usual mica ordering with M(1)
QM( 2),M(3) =M(3)−O − M(2) −O
12
M(2)−O + M(3)−O[ ]

32 Brigatti & Guggenheim
Figure 20. Variation of (a) QM(2),M(3) and (b) EM(2),M(3) parameters as a function of composition. The data points at QM(2),M(3) = 0 and EM(2),M(3) = 0 correspond to C2/m symmetry. Symbols as in Figure 19 (from Brigatti et al. 2000b).
occupied by a cation whose average charge is smaller and whose average size is larger than that found in M(2), was detected for kinoshitalite, ferrokinoshitalite and clintonite (see the “new species and new data” section). Anandite-2O,
Ba0.96K0.003Na 0.01( ) Fe2.022+ Fe0.31
3+ Mg0.45Mn0.042+ Mn0.04
3+( ) Fe1.383+ Si2.62( )O10S0.84Cl0.16F0.04(OH)0.96,
has octahedral Fe-Mg ordering with two Fe-poor octahedra near the cell corners and two Fe-rich octahedra near the C-face center (Filut et al. 1985). The Fe-Mg ordering requires that hydroxyl groups are associated with the Fe-poor octahedra, whereas S replaces (OH) in the Fe-rich octahedra. Bityite-2M1, (Ca0.95Na0.02)(Li0.55 0.45Al2.04Fe 0.01
3+ )(Al1.34Si2.02Be0.64)O10(OH)2, has the trans-M(1) site occupied by Li and vacancies, and the two cis-M(2) sites are occupied by Al cations (Lin and Guggenheim 1983). Coexistence of dioctahedral [with M(1)-vacant sites] and trioctahedral [with Li-filled M(1) sites] sheets was suggested to explain the two patterns of O–H vector orientation.
The topology of each octahedron is influenced not only by local composition but also by the constraints of closest packing within the sheet. Several authors (e.g., Toraya 1981; Lin and Guggenheim 1983; Weiss et al. 1985, 1992) examined the relationships between composition and the octahedral topology (i.e., variations in the octahedral dimensions and in octahedral distortions). In agreement with the observation of Hazen and Wones (1972), who suggested that octahedral flattening is controlled by the octahedral cation radius, Toraya (1981) suggested for 1M silicate and germanate micas, that the octahedral flattening angle, ψ, gradually decreases with decreasing misfit between the tetrahedral and octahedral sheets. He noted also that the tetrahedral lateral dimensions remain constant. Toraya also showed that the degree of octahedral flattening,

Mica Crystal Chemistry and Influence of P-T-X on Atomistic Models 33
which reflects variations in octahedral thickness and lateral octahedral dimensions, is related to lateral misfit between the sheets of tetrahedra and octahedra and, therefore, by α. Lin and Guggenheim (1983) related the counter-rotation of upper and lower octahedral oxygen triads (the ω angle of Appelo 1978) to the difference between the ⟨M(1)–O⟩ and ⟨M(2)–O⟩ distances. They demonstrated that ψ is significantly affected by the field strength of adjacent octahedral cations and less affected either by the octahedral cation size or by the misfit between the tetrahedral and octahedral sheets. They also observed that octahedral flattening and octahedral counter-rotation produce opposing effects. Octahedral flattening increases mean values of the upper and lower triads, and thus increases lateral dimensions of the octahedra, whereas the overall effect of counter-rotation is the reduction of the lateral octahedral size. Weiss et al. (1985) also showed that octahedral flattening and the counter-rotation of the upper and lower anion triads are related to the interaction in the “whole” sheet rather than an individual octahedron, and suggested geometrical models to predict the octahedral topology by composition.
Figure 21. Variation of ψM(1) vs. ⟨M(1)–O⟩ bond distance. Symbols and samples as in Figure 3.
Figure 21 shows the variation of ψ vs. the mean bond distance for the trans M(1) site. Both ψ and ⟨M(1)–O⟩ increase from trioctahedral micas to dioctahedral micas. As noted previously, the distortion of an octahedral site is not a simple function of the size of the cation residing in the octahedron. In fact, distortions in the vacant site in dioctahedral micas and in the M(1) site in Li-rich micas are caused by the decrease in length of the shared edges of the M(1) octahedron with respect to the mean edge value of M(1). M(1) is required to share edges with smaller adjacent octahedra containing cations with high field strength. In Figure 21, plotted values for the trioctahedral micas (excluding Li-rich) show scatter, but the general trend suggests that ψ decreases as the site size increases. From a geometrical point of view (in space group C2/m), a displacement of O(4) along [001] affects each octahedron in the same way, i.e., ⟨M(1)–O⟩ and ⟨M(2)–O⟩ mean bond

34 Brigatti & Guggenheim
Figure 22. (a) ψ = cos-1 toct / 2⟨M–O⟩; (b) deformation induced on M(1) by a displacement of the O(4) oxygen atom along the [001] direction; (c) deformation induced on M(2) by a displacement of the O(4) oxygen atom along [001] direction; (d) deformation produced on octahedra by a displacement in (001) plane which produces the C2/m symmetry requirement.
distances decrease equally, whereas ψM(1) and ψM(2) values increase equally [modes (b) and (c), Fig. 22]. Differences between M(1) and M(2) are explained by mode (d) (Fig. 22), with a displacement of the O(4) atom toward M(2). In this way, the ⟨M(1)–O⟩ distance, and the ψM(1) value increase at nearly two times the rate at which ⟨M(2)–O⟩ and ψM(2) decrease. Mode (d), therefore, does not affect ⟨M–O⟩ [⟨M–O⟩ = (⟨M(1)–O⟩ + 2 × ⟨M(2)–O⟩)/3] and ⟨ψ⟩ [⟨ψ⟩ = (ψM(1) + 2× ψM(2))/3] mean values. The results provided by the geometrical model (see Appendix I) can be compared to the trend observed for the structures in Figure 23. The parameter otcor (i.e., the difference between the value of the observed octahedral thickness and the thickness of an ideal octahedron whose edge is equal to Σ⟨O–O⟩unshared) is defined here as:
ot cor = ot −6
3⋅ ⟨O − O⟩unshared
where ot is the observed octahedral thickness and Σ ⟨O–O⟩unshared is the mean value of the M(1)and M(2) unshared edges [i.e, the mean octahedral triad value: Σ ⟨O–O⟩unshared = (⟨O–O⟩unshared M(1) + 2 × ⟨O–O⟩unshared M(2))/3]. The resulting equation of regression is ⟨ψ⟩ = -34.352⋅otcor / Σ⟨O–O⟩unshared + 54.779 (r = 0.982). The trend in Figure 23 indicates that the ψ mean value depends nearly entirely on the displacement of the O(4) atom along the [001] direction. The first-order constant in the regression equation (i.e., -34.352) is greater than the calculated value from the

Mica Crystal Chemistry and Influence of P-T-X on Atomistic Models 35
Figure 23. Variation of the mean octahedral flattening angle vs. the otcor/⟨O–O⟩unshared. otcor represents the difference between the octahedral thickness (actual) value and the thickness of an ideal octahedron whose edge is equal to ⟨O–O⟩unshared. ⟨O–O⟩unshared are the octahedral unshared edges (i.e., the octahedral triads). Symbols used: filled circles = annite; filled circles, x-hair = magnesian annite; open circle = phlogopite; open circle, x-hair = ferroan phlogopite; filled circle, dotted = tetra-ferri-annite; open circle, dotted = tetra-ferriphlogopite; filled hexagon, x-hair =norrishite; crosses = preiswerkite; open triangle up = clintonite; filled triangle up, x-hair =ferrokinoshitalite; filled trangle up = kinoshitalite.
geometrical model which assumes that only O(4) is displaced parallel to the [001] direction. Thus, we assume for the O(3) position (i.e., the apical oxygen atoms) a similar displacement along the [001] direction. This displacement suggests the existence of a very small corrugation in the O(3) and O(4) oxygen-atom plane. Similar results can be obtained using octahedral mean bond distances ⟨M–O⟩. For C2/m micas, the geometrical model also predicts the effect of the O(4) atom displacement along [100] (i.e, the difference between ψ values of M(1) and M(2) increases concomitant with the displacement of O(4) along [100]). Toraya (1981) used energy-based arguments to explain the difference between the M(1) and M(2) sites and, in particular, to explain why M(1) is usually larger than M(2). The results obtained here seem to confirm the interpretation of Toraya. In particular, it is shown that a displacement of the O(4) oxygen atom in the (001) plane should not change the ⟨M-O⟩ mean value, i.e.,
M(1) -O + 2 M(2) -O
3⎡ ⎣ ⎢
⎤ ⎦ ⎥ . It can be easily shown that the value of 1
⟨M(1) − O⟩ +
1⟨M(2)− O⟩
+ 1⟨M(3) − O⟩
increases. Therefore, the energy of the M–O(4) bond decreases.
Assuming equal charges in each of the three octahedra, the following relationship (see Appendix I) can be derived:

36 Brigatti & Guggenheim
E M−O(4) ∝ QO(4) ⋅QM ⋅1
⟨M(1) − O⟩+
1⟨M(2) − O⟩
+1
⟨M(3) − O⟩⎛ ⎝ ⎜
⎞ ⎠ ⎟
where EM-O(4) is the M-O(4) bond energy. This equation indicates that cation ordering resulting in an increase in the charge of M(2) and M(3) and a decrease in charge in M(1) is even more energetically favorable. In contrast, as O(4) is displaced away from the center of the ditrigonal silicate ring, the energy related to the O(4)-O(3) bonds is expected to increase. This mechanism may account for the difference concerning the two octahedral sites, but further studies are needed to confirm this.
Bailey (1984b) suggested that the large dimensions of the vacant M(1) octahedral site in dioctahedral micas cause an “overshift”, (i.e., the intralayer shift parameter), where the upper tetrahedral sheet is shifted relative to the lower sheet by a value greater than 0.33a1 of the pseudo- hexagonal cell. Apical oxygen atoms of the 2:1 layer are linked to the diagonal edges of the trans M(1) octahedron, thus causing the M(1) diagonal edge to increase. This produces an intralayer shift. The intralayer shift results from a displacement of the apical oxygen atoms from their ideal positions midway among the three octahedral sites. Trioctahedral micas with all three sites equal in size have the smallest intralayer shifts whereas the dioctahedral micas show the greatest. The anomal- ous behavior of norrishite is related to octahedral distortions induced by the Jahn-Teller effect (Fig. 24).
Figure 24. Differences between the ⟨M(1)–O⟩ and ⟨M(2)–O⟩ octahedral mean bond distances vs. the intralayer shift. Symbols and samples as in Figure 3.
Crystal chemistry of micas in plutonic rocks Most rock-forming silicates have solid solution involving the substitution of
different cations in one or several symmetrically different sites. Their compositions, cation ordering and topology are sensitive to many environmental conditions occurring during crystallization (e.g., Ganguly 1982; Hirschmann et al. 1994). In particular, micas

Mica Crystal Chemistry and Influence of P-T-X on Atomistic Models 37
are rock-forming silicates of great interest for their petrological, crystal-chemical and thermodynamic significance. In igneous rocks, they participate in mineral-mineral, mineral-melt, and mineral-fluid equilibria. Thus, their structures may reflect the different reactions involved (Icenhower and London 1995, 1997; references therein). However, rock-forming micas have received less attention by crystallographers as petrogenetic indicators owing to the difficulty in obtaining quality data from a structure determination. We review below the relatively few systematic studies on the crystal chemistry of naturally occurring micas crystallized from a melt. Phlogopite-annite appears to be the most widespread species in plutonic parageneses, whereas dioctahedral mica occurrences are limited, typically, to peraluminous granitoids.
Many authors have suggested the dependence of the composition of igneous micas on factors such as bulk host-rock chemistry, oxygen fugacity, H2O fugacity, and (other) fluid activity (e.g. Arima and Edgar 1981; Barton 1979; Edgar and Arima 1983; Speer 1984). The partition coefficients (D) between micas and coexisting phases were also recognized as important indicators for melt evolution (e.g., De Albuquerque 1975; Monier and Robert 1986; Icenhower and London 1995; Wolf and London 1997).
The increase of Mg/(Mg+Fe) in phlogopite with increase in MgO/(MgO+FeO) of the rock as well as with increase temperature is well-documented (Speer 1984; Puziewicz and Johannes 1990). Figure 25a suggests that the MgO/(MgO+FeO) ratio of the rock is related approximately to the content of the M(1) site. In particular, as the MgO/(MgO+FeO) ratio of the rock increases, the mica composition becomes more phlogopitic and the ⟨M(1)-O⟩ mean bond distance decreases. Different crystallization conditions may account for the poor fit of the data in Figure 25a. For example, the Tapira carbonatite complex crystallized at a high crustal level (e.g., lower pressure, faster cooling rates) and is characterized by oxygen fugacity above the NNO buffer (Brigatti et al. 1996a), whereas peraluminous granites of Sardinia and Antarctica are the products of ultrametamorphism leading to anatexis of aluminous metasedimentary rocks in the continental crust (Brigatti et al. 2000a).
Figure 25b shows the interlayer separation vs. bulk rock Al content. Interlayer separation increases as the Al content of the rock decreases. This relationship is the structural parameter which better fits the Al rock content. The micas, for which data are shown in Figure 25b, come from different rock-types, but share a relationship of increas- ing Ti and Al with increasing bulk-rock Al. The decrease in the interlayer separation (Fig. 25b) is therefore related to the exchange vector [6](Mg,Fe)2+
-1 OH--2
[6]Ti4+ O-22 required to
achieve layer-charge neutrality. Bigi et al. (1993) described ferroan phlogopite and magnesian annite crystals from
mafic rocks occurring at different stratigraphic levels of the Ivrea-Verbano Mafic Complex (Western Alps, Northern Italy). They noted that some properties, such as poly-typism with different amounts of stacking disorder coexist in all samples and do not have a direct or simple petrological cause, whereas octahedral cation disorder in a crystal close to the contact with metasediments may suggest the incorporation of a restitic assemblage in the melt. The hotter melt may have preserved the mica (and other refractory minerals), but may have induced cation disorder of the octahedral sites. Similar results were found in the study on Fe3+-rich phlogopite from the Tapira alkaline carbonatitic complex (Brigatti et al. 1996a). The crystal-chemical features of these micas (mostly phlogopite-1M and tetra-ferriphlogopite-1M) are related to the variation of f(O2), a(H2O) and a(CO2), in addition to the magma composition during fractional crystallization and cumulus processes responsible for the generation of the rock sequence. In addition, the disorder in octahedral cation distribution agrees with field relationships and textural features which suggest crystallization at high crustal levels and a high cooling rate.

38 Brigatti & Guggenheim
Figure 25. (a) Compositional dependence of ⟨M(1)–O⟩ bond length in trioctahedral mica from Mg/(Mg+Fe) of the host rock; (b) dependence of interlayer separation from Al content in the host rock. Symbols: open squares = ferroan phlogopite and magnesian annite crystals from “Diorites” of Ivrea-Verbano Zone, Italy (Bigi et al. 1993); open circles = ferroan phlogopite crystals from synitic complex of Valle del Cervo, Northwestern Italy (Brigatti and Davoli 1990; Bigi and Brigatti 1994); crosses = magnesian annite from “UZ gabbros” of Ivrea Verbano Zone, Italy (Bigi et al. 1993); filled triangles up = ferroan phlogopite from monzonitic complex of Valle del Cervo, Nortwestern Italy (Brigatti and Davoli 1990); open diamonds = magnesian annite crystals from peraluminous granites of Sardinia Island (Italy) and Antarctica (Brigatti et al. 2000a); open triangles down = phlogopite, tetra-ferriphlogopite and ferroan phlogopite crystals from Tapira carbonatite complex, Brazil (Brigatti et al. 1996a).
The partition coefficients of major and trace elements between trioctahedral Mg-, Fe-rich micas and dioctahedral muscovite are a key to understanding thermodynamic relationships. In addition, the coefficients can lead to an understanding of detailed kinetics of anatexis of aluminous metasediments and the evolution of peraluminous granitic suites (De Albuquerque 1975; Tracy 1978; Speer 1984; Dymeck 1983; Monier and Robert 1986; Patiño Douce and Johnston 1991,1993; Icenhover and London 1995). The octahedral site intercrystalline partitioning between coexisting magnesian annite and muscovite was recognized as a good indicator of chemical processes during crystallization (Brigatti et al. 2000a). In peraluminous granites, the compositions of
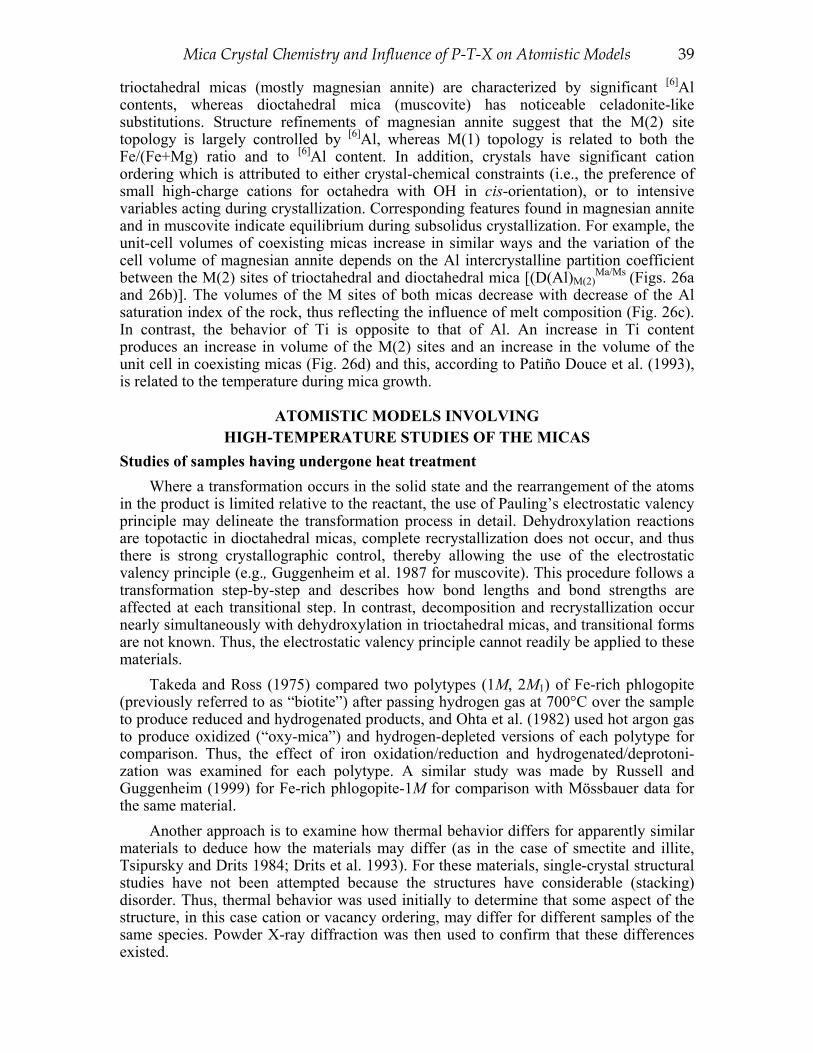
Mica Crystal Chemistry and Influence of P-T-X on Atomistic Models 39
trioctahedral micas (mostly magnesian annite) are characterized by significant [6]Al contents, whereas dioctahedral mica (muscovite) has noticeable celadonite-like substitutions. Structure refinements of magnesian annite suggest that the M(2) site topology is largely controlled by [6]Al, whereas M(1) topology is related to both the Fe/(Fe+Mg) ratio and to [6]Al content. In addition, crystals have significant cation ordering which is attributed to either crystal-chemical constraints (i.e., the preference of small high-charge cations for octahedra with OH in cis-orientation), or to intensive variables acting during crystallization. Corresponding features found in magnesian annite and in muscovite indicate equilibrium during subsolidus crystallization. For example, the unit-cell volumes of coexisting micas increase in similar ways and the variation of the cell volume of magnesian annite depends on the Al intercrystalline partition coefficient between the M(2) sites of trioctahedral and dioctahedral mica [(D(Al)M(2)
Ma/Ms (Figs. 26a and 26b)]. The volumes of the M sites of both micas decrease with decrease of the Al saturation index of the rock, thus reflecting the influence of melt composition (Fig. 26c). In contrast, the behavior of Ti is opposite to that of Al. An increase in Ti content produces an increase in volume of the M(2) sites and an increase in the volume of the unit cell in coexisting micas (Fig. 26d) and this, according to Patiño Douce et al. (1993), is related to the temperature during mica growth.
ATOMISTIC MODELS INVOLVING HIGH-TEMPERATURE STUDIES OF THE MICAS
Studies of samples having undergone heat treatment Where a transformation occurs in the solid state and the rearrangement of the atoms
in the product is limited relative to the reactant, the use of Pauling’s electrostatic valency principle may delineate the transformation process in detail. Dehydroxylation reactions are topotactic in dioctahedral micas, complete recrystallization does not occur, and thus there is strong crystallographic control, thereby allowing the use of the electrostatic valency principle (e.g., Guggenheim et al. 1987 for muscovite). This procedure follows a transformation step-by-step and describes how bond lengths and bond strengths are affected at each transitional step. In contrast, decomposition and recrystallization occur nearly simultaneously with dehydroxylation in trioctahedral micas, and transitional forms are not known. Thus, the electrostatic valency principle cannot readily be applied to these materials.
Takeda and Ross (1975) compared two polytypes (1M, 2M1) of Fe-rich phlogopite (previously referred to as “biotite”) after passing hydrogen gas at 700°C over the sample to produce reduced and hydrogenated products, and Ohta et al. (1982) used hot argon gas to produce oxidized (“oxy-mica”) and hydrogen-depleted versions of each polytype for comparison. Thus, the effect of iron oxidation/reduction and hydrogenated/deprotoni-zation was examined for each polytype. A similar study was made by Russell and Guggenheim (1999) for Fe-rich phlogopite-1M for comparison with Mössbauer data for the same material.
Another approach is to examine how thermal behavior differs for apparently similar materials to deduce how the materials may differ (as in the case of smectite and illite, Tsipursky and Drits 1984; Drits et al. 1993). For these materials, single-crystal structural studies have not been attempted because the structures have considerable (stacking) disorder. Thus, thermal behavior was used initially to determine that some aspect of the structure, in this case cation or vacancy ordering, may differ for different samples of the same species. Powder X-ray diffraction was then used to confirm that these differences existed.

40 Brigatti & Guggenheim
Figu
re
26.
Rel
atio
nshi
ps
betw
een
coex
istin
g m
agne
sian
an
nite
-1M
an
d m
usco
vite
-2M
1 cr
ysta
ls
in
pera
lum
inou
s gr
anite
s fr
om
Sard
inia
Is
land
an
d A
ntar
ctic
a (B
rigat
ti et
al
20
00a)
. (a
) un
it ce
ll vo
lum
e of
m
agne
sian
ann
ite v
s. un
it ce
ll vo
lum
e of
m
usco
vite
; (b
) m
agne
sian
an
nite
un
it ce
ll vo
lum
e vs
. D
(Al M
(2))M
a/M
s pa
rtitio
n co
effic
ient
s (A
l M(2
) =
Al
in
M(2
) si
tes;
M
a =
mag
nesi
an
anni
te;
Ms
mus
covi
te);
(c)
ratio
be
twee
n M
(1)
and
M(2
) si
te v
olum
es i
n m
agne
sian
an
nite
vs
. th
e A
l sa
tura
tion
inde
x (A
.S.I.
). of
the
ho
st r
ock;
(d)
Mus
covi
te c
ell
volu
me
vs.
the
M(2
) si
te
titan
ium
con
tent
of
mag
nesi
an
anni
te
and
mus
covi
te
(Ti M
a /
(Ti M
a +
TiM
s) (f
rom
Brig
atti
et
al. 2
000a
).

Mica Crystal Chemistry and Influence of P-T-X on Atomistic Models 41
Dehydroxylation process for dioctahedral phyllosilicates Bailey (1984b) described the general differences between the orientation of the O–H
vector between trioctahedral and dioctahedral micas. In trioctahedral micas where each of the three octahedral sites is occupied by the same cation, the O–H vector points nearly vertical to the (001) plane. In this way, the proton is nearly equidistant from the three octahedral cations, and thus, equidistant from the sources of the positive charges originating from the octahedral sheet. The interlayer cation sits directly above the OH group so that the proton is between the oxygen atom of the OH and the interlayer cation. Because they are of like charge, the interlayer cation and the proton interact (repulsion), but the repulsions are directed along the vertical to the (001) plane, thereby positioning the interlayer cation away from the proton and creating an increased separation between adjacent 2:1 layers. Hence, fluorine substitution for OH in trioctahedral micas produces a smaller interlayer separation and smaller c-axis dimension because the negatively charged F anion attracts, rather than repulses, the interlayer cation. This is also why F-rich trioctahedral micas generally have a greater thermal stability than a mica of equal composition, but F-poor.
Figure 27. Projection near the (001) plane to illustrate the relation between the interlayer cation (K), the (underlying) O-H vector, and the O(2) atom. Note that the hydrogen is closely associated with the K-O(2) bond. The K-O(2) bond is weaker than the other K-O bonds and weakens further at high temperature. Note also that the silicate ring is ditrigonal and not hexagonal.
In contrast to trioctahedral forms, dioctahedral micas with the vacant site located in the trans position (“trans-vacant” or “tv” 2:1 layers) have a relatively non-symmetric distribution of positive charges around the OH (Fig. 27). The O–H vector is directed away from the two occupied sites containing trivalent cations and points, in plan view, toward the vacant site. Thus, in muscovite, the O–H vector does not point directly toward the interlayer cation, and instead the proton is near the interlayer cation, K, and a bonded oxygen [K–O(2)] of the basal oxygen-atom plane. In muscovite (Rothbauer 1971), the O–H vector is inclined by 12° from the basal oxygen plane and, in plan, a straight line may be drawn from the oxygen of the OH group, through the proton, and to O(2). Of the three symmetry-unique nearest-neighbor K–O bond distances, Guggenheim et al. (1987) found that the K–O(2) bond distance is the longest at room temperature, and therefore, the weakest. At all elevated temperatures studied (to 650°C), this bond remains longer and increases in length at a faster rate than the other K–O bonds. The proximity of the proton to the K–O(2) bond and the rate at which this bond weakens at high temperatures suggest a preferred path for dehydroxylation, although the actual mechanism is not known. Dehydroxylation is not a result of destabilization of the structure owing to an increase in misfit between the tetrahedral and octahedral sheets at higher temperatures as was suggested by Hazen (1977), because the measured rotation angle, α, indicates that the tetrahedral and octahedral sheets mesh comfortably at temperatures to dehydroxylation.

42 Brigatti & Guggenheim
The initial process of dehydroxylation in dioctahedral micas remains problematic. In muscovite, Guggenheim et al. (1987) noted that the weakening of the K–O(2) bond with temperature is consistent with (i) the angular relationship of the O–H vector to K and O(2), and (ii) the O(2) atom deviating from the mean basal plane by an out-of-plane tetrahedral corrugation as measured by Δz (see above). Results from a high-temperature study of paragonite (see below) suggest that the weakening of the K–O(2) bond in muscovite is probably related to an increase in tetrahedral corrugation at high temperatures. Guggenheim et al. (1987) noted also that mean interatomic distances of the Al octahedral site do not vary greatly with temperature and that the Al–OH bond expands in a limited way (from 1.906 Å at 20°C to ∼1.918 Å at 650°C). However, the latter expansion is greater than the other Al–O bonds of the octahedra.
These results clearly indicate that the O–H bond does not weaken as a simple function of temperature below the dehydroxylation temperature. If the length of the O–H bond did expand, the charge on the oxygen atom would be affected (i.e., the proton, as it moves away from the oxygen atom, would cause undersaturation of the oxygen atom with respect to positive charge) and the Al–OH bond distance would be expected to either decrease or increase less rapidly than those of the other Al–O bonds. Drits (pers. comm.) suggested that the tetrahedral bridging and non-bridging bond lengths would be affected also, in accord with Bookin and Smoliar (1985), if the O–H bond weakens. It is possible that the O–H bond length is affected only at conditions immediately below the dehydroxylation event such that, at a critical temperature, the O–H bond of muscovite destabilizes with the formation of H2O molecules. This is consistent with the high-temperature study of Guggenheim et al. (1987). Other processes are possible and careful optical (infrared, etc.) studies at high temperature would be useful to obtain a better understanding. A potential problem of such studies, however, is that the dehydroxylation process does not appear to occur uniformly within a crystal, and the proton interactions are complex. Some of these interactions are discussed below.
Dehydroxylation, for example in muscovite, involves H2O loss, and not (OH)- or H2 loss alone. Therefore, it is likely that the OH group that destabilizes initially must attract the H+ from the adjacent OH group following the reaction: 2(OH) → H2O(↑) + Or. The remaining oxygen, Or, is referred to as the “residual” oxygen and remains in a muscovite-like dehydroxylate structure where the Al cations are in five-coordination (Fig. 28). This rearrangement, to maintain a “dioctahedral” configuration after H2O loss, distinguishes the dioctahedral micas from trioctahedral varieties, because there is insufficient room in trioctahedral micas for such an adjustment and recrystallization occurs upon dehydroxylation. The muscovite dehydroxylate structure and the corresponding dehy-droxylate of pyrophyllite were described by Udagawa et al. (1974) and Wardle and Brindley (1972), respectively.
In addition to comparing bond lengths as a measure of bond strength, the strength of an electrostatic bond (Pauling bond strength, PBS) is defined as the ratio of the valence, v, of the cation and the (first) coordination number, n. Guggenheim et al. (1987) used Pauling bond strengths and the second rule to examine the muscovite structure, the transitional forms by simulating structures by considering the loss of H2O groups one at time, and the dehydroxylate structure. More sophisticated models involving bond strengths and bond lengths are not suitable because these structures have not been refined and bond lengths are unavailable. Although OH groups are initially equal with respect to energy in muscovite and would be expected to respond to temperature in identical ways, the implication here is that dehydroxylation is temporal in that as H2O evolves, the structure changes to compensate for changes in charge distribution. Evidence for a non-homogeneous loss of H2O in dioctahedral 10-Å phyllosilicates was found by Heller-
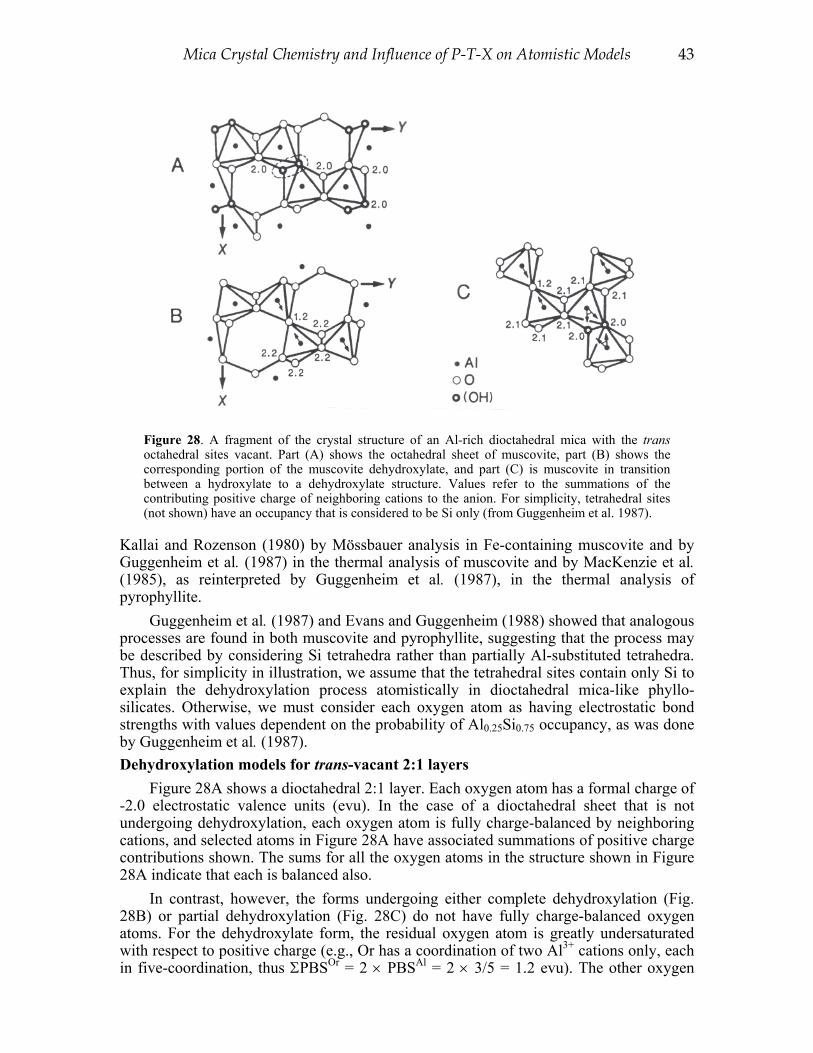
Mica Crystal Chemistry and Influence of P-T-X on Atomistic Models 43
Figure 28. A fragment of the crystal structure of an Al-rich dioctahedral mica with the trans octahedral sites vacant. Part (A) shows the octahedral sheet of muscovite, part (B) shows the corresponding portion of the muscovite dehydroxylate, and part (C) is muscovite in transition between a hydroxylate to a dehydroxylate structure. Values refer to the summations of the contributing positive charge of neighboring cations to the anion. For simplicity, tetrahedral sites (not shown) have an occupancy that is considered to be Si only (from Guggenheim et al. 1987).
Kallai and Rozenson (1980) by Mössbauer analysis in Fe-containing muscovite and by Guggenheim et al. (1987) in the thermal analysis of muscovite and by MacKenzie et al. (1985), as reinterpreted by Guggenheim et al. (1987), in the thermal analysis of pyrophyllite.
Guggenheim et al. (1987) and Evans and Guggenheim (1988) showed that analogous processes are found in both muscovite and pyrophyllite, suggesting that the process may be described by considering Si tetrahedra rather than partially Al-substituted tetrahedra. Thus, for simplicity in illustration, we assume that the tetrahedral sites contain only Si to explain the dehydroxylation process atomistically in dioctahedral mica-like phyllo-silicates. Otherwise, we must consider each oxygen atom as having electrostatic bond strengths with values dependent on the probability of Al0.25Si0.75 occupancy, as was done by Guggenheim et al. (1987). Dehydroxylation models for trans-vacant 2:1 layers
Figure 28A shows a dioctahedral 2:1 layer. Each oxygen atom has a formal charge of -2.0 electrostatic valence units (evu). In the case of a dioctahedral sheet that is not undergoing dehydroxylation, each oxygen atom is fully charge-balanced by neighboring cations, and selected atoms in Figure 28A have associated summations of positive charge contributions shown. The sums for all the oxygen atoms in the structure shown in Figure 28A indicate that each is balanced also.
In contrast, however, the forms undergoing either complete dehydroxylation (Fig. 28B) or partial dehydroxylation (Fig. 28C) do not have fully charge-balanced oxygen atoms. For the dehydroxylate form, the residual oxygen atom is greatly undersaturated with respect to positive charge (e.g., Or has a coordination of two Al3+ cations only, each in five-coordination, thus ΣPBSOr = 2 × PBSAl = 2 × 3/5 = 1.2 evu). The other oxygen

44 Brigatti & Guggenheim
atoms are each bonded to five-coordinated Al cations and one four-coordinated (Si4+) cation and thus are oversaturated at 2.2 evu (ΣPBSO = 2 × PBSAl + 1 × PBSSi = 1.2 + 4/4 = 2.2 evu). The arrow in Figure 28B emanating from the Al cations shows the resulting direction of movement of the Al cation away from the oversaturated oxygen atoms. This cation has a high positive charge (3+), which helps saturate the (undersaturated) Or atom.
The PBS involves only approximate electrostatic relationships and it is not an accurate measure of bond strength in comparison to bond length. However, the anticipated movement of the Al toward the Or atom will produce a stronger Al–Or bond based on the bond length and the simultaneous movement away from the oversaturated oxygen atoms produce weaker Al–O bonds.
Figure 28C shows a partially dehydroxylated form where some aluminum cations are in five coordination and others are in six coordination. In the latter case, the distribution of oversaturated oxygen atoms (labeled 2.1 evu) are such that the direction of anticipated Al movement (note arrows) is toward the OH group and away from the oversaturated oxygen atoms. Moving a charged atom closer to an OH group that is balanced (at 2.0 evu for the oxygen atom of the OH) must result in a readjustment which, in this case, requires the H+ ion to move further away from its oxygen-atom neighbor, thereby weakening the O–H bond. Aines and Rossman (1985) and Gaines and Vedder (1964) showed that heating of muscovite produces a shift to lower wave numbers for the O–H stretching frequency, indicating an overall weakening of the O–H bond during dehydroxylation over the average structure of the crystal. Thermal analysis (TGA, DTA, DTG) curves are consistent with the model in that dehydroxylation does not occur homogeneously throughout the sample. Thus, dehydroxylation initially occurs relatively rapidly. However, as some OH groups are lost and sections of the structure contain five-coordinated Al cations, the remaining OH groups become more tightly bound as Al–OH bonds strengthen, thereby slowing further dehydroxylation. As temperature increases, the number of five-coordinated Al atoms increases to a point where the Al–OH bonds have all been affected and dehydroxylation proceeds rapidly again. The model predicts that there is a bimodal loss of H2O involving dehydroxylation and the temperature interval will be large, as is observed (Fig. 29). Because the thermal energy required to produce dehydroxylation changes with variations in the bond strength during the process, the area under the curve of the DTA (or DTG) cannot be used as an estimate of the number of OH groups involved in either of the two distributions.
Mazzucato et al. (1999) examined the kinetics of muscovite dehydroxylation by in situ powder X-ray diffraction. They found that the results were compatible with the above structural model and followed a multi-step process where (i) two adjacent OH groups form a H2O molecule within the octahedral sheet, followed by (ii) diffusion along the c* axis through the six-fold silicate ring (Rouxhet 1970), and then (iii) diffusion of H2O in the interlayer to the crystal surface. The rate limiting step is step (ii). However, this study is consistent with Heller-Kallai and Rozenson (1980), who advocated nonhomogenous loss of H2O (see above), and Kalinichenco et al. (1997), who suggested a continuous nucleation process. Dehydroxylation models for cis-vacant 2:1 layers
Guggenheim and co-workers considered only trans-vacant dioctahedral micas in the dehydroxylation process. The possibility of dioctahedral 2:1 layers with the vacant site located in the cis position (“cis-vacant” or “cv” 2:1 layers) had been suggested for mont-morillonite and other dioctahedral smectites (e.g., Méring and Glaeser 1954; Méring and Oberlin 1971; Besson 1980; Besson et al. 1982; Drits et al. 1984; Tsipursky and Drits 1984). Although most illite consist of trans-vacant layers, Zvyagin et al. (1985), Drits et al. (1993), and Reynolds and Thompson (1993) described illites with cis-vacant sites.

Mica Crystal Chemistry and Influence of P-T-X on Atomistic Models 45
Figure 29. Thermal analysis curves [thermal gravimetric analysis (DTA) and derivative thermal gravimetric (DTG)] of muscovite (A) and pyrophyllite (B) showing two thermal analysis events in each phase. See text for discussion (from Guggenheim et al. 1987).
The postulated configuration (Drits et al. 1995) of the cis-vacant 2:1 layer is shown in Figure 30. In this configuration, the shared edge between any two Al-containing octahedra is either two oxygen atoms or an oxygen atom and a hydroxyl group. This differs significantly from the configuration involving the trans-vacant site by both the position of the vacancy and the shared edge between Al octahedra which consists of either two oxygen atoms or two hydroxyl groups. Dehydroxylation is still expected to involve adjacent OH groups, so that a residual oxygen atom is retained in the structure and one oxygen atom and two hydrogen atoms are liberated (= H2O).
For a cis-vacant 2:1 layer, dehydroxylation produces a structure where there is a five-coordinated Al(2) site, with one Or atom and four additional oxygen atoms, and an octahedral site [Al(2)] in trans-orientation with respect to Or (Fig. 31). Pauling’s electrostatic valency rule may be used to predict how the structure responds to dehydroxylation. As before, the tetrahedral sites may be assumed to contain only Si. Figure 31 shows the postulated structure with each oxygen atom labeled with the sum of the bond strengths that reach the atom from the neighboring cations (including the Si cations, which are not shown). Al(2) cations are surrounded by oversaturated oxygen atoms, except for one very undersaturated Or. Thus, it is expected that the position of this cation will be further away from the oversaturated oxygen atoms and closer to the residual oxygen atom.
In contrast, the Al(1) cation is located in a very distorted and large site with two opposing under-saturated residual oxygen atoms, and this arrangement is inherently unstable. To compensate, the Al cation positions itself closer to one of the residual oxygen atoms (illustrated in Fig. 31 as the upper Or). Thus, each Or is partly

46 Brigatti & Guggenheim
Figure 30 (left). The octahedral sheet of an Al-rich dioctahedral mica with the cis octahedral sites vacant (after Drits et al. 1995). Figure 31 (right). The structural model of a cis-vacant Al-rich octahedral sheet after initial heating. The OH groups have been lost and a residual O atom remains. Compare this figure to Figure 30. Al(1) atom is located in a very distorted octahedral site, and this atom will readjust its position to a structure as depicted in Figure 32 (after Drits et al. 1995).
compensated by an adjacent Al(1) and the resultant nearest neighbor arrangement around Al(1) becomes five-coordinated (Fig. 32). Drits et al. (1995) noted that the movement of Al(1) toward Or also requires a closer approach to O(5), which is destabilizing. They suggested that this structure (Fig. 32) transforms to the trans-vacant dehydroxylated structure (Fig. 28) with increasing temperature by the migration of Al(1) to the vacant site depicted in Figure 32.
The models as presented in Figures 28 and 32 are significantly different and thus they have unique diffraction patterns and different a and b cell parameters. Drits et al. (1995) considered several dioctahedral cis-vacant phyllosilicates, including illite and montmorillonite. In montmorillonite, the b value initially increases with increasing temperature, but decreases from 500 to ~650°C, after which it again increases with increasing temperature. The decrease in the b value is related to the change in structure illustrated from Figure 31 to Figure 32. Drits et al. (1995) suggested that the interlayer cation prevents tetrahedral rotation in illite, but because montmorillonite does not have an interlayer cation that resides within the silicate ring, tetrahedral rotation is not inhibited. Thus, unlike cis-vacant illite, the lateral dimensions in cis-vacant montmorillonite can decrease, and cis-vacant montmorillonite can more easily adjust to dehydroxylation than

Mica Crystal Chemistry and Influence of P-T-X on Atomistic Models 47
Figure 32. The Al(1) atom has move closer to the residual oxygen atom and the octahedral coordination of Al(1) (Fig. 31) becomes five-coordinated. As tempera-ture increases, Al(1) moves to the vacant site (note arrow) and the structure becomes trans vacant.
cis-vacant illite. At temperatures greater than ~ 700°C, both cis-vacant illite and cis-vacant montmorillonite transform to the model shown in Figure 28 (derived from the dehydroxylation of the trans-vacant dioctahedral phyllosilicate) by the migration of Al(1) of Figure 32 into the vacant site.
Drits et al. (1995) argued that although crystallinity and particle size effects are important considerations for the dehydroxylation temperatures for illite and montmorillonite, these effects do not explain why cis-vacant forms dehydroxylate at higher temperatures (by 150-200°C) than trans-vacant forms. Drits et al. (1995) suggested that one possible reason involves “the probability for hydrogen to jump to the nearest OH group to form a water molecule strongly depends on the distance between the adjacent OH groups. The shorter the distance, the lesser the thermal energy required for the dehydroxylation of OH pairs”. Studies involving electrostatic modeling would be useful to relate how the proximity between adjacent OH pairs affects the path the proton must travel to form an H2O molecule.
A thermodynamic assessment for aluminum-rich cis-vacant and trans-vacant dehydroxylation reactions is useful. Figure 33 shows a schematic reaction path for both reactions with respect to temperature. The low-temperature, cis-vacant hydroxyl-rich form (phase a) appears to have a greater thermal stability than the corresponding trans-vacant form (phase b). The trans-vacant dehydroxylate structure (c) is the end product in Figure 33 for both reactions, and this phase appears also to have a different thermal stability for the two reaction series.

48 Brigatti & Guggenheim
Temperature increasing → Figure 33. A schematic showing two reactions, A and B, with apparent stability fields with respect to temperature. Reaction A involves phase (a), which is cis-vacant, and Reaction B involves a trans-vacant reactant, (b). Reaction A produces a transition phase, a’, that is OH poor before transforming to a trans-vacant dehydroxylate, phase (c). Reaction B transforms directly to phase (c). Phase (c) appears to have two different thermal “stability” ranges depending on the reaction involved, which is a clear indication that kinetic effects are important in determining where the transformation to phase (c) occurs. Likewise, the upper temperature limits for phase (a) and phase (b) are not related to stability, but must be related to kinetic effects. Note that Pauling bond strength calculations for the residual oxygen atom (note the values, in evu, at the top right corner above each box) are consistent with decreasing PBS at elevated temperatures.
Muller et al. (2000c) showed that rehydroxylated illite consisted of only trans-vacant layers, regardless of the nature of the starting material. Thus, reaction B involves a (metastable) equilibrium reaction phase b → phase c, which is reversible. In contrast, reaction A has not been reversed, suggesting that if this is an equilibrium reaction, a significant kinetic barrier prevents a reversal. Thus, the different temperatures for phase a → phase a’ and phase b → phase c are a consequence of resultant processes where the two forms (a and b) follow separate paths to phase c. This may be the reason why there is a significant difference in thermal stability for phase c for reaction A vs. reaction B. The reaction series for reaction A and reaction B must follow a structural pathway consistent with Pauling’s second rule. Note that increasing temperature produces structures where the charge on the residual oxygen atom (Fig. 33) deviates from 2.0 by greater amounts with increasing temperature for each structure in a given series.
The situation differs, however, for dioctahedral micas containing significant amounts of divalent cations, and this would be expected, considering the differences in composition. Tsipursky et al. (1985) inferred that dehydroxylation of celadonite and glauconite is accompanied by cation migration from cis to trans sites, with cation migration occurring if Fe is greater than Al. For celadonite, Muller et al. (2000a) found that trans-vacant layers are transformed to cis-vacant layers upon dehydroxylation and both types of layers exist upon rehydration (at 80% cis-vacant, 20% trans-vacant). The transformation involves cation migration and several intermediate structures (see below). For the glauconite sample studied, which had a significant amount of octahedral aluminum, the trans-vacant layers were transformed to cis-vacant layers by dehydroxylation and then to trans-vacant layers upon rehydroxylation.
Muller et al. (2000b) suggested that the dehydroxylated structure of Fe- and Mg-bearing dioctahedral micas contains structural fragments with different cation occupancy within the same layer, with each fragment being dioctahedral. In a study using selected-area electron diffraction, Muller et al. (2000c) found that at near 650°C, Mg preferentially migrates unequally to trans sites, after which it remains fixed. After Mg
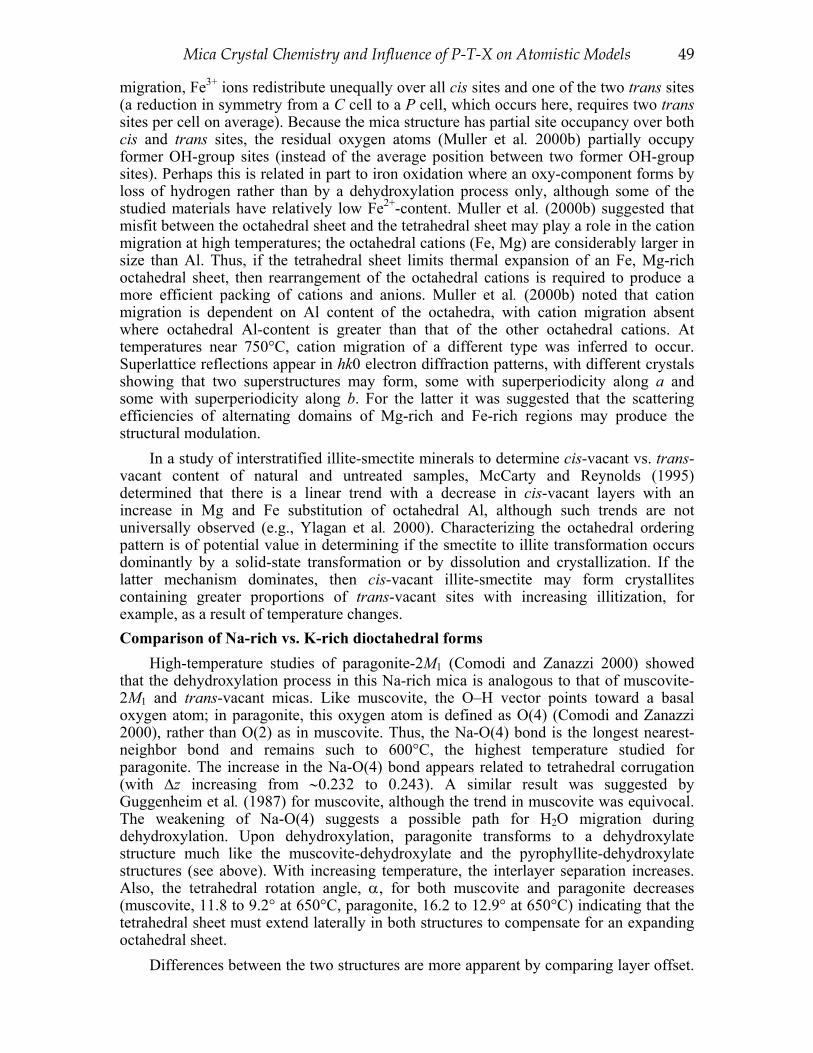
Mica Crystal Chemistry and Influence of P-T-X on Atomistic Models 49
migration, Fe3+ ions redistribute unequally over all cis sites and one of the two trans sites (a reduction in symmetry from a C cell to a P cell, which occurs here, requires two trans sites per cell on average). Because the mica structure has partial site occupancy over both cis and trans sites, the residual oxygen atoms (Muller et al. 2000b) partially occupy former OH-group sites (instead of the average position between two former OH-group sites). Perhaps this is related in part to iron oxidation where an oxy-component forms by loss of hydrogen rather than by a dehydroxylation process only, although some of the studied materials have relatively low Fe2+-content. Muller et al. (2000b) suggested that misfit between the octahedral sheet and the tetrahedral sheet may play a role in the cation migration at high temperatures; the octahedral cations (Fe, Mg) are considerably larger in size than Al. Thus, if the tetrahedral sheet limits thermal expansion of an Fe, Mg-rich octahedral sheet, then rearrangement of the octahedral cations is required to produce a more efficient packing of cations and anions. Muller et al. (2000b) noted that cation migration is dependent on Al content of the octahedra, with cation migration absent where octahedral Al-content is greater than that of the other octahedral cations. At temperatures near 750°C, cation migration of a different type was inferred to occur. Superlattice reflections appear in hk0 electron diffraction patterns, with different crystals showing that two superstructures may form, some with superperiodicity along a and some with superperiodicity along b. For the latter it was suggested that the scattering efficiencies of alternating domains of Mg-rich and Fe-rich regions may produce the structural modulation.
In a study of interstratified illite-smectite minerals to determine cis-vacant vs. trans-vacant content of natural and untreated samples, McCarty and Reynolds (1995) determined that there is a linear trend with a decrease in cis-vacant layers with an increase in Mg and Fe substitution of octahedral Al, although such trends are not universally observed (e.g., Ylagan et al. 2000). Characterizing the octahedral ordering pattern is of potential value in determining if the smectite to illite transformation occurs dominantly by a solid-state transformation or by dissolution and crystallization. If the latter mechanism dominates, then cis-vacant illite-smectite may form crystallites containing greater proportions of trans-vacant sites with increasing illitization, for example, as a result of temperature changes. Comparison of Na-rich vs. K-rich dioctahedral forms
High-temperature studies of paragonite-2M1 (Comodi and Zanazzi 2000) showed that the dehydroxylation process in this Na-rich mica is analogous to that of muscovite-2M1 and trans-vacant micas. Like muscovite, the O–H vector points toward a basal oxygen atom; in paragonite, this oxygen atom is defined as O(4) (Comodi and Zanazzi 2000), rather than O(2) as in muscovite. Thus, the Na-O(4) bond is the longest nearest-neighbor bond and remains such to 600°C, the highest temperature studied for paragonite. The increase in the Na-O(4) bond appears related to tetrahedral corrugation (with Δz increasing from ∼0.232 to 0.243). A similar result was suggested by Guggenheim et al. (1987) for muscovite, although the trend in muscovite was equivocal. The weakening of Na-O(4) suggests a possible path for H2O migration during dehydroxylation. Upon dehydroxylation, paragonite transforms to a dehydroxylate structure much like the muscovite-dehydroxylate and the pyrophyllite-dehydroxylate structures (see above). With increasing temperature, the interlayer separation increases. Also, the tetrahedral rotation angle, α, for both muscovite and paragonite decreases (muscovite, 11.8 to 9.2° at 650°C, paragonite, 16.2 to 12.9° at 650°C) indicating that the tetrahedral sheet must extend laterally in both structures to compensate for an expanding octahedral sheet.
Differences between the two structures are more apparent by comparing layer offset.

50 Brigatti & Guggenheim
Lin and Bailey (1984), in a study of the room-temperature structure of paragonite-2M1, noted that the large layer offset in paragonite in comparison to that in muscovite is related to both the smaller size of Na relative to K and the corrugation of the basal oxygen-atom surfaces owing to tetrahedral tilting around the vacant M(1) site. The tetrahedral tilting places the O(3) basal oxygen atoms of adjacent layers in paragonite close to each other, thereby producing repulsion that causes a layer offset. The high-temperature study of Comodi and Zanazzi (2000) appears to confirm this explanation because the corrugation of the basal oxygen atoms, Δz, increases at higher temperatures and produces a greater layer offset. In contrast, the K in muscovite is much larger than Na in paragonite and the adjacent 2:1 layers are sufficiently separated so that O(3)-O(3) repulsions are minimized. Heat-treated trioctahedral samples: the O,OH,F site and in situ high-temperature studies
Takeda and Morosin (1975) obtained cell dimensions to 802°C and refined the crystal structure of a synthetic F-rich phlogopite-1M at 700°C. They developed a model involving misfit between the octahedral and tetrahedral sheets to explain thermal decomposition. In this model, the octahedral sheet expands at high temperature and the tetrahedral sheet responds to this expansion by becoming more hexagonal in symmetry (i.e., the tetrahedral rotation angle, α, approaches zero) because the apparent size of the individual tetrahedra does not expand commensurately. Takeda and Morosin (1975) stated that thermal decomposition resulted from loss of contact of the anions around the interlayer cations as α approaches zero. Hazen (1977) suggested that misfit and the lack of congruency between the tetrahedral and octahedral sheets results in decomposition as a general mechanism. However, this general mechanism has since been discredited by Guggenheim et al. (1987), although it may apply for certain unusual compositions. Toraya (1981) noted that a fully extended tetrahedral sheet may not be the only condition for establishing an upper-temperature limit before decomposition, and he also discussed how octahedra may change in size and shape in response to thermal effects.
Russell and Guggenheim (1999) studied a near-OH end-member, natural phlogopite-1M crystal to 600°C and found that the K–O bond distances increased similarly with increasing temperature. In trioctahedral micas where each octahedral site is similarly occupied and the O–H vector points along the [001] toward the interlayer cation, all the K–O bond distances would be expected to lengthen as the proton moves away from the oxygen atom of the OH group (owing to H+ to K+ repulsions). Thus, it is not apparent from a structural analysis how dehydroxylation is initiated. Dehydroxylation in phlogopite, however, is consistent with generally higher thermal stabilities for F-rich trioctahedral micas compared to OH-rich trioctahedral micas of otherwise similar compositions.
Comparison of the F vs. OH end-member phlogopite structures at high temperatures showed that the effect of this substitution produced different modes of octahedral expansion with increasing temperature. For F-rich octahedra, Takeda and Morosin (1975) found that the octahedra become elongate parallel to the c axis above 400°C and there is a change in thermal expansion for each cell parameter (a, b, or c) at this temperature. In contrast, although the OH-rich octahedra are larger at elevated temperatures, these octahedra do not change shape, and there is no change in the rate of linear expansion of the cell parameters (Russell and Guggenheim 1999). The attractive forces between K+ and F- and the repulsive forces between K+ and H+ affect the interlayer K octahedron for these two phases: in accordance, the K–O octahedron in phlogopite is elongate parallel to c*, but in fluorophlogopite the octahedron is compressed along c*. The octahedral distortions for both the Mg-rich octahedra and the K-rich octahedron attributed by Russell and Guggenheim (1999) to the difference in composition between the OH-rich

Mica Crystal Chemistry and Influence of P-T-X on Atomistic Models 51
vs. F-rich site assumes that the substitutions of Na, Al and Fe in the natural sample (K0.82Na0.115)Σ= 0.935(Mg2.28Al0.495Fe0.12)Σ=2.895 do not greatly affect the results. Heat-treated trioctahedral samples: polytype comparisons
The location and influence of the proton in micas is important in understanding how mica structures alter (e.g., Bassett 1960; Norrish 1973), the formation of mica polytypes (e.g., Takéuchi 1965), and thermal decomposition (e.g., Guggenheim et al. 1987). Mica-polytype derivations and descriptions are included in detail elsewhere in this volume. However, heat-treatment studies have been useful in understanding the influence of the OH site on mica polytypes. These studies have involved structure determinations of iron-bearing phlogopite (“biotite”) that have been reduced (“hydroxy” component with Fe2+ production) or oxidized (“oxy” component with Fe3+ production), so that the “OH” site may or may not contain H+, respectively. Using samples heated under hydrogen for an unreported period at 700°C, Takeda and Ross (1975) studied 1M and 2M1 polytypes of similar compositions to determine the effect of stacking on atom positions. They found that adjacent layers exert an influence on the 2:1 layer and that two oxygen atoms associated with the octahedra are displaced in the 2M1 polytype relative to the 1M polytype within the (001) plane. This causes the octahedra to have a deformation that results in variations in the octahedral bond distances (some longer and some shorter than most octahedra). In a follow-up study using similar material from the same locality but with treatment by hot argon gas (oxy-micas), Ohta et al. (1982) found that the interlayer separation increased significantly for the hydrogenated material relative to the oxy-mica; this is caused by H+ to K+ repulsions. Ohta et al. (1982) found also that for both polytypes, Fe was incorporated in the tetrahedral sites upon oxidation. In contrast, in a study involving heat-treatment and oxidation, Russell and Guggenheim (1999) did not find a change in tetrahedral-site occupancy by oxidation and heat-treatment, although they did find results similar to those of Ohta et al. (1982). Russell and Guggenheim suggested that the apparent change in the tetrahedral site occupancy as found by Ohta et al. (1982) was a result of using crystals of different starting composition.
ACKNOWLEDGMENTS We thank V.A. Drits for comments on an early version of this manuscript and D.R.
Peacor and G. Ferraris for comments on the final version. Special thanks to Marco Poppi for helping in deriving models of mica crystal chemistry. Partial support for this work was made possible by the donors of The Petroleum Research Fund, administered by The American Chemical Society, under grant PRF-32858-AC5 and by the U.S. National Science Foundation, under grant #EAR-0001122. We also thank the Italian MURST (project “Layer silicates: Crystal chemical, structural and petrological aspects”) and the CNR for financial support.

52 Brigatti & Guggenheim
APPENDIX I: DERIVATIONS This section shows the derivation of some formulae reported in the text.
Derivation of “tetrahedral cation displacement”, Tdisp.
Figure A1. Geometrical considerations to derive Tdisp. T represents the tetrahedral cation, the three Obasal atoms define the basal oxygen-atom plane and Oapical repre-sents the oxygen atom of the tetrahedral apex. Oapical–H is the height of the tetrahedron.
The variable Tdisp. is the displacement of the tetrahedral cation from its ideal position (i.e., from the center of mass of the tetrahedron). In a tetrahedron (Fig. A1), the center of mass divides the tetrahedral height (Oapical–H) into two parts. The part containing the vertex (T–Oapical) is three times larger than the distance of the tetrahedral (T) cation from the basal oxygen-atom plane (T - H). In the above formula the part under square root is T-H. Using The Pythagorean theorem and assuming that all Obasal–Obasal edges are equal, we obtain:
Obasal − H( )=23
32
⋅ Obasal − O basal( )⎛
⎝ ⎜
⎞
⎠ ⎟
By equating the two latter relations:
T − H( ) = T − O basal( )2−
13
⋅ O basal − O basal( )2
For a regular tetrahedron:
T − H( ) = T− Oapical( ) 3
Thus, for a regular tetrahedron Tdisp. is zero. If the tetrahedral cation shifts from the center of mass of the tetrahedron Tdisp. differs from zero and relates to the modulus of the shift. Derivation of ΔE1, ΔE2, ΔE3
ΔE1 =−3 ⋅qT
dTπOb−
−9⋅ qT
T − Oapical
⎛
⎝ ⎜
⎞
⎠ ⎟
ΔE3 =
q T2
IS + 2 ⋅dTπOb−
qT2
IS + 2 / 3 ⋅ T − Oapical( )⎛
⎝ ⎜ ⎜
⎞
⎠ ⎟ ⎟
ΔE 2 =qT ⋅ qA / 4( )
IS / 2 + d TπOb( )2 + Oapical − Oapical2
⎛
⎝
⎜ ⎜ ⎜
⎞
⎠
⎟ ⎟ ⎟
−q T ⋅ q A / 4( )
IS / 2 + T − Oapical( )/ 3( )2+ Oapical − Oapical
2
⎛
⎝
⎜ ⎜ ⎜
⎞
⎠
⎟ ⎟ ⎟
( ) ( )3
)O(T
3OO
O T ) A ( T apical2
basal2b a sa ld isp .
−−
− − − =

Mica Crystal Chemistry and Influence of P-T-X on Atomistic Models 53
The “asymmetric unit” and charge distribution produces a pattern of charge as shown in Figure 9 (see text). The electrostatic energy (E) associated with two charged atoms is directly proportiol to the product of charges (Q) and inversely proportional to the distance (d12) between atoms (1,2). The energy E can be estimated as E = ηQ1 × Q2 d12, where η is a constant set equal to 1 (Coulomb’s law).
Energy E1 is the electrostatic interaction between the tetrahedral cation and the basal oxygen atoms. Each oxygen atom contributes −1 × q t dpob where -1 is the formal oxygen-atom charge (i.e., the charge of the basal oxygen atom divided by the number of nearest neighbor tetrahedral cations, qt is the tetrahedral-cation charge, and dpob is the distance between the tetrahedral cation and the basal oxygen atom. ΔE1 represents the difference between the E1 calculated for the configuration vs. an ideal configuaration. The ideal configuration occurs where the position of the tetrahedral cation is located in the center of mass of the tetrahedron [ i.e., dTπOb is substituted by (T-Oapical)/3 ]. Thus, for a regular tetrahedron, ΔE1 is equal to zero. If the tetrahedron is distorted, ΔE1 differs from zero and increases (in absolute value) as the tetrahedral cation shifts from the center of mass of the tetrahedron. ΔE2, ΔE3 can be calculated similarly.
E2 is the electrostatic interaction between the tetrahedral cation and the interlayer cation. Each tetrahedral cation interacts with three neighboring interlayer cations (contributions from more distant interlayer cations are omitted). Each interlayer cation contributes
qT ⋅ q A / 12( )IS / 2 + d TπOb( )2
+ Oapical − Oapical( )2
where each interlayer cation is surrounded by 12 tetrahedral cations and the term involving the square root is the distance between the interlayer cation and the tetrahedral cation). An expression for ΔE2 is obtained similarly to ΔE1 (i.e., substi-tuting in the second term (T-Oapical)/3 for dTπOb).
E3 is the electrostatic interaction between two opposing tetrahedral cations (the influence of additional surrounding tetrahedral cations is omitted). The atoms involved here have the same charge (qT). The product of the charges ( 2
Tq ) is thus divided by the distance between atoms (as for E1 and E2). ΔE3 is obtained the same way as ΔE1 and ΔE2. Derivation of α
α = tan−1 1 / 3 + k ⋅ 4 / 3 − k2
k 2 − 1
⎛
⎝ ⎜
⎞
⎠ ⎟ − 60 or α = cos −1 3
2⋅k
⎛
⎝ ⎜
⎞
⎠ ⎟
The following assumptions are made:(1) The hexagonal ring distorts by varying the internal-angle value from 120° by an amount of either +2α or -2α alternating around the ring. (2) Symmetry plane is present. (3) Each tetrahedron is rigid (i.e., with constant tetrahedral edges and with each tetrahedral oxygen atom and with each tetrahedral cation occupying ideal positions).
Thus tetrahedral and octahedral coordinates for the basal and apical oxygen atoms in a (001) plane (Fig. A2) may be written. From this, as expression for k as a function of α, can be obtained
k =3
3⋅
3 ⋅cos 60 + α180
⋅π⎛ ⎝ ⎜ ⎞
⎠ ⎟ ⋅sin α − 60180
⋅π⎛ ⎝ ⎜ ⎞
⎠ ⎟ + cos 60 + α180
⋅ π⎛ ⎝ ⎜ ⎞
⎠ ⎟ ⋅cos α180
⋅π⎛ ⎝ ⎜ ⎞
⎠ ⎟ + 2 − cos α − 60180
⋅π⎛ ⎝ ⎜ ⎞
⎠ ⎟ 2
+ cos α180
⋅ π⎛ ⎝ ⎜ ⎞
⎠ ⎟ 2
+
+ 3 ⋅sin 60 + α180
⋅π⎛ ⎝ ⎜ ⎞
⎠ ⎟ ⋅cos 60 + α180
⋅π⎛ ⎝ ⎜ ⎞
⎠ ⎟ + 3 ⋅sin 60 + α180
⋅π⎛ ⎝ ⎜ ⎞
⎠ ⎟ ⋅cos α180
⋅ π⎛ ⎝ ⎜ ⎞
⎠ ⎟ + sin α − 60180
⋅π⎛ ⎝ ⎜ ⎞
⎠ ⎟ ⋅sin 60 + α180
⋅π⎛ ⎝ ⎜ ⎞
⎠ ⎟
and simplifying:
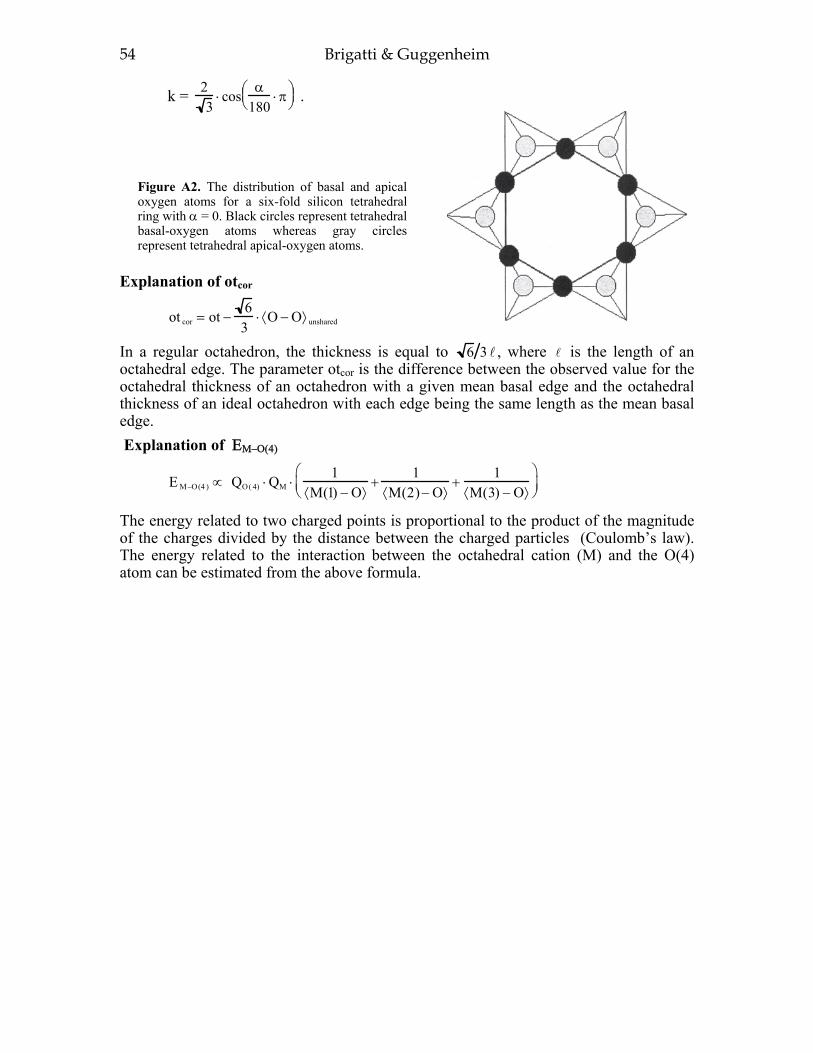
54 Brigatti & Guggenheim
k = 23
⋅cos α180
⋅π⎛ ⎝ ⎜ ⎞
⎠ ⎟ .
Figure A2. The distribution of basal and apical oxygen atoms for a six-fold silicon tetrahedral ring with α = 0. Black circles represent tetrahedral basal-oxygen atoms whereas gray circles represent tetrahedral apical-oxygen atoms.
Explanation of otcor
ot cor = ot −6
3⋅ ⟨O − O⟩ unshared
In a regular octahedron, the thickness is equal to 6 3 l , where l is the length of an octahedral edge. The parameter otcor is the difference between the observed value for the octahedral thickness of an octahedron with a given mean basal edge and the octahedral thickness of an ideal octahedron with each edge being the same length as the mean basal edge. Explanation of ΕΜ−Ο(4)
E M−O(4 ) ∝ QO( 4) ⋅QM ⋅1
⟨M(1) − O⟩+
1⟨M(2) − O⟩
+1
⟨M(3) − O⟩⎛ ⎝ ⎜
⎞ ⎠ ⎟
The energy related to two charged points is proportional to the product of the magnitude of the charges divided by the distance between the charged particles (Coulomb’s law). The energy related to the interaction between the octahedral cation (M) and the O(4) atom can be estimated from the above formula.

Mica Crystal Chemistry and Influence of P-T-X on Atomistic Models 55
APPENDIX II: TABLES 1-4 TABLE 1. STRUCTURAL DETAILS OF TRIOCTAHEDRAL TRUE MICAS

56 Brigatt i & Guggenheim
Cell parameters R
Reference (sample number)
Species, locality Rock type Composition A
(Å)
b
(Å)
c
(Å) (°) (%)
1. Alietti et al. 1995 (n # 1a)
Phlogopite, Mt. Monzoni (Italy)
Skarn (K0.93Na0.04) (Al0.24Fe3+0.09 Fe2+
0.12 Mg2.48Mn0.01Ti0.02) (Si2.74Al1.26)O9.99 F0.06 (OH)1.95
5.306(1) 9.195(3) 10.272(3) 100.01(2) 2.9
2. Alietti et al. 1995 (n # 1b)
Phlogopite, Mt. Monzoni (Italy)
Skarn (K0.93Na0.04) (Al0.24Fe3+0.07 Fe2+
0.11 Mg2.55Mn0.01Ti0.02) (Si2.65Al1.35)O9.96 F0.09 (OH)1.95
5.309(2) 9.180(5) 10.291(4) 100.00(4) 2.8
3. Alietti et al. 1995 (n # 2a)
Phlogopite, Mt. Monzoni (Italy)
Skarn (K0.95Na0.02Ba0.01) (Al0.18Fe3+0.15
Fe2+0.03Mg2.63Ti0.01) (Si2.60Al1.40)
O9.93 F0.11 (OH)1.96
5.305(2) 9.189(3) 10.286(3) 99.96(2) 2.9
4. Alietti et al. 1995 (n # 3a)
Aluminian phlogopite Mt. Monzoni (Italy)
Skarn (K0.95Na0.02Ba0.01) (Al0.47Fe3+0.15
Fe2+0.07Mg2.23Mn0.04 Ti0.01) (Si2.50
Al1.50) O10.02 F0.04 (OH)1.94
5.299(1) 9.179(2) 10.279(3) 99.90(2) 3.0
5. Alietti et al. 1995 (n # 4a)
Phlogopite, Mt. Monzoni (Italy)
Skarn (K0.90Na0.02Ba0.02Ca0.02) (Al0.20Fe3+
0.11Fe2+0.04 Mg2.64Mn0.01)
(Si2.60Al1.40) O9.92 F0.06 (OH)2.02
5.307(2) 9.199(2) 10.291(2) 99.89(2) 2.5
6. Bigi and Brigatti 1994 (n # M7)
Ferroan phlogopite, Valle Cervo (Italy)
Syenite (Na0.02K0.95) (Al0.05Fe3+0.50 Fe2+
0.70 Mg1.54Mn0.02Ti0.20) (Si2.81Al1.19)O10.73 (OH)1.27
5.335(2) 9.244(2) 10.206(3) 100.08(2) 3.3
7. Bigi et al. 1993 (n # MP9)
Magnesian annite, Ivrea (Italy)
Gabbro (Na0.02K0.81Ba0.10) (Fe2+1.05 Mg0.92
Mn0.01Ti0.67) (Si2.50Al1.37 Fe0.13)O9.99 F0.06 (OH)1.95
5.349(2) 9.244(6) 10.132(7) 100.38(4) 3.1
8. Brigatti and Davoli 1990 (n # M14)
Ferroan phlogopite, Valle Cervo (Italy)
Monzonite (K0.90Na0.03) (Fe3+0.45Fe2+
0.79 Mg1.43Mn0.01Ti0.23 Li0.01) (Si2.78
Al1.19 Fe3+0.03) O10.44 Cl0.04 (OH)1.52
5.343(3) 9.258(1) 10.227(2) 100.26(2) 3.3
9. Brigatti and Davoli 1990 (n # M32)
Ferroan phlogopite, Valle Cervo (Italy)
Syenite (K0.92Na0.01Ca0.01) (Al0.01Fe3+0.46
Fe2+0.71Mg1.50Mn0.03 Ti0.15Li0.01)
(Si2.80Al1.20) O10.25 Cl0.02 (OH)1.73
5.346(2) 9.252(2) 10.238(4) 100.02(3) 2.4
10. Brigatti and Davoli 1990 (n # M62)
Ferroan phlogopite, Valle Cervo (Italy)
Granite-monzo-nite transition
(K0.94Na0.02) (Al0.05 Fe3+0.39 Fe2+
0.95 Mg1.35Mn0.03Ti0.20 Li0.01) (Si2.79
Al1.21) O10.55 Cl0.01 (OH)1.44
5.337(1) 9.242(2) 10.211(2) 100.15(2) 3.5
11. Brigatti and Davoli 1990 (n # M73)
Ferroan phlogopite, Valle Cervo (Italy)
Monzonite (K0.91Na0.02) (Al0.02 Fe3+0.36 Fe2+
0.86 Mg1.39Mn0.02Ti0.25 Li0.01) (Si2.74
Al1.26) O10.32 Cl0.05 (OH)1.63
5.345(1) 9.258(2) 10.222(2) 100.23(2) 2.1
12. Brigatti and Davoli 1990 (n # M13)
Ferroan phlogopite, Valle Cervo (Italy)
Granite (K0.99Na0.01) (Al0.05Fe3+0.34Fe2+
0.91 Mg1.35Mn0.03 Ti0.23Li0.02) (Si2.85
Al1.15) O10.54 Cl0.01 (OH)1.45
5.355(1) 9.251(4) 10.246(4) 100.15(3) 6.2
13. Brigatti and Poppi 1993 (n # 18)
Titanian phlogopite, Jumilla (Spain)
Lamproite (K0.93Na0.06Ba0.01) (Al0.01Fe3+0.18
Fe2+0.06Mg2.33Mn0.01 Ti0.41) (Si2.94
Al1.06) O10.96 F0.79 (OH)0.25
5.320(2) 9.207(3) 10.100(2) 100.24(2) 2.0
14. Brigatti and Poppi 1993 (n # 20)
Aluminian phlogopite, Grotta dei Cervi (Italy)
Leuciticbasanite
(K0.88Na0.07Ca0.03Ba0.03) (Al0.93Fe3+
0.41Fe2+0.39 Mg1.10Mn0.03Ti0.14)
(Si2.68 Al1.32) O11.36 F0.14 (OH)0.50
5.323(1) 9.219(1) 10.219(4) 100.03(2) 2.7
15. Brigatti and Poppi 1993 (n # 21)
Ferrian phlogopite, Grotta dei Cervi (Italy)
Leuciticbasanite
(K0.92Na0.05Ba0.03) (Al0.14Fe3+0.38
Fe2+0.31Mg2.00Mn0.01Ti0.17) (Si2.68
Al1.32) O10.57 F0.16 (OH)1.27
5.326(1) 9.222(1) 10.223(2) 100.04(1) 2.3
Table 1a. Structural details of trioctahedral true Micas-1M, space group C2/m
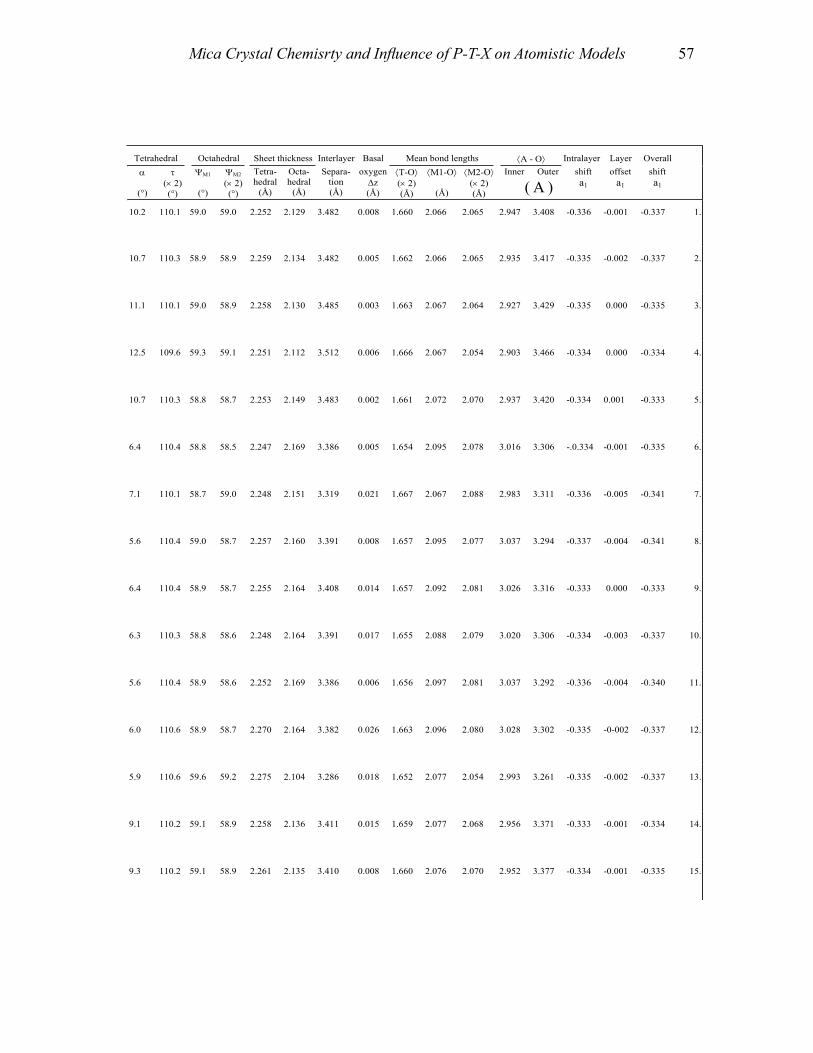
57Mica Crystal Chemisrty and Infl uence of P-T-X on Atomistic Models
Tetrahedral Octahedral Sheet thickness Interlayer Basal Mean bond lengths A - O Intralayer Layer Overall
(°)( 2) (°)
M1
(°)
M2
( 2)(°)
Tetra-hedral
(Å)
Octa-hedral
(Å)
Separa-tion(Å)
oxygenz
(Å)
T-O( 2) (Å)
M1-O
(Å)
M2-O( 2) (Å)
Inner Outer shifta1
offset a1
shifta1
10.2 110.1 59.0 59.0 2.252 2.129 3.482 0.008 1.660 2.066 2.065 2.947 3.408 -0.336 -0.001 -0.337 1.
10.7 110.3 58.9 58.9 2.259 2.134 3.482 0.005 1.662 2.066 2.065 2.935 3.417 -0.335 -0.002 -0.337 2.
11.1 110.1 59.0 58.9 2.258 2.130 3.485 0.003 1.663 2.067 2.064 2.927 3.429 -0.335 0.000 -0.335 3.
12.5 109.6 59.3 59.1 2.251 2.112 3.512 0.006 1.666 2.067 2.054 2.903 3.466 -0.334 0.000 -0.334 4.
10.7 110.3 58.8 58.7 2.253 2.149 3.483 0.002 1.661 2.072 2.070 2.937 3.420 -0.334 0.001 -0.333 5.
6.4 110.4 58.8 58.5 2.247 2.169 3.386 0.005 1.654 2.095 2.078 3.016 3.306 -.0.334 -0.001 -0.335 6.
7.1 110.1 58.7 59.0 2.248 2.151 3.319 0.021 1.667 2.067 2.088 2.983 3.311 -0.336 -0.005 -0.341 7.
5.6 110.4 59.0 58.7 2.257 2.160 3.391 0.008 1.657 2.095 2.077 3.037 3.294 -0.337 -0.004 -0.341 8.
6.4 110.4 58.9 58.7 2.255 2.164 3.408 0.014 1.657 2.092 2.081 3.026 3.316 -0.333 0.000 -0.333 9.
6.3 110.3 58.8 58.6 2.248 2.164 3.391 0.017 1.655 2.088 2.079 3.020 3.306 -0.334 -0.003 -0.337 10.
5.6 110.4 58.9 58.6 2.252 2.169 3.386 0.006 1.656 2.097 2.081 3.037 3.292 -0.336 -0.004 -0.340 11.
6.0 110.6 58.9 58.7 2.270 2.164 3.382 0.026 1.663 2.096 2.080 3.028 3.302 -0.335 -0-002 -0.337 12.
5.9 110.6 59.6 59.2 2.275 2.104 3.286 0.018 1.652 2.077 2.054 2.993 3.261 -0.335 -0.002 -0.337 13.
9.1 110.2 59.1 58.9 2.258 2.136 3.411 0.015 1.659 2.077 2.068 2.956 3.371 -0.333 -0.001 -0.334 14.
9.3 110.2 59.1 58.9 2.261 2.135 3.410 0.008 1.660 2.076 2.070 2.952 3.377 -0.334 -0.001 -0.335 15.
( A )
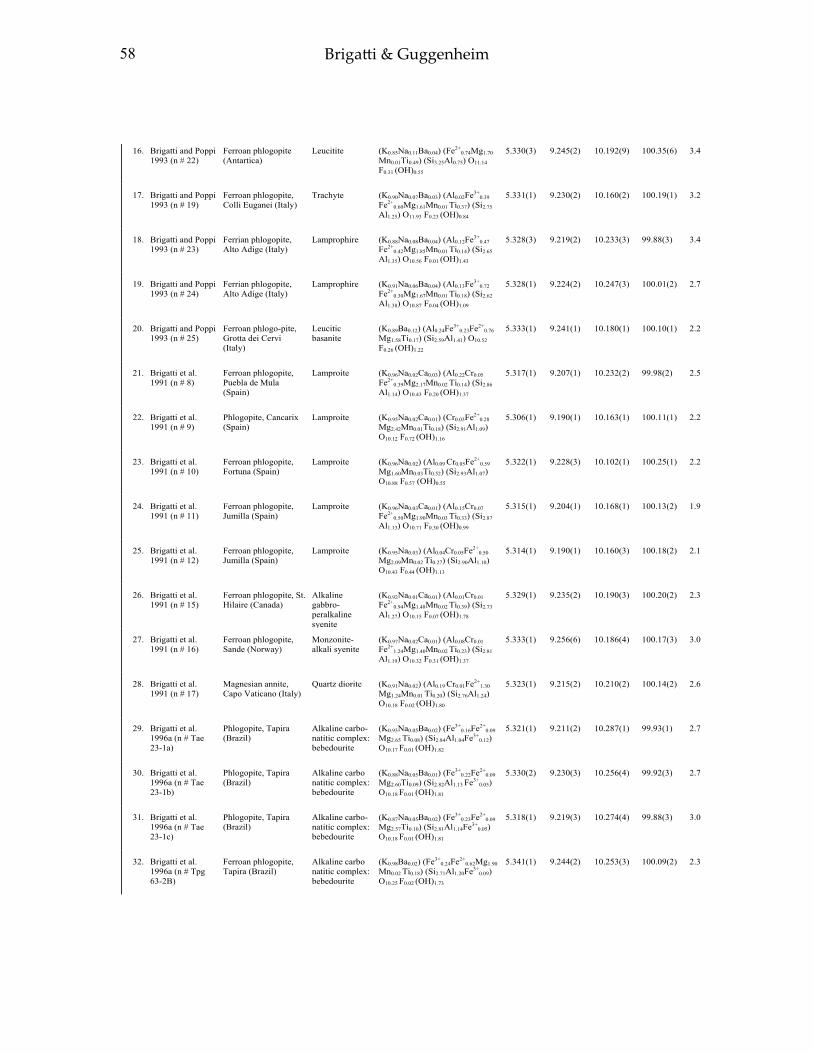
58 Brigatt i & Guggenheim
16. Brigatti and Poppi 1993 (n # 22)
Ferroan phlogopite (Antartica)
Leucitite (K0.85Na0.11Ba0.04) (Fe2+0.74Mg1.70
Mn0.01Ti0.49) (Si3.25Al0.75) O11.14F0.31 (OH)0.55
5.330(3) 9.245(2) 10.192(9) 100.35(6) 3.4
17. Brigatti and Poppi 1993 (n # 19)
Ferroan phlogopite, Colli Euganei (Italy)
Trachyte (K0.90Na0.07Ba0.03) (Al0.02Fe3+0.39
Fe2+0.60Mg1.61Mn0.01 Ti0.37) (Si2.75
Al1.25) O11.93 F0.23 (OH)0.84
5.331(1) 9.230(2) 10.160(2) 100.19(1) 3.2
18. Brigatti and Poppi 1993 (n # 23)
Ferrian phlogopite, Alto Adige (Italy)
Lamprophire (K0.88Na0.08Ba0.04) (Al0.12Fe3+0.47
Fe2+0.42Mg1.85Mn0.01 Ti0.14) (Si2.65
Al1.35) O10.56 F0.01 (OH)1.43
5.328(3) 9.219(2) 10.233(3) 99.88(3) 3.4
19. Brigatti and Poppi 1993 (n # 24)
Ferrian phlogopite, Alto Adige (Italy)
Lamprophire (K0.91Na0.06Ba0.04) (Al0.13Fe3+0.72
Fe2+0.30Mg1.67Mn0.01 Ti0.18) (Si2.62
Al1.38) O10.87 F0.04 (OH)1.09
5.328(1) 9.224(2) 10.247(3) 100.01(2) 2.7
20. Brigatti and Poppi 1993 (n # 25)
Ferroan phlogo-pite, Grotta dei Cervi (Italy)
Leuciticbasanite
(K0.89Ba0.12) (Al0.24Fe3+0.23Fe2+
0.76 Mg1.58Ti0.17) (Si2.59Al1.41) O10.52F0.26 (OH)1.22
5.333(1) 9.241(1) 10.180(1) 100.10(1) 2.2
21. Brigatti et al. 1991 (n # 8)
Ferroan phlogopite, Puebla de Mula (Spain)
Lamproite (K0.96Na0.02Ca0.03) (Al0.22Cr0.05 Fe2+
0.39Mg2.17Mn0.02 Ti0.14) (Si2.86Al1.14) O10.43 F0.20 (OH)1.37
5.317(1) 9.207(1) 10.232(2) 99.98(2) 2.5
22. Brigatti et al. 1991 (n # 9)
Phlogopite, Cancarix (Spain)
Lamproite (K0.95Na0.02Ca0.01) (Cr0.03Fe2+0.28
Mg2.42Mn0.01Ti0.18) (Si2.91Al1.09)O10.12 F0.72 (OH)1.16
5.306(1) 9.190(1) 10.163(1) 100.11(1) 2.2
23. Brigatti et al. 1991 (n # 10)
Ferroan phlogopite, Fortuna (Spain)
Lamproite (K0.96Na0.02) (Al0.09 Cr0.05Fe2+0.59
Mg1.60Mn0.03Ti0.52) (Si2.93Al1.07)O10.88 F0.57 (OH)0.55
5.322(1) 9.228(3) 10.102(1) 100.25(1) 2.2
24. Brigatti et al. 1991 (n # 11)
Ferroan phlogopite, Jumilla (Spain)
Lamproite (K0.96Na0.03Ca0.01) (Al0.15Cr0.07 Fe2+
0.50Mg1.90Mn0.03 Ti0.33) (Si2.87Al1.13) O10.71 F0.30 (OH)0.99
5.315(1) 9.204(1) 10.168(1) 100.13(2) 1.9
25. Brigatti et al. 1991 (n # 12)
Ferroan phlogopite, Jumilla (Spain)
Lamproite (K0.95Na0.03) (Al0.04Cr0.05Fe2+0.50
Mg2.09Mn0.02 Ti0.27) (Si2.90Al1.10)O10.43 F0.44 (OH)1.13
5.314(1) 9.190(1) 10.160(3) 100.18(2) 2.1
26. Brigatti et al. 1991 (n # 15)
Ferroan phlogopite, St. Hilaire (Canada)
Alkalinegabbro-peralkalinesyenite
(K0.92Na0.01Ca0.01) (Al0.01Cr0.01 Fe2+
0.94Mg1.48Mn0.02 Ti0.39) (Si2.73Al1.27) O10.15 F0.07 (OH)1.78
5.329(1) 9.235(2) 10.190(3) 100.20(2) 2.3
27. Brigatti et al. 1991 (n # 16)
Ferroan phlogopite, Sande (Norway)
Monzonite-alkali syenite
(K0.97Na0.02Ca0.01) (Al0.08Cr0.01 Fe2+
1.24Mg1.40Mn0.02 Ti0.23) (Si2.81Al1.19) O10.32 F0.31 (OH)1.37
5.333(1) 9.256(6) 10.186(4) 100.17(3) 3.0
28. Brigatti et al. 1991 (n # 17)
Magnesian annite, Capo Vaticano (Italy)
Quartz diorite (K0.91Na0.02) (Al0.19 Cr0.01Fe2+1.30
Mg1.24Mn0.01 Ti0.20) (Si2.76Al1.24)O10.18 F0.02 (OH)1.80
5.323(1) 9.215(2) 10.210(2) 100.14(2) 2.6
29. Brigatti et al. 1996a (n # Tae 23-1a)
Phlogopite, Tapira (Brazil)
Alkaline carbo-natitic complex: bebedourite
(K0.93Na0.05Ba0.02) (Fe3+0.16Fe2+
0.09 Mg2.65 Ti0.08) (Si2.84Al1.04Fe3+
0.12)O10.17 F0.01 (OH)1.82
5.321(1) 9.211(2) 10.287(1) 99.93(1) 2.7
30. Brigatti et al. 1996a (n # Tae 23-1b)
Phlogopite, Tapira (Brazil)
Alkaline carbo natitic complex: bebedourite
(K0.88Na0.05Ba0.01) (Fe3+0.22Fe2+
0.09 Mg2.60Ti0.09) (Si2.82Al1.13 Fe3+
0.05)O10.18 F0.01 (OH)1.81
5.330(2) 9.230(3) 10.256(4) 99.92(3) 2.7
31. Brigatti et al. 1996a (n # Tae 23-1c)
Phlogopite, Tapira (Brazil)
Alkaline carbo-natitic complex: bebedourite
(K0.87Na0.05Ba0.02) (Fe3+0.23Fe2+
0.09 Mg2.57Ti0.10) (Si2.81Al1.14Fe3+
0.05)O10.18 F0.01 (OH)1.81
5.318(1) 9.219(3) 10.274(4) 99.88(3) 3.0
32. Brigatti et al. 1996a (n # Tpg 63-2B)
Ferroan phlogopite, Tapira (Brazil)
Alkaline carbo natitic complex: bebedourite
(K0.98Ba0.02) (Fe3+0.24Fe2+
0.62Mg1.90 Mn0.02 Ti0.18) (Si2.71Al1.20Fe3+
0.09)O10.25 F0.02 (OH)1.73
5.341(1) 9.244(2) 10.253(3) 100.09(2) 2.3

59Mica Crystal Chemisrty and Infl uence of P-T-X on Atomistic Models
4.4 110.3 59.0 58.7 2.270 2.154 3.332 0.020 1.655 2.093 2.072 3.045 3.245 -0.336 -0.007 -0.344. 16.
7.6 110.0 59.3 59.0 2.261 2.125 3.353 0.008 1.657 2.083 2.064 2.976 3.325 -0.335 -0.002 -0.337 17.
9.3 110.2 58.9 58.7 2.250 2.154 3.426 0.010 1.659 2.083 2.074 2.957 3.380 -0.331 0.001 -0.330 18.
9.1 110.3 58.9 58.7 2.262 2.153 3.413 0.001 1.662 2.084 2.073 2.959 3.373 -0.334 0.000 -0.334 19.
8.6 110.4 59.1 59.0 2.271 2.135 3.344 0.007 1.663 2.080 2.071 2.953 3.347 -0.334 -0.001 -0.335 20.
7.6 110.5 58.9 58.8 2.259 2.145 3.413 0.005 1.654 2.079 2.068 2.989 3.333 -0.333 -0.001 -0.334 21.
6.6 110.7 59.2 59.1 2.269 2.116 3.352 0.010 1.650 2.067 2.058 2.989 3.289 -0.335 -0.001 -0.336 22.
5.3 110.0 59.6 59.2 2.261 2.107 3.313 0.010 1.648 2.081 2.056 3.017 3.256 -0.336 -0.002 -0.338 23.
6.8 110.5 59.2 59.0 2.265 2.122 3.357 0.009 1.652 2.074 2.061 2.989 3.300 -0.334 -0.002 -0.336 24.
6.7 110.5 59.2 59.0 2.258 2.123 3.360 0.009 1.649 2.071 2.061 2.990 3.297 -0.335 -0.003 -0.338 25.
7.5 110.2 59.0 58.7 2.252 2.150 3.374 0.013 1.656 2.089 2.071 2.985 3.327 -0.335 -0.004 -0.339 26.
5.3 110.5 58.9 58.6 2.248 2.164 3.365 0.000 1.653 2.094 2.077 3.036 3.276 -0.335 -0.002 -0.337 27.
8.0 110.1 58.7 58.5 2.230 2.170 3.421 0.015 1.650 2.085 2.077 2.984 3.346 -0.336 -0.002 -0.338 28.
8.9 110.6 58.7 58.7 2.259 2.161 3.453 0.000 1.659 2.077 2.077 2.972 3.376 -0.333 0.000 -0.333 29.
8.9 110.3 58.7 58.7 2.248 2.158 3.449 0.000 1.658 2.079 2.079 2.974 3.380 -0.332 0.001 -0.331 30.
8.9 110.3 58.8 58.8 2.255 2.149 3.462 0.006 1.659 2.076 2.073 2.975 3.378 -0.333 0.002 -0.331 31.
8.1 110.2 58.9 58.7 2.254 2.159 3.428 0.009 1.659 2.087 2.079 2.990 3.359 -0.335 -0.001 -0.336 32.

60 Brigatt i & Guggenheim
33. Brigatti et al. 1996a (n # Tas 22-1a)
Tetra-ferriphlogopite, Tapira (Brazil)
Alkaline carbo natitic complex: glimmerite
(K0.99Na0.01) (Fe3+0.05Fe2+
0.17Mg2.70 Ti0.01) (Si3.11Fe3+
0.89) O10.08 F0.14 (OH)1.78
5.357(2) 9.270(4) 10.319(4) 99.96(3) 3.2
34. Brigatti et al. 1996a (n # Tas 22-1b)
Tetra-ferriphlogopite, Tapira (Brazil)
Alkaline carbo natitic complex: glimmerite
(K0.98Na0.02) (Fe3+0.06Fe2+
0.17Mg2.75 Mn0.01Ti0.01) (Si3.07Fe3+
0.93) O10.17 F0.05 (OH)1.78
5.358(2) 9.277(3) 10.308(2) 99.99(4) 3.3
35. Brigatti et al. 1996a (n # Tpt 17-1)
Phlogopite, Tapira (Brazil)
Alkaline carbo-natitic complex: perovskite-magnetitite
(K0.98Na0.01Ba0.02) (Fe3+0.15Fe2+
0.08 Mg2.68Mn0.01 Ti0.08) (Si2.82Al1.11Fe3+
0.07) O10.16 F0.11 (OH)1.73
5.332(1) 9.239(2) 10.291(2) 99.94(2) 2.8
36. Brigatti et al. 1996a (n # Tas 27-2Ba)
Phlogopite, Tapira (Brazil)
Alkaline carbo natitic complex: dunite
(K0.96Na0.03Ba0.01) (Fe3+0.19Fe2+
0.07 Mg2.68Ti0.05) (Si2.85Al1.07Fe3+
0.08)O10.16 F0.03 (OH)1.81
5.318(2) 9.214(1) 10.279(2) 100.01(2) 2.8
37. Brigatti et al. 1996a (n # Tas 27-2Bb)
Phlogopite, Tapira, (Brazil)
Alkaline carbo natitic complex: dunite
(K0.96Na0.03Ba0.01) (Fe3+0.21Fe2+
0.07 Mg2.64Mn0.01Ti0.06) (Si2.85Al1.10 Fe3+
0.05) O10.13 F0.06 (OH)1.81
5.330(1) 9.235(1) 10.301(1) 99.92(1) 2.5
38. Brigatti et al. 1996a (n # Tag 15-4)
Ferroan phlogopite, Tapira (Brazil)
Alkaline carbo natitic complex: bebedourite
(K0.92Ba0.04) (Fe3+0.30Fe2+
0.38Mg2.17 Mn0.01Ti0.13) (Si2.76Al1.19Fe3+
0.05)O10.26 F0.06 (OH)1.68
5.333(1) 9.238(2) 10.267(2) 99.96(2) 2.8
39. Brigatti et al. 1996a (n # Tag 15-3)
Ferroan phlogopite, Tapira (Brazil)
Alkaline carbo natitic complex: bebedourite
(K0.92Ba0.02) (Fe3+0.25Fe2+
0.34Mg2.19 Mn0.01 Ti0.13) (Si2.74Al1.15Fe3+
0.11)O10.04 F0.05 (OH)1.91
5.329(2) 9.228(2) 10.258(3) 100.03(3) 2.8
40. Brigatti et al. 1996a (n # Tpq 16-4A)
Tetra-ferriphlogopite, Tapira (Brazil)
Alkaline carbo-natitic complex: perovskite-magnetitite
K0.99 (Fe3+0.10Fe2+
0.22Mg2.64Mn0.01 Ti0.03) (Si2.91Al0.71Fe3+
0.38) O10.06 F0.08 (OH)1.86
5.338(2) 9.247(1) 10.300(2) 99.96(2) 2.8
41. Brigatti et al. 1996a (n # Tpq 16-6B)
Tetra-ferriphlogopite, Tapira (Brazil)
Alkaline carbo natitic complex: glimmerite
(K0.95Na0.02) (Fe3+0.23Fe2+
0.20 Mg2.54Ti0.02) (Si3.15Al0.04Fe3+
0.81)O10.34 F0.10 (OH)1.56
5.356(1) 9.284(2) 10.309(3) 100.03(2) 3.1
42. Brigatti et al. 1996b (n # Tas 22-1c)
Tetra-ferriphlogopite, Tapira (Brazil)
Alkaline carbo natitic complex: glimmerite
(K0.99Na0.01) (Fe3+0.08Fe2+
0.17Mg2.73 Ti0.01) (Si3.05Fe3+
0.95) O10.17 F0.04 (OH)1.79
5.362(1) 9.288(1) 10.321(2) 99.99(1) 3.1
43. Brigatti et al. 1996b (n # Tpq 16-6B)
Tetra-ferriphlogopite, Tapira (Brazil)
Alkaline carbo natitic complex: glimmerite
K1.02 (Fe3+0.11Fe2+
0.20Mg2.68Mn0.01)(Si3.05Fe3+
0.95) O10.18 F0.07 (OH)1.75
5.365(1) 9.292(1) 10.326(1) 99.99(1) 2.5
44. Brigatti et al. 1998 (n # wa3H)
Ferroan phlogopite, Warburton (Australia)
Granodiorite (K0.92Na0.03Ca0.02Ba0.04) (Al0.18Fe3+
0.18Fe2+1.01Mg1.26Mn0.02 Ti0.28)
(Si2.77Al1.23) O10.58 F0.08 Cl0.02)(OH)1.32
5.341(1) 9.252(1) 10.229(2) 100.17(2) 2.9
45. Brigatti et al. 1998 (n # wa8E)
Magnesian annite, Warburton (Australia)
Microgranitoidenclave in granodiorite
(K0.93Na0.03Ca0.02Ba0.01) (Al0.21Fe2+
1.37Mg1.15Mn0.03 Ti0.25) (Si2.85Al1.15) O10.61 F0.16 Cl0.06 (OH)1.17
5.345(1) 9.263(4) 10.234(6) 100.11(2) 3.9
46. Brigatti et al. 1998 (n # wa8H)
Magnesian annite, Warburton, (Australia)
Granodiorite (K0.89Na0.03Ca0.03Ba0.02) (Al0.18Fe3+
0.13Fe2+1.20Mg1.19Mn0.02 Ti0.29)
(Si2.82Al1.18) O10.76 F0.14 Cl0.05
(OH1.05)
5.344(1) 9.258(1) 10.232(1) 100.15(1) 3.3
47. Brigatti et al. 1998 (n # wa23e)
Ferroan phlogopite, Warburton (Australia)
Microgranitoidenclave in granodiorite
(K0.92Na0.03Ca0.04Ba0.01) (Al0.31Fe3+
0.16Fe2+1.10Mg1.23Mn0.01 Ti0.19)
(Si2.77Al1.23) O10.67 F0.12 Cl0.02
(OH)1.19
5.347(1) 9.260(2) 10.229(3) 100.07(3) 2.8
48. Brigatti et al. 1999 (n # TAG15-4b)
Ferroan phlogopite, Tapira (Brazil)
Alkaline carbo natitic complex: bebedourite
(K0.95Na0.02Ba0.03) (Fe3+0.23Fe2+
0.38 Mg2.25Mn0.01 Ti0.13) (Si2.76Al1.17Fe0.07) O10.28 F0.05 (OH)1.68
5.332(1) 9.230(2) 10.267(1) 99.99(1) 2.8
49. Brigatti et al. 1999 (n # TpQ16-4Ab)
Phlogopite, Tapira (Brazil)
Alkaline carbo-natitic complex: perovskite-magnetitite
(K0.97Na0.01Ba0.02) (Fe3+0.20Fe2+
0.11 Mg2.59Mn0.01 Ti0.05) (Si2.90Al1.06Fe0.04) O10.12 F0.06 (OH)1.82
5.323(1) 9.219(1) 10.282(1) 99.93(1) 2.4

61Mica Crystal Chemisrty and Infl uence of P-T-X on Atomistic Models
10.8 109.6 58.7 58.7 2.254 2.168 3.487 0.002 1.670 2.088 2.089 2.952 3.446 -0.334 0.001 -0.333 33.
10.9 110.1 58.9 58.9 2.271 2.156 3.454 0.000 1.677 2.087 2.085 2.941 3.440 -0.333 -0.001 -0.334 34.
8.8 110.7 58.8 58.7 2.265 2.159 3.447 0.001 1.663 2.081 2.080 2.977 3.379 -0.333 0.000 -0.333 35.
8.5 110.7 58.6 58.6 2.256 2.164 3.448 0.000 1.656 2.078 2.077 2.980 3.364 -0.335 -0.001 -0.336 36.
8.5 110.7 58.6 58.6 2.261 2.167 3.457 0.001 1.660 2.081 2.082 2.987 3.372 -0.333 0.000 -0.333 37.
8.6 110.2 58.8 58.7 2.257 2.157 3.442 0.005 1.660 2.083 2.078 2.981 3.372 -0.333 0.000 -0.333 38.
8.5 110.4 58.7 58.6 2.252 2.167 3.431 0.001 1.658 2.085 2.079 2.977 3.365 -0.335 0.000 -0.335 39.
9.1 110.2 58.7 58.7 2.257 2.164 3.467 0.003 1.662 2.084 2.083 2.978 3.394 -0.334 0.000 -0.334 40.
10.2 110.2 58.8 58.7 2.268 2.168 3.447 0.004 1.673 2.091 2.089 2.955 3.422 -0.334 -0.001 -0.335 41.
11.5 109.9 59.0 59.0 2.274 2.151 3.465 0.001 1.680 2.087 2.087 2.931 3.462 -0.334 0.000 -0.334 42.
11.5 119.9 58.9 58.9 2.271 2.159 3.469 0.001 1.679 2.091 2.089 2.934 3.464 -0.333 -0.001 -0.334 43.
7.0 110.3 59.1 58.8 2.257 2.148 3.407 0.009 1.658 2.091 2.073 3.010 3.330 -0.336 -0.002 -0.338 44.
6.6 109.7 58.5 58.5 2.229 2.186 3.431 0.026 1.654 2.092 2.090 3.027 3.329 -0.336 0.000 -0.336 45.
7.1 110.2 59.0 58.8 2.256 2.152 3.408 0.012 1.659 2.091 2.076 3.010 3.332 -0.335 -0.002 -0.337 46.
6.8 110.3 59.0 58.8 2.262 2.153 3.395 0.010 1.657 2.090 2.075 3.010 3.319 -0.333 -0.001 -0.334 47.
9.1 110.5 58.7 58.7 2.260 2.163 3.428 0.000 1.662 2.082 2.079 2.965 3.378 -0.334 0.000 -0.334 48.
8.8 110.7 58.6 58.6 2.259 2.164 3.446 0.002 1.659 2.078 2.078 2.974 3.372 -0.333 0.000 -0.333 49.

62 Brigatt i & Guggenheim
50. Brigatti et al. 1999 (n #TPQ16-4Ac)
Ferroan tetra-ferriphlogopite, Tapira (Brazil)
Alkaline carbo-natitic complex: perovskite-magnetitite
(K0.99Na0.01) (Fe3+0.30Fe2+
0.54Mg1.99 Mn0.02 Ti0.01) (Si3.01Al0.13Fe0.86)O10.04 (OH)1.96
5.370(1) 9.306(1) 10.319(1) 100.00(1) 3.0
51. Brigatti et al. 2000a (n # a4)
Magnesian annite, Sos Canales pluton, Sardinia (Italy)
Peraluminous granite
(K0.95Na0.04) (Al0.35Fe3+0.01Fe2+
1.45 Mg0.77Mn0.04 Ti0.21) (Si2.71Al1.29)O10.15 F0.05 (OH)1.80
5.352(1) 9.268(3) 10.255(3) 100.27(2) 3.2
52. Brigatti et al. 2000a (n # b1)
Magnesian annite, Tinker Glacier (Antarctica)
Peraluminous granite
(K0.93Na0.03Ca0.01) (Al0.54Fe3+0.01
Fe2+1.41Mg0.83Mn0.03 Ti0.17) (Si2.62
Al1.38) O10.46 (OH)1.54
5.336(1) 9.239(2) 10.200(2) 100.29(2) 2.7
53. Brigatti et al. 2000a (n # c3-31)
Magnesian annite, Tinker Glacier (Antarctica)
Peraluminous granite
(K0.96Na0.03Ca0.01Ba0.01) (Al0.48Fe2+
1.48Mg0.70Mn0.06 Ti0.20) (Si2.63Al1.37) O10.38 F0.01 (OH)1.61
5.347(2) 9.257(1) 10.211(1) 100.27(2) 3.1
54. Brigatti et al. 2000a (n # cc1)
Magnesian annite, Tinker Glacier (Antarctica)
Peraluminous granite
(K0.96Na0.01) (Al0.64Fe2+1.33Mg0.73
Mn0.04Ti0.17) (Si2.68Al1.32) O10.44 (OH)1.32
5.328(1) 9.222(2) 10.197(2) 100.26(1) 3.2
55. Brigatti et al. 2000a (n # Gfs15a)
Magnesian annite, Sos Canales pluton, Sardinia (Italy)
Peraluminous granite
(K0.96Na0.02Ca0.03Ba0.01) (Al0.60Fe2+
1.36Mg0.73Mn0.02Ti0.14) (Si2.69Al1.31) O10.31 F0.12 (OH)1.57
5.339(1) 9.232(2) 10.208(2) 100.30(2) 3.6
56. Brigatti et al. 2000a (n # H87)
Magnesian annite, Riu Morunzu, Sardinia (Italy)
Peraluminous granite
(K0.98Na0.02) (Al0.50Fe2+1.46Mg0.70
Mn0.03Ti0.16) (Si2.72Al1.28) O10.25 F0.15 Cl0.03 (OH)1.57
5.344(2) 9.256(3) 10.237(2) 100.27(2) 3.2
57. Brigatti et al. 2000b (n # 120)
Annite, Pikes Peak, Colorado
Graniticpegmatite
(K0.99Na0.01) (Al0.13Fe3+0.21Fe2+
2.29 Mg0.10Mn0.01Ti0.25) (Si3.14Al0.86)F0.26 O10.95 (OH)0.79
5.384(1) 9.324(1) 10.254(1) 100.86(1) 2.6
58. Brigatti et al. 2000b (n # 26 )
Siderophyllite, Pikes Peak, Colorado
Graniticpegmatite
(K0.95Rb0.02Na0.05) (Al0.84Fe3+0.24
Fe2+1.63Mg0.10 Zn0.01 Li0.17Ti0.02)
(Si2.94Al1.06) O10.93 F0.90 (OH)0.17
5.358(2) 9.280(3) 10.151(2) 100.10(1) 3.3
59. Brigatti et al. 2000b (n # 33 )
Aluminian annite, Pikes Peak, Colorado
Graniticpegmatite
(K1.00Na0.01) (Al0.35Fe3+0.16Fe2+
2.22 Mn0.08Ti0.11 Li0.08) (Si3.09Al0.91)O10.95 F0.26 (OH)0.79
5.372(1) 9.313(1) 10.204(1) 100.52(1) 3.6
60. Comodi et al. 1999
Cesian, tetra-ferri-annite
Synthetic Cs0.89 (Fe3+0.03Fe2+
2.97) (Si3.07Fe3+
0.90Al0.03) O10 OH2
5.486(1) 9.506(1) 10.818(1) 99.67(6) 3.7
61. Donnay et al. 1964
Tetra-ferri-annite Synthetic K1.00 Fe2+3.00 (Si3.00Fe3+
1.00) O10(OH)2
5.430(2) 9.404(5) 10.341(3) 100.1(1) 9.3
62. Guggenheim 1981 Trilithionite,Radkovice, Jihlava, Moravia (Czech Republic)
Pegmatite (K0.79Rb0.07Cs0.03Na0.03Ca0.01)(Li1.48Fe2+
0.02Fe3+0.008 Mg0.05
Mn0.03Al1.30) (Si3.49Al0.51) O10
(OH,F)2
5.209(2) 9.011(5) 10.149(5) 100.77(4) 3.5
63. Guggenheim and Kato 1984 (n # 1)
Manganoan phlogopite, Nodatamagawa, Iwate Prefecture (Japan)
Metamorphosed manganese deposit
(K0.85Na0.19Ba0.06) (Fe3+0.06Mg1.74
Mn2+0.95Mn3+
0.18) (Si2.75Al1.15 Ti0.03Fe3+
0.07) O10.01 F0.09 (OH)1.90
5.380(2) 9.295(2) 10.318(4) 99.96(2) 5.4
64. Guggenheim and Kato 1984 (n # 5)
Barian, manganoan, phlogopite, Nodatamagawa, Iwate Prefecture (Japan)
Metamorphosed manganese deposit
(K0.58Na0.09Ba0.35) (Fe3+0.04Al0.35
Mg2.10 Mn2+0.52 Mn3+
0.22) (Si2.33Al1.65Ti0.01) O10.75 F0.07 (OH)1.18
5.330(2) 9.245(3) 10.240(3) 99.92(2) 3.8
65. Hawthorne et al. 1999
Rubidian, cesian, phlogopite, Red Cross Lake, Manitoba (Canada)
Graniticpegmatite
K0.46Cs0.23Rb0.28 (Al0.38Fe2+1.00
Mn0.04Ti0.04Mg1.20 Li0.34) (Si2.91Al1.09) O10 F0.45 (OH)1.55
5.343(1) 9.247(2) 10.397(3) 100.04(2) 4.5
66. Hazen and Burnham 1973
Annite, Pikes Peak, Colorado
Granite (K0.88Na0.07Ca0.03) (Al0.09Fe3+0.19
Fe2+2.22Mg0.12Mn0.05 Ti0.22) (Si2.81
Al1.19) O10.35 F0.22 Cl0.05 (OH)1.38
5.3860(9) 9.3241(7) 10.2683(9) 100.63(1) 4.5

63Mica Crystal Chemisrty and Infl uence of P-T-X on Atomistic Models
10.8 110.0 58.9 58.8 2.269 2.170 3.455 0.006 1.678 2.097 2.092 2.948 3.446 -0.334 0.000 -0.334 50.
8.5 110.1 59.3 58.8 2.259 2.148 3.424 0.011 1.665 2.101 2.073 2.985 3.373 -0.338 -0.004 -0.342 51.
7.6 110.1 59.4 58.9 2.255 2.130 3.395 0.019 1.658 2.094 2.063 2.991 3.337 -0.338 -0.003 -0.341 52.
7.6 110.2 59.3 58.9 2.258 2.140 3.391 0.019 1.661 2.097 2.070 2.993 3.341 -0.338 -0.002 -0.340 53.
8.1 110.2 59.5 58.9 2.251 2.128 3.404 0.021 1.657 2.093 2.058 2.978 3.348 -0.338 -0.003 -0.341 54.
7.7 110.2 59.3 58.9 2.251 2.137 3.404 0.008 1.658 2.091 2.067 2.992 3.340 -0.339 -0.003 -0.342 55.
8.1 110.1 59.4 58.8 2.260 2.138 3.415 0.015 1.663 2.101 2.066 2.989 3.357 -0.338 -0.004 -0.342 56.
1.5 110.2 58.8 58.4 2.250 2.196 3.374 0.000 1.658 2.117 2.098 3.143 3.212 -0.336 -0.023 -0.359 57.
5.0 110.1 59.0 59.4 2.252 2.123 3.367 0.009 1.668 2.059 2.087 3.051 3.279 -0.333 0.001 -0.332 58.
2.0 110.2 58.5 58.4 2.241 2.201 3.349 0.002 1.656 2.109 2.100 3.122 3.211 -0.338 -0.009 -0.347 59.
0.3 110.5 59.3 59.2 2.293 2.180 3.899 0.013 1.688 2.132 2.128 3.359 3.372 -0.333 +0.002 -0.331 60.
6.4 110.3 59.3 59.3 2.318 2.152 3.394 0.010 1.687 2.107 2.106 3.055 3.351 -0.334 0.001 -0.333 61.
7.3 112.1 61.0 58.6 2.259 2.056 3.397 0.070 1.632 2.118 1.970 2.950 3.270 -0.357 -0.007 -0.364 62.
6.8 110.8 58.1 57.9 2.254 2.245 3.409 0.008 1.663 2.122 2.110 3.027 3.337 -0.331 -0.001 -0.332 63.
11.0 110.6 58.8 58.7 2.273 2.161 3.380 0.002 1.672 2.086 2.078 2.910 3.413 -0.332 0.001 -0.331 64.
3.5 110.8 59.5 59.0 2.261 2.125 3.591 0.017 1.652 2.093 2.064 3.141 3.296 -0.338 -0.001 -0.339 65.
1.6 110.4 58.6 58.3 2.252 2.207 3.380 0.014 1.660 2.121 2.101 3.143 3.215 -0.334 -0.018 -0.352 66.

64 Brigatt i & Guggenheim
67. Hazen and Burnham 1973
Phlogopite, Franklin, New Jersey
Marble (K0.77Na0.16Ba0.05) Mg3.00(Si2.95Al1.05) O10 F1.30 (OH)0.70
5.3078(4) 9.1901(5) 10.1547(8) 100.08(1) 4.1
68. Hazen and Finger 1978 (high pressure)
Phlogopite, Franklin, New Jersey
Marble (K0.77Na0.16Ba0.05) Mg3.00(Si2.95Al1.05) O10 F1.30 (OH)0.70
5.260(1) 9.100(1) 9.791(9) 100.68(4) 14.7
69. Hazen et al. 1981 (n # Y253)
Tetra-ferriphlogopite, Cupaello (Italy)
Volcanicmelilite
(K0.97Na0.01Ba0.02) (Fe2+0.03Mg2.46
Ti3+0.09 Li0.23Na0.11) (Si3.31Al0.04
Fe3+0.65) O10 F2.00
5.329(1) 9.230(2) 10.219(1) 99.98(1) 3.0
70. Joswig 1972 Phlogopite(Madagascar)
(K0.90Na0.02) (Al0.07Fe2+0.16Mg2.70
Ti0.03) (Si2.91Al1.09) O9.90 F1.13 (OH)0.97
5.314(1) 9.2024(5) 10.1645(7) 100.05(1) 2.0
71. Kato et al. 1979 (n # 2)
Manganoan phlogopite, Nodatamagawa, Iwate Prefecture (Japan)
Metamorphosed manganese deposit
(K0.73Na0.32Ba0.11) (Fe3+0.03Mg2.27
Mn2+0.49) (Si2.86Al1.07Ti0.02 Fe3+
0.05)O10.34 F0.09 (OH)1.57
5.349(2) 9.241(2) 10.282(4) 99.96(2) 10.6
72. McCauley et al. 1973
Fluoro phlogopite Synthetic (K0.98Na0.04) Mg2.97 (Si2.98Al1.02)O9.90 F1.94 (OH)0.16
5.308(2) 9.183(3) 10.139(1) 100.07(2) 6.1
73. Medici 1996 (n # TPP16-6a)
Phlogopite, Tapira (Brazil)
Alkaline carbo natitic complex: garnet magnetite
(K0.98Na0.01) (Fe3+0.08Fe2+
0.13Mg2.73 Ti0.06) (Si2.82Al1.04Fe3+
0.14) O10.01 F0.11 (OH)1.88
5.330(1) 9.239(1) 10.305(1) 99.89(1) 3.3
74. Medici 1996
(n # TPP16-6b)
Octa-ferroan tetra-ferriphlogopite, Tapira (Brazil)
Alkaline carbo natitic complex: garnet magnetite
(K1.00Ba0.01) (Fe3+0.01Fe2+
0.60Mg2.36 Mn0.01 Ti0.01) (Si3.03Al0.07Fe3+
0.90)O10.08 F0.01 (OH)1.91
5.360(1) 9.293(1) 10.314(2) 100.01(1) 2.8
75. Medici 1996 (n # TPP16-6c)
Octa-ferroan tetra-ferriphlogopite, Tapira (Brazil)
Alkaline carbo natitic complex: garnet magnetite
(K1.97Ca0.03 Ba0.01) (Fe2+0.60Mg2.38
Mn0.01Ti0.01) (Si3.02Al0.06Fe3+0.92)
O10.05 F0.04 (OH)1.91
5.3637(5) 9.2908(8) 10.321(1) 99.995(9) 2.5
76. Medici 1996 (n # TAX27-1)
Ferroan phlogopite, Tapira, Brazil
Alkaline carbo natitic complex: clinopyroxenite
(K0.95Na0.03) (Fe3+0.04Fe2+
0.43Mg2.39 Mn0.01Ti0.08) (Si2.94Al0.78Fe3+
0.28)O10.00 F0.05 (OH)1.95
5.351(1) 9.267(2) 10.311(1) 99.99(1) 2.6
77. Medici 1996 (n # TAI17-1)
Ferroan phlogopite, Tapira (Brazil)
Alkaline carbo natitic complex: bebedourite
(K0.98Na0.02Ba0.01) (Fe3+0.10Fe2+
0.44 Mg2.36Mn0.01 Ti0.09) (Si2.82Al1.10Fe3+
0.08) O10.12 (OH)1.88
5.3355(8) 9.2457(7) 10.294(2) 99.94(1) 2.5
78. Medici 1996 (n # TAA11-1a)
Ferroan phlogopite, Tapira (Brazil)
Alkaline carbo natitic complex: bebedourite
(K0.98Na0.02) (Fe3+0.06Fe2+
0.60 Mg2.23Mn0.01 Ti0.10) (Si2.84Al1.14Fe3+
0.02) O10.11 F0.05 (OH)1.84
5.329(2) 9.244(2) 10.271(3) 99.97(2) 3.6
79. Medici 1996 (n # TA9)
Ferroan phlogopite, Tapira (Brazil)
Alkaline carbo naitic complex: garnet magnetite
(K0.98Ba0.02) (Fe2+1.14Mg1.73Mn0.04
Ti0.09) (Si3.00Al0.90Fe3+0.10) O10.17
F0.01 (OH)1.82
5.344(1) 9.259(2) 10.280(2) 100.01(1) 2.8
80. Medici 1996 (n # LI12a)
Ferroan phlogopite, Limeira, Brazil
Kamafugite (K0.95Na0.04) (Fe2+0.44Mg2.51Ti0.05)
(Si3.01Al0.92Fe3+0.07) O10.11 F0.18
(OH)1.71
5.331(1) 9.227(1) 10.275(2) 99.96(2) 3.9
81. Medici 1996 (n # MA-1)
Phlogopite, Malaquias (Brazil)
Kamafugite (K0.97Na0.02 Ba0.02) (Fe3+0.03Fe2+
0.35 Mg2.07Ti0.33) (Si2.94Al1.06) O10.21 F0.93 (OH)0.86
5.317(1) 9.208(2) 10.118(2) 100.15(1) 2.9
82. Mellini et al. 1996 Cesian tetra-ferri-annite
Synthetic Cs0.89 (Fe3+0.03Fe2+
2.97) (Si3.07Fe3+
0.90Al0.03) O10 (OH)2
5.487(1) 9.506(2) 10.826(6) 99.83(3) 5.5
83. Oberti et al. 1993 (n # KP9)
Preiswerkite, Geisspfad(Switzerland)
Ultramafic complex
(K0.02Na0.83) (Al0.93 Fe0.17Mg1.90 Cr0.01) (Si2.12Al1.88) O9.99 (OH)2.01
mean composition
5.225(4) 9.050(8) 9.791(9) 100.27(6) 3.8

65Mica Crystal Chemisrty and Infl uence of P-T-X on Atomistic Models
7.5 110.5 59.0 59.0 2.261 2.125 3.352 0.002 1.650 2.063 2.065 2.969 3.312 -0.334 -0.001 -0.335 67.
9.7 109.3 60.1 59.3 2.280 2.059 3.002 0.000 1.66 2.07 2.02 2.81 3.26 -0.345 0.000 -0.345 68.
5.7 110.8 58.8 58.8 2.275 2.151 3.364 0.003 1.655 2.077 2.077 3.021 3.282 -0.332 0.000 -0.332 69.
7.7 110.6 59.2 59.1 2.268 2.116 3.356 0.001 1.654 2.066 2.063 2.970 3.319 -0.334 0.000 -0.334 70.
6.2 111.3 58.4 58.2 2.265 2.202 3.395 0.018 1.657 2.101 2.090 3.025 3.307 -0.330 -0.002 -0.332 71.
5.9 110.1 59.0 59.0 2.252 2.124 3.356 0.004 1.642 2.062 2.064 3.006 3.273 -0.334 0.000 -0.334 72.
8.6 110.7 58.7 58.6 2.263 2.168 3.458 0.008 1.661 2.084 2.081 2.986 3.374 -0.333 0.001 -0.332 73.
10.3 110.0 58.8 58.8 2.265 2.170 3.457 0.001 1.674 2.092 2.091 2.953 3.435 -0.334 0.000 -0.334 74.
10.4 110.1 58.8 58.8 2.270 2.165 3.460 0.003 1.675 2.091 2.090 2.958 3.433 -0.334 0.000 -0.334 75.
8.0 110.5 58.7 58.6 2.265 2.174 3.451 0.006 1.664 2.091 2.089 3.004 3.367 -0.334 0.000 -0.334 76.
9.0 110.6 58.7 58.7 2.269 2.162 3.440 0.002 1.665 2.084 2.081 2.973 3.382 -0.333 0.000 -0.333 77.
8.5 110.4 58.5 58.5 2.245 2.178 3.447 0.007 1.658 2.087 2.084 2.983 3.372 -0.333 -0.001 -0.334 78.
6.7 110.7 58.6 58.5 2.259 2.178 3.428 0.005 1.659 2.092 2.087 3.024 3.329 -0.334 0.000 -0.334 79.
6.7 110.8 58.6 58.6 2.258 2.169 3.435 0.018 1.655 2.082 2.081 3.019 3.324 -0.333 0.000 -0.333 80.
4.5 110.8 59.3 59.0 2.271 2.123 3.294 0.011 1.648 2.077 2.061 3.026 3.230 -0.334 -0.001 -0.335 81.
0.2 110.0 59.4 59.3 2.284 2.168 3.930 0.015 1.688 2.130 2.125 3.370 3.380 -0.335 -0.002 -0.337 82.
20.0 107.7 59.6 59.5 2.255 2.051 3.073 0.005 1.695 2.025 2.020 2.573 3.514 -0.334 0.000 -0.334 83.

66 Brigatt i & Guggenheim
84. Oberti et al. 1993 (n # KP17)
Preiswerkite, Geisspfad(Switzerland)
Ultramafic complex
(K0.02Na0.83) (Al0.93 Fe0.17Mg1.90 Cr0.01) (Si2.12Al1.88) O9.99 (OH)2.01
mean composition
5.228(7) 9.049(10) 9.819(12) 100.41(13) 4.6
85. Otha et al. 1982 Ferrian phlogopite, Ruiz Peak, Valles Mountains, New Mexico
Rhyodacite (K0.77Na0.16Ba0.02) (Al0.16Fe3+0.86
Fe2+0.01Mg1.67Mn0.01Ti0.34) (Si2.84
Al1.16) O11.62 F0.17 (OH)0.21
5.320(4) 9.210(1) 10.104(1) 100.10(1) 5.0
86. Rayner 1974 Phlogopite (K0.93Na0.04Ca0.03) (Fe2+0.10Mg2.77
Ti0.11) (Si2.88Al1.12) O10 F0.51(OH)1.49
5.322 9.206 10.240 100.03 6.6
87. Russell and Guggenheim 1999 (T°C = 20)
Aluminian phlogopite, White Well (Australia)
Metamorphosed ultrabasic schist
(K0.82Na0.12) (Al0.50Fe0.12Mg2.28)(Si2.79Al1.21) O10 F0.07 (OH)1.93
5.3030(4) 9.1805(6) 10.2483(7) 100.05(6) 9.7
88. Russell and Guggenheim 1999 (T°C = 300)
Aluminian phlogopite, White Well (Australia)
Metamorphosed ultrabasic schist
(K0.82Na0.12) (Al0.50Fe0.12Mg2.28)(Si2.79Al1.21) O10 F0.07 (OH)1.93
5.3193(7) 9.207(1) 10.286(1) 100.042(9) 12.8
89. Russell and Guggenheim 1999 (T°C = 450)
Aluminian phlogopite, White Well (Australia)
Metamorphosed ultrabasic schist
(K0.82Na0.12) (Al0.50Fe0.12Mg2.28)(Si2.79Al1.21) O10 F0.07 (OH)1.93
5.3331(7) 9.2316(9) 10.3159(8) 100.004(8) 11.9
90. Russell and Guggenheim 1999 (T°C = 600)
Aluminian phlogopite, White Well (Australia)
Metamorphosed ultrabasic schist
(K0.82Na0.12) (Al0.50Fe0.12Mg2.28)(Si2.79Al1.21) O10 F0.07 (OH)1.93
5.342(3) 9.238(4) 10.357(5) 99.99(1) 6.9
91. Russell and Guggenheim 1999 (room temperature)
Ferroan phlogopite Silver Crater Mine, Bancroft (Ontario)
Calcite veins hosted within nephelinesyenites
(K0.93Na0.08) (Mg1.57Fe2+1.07Fe3+
0.10 Ti0.10 Mn0.06) (Si2.97Al1.00Ti0.03) O10F0.94 Cl0.01 (OH)1.05
5.3346(7) 9.2417(8) 10.182(2) 100.26(1) 3.9
92. Russell and Guggenheim 1999 (heated)
Ferroan phlogopite Silver Crater Mine, Bancroft (Ontario)
Calcite veins hosted within nephelinesyenites
(K0.93Na0.08) (Mg1.57Fe2+1.07Fe3+
0.10 Ti0.10 Mn0.06) (Si2.97Al1.00Ti0.03) O10F0.94 Cl0.01 (OH)1.05
5.3099(5) 9.185(1) 10.093(2) 100.07(1) 3.9
93. Sartori 1976 Trilithionite, Elba Island (Italy)
Graniticpegmatite
(K0.88Na0.06Rb0.05Ca0.01) (Al1.13Li1.31) (Si3.36Al0.64) O10 F1.53 (OH)0.47
5.20(2) 9.01(1) 10.09(1) 99.3(3) 6.7
94. Semenova et al. 1977
Tetra-ferriphlogopite, Kovdor massif
Ultrabasic and alkaline rocks
(K1.03Na0.09Ca0.04) (Mg2.89Fe2+0.16
Mn0.01) (Al0.08Fe3+0.85Ti0.03Si2.98)
O10 (OH)2
5.358(3) 9.297(3) 10.318(2) 100.02(5) 4.2
95. Steinfink 1962 Tetra-ferriphlogopite, Langhan (Sweden)
(K0.90Mn0.10) Mg3.00 [Si3.00 (Fe3+,
Mn)1.00] O10 (OH)2.0
5.36(1) 9.29(2) 10.41(2) 100.0(2) 13.1
96. Takeda and Burnham 1969
Polylithionite Synthetic K1.00 (Li2.00 Al1.00) Si4.00 O10.00 F2.00 5.188(4) 8.968(3) 10.029(5) 100.45(1) 5.1
97. Takeda and Donnay 1966
Lithium-containing phlogopite
Synthetic (K0.95) (Mg2.80Li0.20) (Si3.25Al0.75)O10 F2
5.31 9.21 10.13 100.02 7.5
98. Takeda and Morosin 1975
Fluoro phlogopite (room temperature)
Synthetic (K0.98 Na0.04) Mg2.97 (Si2.98Al1.02)O9.90 (OH0.16,F1.94)
5.3074(6) 9.195(2) 10.134(1) 100.08(1) 4.3
99. Takeda and Ross 1975
Ferroan phlogopite, Ruiz Peak, Valles Mountains, New Mexico
Rhyodacite (K0.78 Na0.16Ba0.02) (Al0.19Fe3+0.19
Fe2+0.71Mg1.68Mn0.01 Ti0.34) (Si2.86
Al1.14) O11.12 F0.17 (OH)0.71
5.331(2) 9.231(4) 10.173(4) 100.16(3) 4.4
100. Tateyama et al. 1974
Tetra-magnesian phlogopite
Synthetic (K0.96Na0.03) Mg2.84 (Si3.63Mg0.31Fe0.03Al0.03) O10 (OH)2
5.321(2) 9.238(1) 10.287(1) 100.06(1) 10.4

67Mica Crystal Chemisrty and Infl uence of P-T-X on Atomistic Models
19.6 107.8 60.0 59.1 2.247 2.061 3.103 0.065 1.688 2.059 2.007 2.592 3.512 -0.342 0.003 -0.339 84.
7.3 110.3 59.5 59.2 2.275 2.112 3.287 0.021 1.655 2.077 2.059 2.962 3.294 -0.331 -0.002 -0.333 85.
8.7 109.0 59.2 59.0 2.270 2.126 3.418 0.005 1.659 2.076 2.064 2.967 3.360 -0.332 -0.003 -0.335 86.
11.2 110.2 59.1 58.9 2.252 2.192 3.459 0.001 1.662 2.072 2.059 2.915 3.424 -0.328 -0.009 -0.337 87.
9.6 110.2 59.1 58.9 2.252 2.130 3.495 0.014 1.660 2.074 2.065 2.968 3.402 -0.336 -0.001 -0.337 88.
8.7 110.2 59.1 59.0 2.252 2.138 3.517 0.006 1.660 2.076 2.072 3.000 3.393 -0.335 -0.001 -0.336 89.
6.7 110.5 58.9 58.8 2.257 2.154 3.532 0.001 1.658 2.085 2.078 3.051 3.352 -0.324 -0.012 -0.336 90.
4.3 110.7 58.7 58.5 2.250 2.175 3.345 0.002 1.650 2.090 2.082 3.051 3.247 -0.336 -0.004 -0.340 91.
4.7 110.6 59.2 59.0 2.269 2.119 3.280 0.016 1.645 2.070 2.059 3.013 3.227 -0.331 -0.001 -0.332 92.
7.4 112.2 60.8 58.5 2.255 2.060 3.387 0.062 1.631 2.113 1.972 2.942 3.269 -0.330 0.017 -0.313 93.
11.5 109.9 59.0 59.0 2.277 2.146 3.460 0.008 1.680 2.086 2.085 2.933 3.458 -0.334 -0.001 -0.335 94.
11.1 110.2 58.1 58.2 2.280 2.218 3.475 0.008 1.681 2.101 2.105 2.945 3.452 -0.338 0.001 -0.337 95.
3.0 113.8 60.2 58.1 2.247 2.095 3.274 0.036 1.619 2.106 1.981 3.000 3.132 -0.351 0.000 -0.351 96.
6.2 110.6 59.4 59.3 2.273 2.102 3.328 0.006 1.651 2.061 2.060 2.995 3.278 -0.333 0.001 -0.332 97.
6.5 110.7 59.4 59.4 2.277 2.095 3.329 0.008 1.650 2.056 2.058 2.987 3.282 -0.335 0.001 -0.334 98.
7.6 110.4 59.2 58.9 2.271 2.138 3.334 0.014 1.659 2.086 2.068 2.972 3.318 -0.335 -0.002 -0.337 99.
7.4 110.8 58.0 58.2 2.230 2.204 3.465 0.016 1.65 2.08 2.09 3.01 3.34 -0.335 -0.003 -0.338 100.

68 Brigatt i & Guggenheim
101. Tepikin et al. 1969
Annite (K0.88Na0.02Ca0.02) (Fe2+2.31Mg0.28
Mn0.02Al0.18Fe3+0.01 Ti0.10Li0.04)
(Si2.71Al1.29) (H3O)0.04 O10 F0.14
(OH)1.86
5.366(5) 9.311(5) 10.16(1) 100.2(2) 13.5
102. Toraya and Marumo 1981 (n # X1.96)
Tetra-germanatian, manganoan fluoro phlogopite
Synthetic K1.0 (Mg1.04Mn1.96) (Ge3.00Al1.00)O10 F2
5.489(1) 9.509(1) 10.462(3) 100.12(2) 5.0
103. Toraya and Marumo1981 (n # X0.68)
Tetra-germanatian, manganoan fluoro phlogopite
Synthetic K1.00 (Mg2.36Mn0.64) (Ge3.00Al1.00)O10 F2
5.435(1) 9.413(2) 10.458(3) 100.03(3) 4.0
104. Toraya et al. 1976 Tetra-silicic fluorophlogopite
Synthtetic K Mg2.5 Si4O10 F2 5.253(1) 9.086(2) 10.159(1) 99.89(3) 3.8
105. Toraya et al. 1977 Tainiolite Synthetic K (Mg2Li) Si4O10 F2 5.231(1) 9.065(2) 10.140(1) 99.86(2) 2.4
106. Toraya et al. 1978a (n # 1)
Tetra-germanatian fluoro phlogopite
Synthetic K1.00 Mg2.50 Ge4.00 O10 F2 5.421(2) 9.353(4) 10.533(2) 100.14(4) 5.5
107. Toraya et al. 1978a (n # 2)
Tetra-germanatian tainiolite
Synthetic K1.00 (Mg2.00Li1.00) Ge4.00 O10 F2 5..395(1) 9.341(2) 10.547(1) 99.87(2) 3.8
108. Toraya et al. 1978b (n # c)
Fluoro phlogopite Synthetic K Mg2.75 (Si3.5Al0.5) O10 F2 5.292(1) 9.164(5) 10.143(1) 100.07(2) 2.9
109. Toraya et al. (1978c)
Tetra-germanatian fluoro phlogopite
Synthetic K Mg3 (Ge3Al) O10 F2 5.417(6) 9.345(5) 10.468(1) 100.03(3) 3.7
110. Toraya et al. 1983 Fluoro phlogopite Synthetic K (Mg2.44Mn0.24) (Si3.82Mn0.18)O10 F2
5.285(1) 9.157(1) 10.190(2) 99.97(2) 4.3
111. Tyrna and Guggenheim 1991
Norrishite, Grenfell New South Wales (Australia)
Metamorphosed stratiform unit
K (Li Mn3+2) Si4 O12 5.289(3) 8.914(3) 10.062(7) 98.22(5) 7.8
112. Weiss et al. 1993 Aluminian fluoro annite, Brooks Mountain, Seward (Alaska)
(K0.92Na0.09Ca0.01Rb0.01) (Fe2+2.02
Al0.47Li0.33Mn0.07Mg0.03) (Si2.98Al1.02) O10 F0.99 Cl0.03 (OH)0.98
5.3655(6) 9.293(1) 10.198(2) 100.47(1) 3.8

69Mica Crystal Chemisrty and Infl uence of P-T-X on Atomistic Models
1.3 110.5 59.6 59.6 2.277 2.107 3.340 0.060 1.668 2.080 2.078 3.134 3.191 -0.330 -0.004 -0.334 101.
13.2 111.4 59.5 59.5 2.419 2.158 3.304 0.006 1.749 2.128 2.123 2.892 3.527 -0.335 0.000 -0.335 102.
15.0 111.5 59.9 59.9 2.421 2.102 3.354 0.004 1.746 2.094 2.095 2.846 3.557 -0.335 0.000 -0.335 103.
1.4 111.8 58.0 58.0 2.243 2.186 3.337 0.003 1.625 2.062 2.064 3.079 3.142 -0.333 +0.001 -0.332 104.
1.1 112.7 57.8 57.9 2.251 2.192 3.297 0.000 1.625 2.058 2.061 3.068 3.116 -0.332 0.000 -0.332 105.
12.9 114.3 60.1 58.4 2.446 2.170 3.306 0.051 1.744 2.178 2.070 2.872 3.480 -0.339 -0.003 -0.342 106.
13.5 114.3 59.3 59.3 2.458 2.138 3.338 0.009 1.744 2.093 2.092 2.861 3.494 -0.333 -0.002 -0.335 107.
3.6 111.1 58.8 58.8 2.258 2.137 3.334 0.000 1.638 2.062 2.063 3.045 3.209 -0.335 0.000 -0.335 108.
15.9 111.5 60.2 60.2 2.425 2.063 3.395 0.005 1.744 2.076 2.078 2.824 3.577 -0.335 -0.002 -0.337 109.
1.7 111.2 58.4 58.4 2.246 2.172 3.372 0.000 1.632 2.071 2.070 3.097 3.174 -0.333 -0.001 -0.334 110.
0.6 112.9 58.6 57.2 2.246 2.213 3.253 0.055 1.621 2.123 2.040 3.063 3.086 -0.274 0.002 -0.272 111.
1.3 110.6 58.9 58.5 2.247 2.180 3.355 0.005 1.656 2.108 2.088 3.133 3.195 -0.341 -0.004 -0.345 112.

70 Brigatt i & Guggenheim
Cell parameters R
Reference (sample number)
Species, locality Rock type Composition
a(Å)
b(Å)
c(Å) (°) (%)
113. Backhaus 1983 Polylithionite, Wakefield (Canada)
(K0.90Na0.08Rb0.04 Cs0.003) (Al1.10Li1.51Fe3+
0.03Fe2+0.15 Mn0.16 Ti0.01)
(Si3.48 Al0.53) O10.38 (OH)0.41 F1.67
5.216(3) 9.005(4) 10.084(3) 100.72(5) 7.3
114. Brigatti et al. 2000b (n # 114)
Ferroan polylithionite, Sentinel Rock, Pikes Peak (Colorado)
Miarolitic cavity in granitic pegmatite
(K0.91Na0.01Rb0.05) (Al1.06Li1.41 Fe3+
0.05Fe2+0.40Mn0.04 Mg0.002Zn0.002)
(Si3.54Al0.46) O10.11 (OH)0.14 F1.75
5.262(1) 9.085(2) 10.099(2) 100.72(1) 3.4
115. Brigatti et al. 2000b (n # 55a)
Ferroan polylithionite, Wigwam Creek, Pikes Peak (Colorado)
Miarolitic cavity in granitic pegmatite
(K0.94Na0.002Rb0.003) (Al1.11Li1.11Fe3+
0.05Fe2+0.53Mg0.01Mn0.04Ti0.01
Zn0.003) (Si3.41Al0.59) O10.17 (OH)0.20
F1.63
5.270(1) 9.092(1) 10.080(2) 100.70(1) 3.7
116. Brigatti et al. 2000b (n # 55b)
Ferroan polylithionite, Wigwam Creek, Pikes Peak (Colorado)
Miarolitic cavity in granitic pegmatite
(K0.96Na0.01Rb0.02) (Al1.06Li1.22 Fe3+
0.06Fe2+0.55 Mg0.005Mn0.05
Zn0.01Ti0.005) (Si3.41Al0.59) O10.23
(OH)0.24 F1.53
5.263(1) 9.085(1) 10.078(1) 100.75(1) 3.2
117. Brigatti et al. 2000b (n # 130-1)
Ferroan polylithionite, Devils Head area, Pikes Peak (Colorado)
Miarolitic cavity in granitic pegmatite
(K0.97Na0.02Ca0.01) (Al1.01Li1.08 Fe3+
0.09Fe2+0.70Mg0.02 Mn0.06Zn0.005
Ti0.002) (Si3.30Al0.70) O10.26 (OH)0.19
F1.55
5.290(1) 9.128(1) 10.093(1) 100.80(1) 3.0
118. Brigatti et al. 2000b (n # 130-2)
Ferroan polylithionite, Devils Head area, Pikes Peak (Colorado)
Miarolitic cavity in granitic pegmatite
(K0.96Na0.02Ca0.006) (Al1.02Li1.09Fe3+
0.06Fe2+0.71Mg0.02Mn0.06Zn0.005
Ti0.005) (Si3.33Al0.67) O10.27 (OH)0.19
F1.54
5.275(2) 9.105(2) 10.084(1) 100.70(1) 3.9
119. Brigatti et al. 2000b (n # 137)
Polylithionite-sidero-phyllite intermediate, Lake George Ring, Pikes Peak (Colorado)
Miarolitic cavity in granitic pegmatite
(K0.94Na0.02) (Al1.05Li0.97Fe3+0.07
Fe2+0.67 Mg0.01Mn0.07Zn0.006Ti0.005)
(Si3.21Al0.79) O10.02 (OH)0.24 F1.74
5.279(1) 9.114(2) 10.077(2) 100.79(1) 3.6
120. Brigatti et al. 2000b (n # 104)
Polylithionite-sidero-phyllite intermediate, Crystal Park, Pikes Peak (Colorado)
Miarolitic cavity in granitic pegmatite
(K0.96Na0.02Ca0.001) (Al1.03Li0.97Fe3+
0.14Fe2+0.64 Mg0.01 Mn0.01
Zn0.005Ti0.01) (Si3.30Al0.70) O10.15
(OH)0.24 F1.61
5.285(1) 9.122(2) 10.101(2) 100.85(1) 3.3
121. Brigatti et al. 2000b (n # 54b)
Polylithionite-sidero-phyllite intermediate, Harris Park, Pikes Peak (Colorado)
Miarolitic cavity in granitic pegmatite
(K0.94Na0.02Rb0.004) (Al1.05Li0.94Fe3+
0.12Fe2+0.61Mg0.01Mn0.06Ti0.006
Zn0.002) (Si3.31Al0.69) O10.10 (OH)0.25
F1.65
5.283(1) 9.123(2) 10.072(2) 100.76(1) 3.8
122. Brigatti et al. 2000b (n # 177)
Polylithionite-sidero-phyllite intermediate, Wigwam Creek, Pikes Peak (Colorado)
Miarolitic cavity in granitic pegmatite
(K0.94Na0.04Rb0.003) (Al0.88Li0.86Fe3+
0.24Fe2+0.65Mg0.01 Mn0.06
Zn0.01Ti0.005) (Si3.23Al0.77) O9.93
(OH)0.15 F1.92
5.288(1) 9.133(1) 10.088(1) 100.81(1) 3.4
123. Brigatti et al. 2000b (n # 140-1)
Polylithionite-sidero-phyllite intermediate, Lake George Ring , Pikes Peak (Colorado)
Miarolitic cavity in granitic pegmatite
(K0.96Na0.01) (Al1.02Li0.86Fe3+0.04
Fe2+0.81Mg0.05Mn0.06 Zn0.01Ti0.03)
(Si3.17Al0.83) O10.13 (OH)0.25 F1.62
5.283(1) 9.118(1) 10.092(1) 100.78(1) 2.9
124. Brigatti et al. 2000b (n # 140-2)
Polylithionite-sidero-phyllite intermediate, Lake George Ring, Pikes Peak (Colorado)
Miarolitic cavity in granitic pegmatite
(K0.96Na0.01) (Al0.98Li0.85Fe3+0.05
Fe2+0.80Mg0.05 Mn0.06 Zn0.01Ti0.025)
(Si3.24Al0.76) O10.11 (OH)0.25 F1.64
5.297(1) 9.146(1) 10.102(1) 100.81(1) 2.7
125. Brigatti et al. 2000b (n # 24)
Polylithionite-sidero-phyllite intermediate, Wigwam Creek, Pikes Peak (Colorado)
Miarolitic cavity in granitic pegmatite
(K0.82Na0.03Rb0.09) (Al1.11Li0.77 Fe3+
0.05Fe2+0.78Mn0.08 Ti0.006Mg0.004
Zn0.002) O10.24 (Si3.31Al0.69) (OH)0.17
F1.59
5.295(1) 9.139(2) 10.077(2) 100.83(2) 3.7
126. Brigatti et al. 2000b (n # 47)
Lithian siderophyllite, Lake George Ring complex, Pikes Peak (Colorado)
Quartz core, graniticpegmatite
(K0.99Na0.01) (Al0.81 Li0.41Fe3+0.09
Fe2+1.40Mg0.04 Mn0.08Zn0.02Ti0.10)
(Si3.06Al0.94) O10.64 (OH)0.28 F1.08
5.339(1) 9.233(1) 10.135(2) 100.73(1) 3.3
127. Brigatti et al. 2000b (n # 103)
Lithian siderophyllite, Crystal Park, Pikes Peak (Colorado)
Quartz core, graniticpegmatite
(K0.99Na0.04Rb0.002) (Al0.90Li0.62Fe3+
0.09Fe2+1.19 Mg0.02 Mn0.05Zn0.01
Ti0.03) (Si3.23Al0.77) O10.55 (OH)0.15
F1.29
5.300(1) 9.144(1) 10.089(2) 100.74(1) 3.6
Table 1b. Structural details of trioctahedral true Micas-1M, space group C2

71Mica Crystal Chemisrty and Infl uence of P-T-X on Atomistic Models
Tetrahedral Octahedral Sheet thickness Interlayer Basal Mean bond lengths A - O Intralayer Layer Overall
(°)
T1
T2(°)
M1
(°)
M2
M3(°)
Tetra-hedral
(Å)
Octa-hedral
(Å)
Separa-tion(Å)
oxygenz
(Å)
T1-OT2-O(Å)
M1-O
(Å)
M2-OM3-O
(Å)
Inner Outer shifta1
offset a1
shifta1
6.0 112.3
112.3
60.5 59.9
57.3
2.257 2.066 3.328 0.109 1.631
1.633
2.098 2.058
1.914
2.958 3.226 -0.356 -0.004 -0.360 113.
3.7 111.9
111.9
60.6 60.6
56.4
2.252 2.086 3.333 0.131 1.632
1.640
2.124 2.122
1.885
3.029 3.195 -0.355 -0.002 -0.357 114.
4.0 111.8
111.7
60.6 56.5
60.6
2.249 2.087 3.319 0.134 1.641
1.635
2.125 1.888
2.124
3.022 3.199 -0.354 -0.001 -0.355 115.
3.8 112.0
111.8
60.6 56.2
60.5
2.246 2.092 3.316 0.135 1.634
1.636
2.129 1.882
2.127
3.022 3.193 -0.355 -0.002 -0.357 116.
5.0 111.2
111.3
60.8 56.7
60.8
2.255 2.075 3.331 0.129 1.649
1.640
2.128 1.890
2.127
3.009 3.236 -0.354 -0.004 -0.358 117.
4.1 111.7
111.6
60.7 56.6
60.7
2.252 2.082 3.323 0.144 1.641
1.637
2.125 1.890
2.125
3.023 3.206 -0.353 -0.002 -0.355 118.
4.3 111.6
111.5
60.7 56.4
60.7
2.250 2.084 3.314 0.109 1.638
1.641
2.129 1.885
2.131
3.018 3.209 -0.355 -0.002 -0.357 119.
4.6 111.4
111.4
60.8 56.6
60.7
2.252 2.081 3.336 0.130 1.644
1.640
2.133 1.890
2.123
3.018 3.226 -0.356 -0.004 -0.360 120.
3.6 111.5
111.5
60.8 56.3
60.7
2.250 2.087 3.308 0.133 1.642
1.639
2.136 1.883
2.132
3.033 3.195 -0.354 -0.002 -0.356 121.
4.5 111.3
111.2
60.7 56.6
60.7
2.250 2.083 3.326 0.128 1.643
1.641
2.130 1.891
2.131
3.021 3.222 -0.355 -0.003 -0.358 122.
4.0 111.5
111.6
60.6 56.4
60.6
2.250 2.093 3.323 0.137 1.643
1.637
2.133 1.891
2.129
3.028 3.208 -0.354 -0.003 -0.357 123.
4.4 111.3
111.3
60.7 56.6
60.7
2.254 2.088 3.326 0.127 1.646
1.643
2.135 1.896
2.131
3.026 3.224 -0.354 -0.004 -0.358 124.
4.8 111.1
111.1
60.9 56.6
60.9
2.250 2.077 3.320 0.141 1.645
1.643
2.134 1.885
2.133
3.015 3.230 -0.355 -0.003 -0.358 125.
3.4 110.5
110.5
59.8 58.0
59.2
2.241 2.138 3.339 0.058 1.658
1.637
2.126 2.017
2.085
3.070 3.224 -0.348 -0.005 -0.353 126.
3.5 111.3
111.3
60.4 56.6
60.3
2.247 2.107 3.310 0.125 1.643
1.641
2.131 1.916
2.129
3.043 3.201 -0.352 -0.003 -0.355 127.

72 Brigatt i & Guggenheim
128. Guggenheim 1981 Polylithionite, Tanakamiyama, Ohtsu, Japan
(K1.01Na0.01 Rb0.03) (Si3.87Al0.13)(Al1.13 Li1.41Fe2+
0.07Mn0.05) O10(OH, F)2
5.242(3) 9.055(6) 10.097(7) 100.77(5) 6.2
129. Guggenheim and Bailey 1977
Polylithionite-sidero-phyllite intermediate, Sadisdorf Mine, Germany
(K0.90Na0.05) (Al1.05Li0.67Fe3+0.16
Fe2+0.77Mg0.01Mn0.05 Ti0.01)
(Si3.09Al0.91) O10 (OH)0.79 F1.21
5.296(1) 9.140(2) 10.096(3) 100.83(2) 5.7
130. Mizota et al. 1986 Masutomilite,Tanaka-miyama, Ohtsu, Japan
(K0.90Na0.08 Rb0.07) (Si3.33Al0.67)(Al0.98Li1.27Mn0.50Fe3+
0.03Fe2+0.09
Ti0.005) O9.82 (OH0.60F1.58)
5.262(2) 9.102(3) 10.094(3) 100.83(2) 4.6
Table 1c. Structural details of trioctahedral true Micas-2M1, space group C2/c
Cell parameters R
Reference (sample number)
Species, locality Rock type Composition a
(Å)
b
(Å)
c
(Å) (°) (%)
131. Bigi and Brigatti 1994 (n # M7)
Ferroan phlogopite Valle del Cervo (Italy)
Syenite (K0.95Na0.03) (Mg1.55Fe3+0.52Fe2+
0.70 Mn0.02Ti0.22) (Si2.78Al1.22) O10.73
(OH)1.27
5.339(1) 9.249(1) 20.196(1) 95.06(1) 2.7
132. Bigi e al. 1993 (n # MP16)
Magnesian annite, Ivrea-Verbano Zone (Italy)
Gabbroic calc-alkaline rock
(K0.92Na0.01Ca0.001Ba0.04) (Fe2+1.36
Mg0.80 Al0.40Fe3+0.17Mn0.01Ti0.26)
(Si2.84 Al1.16) O10.95 (OH)1.05
5.335(2) 9.242(3) 20.106(7) 95.07(3) 3.7
133. Bigi et al. 1993 (n # MP17a)
Ferroan phlogopite Ivrea-Verbano Zone (Italy)
Gabbroic calc-alkaline rock
(K0.98 Ca0.001 Ba0.02) (Mg1.63Al0.23Fe2+
0.81 Mn0.002Ti00.33) (Si2.79 Al1.21)O10.70 F0.31 (OH)0.99
5.328(4) 9.220(3) 20.118(3) 95.11(3) 2.7
134. Bigi et al. 1993 (n # MP17b)
Ferroan phlogopite Ivrea-Verbano Zone (Italy)
Gabbroic calc-alkaline rock
(K0.95Na0.02Ca0.003Ba0.02) (Mg1.57
Al0.34Fe2+0.79Ti0.30Mn0.002) (Si2.87
Al1.13) O10.83 F0.26 (OH)0.91
5.323(1) 9.222(3) 20.130(5) 95.06(2) 3.4
135. Bohlen et al. 1980 Magnesian annite, Au Sable Forks, New York (NortheastAdirondacks)
Orthogneiss (K0.99 Ca0.003Na0.02) (Al0.12Mg1.16
Fe2+1.39 Mn0.007 Ti0.32) (Si2.79 Al1.21)
O10.56 F0.08Cl0.14 (OH)1.22
5.357(6) 9.245(5) 20.234(5) 94.98(4) 4.2
136. Brigatti et al. 2000a (n # C6c)
Magnesian annite, Tinker Glacier, Antarctica
Peraluminous granite
(K0.98Na0.02Ca0.01) (Fe2+1.36Al0.60
Mg.0.71Mn0.04Ti0.16) (Si2.71Al1.29)O10.36 (OH)1.64
5.335(1) 9.242(2) 20.181(4) 95.20(2) 2.8
137. Otha et al. 1982 Ferrian phlogopite, Ruiz Peak, Valles Mountains, New Mexico
Rhyodacite (K0.77Na0.16Ba0.02) (Mg1.67Fe3+0.86
Fe2+0.01Mn0.01Ti0.34 Al0.16) (Si2.84
Al1.16) O11.62 F0.17 (OH)0.21
5.3175(7) 9.212(2) 19.976(3) 95.09(1) 3.9
138. Swanson and Bailey 1981
Polylithionite,Biskupice, Czech Republic
(K0.80Na0.004Cs0.02Rb0.06) (Li1.65Al1.24Mg0.002Fe2+
0.002Ti0.001 Mn0.04)(Si3.62Al0.38) O10 F1.52 (OH)0.48
5.199(1) 9.026(2) 19.969(5) 95.41(2) 9.1
139. Takeda and Ross 1975
Hydrogenated, ferroan phlogopite, Ruiz Peak, Valles Mountains, New Mexico
Rhyodacite (K0.78Na0.16Ba0.02) (Mg1.68Fe3+0.19
Fe2+0.71Mn0.01Ti0.34 Al0.19) (Si2.86
Al1.14) O11.12 F0.17 (OH)0.71
5.329(2) 9.234(3) 20.098(7) 95.09(3) 5.6

73Mica Crystal Chemisrty and Infl uence of P-T-X on Atomistic Models
3.5 112.6
112.5
60.4 56.2
60.5
2.254 2.092 3.318 0.087 1.64
1.63
2.12 1.88
2.12
3.02 3.18 -0.356 -0.004 -0.360 128.
5.8 111.0
111.1
60.8 56.5
60.8
2.252 2.078 3.333 0.127 1.646
1.639
2.132 1.882
2.131
2.990 3.251 -0.354 -0.004 -0.358 129.
4.4 108.8
111.3
60.5 56.4
60.4
2.238 2.098 3.340 0.115 1.626
1.641
2.128 1.893
2.123
3.017 3.215 -0.356 -0.004 -0.360 130.
Tetrahedral OctahedralSheet
Thickness Inter-layer Basal Mean bond lengths A- O
Intra-layer Layer Overall
(°)
T1,T2
(°)
M1
(°)
M2
( 2) (°)
Tetra-hedral
(Å)
Octa-hedral
(Å)
separa-tion(Å)
Oxygenz
(Å)
T1-OT2-O(Å)
M1-O
(Å)
M2-O( 2) (Å)
Inner
(Å)
Outer
(Å)
shifta2, 3
offset a1, 1
shifta1
6.0 110.6
110.7
58.9 58.6 2.257 2.170 3.376 0.018 1.657
1.654
2.097 2.082 3.023 3.297 0.333 -0.001 -0.334 131.
6.8 109.8
109.9
59.3 58.8 2.255 2.144 3.359 0.026 1.639
1.677
2.100 2.071 3.006 3.317 0.330 -0.002 -0.333 132.
7.8 110.2
110.2
59.3 59.0 2.258 2.128 3.374 0.020 1.656
1.658
2.085 2.064 2.977 3.331 0.336 -0.001 -0.336 133.
7.8 110.1
110.0
58.9 58.9 2.244 2.146 3.393 0.006 1.662
1.661
2.074 2.076 2.980 3.337 0.332 0.000 -0.334 134.
5.3 110.2
110.4
58.7 58.4 2.250 2.185 3.393 0.008 1.661
1.656
2.106 2.086 3.046 3.289 0.334 0.001 -0.328 135.
7.8 110.2
110.1
59.4 58.8 2.254 2.135 3.406 0.024 1.658
1.660
2.099 2.063 2.988 3.346 0.338 -0.002 -0.343 136.
7.4 110.2
110.2
59.4 59.1 2.270 2.113 3.295 0.026 1.653
1.656
2.076 2.060 2.960 3.300 0.331 -0.001 -0.333 137.
6.2 112.3
112.2
60.7 58.6 2.256 2.061 3.366 0.072 1.628
1.631
2.107 1.977 2.964 3.237 0.357 -0.003 -0.362 138.
7.7 110.2
110.3
59.2 58.9 2.269 2.135 3.337 0.020 1.662
1.657
2.087 2.068 2.970 3.323 0.334 -0.001 -0.335 139.
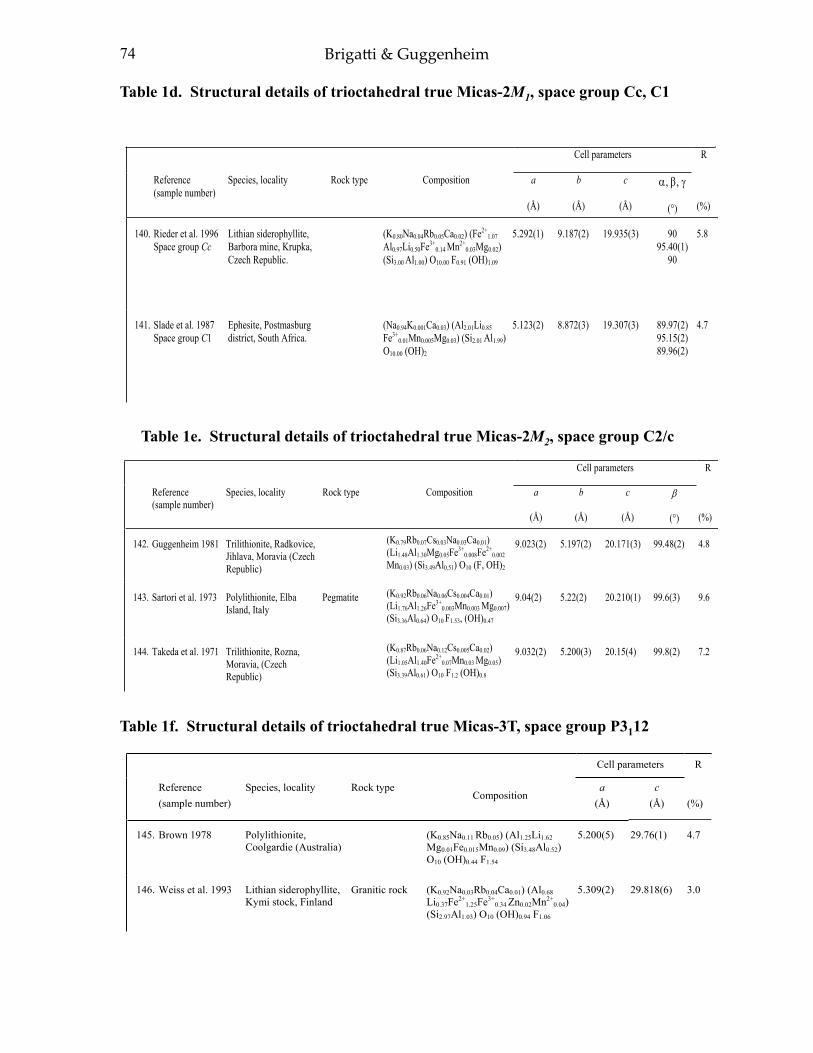
74 Brigatt i & Guggenheim
Table 1d. Structural details of trioctahedral true Micas-2M1, space group Cc, C1
Table 1e. Structural details of trioctahedral true Micas-2M2, space group C2/c
Table 1f. Structural details of trioctahedral true Micas-3T, space group P3112
Cell parameters R
Reference (sample number)
Species, locality Rock type Composition a
(Å)
b
(Å)
c
(Å)
, ,
(°) (%)
140. Rieder et al. 1996 Space group Cc
Lithian siderophyllite, Barbora mine, Krupka, Czech Republic.
(K0.80Na0.04Rb0.05Ca0.02) (Fe2+1.07
Al0.97Li0.50Fe3+0.14 Mn2+
0.03Mg0.02)(Si3.00 Al1.00) O10.00 F0.91 (OH)1.09
5.292(1) 9.187(2) 19.935(3) 9095.40(1)
90
5.8
141. Slade et al. 1987 Space group C1
Ephesite, Postmasburg district, South Africa.
(Na0.94K0.001Ca0.03) (Al2.01Li0.85Fe3+
0.01Mn0.005Mg0.03) (Si2.01 Al1.99)O10.00 (OH)2
5.123(2) 8.872(3) 19.307(3) 89.97(2) 95.15(2) 89.96(2)
4.7
Cell parameters R
Reference (sample number)
Species, locality Rock type Composition a
(Å)
b
(Å)
c
(Å) (°) (%)
142. Guggenheim 1981 Trilithionite, Radkovice, Jihlava, Moravia (Czech Republic)
(K0.79Rb0.07Cs0.03Na0.03Ca0.01)(Li1.48Al1.30Mg0.05Fe3+
0.008Fe2+0.002
Mn0.03) (Si3.49Al0.51) O10 (F, OH)2
9.023(2) 5.197(2) 20.171(3) 99.48(2) 4.8
143. Sartori et al. 1973 Polylithionite, Elba Island, Italy
Pegmatite (K0.92Rb0.06Na0.06Cs0.004Ca0.01)(Li1.76Al1.26Fe3+
0.003Mn0.003 Mg0.007)(Si3.36Al0.64) O10 F1.53, (OH)0.47
9.04(2) 5.22(2) 20.210(1) 99.6(3) 9.6
144. Takeda et al. 1971 Trilithionite, Rozna, Moravia, (Czech Republic)
(K0.87Rb0.06Na0.12Cs0.005Ca0.02)(Li1.05Al1.40Fe2+
0.07Mn0.03 Mg0.05)(Si3.39Al0.61) O10 F1.2 (OH)0.8
9.032(2) 5.200(3) 20.15(4) 99.8(2) 7.2
Cell parameters R
Reference (sample number)
Species, locality Rock type Composition
a(Å)
c(Å) (%)
145. Brown 1978 Polylithionite, Coolgardie (Australia)
(K0.85Na0.11 Rb0.05) (Al1.25Li1.62Mg0.01Fe0.015Mn0.09) (Si3.48Al0.52)O10 (OH)0.44 F1.54
5.200(5) 29.76(1) 4.7
146. Weiss et al. 1993 Lithian siderophyllite, Kymi stock, Finland
Granitic rock (K0.92Na0.03Rb0.04Ca0.01) (Al0.68Li0.37Fe2+
1.25Fe3+0.34 Zn0.02Mn2+
0.04)(Si2.97Al1.03) O10 (OH)0.94 F1.06
5.309(2) 29.818(6) 3.0
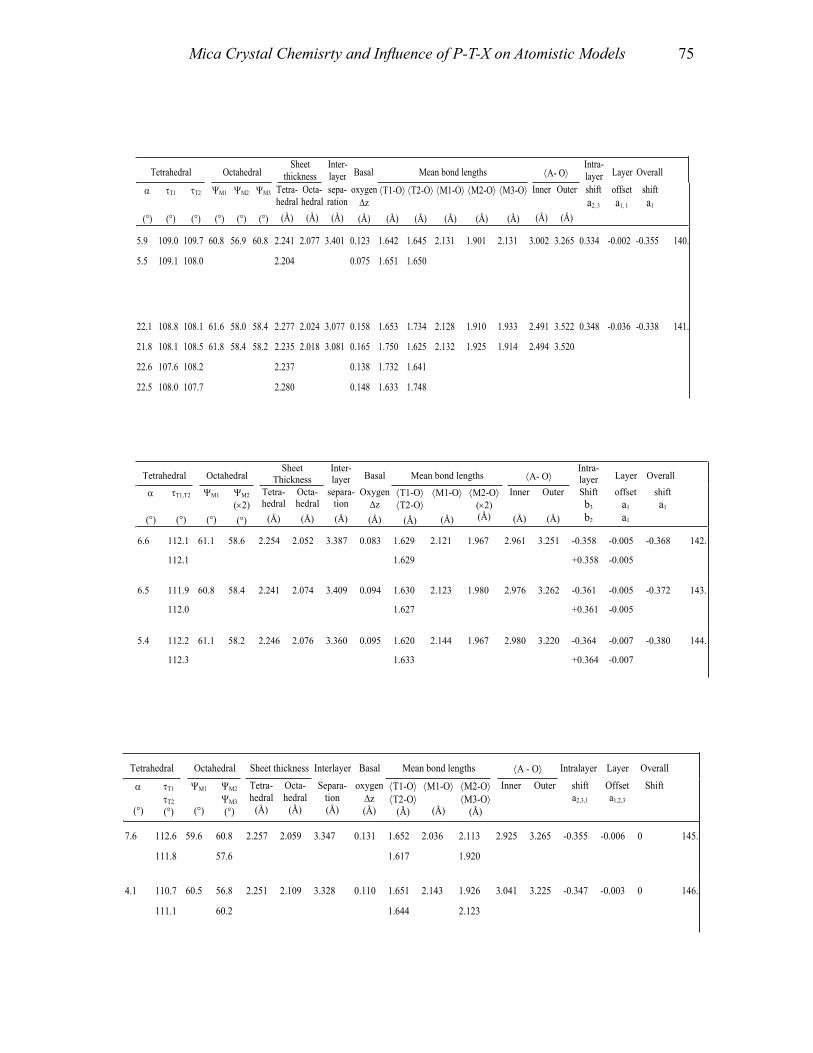
75Mica Crystal Chemisrty and Infl uence of P-T-X on Atomistic Models
Tetrahedral OctahedralSheet
thicknessInter-layer Basal Mean bond lengths A- O
Intra-layer Layer Overall
(°)
T1
(°)
T2
(°)
M1
(°)
M2
(°)
M3
(°)
Tetra-hedral
(Å)
Octa-hedral
(Å)
sepa-ration(Å)
oxygenz
(Å)
T1-O
(Å)
T2-O
(Å)
M1-O
(Å)
M2-O
(Å)
M3-O
(Å)
Inner
(Å)
Outer
(Å)
shifta2, 3
offset a1, 1
shifta1
5.9
5.5
109.0
109.1
109.7
108.0
60.8 56.9 60.8 2.241
2.204
2.077 3.401 0.123
0.075
1.642
1.651
1.645
1.650
2.131 1.901 2.131 3.002 3.265 0.334 -0.002 -0.355 140.
22.1
21.8
22.6
22.5
108.8
108.1
107.6
108.0
108.1
108.5
108.2
107.7
61.6
61.8
58.0
58.4
58.4
58.2
2.277
2.235
2.237
2.280
2.024
2.018
3.077
3.081
0.158
0.165
0.138
0.148
1.653
1.750
1.732
1.633
1.734
1.625
1.641
1.748
2.128
2.132
1.910
1.925
1.933
1.914
2.491
2.494
3.522
3.520
0.348 -0.036 -0.338 141.
Tetrahedral OctahedralSheet
Thickness Inter-layer Basal Mean bond lengths A- O
Intra-layer Layer Overall
(°)
T1,T2
(°)
M1
(°)
M2
( 2) (°)
Tetra-hedral
(Å)
Octa-hedral
(Å)
separa-tion(Å)
Oxygenz
(Å)
T1-OT2-O(Å)
M1-O
(Å)
M2-O( 2) (Å)
Inner
(Å)
Outer
(Å)
Shiftb3
b2
offset a1
a1
shifta1
6.6 112.1
112.1
61.1 58.6 2.254 2.052 3.387 0.083 1.629
1.629
2.121 1.967 2.961 3.251 -0.358
+0.358
-0.005
-0.005
-0.368 142.
6.5 111.9
112.0
60.8 58.4 2.241 2.074 3.409 0.094 1.630
1.627
2.123 1.980 2.976 3.262 -0.361
+0.361
-0.005
-0.005
-0.372 143.
5.4 112.2
112.3
61.1 58.2 2.246 2.076 3.360 0.095 1.620
1.633
2.144 1.967 2.980 3.220 -0.364
+0.364
-0.007
-0.007
-0.380 144.
Tetrahedral Octahedral Sheet thickness Interlayer Basal Mean bond lengths A - O Intralayer Layer Overall
(°)
T1
T2
(°)
M1
(°)
M2
M3
(°)
Tetra-hedral
(Å)
Octa-hedral
(Å)
Separa-tion(Å)
oxygenz
(Å)
T1-OT2-O(Å)
M1-O
(Å)
M2-OM3-O
(Å)
Inner Outer shifta2,3,1
Offset a1,2,3
Shift
7.6 112.6
111.8
59.6 60.8
57.6
2.257 2.059 3.347 0.131 1.652
1.617
2.036 2.113
1.920
2.925 3.265 -0.355 -0.006 0 145.
4.1 110.7
111.1
60.5 56.8
60.2
2.251 2.109 3.328 0.110 1.651
1.644
2.143 1.926
2.123
3.041 3.225 -0.347 -0.003 0 146.

76 Brigatt i & Guggenheim
TABLE 2. STRUCTURAL DETAILS OF DIOCTAHEDRAL TRUE MICAS
Table 2a . Structural details of trioctahedral true Micas-1M,
space groups C2/m and C2
Cell parameters R
Reference (sample number)
Species, locality Rock type Composition a
(Å)
b
(Å)
c
(Å) (°) (%)
1. Sidorenko et al. 1975 (Space group C2)
Muscovite, Transbaikal, Siberia, Russia
(K0.65Na0.03) (Al1.83Fe3+0.03Fe2+
0.04 Mg0.10 Mn0.04) (Si3.51Al0.49) O10.13F0.07 (OH)1.80
5.186 8.952 10.12 101.8 10.9
2. Soboleva et al. 1977 (Space group C2/m)
Paragonite Synthetic Na0.91 Al1.88 (Si3.45Al0.55) O10 (OH)2 5.135 8.890 9.74 99.7 12.1
3. Zhukhlistov et al. 1977 (Space group C2/m)
Celadonite, Krivoj Rog, Ukraine
Iron-ore basin (K0.83Na0.01Ca0.04)(Al0.05Fe3+
1.15Fe2+0.36 Mg0.41Ti0.01)
(Si3.94Al0.06) O10 F0.01 (OH)1.99
5.23 9.05 10.15 100.5 10.8

77Mica Crystal Chemisrty and Infl uence of P-T-X on Atomistic Models
Tetrahedral Octahedral Sheet thickness Interlayer Basal
oxygen Mean bond lengths A - O Intralayer Layer Overall
(°) (°)
M1vacancy
(°)
M2,M3
(°)
Tetra-hedral
(Å)
Octa-hedral
(Å)
separa-tion(Å)
z
(Å)
T-O
(Å)
M1-Ovacancy
(Å)
M2-OM3-O
(Å)
Inner Outer shifta1
offset a1
shifta1
9.3 110.1
111.1
61.6 56.6
57.3
2.196 2.113 3.399 0.220 1.614
1.633
2.221 1.920
1.957
2.897 3.306 -0.376 -0.024 -0.400 1.
19.1 110.4 2 59.9 57.8 2 2.222 2.099 3.059 0.096 1.659 2 2.091 1.971 2 2.561 3.441 -0.338 0.020 -0.319 2.
1.3 112.6 2 58.3 56.6 2 2.248 2.249 3.233 0.000 1.636 2 2.141 2.043 2 3.044 3.103 -0.354 -0.002 -0.356 3.
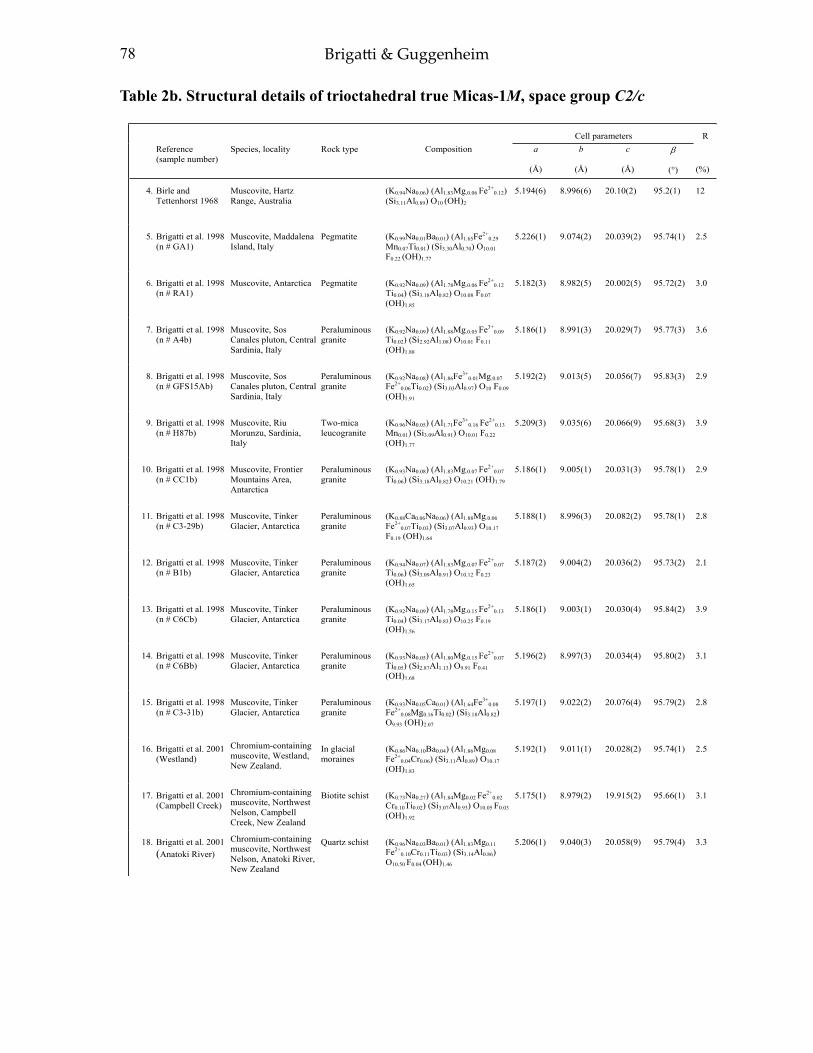
78 Brigatt i & Guggenheim
Table 2b. Structural details of trioctahedral true Micas-1M, space group C2/c
Cell parameters RReference (sample number)
Species, locality Rock type Composition a
(Å)
b
(Å)
c
(Å) (°) (%)
4. Birle and Tettenhorst 1968
Muscovite, Hartz Range, Australia
(K0.94Na0.06) (Al1.83Mg.0.06 Fe3+0.12)
(Si3.11Al0.89) O10 (OH)2
5.194(6) 8.996(6) 20.10(2) 95.2(1) 12
5. Brigatti et al. 1998 (n # GA1)
Muscovite, Maddalena Island, Italy
Pegmatite (K0.99Na0.01Ba0.01) (Al1.65Fe2+0.29
Mn0.07Ti0.01) (Si3.30Al0.70) O10.01F0.22 (OH)1.77
5.226(1) 9.074(2) 20.039(2) 95.74(1) 2.5
6. Brigatti et al. 1998 (n # RA1)
Muscovite, Antarctica Pegmatite (K0.92Na0.09) (Al1.78Mg.0.06 Fe2+0.12
Ti0.04) (Si3.18Al0.82) O10.08 F0.07 (OH)1.85
5.182(3) 8.982(5) 20.002(5) 95.72(2) 3.0
7. Brigatti et al. 1998 (n # A4b)
Muscovite, Sos Canales pluton, Central Sardinia, Italy
Peraluminous granite
(K0.92Na0.09) (Al1.88Mg.0.05 Fe3+0.09
Ti0.02) (Si2.92Al1.08) O10.01 F0.11
(OH)1.88
5.186(1) 8.991(3) 20.029(7) 95.77(3) 3.6
8. Brigatti et al. 1998 (n # GFS15Ab)
Muscovite, Sos Canales pluton, Central Sardinia, Italy
Peraluminous granite
(K0.92Na0.08) (Al1.86Fe3+0.01Mg.0.07
Fe2+0.06Ti0.02) (Si3.03Al0.97) O10 F0.09
(OH)1.91
5.192(2) 9.013(5) 20.056(7) 95.83(3) 2.9
9. Brigatti et al. 1998 (n # H87b)
Muscovite, Riu Morunzu, Sardinia, Italy
Two-mica leucogranite
(K0.96Na0.05) (Al1.71Fe3+0.16 Fe2+
0.13
Mn0.01) (Si3.09Al0.91) O10.01 F0.22(OH)1.77
5.209(3) 9.035(6) 20.066(9) 95.68(3) 3.9
10. Brigatti et al. 1998 (n # CC1b)
Muscovite, Frontier Mountains Area, Antarctica
Peraluminous granite
(K0.93Na0.08) (Al1.83Mg.0.07 Fe2+0.07
Ti0.06) (Si3.18Al0.82) O10.21 (OH)1.79
5.186(1) 9.005(1) 20.031(3) 95.78(1) 2.9
11. Brigatti et al. 1998 (n # C3-29b)
Muscovite, Tinker Glacier, Antarctica
Peraluminous granite
(K0.88Ca0.06Na0.06) (Al1.88Mg.0.06 Fe2+
0.07Ti0.03) (Si3.07Al0.93) O10.17F0.19 (OH)1.64
5.188(1) 8.996(3) 20.082(2) 95.78(1) 2.8
12. Brigatti et al. 1998 (n # B1b)
Muscovite, Tinker Glacier, Antarctica
Peraluminous granite
(K0.94Na0.07) (Al1.83Mg.0.07 Fe2+0.07
Ti0.06) (Si3.09Al0.91) O10.12 F0.23 (OH)1.65
5.187(2) 9.004(2) 20.036(2) 95.73(2) 2.1
13. Brigatti et al. 1998 (n # C6Cb)
Muscovite, Tinker Glacier, Antarctica
Peraluminous granite
(K0.92Na0.09) (Al1.78Mg.0.15 Fe2+0.13
Ti0.04) (Si3.17Al0.83) O10.25 F0.19
(OH)1.56
5.186(1) 9.003(1) 20.030(4) 95.84(2) 3.9
14. Brigatti et al. 1998 (n # C6Bb)
Muscovite, Tinker Glacier, Antarctica
Peraluminous granite
(K0.93Na0.05) (Al1.80Mg.0.15 Fe2+0.07
Ti0.05) (Si2.87Al1.13) O9.91 F0.41
(OH)1.68
5.196(2) 8.997(3) 20.034(4) 95.80(2) 3.1
15. Brigatti et al. 1998 (n # C3-31b)
Muscovite, Tinker Glacier, Antarctica
Peraluminous granite
(K0.93Na0.05Ca0.01) (Al1.64Fe3+0.08
Fe2+0.08Mg0.16Ti0.02) (Si3.18Al0.82)
O9.93 (OH)2.07
5.197(1) 9.022(2) 20.076(4) 95.79(2) 2.8
16. Brigatti et al. 2001 (Westland)
Chromium-containing muscovite, Westland, New Zealand.
In glacial moraines
(K0.86Na0.10Ba0.04) (Al1.86Mg0.08
Fe2+0.04Cr0.06) (Si3.11Al0.89) O10.17
(OH)1.83
5.192(1) 9.011(1) 20.028(2) 95.74(1) 2.5
17. Brigatti et al. 2001 (Campbell Creek)
Chromium-containing muscovite, Northwest Nelson, Campbell Creek, New Zealand
Biotite schist (K0.73Na0.27) (Al1.84Mg0.02 Fe2+0.02
Cr0.10Ti0.02) (Si3.07Al0.93) O10.05 F0.03 (OH)1.92
5.175(1) 8.979(2) 19.915(2) 95.66(1) 3.1
18. Brigatti et al. 2001 (Anatoki River)
Chromium-containing muscovite, Northwest Nelson, Anatoki River, New Zealand
Quartz schist (K0.96Na0.03Ba0.01) (Al1.83Mg0.11 Fe2+
0.10Cr0.11Ti0.03) (Si3.14Al0.86)O10.50 F0.04 (OH)1.46
5.206(1) 9.040(3) 20.058(9) 95.79(4) 3.3

79Mica Crystal Chemisrty and Infl uence of P-T-X on Atomistic Models
Table 1a . Structural details of trioctahedral true micas-2M1, C12/c(1) layer symmetry (May 20, 2000)
Tetrahedral Octahedral Sheet thickness Inter-layer
Basaloxygen Mean bond lengths A- O
Intra-layer Layer Overall
(°)
T1,
T2
(°)
M1
vacancy
(°)
M2
( 2)(°)
Tetra-hedral
(Å)
Octa-hedral
(Å)
separa-tion(Å)
z
(Å)
T1-OT2-O(Å)
M1-Ovacancy
(Å)
M2-O( 2)(Å)
Inner
(Å)
Outer
(Å)
shifta2, 3
offset a1, 1
shifta1
12.0 110.6
111.2
62.4 57.0 2.243 2.097 3.427 0.236 1.660
1.636
2.259 1.925 2.852 3.385 0.368 0.002 -0.349 4.
7.7 111.5
111.5
61.8 57.4 2.247 2.107 3.368 0.179 1.640
1.640
2.230 1.953 2.943 3.287 0.374 -0.005 -0.384 5.
11.3 111.0
111.1
62.3 57.1 2.242 2.088 3.378 0.223 1.643
1.639
2.243 1.923 2.849 3.351 0.378 -0.002 -0.385 6.
11.2 111.1
111.1
62.1 57.1 2.242 2.095 3.385 0.223 1.642
1.640
2.242 1.928 2.854 3.354 0.378 -0.005 -0.388 7.
11.2 110.9
110.8
62.3 57.2 2.242 2.087 3.405 0.225 1.644
1.643
2.244 1.928 2.864 3.362 0.379 -0.006 -0.392 8.
10.1 111.2
111.1
62.0 57.3 2.251 2.099 3.383 0.214 1.641
1.647
2.237 1.941 2.887 3.336 0.374 -0.004 -0.381 9.
11.1 111.0
111.0
62.2 57.2 2.242 2.090 3.391 0.221 1.642
1.642
2.243 1.928 2.860 3.354 0.377 -0.006 -0.389 10.
11.4 111.0
111.0
62.3 57.2 2.246 2.089 3.409 0.230 1.645
1.644
2.247 1.925 2.858 3.364 0.377 -0.006 -0.390 11.
10.8 111.1
111.1
62.3 57.1 2.245 2.091 3.388 0.219 1.642
1.641
2.245 1.927 2.865 3.347 0.376 -0.005 -0.386 12.
11.3 111.0
110.9
62.3 57.2 2.241 2.088 3.393 0.225 1.644
1.642
2.245 1.926 2.857 3.358 0.378 -0.007 -0.393 13.
11.0 111.1
111.0
62.2 57.2 2.242 2.090 3.391 0.219 1.641
1.644
2.244 1.928 2.863 3.353 0.377 -0.006 -0.390 14.
10.9 111.2
111.1
62.2 57.1 2.248 2.097 3.393 0.224 1.647
1.645
2.251 1.931 2.868 3.356 0.377 -0.006 -0.390 15.
11.4 111.1
111.1
62.2 57.1 2.250 2.095 3.369 0.223 1.646
1.646
2.244 1.931 2.848 3.358 0.377 -0.005 -0.386 16.
12.3 111.0
110.9
62.2 57.0 2.242 2.095 3.329 0.228 1.645
1.644
2.244 1.925 2.810 3.361 0.376 -0.002 -0.380 17.
10.5 111.5
111.2
62.1 57.2 2.252 2.099 3.374 0.196 1.642
1.650
2.246 1.937 2.875 3.344 0.379 -0.006 -0.389 18.

80 Brigatt i & Guggenheim
19. Catti et al. 1989 (T = 25°C)
Muscovite, Monte Botte Donato, Calabria, Italy
Pegmatite (K0.86Na0.11) (Al1.93 Fe0.07Mg.0.02)(Si3.08Al0.92) O10 (OH)2
5.191(1) 9.006(3) 20.068(6) 95.77(2) 4.8
20. Catti et al. 1989, (T = 700°C)
Muscovite, Monte Botte Donato, Calabria, Italy
Pegmatite (K0.86Na0.11) (Al1.93 Fe0.07Mg.0.02)(Si3.08Al0.92) O10 (OH)2
5.229(1) 9.076(3) 20.322(8) 95.74(3) 6.0
21. Catti et al. 1994 (Room pressure)
Muscovite, Effingham Township, Ontario
Granitepegmatite
(K0.90Na0.07) (Al1.63Fe0.23Mg0.16
Ti0.03) (Si3.20Al0.80) O10 (OH)2
5.2108(4) 9.0399(8) 20.021(2) 95.76(1) 4.0
22. Comodi and Zanazzi 1997 (n # AL433, 0.001 Kbar)
Paragonite, Western Alps, Italy
(Na0.88K0.10Ca0.01Ba0.01) (Al1.97Fe0.01Mn0.002Mg0.006Ti0.007) (Si3.01Al0.99) O10 (OH)2
5.135(1) 8.906(1) 19.384(4) 94.6(1) 2.1
23. Comodi and Zanazzi 1997 (n # AL433, 0.5 Kbar)
Paragonite, Western Alps, Italy
(Na0.88K0.10Ca0.01Ba0.01) (Al1.97Fe0.01Mn0.002Mg0.006Ti0.007) (Si3.01Al0.99) O10 (OH)2
5.134(3) 8.906(5) 19.32(1) 94.5(2) 6.1
24. Comodi and Zanazzi 1997 (n # AL433, 25.4 Kbar)
Paragonite, Western Alps, Italy
(Na0.88K0.10Ca0.01Ba0.01) (Al1.97Fe0.01Mn0.002Mg0.006Ti0.007) (Si3.01Al0.99) O10 (OH)2
5.082(2) 8.813(5) 18.91(1) 94.7(2) 7.0
25. Comodi and Zanazzi 1997 (n # AL433, 40.5 Kbar)
Paragonite, Western Alps, Italy
(Na0.88K0.10Ca0.01Ba0.01) (Al1.97Fe0.01Mn0.002Mg0.006Ti0.007) (Si3.01
Al0.99) O10 (OH)2
5.062(2) 8.769(3) 18.64(2) 95.2(2) 6.5
26. Comodi and Zanazzi 2000 (n # AMNH104213) (T = 25°C)
Paragonite, Guatemala (Na0.91K0.07Ca0.01Ba0.01) (Al1.99Fe0.01Mn0.001Mg0.02Ti0.005) (Si2.92
Al1.08) O10 (OH)2
5.140(2) 8.911(5) 19.38(1) 94.62(1) 3.7
27. Comodi and Zanazzi 2000 (n # AMNH104213) (T = 210°C)
Paragonite, Guatemala (Na0.91K0.07Ca0.01Ba0.01) (Al1.99
Fe0.01Mn0.001Mg0.02Ti0.005) (Si2.92Al1.08) O10 (OH)2
5.152(2) 8.941(5) 19.46(1) 94.26(1) 2.5
28. Comodi and Zanazzi 2000 (n # AMNH104213) (T = 450°C)
Paragonite, Guatemala (Na0.91K0.07Ca0.01Ba0.01) (Al1.99Fe0.01Mn0.001Mg0.02Ti0.005) (Si2.92Al1.08) O10 (OH)2
5.173(2) 8.985(5) 19.55(1) 93.58(1) 2.9
29. Comodi and Zanazzi 2000 (n # AMNH104213) (T = 600°C)
Paragonite, Guatemala (Na0.91K0.07Ca0.01Ba0.01) (Al1.99Fe0.01Mn0.001Mg0.02Ti0.005) (Si2.92Al1.08) O10 (OH)2
5.190(3) 9.011(6) 19.60(2) 92.96(1) 4.4
30. Evsyunin et al. 1997
Chromphyllite, Slyudyanka, Irkutsk region
(K0.82Ba0.14Na0.04) (Cr3+1.42Al0.27
V3+0.13Mg0.18Fe2+
0.01) (Si3.02 Al0.98)O10 F0.30 (OH)1.66
5.240(3) 9.103(2) 19.93(4) 95.59(3) 4.8
31. Guggenheim et al. 1987 (T = 20°C)
Muscovite, Diamond mine, Keystone, South Dakota
Pegmatite (K0.93Na0.08Ca0.01) (Al1.83Fe0.16 Mg0.01Mn0.01) (Si3.10Al0.90) O10 F0.17
(OH)1.83
5.200(4) 9.021(7) 20.07(2) 95.71(7) 4.0
32. Guggenheim et al. 1987 (T = 300°C)
Muscovite, Diamond mine, Keystone, South Dakota
Pegmatite (K0.93Na0.08Ca0.01) (Al1.83Fe0.16 Mg0.01Mn0.01) (Si3.10Al0.90) O10 F0.17
(OH)1.83
5.215(2) 9.053(4) 20.15(1) 95.72(3) 5.3
33. Guggenheim et al. 1987 (T = 20°C)
Muscovite, Panasqueira, Portugal
(K1.00Na0.03Ca0.01) (Al1.93Fe2+0.01
Mg0.01Mn0.01) (Si3.09Al0.91) O10 F0.12(OH)1.88
5.1579(9) 8.9505(8) 20.071(5) 95.75(2) 5.2
34. Guggenheim et al. 1987 (T = 525°C)
Muscovite, Panasqueira, Portugal
(K1.00Na0.03Ca0.01) (Al1.93Fe2+0.01
Mg0.01Mn0.01) (Si3.09Al0.91) O10 F0.12(OH)1.88
5.182(1) 8.993(1) 20.232(5) 95.75(2) 6.9
35. Guggenheim et al. 1987 (T = 650°C)
Muscovite, Panasqueira, Portugal
(K1.00Na0.03Ca0.01) (Al1.93Fe2+0.01
Mg0.01Mn0.01) (Si3.09Al0.91) O10 F0.12(OH)1.88
5.189(1) 9.004(1) 20.256(6) 95.74(2) 7.3

81Mica Crystal Chemisrty and Infl uence of P-T-X on Atomistic Models
11.8 111.0
111.0
62.4 57.2 2.248 2.089 3.398 0.232 1.647
1.647
2.251 1.925 2.848 3.373 0.377 -0.005 -0.389 19.
8.2 111.2
111.1
62.5 57.2 2.257 2.100 3.495 0.212 1.642
1.646
2.274 1.936 2.970 3.332 0.380 -0.005 -0.389 20.
9.5 109.8
110.7
62.0 57.2 2.241 2.108 3.370 0.229 1.645
1.640
2.241 1.943 2.897 3.322 0.372 -0.005 -0.386 21.
16.0 110.4
110.4
62.0 56.9 2.243 2.085 3.089 0.234 1.654
1.651
2.225 1.912 2.642 3.375 0.373 0.036 -0.303 22.
16.3 110.3
110.0
62.1 57.0 2.247 2.080 3.056 0.193 1.65
1.65
2.22 1.91 2.63 3.37 0.372 0.036 -0.295 23.
17.9 111.5
112.7
62.6 57.9 2.306 1.998 2.814 0.188 1.68
1.67
2.17 1.88 2.50 3.30 0.364 0.024 -0.305 24.
18.4 111.5
112.1
62.5 57.8 2.252 1.980 2.797 0.167 1.68
1.65
2.14 1.86 2.48 3.33 0.366 0.015 -0.334 25.
16.2 110.4
110.4
62.0 56.9 2.246 2.092 3.074 0.232 1.656
1.654
2.225 1.915 2.634 3.378 0.373 0.037 -0.304 26.
15.3 110.4
110.4
62.1 57.0 2.247 2.091 3.118 0.225 1.655
1.652
2.233 1.918 2.672 3.375 0.374 0.049 -0.281 27.
14.3 110.4
110.5
62.2 57.0 2.248 2.096 3.167 0.238 1.655
1.651
2.243 1.925 2.722 3.372 0.374 0.070 -0.236 28.
12.9 110.3
110.3
62.2 57.1 2.244 2.101 3.200 0.243 1.652
1.648
2.256 1.932 2.768 3.359 0.374 0.090 -0.195 29.
7.3 111.6
111.6
61.2 57.3 2.252 2.136 3.278 0.155 1.644
1.643
2.213 1.976 2.933 3.260 0.368 -0.002 -0.370 30.
11.3 111.0
111.2
62.1 57.2 2.249 2.098 3.388 0.216 1.646
1.647
2.243 1.935 2.858 3.364 0.376 -0.004 -0.384 31.
10.3 111.0
111.0
62.2 57.1 2.246 2.105 3.427 0.229 1.649
1.645
2.256 1.939 2.898 3.358 0.377 -0.004 -0.385 32.
11.8 110.9
110.8
62.2 57.1 2.234 2.081 3.436 0.218 1.635
1.637
2.234 1.916 2.848 3.368 0.377 -0.006 -0.390 33.
9.8 111.2
111.1
62.3 57.1 2.241 2.091 3.492 0.213 1.637
1.635
2.246 1.925 2.916 3.347 0.379 -0.006 -0.391 34.
9.2 111.1
111.2
62.3 57.1 2.241 2.091 3.506 0.220 1.636
1.634
2.249 1.926 2.935 3.340 0.379 -0.006 -0.390 35.

82 Brigatt i & Guggenheim
36. Güven 1971b Muscovite, Georgia Pegmatite [K0.86Na0.10 (H+3°)0.01] (Al1.90
Mg.0.06Fe3+0.02Fe2+
0.05 Ti0.01)(Si3.02Al0.98) O10 F0.01 (OH)1.99
5.1906(2) 9.0080(3) 20.0470(6) 95.757(2) 3.5
37. Güven 1971b Magnesian muscovite, Tiburon Peninsula, California
Schist (K0.87Na0.07Ba 0.01Ca 0.02) (Al1.43Mg.0.50Fe3+
0.05Fe2+0.09 Ti0.01)
(Si3.39Al0.61) O10.08 (OH)1.92
5.2112(3) 9.0383(4) 19.9473(6) 95.769(5) 4.5
38. Knurr and Bailey 1986
Muscovite, Minas Gerais, Brazil
Metamorphosed sedimentary manganese deposits
(K0.93Na0.05Ba 0.007) (Al1.72Mg.0.10
Fe3+0.15Mn3+
0.02Ti0.02) (Si3.06 Al0.94)O10 (OH)2
5.2044(8) 9.018(2) 20.073(5) 95.82(2) 2.7
39. Lin and Bailey 1984 (n # PWB 1705)
Paragonite, Zermatt-Saas Fee, Swiss Alps
Glaucophane-bearing metamorphosed eclogite
(Na0.92K0.04Ca 0.02) (Al1.99Mg.0.01 Fe0.03Ti0.003) (Si2.94Al1.06) O10(OH)2
5.128(2) 8.898(3) 19.287(9) 94.35(3) 4.5
40. Brigatti et al. 2001 (n # 39)
Muscovite, Fregeneda, Portugal
Graniticpegmatite
(K0.94Na0.05Rb0.01) (Al1.94Fe2+0.08
Mg0.02Li0.03) (Si3.07Al0.93) O10.12F0.09 (OH)1.79
5.193(1) 9.016(3) 20.114(5) 95.77(2) 3.5
41. Brigatti et al. 2001 (n # 147)
Lithian, ferroan muscovite, Pikes Peak, Colorado
Graniticpegmatite
(K0.96Na0.01Rb0.03) (Al1.49Fe3+0.07
Fe2+0.39Mn0.01Li0.28) (Si3.24Al0.76)
O10.0 F0.43 (OH)1.57
5.209(2) 9.038(3) 19.997(5) 95.70(3) 4.1
42. Brigatti et al. 2001 (n # 129)
Lithian, ferroan muscovite, Pikes Peak, Colorado
Graniticpegmatite
(K0.98Na0.02Rb0.02) (Al1.45Fe3+0.08
Fe2+0.33Mn0.03Ti0.01 Li0.37) (Si3.28
Al0.72) O10.0 F0.57 (OH)1.43
5.224(1) 9.081(3) 19.952(4) 95.63(2) 3.5
43. Brigatti et al. 2001 (n # 2b)
Muscovite, Argemela, Portugal
Granite (K0.86Na0.15Rb0.02) (Al1.79Fe2+0.13
Mg0.01Mn0.01Li0.12) (Si3.19Al0.81)O10.0 F0.29 (OH)1.71
5.190(2) 9.022(3) 20.057(4) 95.60(7) 3.3
44. Brigatti et al. 2001 (n # 2a)
Muscovite, Argemela, Portugal
Granite (K0.86Na0.15Rb0.02) (Al1.81Fe2+0.13
Mg0.01Mn0.01Li0.12) (Si3.13Al0.87)O10.0 F0.29 (OH)1.71
5.197(1) 9.019(2) 20.068(3) 95.71(1) 4.2
45. Richardson and Richardson 1982
Muscovite, Archer’s Post, Kenya
(K0.88Na0.03Ca0.01) (Al1.87Ti0.03 Mg0.06 Mn3+
0.03) (Si3.01Al0.85 Fe3+
0.14) O10 (OH)2
5.199(2) 9.027(2) 20.106(4) 95.78(4) 9.9
46. Rothbauer 1971 Muscovite, Diamond Mine, Black Hills, South Dakota
Pegmatite (K0.85Na0.09) (Al1.81Fe2+0.14 Mg0.12)
(Si3.09Al0.91) O9.81 F0.19 (OH)2
5.1918(2) 9.0155(5) 20.0457(7) 95.735(3) 2.7
47. Rule and Bailey 1985
Magnesium-containing muscovite, Rio de Oro, Sahara
(K0.95Na0.05Ba0.03) (Al1.51Mg0.27 Fe0.14Cr0.10Ti0.01Mn0.003) (Si3.25Al0.75) O10 (OH)2
5.2153(5) 9.043(2) 19.974(9) 95.789(9) 3.3
48. Sidorenko et al. 1977a
Paragonite, Southern Urals
Pyroclastic rock (K0.10Na0.60Ca0.03) (Al1.93 Mg0.10 Fe2+
0.02) (Si2.98 Al1.02) O8.78 (OH)2.22
5.135 8.894 19.365 94.10 11.1
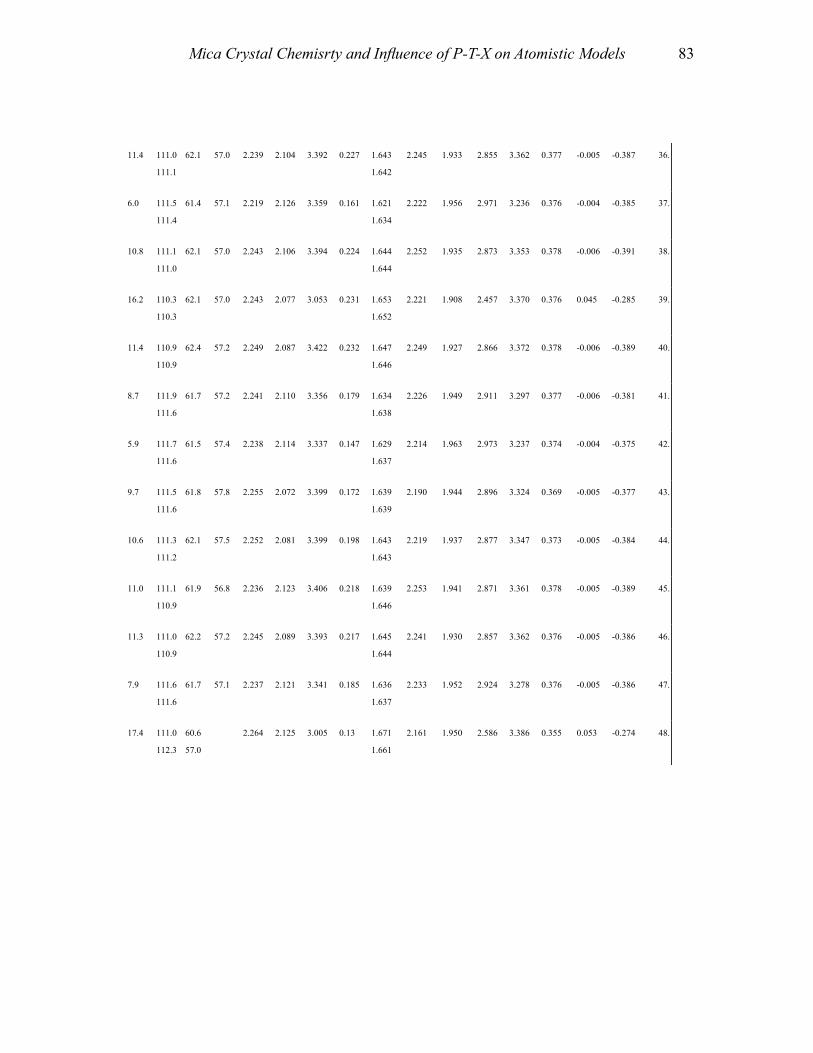
83Mica Crystal Chemisrty and Infl uence of P-T-X on Atomistic Models
11.4 111.0
111.1
62.1 57.0 2.239 2.104 3.392 0.227 1.643
1.642
2.245 1.933 2.855 3.362 0.377 -0.005 -0.387 36.
6.0 111.5
111.4
61.4 57.1 2.219 2.126 3.359 0.161 1.621
1.634
2.222 1.956 2.971 3.236 0.376 -0.004 -0.385 37.
10.8 111.1
111.0
62.1 57.0 2.243 2.106 3.394 0.224 1.644
1.644
2.252 1.935 2.873 3.353 0.378 -0.006 -0.391 38.
16.2 110.3
110.3
62.1 57.0 2.243 2.077 3.053 0.231 1.653
1.652
2.221 1.908 2.457 3.370 0.376 0.045 -0.285 39.
11.4 110.9
110.9
62.4 57.2 2.249 2.087 3.422 0.232 1.647
1.646
2.249 1.927 2.866 3.372 0.378 -0.006 -0.389 40.
8.7 111.9
111.6
61.7 57.2 2.241 2.110 3.356 0.179 1.634
1.638
2.226 1.949 2.911 3.297 0.377 -0.006 -0.381 41.
5.9 111.7
111.6
61.5 57.4 2.238 2.114 3.337 0.147 1.629
1.637
2.214 1.963 2.973 3.237 0.374 -0.004 -0.375 42.
9.7 111.5
111.6
61.8 57.8 2.255 2.072 3.399 0.172 1.639
1.639
2.190 1.944 2.896 3.324 0.369 -0.005 -0.377 43.
10.6 111.3
111.2
62.1 57.5 2.252 2.081 3.399 0.198 1.643
1.643
2.219 1.937 2.877 3.347 0.373 -0.005 -0.384 44.
11.0 111.1
110.9
61.9 56.8 2.236 2.123 3.406 0.218 1.639
1.646
2.253 1.941 2.871 3.361 0.378 -0.005 -0.389 45.
11.3 111.0
110.9
62.2 57.2 2.245 2.089 3.393 0.217 1.645
1.644
2.241 1.930 2.857 3.362 0.376 -0.005 -0.386 46.
7.9 111.6
111.6
61.7 57.1 2.237 2.121 3.341 0.185 1.636
1.637
2.233 1.952 2.924 3.278 0.376 -0.005 -0.386 47.
17.4 111.0
112.3
60.6
57.0
2.264 2.125 3.005 0.13 1.671
1.661
2.161 1.950 2.586 3.386 0.355 0.053 -0.274 48.

84 Brigatt i & Guggenheim
Table 2c. Structural details of trioctahedral true Micas-2M2, space group C2/c
Table 2d. Structural details of trioctahedral true Micas-3T, space group P3112
Cell parameters R
Reference (sample number)
Species, locality Rock type Composition a
(Å)
b
(Å)
c
(Å) (°) (%)
49. Ni and Hughes 1996
Nanpingite, Nanping, Fujian, China
Graniticpegmatite
(Cs0.88K0.06Rb0.01) (Al1.64Fe2+
0.17Mg0.22Li0.15) (Si3.16Al0.84)O10 (OH)1.79 F0.21
9.076(3) 5.226(2) 21.41(5) 99.48(6) 5.8
50. Zhoukhlistov et al. 1973
Muscovite, North Armenia.
Metasomatized pyrite deposits
(K0.68Na0.09) Al1.93 (Si3.5Al0.5) O10.06
(OH)1.948.965 5.175 20.31 100.66 11.7
Cell parameters R
Reference (sample number)
Species, locality Rock type Composition
a(Å)
c(Å) (%)
51. Amisano Canesi et al. 1994 (n # KZ)
Muscovite, (North Kazakhstan)
Shist,conditions: 6 <p<9 kbar; T=600°C
(K0.93Na0.03) (Al1.54Fe0.25Mg0.21Ti0.04) (Si3.34Al0.56) O10(OH)2
5.212(1) 29.804(6) 3.6
52. Amisano Canesi et al. 1994 (n # DM)
Magnesian muscovite, Dora Maira massif (Italy)
Pyrope-bearing white shist (P=30kbar, T=700°C)
(K0.92Na0.01) (Al1.41Mg0.60Ti0.02)(Si3.54Al0.46) O10 (OH)2
5.215(1) 29.755(5) 4.5
53. Güven and Burnham 1967
Muscovite, Sultan Basin, Snohomish County, Washington
(K0.90Na0.06Ca0.01Ba0.01) (Al1.83Fe2+
0.04F3+0.04Mg0.09Ti0.01)
(Si3.11Al0.89) O10 (OH)1.98 F0.03
5.1963(4) 29.971(2) 2.4
54. Sidorenko et al. 1977b
Paragonite (Na0.71K0.16Ca0.03) (Al2.02Fe3+
0.01Mg0.01) (Si2.96Al1.04) O9.98(OH)2.02
5.132 28.72 13.0

85Mica Crystal Chemisrty and Infl uence of P-T-X on Atomistic Models
Tetrahedral OctahedralSheet
Thickness Inter-layer Basal Mean bond lengths A- O
Intra-layer Layer Overall
(°)
T1,T2
(°)
M1
(°)
M2
( 2) (°)
Tetra-hedral
(Å)
Octa-hedral
(Å)
separa-tion(Å)
Oxygenz
(Å)
T1-OT2-O(Å)
M1-O
(Å)
M2-O( 2) (Å)
Inner
(Å)
Outer
(Å)
Shiftb3
b2
offset a1
a1
shifta1
5.7 111.4
111.5
62.4 57.6 2.241 2.079 3.997 0.215 1.634
1.633
2.244 1.939 3.174 3.416 -0.379
+0.379
-0.005
-0.005
-0.389 49.
11.2 111.4
111.6
60.9 57.0 2.216 2.133 3.414 0.233 1.619
1.653
2.195 1.956 2.860 3.354 -0.380
+0.380
-0.018
-0.018
-0.419 50.
Tetrahedral Octahedral Sheet thickness Interlayer Basal Mean bond lengths A - O Intralayer Layer Overall
(°)
T1
T2(°)
M1
(°)
M2
M3(°)
Tetra-hedral
(Å)
Octa-hedral
(Å)
Separa-tion(Å)
oxygenz
(Å)
T1-OT2-O(Å)
M1-O
(Å)
M2-OM3-O
(Å)
Inner Outer shifta2,3,1
Offset a1,2,3
Shift
7.4 111.9
111.8
61.7 57.0
57.2
2.247 2.116 3.305 0.182 1.637
1.638
2.231 1.943
1.953
2.928 3.259 0.379 -0.003 0 51.
5.4 112.1
112.1
61.4 57.1
57.3
2.235 2.130 3.305 0.162 1.628
1.631
2.228 1.954
1.971
2.972 3.213 0.378 -0.003 0 52.
11.8 110.0
110.3
61.8 57.6
56.5
2.207 2.112 3.465 0.156 1.670
1.603
2.231 1.973
1.913
2.868 3.389 0.383 -0.004 0 53.
15.7 111.6
110.4
59.8 58.1
58.4
2.249 2.075 3.001 0.092 1.609
1.684
2.061 1.965
1.981
2.621 3.341 -0.349 -0.025 0 54.

86 Brigatt i & Guggenheim
TABLE 3a. STRUCTURAL DETAILS OF TRIOCTAHEDRAL BRITTLE MICAS
Cell parameters R
Reference (sample number)
Species, locality Rock type Composition a
(Å)
b
(Å)
c
(Å) (°) (%)
1M polytype, space group C2/m
1. Alietti et al. 1997 (n # cli5a)
Clintonite, Valle di Stabio (Italy)
Skarn (Na0.01Ca0.99) (Al0.68Fe3+0.04Fe2+
0.11 Mg2.21) (Si1.20Al2.76) O9.88 F0.14(OH)1.98
5.200(1) 9.005(2) 9.795(2) 100.24(2) 3.5
2. Alietti et al. 1997 (n # cli7c)
Clintonite, Mt. Monzoni (Italy)
Skarn (Na0.01Ca0.99) (Al0.64Fe2+0.22Mg2.14)
(Si1.19Al2.79Fe3+0.02) O9.82 F0.11
(OH)2.07
5.198(1) 9.006(1) 9.796(1) 100.21(1) 3.7
3. Alietti et al. 1997 (n # cli8a)
Clintonite, Mt. Monzoni (Italy)
Skarn (Na0.02Ca0.96) (Al0.76Fe2+0.15Mg2.09)
(Si1.25Al2.75) O9.94 F0.09 (OH)1.97
5.194(1) 8.995(2) 9.788(2) 100.23(3) 3.1
4. Alietti et al. 1997 (n # cli8d)
Clintonite, Mt. Monzoni (Italy)
Skarn (Na0.02Ca0.97) (Al0.65Fe2+0.13Mg2.22)
(Si1.24Al2.76) O9.86 F0.17 (OH)1.97
5.203(1) 9.026(2) 9.811(1) 100.27(1) 3.2
5. Alietti et al. 1997 (n # cli9a)
Clintonite, Mt. Monzoni (Italy)
Skarn Ca0.98 (Al0.67Fe2+0.16Mg2.17Ti0.01)
(Si1.19Al2.78Fe3+0.03) O9.83 F0.19
(OH)1.98
5.192(2) 9.003(2) 9.794(2) 100.17(2) 3.3
6. Alietti et al. 1997 (n # cli9b)
Clintonite Valle di Stabio, Italy
Skarn (Na0.01Ca0.95) (Al0.63Fe2+0.16Mg2.20
Ti0.01) (Si1.28Al2.7Fe3+0.02) O9.84 F0.18
(OH)1.98
5.202(1) 9.005(2) 9.816(2) 100.30(1) 2.7
7. Brigatti & Poppi 1993 (n #27)
Potassium kinoshitalite (Alaska)
Skarn (K0.41Na0.04Ca0.01Ba0.54)(Al0.17Fe2+
0.27Mg2.53Ti0.03) (Si2.17
Al1.83) O9.94 F0.71(OH)1.35
5.318(1) 9.214(1) 10.164(2) 100.11(1) 2.5
8. Gnos and Armbruster 2000
Kinoshitalite Metamorphic manganese deposit
(Ba0.99K0.06Na0.01) (Al0.04Mg2.64
Mn0.31) (Si2.03Al1.97) O10 F0.37 Cl0.02(OH)1.61
5.316(1) 9.230(2) 10.197(2) 100.06(1) 3.4
9. Guggenheim & Frimmel 1999
Ferrokinoshitalite, Brooken Hill (South Africa)
Sulfide ore body in iron formation
(Ba0.47K0.33Na0.04) (Fe2+1.72Fe3+
0.15 Mg0.74Mn0.08 Ti0.17) (Si2.44Al1.56)O10 F0.65 (OH)1.35
5.389(1) 9.337(2) 10.054(2) 100.53(2) 3.2
10. Joswig et al. 1986 Clintonite, Lago della Vacca, Adamello (Italy)
Skarn (Ca1.00Na0.007) (Mg2.29Al0.70Fe2+0.05
Ti0.006) (Si1.20Al2.69Fe3+0.11) O10
(OH)2
5.2037(9) 9.0126(5) 9.8145(9) 100.26(1) 2.0
11. Kato et al. 1979 (n# 6)
Manganoan kinoshitalite, Nodatamagawa, Iwate Prefecture (Japan)
Metamorphic manganese deposit
(K0.35Na0.11Ba0.58) (Fe3+0.05Al0.22
Mg2.07Mn2+0.52 Mn3+
0.21)(Si2.05Al1.94 Ti0.01) O10.33 F0.05(OH)1.62
5.345(3) 9.250(4) 10.256(8) 99.99(5) 7.8
12. MacKinney et al. 1988 (n # 2U.W.1782/5)
Clintonite, Ertsberg (Jaya)
Skarn Ca1.00 (Mg2.08Al0.74Fe2+0.18)
(Si1.10Al2.90) O10 (OH)2
5.199(2) 9.005(3) 9.812(3) 100.30(2) 2.2
13. MacKinney et al. 1988 (n # 3USNM94594)
Clintonite, Edenville (New York)
Marble Ca0.97 (Mg2.18Al0.70Fe2+0.11Ti0.01)
(Si1.32Al2.68) O10 (OH)2
5.200(1) 9.005(2) 9.779(2) 100.30(2) 4.0
14. MacKinney et al. 1988 (n# 1USNM 105455)
Clintonite, Chichibu mine (Japan)
Ca1.00 (Mg2.11Al0.82Fe2+0.07)
(Si1.08Al2.92) O10 (OH)2
5.197(1) 9.002(2) 9.812(2) 100.32(2) 2.2
15. McCauley and Newnham 1973
Lithian kinoshitalite synthetic Ba0.97 (Mg2.23Li0.77) (Si2.84Al1.16)O9.9 F2.08
5.2858(2) 9.1575(6) 10.0375(5) 100.124(4) 7.1

87Mica Crystal Chemisrty and Infl uence of P-T-X on Atomistic Models
Tetrahedral Octahedral Sheet thickness Interlayer Basal Mean bond lengths A - O Intralayer Layer Overall
(°) (°)
M1
(°)
M2
(°)
Tetra-hedral
(Å)
Octa-hedral
(Å)
Separa-tion(Å)
oxygenz
(Å)
T-O
(Å)
M1-O
(Å)
M2-O
(Å)
Inner Outer shift offset Shift
23.4 109.2 2 59.1 58.8 2 2.319 2.092 2.908 0.004 1.731 2 2.034 2.020 2 2.432 3.561 -0.335a1 0.000a1 -0.335a1 1.
24.4 109.2 2 58.8 58.7 2 2.316 2.106 2.903 0.002 1.742 2 2.030 2.027 2 2.407 3.585 -0.334a1 0.000a1 -0.334a1 2.
23.9 109.2 2 58.8 58.6 2 2.309 2.106 2.908 0.007 1.733 2 2.033 2.023 2 2.417 3.572 -0.334a1 -0.001a1 -0.335a1 3.
23.4 109.4 2 59.1 58.8 2 2.327 2.094 2.906 0.012 1.735 2 2.037 2.022 2 2.435 3.563 -0.336a1 -0.001a1 -0.336a1 4.
24.9 108.9 2 58.8 58.7 2 2.309 2.102 2.920 0.027 1.749 2 2.029 2.024 2 2.397 3.603 -0.334a1 0.001a1 -0.333a1 5.
23.1 109.3 2 59.0 58.6 2 2.317 2.103 2.921 0.006 1.725 2 2.042 2.021 2 2.444 3.554 -0.337a1 0.000a1 -0.337a1 6.
11.4 111.1 2 59.0 59.0 2 2.298 2.131 3.280 0.003 1.676 2 2.071 2.067 2 2.866 3.391 -0.336a1 0.001a1 -0.335a1 7.
12.0 112.1 2 58.6 58.6 2 2.324 2.167 3.226 0.002 1.686 2 2.080 2.079 2 2.837 3.396 -0.335a1 0.000a1 -0.335a1 8.
4.0 111.3 2 58.5 58.3 2 2.269 2.216 3.130 0.008 1.672 2 2.120 2.106 2 3.024 3.210 -0.340a1 -0.001a1 -0.341a1 9.
23.1 109.3 2 59.1 58.6 2 2.322 2.103 2.911 0.013 1.727 2 2.046 2.021 2 2.443 3.553 -0.336a1 0.000a1 -0.336a1 10.
12.4 110.9 2 58.6 58.4 2 2.294 2.184 3.328 0.019 1.684 2 2.095 2.087 2 2.866 3.438 -0.334a1 0.001a1 -0.333a1 11.
23.4 109.0 2 59.2 58.8 2 2.317 2.088 2.931 0.014 1.728 2 2.041 2.015 2 2.440 3.564 -0.336a1 -0.001a1 -0.337a1 12.
22.8 109.3 2 59.1 58.7 2 2.317 2.097 2.892 0.008 1.722 2 2.040 2.019 2 2.444 3.538 -0.336a1 0.000a1 -0.336a1 13.
23.3 109.1 2 59.4 58.9 2 2.323 2.080 2.926 0.011 1.728 2 2.042 2.011 2 2.440 3.560 -0.337a1 -0.001a1 -0.338a1 14.
4.7 112.6 2 58.7 58.5 2 2.280 2.155 3.165 0.011 1.645 2 2.074 2.062 2 2.975 3.192 -0.333a1 -0.001a1 -0.334a1 15.

88 Brigatt i & Guggenheim
2M1 polytype, space group Cc
16. Lin and Guggenheim 1983
Bityite, Mops, (Zimbabwe)
Pegmatite (Ca0.95Na0.02K0.001) (Al2.04Li0.55 �0.45
Fe3+0.007) (Si2.02Be0.64 Al1.34)
O10(OH)2
5.058(1) 8.763(3) 19.111(7) 95.39(2) 3.0
2Or polytype, space group Pnmn
17. Giuseppetti and Tadini 1972
Anandite, Wilagedera, (North Western Sri Lanka)
Magnetite ore zone, iron-ore body
(Ba0.87K0.05Na0.04Mn0.04Ca<0.01)(Fe2+
2.46 Mg0.48 Mn0.06)(Si2.64Fe3+
0.7Fe2+0.58 Al0.08) O10
(OH) S0.85 Cl0.15
5.468(9) 9.49(2) 19.96(1) 6.1
18. Filut et al. 1985 Anandite, Wilagedera, (North Western Sri Lanka)
Magnetite ore zone, iron-ore body
(Ba0.96K0.03Na0.01) (Fe2+2.01Fe3+
0.28Al0.10Mg0.46 Mn3+
0.04 Mn2+0.04Ti0.01)
(Si2.60Fe3+1.40) O10 (OH) F0.04 S0.84
Cl0.16
5.439(1) 9.509(2) 19.878(6) 6.4
TABLE 3b. STRUCTURAL DETAILS OF DIOCTAHEDRAL BRITTLE MICAS
Cell parameters R
Reference (sample number)
Species, locality Rock type Composition a
(Å)
B
(Å)
c
(Å) (°) (%)
2M1 polytype, Space group Cc
19. Guggenheim and Bailey 1975, 1978
Margarite, Corundum Hill, Unionville, Chester County (Pennsylvania)
(Ca0.81Na0.19K0.01) (Al1.99Fe2+
0.01Mg0.03) (Si2.11Al1.89) O10(OH)2
5.1038(4) 8.8287(7) 19.148(1) 95.46(3) 4.0
20. Joswig et al. 1983 Margarite, Greiner, Zillertal, Tirol, Austia
(Ca0.73Na0.21) (Al1.96 Fe0.03Mg0.10 Li0.12) (Si1.92Al2.08) O10 (OH)2.12
5.108(1) 8.844(2) 19.156(3) 95.48(2) 1.7
21. Kassner et al. 1993 Margarite, Greiner, Zillertal, Tirol, Austia
(Ca0.73Na0.21) (Al1.96 Fe0.03Mg0.10 Li0.12) (Si1.92Al2.08) O10 (OH)2.12
5.1138(2) 8.8569(4) 19.185(1) 95.484(4) 2.7
TABLE 4. STRUCTURAL DETAILS OF BOROMUSCOVITE-1M AND -2M1
Cell parameters R Tetrahedral Octahedral Sheetthickness
a(Å)
b(Å)
c(Å) (°) %
(°)
T1
T2(°)
M1
(°)
M2
( 2) (°)
Tetra-hedral
(Å)
Octa-hedral
(Å)
Boromuscovite-1M 5.102(4) 8.788(7) 10.076(7) 101.23(3) 3.8 10.5 106.2
( 2)
62.5 54.6 2.03 2.19
Boromuscovite-2M1 5.090(1) 8.822(2) 19.819(5) 95.62(1) 3.8 8.4 108.2
108.9
61.8 57.4 2.14 2.05
calculated from the rietveld structure refi nement by Liang et al. (1995)

89Mica Crystal Chemisrty and Infl uence of P-T-X on Atomistic Models
21.6
21.7
109.8T1
110.1T11
109.5T2
110.3T22
61.4 57.3M2
57.3M3
2.276
2.277
2.050 2.910 0.169
0.167
1.723T1
1.632T11
1.628T2
1.721T22
2.14 1.902M2
1.903M3
2.432 3.437 0.355a2,3 0.002a1,1 -0.355a1 16.
2.1
3.0
112.9T1
113.7T2
59.0M1
56.2M2
56.2M3
58.7M4
2.301 2.338 3.041 0.207 1.68T1
1.77T2
2.267M1
2.104M2
2.096M3
2.250M4
3.026 3.241 0.331a1 0 0 17.
0.9
0.9
112.5
112.6
59.8M1
55.3M2
55.2M3
60.2M4
2.265 2.327 3.083 -0.13
+0.18
1.620(2)
1.799(2)
2.097M1
2.236M2
2.228M3
2.120M4
3.054 3.228 0.337 a1 0 0 18.
Tetrahedral OctahedralSheet
Thickness Inter-layer Basal Mean bond lengths A- O
Intra-layer Layer Overall
(°)
(T1, T11, T2, T22)
(°)
(M1) vacancy
(°)
(M2,M3) Tetra-hedral
(Å)
Octa-hedra
(Å)
separa-tion
(Å)
Oxygenz
(Å)
T-O(T1, T11, T2, T22)
(Å)
M1-Ovacancy
(Å)
M2-OM3-O
(Å)
Inner
(Å)
Outer
(Å)
shift
a2,3
offset
a1, ,1
shift
a1
21.0
20.8
107.5
109.0
109.3
109.1
56.9
57.1
2.305
2.272
2.080 2.875 0.202
0.202
1.747
1.623
1.633
1.736
1.903
1.915
2.456 3.432 0.365 0.006 -0.359 19.
20.9
20.9
110.6
110.5
110.6
110.6
61.7 57.0
57.1
2.288
2.293
2.079 2.874 0.194
0.208
1.748
1.628
1.748
1.626
2.193 1.909
1.912
2.454 3.438 0.365 0.006 -0.358 20.
20.8
20.8
110.7
110.7
110.6
110.6
61.7 57.0
57.1
2.294
2.296
2.080 2.879 0.203
0.204
1.750
1.750
1.630
1.629
2.196 1.910
1.915
2.459 3.441 0.366 0.006 -0.359 21.
Interlayer BasalMean bond lengths A - O
Intralayer Layer OverallSepara-
tion(Å)
oxygenz
(Å)
T1-OT2-O(Å)
M1-O
(Å)
M2-O( 2) (Å)
Inner Outer shifta1
offset a1
shifta1
3.64 0.43 1.58
( 2)
2.37 1.89 2.92 3.37 -0.335a1 -0.049a1 -0.385a1
3.52 0.24 1.59
1.57
2.17 1.91 2.92 3.28 0.374a2,3 0.016a1,1 -0.381a1
90 Brigatti & Guggenheim
REFERENCES Aines RD, Rossman GR (1985) The high temperature behavior of trace hydrous components in silicate
minerals. Am Mineral 70:1169-1179 Akhundov YA, Mamedov KS, Belov NV (1961) The crystal structure of brandisite. Dokl Akad Nauk SSSR
137:438-440 Alietti E, Brigatti MF, Poppi L (1995) The crystal structure and chemistry of high-aluminium phologopite.
Mineral Mag 59:149-157 Alietti E, Brigatti MF, Poppi L (1997) Clintonite-1M: Crystal chemistry and its relationships to closely
associated Al-rich phlogopite. Am Mineral 82:936-945 Amisano-Canesi A, Chiari G, Ferraris G, Ivaldi G, Soboleva SV (1994) Muscovite- and phengite-3T:
crystal strutture and conditions of formation. Eur J Mineral 6:489-496 Appelo CAJ (1978) Layer deformation and crystal energy of micas and related minerals. I structural
models for 1M and 2M1 polytypes. Am Mineral 63:782-792 Arima M, Edgar AD (1981) Substitution mechanisms and solubility of titanium in phlogopites from rocks
of probable mantle origin. Contr Mineral Petrol 77:288-295 Backhaus KO (1983) Structure refinement of a lepidolite-1M. Cryst Res Technol 18:1253-1260 Backaus KO, Durovíc S (1984) Polytypism of micas. I. MDO polytypes and their derivation. Clays Clay
Minerals 32:453-463 Bailey SW (1975) Cation ordering and pseudosymmetry in layer silicates. Am Mineral 60:175-187 Bailey SW (1984a) Classification and structures of the micas. Rev Mineral 13:1-12 Bailey SW (1984b) Crystal chemistry of the true micas. Rev Mineral 13:13-60 Bailey SW (1984c) Review of cation ordering in micas. Clays Clay Minerals 32:81-92 Bailey SW (1986) Report of the AIPEA Nomenclature Committee (Illite, Glauconite and Volkonskoite).
AIPEA Newsl 22:1-3 Barton M (1979) A comparative study of some minerals occurring in the potassium-rich alkaline rocks of
the Leucitite Hills, Wyoming, the Vico Volcano, Western Italy, and the Toto-Ankole Region, Uganda. N Jahrb Mineral Abh 137:113-134
Bassett WA (1960) Role of hydroxyl orientation in mica alteration. Geol Soc Am Bull 71:449-456 Besson G (1980) Structure des smectites dioctahedrique, parametres conditionnant les fautes d’empilement
des feullets. Thése de Doctorat d’etat et Sciences Physiques, Orléans Besson G, de la Calle C, Rautureau M, Tchoubar C, Tsipursky SI, Drits VA (1982) X-ray and electron
diffraction study of the structure of the Garfield nontronite. Develop Sediment 35:29-40 Bigi S, Brigatti MF (1994) Crystal chemistry and microstructures of plutonic biotite. Am Mineral 79:63-72 Bigi S, Brigatti MF, Mazzucchelli M, Rivalenti G (1993) Crystal chemical variations in Ba-rich biotites
from gabbroic rocks of lower crust (Ivrea Zone, NW Italy). Contrib Mineral Petrol 113:87-99 Birle JD, Tettenhorst R (1968) Refined muscovite structure. Mineral Mag 36:883-886 Bobos I, Ghergari L (1999) Conversion of smectite to ammonium illite in the hydrothermal system of
Harghita Bai, Romania: SEM and TEM investigations. Geologica Carpathica 50:379-387 Bohlen SR, Peacor DR, Essene EJ (1980) Crystal chemistry of a metamorphic biotite and its significance in
water barometry. Am Mineral 65:55-62 Bookin AS, Smoliar BB (1985) Simulation of bond lengths in coordination polyhedra of 2:1 layer silicates.
5th Meet Eur Clay Groups, Prague, 1983, p 51-56 Bracke G, Satir M, Krau P (1995) The Cryptand [222] for exchanging cations of micas. Clays Clay
Minerals 43:732-737 Bradley WF (1959) Current progress in silicate structures. Clays Clay Minerals 6:18-25 Brigatti MF, Davoli P (1990) Crystal structure refinement of 1M plutonic biotites. Am Mineral 75:305-313 Brigatti MF, Frigieri P, Ghezzo C, Poppi L (2000a) Crystal chemistry of Al-rich biotites coexisting with
muscovites in peraluminous granites. Am Mineral 85:436-448 Brigatti MF, Frigieri P, Poppi L (1998a) Crystal chemistry of Mg-, Fe-bearing muscovites-2M1. Am
Mineral 83:775-785 Brigatti MF, Galli E, Poppi L (1991) Effect of Ti substitution in biotite-1M crystal chemistry. Am Mineral
76:1174-1183 Brigatti MF, Galli E, Medici L, Poppi L, Cibin G, Marcelli A, Mottana A (2001a) Crystal structure
refinement and X-ray absorption spectroscopy of chromium-containing muscovite. Eur J Mineral 13:377-390
Brigatti MF, Kile DE, Poppi M (2001b) Crystal structure and crystal chemistry of lithium-bearing muscovite-2M1. Can Mineral 39:1171-1180
Brigatti MF, Lalonde AE, Medici L (1999) Crystal chemistry of IVFe3+-rich phlogopites: a combined single-crystal X-ray and Mössbauer study. 11th Int’l Clay Conf, Ottawa, 1977, p 317-327

Mica Crystal Chemistry and Influence of P-T-X on Atomistic Models 91
Brigatti MF, Lugli C, Poppi L, Elburg M (1998b) Crystal chemistry of biotites from mafic enclaves in the Warburton granodiorite, Lachlan Fold Belt (Australia). Eur J Mineral 10:855-864
Brigatti MF, Lugli C, Poppi L, Foord EE, Kile DE (2000b) Crystal chemical variations in Li- and Fe-rich micas from Pikes Peak Batholith (central Colorado). Am Mineral 85:1275-1286
Brigatti MF, Medici L, Poppi L (1996b) Refinement of the structure of natural ferriphlogopite. Clays Clay Minerals 44:540-545
Brigatti MF, Medici L, Saccani E, Vaccaro C (1996a) Crystal chemistry and petrologic significance of Fe3+- rich phlogopite from the Tapira carbonatite complex, Brazil. Am Mineral 81:913-927
Brigatti MF, Poppi L (1993) Crystal chemistry of Ba-rich trioctahedral micas-1M. Eur J Mineral 5:857-871 Brown BE (1978) The crystal structure of 3T lepidolite. Am Mineral 63:332-336 Brown BE, Bailey SW (1963) Chlorite polytypism. II. Crystal structure of one layer Cr-chlorite. Am
Mineral 48:42-61 Bucher-Nurminen K (1976) Occurrence and chemistry of xanthophyllite in roof pendants of the Bergell
granite, Sondrio, northern Italy. Schweiz mineral petrogr Mitt 56:413-426 Catti M, Ferraris G, Hull S, Pavese A (1994) Powder neutron diffraction study of 2M1 muscovite at room
pressure and at 2 GPa. Eur J Mineral 6:171-178 Catti M, Ferraris G, Ivaldi G (1989) Thermal strain analysis in the crystal structure of muscovite at 700°C.
Eur J Mineral 1:625-632 Cerny P, Stanek J, Novák M, Baadsgaard H, Rieder M, Ottolini L, Kavalová M, Chapman R (1995)
Chemical and structural evolution of micas in the Rozná and Dobrá Voda pegmatites, Czech Republic. Mineral Petrol 55:177-202
Comodi P, Zanazzi PF (1997) Pressure dependence of structural parameters of paragonite. Phys Chem Minerals 24:274-280
Comodi P, Zanazzi PF (2000) Structural thermal behavior of paragonite and its dehydroxylate: A high-temperature single-crystal study. Phys Chem Minerals 27:377-385
Comodi P, Zanazzi PF, Weiss Z, Rieder M, Drábek M (1999) "Cs-tetra-ferri-annite": High-pressure and high-temperature behavior of a potential nuclear waste disposal phase. Am Mineral 84:325-332
Cruciani G, Zanazzi PF (1994) Cation partitioning and substitution mechanism in 1M-phogopite: A crystal chemical study. Am Mineral 78:289-301
Cruciani G, Zanazzi PF, Quartieri S (1995) Tetrahedral ferric iron in phlogopite. XANES and Mössbauer comparison to single-crystal X-ray data. Eur J Mineral 7:255-265
Daniels EJ, Marshak S, Altaner SP (1996) Use of clay-mineral alteration patterns to define syntectonic permeability of joints (cleat) in Pennsylvania anthracite coal. Tectonophysics 263:123-136
De Albuquerque CAR (1975) Partition of trace elements in co-existing biotite, muscovite and potassium feldspar of granitic rocks, Northern Portugal. Chem Geol 16:89-108
Donnay G, Morimoto N, Takeda H, Donnay JDH (1964) Trioctahedral one-layer micas: I. Crystal structure of a synthetic iron mica. Acta Crystallogr 17:1369-1373
Dornberger-Schiff K, Backhaus K-O, Durovíc S (1982) Polytypism of micas: OD-interpretation, stacking symbols, symmetry relations. Clays Clay Minerals 30:364-374
Drábek M, Rieder M, Viti C, Weiss Z, Fryda J (1998) Hydrothermal synthesis of a Cs ferruginous trioctahedral mica. Can Mineral 36:755-761
Drits VA (1969) Some general remarks on the structure of trioctahedral micas. 4th Int’l Clay Conf Proc, Tokyo 1:51-59
Drits V A (1975) The structural and crystallochemical features of layer silicates. In Crystallochemistry of Minerals, and Geological Problems. AG Kossovskaya (ed), Nauka, Novosibirsk, p 35-51 (in Russian)
Drits VA, Besson G, Muller F (1995) An improved model for structural transformations of heat-treated aluminous dioctahedral 2:1 layer silicates. Clays Clay Minerals 43:718-731
Drits VA, Lindgreen H, Salyn AL (1997) Determination of the content and distribution of fixed ammonium in illite-smectite by X-ray diffraction: Application to North Sea illite-smectite. Am Mineral 82:79-87
Drits VA, Lindgreen H, Salyn AL, Ylagan R, McCarty DK (1998) Semiquantitative determination of trans-vacant and cis-vacant 2:1 layers in illites and illite-smectites by thermal analysis and X-ray diffraction. Am Mineral 83:1188-1198
Drits VA, Plançon A, Sakharov BA, Besson G, Tsipursky SI, Tchoubar C (1984) Diffraction effects calculated for structural models of K-saturated montmorillonite containing different types of defects. Clay Minerals 19:541-561
Drits VA, Weber F, Salyn AL, Tsipursky SI (1993) X-ray identification of one-layer illite varieties: Application to the study of illites around uranium deposits of Canada. Clays Clay Minerals 41:389-398
Duit W, Jansen JBH, Breemen AV, Bos A (1986) Ammonium micas in metamorphic rocks as exemplified by Dome de L’Agout (France). Am J Sci 286:702-732

92 Brigatti & Guggenheim
Durovíc S (1981) OD-caracther, Polytypie und identifikation von Schichtsilikaten. Fortshr Mineral 59: 191-226
Durovíc S (1994) Classification of phyllosilicates according to the symmetry of their octahedral sheets. Ceramics–Silikàty 38:81-84
Durovíc S, Weiss Z, Backhaus KO (1984) Polytypism of micas. II. Classification and abundance of MDO polytypes. Clays Clay Minerals 32:464-474
Dyar MD (1990) Mossbauer spectra of biotite from metapelites. Am Mineral 75:656-666 Dymek RF (1983) Titanium, aluminium and interlayer cation substitutions in biotite from high-grade
gneisses, West Greenland. Am Mineral 68:880-899 Edgar AD, Arima M (1983) Conditions of phlogopite crystallization in ultrapotassic volcanic rocks.
Mineral Mag 47:11-19 Eggleton RA, Ashley PM (1989) Norrishite, a new manganese mica, K(Mn3+
2Li)Si4O12, from the Hoskins mine, New South Wales, Australia. Am Mineral 74:1360-136
Ertl A, Brandstätter F (1998) Olenit mit borüberschuss aus ein metapegmatit östlich der Stoffhütte, Koralpe, Steiermark. Osterreich Mitt Abr Mineral Landesmuseum Joanneum, 62/63:3-21
Evans BW, Guggenheim S (1988) Talc, pyrophyllite, and related minerals. Rev Mineral 19:225-294 Evsyunin VG, Kashaev AA, Rastsvetaeva RK (1997) Crystal structure of a new representative of Cr micas.
Cryst Rep 42:571-574 Farmer LG, Boettcher AI (1981) Petrologic and crystal chemical significance of some deep-seated
phlogopites. Am Mineral 66:1154-1163 Ferraris G, Gula A, Ivaldi G, Nespolo M, Sokoleva E, Khomyakov AP, Uvarova Yu (2000) First structural
determination of a truly-polytypic mica-2O. In Advances on micas (Problems, methods, applications in Geodynamics). Acad Naz Lincei, Roma, p 205-209
Filut AM, Rule AC, Bailey SW (1985) Crystal structure refinement of anandite 2Or, a barium- and sulfur-bearing trioctahedral mica. Am Mineral 70:1298-1308
Foord EE, Martin RF, Fitzpatrick JJ, Taggart JE Jr, Crock JG (1991) Boromuscovite, a new member od the mica group, from the Little Three mine pegmatite, Ramona district, San Diego County, California. Am Mineral 76:1998-2002
Frimmel HE, Hoffmann D, Watkins RT, Moore JM (1995) An Fe analogue of kinoshitalite from the Broken Hill massive sulfide deposit in the Namaqualand Metamorphic Complex, South Africa. Am Mineral 80:833-840
Gaines GL Jr, Vedder W (1964) Dehydroxylation of muscovite. Nature 201:495 Ganguly J (1982) Mg-Fe order-disorder in ferromagnesian silicate: II Thermodynamics, kinetics and
geological implications. Adv Phys Geochem 2:58-99 Giese RF Jr (1984) Electrostatic energy models of micas. Rev Mineral 13:105-140 Giuseppetti G, Tadini C (1972) The crystal structure of 2O brittle mica: anandite. Tschermaks mineral
petrogr Mitt 18:169-184 Gnos E, Armbruster T (2000) Kinoshitalite, Ba(Mg)3(Al2Si2)O10(OH,F)2, a brittle mica from a manganese
deposit in Oman: Paragenesis and crystal chemistry. Am Mineral 85:242-250 Godard G (1988) Petrology of some eclogites in the Hercynides: The eclogites from the southern
Armorican massif, France. In Eclogites and eclogite-facies rocks. DC Smith (ed) Elsevier, Amsterdam, p 451-519
Godard G, Smith D (1999) Preiswerkite and Na- (Mg,Fe)-margarite in eclogites. Contrib Mineral Petrol 136:20-32
Grew ES, Yates MG, Adams PM, Kirkby R, Wiedenbeck M (1999) Harkerite and associated minerals in marble and skarns from Crestmore quarry, Riverside County, California and Cascade Slide, Adirondack Mountains, New York. Can Mineral 37:277-296
Grim RE, Bray RH, Bradley WF (1937) The mica in argillaceous sediments. Am Mineral 22:813-829 Guggenheim S (1981) Cation ordering in lepidolite. Am Mineral 66:1221-1232 Guggenheim S (1984) The brittle micas. Rev Mineral 13:61-104 Guggenheim S, Bailey SW (1975) Refinement of the margarite structure in subgroup symmetry. Am
Mineral 60:1023-1029 Guggenheim S, Bailey SW (1977) The refinement of zinnwaldite-1M in subgroup symmetry. Am Mineral
62:1158-1167 Guggenheim S, Bailey SW (1978) Refinement of the margarite structure in subgroup symmetry:
Correction, further refinement, and comments. Am Mineral 63:186-187 Guggenheim S, Chang Y-H, Koster van Groos AF (1987) Muscovite dehydroxylation: High-temperature
studies. Am Mineral 72:537-550 Guggenheim S, Frimmel HE (1999) Ferrokinoshitalite, a new species of brittle mica from the Broken Hill
mine, South Africa: Structural and mineralogical characterization. Can Mineral 37:1445-1452

Mica Crystal Chemistry and Influence of P-T-X on Atomistic Models 93
Guggenheim S, Kato T (1984) Kinoshitalite and Mn phlogopites: Trial refinements in subgroup symmetry and further refinement in ideal symmetry. Mineral J 12:1-5
Güven N (1971a) Structural factors controlling stacking sequences in dioctahedral micas. Clays Clay Minerals 19:159-165
Güven N (1971b) The crystal structures of 2M1 phengite and 2M1 muscovite. Z Kristallogr 134:196-212 Güven N, Burnham CW (1967) The crystal structure of 3T muscovite. Z Kristallogr 125:163-183 Harlow GE (1994) Jadeitites, albitites and related rocks from the Motagua Fault Zone, Guatemala.
J Metamor Geol 12:49-68 Harlow GE (1995) Crystal chemistry of barian enrichment in micas from metasomatized inclusions in
serpentinite, Motagua Fault Zone, Guatemala. Eur J Mineral 7:775-789 Hawthorne FC, Teertstra DK, Černý P (1999) Crystal-structure refinement of a rubidian cesian phlogopite.
Am Mineral 84:778-781 Hazen RM (1977) Temperature, pressure, and composition: Structurally analogous variables. Phys Chem
Minerals 1:83-94 Hazen RM, Burnham CW (1973) The crystal structures of one-layer phlogopite and annite. Am Mineral
58:889-900 Hazen RM, Finger LW (1978) The crystal structures and compressibilities of layer minerals at high
pressure. II. Phlogopite and chlorite. Am Mineral 63:293-296 Hazen RM, Finger LW, Velde D (1981) Crystal structure of a silica- and alkali-rich trioctahedral mica. Am
Mineral 66:586-591 Hazen RM, Wones DR (1972) The effect of cation substitution on the physical properties of trioctahedral
micas. Am Mineral 57:103-129 Heller-Kallai L, Rozenson I (1980) Dehydroxylation of dioctahedral phyllosilicates. Clays Clay Minerals
28:355-368 Higashi S (1982) Tobelite, a new ammonium dioctahedral mica. Mineral J 11:138-146 Hirschmann M, Evans BV, Yang H (1994) Composition and temperature dependence of Fe-Mg ordering in
cummingtonite-grunerite as determined by X-ray diffraction. Am Mineral 79:862-877 Hoppe R (1979) Effective coordination numbers (ECON) and mean fictive ionic radii (MEFIR).
Z Kristallogr 150:23-52 Hower J, Mowatt TC (1966) The mineralogy of illites and mixed illite-montmorillonite. Am Mineral
51:825-854 Icenhower J P, London D (1995) An experimental study of element partitioning among biotite, muscovite
and coexisting peraluminous silicic melt at 200 Mpa (H2O). Am Mineral 80:1229-1251 Icenhower JP, London D (1997) Partitioning of fluorine and chlorine between biotite and granitic melt:
Experimental calibration at 200 MPa H2O. Contrib Mineral Petrol 127:17-29 Joswig W (1972) Neutronenbeugungsmessungen an einem 1M-phlogopit. N Jahrb Mineral Monatsh 1-11 Joswig W, Amthauer G, Takéuchi Y (1986) Neutron diffraction and Mössbauer spectroscopic study of
clintonite (xanthophyllite). Am Mineral 71:1194-1197 Joswig W, Takéuchi Y, Fuess H (1983) Neutron-diffraction study on the orientation of hydroxyl groups in
margarite. Z Kristallogr 165:295-303 Juster TC, Brown PE, Bailey SW (1987) NH4-bearing illite in very low grade metamorphic rocks
associated with coal, northeastern Pennsylvania. Am Mineral 72:555-565 Kalinichenko EA, Lithovchenko AS, Kalinichenko AM, Bagmut NN, Dekhtyaruk NT (1997) The study of
the kinetics and the mechanism of dehydroxylation in muscovite by ESR on Fe3+. Phys Chem Minerals 24:520-527
Kassner D, Baur WH, Joswig W, Eichhorn K, Wendschuh-Jostier M, Kupcik V (1993) A test of the importance of weak reflections in resolving a space-group ambiguity involving the presence or absence of an inversion centre. Acta Crystallogr B49:646-654
Kato T, Enami M, Zhai M (1997) Ultra-high-pressure (UHP) marble and eclogite in the Su-Lu UHP terrane, eastern China. J Metamor Geol 15:169-182
Kato T, Miúra Y, Yoshii M, Maeda K (1979) The crystal structure of 1M-kinoshitalite, a new barium brittle mica and 1M-manganese trioctahedral micas. Mineral J 9:392-408
Keppler H (1990) Ion exchange reactions between dehydroxylated micas and salt melts and the crystal chemistry of the interlayer cations in micas. Am Mineral 75:529-538
Keusen HR, Peters T (1980) Preiswerkite, an Al-rich trioctahedral sodium mica from the Geisspfad ultramafic complex (Penninic Alps). Am Mineral 65:1134-1137
Knurr RA, Bailey SW (1986) Refinement of Mn-substituted muscovite and phlogopite. Clays Clay Minerals 34:7-16
Lee H-L, Guggenheim S (1981) Single crystal refinement of pyrophyllite-1Tc. Am Mineral 66:350-357

94 Brigatti & Guggenheim
Li G, Peacor DR, Coombs DS, Kawachi Y (1997) Solid solution in the celadonite family: The new minerals ferroceladonite K2 Fe2+
2 Fe3+2 Si8O20(OH)4 and ferroaluminoceladonite K2 Fe2+
2 Al2 Si8O20(OH)4. Am Mineral 82:503-511
Liang J-J, Hawthorne FC, Novák M, Cerny P, Ottolini L (1995) Crystal-structure refinement of boromuscovite polytypes using a coupled Rietvelt-static-structure energy-minimization method. Can Mineral 33:859-865
Lin C-Y, Bailey SW (1984) The crystal structure of paragonite-2M1. Am Mineral 69:122-127 Lin J-C, Guggenheim S (1983) The crystal structure of a Li, Be-rich brittle mica: a dioctahedral-
trioctahedral intermediate. Am Mineral 68:130-142 Lindgreen H, Drits VA, Sakharov BA, Salyn AL, Dainyak LG (2000) Illite-smectite structural changes
during metamorphism in black Cambrian Alum shales from the Baltic area. Am Mineral 85:1223-1238 Lindgreen H, Jacobsen H, Jacobsen HJ (1991) Diagenetic structural transformations in North Sea Jurassic
illite/smectite. Clays Clay Minerals 39:54-69 Liu OF, Zhang PF, Ding SL, Lin XS, Zheng NX (1996) NH4-illite in Permo-Carboniferous coal-bearing
strata, North China. Chin Sci Bull 41:1458-1461 Loewenstein W (1954) The distribution of aluminium in the tetrahedra of silicates and aluminates. Am
Mineral 39:92-96 MacKenzie KJD, Brown IWM, Meinhold RH, Bowden ME (1985) Thermal reactions of pyrophyllite
studied by high-resolution solid state 27Al and 29Si nuclear magnetic resonance spectroscopy. J Am Ceram Soc 68:266-272
MacKinney JA, Mora CI, Bailey SW (1988) Structure and crystal chemistry of clintonite. Am Mineral 73:365-375
Mathieson AMcL, Walker GF (1954) Crystal structure of magnesium vermiculite. Am Mineral 39:231-255 Mazzucato E, Artioli G, Gualtieri A (1999) High temperature dehydroxylation of muscovite-2M1: a kinetic
study by in situ XRPD. Phys Chem Minerals 26:375-381 McCarty DK, Reynolds RC Jr (1995) Rotationally disordered illite/smectite in Paleozoic K-bentonites.
Clays Clay Minerals 43:271-284 McCauley JW, Newnham RE (1971) Origin and prediction of ditrigonal distortions in micas. Am Mineral
56:1626-1638 McCauley JW, Newnham RE (1973) Structure refinement of a barium mica. Z Kristallogr 137:360-307 McCauley JW, Newnham RE, Gibbs GV (1973) Crystal structure analysis of synthetic fluorophlogopite.
Am Mineral 58:249-254 Medici L (1996) Cristallochimica delle miche di Tapira (Brasile). PhD dissertation, Modena University,
140 p (in Italian) Mellini M, Weiss Z, Rieder M, Drábek M (1996) Cs-ferriannite as a possible host for waste cesium: Crystal
structure and synthesis. Eur J Mineral 8:1265-1271 Méring J, Glaeser R (1954) Sur le rôle de la valence de cations éxchangeables dans la montmorillonite.
Bull Minéral 77:519-522 Méring J, Oberlin A (1971) The smectites. In The Electron-Optical Investigation of Clays. JA Gard (ed)
Mineralogical Society Monogr 3, London Meyer J (1983) The development of the high-pressure metamorphism in the Allalin metagabbro
(Switzerland). High pressure metamorphism: Indicator of subduction of crustal thickening (abstr). Terra Cognita 3:187
Mizota T, Kato T, Harada K (1986) The crystal structure of masutomilite, Mn-analogue of zinnwaldite. Mineral J 13:13-21
Monier G, Robert J-L (1986) Titanium in muscovites from two mica granites: substitutional mechanisms and partition with coexisting biotite. N Jahrb Mineral Abh 153:147-161
Morandi N, Nannetti MC, Pirani R, Resmi U (1984) La mica verde delle rocce di contatto nell’area Predazzo-Monzoni. Rend Soc It Mineral Petrol 39:677-693
Muller F, Drits VA, Plançon A. Besson G (2000b) Dehydration of Fe3+, Mg-rich dioctahedral micas. (I): Structural transformation. Clay Mineral 35:491-504
Muller F, Drits VA, Plançon A, Robert J-L (2000a) Structural transformations of 2:1 dioctahedral layer silicates during dehydroxylation-rehydroxylation reactions. Clays Clay Minerals 48:572-585
Muller F, Drits VA, Tsipursky SI, Plançon A (2000c) Dehydration of Fe3+,Mg-rich dioctahedral micas. (II): cation migration. Clay Mineral 35:505-514
Neal CR, Taylor LA (1989) The petrography and composition of phlogopite micas from the Blue Ball kimberlite, Arkansas: A record of chemical evolution during crystallyzation. Mineral Petrol 40: 207-224
Newnham RE, Brindley GW (1956) The crystal structure of dickite. Acta Crystallogr 9:759-764 Ni Y, Hughes JM (1996) The crystal structure of nanpingite-2M2, the Cs end-member of muscovite. Am
Mineral 81:105-110

Mica Crystal Chemistry and Influence of P-T-X on Atomistic Models 95
Norrish K (1973) Factors in the weathering of mica to vermiculite. 5th Int’l Clay Conf Proc, Madrid, p 417-432
Novák M, Cerny P, Cooper M, Hawthorne FC, Ottolini L, Xu Z, Liang J-J (1999) Boron-bearing 2M1 + 1M boromuscovite from an elbaite pegmatite at Recice, western Moravia, Czech Republic. Eur J Mineral 11:669-678
Oberti R, Ungaretti L, Tlili A, Smith DC, Robert J (1993) The crystal structure of preiswerkite. Am Mineral 78:1290-1298
Ohta T, Takeda H, Takéuchi Y (1982) Mica polytypism: similarities in the crystal structures of coexisting 1M and 2M1 oxybiotite. Am Mineral 67:298-310
Olesch M, Seifert F (1976) Stability and phase relations of trioctahedral calcium brittle micas (clintonite group). J Petrol 17:291-314
Patiño Douce AE, Johnston AD (1991) Phase equilibria and melt productivity in the pelitic system: implication for the origin of peraluminous granitoids and aluminous granulites. Contrib Mineral Petrol 107:202-218
Patiño Douce AE, Johnston AD, Rice JM (1993) Octahedral excess mixing properties in biotite: a working model with applications to geobarometry and geothermometry. Am Mineral 78:113-131
Pavese A, Ferraris G, Pischedda V, Ibberson R (1999) Tetrahedral order in phengite-2M1 upon heating, from powder neutron diffraction, and thermodynamic consequences. Eur J Mineral 11:309-320
Pavese A, Ferraris G, Pischedda V, Radaelli P (2000) Further study of the cation ordering in phengite-3T by neutron powder diffraction. Mineral Mag 64:11-18
Pavese A, Ferraris G, Prencipe M, Ibberson R (1977) Cation site ordering in phengite-3T from the Dora-Maira massif (western Alps): A variable-temperature neutron powder diffraction study. Eur J Mineral 9:1183-1190
Puziewicz J, Johannes W (1990) Experimental study of a biotite-bearing granitic system under water-saturated and water-undersaturated conditions. Contrib Mineral Petrol 104:397-406
Radoslovich EW (1960) The structure of muscovite, KAl2(Si3Al)O10(OH)2. Acta Crystallogr 13:919-932 Radoslovich EW (1961) Surface symmetry and cell dimensions of layer lattice silicates. Nature 191:67-68 Radoslovich EW, Norrish K (1962) The cell dimensions and symmetry of layer-lattice silicates. I. Some
structural considerations. Am Mineral 47:599-616 Rammlmair D, Mogessie A, Purtscheller F, Tessadri R (1988) Högbomite from the Vumba schist belt,
Botswana. Am Mineral 73:651-657 Rancourt DG, Dang MZ, Lalonde AE (1992) Mössbauer spectroscopy of tetrahedral Fe3+ in trioctahedral
micas. Am Mineral 77:34-93 Rayner JH (1974) The crystal structure of phlogopite by neutron diffraction. Mineral Mag 39:850-856 Reynolds RC, Thompson CH (1993) Illite from the Potsdam Sandstone of New York, a probable
noncentrosymmetric mica structure. Clays Clay Minerals 41:66-72 Richardson SM, Richardson JW (1982) Crystal structure of a pink muscovite from Archer's Post, Kenya:
implications for reverse pleochroism in dioctahedral micas. Am Mineral 67:69-75 Rieder M, Cavazzini G, D’yakonov YS, Frank-Kamenetskii VA, Gottardi G, Guggenheim S, Koval PV,
Müller G, Neiva AMR, Radoslovich EW, Robert J-L, Sassi FP, Takeda H, Weiss Z, Wones DR (1998) Nomenclature of the micas. Clays Clay Minerals 46:586-595
Rieder M, Hybler J, Smrcok L, Weiss Z (1996) Refinement of the crystal structure of zinnwaldite 2M1. Eur J Mineral 8:1241-1248
Robert J-L, Volfinger M, Barrandon J-N, Basutçu M (1983) Lithium in the interlayer space of synthetic trioctahedral micas. Chem Geol 40:337-351
Rothbauer Von R (1971) Untersuchung eines 2M1-Muskovits mit Neutronenstrahlen. N Jahrb Mineral Monatsh 143-154
Rouxhet PG (1970) Kinetics of dehydroxylation and of OH-OD exchange in marcocrystalline micas. Am Mineral 55:841-853
Rule AC, Bailey SW (1985) Refinement of the crystal structure of phengite-2M1. Clays Clay Minerals 33:403-409
Russell RL, Guggenheim S (1999) Crystal structures of hydroxyphlogopite at high temperatures and heat-treated biotites: The influence of the O,OH,F site. Can Mineral 37:711-720
Sakharov BA, Lindgreen H, Salyn A, Drits VA (1999) Determination of illite-smectite structures using multispecimen X-ray diffraction profile fitting. Clays Clay Minerals 47:555-566
Sanz J, Robert J-L (1992) Influence of structural factors on 29Si and 27Al NMR chemical shifts of phyllosilicates 2:1. Phys Chem Minerals 19:39-45
Sartori F (1976) The crystal structure of a 1M lepidolite. Tschermaks mineral petrogr Mitt 23:65-75 Sartori F, Franzini M, Merlino S (1973) Crystal structure of a 2M2 lepidolite. Acta Crystallogr B29:573-
578
96 Brigatti & Guggenheim
Schreyer W, Jung I (1997) Boromuscovite, KAl2 [Bsi3O10](OH)2: A high-pressure mineral. Terra Nova (abstr) 1:32
Semenova TF, Rozhdestvenskaya IV, Frank-Kamenetskii VA (1977) Refinement of the crystal structure of tetraferriphlogopite. Sov Phys Crystallogr 22:680-683
Sidorenko OV, Zvyagin BB, Soboleva SV (1975) Crystal structure refinement for 1M dioctahedral mica. Sov Phys Crystallogr 20:332-335
Sidorenko OV, Zvyagin BB, Soboleva SV (1977a) Refinement of the crystal structure of 2M1 paragonite by the method of high-voltage electron diffraction. Sov Phys Crystallogr 22:554-556
Sidorenko OV, Zvyagin BB, Soboleva SV (1977b) Crystal structure of 3T paragonite. Sov Phys Crystallogr 22:557-559
Slade PG, Radoslovich EW (1985) The structure of ephesite-2M1 in space group Cc. N Jahrb Mineral Monatsh 337-352
Slade PG, Schultz PK, Dean C (1987) Refinement of the ephesite structure in C1 symmetry. N Jahrb Mineral Monatsh 6:275-287
Smith DC, Kechid S-A (1983) Three rare Al- and Na-rich micas in the Liset eclogite pod, Norway: Mg-Fe-margarite, preiswerkite and Na-eastonite (abstr). Terra Cognita 3:191
Smith JV, Yoder HS Jr (1956) Experimental and theorethical studies of the mica polymorphs. Mineral Mag 31:209-235
Soboleva SV, Sidorenko OV, Zvyagin BB (1977) Crystal structure of paragonite 1M. Sov Phys Crystallogr 22:291-294
Sokolova GV, Aleksandrova VA, Drits VA, Bairakov VV (1979) Crystal structures of two lithium-bearing brittle micas. In Kristallokhimaya I Strukturnaya Mineralogiya. Krank-Kamenetskii VA (ed) Nauka, Leningrad, p 55-66
Speer J A (1984) Micas in igneous rocks. Rev Mineral 13:299-356 Srodon J, Elsass F, McHardy WJ, Morgan DJ (1992) Chemistry of illite-smectite inferred from TEM
measurements of fundamental particle. Clay Minerals 27:137-158 Steinfink U (1962) Crystal structure of a trioctahedral mica: Phlogopite. Am Mineral 47:886-896 Sterne EJ, Reynolds RC Jr, Zantop H (1982) Natural ammonium illites from black shales hosting a
stratiform base metal deposit, DeLong Mountains, Northern Alaska. Clays Clay Minerals 30:161-166 Sterne EJ, Zantop H, Reynolds RC (1984) Clay mineralogy and carbon-nitrogen geochemistry of the Lik
and Competition Creek zinc-lead-silver prospects, DeLong Mountains, Alaska. Econ Geol 79: 1406-1411
Swanson TH, Bailey SW (1981) Redermination of the lepidolite-2M1 structure. Clays Clay Minerals 29: 81-90
Takeda H, Burnham CW (1969) Fluor-polylithionite: a lithium mica with nearly hexagonal (Si2O5)2- ring. Mineral J 6:102-109
Takeda H, Donnay JDH (1966) Trioctahedral one-layer Micas. III. Crystal structure of a synthetic lithium fluormica. Acta Crystallogr 20:638-646
Takeda H, Morosin B (1975) Comparison of observed and predicted structural parameters of mica at high temperature. Acta Crystallogr B31:2444-2452
Takeda H, Haga N, Sadanaga R (1971) Structural investigation of a polymorphic transition between 2M2-, 1M-lepidolite and 2M1-muscovite. Mineral J 6:203-215
Takeda H, Ross M (1975) Mica polytypism: Dissimilarities in the crystal structures of coexisting 1M and 2M1 biotite. Am Mineral 60:1030-1040
Takéuchi Y (1965) Structures of brittle micas. Clays Clay Minerals 13:1-25 Takéuchi Y (1975) The distortion of Si(Al)-tetrahedra in sheet silicates. Contribution Clay Mineralogy.
T. Sudo Volume, K Henmi (ed) p 1-6 Tateyama H, Shimoda S, Sudo T (1974) The crystal structure of synthetic MgIV mica. Z Kristallogr
139:196-206 Tepikin EV, Drits VA, Alexandrova VA (1969) Crystal structure of iron biotite and construction of
structural models for trioctahedral micas. Proc 4th Int’l Clay Conf, Tokyo, p 43-49 Tlili A, Smith DC, Bény J-M, Boyer H (1989) A Raman microprobe study of natural micas. Mineral Mag
53:165-179 Toraya H (1981) Distortions of octahedra and octahedral sheets in 1M micas and the relation to their
stability. Z Kristallogr 157:173-190 Toraya H, Marumo F (1981) Structure variation with octahedral cation substitution in the system of
germanate micas KMg3-xMnxGe3AlO10F2. Mineral J 10:396-407 Toraya H, Iwai S, Marumo F, Daimon M, Kondo R (1976) The crystal structure of tetrasilicic potassium
fluor mica KMg2.5Si4O10F2. Z Kristallogr 144:42-52 Toraya H, Iwai S, Marumo F, Hirao M (1977) The crystal structure of taeniolite, KLiMg2Si4O10F2.
Z Kristallogr 146:73-83

Mica Crystal Chemistry and Influence of P-T-X on Atomistic Models 97
Toraya H, Iwai S, Marumo F, Hirao M (1978a) The crystal structures of germanate micas KMg2.5Ge4O10F2 and KLiMg2Ge4O10F2. Z Kristallogr 148:65-81
Toraya H, Iwai S, Marumo F, Hirao M (1978c) The crystal structure of germanate micas KMg3Ge3AlO10F2. Mineral J 9:221-230
Toraya H, Marumo F, Hirao M (1983) Synthesis and the crystal structure of manganoan fluoromica K(Mg2.44 Mn0.24)(Si3.82Mn0.18)O10F2. Mineral J 11:240-247
Toraya H, Iwai S, Marumo F, Nishikawa T, Hirao M (1978b) The crystal structure of synthetic mica KMg2.75Si3.5Al0.5O10F2. Mineral J 9:210-220
Tracy RJ (1978) High-grade metamorphic reactions and partial melting in pelitic schist, west-central Massachusetts. Am J Sci 278:150-178
Tsipursky SI, Drits VA (1984) The distribution of octahedral cations in the 2:1 layers of dioctahedral smectites studied by oblique-texture electron diffraction. Clay Minerals 19:177-193
Tsipursky SI, Kameneva MYu, Drits VA (1985) Structural transformations of Fe3+-containing 2:1 dioctahedral phyllosilicates in the course of dehydroxylation. 5th Meet Eur Clay Groups, Prague, p 569-577
Tyrna PL, Guggenheim S (1991) The crystal structure of norrishite, KLiMn23+ Si4O12: An oxygen-rich
mica. Am Mineral 76:266-271 Udagawa S, Urabe K, Hasu H (1974) The crystal structure of muscovite dehydroxylate. Japan Assoc
Mineral Petrol Econ Geol 69:381-389 Visser D, Nijland TG, Lieftink DJ, Maijer C (1999) The occurrence of preiswerkite in a tourmaline-biotite-
scapolite rock from Blengsvatn, Norway. Am Mineral 84:977-982 Volfinger M, Robert J-L (1979) Le lithium dans une phlogopite de sythèse. Bull Minéral 102:26-32 Volfinger M, Robert J-L (1980) Structural control of the distribution of trace elements between silicates
and hydrothermal solutions. Geochim Cosmochim Acta 44:1455-1461 Von Damm KL, Edmond JM, Measures CI, Grant B (1985) Chemistry of submarine hydrothermal
solutions at Guaymas Basin, Gulf of California. Geochim Cosmochim Acta 49:2221-2237 Wardle R, Brindley GW (1972) The crystal structures of pyrophyllite-1Tc and of its dehydroxylate. Am
Mineral 57:732-750 Weiss Z, Rieder M, Chmielová M (1992) Deformation of cocordination polyhedra and their sheets in
phyllosilicates. Eur J Mineral 4:665-682 Weiss Z, Rieder M, Chmielová M, Krajicek J (1985) Geometry of the octahedral coordination in micas: a
review of refined structures. Am Mineral 70:747-757 Weiss Z, Rieder M, Smrcok L, Petrícek V, Bailey SW (1993) Refinement of the crystal structures of two
"protolithionites." Eur J Mineral 5:493-502 Wilson PN, Parry WT, Nash WP (1992) Characterization of hydrothermal tobelitic veins from black shale,
Oquirrh Mountains, Utah. Clays Clay Minerals 40:405-420 Wolf MB, London D (1997) Boron in granitic magmas: stability of tourmaline in equilibrium with biotite
and cordierite. Contrib Mineral Petrol 130:12-30 Yang Y, Ni Y, Wang L, Wang W, Zhang Y, Chen C (1988) Nanpingite—A new cesium mineral. Yanshi
Kuangwuxue Zashi (China) 7:49-58 (abstr: Am Mineral 75:708-709) Ylagan RF, Altaner SP, Pozzuoli A (2000) Reaction mechanisms of smectite illitization associated with
hydrothermal alteration from Ponza Island, Italy. Clays Clay Minerals 48:610-631 Zhoukhlistov AP, Zvyagin BB, Lazarenko EK, Pavlishin VI (1977) Refinement of the crystal structure of
ferrous seladonite. Sov Phys Crystallogr 22:284-288 Zhoukhlistov AP, Zvyagin BB, Soboleva SV, Fedotov AF (1973) The crystal structure of the dioctahedral
mica 2M2 determined by high voltage electron diffraction. Clays Clay Minerals 21:465-470 Zöller M, Brockamp O (1997) 1M- and 2M1-illites: different minerals and not polytypes. Eur J Mineral
9:821-827 Zvyagin BB (1957) Determination of the structure of celadonite by electron diffraction. Sov Phys
Crystallogr 2:388-394 Zvyagin BB (1967) Electron Diffraction Analysis of Clay Minerals Structures. Plenum Press, New York Zvyagin BB, Rabotnov VT, Siderenko OV, Kotelnikov DD (1985) Unique mica from noncentrosymmetric
layers. Izv Akad Nauk SSSR, Ser Geologicheskaya 35:121-124

1529-6466/02/0046-0002$05.00 DOI:10.2138/rmg.2002.46.02
2 Behavior of Micas at High-Pressure and High-Temperature
Pier Francesco Zanazzi Dipartimento di Scienze della Terra
Universitá degli Studi di Perugia Piazza Università, Perugia, Italy
e-mail: [email protected]
Alessandro Pavese Dipartimento di Scienze della Terra
Università degli Studi di Milano Via Botticelli 23, 20133 Milano, Italy
e-mail: [email protected]
INTRODUCTION Micas have been long known to play a crucial role in most petrologic and
petrogenetic processes, both in magmatic and metamorphic environments. Understanding the crystal-chemical and thermoelastic behavior of this mineral family with variations in pressure (P), temperature (T) and composition (X) is crucial to provide a reliable basis for further interpretation and prediction of phase equilibria, transformations and most reactions occurring in a variety of rocks. In addition, the development of geothermom- eters and geobarometers has extensively made use of compositional (Fe/Mg+Fe ratio, K/Na+K ratio, Tschermak substitution, etc.) and structural (cation ordering, polytypic occurrence, etc.) properties of micas, or of their occurrence in assemblages at equilibrium with other phases. A few studies by in situ high-pressure, high-temperature and high-pressure–high-temperature experiments are available (see e.g., Chapter 8 in Reviews in Mineralogy and Geochemistry, Volume 41). The objectives of these studies are to determine structural and thermoelastic properties of micas and to understand the microscopic mechanisms ruling their responses to thermobaric stress.
Following these objectives, we partition such investigations into two categories: 1. Those which do not lead to a breakdown or permanent change of the structure of
the reactant phase or of its chemical composition. • High-pressure studies (single crystal, SC, and/or powder diffraction, PD) within
the elastic boundaries of response are required for the determination of P-V equations of state, of compressibilities of bond lengths, of polyhedral volumes and similar parameters for any other structural building units. These studies lead to the understanding of compression mechanisms and to the estimate of the PV-contribution to the Gibbs energy for correct interpretation of stability fields.
• High-temperature studies (SC, PD) are aimed at determining bulk/polyhedral/ bond-length thermal expansions, or at obtaining insight into cation rearrange-ments triggered by temperature. Results from these studies produce information on the structural response to heating, on the bulk/tensorial thermal-expansion coefficients used in thermodynamic calculations and on the cation order-disorder reaction mechanisms.
• High-pressure/high-temperature studies (SC, PD) for determination of P-V-T equations of state. These results lead to an understanding of thermoelastic properties, of exsolution phenomena and of phase diagrams.

100 Zanazzi & Pavese
• Measurements at ambient conditions of elastic constants contribute to refining the equation of state.
2. Those which cause significant change of the structure, or of the chemical composition.
• High-pressure studies (PD) involving the tracking of transformations to amorphous phases. These studies contribute to the understanding of breakdown reactions in high-pressure metamorphic environments.
• High-temperature studies (SC, PD) are mostly devoted to investigations on oxidization reactions in Fe-bearing micas, and on dehydroxylation/dehydration processes. These studies lead to the understanding of mechanisms of storage and release of H2O in hydrated sheet silicates through thermal activation and the effects of the oxygen fugacity upon phase relation diagrams.
Given the variety of topics targeted by studies at non-ambient conditions on micas, many methodologies are used, both of experimental and of theoretical nature. These methodologies are: 3. Experimental diffraction techniques (sealed-source X-ray tube; synchrotron radiation
source; pulsed/steady neutron sources) with conditioning chambers, properly designed to achieve high-pressure, high-temperature, and high-pressure–high-temperature conditions. [See Chapters 14, 15, and 16 in “Hi gh Temperature and High-Pressure Crystal Chemistry,” Reviews in Mineralogy and Geochemistry Vol. 41 (R.M. Hazen and R.T. Downs, editors, 2000) for detailed descriptions.]
4. Experimental shock-wave methods, or Brillouin scattering techniques used to measure elastic constants at either ambient, or non-ambient conditions.
5. Theoretical models to develop P-V and P-V-T equations of state, which provide links between thermodynamics, structural data and thermoelasticity. As discussed above for the objectives and methodologies, we consider trioctahedral
and dioctahedral micas. We stress the differences of behavior as a function of environmental variables exhibited by these two “subgroups.” Investigation techniques for the study of the thermoelastic behavior of micas
Among the techniques concerning crystallography and spectroscopy under static high pressure, the diamond anvil cell (DAC) is a powerful device. The best system for obtaining high pressures involves the use of two gem-quality single-crystal diamonds with flat surfaces to serve as anvil faces. Diamond is used because of its high degree of hardness, and because it is transparent to most electromagnetic radiations. The diamonds are set so that a sample (a powder or a crystal) can be mounted between the anvil faces. The area of the culet face is small, thereby allowing very high pressures to be reached with small loads. A thick sheet of metal having a hole with a diameter smaller than that of the diamond faces is used as a gasket between the two diamonds: the hole is the chamber in which the sample, generally together with a fluid as a hydrostatic medium, is located. The apparatus must be small to be mounted on a diffractometer. Larger cells have been used in connection with neutron studies (Catti et al. 1994). Detailed descriptions of different DACs are given by Ahsbahs (1987) and Hazen and Finger (1982), and updated in Chapters 14 and 16 in “High-Temperature and High-Pr essure Crystal Chemistry,” Reviews in Mineralogy and Geochemistry Vol.41 (R.M. Hazen and R.T. Downs, editors, 2000).
Several methods for measuring pressure have been developed. By far the most popular method for high-pressure calibration is based on the wavelength shift of the fluorescence lines of some elements excited by an intense source. One frequently used

Micas at High Temperature and High Pressure 101
sensor is ruby (Barnett et al. 1973): when excited by blue light, Cr3+ in the matrix of Al2O3 undergoes a 2E-4A2 transition, generating a doublet whose wavelength increases with pressure.
Single-crystal diffractometry under high pressure presents several experimental problems, which generally produce low-quality intensity data, and hence, inferior structural refinement results (Zanazzi 1996, Angel et al. 2001). Generally, diffractometry studies were performed with sealed-source X-ray tubes, synchrotron, or neutron radiation.
The thermoelastic behavior of micas was also studied by dynamic methods, namely shock wave compression (Sekine et al. 1991), or by techniques involving resonant ultrasound spectroscopy (Aleksandrov and Ryzhova 1961) or by Brillouin spectrometry (Vaughan and Guggenheim 1986).
For a description of the devices and methods for high-temperature studies, see Chung et al. (1993) and see Chapter 13 in “H igh-Temperature and High-Pressure Crystal Chemistry,” Reviews in Mineralogy and Geochemistry Vol. 41 for more recent techniques.
Heating methods can be grouped into three main categories: (1) Hot gas. The sample is heated by a gas flow (N2) passing over a coiled electric
heating element. Maximum temperature is about 900°C, and stability is poor. (2) Radiative furnaces. A resistance wire is embedded in a refractory cement or ceramic
with conical openings for accessibility to the sample. Furnaces are normally designed to operate in air, although the crystal itself may be sealed in a glass capillary. Some heaters operate either in vacuum or in a controlled atmosphere (especially for neutron diffraction).
(3) Laser heating. This heating method is based on the use of laser (Nd-YAG, or CO2). This method involves the local heating of the sample in connection with the diamond anvil cell for high P and high T studies in the simulation of geophysical conditions. [See Chapter 13 in “High-Temperature and High-Pressure Crystal Chemistry,” Reviews in Mineralogy and Geochemistry Vol. 41 for additional refs.]
P-V and P-V-T equations of state One of the main goal of studies at non-ambient conditions involves the derivation of
the equations of state (EoS) of minerals, which are crucial for the prediction and interpretation of high-pressure and high-temperature processes. The EoS relates volumetric changes to intensive environmental variables, such as P and/or T [see Wallace (1972) for a survey]. In particular, EoS are the one way to determine the contribution PV to the Gibbs energy, which fixes stability of phases at given thermobaric conditions. EoS’s are also able, at least in principle, to predict the behavior of the bulk modulus as a function of pressure and temperature for wide P-T ranges. Furthermore, data involving P-V-T can be used to obtain the bulk thermal expansion as a function of pressure and temperature simultaneously. Thus equations of state are fundamental in investigating materials in general at non-ambient conditions.
We report and discuss briefly some of the most used EoS, although the reader should refer to Angel (2001), Duffy and Wang (1998), and Anderson (1995) for a more detailed presentation. EoS can broadly be divided into two categories:
f(P,V) = 0 and f(P,V,T) = 0 where the former is commonly called “ P-V” EoS (i.e., isothermal EoS), and the latter

102 Zanazzi & Pavese
“ P-V-T” EoS. P-V equations of state are in most applications described by the Birch-Murnaghan (1986) expression, such that: 5/2 2( ) 3 (1 2 ) ( )E E E EP V f f A Bf Cf= + + + (1) where A = K0, B = 3/4 K0(K′0 - 4), and C = 3/2 K0
2K′′0 + 3/2 K′02K0 - 21/2 K0K′0 + 143/6; K0, K′0 and K′′0 are the bulk modulus, its first and second derivatives versus pressure at room conditions, respectively; fE is the Eulerian strain, defined as
2/30 0
1 ( / ) 12Ef V V⎡ ⎤= −⎣ ⎦ (2)
where V and V0 are the volume at P and at ambient conditions, respectively. A truncation with C = 0 in Equation (1) is in general sufficient to describe the
behavior of minerals at very high pressure. Values for measured P-V data are generally not needed for C [for more details, see Angel (2001)].
An alternative P-V EoS was provided by Vinet et al. (1986; 1987), and derived from very general principles. Its form is as follows
002
3 (1 ) 3( ) exp ( 1)(1 )
2
K WP V K W
W
− ⎡ ⎤′= − −⎢ ⎥⎣ ⎦ (3)
where W =( V/V0)1/3. Extensions of Equation (3) were provided by Vinet et al. (1989) and by Moriarty
(1995). These formalisms, however, are beyond the introductory purposes of this presentation. The Vinet EoS is well suited to cope with structurally simple materials (Jeanloz 1988), and results more appropriate than the Birch-Murnaghan function for cases involving very high compression, when W < 0.6 (Vinet et al. 1986).
The experimental P-V data are fitted by Equation (1) or Equation (3) to infer the elastic parameters which, for the reasons stated above, are commonly restricted to K0 and K′0. The extension of the P-V EoS’s to the high-temperature regime can be made by replacing K0, K′0 and V0 with K0(T), K′0(T) and V0(T), which represent the corresponding quantities at T and ambient pressure. K0(T), K'0(T) and V0(T) are parametrized as a function of T in several ways [for instance, see Saxena and Zhang, 1990]. K0(T) is well known to have a quasi-linear behavior at high temperature, whereas for K'0(T) Saxena and Zhang (1990) proposed a logarithmic dependence on T. V0(T) fulfils the standard relationship
0
0 0( ) exp ( )T
V
T
V T V T dT⎡ ⎤
′ ′= α⎢ ⎥⎢ ⎥⎣ ⎦∫ (4)
where αV is the bulk thermal expansion coefficient. Applications of such a sort of EoS’s have been hitherto reported, for example, by Shinmei et al. (1999), Pavese et al. (1999b) and Utsumi et al. (1998).
An alternative way of introducing the thermal dependence on T in an EoS consists in splitting P into two components, that is
P = PS + PTH (5) where PS has a purely static origin and can be calculated as above [(Eqn.1) or (Eqn.3)], while PTH is a temperature dependent part (“ther mal pressure”). In turn, one has that
0
T
TH V T
T
P K dT= α∫ (6)
Micas at High Temperature and High Pressure 103
A remarkable simplification (Vinet et al. 1987; Birch, 1986) occurs if T > ΘD, where ΘD is the Debye temperature of the compound under study, given that PTH can be approximated as
,0 0 0( )t VP K T T= −α (7) where αV,0 stands for the bulk thermal expansion coefficient at a reference temperature (T0) and ambient pressure. Such an approximation, which was empirically proven (Anderson and Isaak 1995) to hold below ΘD for many materials, allows one to linearize the dependence of the EoS on T, and leads to a significant numerical simplification.
Other EoS have not been considered in this brief outline for the sake of brevity: Poirier and Tarantola (1998), Jackson and Rigden (1996), Kumar and Bedi (1996), Holzapfel (1996), Kumar (1995). Also the use of the Rankine-Hugoniot equations related to shock wave methods (Ahrens 1987) is not discussed here. Dioctahedral micas
Compressibility of white mica . Several methods were used to study the elastic behavior of dioctahedral micas. After the first compression data of Bridgman (1949), Aleksandrov and Ryzhova (1961) measured an incomplete set of elastic constants of muscovite by ultrasonic methods, assuming a hexagonal symmetry for mica. Vaughan and Guggenheim (1986) measured muscovite elasticity by Brillouin spectrometry in its proper monoclinic symmetry. Sekine et al. (1991) obtained the EoS of muscovite by a shock wave method. Faust and Knittle (1994) studied muscovite under pressure by powder X-ray methods to 270 kbar, where complete amorphization of mica occurs. Catti et al. (1994) determined the compressibility of muscovite 2M1 by powder neutron diffraction up to 20 kbar. Comodi and Zanazzi (1995, 1997) measured the compressibility of two samples of muscovite with different Na content, and that of paragonite by single-crystal diffraction methods in the range of 0-40 kbar. The EoS of a phengite 3T was modeled by Pavese et al. (1999b) on the basis of synchrotron powder diffraction measurements, performed at high P and T (P in the range of 0-50 kbar, T to 1000K). Finally, Smyth et al. (2000) determined the bulk elastic properties of synthetic 2M1 and 3T Si-rich phengites. No data are available for brittle micas.
Figure 1 plots the equations of state of muscovite on the basis of the literature data. Differences in samples and methodologies produce scattered values of the compressibility (Table 1). The main observed features, however, show the strong control the atomic arrangement has on the anisotropy of the elastic behavior. The compressibility along [0 0 1] direction is between three and five times (depending on chemical composition) greater than that along the a or b axes.
The main deformation mechanisms based on the single-crystal structural refinements under pressure for muscovite and paragonite-2M1 (Comodi and Zanazzi 1995, 1997) are: 1. The high compressibility along the [001] direction, largely related to the reduction in
the interlayer thickness. This behavior is expected because of the weak bonding of the interlayer cation. The effect is more evident if the cation is potassium, and decreases if potassium is substituted by sodium (Fig. 2).
2. The smaller compressibility observed as Na increases relative to K is explained by stronger repulsion between the basal oxygen atom planes on both sides of the Na interlayer cation, owing to shorter csinβ and greater α tetrahedral rotation than for samples containing K.
3. (Si,Al)-O bond lengths do not vary significantly in the P range of 0-40 kbar. On the whole, tetrahedral volume increases slightly. Tetrahedral thickness also apparently increases, probably owing to tetrahedral tilting out of the (001) plane. A reduction of
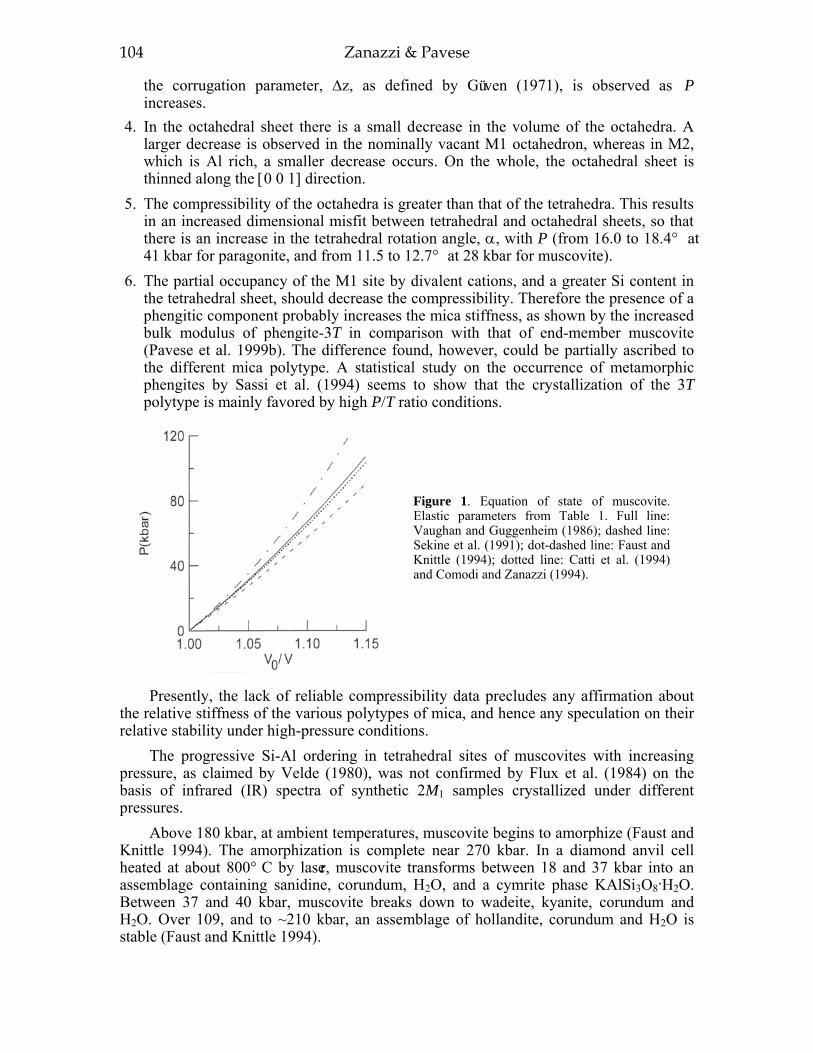
104 Zanazzi & Pavese
the corrugation parameter, Δz, as defined by Güven (1971), is observed as P increases.
4. In the octahedral sheet there is a small decrease in the volume of the octahedra. A larger decrease is observed in the nominally vacant M1 octahedron, whereas in M2, which is Al rich, a smaller decrease occurs. On the whole, the octahedral sheet is thinned along the [0 0 1] direction.
5. The compressibility of the octahedra is greater than that of the tetrahedra. This results in an increased dimensional misfit between tetrahedral and octahedral sheets, so that there is an increase in the tetrahedral rotation angle, α, with P (from 16.0 to 18.4° at 41 kbar for paragonite, and from 11.5 to 12.7° at 28 kbar for muscovite).
6. The partial occupancy of the M1 site by divalent cations, and a greater Si content in the tetrahedral sheet, should decrease the compressibility. Therefore the presence of a phengitic component probably increases the mica stiffness, as shown by the increased bulk modulus of phengite-3T in comparison with that of end-member muscovite (Pavese et al. 1999b). The difference found, however, could be partially ascribed to the different mica polytype. A statistical study on the occurrence of metamorphic phengites by Sassi et al. (1994) seems to show that the crystallization of the 3T polytype is mainly favored by high P/T ratio conditions.
Presently, the lack of reliable compressibility data precludes any affirmation about the relative stiffness of the various polytypes of mica, and hence any speculation on their relative stability under high-pressure conditions.
The progressive Si-Al ordering in tetrahedral sites of muscovites with increasing pressure, as claimed by Velde (1980), was not confirmed by Flux et al. (1984) on the basis of infrared (IR) spectra of synthetic 2M1 samples crystallized under different pressures.
Above 180 kbar, at ambient temperatures, muscovite begins to amorphize (Faust and Knittle 1994). The amorphization is complete near 270 kbar. In a diamond anvil cell heated at about 800°C by laser, muscovite transforms between 18 and 37 kbar into an assemblage containing sanidine, corundum, H2O, and a cymrite phase KAlSi3O8
.H2O. Between 37 and 40 kbar, muscovite breaks down to wadeite, kyanite, corundum and H2O. Over 109, and to ~210 kbar, an assemblage of hollandite, corundum and H2O is stable (Faust and Knittle 1994).
Figure 1. Equation of state of muscovite. Elastic parameters from Table 1. Full line: Vaughan and Guggenheim (1986); dashed line: Sekine et al. (1991); dot-dashed line: Faust and Knittle (1994); dotted line: Catti et al. (1994) and Comodi and Zanazzi (1994).

Micas at High Temperature and High Pressure 105
Table 1. Bulk modulus at P = 0 (K0 in kbar)* and its first derivative versus pressure for dioctahedral micas.
* K0 values obtained from static compression measurements are the isothermal moduli, values obtained from Brillouin spectroscopy and shock wave measurements are the adiabatic moduli.
Sample K0 K’ 0 Technique
Muscovite-2M1 (Vaughan & Guggenheim 1986)
582
-
Brillouin spectroscopy
Muscovite-2M1 (Sekine et al. 1991)
520
3.2
shock wave
Muscovite-2M1 (Faust and Knittle 1994)
614 6.9 static compression powder diffraction
Muscovite-2M1 (Catti et al. 1994)
560
4 static compression neutron powder diffraction
Muscovite-2M1 (Comodi and Zanazzi 1995)
560
-
static compression single crystal diffraction (β -1)
Na-Muscovite-2M1 (Comodi and Zanazzi 1995)
600
- static compression single crystal diffraction (β -1)
Paragonite-2M1 (Comodi and Zanazzi 1997)
655
- static compression single crystal diffraction (β -1)
Phengite-3T (Pavese et al. 1999)
583
6.6
static compression synchrotron X-ray diffraction
Phengite-3T (Smyth et al. 2000)
620 9 static compression single crystal diffraction
Phengite-2M1 (Smyth et al. 2000)
570 9.2 static compression single crystal diffraction
Figure 2. β-1 (kbar) as a function of Na/(Na+K) in dioctahedral micas. Data from Comodi and Zanazzi (1997).
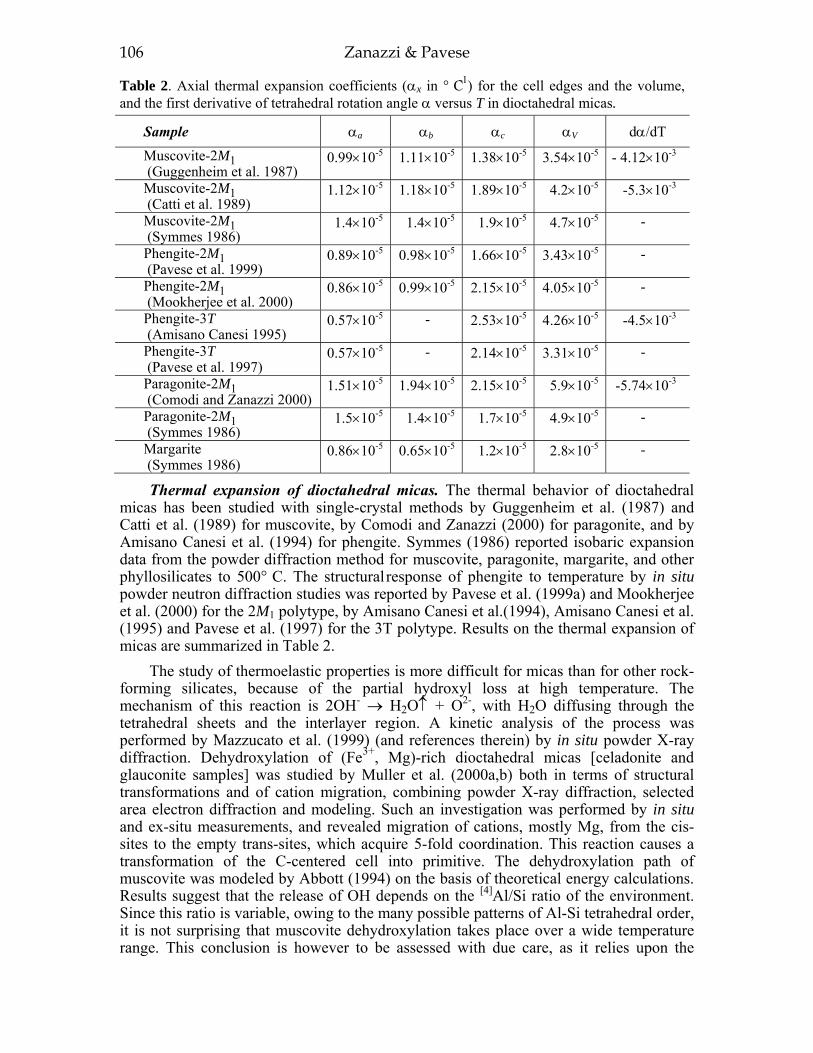
106 Zanazzi & Pavese
Table 2. Axial thermal expansion coefficients (αx in °C-1) for the cell edges and the volume, and the first derivative of tetrahedral rotation angle α versus T in dioctahedral micas.
Sample αa αb αc αV dα/dT Muscovite-2M1 (Guggenheim et al. 1987)
0.99×10⁻⁵ 1.11×10⁻⁵ 1.38×10⁻⁵ 3.54×10⁻⁵ - 4.12×10⁻³
Muscovite-2M1 (Catti et al. 1989)
1.12×10⁻⁵ 1.18×10⁻⁵ 1.89×10⁻⁵ 4.2×10⁻⁵ -5.3×10⁻³
Muscovite-2M1 (Symmes 1986)
1.4×10⁻⁵ 1.4×10⁻⁵ 1.9×10⁻⁵ 4.7×10⁻⁵ -
Phengite-2M1 (Pavese et al. 1999)
0.89×10⁻⁵ 0.98×10⁻⁵ 1.66×10⁻⁵ 3.43×10⁻⁵ -
Phengite-2M1 (Mookherjee et al. 2000)
0.86×10⁻⁵ 0.99×10⁻⁵ 2.15×10⁻⁵ 4.05×10⁻⁵ -
Phengite-3T (Amisano Canesi 1995)
0.57×10⁻⁵ - 2.53×10⁻⁵ 4.26×10⁻⁵ -4.5×10⁻³
Phengite-3T (Pavese et al. 1997)
0.57×10⁻⁵ - 2.14×10⁻⁵ 3.31×10⁻⁵ -
Paragonite-2M1 (Comodi and Zanazzi 2000)
1.51×10⁻⁵ 1.94×10⁻⁵ 2.15×10⁻⁵ 5.9×10⁻⁵ -5.74×10⁻³
Paragonite-2M1 (Symmes 1986)
1.5×10⁻⁵ 1.4×10⁻⁵ 1.7×10⁻⁵ 4.9×10⁻⁵ -
Margarite (Symmes 1986)
0.86×10⁻⁵ 0.65×10⁻⁵ 1.2×10⁻⁵ 2.8×10⁻⁵ -
Thermal expansion of dioctahedral micas. The thermal behavior of dioctahedral micas has been studied with single-crystal methods by Guggenheim et al. (1987) and Catti et al. (1989) for muscovite, by Comodi and Zanazzi (2000) for paragonite, and by Amisano Canesi et al. (1994) for phengite. Symmes (1986) reported isobaric expansion data from the powder diffraction method for muscovite, paragonite, margarite, and other phyllosilicates to 500°C. The structural response of phengite to temperature by in situ powder neutron diffraction studies was reported by Pavese et al. (1999a) and Mookherjee et al. (2000) for the 2M1 polytype, by Amisano Canesi et al.(1994), Amisano Canesi et al. (1995) and Pavese et al. (1997) for the 3T polytype. Results on the thermal expansion of micas are summarized in Table 2.
The study of thermoelastic properties is more difficult for micas than for other rock-forming silicates, because of the partial hydroxyl loss at high temperature. The mechanism of this reaction is 2OH- → H2O↑ + O2-, with H2O diffusing through the tetrahedral sheets and the interlayer region. A kinetic analysis of the process was performed by Mazzucato et al. (1999) (and references therein) by in situ powder X-ray diffraction. Dehydroxylation of (Fe3+, Mg)-rich dioctahedral micas [celadonite and glauconite samples] was studied by Muller et al. (2000a,b) both in terms of structural transformations and of cation migration, combining powder X-ray diffraction, selected area electron diffraction and modeling. Such an investigation was performed by in situ and ex-situ measurements, and revealed migration of cations, mostly Mg, from the cis-sites to the empty trans-sites, which acquire 5-fold coordination. This reaction causes a transformation of the C-centered cell into primitive. The dehydroxylation path of muscovite was modeled by Abbott (1994) on the basis of theoretical energy calculations. Results suggest that the release of OH depends on the [4]Al/Si ratio of the environment. Since this ratio is variable, owing to the many possible patterns of Al-Si tetrahedral order, it is not surprising that muscovite dehydroxylation takes place over a wide temperature range. This conclusion is however to be assessed with due care, as it relies upon the

Micas at High Temperature and High Pressure 107
assumption of a precise knowledge of the hydrogen position, which thing is hard to be determined at an adequate level of precision.
The formation of a metastable dehydroxylated phase is shown by a marked change in slope of the lattice constants and cell volume upon increasing T. This was found in muscovite above 800°C (Guggenheim et al. 1987) and in paragonite above 600°C (Comodi and Zanazzi 2000). This is in agreement with the greater thermal stability of muscovite than paragonite’s obtained from petrographic evidence (Guidotti 1984) and experimental phase relations (Hewitt and Wones 1984). However, the temperature range of dehydroxylation is variable, depending on the rate of the change in T and the possible non-equilibrium conditions of the sample, e.g. those occurring during thermal analysis, or on a hypothetic locally different Al-Si order in tetrahedral sites (Abbott 1994).
For paragonite, the dehydroxylation process is completed below 700°, as shown by Raman spectra. Structure refinements by single-crystal method (Comodi and Zanazzi 2000) show that the dehydroxylated phase is similar to the dehydroxylation product of muscovite (Udagawa et al. 1974). In this phase, the “octahedral” sheets undergo the greatest changes, because the Al ions become five-fold coordinated to form distorted trigonal bipyramids. The sheet of these polyhedra is sandwiched between two tetrahedral sheets, with an atomic arrangement similar to that of the precursor mica. This reaction is topotactic. Because of the enlarged dimensions of the Al sheet, tetrahedral rotation angle decreases, going from 16.2° in paragonite to 13.3° in the anhydrous phase.
The effects of temperature on the mica structure, based on the single-crystal refinements of muscovite at 650°C (Guggenheim et al. 1987) and of paragonite at 600°C (Comodi and Zanazzi 2000), can be summarized as follows: 1. the expansion of dioctahedral micas, like that of other phyllosilicates, is strongly
anisotropic, with maximum value along the [001] direction (Table 2). The anisotropy is slightly smaller in paragonite than in muscovite. The effect on the c-cell parameter is mainly related to the expansion of the interlayer thickness. The variation in the interlayer thickness is 0.07 Å in muscovite and 0.13 Å in paragonite. The β angle does not change with T in muscovite, but decreases in paragonite.
2. the tetrahedral (Si,Al) volume does not change significantly in the investigated interval (25-650°C for muscovite; 25-600°C for paragonite). The Al octahedra expand slightly: the volume of M2 increases by 1.5% in muscovite, and by 2.5% in paragonite. The volume of the M1 vacant site increases by 1.8% in muscovite and by 4% in paragonite. The resulting total increase of the [2:1] layer thickness is 0.02 Å in muscovite and 0.013 Å in paragonite.
3. the effects of intensive variables P and T on the structure of mica are roughly similar, but opposite in sign. This applies to variations in cell edges and to their anisotropy, as well as to polyhedral deformations. The greatest effects concern the interlayer region, where the difference of the six "inner" and six "outer" distances in the interlayer cation polyhedron decreases with T and increases with P. The same trend is observed for the tetrahedral rotation angle α, going from 11.8 to 9.2° in muscovite and from 16.2 to 12.9° in paragonite. Assuming that
1. the variations induced by T and P are cumulative, 2. the derivative of the thermal expansion coefficient versus P at constant T, (∂α/∂P)T ,
is negligible, 3. the derivative of the compressibility coefficient versus T at constant P, (∂β∂T)P , is
negligible,

108 Zanazzi & Pavese
the conditions which do not change the structure with respect to ambient conditions can be determined, at least volumetrically. At first approximation, the resulting EoS in the PTV space for paragonite and muscovite are: V/V0 = 1 + 5.9×10⁻⁵ T – 0.00153 P and V/V0 = 1 + 4.3×10⁻⁵ T – 0.0017 P (T is in °C and P is in kilobars), showing that paragonite is more expandible and less compressible than muscovite. This is a significant datum concerning the shape of the Pg-Ms solvus at high P and T.
Order-disorder of Si and Al in tetrahedral sites as a function of temperature was the object of several studies, with controversial results. The behavior of phengite-3T from Dora Maira at high T was studied by in situ single-crystal X-ray diffraction (Amisano-Canesi et al. 1994; Amisano-Canesi 1995) and powder neutron diffraction (Pavese et al. 1997, 2000). These authors found that this sample seems to exhibit cation ordering both on the tetrahedral and on the octahedral sites, supporting the hypothesis of Sassi et al. (1994) that a high P/T ratio induces cation order. Powder neutron diffraction on a Fe-rich phengite-2M1 (Pavese et al. 1999a) showed that cation partitioning is disordered at room temperature, but Al fully orders into the T1 site at 600°C. This result is in contrast with the findings of Mookherjee et al. (2000) on phengite-2M1 from Greece, who find no evidence for changes in tetrahedral cation order on heating (in situ powder neutron diffraction to 650°C).
Low-temperature powder neutron diffraction measurements were used by Pavese et al. (2001) to investigate the fractional occupancy of the M1 site of phengite-3T and -2M1, commonly assumed to be empty. Trioctahedral micas
High pressure studies. High pressure investigations on trioctahedral micas are hitherto very scarce. Hazen and Finger (1978) first pioneered the crystal structures and compressibilities of layer minerals at high pressure, investigating natural phlogopite and chlorite. There was a twenty-year long lack of high pressure studies on trioctahedral micas until the work of Comodi et al. (1999), who dealt with high-pressure and high-temperature behavior of Cs-tetra-ferri-annite-1M (composition: Cs1.78(Fe2+
5.93Fe3+0.07)
(Si6.15Fe3+1.80Al0.05)O20(OH)4), and Comodi et al. (2001), who studied the compressibility
of Rb-tetra-ferri-annite-1M; hereafter, referred to “C s-annite” and “Rb-annite,” respectively. Note that (1) the investigated samples are synthetic, and that (2) the results therein reported can only be extrapolated to natural micas (i.e., K- and Na-rich micas) with care. The above studies provide indications about the microscopic mechanisms governing the behavior of trioctahedral micas under pressure and explore the baric range to 50 kbar, which is sufficient for applications of geological interest.
In Table 3, the compressibility of the lattice parameters and of the polyhedral building units are reported, along with other structural parameters useful to understand the high-pressure behavior of Cs-annite, Rb-annite and phlogopite. The points outlined below show the effect of how different structural units of trioctahedral micas relate with one another, and then respond as a whole to pressure: 1. Most of the volume reduction under pressure occurs along the [001] direction. This
is readily understood by observing, in Table 3, the remarkable anisotropy of the axial compressibilities. The shortening of the c axis is responsible of about 81% (Cs-annite) and 70% (phlogopite and Rb-annite) of the reduction in volume. An analysis of the change of the tetrahedral, octahedral and interlayer thicknesses as a function of pressure reveals that the interlayer thickness undergoes a shortening at least ten times as large as the others, which, in turn, are comparable with one another.
2. The interlayer site exhibits a significantly smaller bulk modulus than the other sites,
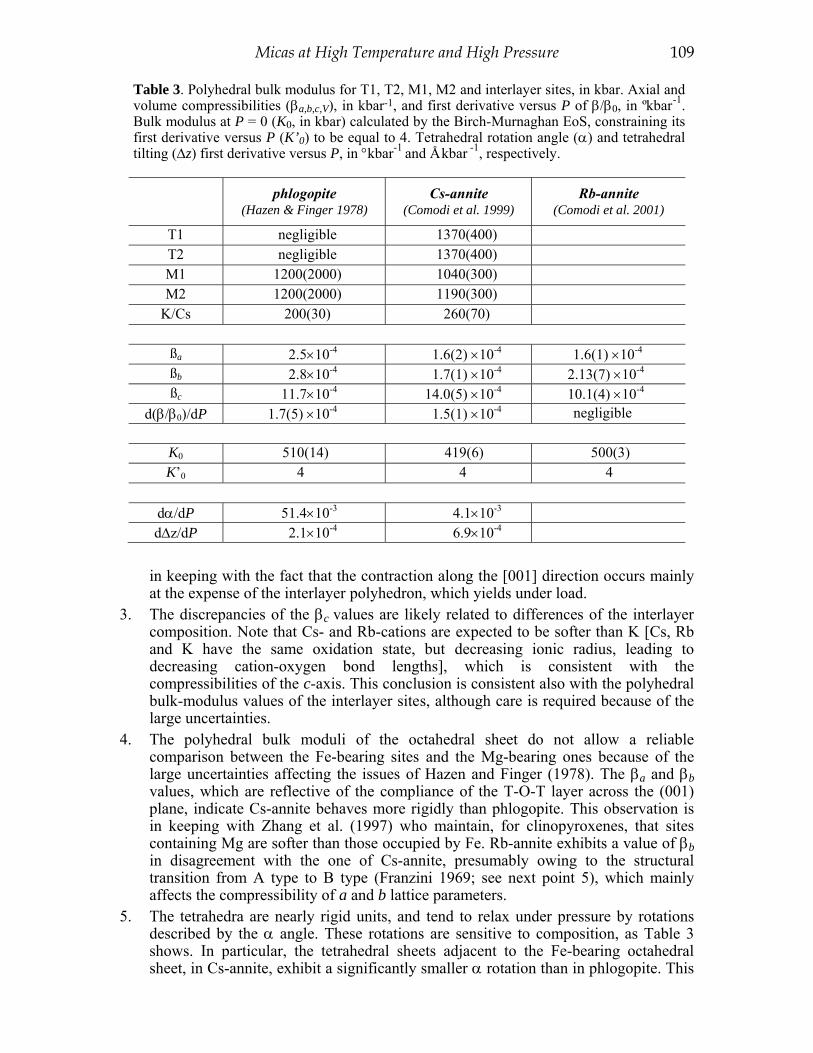
Micas at High Temperature and High Pressure 109
in keeping with the fact that the contraction along the [001] direction occurs mainly at the expense of the interlayer polyhedron, which yields under load.
3. The discrepancies of the βc values are likely related to differences of the interlayer composition. Note that Cs- and Rb-cations are expected to be softer than K [Cs, Rb and K have the same oxidation state, but decreasing ionic radius, leading to decreasing cation-oxygen bond lengths], which is consistent with the compressibilities of the c-axis. This conclusion is consistent also with the polyhedral bulk-modulus values of the interlayer sites, although care is required because of the large uncertainties.
4. The polyhedral bulk moduli of the octahedral sheet do not allow a reliable comparison between the Fe-bearing sites and the Mg-bearing ones because of the large uncertainties affecting the issues of Hazen and Finger (1978). The βa and βb values, which are reflective of the compliance of the T-O-T layer across the (001) plane, indicate Cs-annite behaves more rigidly than phlogopite. This observation is in keeping with Zhang et al. (1997) who maintain, for clinopyroxenes, that sites containing Mg are softer than those occupied by Fe. Rb-annite exhibits a value of βb in disagreement with the one of Cs-annite, presumably owing to the structural transition from A type to B type (Franzini 1969; see next point 5), which mainly affects the compressibility of a and b lattice parameters.
5. The tetrahedra are nearly rigid units, and tend to relax under pressure by rotations described by the α angle. These rotations are sensitive to composition, as Table 3 shows. In particular, the tetrahedral sheets adjacent to the Fe-bearing octahedral sheet, in Cs-annite, exhibit a significantly smaller α rotation than in phlogopite. This
Table 3. Polyhedral bulk modulus for T1, T2, M1, M2 and interlayer sites, in kbar. Axial and volume compressibilities (βa,b,c,V), in kbar-1, and first derivative versus P of β/β0, in ºkbar-1. Bulk modulus at P = 0 (K0, in kbar) calculated by the Birch-Murnaghan EoS, constraining its first derivative versus P (K’0) to be equal to 4. Tetrahedral rotation angle (α) and tetrahedral tilting (Δz) first derivative versus P, in °kbar-1 and Å kbar -1, respectively.
phlogopite (Hazen & Finger 1978)
Cs-annite (Comodi et al. 1999)
Rb-annite (Comodi et al. 2001)
T1 negligible 1370(400) T2 negligible 1370(400) M1 1200(2000) 1040(300) M2 1200(2000) 1190(300)
K/Cs 200(30) 260(70)
ßa 2.5×10⁻⁴ 1.6(2) ×10-4 1.6(1) ×10-4 ßb 2.8×10⁻⁴ 1.7(1) ×10-4 2.13(7) ×10-4 ßc 11.7×10⁻⁴ 14.0(5) ×10-4 10.1(4) ×10-4
d(β/β0)/dP 1.7(5) ×10-4 1.5(1) ×10-4 negligible
K0 510(14) 419(6) 500(3) K’0 4 4 4
dα/dP 51.4×10⁻³ 4.1×10⁻³ dΔz/dP 2.1×10⁻⁴ 6.9×10⁻⁴

110 Zanazzi & Pavese
is consistent with point (4): the rigidity of the Fe-rich octahedral sheet seriously limits the rotational degree of freedom of the tetrahedral sheet to comply with pressure. The α value and the tetrahedral sheet corrugation (Δz) increase upon increasing pressure, regardless of the composition; such an observation suggests that the tetrahedral rotation and the corrugation of the basal oxygen atom plane are a very general way of relaxation of the tetrahedral sheet in micas. The structural evolution of Rb-annite with pressure (Comodi et al. 2001) shows a peculiar behavior of the tetrahedral rotation angle α: although it increases with pressure as well as in other micas, it assumes positive values at pressures lower than about 45 kbar and negative values at higher pressure, indicating a phase transition from a type A to a type B structure (Franzini 1969).
6. The differences on the bulk-modulus values must be assessed with care, because of the small number of points obtained by Hazen and Finger (1978) in deriving K0 for phlogopite. Taking into account the large uncertainties on the data, the difference in K0 reflects the greater softness of Cs/Rb-annites than phlogopite because of the replacement of K with Cs/Rb in the interlayer. In particular, note that the larger K0 of Rb-annite than that of Cs-annite is consistent with predictions based on the ionic radii, as discussed in point (3) above.
7. The obliquity of the monoclinic cells of trioctahedral micas increases upon pressure. High-temperature studies. In this section we discuss in situ high-temperature
investigations, and studies with heat-treated samples to induce oxidation and dehydration/ dehydroxylation processes.
Takeda and Morosin (1975) compared the behavior at high temperature of a synthetic fluorphlogopite with predictions relying upon the geometrical approach of Donnay et al. (1964). Hogg and Meads (1975) investigated by Mössb auer spectroscopy the thermal decomposition of biotites, owing to Fe2+ → Fe3+ oxidation accompanied by dehydroxylation on specimens previously heated. Tripathi et al. (1978) studied the effects of high-temperature reactions in biotite and phlogopite by Mössbauer spectroscopy. Rancourt et al. (1993) reported the first kinetic study of iron oxidation in biotite by Mössbauer spectroscopy. They also suggested a simple activation model accounting for iron oxidation and ordinary dehydroxylation, based on the following reactions: OH- → O2- + H+, i.e., local dissociation of OH-groups either by Fe2+ + H+ → Fe3+ + H, i.e., Fe-oxidation, or by O2- + 2 H+ → H2O, i.e., dehydroxylation. Twenty-four years after the Takeda and Morosin’s investigation, Russell and Guggenheim (1999), and Comodi et al. (1999) discussed the high-temperature behavior of a near end-member phlogopite and of a “Cs-annite,” respectively. These investigations consider structural aspects observed in situ and Fe-oxidation mechanisms in heat-treated specimens. The latter topic is discussed in the light of bond-length changes and cell volume versus heating-time curves. Tutti et al. (2000) studied the thermal expansion of a natural phlogopite from Pargas (Finland) and monitored by TGA and DTG the Fe-oxidation and dehydroxylation processes triggered by temperature. They observed that the curves of a, b and c as a function of temperature are split by a discontinuity slightly above 400°C into two regions exhibiting quite different thermal expansion coefficients. Such a behavior upon heating is presumably related to the different mechanisms governing the structural rearrangements of phlogopite below and above the oxidation temperature of Fe, which takes place about 500-600°C. Note that the discontinuity observed by Tutti et al. (2000) is consistent with that reported by Takeda and Morosin (1975) for F-phlogopite. It is worthy of interest to analyse how the structure of trioctahedral micas responds to heating, to achieve a full understanding of the mechanisms driving the high-temperature processes in these

Micas at High Temperature and High Pressure 111
Table 4. Axial thermal expansion coefficients (αa,b,c,V), in ºC-1, and first derivative of β/β0 angle of the monoclinic cell versus T, in ºC-1. Tetrahedral rotation angle (α) and octahedral flatness angle (Ψ) first derivatives versus T, in degºC-1. The results from Tutti et al. (2000) are reported on two rows: the upper and the lower refer to thermal expansion coefficients below and above 412°C, respectively.
F-phlogopite (Takeda and
Morosin 1975)
phlogopite(Russell and Gug-
genheim 1999)
phlogopite(Tutti et al. 2000)
Cs-annite(Comodi et al.
1999)
αa 0.89×10⁻⁵ 1.40×10⁻⁵ 3.74×10⁻⁵ 0.86×10⁻⁵
negligible
αb 0.77×10⁻⁵ 1.34×10⁻⁵ 1.09×10⁻⁵ 0.80×10⁻⁵
negligible
αc 1.8×10⁻⁵ 1.81×10⁻⁵ 1.19×10⁻⁵ 1.93×10⁻⁵
3.12×10⁻⁵
d(β/β0)/dT -1.3 -1.5 -0.36
dα/dT -5.6×10⁻³ -7.9×10⁻³ -1.0×10⁻³ dΨ/dT -0.7×10⁻³ -0.3×10⁻³ -0.7×10⁻³
minerals. In Table 4, we report some of the parameters required to understand structural adjustments occurring as a function of temperature: 1. All trioctahedral micas (Table 4) expand mainly along the [001] direction, although at
quite different rates according to the compositions of the octahedral sheet and, principally, of the interlayer sites. For Cs-annite, the Fe(O,OH)6 octahedra are moderately sensitive to heating, so that the thermal expansion coefficients along the [100] and [010] directions are negligible and the volume expansion occurs entirely along the [001] direction. The “soft” Cs-cation in the interlayer site causes βc in Cs-annite to be nearly twice as large as the corresponding value in phlogopite. This conclusion is consistent with the linear thermal expansion coefficients of the interlayer at approximately 6.3 × 10⁻⁵ and 3.7 × 10⁻⁵ per °C for Cs-annite and phlogopite, respectively. In Figure 3, the relative change of the c cell dimension for Cs-annite and phogopite is reported as a function of T.
2. The octahedral flatness angle, ψ, decreases upon heating for both Mg- and Fe-bearing trioctahedral micas, which reduces the diagonal elongation versus the sheet thickness. Note that the dψ/dT values are not simply related to the cation occupancy of the M-sites. For example Mg(O,OH)6 shows remarkable differences in phlogopite or in F-rich phlogopite.
3. The tetrahedral rotation angle as a function of T exhibits a negative slope, and changes at different rates in Mg- or Fe-bearing trioctahedral micas. In particular, the rotation angle changes slightly in the latter, and this result is related to the inertness of the Fe(O,OH)6 or Fe(O,F)6 octahedra and implies a modest rearrangement in the T-sheet.
4. The obliquity of the cell decreases on heating, indicating a tendency to approach a 90° β angle. In brief, from the discussion above, trioctahedral micas, under thermal or baric
conditions, respond as follows: 1. structural changes occur mainly along the [001] direction, at the expense of the
interlayer site, owing to the weaker interactions. The axial thermal expansion or compressibility coefficients reflect this aspect.

112 Zanazzi & Pavese
2. the adjustment of the T-O-T layer is accomplished by volumetric changes of the
octahedra by either expansion or compression, and by rotations and corrugations of the tetrahedral sheets. The tetrahedra behave as quasi-rigid bodies, to achieve matching lateral dimensions between tetrahedral and octahedral sheets.
3. the obliquity of the unit cell increases under pressure, and decreases upon heating. The behavior of micas as a function of P and/or T is therefore strictly dependent on
the stacking structural features of these minerals. Thus, trioctahedral and dioctahedral micas show similar responses to thermobaric stress. Most of the compression/expansion occurs along c*, at the expense of the interlayer polyhedra. The changes occurring across the (0 0 1) plane are out-of-plane tilting and in-plane rotation of the tetrahedra of the tetrahedral sheets, to minimize the misfit between the tetrahedral and octahedral sheets,
Figure 3. (c-c0)/c
0 ratio as a function of
temperature, for Cs-annite (Comodi et al. 1999) and phlogopite (Russell and Guggenheim 1999). c0 is the value of c at ambient conditions.
Figure 4. (a) <T-O> (filled squares) and <M-O> (M1 and M2, filled and empty diamonds respectively) bond lengths versus pressure, normalized to their values at room conditions. pg: paragonite. Data from Comodi and Zanazzi (1997). Subscripts HP and RP stand for high pressure and room pressure, respectively. (b) <T-O> (T1 and T2, filled and empty circles, respectively) and <M-O> (M1 and M2, filled and empty diamonds, respectively) bond lengths versus temperature, normalized to their values at room conditions. pg: paragonite. Data from Comodi and Zanazzi (2000). Subscripts RT and HT stand for room temperature and high temperature, respectively.

Micas at High Temperature and High Pressure 113
the latter accounting for the most significant bond-length variations in the 2:1 layer. As an example, in Figures 4a and 4b the average T-O and M-O bond lengths in paragonite are plotted as a function of pressure and temperature, respectively, to illustrate the sensitivity of the tetrahedra and octahedra to thermobaric stress. The results are consistent with the general rule that temperature promotes regularity whereas pressure favors distortion in structures: Figures 5a and 5b show the difference between the average of the interlayer cation-oxygeninner and cation-oxygenouter bond lengths in paragonite and muscovite, normalized to ambient conditions, versus P and T, respectively. Note that pressure tends to increase the twelve-fold site strain, whereas temperature shows the reverse trend, where atoms produce a more regular arrangement. Note also the remarkable dependence of the thermoelastic parameters on the chemical composition, apparent in the case of the interlayer cation replacement. Figure 6 shows the bulk modulus plotted as a function of the interlayer cation size. The figure is computed as an average of the interlayer chemical composition, assuming a twelve-fold coordination. A shift of approximately 0.5 Å in ionic radius corresponds to more than 100-kbar decrease in K0.
Figure 5. (a). |<K-O>inner-<K-O>outer| versus pressure, normalized to their values at room conditions. pg (filled circles): paragonite (Comodi and Zanazzi 1997); ms (empty circles): muscovite (Comodi and Zanazzi 1995). Subscripts i and o stand for inner and outer; HP and RP for high pressure and room pressure, respectively. (b)|<K-O>inner-<K-O>outer| versus temperature, normalized to their values at room conditions. pg (open circles): paragonite (Comodi and Zanazzi 2000); ms (filled circles): muscovite (Guggenheim et al. 1987). Subscripts i and o stand for inner and outer; HT and RT for high temperature and room temperature, respectively.
The modest number of experimental studies on the behavior of micas as a function of pressure and/or temperature and the difficulty in the experiments that leads to lack of precision, make a statistically reliable comparison between trioctahedral and dioctahedral micas difficult. The main differences between the two originate from the octahedral sheet behavior. Differences between the two forms would be expected between the rearrangements of the 2:1 layers upon P and/or T.
Based on the current data, and assuming a K-bearing interlayer sheet, the following conclusions can be drawn: 1. Dioctahedral micas are less thermally stable, and have larger bulk thermal expansion
than trioctahedral micas, presumably as a consequence of the vacant M1 site.

114 Zanazzi & Pavese
2. Dioctahedral micas have a slightly larger bulk modulus than trioctahedral micas (i.e. are slightly stiffer), because of the presence of trivalent cations instead of divalent cations in octahedral coordination. This produces a larger polyhedral bulk modulus (Hazen and Finger 1982).
ACKNOWLEDGMENTS We are grateful to Steve Guggenheim for reviewing this chapter and for his
comments on the manuscript.
REFERENCES Abbott RN (1994) Energy calculations bearing on the dehydroxylation of muscovite. Can Mineral 32:87-92 Ahrens TJ (1987) Shock wave techniques for geophysics and planetary physics. In: CG Sammis, TL
Henyey (eds) Methods of experimental physics. p 185-235. Academic Press, San Diego, CA Ahsbahs H (1987) X-ray diffraction on single crystals at high pressure. Prog Crystal Growth and Charact
14:263-302 Aleksandrov KS, Ryzhova TV (1961) Elastic properties of rock-forming minerals, II. Layered silicates. Izv
Acad Sci USSR, Phys Solid Earth, Engl Transl 1165-1168 Amisano Canesi A. (1995) Studio cristallografico di minerali di altissima pressione del complesso
Brossasco-Isasca (Dora Maira Meridionale): PhD dissertation, University of Torino Amisano Canesi A, Ivaldi G, Chiari G, Ferraris G (1994) Crystal structure of phengite-3T: thermal
dependence and stability at high P/T. Abstracts 16th General Meeting IMA, Abstr, 10 Anderson OL (1995) Equations of state for geophysics and ceramic sciences. Oxford University Press,
Oxford, UK Anderson OL and Isaak DG (1995) Elastic constants of mantle minerals at high temperature. In Mineral
Physics and Crystallography: A Handbook of Physical Constants. Ahrens TJ (ed) AGU Reference Shelf 2
Angel RJ (2001) Equations of state. Rev Mineral Geochem 41:35-59 Angel RJ, Downs RT, Finger LW (2001) Diffractometry. Rev Mineral Geochem 41:556-559 Barnett JD, Block S and Piermarini GJ (1973) An optical fluorescence system for quantitative pressure
measurement in the diamond-anvil cell. Rev Sci Instrum 44:1-9 Birch F (1986) Equation of state and thermodynamic parameters of NaCl to 300 kbar in the high-
temperature domain. J Geophys Res 83:1257-1268 Bridgman PW (1949) Linear compressions to 30,000 kg/cm2, including relatively incompressible
substances. Proc Am Acad Arts Sci 77:189-234
Figure 6. Bulk modulus as a function of interlayer cation size, calculated using the interlayer chemical composition. Na(Pg): paragonite (Comodi and Zanazzi 1997); Na(mu): Na-rich muscovite (Comodi and Zanazzi 1995); K(phl): phlogopite (Hazen and Finger 1978); K(mu): K-muscovite (Comodi and Zanazzi 1995); Cs(Cs-tfa): Cs-tetra-ferri-annite (Comodi et al. 1999); Rb(Rb-tfa): Rb-tetra-ferri-annite (Comodi et al. 2001).

Micas at High Temperature and High Pressure 115
Catti M, Ferraris G, Ivaldi G (1989) Thermal strain analysis in the crystal structure of muscovite at 700°C. Eur J Mineral 1:625-632
Catti M, Ferraris G, Hull S, Pavese A (1994): Powder neutron diffraction study of 2M1 muscovite at room pressure and at 2 GPa. Eur J Mineral 6:171-178
Chung DDL, De Haven PW, Arnold H, Ghosh D (1993). X-ray diffraction at elevated temperatures, VCH Ed., New York
Comodi P, Zanazzi PF (1995) High-pressure structural study of muscovite. Phys Chem Minerals 22:170-177
Comodi P, Zanazzi PF (1997) Pressure dependence of structural parameters of paragonite. Phys Chem Minerals 24:274-280
Comodi P, Zanazzi PF (2000) Structural thermal behavior of paragonite and its dehydroxylate: A high-temperature single-crystal study. Phys Chem Minerals 27:377-385
Comodi P, Zanazzi PF, Weiss Z, Rieder M, Drábek M (1999) Cs-tetra-ferri-annite: High-pressure and high-temperature behavior of a potential nuclear waste disposal phase. Am Mineral 84:325-332
Comodi P, Drábek M, Montagnoli M, Rieder M, Weiss Z, Zanazzi PF (2001) Pressure-induced phase transition in a new synthetic Rb-mica. FIST-Geoitalia 2001, Chieti, Sept. 5-8 2001
Donnay G, Donnay JDH, Takeda H (1964) Trioctahedral one-layer micas. II. Prediction of the structure from composition and cell dimensions. Acta Crystallogr 17:1374-1381
Duffy TS, Wang Y (1998) Pressure-volume-temperature equations of state. Rev Mineral xx 425-457 Faust J, Knittle E (1994) The equation of state, amorphization, and high-pressure phase diagram of
muscovite. J Geophys Res 99:19785-19792 Flux S, Chatterjee ND, Langer K (1984) Pressure induced [4](Al,Si)-ordering in dioctahedral micas?
Contrib Mineral Petrol 85:294-297 Franzini M (1969) The A and B layers and the crystal structure of sheet silicates. Contrib Mineral Petrol
21:203-224 Guidotti CV (1984) Micas in metamorphic rocks. Rev Mineral 13:357-467 Guggenheim S, Chang YH, Koster van Groos AF (1987) Muscovite dehydroxylation: High-temperature
studies. Am Mineral 72:537-550 Güven N (1971) The crystal structures of 2M 1 phengite and 2M1 muscovite. Z Kristallogr 134:196-212 Hazen RM and Finger LW (1978) The crystal structures and compressibilities of layer minerals at high
pressure. II. Phlogopite and chlorite. Am Mineral 63:293-296 Hazen RM and Finger LW (1982) Comparative Crystal Chemistry. John Wiley and Sons, New York. Hewitt DA, Wones DR (1984) Experimental phase relations of the micas. Rev Mineral 13:357-467 Hogg CS, Meads RE (1975) A Mössbauer study of th ermal decomposition of biotites. Mineral Mag 40:79-
88 Holzapfel WB (1996) Physics of solids under strong compression. Reports Progress Phys 59:29-90 Jackson I and Rigden SM (1996) Analysis of P-V-T data—Constraints on the thermoelastic properties of
high pressure minerals. Phys Earth Planet Int 96:85-112 Jeanloz R (1988) Universal equation of state. Phys Rev B 38:805-807 Kumar M (1995) High pressure equation of state for solids. Physica B 212:391-394 Kumar M and Bedi SS (1996) A comparative study of Birch and Kumar equations of state under high
pressure. Phys Stat Sol B 196:303-307 Mazzucato E, Artioli G, Gualtieri A (1999) High temperature dehydroxylation of muscovite-2M1: a kinetic
study by in situ XRPD. Phys Chem Minerals 26:375-381 Mookherjee M, Redfern SAT, Hewat A (2000) Structural response of phengite 2M1 to temperature: an in
situ neutron diffraction study. EMPG VIII, Bergamo, April 16-19, Abstracts, p 75 Moriarty JA (1995) First-principles equations of state for Al, Cu, Mo and Pb to ultrahigh pressures. High
Press Res 13:343-365 Muller F, Drits VA, Plançon A, Besson G (2000a) Dehydroxylation of Fe3+, Mg-rich dioctahedral micas:
(I) structural transformation. Clay Minerals 35:491-504 Muller F, Drits VA, Tsipursky SI, Plançon A (2000b) Dehydroxylation of Fe3+, Mg-rich dioctahedral
micas: (II) cation migration. Clay Mineral 35:505-514 Pavese A, Ferraris G, Prencipe M, Ibberson R (1997) Cation site ordering in phengite-3T from the Dora-
Maira massif (western Alps): a variable-temperature neutron powder diffraction study. Eur J Mineral 9:1183-1190
Pavese A, Ferraris G, Pischedda V, Ibberson R (1999a) Tetrahedral order in phengite-2M1 upon heating, from powder neutron diffraction, and thermodynamic consequences. Eur J Mineral 11:309-320
Pavese A, Ferraris G, Pischedda V, Mezouar M (1999b) Synchrotron powder diffraction study of phengite 3T from the Dora-Maira massif: P-V-T equation of state and petrological consequences. Phys Chem Minerals 26:460-467

116 Zanazzi & Pavese
Pavese A, Ferraris G, Pischedda V, Radaelli P (2000) Further powder neutron diffraction on phengite-3T: cation ordering and methodological thoughts. Mineral Mag 64:11-18
Pavese A, Ferraris G, Pischedda V, Fauth F (2001) M1-site occupancy in 3T and 2M1 phengites by low temperature neutron powder diffraction: Reality or artefact? Eur J Mineral (in press)
Poirier JP, Tarantola A (1998) A logarithmic equation of state. Phys Earth Planet Int 109:1-8 Rancourt DG, Tume P, Lalonde AE (1993) Kinetics of the (Fe2++ OH-)mica→ (Fe3++O2-)mica + H
oxidation reaction in bulk single-crystal biotite studied by Mössbauer spectroscopy. Phys Chem Minerals 20:276-284
Russell RL, Guggenheim S (1999) Crystal structures of near-end-member phlogopite at high temperature and heat treated Fe-rich phlogopite: the influence of the O,OH,F site. Can Mineral 37:711-720
Sassi F P, Guidotti C, Rieder M, De Pieri R (1994) On the occurrence of metamorphic 2M1 phengites: some thoughts on polytypism and crystallization conditions of 3T phengites. Eur J Mineral 6:151-160
Saxena SK, Zhang J (1990) Thermochemical and pressure-volume-temperature systematics of data on solids, examples: tungsten and MgO. Phys Chem Minerals 17:45-51
Sekine T, Rubin AM, Ahrens TJ (1991) Shock wave equation of state of muscovite. J Geophys Res 96:19675-19680
Shinmei T, Tomioka N, Fujino K, Kuroda K, Irifune T (1999) In situ X-ray diffraction study of enstatite up to 12 GPa and 1473 K and equation of state. Am Mineral 84:1588-1594
Smyth JR, Jacobsen SD, Swope RJ, Angel RJ, Arlt T, Domanik K, Holloway JR (2000) Crystal structures and compressibilities of synthetic 2M1 and 3T phengite micas. Eur J Mineral 12:955-963
Symmes GH (1986) The thermal expansion of natural muscovite, paragonite, margarite, pyrophyllite, phlogopite, and two chlorites: The significance of high T/P volume studies on calculated phase equilibria. B.A. Thesis, Amherst College, Amherst, Massachusetts
Takeda H and Morosin B (1975) Comparison of observed and predicted structural parameters of mica at high temperature. Acta Crystallogr B31:2444-2452
Tripathi RP, Chandra U, Chandra R, Lokanathan S (1978) A Mössbauer study of the effects of heating biotite, phlogopite and vermiculite. J Inorg Nucl Chem 40:1293-1298
Tutti F, Dubrovinsky LS, Nygren M (2000) High-temperature study and thermal expansion of phlogopite. Phys Chem Minerals 27:599-603
Udagawa S, Urabe K, Hasu H (1974) The crystal structure of muscovite dehydroxylate. Japan Assoc Mineral Petrol Econ Geol 69:381-389
Utsumi W, Weidner DJ, Liebermann RC (1998) Volume measurements of MgO at high pressure and temperature. In MH Manghnani, Y Yagi (eds) Properties of Earth and Planetary Materials at High Pressure and Temperature, p 327-334, Am Geophys Union, Washington, DC
Vaughan MT, Guggenheim S (1986) Elasticity of muscovite and its relationship to crystal structure. J Geophys Res 91:4657-4664
Velde B (1980) Cell dimension, polymorph type, and infrared spectra of synthetic white micas: the importance of ordering. Am Mineral 65:1277-1282
Vinet P, Ferrante J, Smith JR, Rose JH (1986) A universal equation of state for solids. J Phys C 19:L467-L473
Vinet P, Smyth JR, Ferrante J, Rose JH (1987) Temperature effects on the universal equation of state of solids. Phys Rev B 35:1945-1953
Vinet P, Rose JH, Ferrante J, Smyth JR (1989) Universal features of the equation of state of solids. J Phys Cond Mater 1:941-1963
Wallace DC (1972) Thermodynamics of Crystals. John Wiley and Sons, New York. Zhang L, Ahsbahs H, Hafner S, Kutoglu A (1997) Single-crystal compression study and crystal structure of
clinopyroxenes up to 10 GPa. Am Mineral 82:245-258 Zanazzi PF (1996) X-ray diffraction experiments in (moderate) high-P / high-T conditions; high-P and
high-T crystal chemistry. High Pressure and High Temperature Research on Lithosphere and Mantle Materials. Proc Int’l School Earth Planetary Sci, Siena, December 3-9, 1995, p 107-120

1529-6466/02/0046-0003$05.00 DOI:10.2138/rmg.2002.46.03
3 Structural Features of Micas
Giovanni Ferraris1 and Gabriella Ivaldi2 1,2Dipartimento di Scienze Mineralogiche e Petrologiche
Università di Torino 10125 Torino, Italy
and 1Istituto di Geoscienze e Georisorse Consiglio Nazionale delle Ricerche
10125 Torino, Italy [email protected] [email protected]
INTRODUCTION The large number of mica species (end-members) and varieties is based on chemical
variability and peculiar structural features like polytypism, local and global symmetry. In addition, mainly because of an inherent misfit between the constituent tetrahedral and octahedral sheets, in the specific mica structures several structural parameters undergo adjustments relative to their ideal values. Consequently, the mechanisms ruling distor-tions from ideal models must be considered when investigating a mica behavior under geological conditions.
Micas are important rock-forming minerals and petrographers consider them mainly for their chemical aspects. The importance of the chemical composition is well known to all researchers dealing with minerals. To give emphasis to the chemical composition, the official classification of the micas (Rieder et al. 1998; Rieder 2001) allows exceptions (note the introduction of ‘species that are not end member’ in Rieder et al. 1998) to the rules which are normally used to define mineral species (Nickel and Grice 1998). However, as shown throughout this book, the role of structure features (including some aspects of polytypism) in determining fields of stability of micas and, therefore, in providing geological insights, is increasingly recognized as crucial. Thus, it seems justified that a chapter dedicated to the description of the general structural background of micas should be presented independently from specific cases, which are discussed in other chapters.
This chapter is an introduction to the symmetry and geometric aspects of micas. Nevertheless, some less conventional topics not covered in other chapters are reported in appendices. Appendix I concerns the wide presence of mica-like modules in the growing group of natural, layer titanosilicates (Khomyakov 1995; Ferraris et al. 2001b,d) and other more or less exotic structures belonging to the expanding field of modular crystallography (Merlino 1997). Important results have been obtained by the oblique-texture electron diffraction method (OTED; cf. Zvyagin et al. 1996, and references therein). Only a few, limited treatments are in English. Thus, this method is discussed in Appendix II.
NOMENCLATURE AND NOTATION Bailey (1984c) recommended a notation system for structural sites in micas.
However, there is no agreement to the labeling of these sites; e.g., either an italic or roman font is used with or without parentheses to separate the alphanumeric parts. Following recent papers (Nespolo et al. 1999c: Nespolo 2001) and in agreement with the chapter of Nespolo and Durovic (this volume), the nomenclature of the OD theory of polytypes (Dornberger-Schiff et al. 1982; Durovic 1994) is here adopted to label sites,
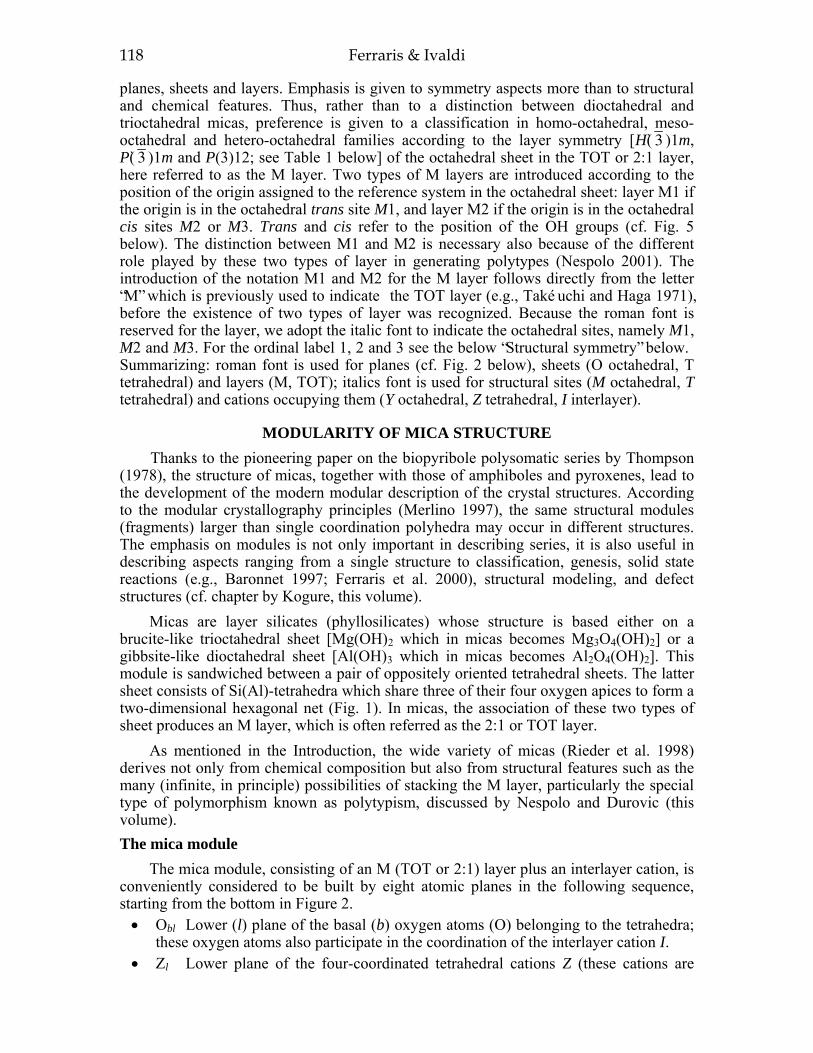
118 Ferraris & Ivaldi
planes, sheets and layers. Emphasis is given to symmetry aspects more than to structural and chemical features. Thus, rather than to a distinction between dioctahedral and trioctahedral micas, preference is given to a classification in homo-octahedral, meso-octahedral and hetero-octahedral families according to the layer symmetry [H(̀ 3 )1m, P(̀ 3 )1m and P(3)12; see Table 1 below] of the octahedral sheet in the TOT or 2:1 layer, here referred to as the M layer. Two types of M layers are introduced according to the position of the origin assigned to the reference system in the octahedral sheet: layer M1 if the origin is in the octahedral trans site M1, and layer M2 if the origin is in the octahedral cis sites M2 or M3. Trans and cis refer to the position of the OH groups (cf. Fig. 5 below). The distinction between M1 and M2 is necessary also because of the different role played by these two types of layer in generating polytypes (Nespolo 2001). The introduction of the notation M1 and M2 for the M layer follows directly from the letter “M” which is previously used to indicate the TOT layer (e.g., Takéuchi and Haga 1971), before the existence of two types of layer was recognized. Because the roman font is reserved for the layer, we adopt the italic font to indicate the octahedral sites, namely M1, M2 and M3. For the ordinal label 1, 2 and 3 see the below “Structural symmetry” below. Summarizing: roman font is used for planes (cf. Fig. 2 below), sheets (O octahedral, T tetrahedral) and layers (M, TOT); italics font is used for structural sites (M octahedral, T tetrahedral) and cations occupying them (Y octahedral, Z tetrahedral, I interlayer).
MODULARITY OF MICA STRUCTURE Thanks to the pioneering paper on the biopyribole polysomatic series by Thompson
(1978), the structure of micas, together with those of amphiboles and pyroxenes, lead to the development of the modern modular description of the crystal structures. According to the modular crystallography principles (Merlino 1997), the same structural modules (fragments) larger than single coordination polyhedra may occur in different structures. The emphasis on modules is not only important in describing series, it is also useful in describing aspects ranging from a single structure to classification, genesis, solid state reactions (e.g., Baronnet 1997; Ferraris et al. 2000), structural modeling, and defect structures (cf. chapter by Kogure, this volume).
Micas are layer silicates (phyllosilicates) whose structure is based either on a brucite-like trioctahedral sheet [Mg(OH)2 which in micas becomes Mg3O4(OH)2] or a gibbsite-like dioctahedral sheet [Al(OH)3 which in micas becomes Al2O4(OH)2]. This module is sandwiched between a pair of oppositely oriented tetrahedral sheets. The latter sheet consists of Si(Al)-tetrahedra which share three of their four oxygen apices to form a two-dimensional hexagonal net (Fig. 1). In micas, the association of these two types of sheet produces an M layer, which is often referred as the 2:1 or TOT layer.
As mentioned in the Introduction, the wide variety of micas (Rieder et al. 1998) derives not only from chemical composition but also from structural features such as the many (infinite, in principle) possibilities of stacking the M layer, particularly the special type of polymorphism known as polytypism, discussed by Nespolo and Durovic (this volume). The mica module
The mica module, consisting of an M (TOT or 2:1) layer plus an interlayer cation, is conveniently considered to be built by eight atomic planes in the following sequence, starting from the bottom in Figure 2.
• Obl Lower (l) plane of the basal (b) oxygen atoms (O) belonging to the tetrahedra; these oxygen atoms also participate in the coordination of the interlayer cation I.
• Zl Lower plane of the four-coordinated tetrahedral cations Z (these cations are

Structural Features of Micas 119
often indicated by T, but here this letter is used to indicate a tetrahedral site T and a tetrahedral sheet T).
• Oal Plane of the lower apical (a) oxygen atoms of the tetrahedra; these oxygen atoms are shared between one tetrahedral and one octahedral sheet. The Oal plane contains also hydroxyl (OH)- groups (and their substitutions) which belong only to the octahedral sheet.
• Y Plane of the octahedral cations Y which are often indicated by M (here this letter is used to indicate an octahedral site M and the M layer; the symbol O is used to indicate the sheet containing the M sites).
• Oau Plane of the upper (u) apical oxygen atoms (Oa) of the tetrahedra (cf. Oal). • Zu Upper (u) plane of the tetrahedral cations (cf. Zl). • Obu Upper (u) plane of the basal (b) oxygen atoms (Ob) belonging to the tetrahedra
(cf. Obl). • I Plane of the interlayer cations I (interlayer sites).
Figure 1. Ideal trioctahedral brucite-like (a) and dioctahedral gibbsite-like (b) sheets. Two ideal tetrahedral sheets (c) share their apical oxygen atoms with an octahedral sheet to form an M layer (d) which is also known as 2:1 or TOT layer. Hydroxyl (OH)- groups are represented by black circles.
Planes are combined to form three types of sheets: Ob + Z + Oa form two tetrahedral sheets (Tl and Tu); Oa + Y + Oa form one octahedral (O) sheet. The whole M mica layer corresponds to the Tl-O-Tu (also termed 2:1) sequence; this layer is also called the conventional mica layer and is often designated as the TOT layer. The interlayer cations are located between two successive M layers in the I plane and their coordination is discussed below. The separation between two I planes is about 10 Å.

120 Ferraris & Ivaldi
CLOSEST-PACKING ASPECTS The apical oxygen atoms and the hydroxyl (OH)- groups forming the Oa plane (Fig.
2) are arranged according to a two-dimensional closest-packing of spheres; Oa is also called the hydroxyl plane. In this plane, the packing is however not tight; in fact, the spacing between the oxygen anions is about 3.1 Å compared to 2.6 Å in a typical closest-packing of oxygen atoms (e.g., in olivine or spinel). Between two adjacent hydroxyl planes (Oal and Oau), the octahedral and tetrahedral sites that are typical of a three-dimensional closest-packing of spheres occur (Fig. 3). This type of tetrahedral sites is vacant in micas; the octahedral sites M instead are fully (trioctahedral micas) or partially.
Figure 2. Cross-section perpendicular to the M layer of the mica structure seen along [110]. Sequence and labeling of eight distinct building atomic planes are shown. Hydroxyl (OH)- groups are represented by black circles (see text for explanation of labeling).
Figure 3. Projection of a closest-packing AB sequence along the planes formed by apical oxygen atoms Oa. Positions of the octahedral (M) and tetrahedral (small circles) sites are shown. These tetrahedral sites are not occupied in the octahedral sheets of micas.

Structural Features of Micas 121
Figure 4. Stacking of two closest-packing planes of spheres (plane A dark gray, plane B light gray) consisting of oxygen atoms and (OH)- groups. The primitive hexagonal cell (A1 = A2) and the conventional C-centred orthohexagonal cell [(a, b) in the C1 orientation according to Arnold (1996)] normally used for phyllosilicates are shown. Cells are shown also for a closest-packing of equal spheres [smaller (ah, bh) cells]. Each n-th plane of spheres (e.g. B) is ±a/3 staggered relative to the (n-1)-th plane (A). The interstitial sites between the spheres appear either as open holes or as gray ‘triangles’. Each interstice is surrounded by three packing spheres in its plane; between the two planes A and B tetrahedral and octahedral sites occur (Fig. 3).
(dioctahedral micas) occupied by Y cations. Note (Fig. 4) that in the Oa plane each (OH)- group is surrounded by six oxygen ions which, in turn, are surrounded by three (OH)- groups, and three oxygen atoms.
The distances (∼2.7 Å) between the anio ns within the basal Ob plane are closer to the expected value for a closest-packing of oxygen ions (∼2.6 Å). However, relative to real closest-packing, the Ob plane shows vacancies. In fact, this plane can be formally derived from a closest-packing of spheres by removing one third of the spheres which, otherwise, in a (001) projection would occupy the center of the hexagonal rings (Fig. 1). The same configuration of the Ob plane is obtained by removing the (OH)- groups in Figure 4. The Ob plane shows ideal closest-packing without vacancies if the maximum value (30°) of the ditrigonal rotation occurs (cf. the paragraph “Ditrigonal rotation” and Fig. 8 below).
Closest-packing and polytypism The pseudo-closest-packing feature of the Oa planes is key to the understanding of
widespread polytypism of micas (Bailey 1984a). A plane closest-packing of equal spheres (Fig. 4) is based upon a plane hexagonal Bravais lattice with cell parameter ah which is equal to the diameter of the packed sphere. In the plane, each sphere is in contact with six translationally equivalent spheres and two translationally independent sets of small vacant sites; each of these two sets (open circles and gray ‘triangles’ in Fig. 4) contains three translationally equivalent vacant sites. To maintain a closest-packing arrangement in three dimensions, the stacking of two successive planes of spheres (A and B) implies that the upper plane (e.g., B) is staggered (shifted) in such a way that its spheres overlie one set of vacant sites belonging to the lower plane (A). Owing to the hexagonal symmetry in the plane, six equivalent staggers are possible along six directions separated by 60° (cf. Ferraris 2002).

122 Ferraris & Ivaldi
The possibility of multiple staggering is the basis for different periodicities along c, a structural aspect known as polytypism (Verma and Krishna 1966). In the case of micas (and, generally, of phyllosilicates) there are two types of packing spheres: oxygen ions and (OH)- groups. A larger, orthohexagonal C-centered cell (a,b) must be chosen, as shown in Figure 4, and the typical closest-packing stagger between Oal and Oau corresponds to an ±a/3 shift (intralayer stagger). Note that, in module, the parameter a in micas corresponds to the parameter bh of the orthohexagonal cell in a standard closest-packing plane of equal spheres. The ±a/3 stagger between Oal and Oau reflects in the mutual postion of the Tl and Tu sheets as shown in Figure 5. Particularly in K-micas (Radoslovich 1960) and in dioctahedral micas (Bailey 1975) the intralayer stagger may slightly differ from ±a/3. This effect is related either to the size of the I cation or to the distortion of the vacant M1 site, as defined below.
Figure 5. Reference axes in the M layer plane. Hydroxyl (OH)- groups are represented by black circles. The OH groups are in trans position in M1 and in cis position in M2 and M3. The stagger (offset) ±a/3 between lower and upper T sheets is shown. The T1u and T2u tetrahedra are translationally independent; the same for the M1, M2 and M3 octahedra.
To build the crystal structures of the mica polytypes, the M layer is stacked along c in steps of about 10 Å. Commonly, at least in the homo-octahedral (i.e., all octahedra are equal in content and size; cf. below) approximation, the derivation of the mica polytypes is achieved by considering rotations between adjacent M layers (Smith and Yoder 1956) rather than stacking directions. These rotations are performed around the normal to the layer and leave the layer unchanged if multiples are of 60°. The insertion between two Ob planes of interlayer cations I is possible only if each (ideally) hexagonal ring of the atomic plane Obu, belonging to the nth layer, faces an (ideally) hexagonal ring of the plane Obl belonging to the (n+1)th layer. Because this structural requirement can be achieved by different relative rotations between two adjacent layers, different mica polytypes are possible.
COMPOSITIONAL ASPECTS Ideally, the crystal-chemical formula of micas can be written as I(Y3-x x)[Z4O10]A2

Structural Features of Micas 123
(Rieder et al. 1998). Labels represent the following chemical elements and groups [the commonest elements and groups are shown in bold face and their ionic radii (Å) according to Shannon (1976) are given in parentheses].
• I = Cs, K (1.38), Na (1.02), NH4, Rb, Ba, Ca (1.00), . • Y = Li (0.76), Fe2+ (0.78), Fe3+ (0.645), Mg (0.72), Mn2+, Mn3+, Zn, Al (0.535), Cr, V,
Ti (0.605), Na (unpublished results on the occurrence of an analogue of tainiolite with octahedral Na instead of Li). In the crystal-chemical formula, the coefficient 3-x together with the symbol of vacancy ( ) means that in principle the occupancy of the octahedral sheet (O) can span from 2/3 (x = 1, dioctahedral micas) to all the available sites (x = 0, trioctahedral micas). Actually, not many examples of intermediate di-/trioctahedral micas are known. Some of the examples might leave doubts on their ‘intermediate’ nature because of unsatisfactory chemical (cf. below) and/or structural data. A 2M2 lepidolite with (Li0.35Al0.10 0.55) in M1 (Takeda et al. 1971) and a Li-Be-rich mica bityite with (Li0.55 0.45) in M1 (Lin and Guggenheim 1983) should be true octahedrally intermediate micas. Cases as the M1-deficient Li-rich micas refined by Brigatti et al. (2000), where the maximum vacancy in M1 is 0.23, look more like octahedrally-deficient trioctahedral micas than intermediate di-/trioctahedral micas. On chemical basis only, a Si-rich mica with slightly less than two Y cations has recently been reported (Burchard 2000).
• Z = Be, Al (0.39), B, Fe3+ (0.49), Si (0.26), Ti (?) (no vacancies have been reported). • A = Cl, F, OH, O, S (no vacancies have been reported).
It should be noted that: 1. The same site may be occupied (either in an ordered or a disordered way) by different
ions. 2. At least two elements (Al and Fe3+) may occupy both octahedral and tetrahedral sites;
as mentioned above, Na is reported also in octahedral coordination. 3. The same element (e.g., Fe) may be present in different oxidation states. 4. Most of the recent chemical data are obtained by electron microprobe analysis;
consequently, they are often incomplete because oxidation state, light elements and water (hydrogen) are not analyzed [cf. Dyar (this volume) and Pavese et al. (2002) for a recent case of synergic use of neutron-diffraction data and Mössabauer spectroscopy].
Features 1-4 imply that the crystal-chemical formula of a mica cannot be established on the basis of a chemical analysis only (even if it is complete); detailed structural knowl-edge is necessary. Structurally, the occupancy of a site can be obtained by combining chemical constraints (chemical analysis) with other information like the following.
Scattering power of a site (Sp ). If a site is fully occupied by two elements with scattering power S1 and S2 and occupancy x and 1-x, respectively, the distribution of the elements can be obtained by solving the equation Sp = xS1 + (1-x)S2. This procedure cannot be applied without further information when (1) vacancy and/or more than two elements occur in the same site; (2) the difference in the scattering power is small as, with X-ray diffraction, in the common cases of substituting elements differing by only one electron (Na-Mg, Mg-Al, Al-Si, Mn-Fe). If suitable wavelengths are available (e.g., synchrotron radiation) anomalous scattering may be used to recognize different atoms that randomly occupy the same site. For case (2), neutron-diffraction data would represent the best solution; but, for powder-diffraction data, cf. a discussion in Pavese et al. (2000). Note that the occurrence of stacking faults in the structure may create peculiar problem in the refinement procedure (Nespolo and Ferraris 2001).

124 Ferraris & Ivaldi
Distributions of the bond lengths . Good quality structural data allow the use of the average bond length of a coordination polyhedron to determine quantitatively the fraction of occupying atoms. In micas, a reasonable determination of the tetrahedral Si (xSi) and Al (xAl) fractional contents as a function of the average tetrahedral bond lengths (Z-O)av can be obtained by the equation (Z-O)av = 0.163[xAl /( xSi + xAl )] + 1.608 (Hazen and Burnham 1973; cf. Brigatti and Guggenheim (this volume) for an equation which also takes into account tetrahedral Fe).
SYMMETRY ASPECTS Metric (lattice) symmetry
Because of the pseudo-closest-packing nature of the atomic planes mentioned above, the two-dimensional Bravais lattice of both the T and the O sheets (Fig. 1), idealized and undeformed according to the Pauling (1930) structural model of micas, is hexagonal 6mm. Both sheets can be described in terms of a primitive hexagonal lattice, defined by two hexagonal axes A1 and A2, or of a C-centered orthohexagonal lattice defined by the two shortest perpendicular translation vectors, a and b, between which the ortho-hexagonal relation b = a√3 ideally holds (Fig. 5; Nespolo et al. 1997a, 1998).
The two-dimensional lattice of the real sheets, as well as of the whole M layer they form, is no longer hexagonal. The A1 and A2 axes are no longer exactly identical in length and their interaxial angle is no longer exactly 120°: they define a lattice that is only pseudo-hexagonal and corresponds to a centered rectangular lattice whose a and b axes only approximately obey the orthohexagonal relation b = a√3. Structural symmetry
The T sheet. In an ideal T sheet (Fig. 1), the tetrahedra are regular polyhedra and their centers (Z cations) coincide with the nodes of a hexagonal plane lattice; the corresponding point group symmetry is 6mm. The layer symmetry (λ-symmetry) of this sheet is P(6)mm; the symmetry of the direction without periodicity, which is perpendicular to the layer, is shown in parentheses according to the layer group notation (Dornbenger-Schiff 1959). In each T sheet there are two translationally independent tetrahedral sites (Fig. 5). On the whole there are four T sites in the M layer: T1u, T2u, T1l and T2l (u = upper; l = lower). Following Bailey (1984), tetrahedral sites in the upper sheet that, in the (001) projection, are at -1/3[010], +1/3[310] and –1/3[⎯310] from the upper OH group are labeled T1, whereas those at +1/3[010], -1/3[310] and +1/3[⎯310] are labeled T2. The same definition applies to the lower T sites with respect to the lower OH group.
The O sheet . In the O sheet (Fig. 5) the number of translationally independent M sites is three: one site (M1) has two (OH)- groups in trans configuration, whereas the other two sites (M2 and M3) have two (OH)- groups in cis configuration. The definition of M2 and M3 is however not straightforward. Bailey (1984c) suggested labeling M3 the site on the left of the (pseudo)-mirror plane, but most authors have labeled that site as M2. Here we retain the definition prevailing in the literature, calling M2 (M3) the site with negative (positive) y coordinate in the layer-fixed reference, namely on the left (right) of the (pseudo)mirror plane looking down the positive direction of the c axis.
Families of micas accordin g to the symmetry of the O sheet . The type of occupancy (number of electrons in the site, if the exact cation composition of the site is unknown) of the three M octahedral sites defines the three following families of micas as introduced by OD theory (Dornberger-Schiff et al. 1982; Durovic 1994). The λ-symmetry of the O sheet is different in the three families (Table 1): homo-octahedral family (the three M sites have the same cation occupancy), meso-octahedral family (two M sites are identical,

Structural Features of Micas 125
one is different), and hetero-octahedral family (the three M sites are differently occupied). The distinction in three families is based on structural features and reflects the symmetry of the O sheet; it is operatively determined on the basis of the number of electrons filling each of the three M sites, and it is used by the OD theory to fix unequivocally the origin in the layer. Table 1 contains a comparison of the common division of the mica families into tri- and dioctahedral classifications.
Dioctahedral/trioctahedral distinction. As mentioned above, the O sheet of micas is
traditionally described with reference to the minerals brucite (brucite-like sheet or trioctahedral sheet, namely homo-octahedral sheet) and gibbsite (gibbsite-like sheet or dioctahedral sheet, namely meso-octahedral sheet). This description is helpful to emphasize the modular nature of the mica layer; however, whereas the brucite-like sheet corresponds to the highest symmetry (homo-octahedral), the gibbsite- sheet does not correspond to the lower symmetry, being only meso-octahedral.
Symmetry of the O sheet . The plane point group symmetry of the ideal O sheet (Fig. 1) is 3m (a subgroup of 6mm) and its layer-symmetry is either H(̀ 3 )1m (brucite-like sheet) or P( 3 )1m (gibbsite-like sheet). In fact, the symmetry of the two types of octahedral sheets differs at least for the following reasons.
1. In the ideal brucite-like sheet (Fig. 1) all the octahedral sites are metrically equivalent; each oxygen atom has coordination number three and the O-H bonds of the hydroxyl (OH)- groups are perpendicular to the sheet.
2. In the ideal gibbsite-like sheet (Fig. 1) only 2/3 of the octahedral sites are occupied by the same cation and the other 1/3 is vacant; each oxygen atom has coordination number two and the O-H bond is parallel to the sheet and directed towards the vacant site.
Symmetry of the M layer . Because Oal and Oau correspond to two successive planes of a (pseudo)-closest-packing of spheres, Tl and Tu of an M layer are ±a/3 staggered (Fig. 5); consequently, both in the brucite-like and in the gibbsite-like case, the λ-symmetry of the entire M layer is lowered to C12/m(1). Symmetry and cation sites
Mainly because of a dimensional misfit between the T and O sheets (cf. below), in real mica structures the Pauling model (in which there are no structural distortions) is too abstract and must be replaced at least by a model which takes into account a rotation of the tetrahedra within the (001) plane. This ditrigonal rotation is discussed below; the resulting model has been called the trigonal model by Nespolo et al. (1999c).
Table 1. Families of micas based on the symmetry of the octahedral sheet. Comparison with dioctahedral and trioctahedral classification is given. (Modified after Durovic 1994).
Family λ-symmetry Trioctahedral Dioctahedral
Homo-octahedral H(̀ 3)1m ••• ---
Meso- octahedral P(̀ 3)1m •♦♦ ••
Hetero - octahedral P(3)12 •♦♣ ♦♣
•♦ ♣ = different electron occupancy of the M sites; = vacancy

126 Ferraris & Ivaldi
In the homo-octahedral family, the three M sites are by definition identical in content and size. Any difference in one of the M sites violates the H centering, lowering the symmetry of the O sheet to that of the meso-octahedral family. A difference between the other two M sites destroys also the inversion center and lowers the symmetry of the O sheet to that of the hetero-octahedral family. From the practical viewpoint, differences among the M sites are often small and must be evaluated on statistical grounds. As discussed by Bailey (1984c) for the specific case of micas [cf. an application in Amisano-Canesi et al. (1994)], if σl is taken as the estimated standard deviation (esd) of an individual quantity and σn = σl/n1/2 is the esd of the mean of n values, the esd of a difference (Δ) between two mean values is given by σΔ = 21/2σn. Two quantities are considered different at the 0.1% level of significance if Δ > 3.1σΔ (usually known as the 3σ rule).
In both the Pauling and the trigonal models, the stagger of the two T sheets reduces the λ−symmetry of the M layer to monoclinic (Fig. 5). Within the highest layer-group C12/m(1), M2 = M3 and only one symmetrically independent tetrahedral site exists (most of 1M polytypes have this symmetry). Depending on the cation distribution and the presence of structural distortions, the M layer may however have a lower λ-symmetry corresponding to a subgroup of C12/m(1). In principle the following lower symmetries can occur.
Layer group symmetry C1m(1). The m mirror plane coincides with the ac plane of the layer, M2 = M3 and two symmetrically independent tetrahedral sites occur according to the following scheme: T1u = T2u and T1l = T2l. No structures are known with this symmetry.
Layer group symmetry C12(1). The two-fold axis is along the b axis of the layer and the M2 and M3 sites are no longer equivalent. Two symmetrically independent tetrahedral sites are present in each sheet, but the two T sheets of a layer are symmetrically equivalent: T1u = T1l and T2u = T2l. This symmetry occurs in some meso- and hetero-octahedral 1M polytypes and in the hetero-octahedral 3T polytypes.
Layer group symmetry C 1 . The M2 and M3 sites are equivalent. There are two symmetrically independent tetrahedral sites in the M layer according to the following scheme: T1u = T2l and T2u = T1l. Most of the known 2M1 polytypes show this symmetry.
Layer group symmetry C1. The three M sites and the four T sites are all symmetrically independent. This symmetry occurs, e.g., in ephesite-2M1 (Slade et al. 1987).
In real structures, the λ-symmetry of the M layer with a given pattern of cation ordering may be lower than the ideal one described by the trigonal model as a function of the concrete stacking mode in a polytype: this phenomenon is known as desymmetrization (Durovic 1979). A primitive P lattice for the layer occurs in the unique example of anandite-2O (space group Pnmn; Giuseppetti and Tadini 1972, Filut et al. 1985). However, anandite-2O cannot be considered a real mica polytype (Ferraris et al. 2001c) for the following reasons: its P cell is not compatible with the C-centered cell common to all mica polytypes; its space group is not that expected (Ccmm) for the 2O mica polytype according to the OD theory; S substituting OH is coordinated by the interlayer cation which thus has coordination number 13.
Summarizing, in an M layer: 1. The maximum of symmetrically independent M sites is three. 2. At least two symmetrically independent M sites are always present; in dioctahedral
micas an independent site is always represented by the vacant M1 site.

Structural Features of Micas 127
3. In real polytypes the maximum number of independent T sites is two. 4. If the lattice of the layer is P, the maximum number of independent T sites can reach
four, but the resulting structure is no longer strictly polytypic (cf. anandite-2O). Table 2. λ-symmetry (S) and type of layer (L) in the three families of mica polytypes within the
Trigonal model. δ indicates the electron density of the octahedral site (site occupancy).
Family
S of
O sheet
δ
S of
M layer
Origin in
O sheet
L
Homo-octahedral (M1 = M2 = M3) H(̀ 3)1m δ(M1) = δ(M2) = δ(M3) C12/m(1)
--- M1
Meso-octahedral M1 ≠ M2 = M3 P(̀ 3)1m δ(M1) ≠ δ(M2) = δ(M3) C12/m(1)
M1 M1
M1 = M2 ≠ M3 P(̀ 3)1m δ(M1) = δ(M3) ≠ δ(M2) C12(1)
M2 M2
M1 = M3 ≠ M2 P(̀ 3)1m δ(M1) = δ(M2) ≠ δ(M3) C12(1)
M3 M2
Hetero-octahedral (M1 ≠ M2 ≠ M3) P(3)12 δ(M1) ≤ δ(M2), δ(M1) ≤ δ(M3) C12(1)
M1 M1
P(3)12 δ(M2) < δ(M1), δ(M2) < δ(M3) C12(1)
M2 M2
P(3)12 δ(M3) < δ(M1), δ(M3) < δ(M2) C12(1)
M3 M2
Two kinds of mica layer: M1 and M2 layers The λ-symmetry of the M layer depends on the number of identical M sites in the O
sheet. The origin of this sheet is fixed by the OD theory and taken at the site with the point symmetry corresponding to the λ-symmetry of the sheet (Dornberger-Schiff et al. 1982). The complete scheme is given in Table 2 and is summarized as follows.
Homo-octahedral family . In this family any of the three M sites has 3 1m point group symmetry.
Meso-octahedral family . In this family only one of the M sites has symmetry 3 1m: it is the site with different occupancy/size. Depending on whether this site is M1 (trans) or M2/M3 (cis), the layer itself is termed M1 or M2 respectively; the highest layer-group for these two layers is C12/m(1) (M1) and C12(1) (M2). There is thus a basic difference in the nature of these two types of layer.
Hetero-octahedral family . In this family, because of the chemical/size difference of the three M sites, the highest layer-group is C12(1) for both kinds of layer and any of the three M sites has point symmetry 312. In the hetero-octahedral family the origin can in principle be chosen in any of the M sites. In the case of dioctahedral micas, the origin of the O sheet is taken in the vacant octahedral site. By extending this criterion, in the case of hetero-trioctahedral micas the origin of the O sheet is taken as the site showing the lowest electron density δ (lowest X-ray scattering power; Durovic et al. 1984), which often corresponds to the largest M site (in most cases that site is M1). However, some examples are known (cf. Nespolo and Durovic, this volume) in which the site containing the lowest electron density is either M2 or M3, and the origin of the O sheet is thus in one of the two cis sites. Thus, as in the meso-octahedral family, two kinds of layer, M1 and M2, are distinguished.

128 Ferraris & Ivaldi
Examples . Although the M1 layer is much more common, several examples of micas constructed of M2 layers are known. So far, in dioctahedral micas constructed of M2 only examples of 1M polytype have been reported; in them the vacancy is ordered into one of the two cis sites (Zvyagin et al. 1985; Bloch et al. 1990; Zhukhlistov and Zvyagin 1991; Zhukhlistov et al. 1996). On the contrary, trioctahedral micas constructed of M2 layers are known for all the three most common polytypes (1M, 2M1 and 3T) (Guggenheim and Bailey 1977; Brown 1978; Guggenheim 1981; Mizota et al. 1986; Rieder et al. 1996; Brigatti et al. 2000). Both the M1 and the M2 layers can undergo the mentioned desymmetrization (Durovic 1979); a corresponding reduction to a space subgroup of the whole polytype may or may not occur. To distinguish the two kinds of layer, the occupancy and the size of the three octahedral sites must be known as a result of the refinement of the crystal structure. This knowledge is available only in a few cases and most of the mica structural studies are just based on the assumption that the crystal under investigation is built by M1 layers. For this assumption, Nespolo et al. (1999c), following a suggestion by S. Durovic (pers. comm.), introduced the term homo-octahedral approximation. The interlayer configuration
In the Pauling model, the λ-symmetry of the interlayer is P(6/m)mm: the interlayer cations have twelve nearest neighboring oxygen atoms at the corners of a hexagonal prism, which is not modified by an n × 60° rotation between adjacent layers. On the other hand, in the trigonal model the ditrigonal rotation modifies the symmetry of the interlayer depending on the parity of n in the n × 60° rotation. This symmetry becomes P( 3 )1m for even n and P(̀ 6 )2m for odd n. In both cases the I cations have six oxygen atoms as nearest neighbors and other six oxygen atoms as next-nearest neighbors (Fig. 6).
Figure 6. The interlayer cation I (large circles) displays antiprismatic coordination and prismatic coordination in the subfamily A and B polytypes, respectively. First and second neighbor bonds are indicated by full and dashed lines respectively. For maximum ditrigonal rotation (30°), the first six neighbors form either a trigonal antiprism (subfamily A) or a trigonal prism (subfamily B).
Subfamilies A and B of polytypes . Even rotations between adjacent layers lead to a trigonal (considering only the nearest neighbors oxygen atoms) or ditrigonal (considering also the next-nearest neighbors oxygen atoms) antiprismatic coordination for the interlayer cations I, whereas odd rotations lead to trigonal or ditrigonal prismatic coordination. The antiprismatic coordination of the nearest neighbors is often quoted as ‘octahedral’ coordination and, as discussed below, is presumed to be a stabilizing factor of the subfamily A polytypes, as are called those based on 2n × 60° rotations. Instead, the subfamily B polytypes, which are based on (2n +1) × 60° rotations, are rarer and are

Structural Features of Micas 129
considered less stable. MDO polytypes . The subfamily A polytypes 1M (n = 0), 2M1 (n = 1 and 2), and
3T (n = 1 or 2) and the subfamily B polytypes 2O (n = 1), 2M2 (n = 0 and 2), and 6H (n = 0 or 2; never found) are called homogeneous (Zvyagin 1988), MDO (Durovic et al. 1984), simple (Smith and Yoder 1956) or standard (Bailey 1980) polytypes. The ideal space groups of the six MDO polytypes are: C2/m (1M), C2/c (2M1 and 2M2), P31,212 (3T), Ccmm (2O) and P61,522 (6H) (Fig. 7).
Figure 7. Crystal structures of the five known MDO (homogeneous) polytypes of mica: 1M (a), 2M1 (b), 2M2 (c), 3T (d), and 2O (e).
Possible ordering schemes in the MDO polytypes The actual λ-symmetry (maximum λ−symmetry) of the M layer in a polytype can be
any subgroup of C12/m(1) which is not lower than the λ-symmetry required (minimum λ−symmetry) to the M layer by the space-group of the structure. For the five known MDO (homogeneous) polytypes the minimum λ−symmetry is as follows.
Space groups C2/m and Ccmm. The minimum λ−symmetry required by these two space–groups is C12/m(1). The O sheet contains the global twofold axis in both space groups. One tetrahedral and two octahedral independent sites are allowed and no ordering of the tetrahedral cations is possible. The 1M and 2O polytypes show this symmetry.

130 Ferraris & Ivaldi
Space group C 2/c. The minimum λ−symmetry required by this space group is C 1 ; the global twofold axis passes through the interlayer cation. Two tetrahedral and two octahedral independent sites are allowed; consequently, both tetrahedral and, for trioctahedral micas, octahedral cation ordering are possible. The 2M1 and 2M2 polytypes show this symmetry.
Space group P 31,212. The minimum λ−symmetry required by this space group is C12(1) with the O sheet containing a set of global twofold axes; the interlayer cation lies on a second set of global twofold axes. The 3T polytypes show this symmetry. Most of the 3T micas are dioctahedral and both tetrahedral (two independent T sites) and octahedral (three independent M sites, including the vacant one) cation ordering is possible.
Summarizing: among the five known MDO polytypes with ideal space-group, tetrahedral ordering is not possible in 1M and 2O polytypes. Octahedral ordering is instead possible in all five trioctahedral polytypes; for dioctahedral polytypes cf. phengite below. Note that there are some hints of a limited occupancy of M1 in ‘strictly’ dioctahedral micas (Brigatti et al. 1998, 2001; Pavese et al. 2001). The phengite case
The possibility of chemical order/disorder allowed by crystallographically independent M and T sites is a feature influencing the polytype stability (Pavese et al. 1997, 1999a,b; 2000), together with the interlayer coordination and the T/O dimensional mismatch as discussed later. The dioctahedral phengite micas are typical of high-pressure environment (Sassi et al. 1994) and represent a good example for this type of discussion. Owing to an optimum octahedral Mg/Al and tetrahedral Si/Al substitution, a good T/O match with very small ditrigonal rotation (see below) is possible in both 2M1 and 3T polytypes. Because this rotation increases with pressure P (cf. Zanazzi and Pavese's chapter), a small starting value at room-condition allows to maintain a still ‘reasonable’ rotation at higher P. Whereas this feature is present also in trioctahedral micas, only dioctahedral micas (and phengites in particular) show the following characteristics which favor stability at high P (Ferraris et al. 1995; Ferraris and Ivaldi 1993, 1994a,b).
1. The O-H bond tends to be parallel to (001) and in the direction of the vacant M site and does not hinder the compressibility of the interlayer. The O-H pointing towards the interlayer cation is instead an obstacle to this compressibility in the trioctahedral micas.
2. A higher structural flexibility In 3T following from the presence of more than one crystallographically independent octahedral site.
3. A spiral disposition in 3T of the O-H directions across the three M layers of a cell compared to the antiparallel disposition in the 2M1 polytype; consequently, a minor interlayer repulsion can be expected in 3T.
In particular, the stability of 3T phengite at high P relative to the 2M1 polytype occurs by 3T phengite possessing the characteristics 2. and 3.
DISTORTIONS The misfit
As already mentioned, in real mica structures the Pauling model is too abstract and must be replaced at least by the trigonal model, which considers a rotation of the tetrahedra around the perpendicular to (001). In fact, b being about 9.4, 8.6 and 9.3 Å in brucite, gibbsite and T sheet (with Si:Al = 3:1), respectively, the dimensions of the T and of the O sheets do not match. Consequently, as discussed below, some structural distortions are needed to overcome the misfit and to form these two sheets into a layer.

Structural Features of Micas 131
Geometric parameters describing distortions Practically, in all crystal structures, strictly regular coordination polyhedra occur
only if regularity is constrained by the symmetry, i.e., in micas, if the coordinated cation occupies a crystallographic position with point symmetry 4 3m for a tetrahedron and m 3 m for an octahedron. That does not happen because the tetrahedral and octahedral sites occurring in micas, even in the ideal Pauling model, have maximum symmetry 1 and 2/m, respectively. Consequently, the polyhedra on which the M layer is comprised have some degrees of freedom to differentiate their bond lengths and angles. This freedom is exploited to compensate, at least in part, both internal strains, connected with the chemical composition and the misfit between T and O sheets, and external strains, like pressure and temperature variations. In dioctahedral micas, the vacant octahedron is by far larger (⟨M-O⟩ ~ 2.2 Å) than the occupied ones ( ⟨M-O⟩ ~ 1.9 Å) because of the repulsion between the unshielded Oa apical oxygen atoms forming the vacant octahedron. Because two types of quite different Oa-Oa octahedral edges occur in the O sheet of the dioctahedral micas, two different types of Oa-Oa distances are necessary also in the T sheet to fit with the O sheet. Larger distortions must therefore be expected in dioctahedral micas than in trioctahedral micas.
Figure 8. From left to right, undistorted, moderately and fully distorted tetrahedral sheets are shown. The distortion (ditrigonal rotation α) is obtained by rotation of the tetrahedra around the perpendicular to the sheet. As shown, the angle 2α is defined by the directions of two tetrahedral edges sharing a corner. In a fully distorted tetrahedral sheet, the basal oxygens form an ideal closest packing without vacancies.
Ditrigonal rotation The trigonal model is the most important modification of the simple Pauling’s
model; it was introduced in 1949 by Belov, although a later paper by Radoslovich (1961) is usually quoted. To match the T and O sheets into a TOT layer, structural distortions must be introduced. The most important of these distortions is the ditrigonal (or in plane) rotation, α, of the tetrahedra around the perpendicular to (001) (Fig. 8). This distortion was theoretically related to the misfit between T and O by several authors (cf. Bailey 1984c) and was first experimentally confirmed in the structure of clintonite (Takéuchi and Sadanaga 1959; these authors used the variety name ‘xanthophyllite’). The rotation α reaches its maximum value (30°) when the hexagonal ring becomes a perfect ditrigonal ring; in this case the Ob oxygen atoms form an ideal closest-packing. In both Pauling and trigonal models, the tetrahedra have a triangular base exactly parallel to the (001) plane and the Ob oxygen atoms form a flat (001) surface. The angle between the prolongation of one edge of a triangular base and the corresponding edge of the triangular base sharing the same oxygen atom corresponds to 2α (Fig. 8). Calling φi the internal angles of the basal ‘hexagon,’ the angle 2α is obtained by the equation 2α = Σi = 1,6 (|120 −φi|)/6 (e.g., Weiss et al. 1992). The λ-symmetry of the tetrahedral sheet is reduced to trigonal by the ditrigonal rotation [layer-group P( 3 )1m] but the entire M layer maintains the C12/m(1) symmetry.
The physical limits for α are 0° (the fit between T and O is perfect) and 30°

132 Ferraris & Ivaldi
(maximum ditrigonalization). The effects of the two possible directions of the ditrigonal rotation are as follows (Franzini 1969):
Type-A layer. The triangular bases of the tetrahedra are oriented in the opposite way relative to the underlying, parallel triangular faces of the octahedral sheet (Fig. 9A).
Type-B layer. The triangular faces of the tetrahedral and octahedral sheets have the same orientation (Fig. 9B).
Figure 9. Type-A and type-B mica layers according to Franzini (1969) seen down the positive direction of the c axis. In type-A the triangular bases of the tetrahedra are oriented in the opposite way relative to the underlying, parallel triangular faces of the octahedral sheet. In type-B the triangular faces of the tetrahedral and octahedral sheets have the same orientation. The trans octahedra are shadowed.
In the type-A layer, the oxygen atoms of the Ob plane approach the perpendiculars passing through the octahedral cations because, according to Bailey (1984a), they are attracted by these cations. Thus a shielding effect between the Y octahedral cations and the I interlayer cations occurs. In the type-B layer the opposite situation arises and the shielding effect is reduced with respect to the undistorted Pauling’s model. In both cases, the b parameter of the distorted T sheet shortens with respect to that of an ideal T sheet and the T/O match is improved. As noted by Zvyagin (1967), and shown by the orientation of the triangles in Figure 9, the packing sequence of three apical sheets Oal-Oau-Obl approaches cubic-closest-packing (ccp) in type-A and hexagonal-closest-packing (hcp) in type-B. Contrary to Griffen’s (1992) statement that, although rarely, the type-B has been observed in dioctahedral micas, we have found no cases of this layer in micas. It occurs instead in other phyllosilicates, e.g., in 1:1 layer silicates such as lizardite (Mellini 1982) and in cronstedtite (Hybler et al. 2000) [actually, in these silicates the occurrence of unshielded octahedral cations is not a problem because there are no isolated interlayer cations]. Other distortions
Because of the sheet dimensions, which are determined by the Y-O and Z-O distances, the misfit between the T (b ~ 9.3 Å for tetrahedral occupancy Al:Si = 1:3) and O sheets is minimum and maximum when the octahedral sheet corresponds to a brucite-like (b ~ 9.4 Å) or a gibbsite-like ( b ~ 8.6 Å) layer, respectively. These two cases occur in the pure end-members micas phlogopite (trioctahedral), KMg3[AlSi3O10](OH)2, and muscovite (dioctahedral), KAl2[AlSi3O10](OH)2. Therefore, besides ditrigonal rotation, the chemical composition can contribute to match the dimensions between the T and O sheets. As seen in the paragraph “C ompositional aspects,” whereas in the T sites practically only Al and Si (sometimes Fe3+) can occur, a larger variety of cations, with octahedral ionic radii ranging from 0.535 Å (Al) to 0.76 Å (Li), can occur in the M sites. An appropriate distribution of cations can therefore favor the fitting between T and O sheets. The introduction of chemical substitutions at least in part contributes to various types of polyhedral distortions. These, besides the discussed ditrigonal rotation, are classified here below (Fig. 10). Some specific structural reasons for the appearance of

Structural Features of Micas 133
Figure 10. Definition of the octahedral flattening (ψ), octahedral thickness (t0), tetrahedral elongation (τ), tetrahedral tilting (Δz) and octahedral counter-rotation (ω) which is related to εi as shown in the text.
these distortions are given here but more details can be found in Brigatti and Guggenheim (this volume).
Tetrahedral elongation . This distortion is also known as tetrahedral thickening and implies an expansion for the tetrahedra in the direction perpendicular to the T sheet and a lateral compression (Radoslovich and Norrish 1962). The effect is measured by the angle τ = Σi=1,3(Ob-T-Oa)i /3 (τideal = 109.47º). It is particularly active in dioctahedral micas where it is related to the presence of the vacant octahedral site (Lee and Guggenheim 1981).
Tetrahedral tilting . Practically, this distortion is only found in dioctahedral micas because is caused by a great difference between the sizes of the octahedral sites. The tetrahedra rotate around a direction parallel to the (001) plane determining a departure from coplanarity of the Ob oxygen atoms (out-of-plane tilting). This tilting produces a corrugation of the basal plane which is measured by the parameter Δz = [zOb(max) – zOb(min)]csinβ.
Octahedral flattening (or thickening) . This distortion is measured by the angle ψ between the body diagonal and the base of the octahedron (Donnay et al. 1964). Given the thickness t0 of the O sheet and the average octahedral distance ⟨Y-O⟩, ψ is calculated as ψ = cos-1[t0/(2 ⟨Y-O⟩)]. Because ψideal = 54.73°, a flattening results in a larger value of ψ; vice versa for a thickening.
Counter-rotation ω. This distortion (Newnham 1961) is measured as the angle of rotation between the two triangular octahedral faces parallel to (001) belonging to the same octahedron; it is calculated by ω = |(ε 1 + ε 3 + ε 5)/3 - 60°| = |(ε 2 + ε 4 + ε 6)/3 – 60°| (ωideal = 60° and 0°). The angles εi correspond to the O-Y-O angles measured in the projection of the octahedron onto (001); in a regular octahedron εi = 60°. Generally, for all micas this effect is related to the difference in size of neighboring octahedra (Lin and Guggenheim 1983).
These distortions are not independent variables. In fact, besides specific aspects in part mentioned above, all of them are to some extent correlated with chemical substitutions and T/O misfit. Several correlations have been proposed, particularly for the ditrigonal rotation (e.g., Lin and Guggenheim 1983; McCauley and Newnham 1971; Toraya 1981; Weiss et al. 1985).
Effects of the distortions on the stacking mode
All the distortions decrease in the order hetero-octahedral > meso-octahedral > homo-octahedral, because of the corresponding reduction in the size difference of

134 Ferraris & Ivaldi
different octahedra. All octahedra in micas are more or less distorted (they should thus more rigorously be termed trigonal antiprisms) and the distortions can be fully described by the flattening ψ and the counter-rotation ω (Weiss and Rieder 1997). It has been shown (Weiss and Wiewióra 1986; Weiss and Rieder 1997) that the ditrigonal rotation is most effective in influencing the diffraction intensities, in particular 20l and 13l reflections (i.e., the second ellipse in the OTED described in Appendix II); instead the counter-rotation affects mainly the basal diffractions.
Figure 11. Adjacent basal Ob oxygen atoms in the case of 1M and 2O polytypes, that show 0° and 180° rotations between adjacent M layers (left), and (right) of 2M1, 3T, 2M2 and 6H polytypes where instead the rotation between adjacent M layers is ±120° (2M1, 3T) or ±60° (2M2 and 6H). The tetrahedral tilting Δz (Fig. 10) is exaggerated.
Δz and stability of polytypes . The tetrahedral tilting Δz seems to have the most marked influence on the relative stability of the 1M and 2M1 polytypes, the latter becoming energetically favored when Δz increases (Appelo 1978 and 1979, Abbott and Burnham 1988). A general influence of Δz ≠ 0 on the relative stability of different polytypes can also be expected on geometric grounds by considering the interlayer configuration (Fig. 11) for different values of the n × 60° rotation between adjacent M layers (Güven 1971, Soboleva 1987). For polyt ypes based on 0° or 180° rotations (the MDO polytypes are1M and 2O), both the Ob planes delimiting the interlayer region have negative Δz in correspondence of the I cation. For polytypes based on ±120° (2M1 and 3T) or ±60° (2M2 and 6H) rotations, the two Ob sheets delimiting the interlayer region have opposite signs of Δz in correspondence of the I cation. In presence of a large Δz, the polytypes based on 0° and 180° rotations offer too a large cavity for the I cation and, e.g., 2M1 (but also 3T) is favored relative to 1M. At high Δz, (2n+1) × 60° rotations become favored and the relative stability of 2M2 and 2O seems then to depend on the ditrigonal rotation of the tetrahedra (Bailey 1984c; Abbott and Burnham 1988).
Figure 12. Stacking of the M octahedral sites for subfamily A and subfamily B polytypes. These sites lie on the same perpendicular to (001) in subfamily B but not in subfamily A polytypes.

Structural Features of Micas 135
Relative rotation of two adjacent M layers . This plays a role in stabilizing polytypes also in connection with the relative positions of the M sites. In fact (Fig. 12), whereas for a 2n × 60° rotation (subfamily A) the octahedral sites in two adjacent M layers are staggered by ±a/3 and thus not overlapped in the (001) projection, in the case of a (2n+1) × 60° rotation (subfamily B) they are staggered ±b/3 and thus lie on the same perpendicular to (001) [Soboleva 1987; cf. also the polytypic stacking discussed in terms of configurations I and II of the octahedral cations in Bailey (1984a)]. Although a direct influence of the relative positions of octahedral cations belonging to adjacent layers is hardly conceivable, because of the large separation (~10 Å), the stacking of octahedra along the perpendicular becomes an indirect destabilizing factor through its effect on tetrahedral tilting Δz. This would be clear in the case of a hypothetical 2O dioctahedral mica, where the large and vacant octahedral sites would stack on the same perpendicular. As a consequence, tetrahedra on the opposite sides of the I cations are tilted in the same direction, increasing the repulsion between approaching Ob atoms. In the other two MDO subfamily B dioctahedral polytypes (2M2 and 6H), the stacking along a perpendicular alternates vacant and filled octahedral sites, reducing the Ob-Ob repulsion with respect to the 2O polytype. Dioctahedral 2M2, although rare, has been found (Zhukhlistov et al. 1973), whereas neither 2O nor 6H have been discovered so far in dioctahedral micas. The complete absence of the 6H polytype in any family of mica likely derives both from energetic factors (e.g., odd rotations) and kinetic reasons (low probability of formation and inheritance of a 6-layer period with hexagonal symmetry; Nespolo 2001).
FURTHER STRUCTURAL MODIFICATION Pressure, temperature and chemical influence
Generally pressure (P) and temperature (T) have a major influence on the distortions of coordination polyhedra (cf. Zanazzi and Pavese, this volume). The tetrahedral dimen-sions are the ones least sensitive to P and T, whereas the compressibility and expansion of the octahedra are large, so the fit between tetrahedral and octahedral sheets improves with increasing T (larger O sheet) and worsen with increasing P (smaller O sheet). Therefore, in a first approximation, P and T shows an opposite behavior (Hazen and Finger 1982). The knowledge of the P-V-T equation of state would allow the calculation of the isochor, i.e., the P-T path which maintains constant the cell volume (cf. Pavese et al. 1999b) and, reasonably, also the distortions. For a rough estimate of the isochor, the values of the expansion at constant P (isobar) and of the compression at constant T (isotherm) can be combined (e.g., Comodi and Zanazzi 1995; Mellini and Zanazzi 1989).
The main effect of P and T are on the interlayer because the I-Ob bonds are weak. Both the effect of modifying the length of the c parameter and the ditrigonal rotation are discussed below. Note that any change in the T/O match because of P and T variations modifies the ditrigonal rotation and consequently the interlayer coordination. Other sources of change for the I-Ob distances are tetrahedral substitutions (which modify the length l of the tetrahedral edge). Summarizing, for a given I, the parameter c modifies mainly under the following factors:
1. temperature T (expansion → longer c); 2. pressure P (compression → shorter c); 3. ditrigonal rotation α (I-Ob distances are modified).
Thickness of the mica module As mentioned at the beginning of this chapter, a mica module is intended to consist of
an M layer plus the interlayer cation. The use of the module thickness tm = csinβ/n (n is the number of M layers in a unit cell) allows the comparison of data from different polytypes.

136 Ferraris & Ivaldi
Figure 13. Decreasing trend of the mica module thickness (top) and ditrigonal rotation α vs the increasing content of Si in 2M1 (rhombi and crosses) and 3T (open triangles and circles) natural phengitic micas. To obtain α the knowledge of the crystal structure is necessary. The values cor-responding to samples with known structure are indicated by rhombi (2M1) and circles (3T). The values at 3.81Si represent the only two synthetic phen-gites which are included because their crystal structures are known (Smyth et al. 2000). R represents the correlation coefficients of the shown regression lines.
Sinking effect of the I cation . The smaller the ditrigonal rotation α, the larger is the
more or less hexagonal cavity where the interlayer cation I can sink; consequently a shorter c parameter is expected. This effect has been observed by several authors. Guidotti et al. (2000) noted that a shorter c parameter is observed in the low pressure Fm-rich muscovites [Fm = (Fe + Mg)/(Fe + Mg + Al)]. In fact, as expected from the values of the cation ionic radii, the Fm substitution for Al in muscovites (and the parallel Si/Al tetrahedral substitution) improves the T/O fit and, consequently, the ditrigonal rotation α decreases. Μassonne and Schreyer (1986, 1989) and, recently, Schmidt et al. (2001) showed, in synthetic phengites, a contraction of the c parameter with the increase of the Si content. Ivaldi et al. (2001a) have found the same result on natural samples (Fig. 13; the thickness of the mica module tm instead of c is used). The ditrigonal rotation α behaves as tm. The decrease of the ditrigonal rotation α with the increase of the Si content is well explained by the improvement of the fit between the tetrahedral and octahedral sheets promoted by the aluminoceladonitic substitution (Mg for VIAl and Si for IVAl). By decreasing α, more-hexagonal rings occur in the Ob plane where the interlayer cation can sink.

Structural Features of Micas 137
Figure 14. A shift σ (exaggerated) of the basal plane Ob from the full line to the dashed line position reduces more (CD) the I-Ob(outer) distances than (AB) the I-Ob(inner) ones.
Interlayer separation and coordination. Ferraris and Ivaldi (1994b) showed that a variation of the interlayer separation influences the outer I-Ob distances more greatly than the inner I-Ob distances. This geometric effect appears clear in Figure 14. Therefore, an ‘at first sight unexpected’ behavior occurs under variation of P and/or T: the I-Ob(inner) distances, which represent shorter and thus stronger bonds, change by far more than the I-Ob(outer) ones, which instead represent longer and thus weaker bonds.
Figure 15. Undistorted (a) hexagonal ring of a T sheet showing that all basal Ob atoms have the same distance DA = l from the ring center D; D represents the intersection of the drawing plane with the perpendicular to the ring. In a ring (b) with maximum ditrigonal rotation α, the inner Ob atoms are closer (DC = l/31/2) to D than the outer Ob atoms (DB = 2l/31/2). The values of the internal ring angles are related to α as follows: BCB' = 120° + 2α, CBC' = 120° - 2α.
Ditrigonal rotation and interlayer coordination In presence of the ditrigonal rotation, six Ob basal oxygen atoms are closer to (inner
Ob oxygens) and six are farther from (outer Ob oxygens) the interlayer cation I. By increasing α from its minimum value (0°, absence of distortion) to its maximum value (30°), the distance d of the Ob oxygen atoms from the perpendicular to the layer containing I, expressed as a function of the tetrahedral edge l, changes (Fig. 15) from d = l to dinner = l/31/2 and douter = 2l/31/2. In other words, while the Ob(inner) atoms decrease their undistorted distance from the perpendicular by (dinner – d)/d = -42.3%, the Ob(outer) atoms move very little and increase the same distance by (douter – d)/d = 15.5%. Therefore, the consequence of the ditrigonal rotation on the interlayer coordination is dramatic. Precisely:

138 Ferraris & Ivaldi
Increase of the ditrigonal rotation . An increase of α (e.g., under compression) causes the difference between I-Ob(outer) and I-Ob(inner) distances to become larger. Thus both the trigonal antiprismatic (ideally octahedral) coordination (subfamily A polytypes such as 1M, 2M1 and 3T ) and the trigonal prismatic coordination (subfamily B polytypes such as 2O, 2M2 and 6H) become more dominant. As far as the antiprismatic coordination is a stabilizing factor, the increase of the ditrigonal rotation at high P should not weaken a structure.
Decrease of the ditrigonal rotation . A decrease of α (e.g., under expansion) causes the difference between I-Ob(outer) and I-Ob(inner) distances to become smaller: the interlayer coordination approaches the hexagonal prismatic coordination for both polytype subfamilies A and B. As far as the antiprismatic coordination is a stabilizing factor, the decrease of the ditrigonal rotation at high T should weaken a structure.
Note that, under the combined causes which influence the I-Ob distances and discussed above, overall decreases of the I-Ob(inner) has been reported in high-temperature refinements of micas (Catti et al. 1989, Guggenheim et al. 1987; Ivaldi et al. 1998; Russel and Guggenheim 1999; Takeda and Morosin 1975). Effective coordination number (ECoN)
ECoN is a useful generalization of the classical definition of coordination number (number of anions in contact with a cation); it considers the lengths of the bonds (Hoppe 1979). For a cation X establishing R(X)i bonds with equal anions, ECoN is defined as [Nespolo et al. (1999a) on the basis of Hoppe et al. (1989)]:
ECoN(X) = Σiexp{1 – [R(X)i /R(X)av]6}; (1) R(X)av represents a weighted average bond distance for the coordination polyhedron around the cation X and is defined as
Rav(X) =Σi R(X)iexp{1 – [R(X)i /R(X)min]6}/Σiexp{1 – [R(X)i /R(X)min]6} (2) R(X)min being the shortest R(X)i distance (the exponent 6 is valid when the anion is O2-). The sum over i is in principle extended to all the oxygen atoms; practically, however, note that the contribution falls to zero as R(X)i exceeds R(X)av [Eqn. (1)] or R(X)min [Eqn. (2)] by more than about 20%. ECoN defined by Equation (1) is a non-integer number approaching the Pauling's coordination number (i.e., the number of first neighbor anions) and equal to it for regular coordination polyhedra where R(X)i = R(X)av = R(X)min. Recently the method has been extended to distorted and hetero-ligand polyhedra (Nespolo et al. 2001).
A correlation between ECoN calculated for the interlayer cation I and the ditrigonal rotation α can intuitively be expected from the discussion of this section. Such correlation has been investigated by Weiss et al. (1992) and found to be quite regular (Fig. 16). In fact, ECoN for I smoothly decreases from about 12 (null ditrigonal rotation) to 6 (for a ditrigonal rotation higher than about 16°).
CONCLUSIONS Even if the discussion is still open, the basic features of the mica structure
reasonably explain a wide range of the micas properties, from polytypism and twinning (Nespolo et al. 1997b; Nespolo et al. 1999b; details in Nespolo and Durovic', this volume) to chemical variability and stability in a range of geological conditions. The matter of stability fields is of paramount interest in Earth sciences and concerns both the occurrence of a polytype more than others and the capability for a mica of existing at high P and/or T values. For a list of references to occurrences of associated polytypes of

Structural Features of Micas 139
Figure 16. Correlation be-tween ECoN (effective coor-dination number) of the inter-layer cation I and the di-trigonal rotation α in micas. [Modified after Weiss et al. (1992)].
micas; cf. Ivaldi et al. (2001b) and Ferraris et al. (2001c). The following basic structural features play a role in structure stabilization.
1. The type of interlayer coordination, which is connected with the parity n of rotation (n × 60°) between adjacent M layers, justifies a wider occurrence of family A polytypes (not limited to the MDO polytypes 1M, 2M1, 3T) which show even rotations only. The amount of rotation between two adjacent M layers influences the relative stability of polytypes independently of the parity n.
2. A phengitic composition favors stability at high P/T values because the aluminoceladonitic substitution provides a good T/O fit and consequent small ditrigonal rotation α at high P/T also.
3. The argument of a small ditrigonal rotation α cannot stand alone (cf. the trioctahedral micas). It becomes effective as stabilizing factor at high P for dioctahedral micas because other aspects concur as: (1) the O-H bond points towards the vacant octahedral site and assumes a direction (almost) parallel to (001) thus minimizing its interaction with the interlayer cation; (2) the presence both of a pair of independent tetrahedral sites and of independent M2 and M3 octahedral sites in the 3T polytype which, with phengitic composition, is the most stable form of mica at high P/T.
4. In trioctahedral micas, the O-H bond is pushed away from the (001) Ob plane and tends to lie along the perpendicular to this plane. Thus, some repulsive interaction with the interlayer cation occurs that weaken the stability of the structure. However, in oxidized (e.g., Ohta et al. 1982) or fluorinated micas (e.g., Takeda et al. 1971) this repulsion is reduced proportionally to the O2- → OH- or F- → OH- substitution. This is particularly evident in synthetic fluoro-micas (e.g., Takeda and Burnham 1969).
5. Geometric effects connected with the variation of the ditrigonal rotation α and of the interlayer separation are as important as energetic factors in determining the variation of the interlayer bonds under compression, dilatation and effects in α that produce changes in the coordination (i.e., sinking effect) of the interlayer cation.
6. The presence of two types of M layer, M1 and M2, may play a role in the growth of long period polytypes (Nespolo 2001).

140 Ferraris & Ivaldi
APPENDIX I: MICA STRUCTURE AND POLYSOMATIC SERIES
Layer silicates as members of modular series? The T and O sheets occurring in the mica structure are present in all layer silicates
(phyllosilicates); the entire M (TOT) mica layer is present in 2:1 layer silicates only. The description of layer silicates is often given by emphasizing different stacking of T and O sheets, even if an explicit discussion in terms of modular series is absent from the literature.
Several types of modular series have been defined (Makovicky 1997): Polysomatic (homologous accretional) series. The crystal structures of the members of
these series are based on the same modules. Biopyriboles are a well known example (Thompson 1978).
Merotypic series . Both common and peculiar modules are present in the crystal structures of the members. The case of bafertisite-derivative structures, belonging to the heterophyllosilicate group of titanosilicates, is described below.
Plesiotypic series. The crystal structures of the members of these series are based on modules which have common features but may contain additional peculiar details. The family of serpentine-like structures (lizardite, chrysotile, antigorite, carlosturanite) is an example reported by Makovicky (1997). The members of this plesiotypic series are based on variously curled, reversed and/or interrupted TO (serpentine) layers.
From a topologic viewpoint, namely without considering the actual composition of the M layer but only that of the interlayer, the following modules are necessary to obtain all the structures of the 2:1 layer silicates:
1. three types of M layer: homo- meso- and hetero-octahedral layers; 2. interlayer modules of different chemical and structural nature ranging from single
cations (micas), to octahedral sheets (chlorites) and a mixture of layers and various chemical groups (interstratified clay minerals).
The entire group of layer silicates could therefore be classified as a mero-plesiotypic series in the sense that both structural details and nature of the building modules varies. Mica modules in polysomatic series
The M mica module occurs not only in biopyriboles, chlorites and interstratified clay minerals as mentioned above, but also in some other polysomatic series. Because these series represent different possibilities for the presence of mica-like structures in minerals, it seems useful to shortly describe some of them. The heterophyllosicate polysomatic series
By analogy with phyllosilicates, a group of titanium silicates whose structures are based on TOT-like layers have been called heterophyllosilicates (Ferraris et al. 1997). In these structures, rows of Ti(Nb)-octahedra (hereafter, Ti-octahedra) are introduced in a T sheet along the direction which is parallel to a pyroxene tetrahedral chain (Fig. 17). HOH layers are thus obtained where H stands for hetero to indicate the presence of the Ti-octahedra in a sheet corresponding to the T sheet of the layer silicates. Because the edges of the Ti-octahedra and Si-tetrahedra have close lengths dimensions, the insertion of the octahedra in a T sheet does not produce strain. As summarized by Ferraris (1997), three types of HOH layers (Fig. 18) are known so far.
Bafertisite-like ( HOH)B layer . A bafertisite module B, I2Y4[Ti2(O)4Si4O14](O,OH)2, is one-to-one intercalated with a one-chain-wide mica-like module

Structural Features of Micas 141
Figure 17. Different types of H sheets which are obtained by periodically introducing Ti-octahedra (light gray) in a tetrahedral T sheet: bafertisite-like (B), astrophyllite-like (A) and nafertisite-like (N) H sheets.
M,IY3[Si4O10](O,OH)2 (I and Y represent interlayer cations and octahedral cations, respectively).
Astrophyllite-like ( HOH)A layer . With respect to the bafertisite-like layer, a second one-chain-wide mica-like module M is present between two bafertisite-like modules.
Nafertisite-like ( HOH)N layer. With respect to the bafertisite-like layer, a second and a third one-chain-wide mica-like module M are present between two bafertisite-like modules [or, a second M module is added to (HOH)A].
The series. Bafertisite (Guan et al. 1963, Pen and Shen 1963, Rastsvetaeva et al. 1991), astrophyllite (Woodrow 1967) and nafertisite (Ferraris et al. 1996) are members of a polysomatic series BmMn which is based on B (bafertisite-like) and M (mica-like) modules and has a general formula I2+nY4+3n[Ti2(O)4Si4+4nO14+10n](O,OH)2+2n. In the formula, atoms belonging, even in part, to the H sheet are shown in square brackets; for n = 0, I = Ba and Y = (Fe,Mn) the formula of bafertisite is obtained. The heterophyllosilicates have also been described by using differently defined B and M modules (Christiansen et al. 1999), a possibility which is not rare in modular crystallography (Merlino 1997).

142 Ferraris & Ivaldi
Figure 18. Bafertisite-like (B), astrophyllite-like (A) and naf-ertisite-like (N) HOH layers.
Seidozerite derivatives . The bafertisite-like module (HOH)B is the building fragment of several layer titanosilicates (seidozerite or bafertisite derivatives; Ferraris et al. 1997) where only the interlayer content varies. These titanosilicates are B1M0 members of the heterophyllosilicate series with a peculiar interlayer content. They are represented by the formula XY4[Ti2(O)4Si4O14](O,OH)2, where X indicates the interlayer content which may consist of H2O, tetrahedral anions and cations. All the seidozerite derivatives are based on a common two-dimensional (sub)cell with a ~ 5.4 Å and b ~ 7 Å, whereas the value of the stacking c parameter depends on the nature of X. The set of seidozerite derivatives forms a merotype [or mero-plesiotype (Ferraris 2001d) series]. In the seidozerite derivatives, (HOH)B represents the common building layer and the X inter-layer content is variable. The palysepiole polysomatic series
The palysepiole polysomatic series PpSs (Ferraris et al. 1998) includes minerals whose structures contain one or both the types of TOT ribbons (modules) which are present in palygorskite and sepiolite; these ribbons are reminiscent of the TOT modules occurring in amphiboles (Fig. 19). The two modules are:
• P = Ax(Y2+,Y3+, )5[Si8O20(OH)2]·nH2O (palygorskite module; in palygorskite Y is mainly Mg and n ∼ 8);
• S = Ax(Y2+,Y3+, )8[Si12O30(OH)4]·mH2O (sepiolite module; in sepiolite Y is mainly Mg and m ∼ 12).
The structures of sepiolite and palygorskite are based on chess-board arranged [001] TOT ribbons and intercalated channels. Each ribbon occurring in sepiolite, (TOT)S, is six pyroxene-chain wide and 50% wider than that occurring in palygorskite, (TOT)P, which in turn is four pyroxene-chain wide. A variable amount of alkali A cations and water molecules occurs in the channels. The third known mineral of the group, kalifersite, corresponds to the member P1S1 of the series and has formula K5(Fe7
3+, 2)[Si20O50(OH)6]·12H2O. Its structure is based on an alternation, in the [010] direction, of (TOT)S and (TOT)P ribbons. Each of two types of [001] channels, which occur within the mixed palygorskite/sepiolite framework, is filled with a different strip of alkali-octahedra (not shown in Fig. 19).

Structural Features of Micas 143
Figure 19. View along [001] of the crystal structures of palygorskite (P), kalifersite (K) and sepiolite (S). Kalifersite is based on a chess-board arrangement of ribbons (TOT)S (sepiolite) and (TOT)P (palygorskite). Cations and water molecules occurring in the channels are not shown.
Other modular structures
Guggenheim and Eggleton (1987, 1988) described some modular 2:1 layer silicates in terms of fragments of the M (TOT) mica module, with or without interlayer cations. The modularity of these silicates originates by the inversion of part of the tetrahedral linkage. On the basis of the inversion fragments, the basic TOT layers may form either islands (e.g., stilpnomelane and zussmanite) or strips (where the octahedral sheets remains continuous as in ganophyllite and minnesotaite, or discontinuous as in the above mentioned palysepioles). Conclusions
TOT modules occur in different mineral structures and the following examples have been discussed in this Appendix.
• Infinite two-dimensional layers occur in micas, talc, pyrophyllite, chlorites and interstratified clay minerals.
• Slices of the mica (talc) structure cut perpendicularly to the layer are present in amphiboles and palysepioles; they are inclined on the layer in heterophyllosilicates, according to the description of Ferraris et al. (1996).
It seems reasonable to connect variety and frequency of occurrence with structural stability. The wide range of conditions under which the TOT layer is stable on its own occurs in talc and pyrophyllite, built up by this layer only. The TOT layers are even able to survive through reactions generating other minerals [cf. Baronnet (1997) and Buseck (1992) and references therein] including other micas (cf. Ferraris et al. 2001a).
Probably features other than crystal chemistry concur to explain the wide distribution and persistence of variously sliced mica modules. The high symmetry of the mica modules could be a key feature, in the sense that it favors different stacking and connections with other modules both of the same kind and different nature. Mica polytypes and twins are clear examples of symmetry-assisted structures. The flexibility of

144 Ferraris & Ivaldi
the T and O sheets and of the TOT layer as a whole has been widely discussed in this chapter. This flexibility is usefully exploited to match mica modules with other modules, a role which can be played also by closeness of polyhedral dimensions (cf. the heterophyllosilicates case).
APPENDIX II: OBLIQUE TEXTURE ELECTRON DIFFRACTION (OTED)
In addition to powder X-ray (Bailey 1988) and single-crystal X-ray diffraction methods, electron diffraction is widely used to characterize micas. In particular, the oblique-texture electron diffraction (OTED) method here described has been used to obtain important results from micro grained samples of layer silicates (cf. references below). A part some earlier sporadic papers, the OTED method was developed by Vainshtein (1956, 1964), following Pinsker (1953), and further improved during following years (Zvyagin 1967, Zvyagin et al. 1979, Vainshtein et al. 1992, Zvyagin et al. 1996). OTED has been used to obtain diffracted intensities for solving crystal structures (cf. quoted papers and Zhukhlistov et al. 1997), spite of the dynamic effects affecting the electron diffraction intensities. In the present context, however, we are interested in the application of OTED for polytype identification and follow Zvyagin (1967). The method is suitable for materials that show a very good cleavage where thin mounts can be prepared so that the cleavage planes are more or less perfectly parallel to the plane of the mount.
Figure 20. Cylindrical reciprocal lattice generated by rotation of reciprocal lattice rows around c* (left) and its elliptical intersection with the Ewald sphere (right) which, in the case of electron diffraction (only small Bragg angles are possible), can be approximated by a plane. At right, the effect of a non perfect planarity of the sample is shown by substituting the circles of the left figure with tori; the intersection of a torus with the Ewald sphere is an ‘arc’ (Fig. 22). Modified after Zvyagin (1967).
Let us suppose that the exploited cleavage is {001} and the cleavage lamellae are textured in a planar mount so that their orientations have a common perpendicular to (001), i.e., around c*. Under these conditions, each reciprocal row hkl (h and k are fixed) parallel to c* describes a so called cylindrical reciprocal lattice (Fig. 20). The nodes with the same hk indices are at a distance [(h/a)2 + (k/b)2]1/2 from c*. All the circles have their center on the rotation axis but not at the corresponding 00l node, except when the lattice is orthogonal. The projection of these circles on the ab plane is shown in Figure 21 together with the hk
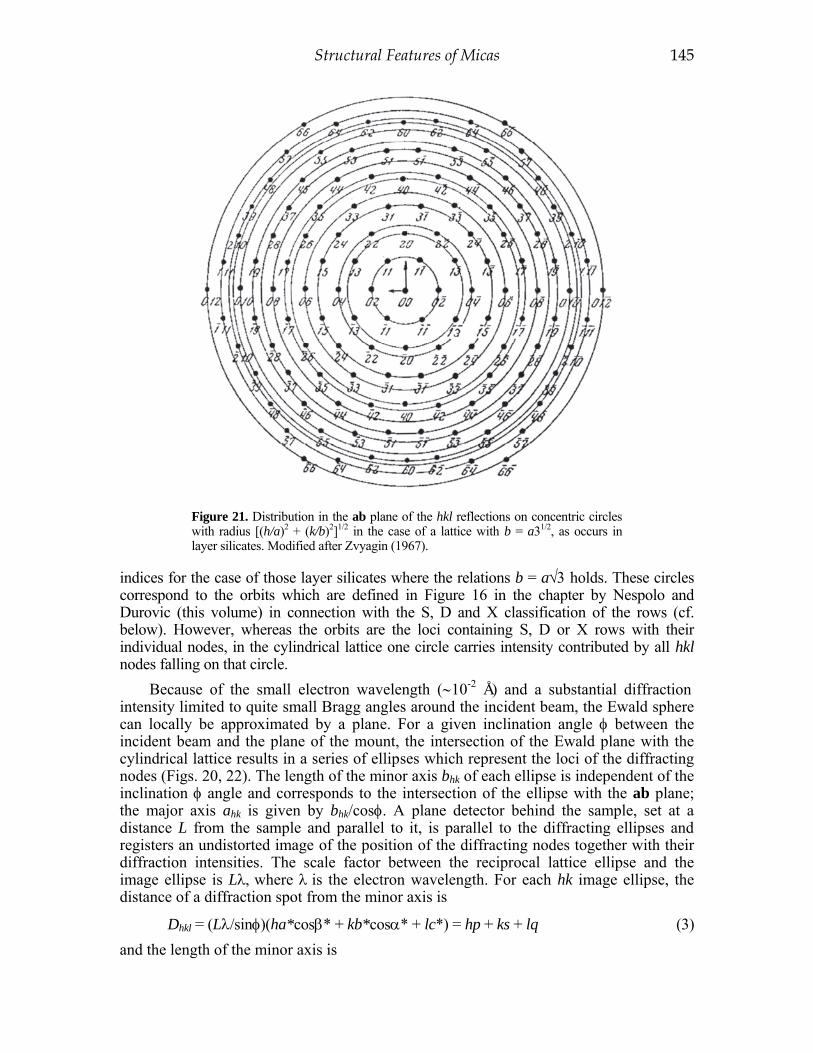
Structural Features of Micas 145
Figure 21. Distribution in the ab plane of the hkl reflections on concentric circles with radius [(h/a)2 + (k/b)2]1/2 in the case of a lattice with b = a31/2, as occurs in layer silicates. Modified after Zvyagin (1967).
indices for the case of those layer silicates where the relations b = a√3 holds. These circles correspond to the orbits which are defined in Figure 16 in the chapter by Nespolo and Durovic (this volume) in connection with the S, D and X classification of the rows (cf. below). However, whereas the orbits are the loci containing S, D or X rows with their individual nodes, in the cylindrical lattice one circle carries intensity contributed by all hkl nodes falling on that circle.
Because of the small electron wavelength (∼10-2 Å) and a substantial diffraction intensity limited to quite small Bragg angles around the incident beam, the Ewald sphere can locally be approximated by a plane. For a given inclination angle φ between the incident beam and the plane of the mount, the intersection of the Ewald plane with the cylindrical lattice results in a series of ellipses which represent the loci of the diffracting nodes (Figs. 20, 22). The length of the minor axis bhk of each ellipse is independent of the inclination φ angle and corresponds to the intersection of the ellipse with the ab plane; the major axis ahk is given by bhk/cosφ. Α plane detector behind the sample, set at a distance L from the sample and parallel to it, is parallel to the diffracting ellipses and registers an undistorted image of the position of the diffracting nodes together with their diffraction intensities. The scale factor between the reciprocal lattice ellipse and the image ellipse is Lλ, where λ is the electron wavelength. For each hk image ellipse, the distance of a diffraction spot from the minor axis is
Dhkl = (Lλ/sinφ)(ha*cosβ* + kb*cosα* + lc*) = hp + ks + lq (3) and the length of the minor axis is

146 Ferraris & Ivaldi
Figure 22. Theoretical OTED diffraction pattern [for a 1M mica polytype for which b = a31/2] showing the spots (arcs) arranged on ellipses. According to its order, each ellipse contains reflections with the type of indices shown in this Figure and in Table 3. The ‘spots’ are represented as arcs because in practice the lamellae of the sample can be slightly inclined relative to the average plane of the sample (Fig. 20). The distance of each ‘spot’ from the trace O of the incident beam (origin of the lattice) corresponds to d*(hkl); the case of d*(112) is shown in the figure. Modified after Zvyagin (1967).
bhk = Lλ(h2/a2 + k2/b2)1/2. (4) Because in the layer silicates b = a31/2, Equation (4) becomes
bhk = Lλ(3h2 + k2)1/2/b. (5) Note that in the OTED method the overlap of reflections is limited to those
reflections with the same value of Dhkl (Eqn. 3) and belonging to the same ellipse; thus a dramatic improvement is obtained relative to the classic powder diffraction methods. Note also that, in the most general case, the reflections with l = 0 do not lie on the minor axis because the a*b* and ab planes are not coincident. These two planes coincide in orthogonal crystal systems where Equations (3) and (4) become, in the order,
Dhkl = (Lλ/sinφ)lc* = lq (6) and
bhk = Lλ[h2(a*)2 + k2(b*)2]1/2. (7) Some simplification is also obtained in the monoclinic case (α* = 90°) where
Dhkl = (Lλ/sinφ)(ha*cosβ* + lc*) = hp + lq. (8)
Each ellipse is characterized by 3h2 + k2 = constant. Table 3 reports the absolute values of hk which occur when b = a31/2. According to their h and k values, the rows parallel to c* have been classified in the following way (Nespolo et al. 2000; cf. below and Nespolo and Durovic, this volume, for details).
S rows . These are the rows with h = 0(mod3) and k =0(mod3); they are family rows in the Pauling model and are common to all polytypes of the same family.
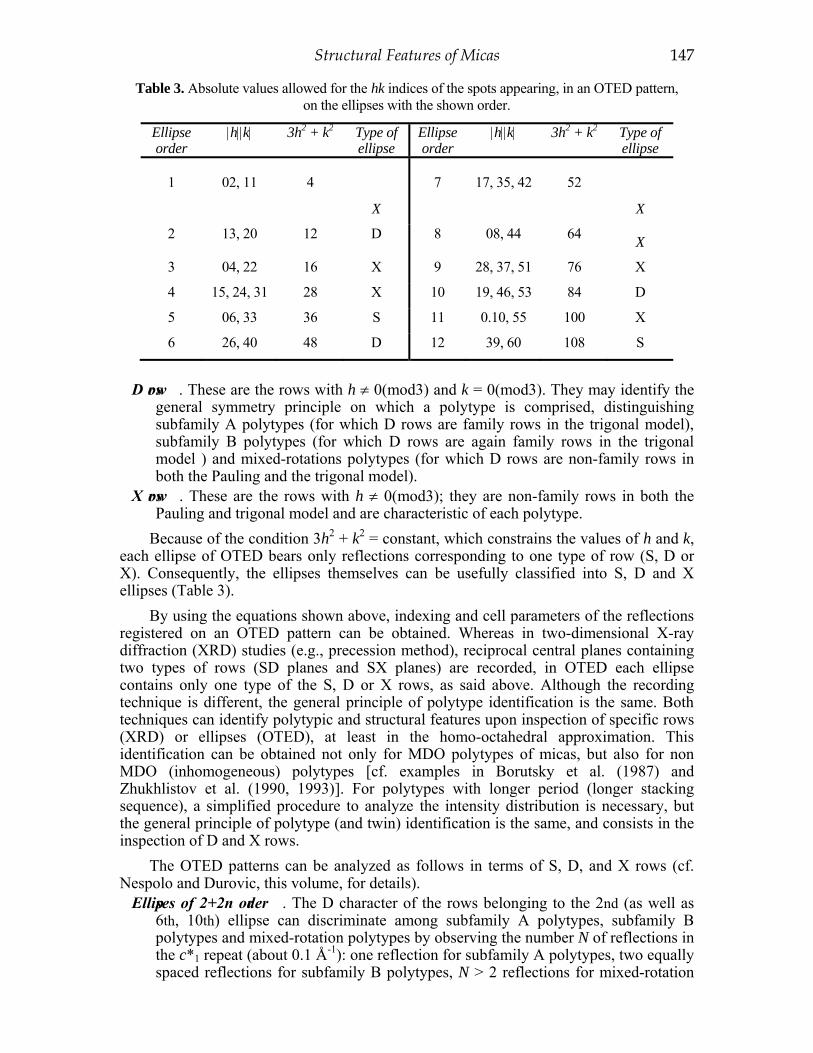
Structural Features of Micas 147
Table 3. Absolute values allowed for the hk indices of the spots appearing, in an OTED pattern, on the ellipses with the shown order.
Ellipse order
|h||k| 3h2 + k2 Type of ellipse
Ellipse order
|h||k| 3h2 + k2 Type of ellipse
1
02, 11
4
X
7 17, 35, 42
52
X 2 13, 20 12 D 8 08, 44 64 X 3 04, 22 16 X 9 28, 37, 51 76 X
4 15, 24, 31 28 X 10 19, 46, 53 84 D
5 06, 33 36 S 11 0.10, 55 100 X
6 26, 40 48 D 12 39, 60 108 S
D rows . These are the rows with h ≠ 0(mod3) and k = 0(mod3). They may identify the general symmetry principle on which a polytype is comprised, distinguishing subfamily A polytypes (for which D rows are family rows in the trigonal model), subfamily B polytypes (for which D rows are again family rows in the trigonal model ) and mixed-rotations polytypes (for which D rows are non-family rows in both the Pauling and the trigonal model).
X rows . These are the rows with h ≠ 0(mod3); they are non-family rows in both the Pauling and trigonal model and are characteristic of each polytype.
Because of the condition 3h2 + k2 = constant, which constrains the values of h and k, each ellipse of OTED bears only reflections corresponding to one type of row (S, D or X). Consequently, the ellipses themselves can be usefully classified into S, D and X ellipses (Table 3).
By using the equations shown above, indexing and cell parameters of the reflections registered on an OTED pattern can be obtained. Whereas in two-dimensional X-ray diffraction (XRD) studies (e.g., precession method), reciprocal central planes containing two types of rows (SD planes and SX planes) are recorded, in OTED each ellipse contains only one type of the S, D or X rows, as said above. Although the recording technique is different, the general principle of polytype identification is the same. Both techniques can identify polytypic and structural features upon inspection of specific rows (XRD) or ellipses (OTED), at least in the homo-octahedral approximation. This identification can be obtained not only for MDO polytypes of micas, but also for non MDO (inhomogeneous) polytypes [cf. examples in Borutsky et al. (1987) and Zhukhlistov et al. (1990, 1993)]. For polytypes with longer period (longer stacking sequence), a simplified procedure to analyze the intensity distribution is necessary, but the general principle of polytype (and twin) identification is the same, and consists in the inspection of D and X rows.
The OTED patterns can be analyzed as follows in terms of S, D, and X rows (cf. Nespolo and Durovic, this volume, for details).
Ellipses of 2+2n order . The D character of the rows belonging to the 2nd (as well as 6th, 10th) ellipse can discriminate among subfamily A polytypes, subfamily B polytypes and mixed-rotation polytypes by observing the number N of reflections in the c*1 repeat (about 0.1 Å -1): one reflection for subfamily A polytypes, two equally spaced reflections for subfamily B polytypes, N > 2 reflections for mixed-rotation

148 Ferraris & Ivaldi
polytypes. When indexing the reflections in the unit cell of a polytype, they correspond to the following presence criteria for the index l: 1M (no systematic absences of l), 2M1 (l = 2n), 3T (l = 3n), 2M2 (no absences of l), 2O (no absences of l), 6H (l = 3n), mixed-rotation (no absences of l).
X-type ellipses . The intensity distribution in the 1st ellipse (as well as other X-type ellipses) is typical of each mica polytype. Knowing the symmetry principle (subfamily A or B, or mixed-rotation, revealed by the 2nd ellipse) helps to obtain the stacking sequence from the intensity distribution in the 1st ellipse. Because the X rows are non-family rows in both the Pauling and trigonal model, the computation of the intensities in the X-type ellipses, to be compared with those experimentally measured, can be performed even in the simplest Pauling model.
Other ellipses . The intensity distribution on the 6th and 7th ellipses (and on the 2nd ellipse in some cases) can distinguish between di- and trioctahedral phyllosilicates (Zvyagin 1993). The ditrigonal rotation α is most effective in influencing the diffraction intensities of the 2nd ellipse (Weiss and Wiewióra 1986; Weiss and Rieder 1997).
Rieder and Weiss (1991) have extended the method to XRD. In this case, however, because of the large curvature of the Ewald sphere (wavelength ∼1 Å) the reflections are no longer on ellipses and concentrated at low diffraction angles. Presumably, a synchrotron source could provide sufficiently short wavelengths to make XRD closer to OTED.
ACKNOWLEDGMENTS Discussions with M. Nespolo (University of Nancy) greatly influenced this chapter.
Useful suggestions came from S. V. Soboleva (IGEM, Moscow). Constructive comments have been provided by the referees, S. Guggenheim and M. Rieder. Research was financially supported by MURST (‘Layer silicates: Crystal chemical, structural and petrologic aspects’ project) and CNR (‘Igneous and metamorphic micas’ project).
REFERENCES Abbott RN Jr, Burnham CW (1988) Polytypism in micas: A polyhedral approach to energy calculations.
Am Mineral 73:105-118 Amisano Canesi A, Chiari G, Ferraris G, Ivaldi G, Soboleva SV (1994) Muscovite- and phengite-3T: Crystal
structure and conditions of formation. Eur J Mineral 6:489-496. Appelo CA (1978) Layer deformation and crystal energy of micas and related minerals. I. Structural model for
1M and 2M1 polytypes. Am Mineral 63:782-792 Appelo CA (1979) Layer deformation and crystal energy of micas and related minerals. II. Deformation of the
coordination units. Am Mineral 64:424-431 Arnold H (1996) Transformations in crystallography. In Th Hahn (ed) International Tables for Crystallography,
Vol A. Kluwer Academic Publishers, Dordrecht, The Netherlands, 69-80 p Bailey SW (1975) Cation ordering and pseudosymmetry in layer silicates. Am Mineral 60:175-187 Bailey SW (1980) Structures of layer silicates. In GW Brindley, G Brown (eds) Crystal Structures of Clay
Minerals and Their X-ray Identification. Mineralogical Society, London, 1-123 p Bailey SW (1984a) Classification and structures of the micas. Rev Mineral 13:1-12 Bailey SW (1984b) Crystal chemistry of the true micas. Rev Mineral 13:13-61 Bailey SW (1984c) Review of cation ordering in micas. Clays Clay Minerals 32:81-92 Bailey SW (1988) X-ray diffraction identification of the polytypes of mica, serepentine, and chlorite. Clays
Clay Minerals 36:193-213 Baronnet A (1997) Equilibrium and kinetic processes for polytype and polysome generation. In S Merlino (ed)
Modular Aspects of Minerals. Eur Mineral Union Notes in Mineralogy 1:119-152 Belov NV (1949) The twin laws of micas and micaceous minerals. Mineral sb L’vovsk geol obva pri univ 3:29-
40 (in Russian)

Structural Features of Micas 149
Bloch AM, Zhukhlistov AP, Zvyagin BB (1990) Centrosymmetric and noncentrosymmetric one-layer polytypes of metasomatic sericites in the upper Devon of the Tuva Through. Abstracts of the 15th general Int’l Mineral Assoc Meeting (Beijing China) 1:297
Borutsky BE, Soboleva SV, Golovanova TI (1987) Three-layer 3Tc1 biotite from the Khibiny pluton. Dokl Acad Sci SSSR 294:141-143
Brigatti MF, Frigeri P, Poppi L (1998) Crystal chemistry of Mg,Fe-bearing muscovites 2M1. Am Mineral 83:775-785
Brigatti MF, Galli E, Medici L, Poppi L, Cibin G, Marcelli A, Mottana A (2001) Chromium-containing muscovite: Crystal chemistry and XANES spectroscopy. Eur J Mineral 13:377-389
Brigatti MF, Lugli C, Poppi L, Foord EE, DE Kile (2000) Crystal chemical variations in Li- and Fe-rich micas from Pikes Peak batholith (central Colorado). Am Mineral 85:1275-1286
Brown BE (1978) The crystal structure of a 3I lepidolite. Am Mineral 63:332-336 Burchard M (2000) Phengite chemistry in a S-type granitic system: Evidence for a new mica substitution.
J Conf Abstr (EMPG-VIII) 5:20 Buseck PR (ed) (1992) Minerals and Reactions at the Atomic Scale: Transmission Electron Microscopy. Rev
Mineral 27, 508 p Catti M, Ferraris G, Ivaldi G (1989) Thermal strain analysis in the crystal structure of muscovite at 700°C. Eur
J Mineral 1:625-632 Christiansen CC, Makovicky E, Johnsen ON (1999) Homology and typism in heterophyllosilicates: An
alternative approach. N Jahrb Mineral Abh 175:153-189 Comodi P, Zanazzi PF (1995) High-pressure structural study of muscovite. Phys Chem Minerals 22:170-177 Donnay G, Donnay JDH, Takeda H (1964) Trioctahedral one-layer micas. II. Prediction of the structure from
composition and cell dimensions. Acta Crystallogr 17:1374-1381 Dornberger-Schiff K (1959) On the nomenclature of the 80 plane groups in the three dimensions. Acta
Crystallogr 12:173 Dornberger-Schiff K, Backhaus KO, Durovic S (1982) Polytypism of micas: OD-interpretation, stacking
symbols, symmetry relations. Clays Clay Minerals 30:364-374 Durovic S (1979) Desymmetrization of OD structures. Krist Tech 14:1047-1053 Durovic S (1994) Classification of phyllosilicates according to the symmetry of their octahedral sheets.
Ceramics-Silikáty 38:81-84 Durovic S, Weiss Z, Backhaus KO (1984) Polytypism of micas. II. Classification and abundance of MDO
polytypes. Clays Clay Minerals 32:454-474 Ferraris C, Chopin C, Wessicken R (2000) Nano- to microscale-decompression products in ultrahigh-
pressure phengite: HRTEM and AEM study, and some petrological implications. Am Mineral 85:1195-1201
Ferraris C, Grobety B, Wessicken R. (2001a) Phlogopite exsolutions within muscovite: a first evidence for a higher-temperature re-equilibrium studied by HRTEM and AEM techniques. Eur J Mineral 13:15-26
Ferraris G (1997) Polysomatism as a tool for correlating properties and structure. In S Merlino (ed) Modular Aspects of Minerals. Eur Mineral Union Notes in Mineralogy 1:275-295
Ferraris G (2002). Mineral and inorganic crystals. In G Giacovazzo (ed.) Fundamentals of Crystal-lography. Oxford University Press, Oxford, UK, p 503-584
Ferraris G, Belluso E, Gula A., Soboleva SV, Ageeva OA, Borutskii, BE (2001b) A structural model of the layer titanosilicate bornemanite based on seidozerite and lomonosovite modules. Can Mineral 39: 1667-1675
Ferraris G, Gula A, Ivaldi G, Nespolo M, Sokolova E, Uvarova Y, Khomyakov AP (2001c) First structure determination of an MDO-2O mica polytype associated with a 1M polytype. Eur J Mineral 13: 1013-1023
Ferraris G, Ivaldi G (1993) Ipotesi di correlazioni tra caratteristiche strutturali e condizioni genetiche di muscovite e fengite. Plinius 10:149-150
Ferraris G, Ivaldi G (1994a) Some new hypothesis on the structural control of polytypes in micas. EMPG-V Abstr suppl No 1 to TERRA nova 6:52
Ferraris G, Ivaldi G (1994b) Forze di legame e variazioni strutturali in funzione di pressione, temperatura e composizione in miche diottaedriche. XXIV Meeting Italian Crystallogr Assoc Abstr p 125-126
Ferraris G, Ivaldi G, Khomyakov AP, Soboleva SV, Belluso E, Pavese A (1996) Nafertisite, a layer titanosilicate member of a polysomatic series including mica. Eur J Mineral 8:241-249
Ferraris G, Ivaldi G, Nespolo, M Takeda H (1995) On the stability of dioctahedral micas. EUG-8 Abstr suppl No 1 to TERRA nova 7:289
Ferraris G, Ivaldi G, Pushcharovsky DYu, Zubkova N, Pekov I (2001d) The crystal structure of delindeite, Ba2{(Na,K, )3(Ti,Fe)[Ti2(O,OH)4Si4O14](H2O,OH)2}, a member of the mero-plesiotype bafertisite series. Can Mineral 39:1306-1316

150 Ferraris & Ivaldi
Ferraris G, Khomyakov AP, Belluso E, Soboleva SV (1997) Polysomatic relationships in some titanosilicates occurring in the hyperagpaitic alkaline rocks of the Kola Peninsula, Russia. Proc 30th Int’l Geol Congr (Mineralogy vol) 16:17-27
Ferraris G, Khomyakov AP, Belluso E, Soboleva SV (1998) Kalifersite, a new alkaline silicate from Kola Peninsula (Russia) based on a palygorskite-sepiolite polysomatic series. Eur J Mineral 10:865-874
Filut MA, Rule AC, Bailey SW (1985) Crystal structure refinement of anandite-2Or, a barium- and sulfur-bearing trioctahedral mica. Am Mineral 70:1298-1308
Franzini M (1969) The A and B mica layers and the crystal structure of sheet silicates. Contrib Mineral Petrol 21:203-224
Giuseppetti G, Tadini C (1972) The crystal structure of 2O brittle mica: Anandite. Tschermaks mineral petrogr Mitt 18:169-184
Griffen DT (1992) Silicate Crystal Chemistry. Oxford University Press, Oxford, UK Guan Ya S, Simonov VI, Belov NV (1963) Crystal structure of bafertisite, BaFe2TiO[Si2O7](OH)2. Dokl Acad
Nauk SSSR 149:1416-1419 (in Russian) Guggenheim S (1981) Cation ordering in lepidolite. Am Mineral 66:1221-1232 Guggenheim S, Bailey SW (1977) The refinement of zinnwaldite-1M in subgroup symmetry. Am Mineral
62:1158-1167 Guggenheim S, Chang YH, Koster Van Groos AF (1987) Muscovite dehydroxylation: high-temperature
studies. Am Mineral 72:537-550 Guggenheim S, Eggleton RA (1987) Modulated 2:1 layer silicates: Review, systematics, and predictions. Am
Mineral 72:724-738 Guggenheim S, Eggleton RA (1988) Crystal chemistry, classification, and identification of modulated layer
silicates: Review, systematics, and predictions. Rev Mineral 19:675-725Guidotti CV, Sassi FP, Comodi P, Zanazzi PF, Blencoe JG (2000) The contrasting responses of muscovite and paragonite to increasing pressure: Petrological implications. Can Mineral 38:707-712
Güven N (1971) Structural factors controlling stacking se quences in dioctahderal micas. Clays Clay Minerals 19:159-165
Hazen RM, Burnham CW (1973) The crystal structure of one layer phlogopite and annite. Am Mineral 58:889-900
Hazen RM, Finger LW (1982) Comparative Crystal Chemistry. John Wiley and Sons, New York Hoppe R (1979) Effective coordination numbers (ECoN) and mean fictive ionic radii (MEFIR).
Z Kristallogr 150:23-52 Hoppe R, Voigt S, Glaum H, Kissel J, Müller HP, Bernet K (1989) A new route to charge distribution in
ionic solids. J Less-Common Metals 156:105-122 Hybler J, Petrícek V, Durovic S, and Smrcok L (2000) Refinement of the crystal structure of cronstedtite-
1T. Clays Clay Minerals 48:331-338 Ivaldi G, Ferraris G, Curetti N (2001a) Crystal structure paths to a phengite geobarometer? EUG XI, J Conf
Abstr 6:540 Ivaldi G, Ferraris G, Curetti N, Compagnoni R (2001b) Coexisting 3T and 2M1 polytypes in a phengite
from Cima Pal (Val Savenca, western Alps): Chemical and polytypic zoning and structural characterisation. Eur J Mineral 13:1025-1034
Ivaldi G, Pischedda V, Ferraris G (1998) Evoluzione termica di una flogopite 1M contenente bario. XXVIII Meeting Italian Crystallogr Assoc Abstr M3-15
Khomyakov AP (1995) Mineralogy of Hyperagpaitic Alkaline Rocks. Clarendon Press, Oxford, UK Lee JH, Guggenheim S (1981) Single crystal X-ray refinement of pyrophyllite-1Tc. Am Mineral 66:
350-357 Lin IC, Guggenheim S (1983) The crystal structure of a Li,Be-rich brittle mica: A dioctahedral-
trioctahedral intermediate. Am Mineral 68:130-142 Makovicky E (1997) Modularity—different approaches. In S Merlino (ed) Modular Aspects of Minerals. Eur
Mineral Union Notes in Mineralogy 1:315-343 Massonne HJ, Schreyer W (1986) High-pressure synthesis and X-ray properties of white micas in the system
K2O-Mg-Al2O3-SiO2-H2O. N Jahrb Mineral Abh 153:177-215 Massonne HJ, Schreyer W (1989) Stability field of the high-pressure assemblage talc + phengite and two new
phengite barometers. Eur J Mineral 1:391-410 McCauley JW, Newnham RE (1971) Origin and prediction of ditrigonal distortions in micas. Am Mineral
56:1626-1638 Mellini M (1982) The crystal structure of lizardite 1T: Hydrogen bonds and polytypism. Am Mineral 67:
587-598 Mellini M, Zanazzi PF (1989) Effects of pressure on the structure of lizardite-1T. Eur J Mineral 1:13-19 Merlino S (ed) (1997) Modular Aspects of Minerals. Eötvös University Press / European Mineralogical Union,
Budapest, 448 p

Structural Features of Micas 151
Mizota T, Kato T, Harada K (1986) The crystal structure of masutomilite, Mn-analogue of zinnwaldite. Mineral J (Japan) 13:13-21
Nespolo M (2001) Perturbative theory of mica polytypism. Role of the M2 layer in the formation of inhomogeneous polytypes. Clays Clay Minerals 49:1-23
Nespolo M, Ferraris G (2001) Effects of the stacking faults on the calculated electron density of mica polytypes —The Durovic effect. Eur J Mineral 13:1035-1045
Nespolo M, Ferraris G, Ivaldi G, Hoppe R (2001) Charge Distribution as a tool to investigate structural details. II. Extension to hydrogen bonds, distorted and hetero-ligand polyhedra. Acta Crystallogr B57:652-664
Nespolo M, Ferraris G, Ohashi H (1999a) Charge Distribution as a tool to investigate structural details: Meaning and application to pyroxenes. Acta Crystallogr B55:902-916
Nespolo M, Ferraris G, Takeda H (2000) Twins and allotwins of basic mica polytypes: Theoretical derivation and identification in the reciprocal space. Acta Crystallogr A56:132-148
Nespolo M, Ferraris G, Takeda H, Takéuchi Y (1999b) Plesiotwinning: oriented crystal associations based on a large coincidence-site lattice. Z Crystallogr 214:378-382
Nespolo M, Takeda H, Ferraris, G (1997a) Crystallography of mica polytypes. In S Merlino (ed) Modular Aspects of Minerals. Eur Mineral Union Notes in Mineralogy 1:81-118
Nespolo M, Takeda H, Ferraris, G (1998) Representation of the axial settings of mica polytypes. Acta Crystallogr A54:348-356
Nespolo M, Takeda H, Ferraris G, Kogure T (1997b) Composite twins of 1M mica: Derivation and identification. Mineral J (Japan) 19:173-186
Nespolo M, Takeda H, Kogure T, Ferraris G (1999c) Periodic intensity distribution (PID) of mica polytypes: Symbolism, structural model orientation and axial settings. Acta Crystallogr A55:659-676
Newnham RE (1961) A refinement of the dickite structure and some remarks on polymorphism of the kaolin minerals. Mineral Mag 32:683-704
Nickel HN, Grice JD (1998) The IMA commission on new minerals and mineral names: Procedures and guidelines on mineral nomenclature, 1998. Can Mineral 36:913-926
Ohta T, Takeda H, Takéuchi Y (1982) Mica polytypism: Similarities in the crystal structures of coexisting 1M and 2M1 oxybiotite. Am Mineral 67:298-310
Pauling L (1930) The structure of micas and related minerals. Proc Nat Acad Sci (USA) 16:123-129 Pavese A, Curetti N, Ferraris G, Ivaldi G, Russo U, Ibberson R (2002) Deprotonation and order-disorder
reactions as a function of temperature in a phengite 3T (Cima Pal, western Alps) by neutron diffraction and Mössbauer spectroscopy. Eur J Mineral 13, submitted
Pavese A, Ferraris G, Pischedda V, Fauth F (2001) M1-site occupancy in 3T and 2M1 phengites by low temperature neutron powder diffraction: Reality or artefact? Eur J Mineral 13:1071-1078
Pavese A, Ferraris G, Pischedda V, Ibberson R (1999a) Tetrahedral order in phengite 2M1 upon heating, from powder neutron diffraction, and thermodynamic consequences. Eur J Mineral 11:309-320
Pavese A, Ferraris G, Pischedda V, Mezouar M (1999b) Synchrotron powder diffraction study of phengite-3T from the Dora Maira massif: P-V-T equation of state and petrological consequences. Phys Chem Minerals 26:460-467
Pavese A, Ferraris G, Pischedda V, Radaelli P (2000) Further study of the cation ordering in phengite-3T by neutron powder diffraction. Mineral Mag 64:11-18
Pavese A, Ferraris G, Prencipe M, Ibberson R (1997) Cation site ordering in phengite-3T from the Dora Maira massif (western Alps): A variable-temperature neutron powder diffraction study. Eur J Mineral 9:1183-1190
Pen ZZ, Shen TC (1963) Crystal structure of bafertisite, a new mineral from China. Scientia Sinica 12:278-280 (in Russian)
Pinsker ZG (1953) Electron Diffraction. Butterworth, London Radoslovich EW (1960) The structure of muscovite, KAl2(Si3Al)O10(OH)2. Acta Crystallogr 13:919-932 Radoslovich EW (1961) Surface symmetry and cell dimensions of layer-lattice silicates. Nature 191:67-68 Radoslovich EW, Norrish K (1962) The cell dimensions and symmetry of layer-lattice silicates. I. Some
structural considerations. Am Mineral 47:599-616 Rastsvetaeva RK, Tamazyan RA, Sokolova EV, Belakovskii DI (1991) Crystal structures of two modifications
of natural Ba, Mn-titanosilicate. Sov Phys Crystallogr 36:186-189 Rieder M (2001) Mineral nomenclature in the mica group: the promise and the reality. Eur J Mineral
13:1009-1012 Rieder M, Cavazzini G, D’yakonov YuS, Frank-Kamenetskii VA, Gottardi G, Guggenheim S, Koval’ PV,
Müller G, Neiva AMR, Radoslowich EW, Robert JL, Sassi FP, Takeda H, Weiss Z, Wones DR (1998) Nomenclature of the micas. Can Mineral 36:905-912
Rieder M, Hybler J, Smrcok L, Weiss Z (1996) Refinement of the crystal structure of zinnwaldite 2M1. Eur J Mineral 8:1241-1248

152 Ferraris & Ivaldi
Rieder M, Weiss Z (1991) Oblique-texture photographs: More information from powder diffraction. Z Kristallogr 197:107-114
Russel RL, Guggenheim S. (1999) Crystal structures of near-end-member phlogopite at high temperature and heat-treated Fe-rich phlogopite: The influence of the O, OH, F site. Can Mineral 37:711-720
Sassi PF, Guidotti C, Rieder M, De Pieri R (1994) On the occurrence of metamorphic 2M1 phengites: Some thoughts on polytypism and crystallization conditions of 3T phengites. Eur J Mineral 6:151-160
Schmidt MW, Dugnani M, Artioli G (2001) Synthesis and characterization of white micas in the join muscovite-aluminoceladonite. Am Mineral 86:555-565
Shannon RD (1976) Revised ionic radii and systematic studies of interatomic distances in halides and oxides Acta Crystallogr A32:751-767
Slade PG, Schultz PK, Dean C (1987) Refinement of the ephesite structure in C1 symmetry. N Jahrb Mineral Monatsh, p 275-287
Smith JV, Yoder HS (1956) Experimental and theoretical studies of the mica polymorphs. Mineral Mag 31:209-235
Smyth JR, Jacobsen SD, Swope RJ, Angel RJ, Arlt T, Domanik K, Holloway JR (2000) Crystal structures and compressibility of synthetic 2M1 and 3T phengite micas. Eur J Mineral 12:955-963
Soboleva SV (1987) Mica polytypes: Theoretical and applied aspects. Mineral J (Ukraine) 9:26-41 Takeda H, Burnham CW (1969) Fluor-polylithionite: A lithium mica with nearly hexagonal (Si2O5)2- ring.
Mineral J (Japan) 6:102-109 Takeda H, Haga N, Sadanaga R (1971) Structural investigation of polymorphic transition between 2M2-,
1M-lepidolite and 2M1 muscovite. Mineral J (Japan) 6:203-215 Takeda H, Morosin B (1975) Comparison of observed and predicted parameters of mica at high
temperature. Acta Crystallogr B31:2444-2452 Takéuchi Y, Haga N (1971) Structural transformation of trioctahedral sheet silicates. Slip mechanism of
octahedral sheets and polytypic changes of micas. Mineral Soc Japan Spec Paper 1:74-87 (Proc IMA-IAGOD Meetings '70, IMA Vol)
Takéuchi Y, Sadanaga R (1959) The crystal structure of xanthophyllite. Acta Crystallogr 12:945-946 Thompson JB Jr (1978) Biopyriboles and polysomatic series. Am Mineral 63:239 Toraya H (1981) Distorsion of octahedra and octahedral sheets in 1M micas and the relation to their stability.
Z Kristallogr 157:173-190 Vainshtein BK (1956) Structure Analysis by Electron Diffraction. Akad Nauk SSSR, Moscow (in Russian) Vainshtein BK (1964) Structure Analysis by Electron Diffraction. Pergamon, Oxford, UK Vainshtein BK, Zvyagin BB, Avilov AS (1992) Electron Diffraction Techniques. Vol 1. Oxford University
Press, Oxford, UK Verma AJ, Krishna P (1966) Polymorphism and Polytypism in Crystals. Wiley, New York Weiss Z, Rieder M (1997) Distortions of coordination polyhedra in phyllosilicates and their diffraction pattern.
11th Int’l Clay Conf Abstr, p A82 Weiss A, Rieder M, Chmielová M (1992) Deformation of coordination polyhedra and their sheets in
phyllosilicates. Eur J Mineral 4:665-682 Weiss Z, Rieder M, Chmielová M, Krajícek J (1985) Geometry of the octahedral coordination in micas: A
review of refined structures. Am Mineral 70:747-757 Weiss Z, Wiewióra A (1986) Polytypism of micas. III: X-ray diffraction identification. Clays Clay Minerals
34:53-68 Woodrow PJ (1967) The crystal structure of astrophyllite. Acta Crystallogr 22:673-678 Zhukhlistov AP, Avilov AS, Ferraris G, Zvyagin BB, Plotnikov VP (1997) Statistical distribution of hydrogen
over three positions in the brucite Mg(OH)2 structure from electron diffractometry data. Crystallogr Rep 42:774-777
Zhukhlistov AP, Dragulescu EM, Rusinov VL, Kovalenker VA, Zvyagin BB, Kuz’mina OV (1996) Sericite with a non-centrosymmetric structure from the gold-silver base metal deposit Banská Stiavnika (Slovakia). Zap Vseross Min Obshch (Proc Russian Mineral Soc) 125:47-54 (in Russian)
Zhukhlistov AP, Litsarev MA, Fin’ko VI (1993) First find of a six-layered triclinic 6Tc polytype of a Ti-oxybiotite. Dokl Acad Sci SSSR 329:188-194 (in Russian)
Zhukhlistov AP, Zyagin BB (1991) The efficiency of electron diffraction in revealing 2:1 layer differing in structure and symmetry, found in dioctahedral micas and smectites. Proc 7th Euroclay Conf, Dresden, p 1211-1212
Zhukhlistov AP, Zvyagin BB, Pavlishin VI (1990) Polytypic 4M modification of Ti-biotite with non uniform alternation of layers, and its appearance in electron-diffraction patterns from textures. Sov Phys Crystallogr 35:232-236
Zhukhlistov AP, Zvyagin BB, Soboleva SV, Fedotov AF (1973) The crystal structure of the dioctahedral mica 2M2 determined by high voltage electron diffraction. Clays Clay Minerals 21:465-470.

Structural Features of Micas 153
Zvyagin BB (1967) Electron-diffraction Analysis of Clay Mineral Structures. Plenum Press, New York Zvyagin BB (1988) Polytypism of crystal structures. Comp Math Applic 16:569-591 Zvyagin BB (1993) Electron diffraction analysis of minerals. MSA 23:66-79 Zvyagin BB, Rabotnov VT, Sidorenko OV, Kotel’nikov, DD (1985) Unique mica built of non-
centrosymmetrical layers. Izvestia Akad Nauk SSSR (ser Geol) 5:121-124 (in Russian) Zvyagin BB, Vrublevskaya ZV, Zhukhlistov AP, Sidorenko OV, Soboleva SV, Fedorov AF (1979) High-
voltage electron diffraction in the study of layered minerals. Nauka, Moscow (in Russian) Zvyagin BB, Zhukhlistov AP, Plotnikov VP (1996) Advances in electron diffraction of minerals. In VI
Simonov Structural studies of minerals. Nauka, Moscow, 225-234 p (in Russian)

1529-6466/02/0046-0004$15.00 DOI:10.2138/rmg.2002.46.04
4 Crystallographic basis of Polytypism and Twinning in Micas
Massimo Nespolo LCM3B, UMR, CNRS 7036
Université Henri Poincaré Nancy 1, BP 239 F54506 Vandoeuvre-les-Nancy cedex, France
Slavomil Ďurovič Slovak Academy of Sciences
Institute of Inorganic Chemistry; Department of Theoretical Chemistry Dúbravská cesta, 9; SK-842 36 Bratislava, Slovakia
INTRODUCTION Although the investigation of micas dates back to the pre-scientific era (see Cipriani,
this volume), the idea of polytypism (originally not distinguished from “polymorphism”) in the micas did not ensue until 1934, when Pauling proposed it in a private conversation quoted by Hendricks and Jefferson (1939). The existence of several structural types was however known from goniometric measurements and morphological analysis performed in the 19th century (e.g., Marignac 1847; Baumhauer 1900) and collected in the 4th volume of the Atlas der Krystallformen (Goldschmidt 1918; for a comparative review and later measurements see Peacock and Ferguson 1943) and appears also in the different axial settings introduced to describe the unit cell of micas (e.g., Brooke and Miller 1852; Des Cloizeaux 1862; Koksharov 1875; Tschermak 1878).
The systematic investigation by X-ray diffraction (XRD) started with Mauguin (1927, 1928), who pointed out that the c axis of phlogopite was half that of muscovite. Pauling (1930) was the first to solve the structure of a mica, a fuchsite (now termed “chromian muscovite”, according to Rieder et al. 1998), by visual comparison of a subset of intensities from photographs, and introduced the first model of the structure of phyllosilicates on the basis of the coordination theory. Jackson and West (1931) were the first to perform a complete structure determination, investigating a muscovite-2M1. Hendricks and Jefferson (1939) investigated one hundred samples of micas and discovered several “polymorphs”, many of which were however twins of simpler structural types (shorter-period polytypes). The symmetry of the 2:1 mica layer was not fully recognized until Pabst (1955) showed that the correct space-group type of 1M polytype was C2/m instead than Cm, as previously assumed by Hendricks and Jefferson (1939) and reported also by Peacock and Ferguson (1943). Since the accomplishment of such an apparently easy task as the determination of the structure of the single-layer polytype took so long time and so much effort, it is not surprising that the whole phenomenon of polytypism in micas occupied several researchers from different countries for a long run of time, and still keeps undisclosed some of its most interesting and challenging points.
Although the causes of the complexity of the phenomenon of polytypism in micas are multifaceted, they can be simplified to “magic words”, local (partial) symmetry, and a “magic number”, 3. As shown hereafter, each atomic plane in mica has an ideal symmetry of at least trigonal, which is preserved in each of the two kinds of sheets (tetrahedral and octahedral), but it is reduced to monoclinic when considering the layer as

156 Nespolo & Ďurovič
a unit. The two T sheets of a layer are staggered along c and the amount of the stagger in the (001) projection is ideally |a|/3. For each non-orthogonal polytype an ideally orthogonal multiple cell can always be chosen, with 3-times the periodicity of the polytype in the stacking direction. In the real structure, some of the atoms move slightly from the positions corresponding to the ideal symmetry, but each atomic plane still preserves a trigonal pseudo-symmetry. Then, the (001) projection of the layer stagger deviates more or less from |a|/3, and the multiple cell is close to, but not exactly orthogonal. The magic words and magic number can be traced also in reciprocal space, where the reflections with k = 0(mod 3) reveal the symmetry principle on which a polytype is built, and the reflections with k ≠ 0(mod 3) permit the identification of the stacking sequence.
The existence of a multiple cell with a metric pseudo-symmetry higher than the structural symmetry, together with the trigonal pseudo-symmetry of the planes of the basal oxygen atoms, is also the geometrical reason of the extensive occurrence of twinning in micas. Although polytypism and twinning can be reduced to relatively simple common geometrical bases, the development of general criteria to recognize the presence of twinning from the diffraction pattern took a long time, and still many questions remain open.
The purpose of this chapter is to give a general overview of the factors, in terms of lattice geometry and of symmetry, which are responsible for polytypism and twinning in micas, and to provide general and simple criteria to be applied in the experimental practice of polytype and twin identification. For this reason, micas are hereafter regarded as built by layer archetypes, i.e. idealized layers where most of the structural distortions are not taken into account. The true atomic structure of the mica layer influences mainly the intensities but not the geometry of the diffraction pattern, and is discussed in detail in Ferraris and Ivaldi (this volume) and in Brigatti and Guggenheim (this volume).
Rigorous mathematical demonstrations are not given here: readers wishing to acquire a deeper knowledge are invited to consult the original publications, quoted hereinafter, where those demonstrations are given in detail. The crystallographic terminology follows Wondratschek (2002).
NOTATION AND DEFINITIONS The geometrical description of mica polytypes is given in terms of the OD theory
developed by Dornberger-Schiff (e.g., 1964) and her successors. OD stands for “Order-Disorder” and indicates that the stacking of layers may produce both periodic (“ordered”) and non-periodic (“disordered”) structures. It has no relation with the chemical order-disorder phenomena. The OD theory emphasizes particularly the role of polytypes which involve pairs, triples, quadruples etc. of geometrically equivalent layers, or, when this is not possible, the smallest number of kinds of triples, quadruples etc. of layers. These polytypes are termed Maximum Degree of Order (MDO) polytypes. The layer-group notation adopted here is the one developed by Dornberger-Schiff (1959), in which the direction of missing periodicity is indicated by parentheses. For example, C12/m(1) indicates a monoclinic holohedral C-centered layer, having (a,b) as the layer plane (for details see Merlino 1990).
The indicative symbols for polytypes were introduced by Ramsdell (1947) and are written as NSn, where N is the number of layers, S indicates the symmetry and n is a sequence number, often (but not always) indicating the order in which polytypes have been discovered. Ramsdell’s symbolism is actually a mixed symbolism, since S (nowadays given with a single uppercase letter according to the IUCr Ad-Hoc committee

Crystallographic Basis of Polytypism and Twinning in Micas 157
recommendations: Guinier et al. 1984) is used to indicate the six crystal families, the trigonal syngony (syngony = crystal system) and the rhombohedral Bravais system: A = anorthic (triclinic), M = monoclinic, O = orthorhombic, Q = quadratic (tetragonal), T = trigonal, R = rhombohedral, H = hexagonal, C = cubic. This mixed symbolism is nowadays preserved for historical reasons and its use is accepted only for indicating polytypes. Q, R and C cannot appear in micas (Takeda 1971).
To classify, but also to identify experimentally, mica polytypes, the relations between a lattice and its derivative lattices (superlattices, sublattices) are of fundamental importance. Different authors have given contrasting definitions. Here, we adopt the definition in terms of the group-subgroup relations, in agreement with the International Tables for Crystallography, Vol. A, 5th ed., in press (Th. Hahn, pers. comm..). Sublattice is termed a derivative lattice obtained from an original lattice by taking a subgroup of translations: its unit cell is larger than that of the original lattice. In contrast, superlattice is termed a lattice obtained from an original lattice by taking a supergroup of translations: its unit cell is smaller than that of the original lattice. Because the derivative lattice obtained from the original one by taking a subgroup (supergroup) of translations has a larger (smaller) unit cell, in some publications the terms superlattice and sublattice are defined in the opposite way. The superlattice-sublattice character of a derivative lattice is inverted when going from one space to its dual (i.e. from direct to reciprocal, or vice versa).
The notations most often used in the following are summarized here for ease of consultation:
The mica layer and its constituents
T: tetrahedral sheet = Ob-Z-Oa or Oa-Z-Ob O: octahedral sheet = Oa-Y-Oa I: plane of the interlayer cations (also: these cations as such). Ob: plane of the basal oxygen atoms of the tetrahedra Oa: plane of the apical oxygen atoms of the tetrahedra; this plane, contains
approximately also OH groups and, depending on the kind of mica, F and, less frequently, Cl and S.
T1,T2: the two translationally independent tetrahedral sites within a T sheet M1,M2,M3: the three translationally independent octahedral sites within an O sheet Ma,Me,Mi: average cations occupying the three translationally independent octahedral
sites (Ma = Maximal; Me = Medium; Mi = Minimal, with reference to their scattering power)
δ(Ma), δ(Me), δ(Mi): X-ray scattering power of the (average) cations Ma,Me,Mi Z: plane of the tetrahedral cations Y: plane of the octahedral cations (whose coordination polyhedra are however not
regular octahedra but rather trigonal antiprisms). Tet: tetrahedral OD layer = Oau-Z-Ob-I-Ob-Z-Oal (l = lower, u = upper; see text) Oc: octahedral OD layer = Oal-Y-Oau p2j: OD packet pointing up = Tet2j/2 + Oc2j+1/2 q2j+1: OD packet pointing down = Oc2j+1/2 + Tet2j+2/2 M: the entire mica layer (T-O-T). There are two types: M1 and M2 depending on the
location (M1 vs. M2/M3) of the origin of the O sheet. Standard character “M” indicates layer, italics “M” indicates cation sites.

158 Nespolo & Ďurovič
Axial settings, indices and lattice parameters
a, b, c: monoclinic crystallographic axes in the space-fixed reference (in italics) a1~6, b1~6, c: monoclinic crystallographic axes in the crystal-fixed reference (in italics) A1, A2, A3, c: hexagonal crystallographic axes (in italics) AF1, AF2, AF3, CF: hexagonal crystallographic axes of the family structure (in italics) a, b, c / a1~6, b1~6, c / A1, A2, A3, c / AF1, AF2, AF3, CF: crystallographic basis vectors
(in bold) C1, C2, C3: the three orthohexagonal cells (Fig. 1; cf. Arnold 2002) cn: the (001) projection of the of the c basis vector c0: vertical distance between two interlayer cations on the opposite sides of an M
layer (c0 = c1cosβ*) c*1 : parameter along c* of the simplest polytype (1M): it corresponds to about 0.1Å-1
HK.L: diffraction indices expressed in hexagonal axes hkl: diffraction indices expressed in orthohexagonal axes lC1: l index in the C1 setting lT: l index in the twin setting ω: obliquity of the twin, divided into a component within the (001) plane (ω||) and a
component normal to the (001) plane (ω⊥) ε: angular deviation from orthohexagonality of the (001) plane η: linear deviation from orthohexagonality of the (001) plane t(hkl): trace of the plane (hkl) onto the (001) plane nt(hkl): normal to t(hkl) in the (001) plane
Symbols
N: number of layers in the conventional cell N′: number of layers in the unit cell of the (pseudo)-orthohexagonal setting: N′ = N
for orthogonal polytypes, N′ = 3N for non-orthogonal polytypes Ti: character (“0”~“5”) indicating the mica OD packet orientation
Figure 1. Relation between the hexagonalcell P and the three orthohexagonal cells C1, C2, C3 (cf. Arnold 2002).

Crystallographic Basis of Polytypism and Twinning in Micas 159
v2j,2j+1: character (“0”~“5”) indicating the displacement between two adjacent mica OD packets p2j and q2j+1
⟨v⟩: the vector assigned to the character v Σv: character (“0”~“5”, “*”, “+”, “–“) indicating vector sum of v2j,2j+1 over a
complete polytype period and corresponding to the projection of the c axis onto the (001) plane
RSiP: i-th Rotational Sequence of the polytype “P”
Ri: i-th translationally independent reciprocal lattice row parallel to c* of the single individual (1 ≤ i ≤ 9).
Ci: i-th “composite row”: translationally independent reciprocal lattice row parallel to c* of the twin (1 ≤ i ≤ 9).
Ij: symbol identifying the “node features” of a row of the reciprocal lattice parallel to c*. I is the number of reflections in the c*1 repeat, j a sequence number.
Symmetry and symmetry operations
λ-symmetry: the symmetry proper of an individual layer (λ-operation: a symmetry operation transforming a layer into itself; the set of λ-operations constitute a layer-group)
σ-symmetry: the symmetry of a layer pair (σ-operation: a coincidence operation transforming a layer into the adjacent one)
τ-operations: symmetry or coincidence operations which do not change the sign of the coordinate in the layer stacking direction. They are labeled λ-τ or σ-τ if they refer to λ- or σ-operations, respectively
ρ-operations: symmetry or coincidence operations which change the sign of the coordinate in the layer stacking direction and thus turn a layer or a stack of layers upside down. They are labeled λ-ρ or σ-ρ if they refer to λ- or σ-operations, respectively. Evidently, τ.τ = τ, τ.ρ = ρ, ρ.τ = ρ and ρ.ρ = τ.
THE UNIT LAYERS OF MICA The conventional layer of mica is described in details in Ferraris and Ivaldi (this
volume). Here we recall only those definitions that are referred to in the following. The conventional layer (also termed TOT layer or 2:1 layer) is constructed of seven
atomic planes: Obl, Zl, Oal, Y, Oau, Zu, Obu, where “l” and “u” stand for “lower” and “upper” respectively. Interlayer cations occurr between two successive layers in the I plane. This layer is referred as the “M layer” and is subdivided into two kinds of sheets: T (Tl: Obl, Zl, Oal, and Tu: Oau, Zu, Obu) , and O (Oal, Y, Oau). On the basis of the occupation of the three octahedral sites, three families of micas exist: homo-octahedral (all three sites are occupied by one type of cation), meso-octahedral (one site is occupied differently from the other two), and hetero-octahedral (all three sites are occupied differently). In these three families the idealized λ-symmetry of the O sheet is H⎯(3)1m, P⎯(3)1m, and P312 respectively (Dornberger-Schiff et al. 1982). Two models were introduced to describe the λ-symmetry of the T sheet: the Pauling model (Pauling 1930), which neglects all the distortions and assumes λ-symmetry P(6)mm; and the Trigonal model, which considers only the ditrigonal rotation of tetrahedra and assumes λ-symmetry P(3)1m. Both these models neglect the distortions occurring in the O sheet. Although the Trigonal model may seem still rather abstract, it is sufficient to describe the diffraction features useful for polytype and twin identification, whereas the Pauling model is too abstract. In fact, the main influence on the conditions for a reflection comes from the ditrigonal rotation of the tetrahedra. The other distortions, not taken into account by the Trigonal model, are quantitatively less relevant; they influence mainly the diffraction

160 Nespolo & Ďurovič
intensities, and to a much lesser degree the geometry of the diffraction pattern; for this reason they can be neglected, in the first approximation.
The stagger of the two T sheets reduces the λ-symmetry of the M layer to monoclinic. Depending on whether the origin of the O sheet (which must be taken at the site with the point symmetry corresponding to the λ-symmetry of the sheet) is in M1 (trans) or in M2/M3 (cis), the layer itself is termed M1 or M2 respectively, and the highest λ-symmetry for these two layers is C12/m(1) and C12(1) respectively (for details see Ferraris and Ivaldi, this volume). The preliminary stage of the experimental study of a mica sample, such as the identification of the polytypic stacking sequence, is normally performed by assuming that the structure is homo-octahedral, and thus in the hypothesis of all M1 layers. For this assumption Nespolo et al (1999d), following a suggestion by S. Ďurovič (pers. comm.), introduced the term homo-octahedral approximation.
Alternative unit layers
Besides the M layer, other unit layers were introduced, in most cases to simplify the description of some features, such as the diffraction pattern.
Amelincks-Dekeyser’s unit layer . Amelinckx and Dekeyser (1953) pioneered the study of the spiral growth of micas. They also introduced the first vectorial and symbolic representation of the stacking sequence of layers in mica polytypes. These authors used a unit cell having the apical oxygen atoms and (OH/F) groups at the boundaries (Fig. 2). In this way, the unit cell is orthogonal and the monoclinic symmetry is achieved by stacking successive cells along three directions making 120º. Although this cell has nowadays no practical importance, it represents the first description alternative to Pauling’s (1930) model and the precursor of the TS unit layers described below.
Franzini and Schiaffino’s A and B layers . Franzini and Schiaffino (1963a,b) assumed that the ditrigonal rotation of the tetrahedra was mainly not related to the misfit of the a and b parameters of the tetrahedral and octahedral sheets, but to an intrinsic tendency of the potassium to assume an octahedral (actually antiprismatic) coordination. Those authors concluded that, with a single type of layer, rotations of (2n+1)×60º were not possible for K-micas. To explain “polymorphs” and twins in which such rotations appear, Franzini and Schiaffino (1963a) introduced two kinds of monolayers, called A and B, in which the antiprismatic coordination for the interlayer cation is preserved for all the six rotations. These two layers differ for the orientation of the octahedral sheet with respect to the tetrahedral sheets: in practice, the slant of the octahedra is reversed in the two layers1. The ordered repetition of layers of the same kind (both A or both B) produces 1M, 2M1 and 3T “polymorphs”, while the alternate repetition of both A and B layers produces 2O, 2M2 and 6H “polymorphs”, however preserving the antiprismatic coordination for the interlayer cation. The co-existence of A and B layers was however regarded as highly improbable (Franzini 1966; 1969). The starting assumption of this theory, namely the impossibility of trigonal prismatic coordination for the interlayer cation, is not correct (Sartori et al. 1973), and the Franzini and Schiaffino theory lost its importance.
Despite that, the terms Franzini-type A and B have found their way into the literature. As Franzini (1969) noted, owing to ditrigonalization, the basal-oxygen atoms in the type A approach the cations in the adjacent octahedral sheet, whereas they move
1 Griffen (1992) described the direction of the ditrigonalization of the T sheets with respect to the triangular bases of the octahedra in terms of the rotations “O” (opposite, corresponding to Franzini-type A of layer) and “S” (same, corresponding to Franzini-type B of layer). This terminology, borrowed from pyroxenes, is commonly not adopted for micas.

Crystallographic Basis of Polytypism and Twinning in Micas 161
apart in type B layers, if compared with the Pauling model. This holds also for phyllosilicates other than micas. Whereas in mica structures refined to date only the type A has been found, the type B has been encountered in some 1:1 phyllosilicates and in some chlorites, where the energetic handicap of the type B is balanced by a more favorable arrangement of hydrogen bonds elsewhere in the structure.
The U layer. The origin of the entire M layer is in the I plane. By shifting the origin into the O sheet, the U-layer (Fig. 2) is obtained and, inside it, a smaller portion, called the u-layer, which does not represent a unit layer but consists of two tetrahedral sheets and the interlayer cations between. These layers were used as a tentative interpretation of the crystallographic transformation of biotites by means either of crystallographic slips (CS) of cation or oxygen planes corresponding to cation-to-cation or oxygen-to-coplane-oxygen distance (CS of the first sort) or of co-operative slip movements of two atomic planes (oxygen-oxygen or oxygen-cation) in a single octahedral sheet (CS of the second
Figure 2. Schematic representation of a slab b/4 thick, showing three layers of the 1M polytype. Four different unit cells are shown: the M layer (solid lines), the U layer (dashed lines), the TS D layer (dotted lines) and the cell used by Amelinckx and Dekeyser (1953) (dotted-dashed lines). The OD layers and packets are indicated directly in the figure.
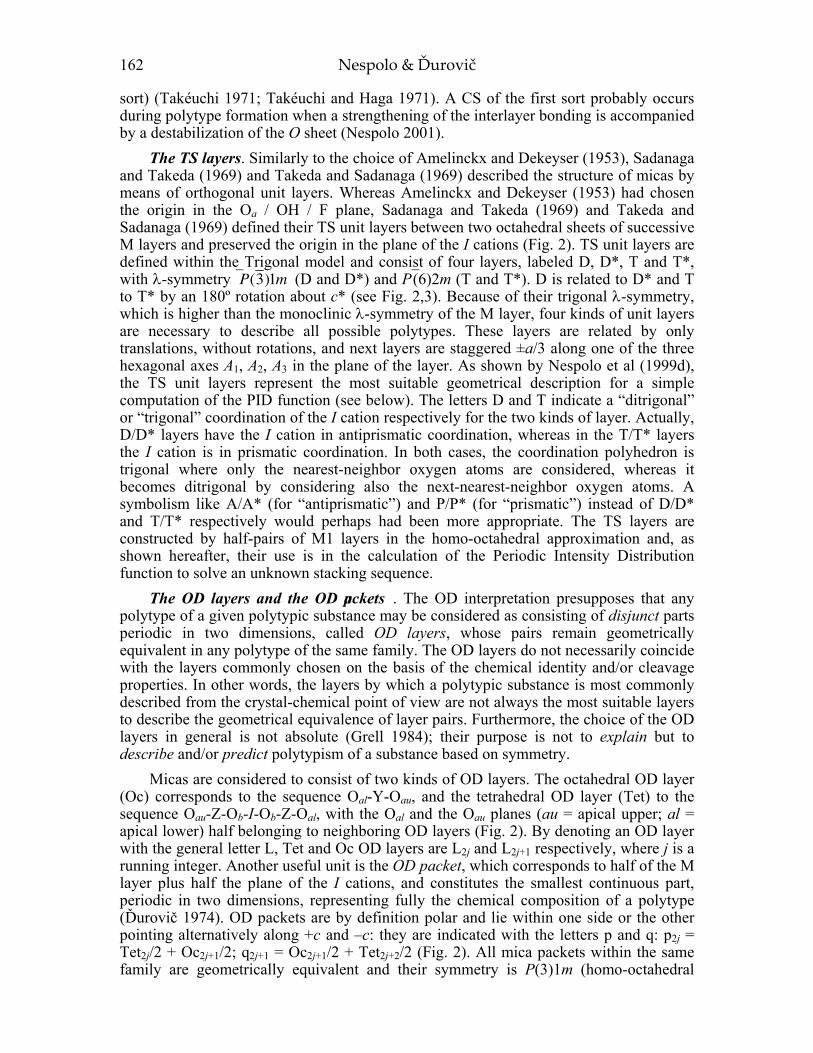
162 Nespolo & Ďurovič
sort) (Takéuchi 1971; Takéuchi and Haga 1971). A CS of the first sort probably occurs during polytype formation when a strengthening of the interlayer bonding is accompanied by a destabilization of the O sheet (Nespolo 2001).
The TS layers. Similarly to the choice of Amelinckx and Dekeyser (1953), Sadanaga and Takeda (1969) and Takeda and Sadanaga (1969) described the structure of micas by means of orthogonal unit layers. Whereas Amelinckx and Dekeyser (1953) had chosen the origin in the Oa / OH / F plane, Sadanaga and Takeda (1969) and Takeda and Sadanaga (1969) defined their TS unit layers between two octahedral sheets of successive M layers and preserved the origin in the plane of the I cations (Fig. 2). TS unit layers are defined within the Trigonal model and consist of four layers, labeled D, D*, T and T*, with λ-symmetry ⎯ (3)1P m (D and D*) and P⎯(6)2m (T and T*). D is related to D* and T to T* by an 180º rotation about c* (see Fig. 2,3). Because of their trigonal λ-symmetry, which is higher than the monoclinic λ-symmetry of the M layer, four kinds of unit layers are necessary to describe all possible polytypes. These layers are related by only translations, without rotations, and next layers are staggered ±a/3 along one of the three hexagonal axes A1, A2, A3 in the plane of the layer. As shown by Nespolo et al (1999d), the TS unit layers represent the most suitable geometrical description for a simple computation of the PID function (see below). The letters D and T indicate a “ditrigonal” or “trigonal” coordination of the I cation respectively for the two kinds of layer. Actually, D/D* layers have the I cation in antiprismatic coordination, whereas in the T/T* layers the I cation is in prismatic coordination. In both cases, the coordination polyhedron is trigonal where only the nearest-neighbor oxygen atoms are considered, whereas it becomes ditrigonal by considering also the next-nearest-neighbor oxygen atoms. A symbolism like A/A* (for “antiprismatic”) and P/P* (for “prismatic”) instead of D/D* and T/T* respectively would perhaps had been more appropriate. The TS layers are constructed by half-pairs of M1 layers in the homo-octahedral approximation and, as shown hereafter, their use is in the calculation of the Periodic Intensity Distribution function to solve an unknown stacking sequence.
The OD layers and the OD packets . The OD interpretation presupposes that any polytype of a given polytypic substance may be considered as consisting of disjunct parts periodic in two dimensions, called OD layers, whose pairs remain geometrically equivalent in any polytype of the same family. The OD layers do not necessarily coincide with the layers commonly chosen on the basis of the chemical identity and/or cleavage properties. In other words, the layers by which a polytypic substance is most commonly described from the crystal-chemical point of view are not always the most suitable layers to describe the geometrical equivalence of layer pairs. Furthermore, the choice of the OD layers in general is not absolute (Grell 1984); their purpose is not to explain but to describe and/or predict polytypism of a substance based on symmetry.
Micas are considered to consist of two kinds of OD layers. The octahedral OD layer (Oc) corresponds to the sequence Oal-Y-Oau, and the tetrahedral OD layer (Tet) to the sequence Oau-Z-Ob-I-Ob-Z-Oal, with the Oal and the Oau planes (au = apical upper; al = apical lower) half belonging to neighboring OD layers (Fig. 2). By denoting an OD layer with the general letter L, Tet and Oc OD layers are L2j and L2j+1 respectively, where j is a running integer. Another useful unit is the OD packet, which corresponds to half of the M layer plus half the plane of the I cations, and constitutes the smallest continuous part, periodic in two dimensions, representing fully the chemical composition of a polytype (Ďurovič 1974). OD packets are by definition polar and lie within one side or the other pointing alternatively along +c and –c: they are indicated with the letters p and q: p2j = Tet2j/2 + Oc2j+1/2; q2j+1 = Oc2j+1/2 + Tet2j+2/2 (Fig. 2). All mica packets within the same family are geometrically equivalent and their symmetry is P(3)1m (homo-octahedral

Crystallographic Basis of Polytypism and Twinning in Micas 163
family), C1m(1) (meso-octahedral family) or C1 (hetero-octahedral family) (Dornberger-Schiff et al. 1982; Backhaus and Ďurovič 1984; Ďurovič, et al. 1984). This reduces the problem of handling two kinds of OD layers to that of one kind of OD packet and this facilitates, among others, also the systematic derivation of MDO polytypes (see below).
Figure 3. The four TS unit layers. a, b: orthohexagonal axes. Black and open small circles represent M1 and M2 sites respectively. Double circles represent interlayer cations and OH/F groups, which are overlapped in the (001) projection. u and l indicate octahedral cations with z = +1/2 and z = -1/2 respectively, overlapped in (001) projection for T and T* layers (modified after Nespolo et al. 1999d).

164 Nespolo & Ďurovič
Furthermore, both M1 and M2 mica layers within the same family consist of the same kind of OD packet.
MICA POLYTYPES AND THEIR CHARACTERIZATION The crystal chemical reason for polytypism is that adjacent layers (two-
dimensionally-periodic units) can be linked to each other in many translationally non-equivalent ways. However, the nearest-neighbor relationships remain preserved. Translated into the language of symmetry, this means that the pairs of adjacent layers remain geometrically equivalent in all polytypes of the same family.
The geometrical equivalence must be fulfilled not necessarily by the real layers, but by their archetypes, i.e. the (partially) idealized layers to which the real layers can be reduced by neglecting some distortions occurring in the true structure. The notion of polytypism becomes thus unequivocal only when it is used in an abstract sense to indicate a structural type with specific geometrical properties. In micas, these archetypes are the layers described by the Trigonal model. Of the several kinds of layers presented in the previous section, the OD layers, and the OD packets, are the most suitable ones to both show and exploit the geometrical equivalence. Micas as OD structures
If the position of a layer is uniquely defined by the position of the adjacent layers and by the so-called vicinity condition (VC)2, which states the geometrical equivalence of layer pairs, the resulting structure is fully ordered. If, on the other hand, more than one position is possible that obeys the VC, the resulting structure is an OD structure and the layers are OD layers. VC structures may thus be either fully ordered structures or OD structures (Dornberger-Schiff 1964, 1966, 1979; see also Ďurovič 1999). All OD structures are polytypic; the reverse may or may not be true (see the arguments in Zvyagin 1993). Equivalency depends on the choice of OD layers and also on the definition of polytypism (see below).
In each of the three mica families, the packet pairs p2jq2j+1 and q2j+1p2j+2 are geometrically equivalent through a ρ-operation of the Oc2j+1 OD layer and of the Tet2j+2 OD layer, respectively. These operations are denoted as 2j,2j+1[ρ(i)] and 2j+1,2j+2[ρ(j)] respectively .The resulting polytype depends on the kind of these operations (they follow from the λ-symmetry of Oc or Tet) and on their sequence in the polytype. Since ρ.ρ = τ and, particularly for OD structures, a product like kl[ρ(i)]·mn[ρ(j)]is allowed only if l=m, each even number of such products, e.g.,
01[ρ (1)]·12[ ρ(2)]· 23[ ρ(3) ]· 34[ρ (4) ]· …. ·2n-1,2n [ρ (2n)] yields a 0,2n[τ]-operation. This operation can be either a translation, a glide operation or a screw rotation, whose translation component is the so-called repeat unit. The τ-operation can be continued, i.e. continuously repeated, and then it generates a periodic polytype. The operation is thus global (total) for the polytype obtained. Of special importance are the 02[τ]-operations which play a decisive role in the derivation of MDO polytypes, as shown below. If the distribution of subsequent ρ−operations is completely random so that no generating τ-operation can be found, the polytype is disordered. Disordered polytypes have been reported as 2n×60º rotations only (e.g., Ross et al. 1966; let us indicate them as 1Md-A, where “A” stands for “subfamily A”) and with both 2n×60º and (2n+1)×60º rotations (Kogure and Nespolo 1999a; let us indicate them as 1Md-M, where “M” stands
2 The vicinity condition (e.g., Dornberger-Schiff 1979) consists of three parts. VC α: VC layers are either geometrically equivalent or, if not, they are relatively few in kind; VC β: translation groups of all VC layers are either identical or they have a common subgroup; VC γ: equivalent sides of equivalent layers are faced by equivalent sides of adjacent layers so that the resulting pairs are equivalent.

Crystallographic Basis of Polytypism and Twinning in Micas 165
for “mixed-rotation”), whereas no examples with (2n+1)×60º rotations only (let us indicate them as 1Md-B, where “B” stands for “subfamily B”) have been reported to date. Note that in periodic polytypes some ρ-operations also become global, whereas the remaining ones are valid only in a subspace of the crystal space. Note also that, alone, a ρ-operation could not be used to construct a polytype, because its repeated application leads back to the area of the starting layer or packet. For more details concerning the OD interpretation of mica structures, see Dornberger-Schiff et al (1982); for the derivation of MDO mica polytypes see Backhaus and Ďurovič (1984); for the classification and abundance of MDO mica polytypes see Ďurovič et al (1984).
The set of all the operations valid in the whole crystal space and in a subspace of the crystal space constitutes a space groupoid (Dornberger-Schiff 1964; Fichtner 1965, 1977, 1980). The theory of groupoids was introduced in mathematics by Brandt (1927) and applied in crystallography in Germany by the OD school (Dornberger-Schiff 1964, 1966), and in Japan by the school of Ito and Sadanaga, with special emphasis on those groupoids, termed twinned space groups, which are necessary to explain the existence of polysynthetic structures (e.g., Ito 1935, 1938, 1950; Ito and Sadanaga 1976; Sadanaga 1978; Sadanaga et al. 1980). The OD school used the terms total for a space-group operation, local or partial (as synonyms) for a symmetry operation valid in a subspace of the crystal space, and coincidence operation, represented by a single transformation matrix, for a non-symmetry operation that corresponds – approximately – to a one-way movement in the structure, i.e. an operation without the corresponding inverse operation. Sadanaga and Ohsumi (1979) and Sadanaga et al (1980) used instead global, local and partial in the same way the OD school used total, local/partial and coincidence respectively. To avoid any possible confusion, hereafter the word “partial” is not adopted, and the term “local” is used to indicate a symmetry operation valid in a subspace of the crystal space.
Within the Pauling model, an isolated Tet layer has λ-symmetry P(6/m)mm, with 12 τ-operations and 12 ρ-operations. Within a group, the three axial and the three inter-axial directions are symmetry-related and thus one entry for each of these two sets in the conventional Hermann-Mauguin symbol suffices to characterize the corresponding symmetry operations. However, in the OD structures, any of these operations can play a specific role and this is why Dornberger-Schiff (1964 p. 44 ff; 1966 p. 54) introduced extended Hermann-Mauguin symbols consisting of seven entries: . . . (.) . . . where the unique direction is in parentheses, the three entries to the left refer to the three axial directions A1, A2, A3 (Fig. 1; cf. Fig. 4) and the three entries to the right refer to the three inter-axial directions B1,B2,B3 where Bi┴Ai. Such an extended Hermann-Mauguin symbol for the layer-group P(6/m)mm reads: P 2/m 2/m 2/m (6/m) 2/m 2/m 2/m
Within the Trigonal model, this λ-symmetry reduces to trigonal. The extended Hermann-Mauguin symbols, depending on which of the two maximal non-isomorphic subgroups is preserved (either (3)1P m or (6)2P m , become: P 1 1 1 (3) 2/m 2/m 2/m and P 2 2 2 (6) m m m.
The individual operations in each of these two groups can be characterized either by the extended Hermann-Mauguin (H-M) symbols (as usual in the OD literature), or with reference to the orthogonal (ORT) axes. Although indexing in the orthohexagonal setting in unequivocal, the correspondence between H-M symbols and ORT symbols depends on which cell is adopted (C1 vs. C2: see Fig. 1). In Table 1, all correspondences are shown.
The two λ-symmetries of the Tet layer correspond to 2n×60º and (2n+1)×60º rotations, respectively, of successive M layers about c*. Each family of polytypes is defined in terms of the λ-symmetry of the Oc layer, which is the same as that of the O

166 Nespolo & Ďurovič
sheet (see Table 2 in Ferraris and Ivaldi, this volume), and is then divided into two subfamilies on the basis of the Tet λ-symmetry: subfamily A for P⎯(3)1m, and subfamily B for (6)2P m . We suggest for the polytypes where Tet layers with both P⎯(3)1m and P⎯(6)2m λ-symmetries co-exist, the term mixed-rotation polytypes (see also Nespolo 1999). Both subfamily A and subfamily B polytypes are OD structures, because the layer stacking obeys the VC. However, the layer stacking in the mixed-rotation polytypes with the geometry of the Trigonal model violates the VC: these polytypes are OD structures only within the Pauling model, i.e. for a null ditrigonal rotation of the tetrahedra (Backhaus and Ďurovič 1984).
Table 1. Extended Hermann-Mauguin (H-M) symbols and corresponding operations indexed in orthogonal (ORT) axes for the two λ-symmetries of the Tet layer within the Trigonal model. The extended H-M symbols consist of seven entries: . . . (.) . . . where the unique direction is in parentheses, the three entries to the left refer to the three axial directions A1, A2, A3 and the three entries to the right refer to the three inter-axial directions B1,B2,B3 (Bi┴Ai). The corresponding orthogonal indices are given with reference to both the C1 and the C2 cells.
P⎯(3)1m
τ-operations ρ-operations
H-M ORT (C1) ORT (C2) H-M ORT (C1) ORT (C2)
1 1 1 ⎯1 ⎯1 ⎯1
(3)-1 3-1[001] 3-1
[001] ⎯(3) –1 ⎯3-1[001] ⎯3-1
[001]
(3)1 31[001] 31
[001] ⎯(3)1 ⎯31[001] ⎯31
[001]
[. . . (.) m . .] m (010) m (110) [. . . (.) 2 . .] 2[010] 2[310]
[. . . (.) . m .] m (110) m (⎯110) [. . . (.) . 2 .] 2[310] 2[⎯310]
[. . . (.) . . m] m (⎯110) m (010) [. . . (.) . . 2] 2[⎯310] 2[010]
P⎯(6)2m
τ-operations ρ-operations
H-M ORT (C1) ORT (C2) H-M ORT (C1) ORT (C2)
1 1 1 ⎯(2)1 m(001) m(001)
(3)-1 3-1[001] 3-1
[001] ⎯(6)–1 ⎯6-1[001] ⎯6-1
[001]
(3)1 31[001] 31
[001] ⎯(6)1 ⎯61[001] ⎯61
[001]
[m . . (.). . .] m (100) m (⎯130) [2 . . (.) . . .] 2[100] 2[⎯110]
[.m . (.) . . .] m (⎯130) m (130) [. 2 . (.) . . .] 2[⎯110] 2[110]
[. . m (.) . . .] m (130) m (100) [. . 2 (.) . . .] 2[110] 2[100]
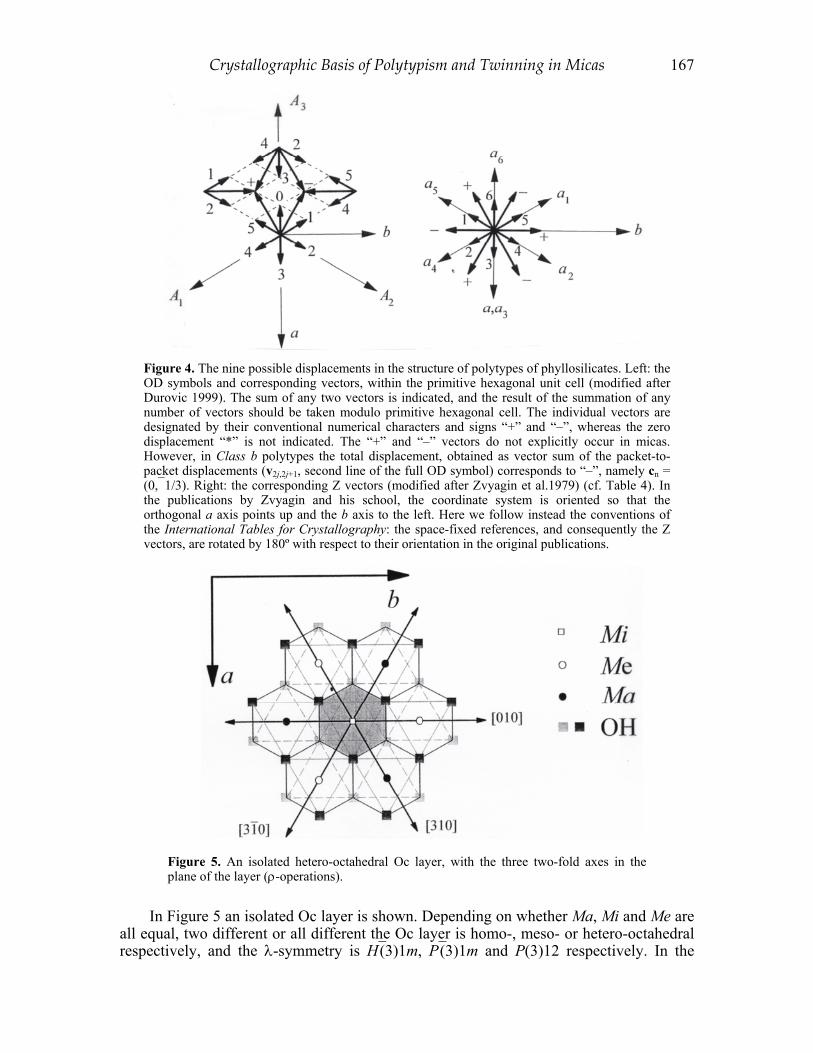
Crystallographic Basis of Polytypism and Twinning in Micas 167
Figure 4. The nine possible displacements in the structure of polytypes of phyllosilicates. Left: the OD symbols and corresponding vectors, within the primitive hexagonal unit cell (modified after Durovic 1999). The sum of any two vectors is indicated, and the result of the summation of any number of vectors should be taken modulo primitive hexagonal cell. The individual vectors are designated by their conventional numerical characters and signs “+” and “–”, whereas the zero displacement “*” is not indicated. The “+” and “–” vectors do not explicitly occur in micas. However, in Class b polytypes the total displacement, obtained as vector sum of the packet-to-packet displacements (v2j,2j+1, second line of the full OD symbol) corresponds to “–”, namely cn = (0,⎯1/3). Right: the corresponding Z vectors (modified after Zvyagin et al.1979) (cf. Table 4). In the publications by Zvyagin and his school, the coordinate system is oriented so that the orthogonal a axis points up and the b axis to the left. Here we follow instead the conventions of the International Tables for Crystallography: the space-fixed references, and consequently the Z vectors, are rotated by 180º with respect to their orientation in the original publications.
Figure 5. An isolated hetero-octahedral Oc layer, with the three two-fold axes in the plane of the layer (ρ-operations).
In Figure 5 an isolated Oc layer is shown. Depending on whether Ma, Mi and Me are all equal, two different or all different the Oc layer is homo-, meso- or hetero-octahedral respectively, and the λ-symmetry is H⎯(3)1m, P⎯(3)1m and P(3)12 respectively. In the

168 Nespolo & Ďurovič
meso-octahedral family Oc includes six τ-operations (1, 3+[001], 3-
[001], m(010), m(110), m(⎯110)) and six ρ-operations (2[010], 2[310], 2[⎯310],⎯1, ⎯3+
[001],⎯3-[001]); these numbers in the homo-
octahedral family have, in fact, to be multiplied by three, owing to the H centering, whereas for the hetero-octahedral family Oc includes three τ and three ρ-operations (the first three of each set). In Figure 6 the same projection is given, but with the positions of the OH/F groups remaining after the substitution with Oa are indicated. This substitution destroys two-thirds of the λ-operations, leaving one (hetero-octahedral) or two (homo- and meso-octahedral) τ-operations (the identity and one m reflection) and one or two ρ-operations (one of the two-fold rotations in the plane of the layer, and the inversion). For meso- and hetero-octahedral Oc layer, for the sake of simplicity and without loss of generality, let us assume that δ(Mi) < [δ(Ma), δ(Me)]. The origin of the Oc layer is then, according to the convention described in Ferraris and Ivaldi (this volume), at the Mi average cation. In Figure 6a, one of the ρ-operations (the only one for hetero-octahedral Oc layer) is the two-fold rotation along [010], and the M1 (trans) site contains the Mi average cation. The M layer is thus of the type M1. Instead, in Figure 6b and 6c the ρ-operation is the two-fold rotation along [310] and [⎯310] respectively: the M1 site contains the Me or the Mi cation respectively, and in both cases the M layer is of type M2.
MDO polytypes . Polytypes in which not only the pairs of layers, but also the triples,
Figure 6. The hetero-octahedral Oc layer shown in Figure 5 after substitution of 2/3 of the OH/F groups with Oa from the upper and lower tetrahedra. Only one of the three ρ-operations remains, defining the relation between the type of site (M1, M2, M3) and its occupation (Ma, Me, Mi). (a) ρ-operation 2[010], Mi cation in the M1 site, layer type M1. (b) ρ-operation 2[310], Me cation in the M1 site, layer type M2. (c) ρ-operation 2[⎯310], Ma cation in the M1 site, layer type M2.

Crystallographic Basis of Polytypism and Twinning in Micas 169
quadruples etc. are geometrically equivalent, or, when this is not possible, contain the smallest number of kinds of triples, quadruples etc., are termed Maximum Degree of Order (MDO) polytypes. This definition originates in a simple philosophy: if a certain configuration (say a triple of layers) is energetically favorable, it will be repeated again and again and will not be intermixed with other, less favorable configurations.
Figure 7. The (001) projections of a Tet layer (the I cation, not shown, takes place in the hole between the two rings of tetrahedra). The two-fold axes in the plane of the layer (half of the ρ-operations of the Tet layer) are indicated. (a) The configuration corresponding to the Pauling model, with zero ditrigonal rotation. The symmetry of the Tet layer is P(6/m)mm. (b) The configuration corresponding to subfamily A in the Trigonal model. The symmetry of the Tet layer is P⎯(3)1m. (c) The configuration corresponding to subfamily B in the Trigonal model. The symmetry of the Tet layer is P⎯(6)2m.
MDO polytypes of the subfamily A [P⎯(3)1m λ-symmetry of the Tet layer] are more favorable then MDO polytypes of the subfamily B [P⎯(6)2m λ-symmetry of the Tet layer], probably because of the different (staggered vs. eclipsed) configuration of the facing Ob atoms (Fig. 7). The most common polytypes are indeed MDO subfamily A. Of the MDO subfamily B, only 2M2 is relatively common in Li-rich trioctahedral micas, where an important structural role of the fluorine atoms has been proposed (Takeda et al. 1971). 2O has been found in its ideal space group in a fluor-phlogopite (Ferraris et al. 2001) and in the brittle mica anandite (Giuseppetti and Tadini 1972; Filut et al. 1985): the structure refinement of anandite indicates that it cannot be described in terms of an orthohexagonal C-centered cell, its space-group type being Pnmn. 2O was also obtained synthetically in fluor-phlogopite (Sunagawa et al. 1968; Endo 1968), and identified from direct

170 Nespolo & Ďurovič
observation of the growth spirals on the surface, but no diffraction study has been performed. Several non-MDO subfamily A polytypes have been reported, as well as some mixed-rotation polytypes, but their number is far smaller than MDO polytypes. The abundance of MDO subfamily A polytypes shows that the geometrical equivalence of OD layers is an important factor even when considering the real structures. The occurrence of non-MDO polytypes is easily understood when considering that the MDO concept specifically refers to a layer-by-layer growth. In all the environments where crystals grow in a fluid phase, the spiral-growth mechanism, to which the MDO criteria apply less strictly, becomes dominant as soon as the supersaturation decreases below a certain critical value (Sunagawa 1984). As a matter of fact, the appearance of long-period polytypes in micas has precise structural reasons. In polytypes based on the close-packed arrangement of atoms, such as SiC, CdI2 etc., the layer thickness is only a few Å and the long-range interactions are not negligible. In micas the layer is about 10Å thick and the long-range interactions are thus less relevant. The probability of the occurrence of non-MDO polytypes, as well as of non-periodic (disordered) polytypes, depends in general on how close are the layers to their archetypes (i.e. how close is the real symmetry to the ideal OD symmetry). The more a layer deviates from its archetype, the less valid are the equivalencies between adjacent layers. The consequence is that when the pairs of adjacent layers are not geometrically equivalent, they are also not energetically equivalent and the ambiguity in the stacking of layers is lost.
The first derivation of the predecessors of the MDO polytypes dates back to Smith and Yoder (1956), who theoretically described the six non-equivalent polytypes (termed “simple polymorphs” by them) that can be obtained by stacking the M1 layer with the same rotation (in the two possible directions) between adjacent layers. All other polytypes were collectively termed complex polymorphs. The term polymorphism was also used by Zvyagin (1962) and by Franzini and Schiaffino (1963a,b), whereas the word polytypism when referring to micas was used for the first time probably by Amelinckx and Dekeyser (1953). The adjectives simple and complex used by Smith and Yoder (1956) represent a qualitative description, as well as the word standard used by Bailey (1980a). Zvyagin et al (1979) (see also Zvyagin 1988) introduced the notion of “condition of homogeneity3”, which identifies polytypes in which the position of any layer relative to the others and the transition from it to the adjacent ones, are the same or equivalent for all layers. These polytypes are called homogeneous polytypes; the remaining ones are called inhomogeneous polytypes. The condition of homogeneity is similar to the condition of the Maximum Degree of Order, but with less emphasis on chemical variations, and thus also on the symmetry distinguishing the three families. The main difference is that Zvyagin applies his condition to the entire crystal-chemical layer, whereas the algorithms for the derivation of MDO polytypes (Dornberger-Schiff et al. 1982, Dornberger-Schiff and Grell 1982) apply to OD layers or OD packets: the latter in micas roughly correspond to half-layers. Within the homo-octahedral approximation in micas, the procedures for the derivation of “simple”, “standard”, “homogeneous”, “MDO”, yield identical results (Table 2): this is however, in general, not true for other compounds, because the algorithms for the derivation of MDO polytypes are considerably different from those employed to derive “homogeneous” or “simple” polytypes. The difference becomes evident when considering that there are only 6 “simple” or “standard” polytypes (that become 8 when considering the non-congruent polytypes, i.e. counting separately each member of an enantiomorphous pair), but they simply correspond to homo-octahedral MDO polytypes. There are then 14 non-equivalent
3 In some texts, the Russian term “однородность” is translated as “uniformity” instead of
“homogeneity”. Here we adopt the latter translation, closer to the original meaning.

171Crystallographic Basis of Polytypism and Twinning in Micas
Tabl
e 2.
Com
para
tive
clas
sific
atio
n of
mic
a po
lyty
pes i
n th
e ho
mo-
octa
hedr
al a
ppro
xim
atio
n.
Rela
tive
rota
tions
bet
ween
succ
essiv
e M
laye
rs
1M: 0
º; 2M
1: 12
0º a
nd
240º
; 3T:
120
º or 2
40º
2O: 1
80º;
2M2:
60º a
nd
300º
; 6H
: 60º
or 3
00º
2n60
º (2
n+1)
60º
Bot
h 2n
60º
an
d (2
n+1)
60º
Subf
amily
A M
DO
a Su
bfam
ily B
MD
Oa
Subf
amily
A n
on-M
DO
a Su
bfam
ily B
non
-MD
Oa
Mix
ed-r
otat
ionb
All
tripl
es o
f OD
pac
kets
with
in
a gi
ven
poly
type
equ
ival
ent
Mor
e th
an o
ne ty
pe o
f trip
le o
f OD
pac
kets
w
ithin
a g
iven
pol
ytyp
e M
ore
than
one
type
of t
riple
of
OD
pac
kets
with
in a
gi
ven
poly
type
OD
stru
ctur
es
Non
OD
stru
ctur
es1
Hom
ogen
eous
with
all
octa
hedr
a pa
ralle
lcH
omog
eneo
us w
ith
octa
-hed
ra p
aral
lel a
nd
anti-
para
llel r
egul
arly
al
tern
atin
gc
Inho
mog
eneo
us w
ith a
ll oc
tahe
dra
para
llelc
Inho
mog
eneo
us w
ith o
ctah
edra
pa
ralle
l and
ant
ipar
alle
l re
gula
rly a
ltern
atin
gc
Inho
mog
eneo
us w
ith m
ixed
(p
aral
lel a
nd a
ntip
aral
lel)
an
d ra
ndom
ly a
ltern
atin
g or
ient
atio
n of
oct
ahed
ra c
All
tripl
es o
f M la
yers
with
in a
giv
en p
olyt
ype
equi
vale
nt
Mor
e th
an o
ne k
ind
of tr
iple
s of M
laye
rs w
ithin
a g
iven
po
lyty
pe
>1 k
ind
of tr
iple
s of M
laye
rs
with
in a
giv
en p
olyt
ype
Stan
dard
, gro
up Id
Stan
dard
, gro
ups I
& II
al
tern
atin
g N
on-s
tand
ard,
gro
up Id
Non
-sta
ndar
d, g
roup
s I &
II
alte
rnat
ing
Non
-sta
ndar
d, g
roup
s I &
II
mix
ed, n
on-a
ltern
atin
g
Sim
plee
Com
plex
e
Tern
aryf
Sena
ryf
Tern
aryf
Sena
ryf
1 Thes
e ar
e O
D st
ruct
ures
if th
e di
trigo
nal r
otat
ion
of th
e te
trahe
dra
is z
ero.
a D
urov
ic e
t al (
1984
); b N
espo
lo (1
999)
; c Zvya
gin
et a
l (19
79) a
nd Z
vyag
in (1
988)
; d Bai
ley
(198
0a);
e Smith
and
Yod
er (1
956)
; f Ros
s et a
l (19
66).
“M
DO
” st
ands
for “
Max
imum
Deg
ree
of O
rder
”.

172 Nespolo & Ďurovič
(22 non-congruent) polytypes in the meso-octahedral family, and 36 non-equivalent (60 non-congruent) polytypes in the hetero-octahedral family, which obey the condition of Maximum Degree of Order. Zvyagin’s “condition of homogeneity” applies to homo- and meso-octahedral polytypes, but not to the hetero-octahedral family.
The reason for the derivation of the polytypes mentioned above is to single out, from the theoretically infinite number of periodic polytypes within a given family, those with relatively short periods in the stacking direction, which are most likely to be encountered in investigated specimens. To calculate theoretical single-crystal diffraction patterns is easy, provided that the structure of the single layer is known, and the distribution of intensities can then be used for their identification by simple visual comparison with patterns obtained experimentally (Weiss and Wiewióra 1986). Thus, it is irrelevant which set of polytypes as derived by different authors/schools is used, provided it fulfils its purpose, namely it allows the identification of the polytype. Identification of long-period (non-MDO) polytypes requires special algorithms exploiting the periodicity of the intensity distribution, and this is treated at the end of this chapter.
SYMBOLIC DESCRIPTION OF MICA POLYTYPES The indicative symbolism developed by Ramsdell (1947) is not sufficiently
informative for polytypes with more than 2-3 layers in the repeat unit. Because of the rapid increase of the number of possible polytypes with the number of layers in the repeat unit (Mogami et al. 1978; McLarnan 1981) the Ramsdell notation needs augmentation with another, descriptive symbolism, from which the structure, including its symmetry, can be reconstructed when the structure of the individual layer is known. Note that a symbol, which describes the stacking mode in an individual polytype, consists of a string of characters. Symbolism is a set of rules governing the construction of symbols. The symbols introduced to describe the stacking mode in mica polytypes can be broadly divided into two types, orientational (giving the absolute orientation of layers with respect to a space-fixed reference) and rotational (giving the relative rotations between pairs of layers).
1) Orientational symbols
1A) DA symbols. The first symbolic description is from Dekeyser and Amelinckx (1953), who used a set of vectors and numerical symbols to indicate the complete stagger of the layer, defined as the (001) projection of the vector connecting two (OH/F) sites on the two sides of the octahedral sheet. Six characters n = 1,2,3⎯,1⎯,2⎯,3 represent the stagger of the layer with respect to a space-fixed reference (Fig. 8). These symbols apply to the homo-octahedral approximation only and therefore cannot correctly describe polytypes containing M2 layers.
1B) Z symbols. Zvyagin (1962) introduced a numerical/vectorial description giving the
stacking of half-layers, as defined by the interlayer cations and the origin of the O sheet. This choice made Zvyagin’s symbols more general than the symbols introduced previously and also suitable for some other phyllosilicates. However,
Figure 8. Symbols used by Dekeyser and Amelinckx (1953) to indicate the orientation of a whole M layer. These symbols can be considered the predecessors of OD and Z symbols (cf. Fig. 4). With respect to the original figure in Dekeyser and Amelinckx (1953), the b and c axes have been taken in the opposite direction (b left instead of right, and c coming out from the plane instead of into) in accordance with the conventions of the International Tables for Crystallography.

Crystallographic Basis of Polytypism and Twinning in Micas 173
Zvyagin changed the notation three times. At first (Zvyagin 1962) he adopted the letters A, B, C, A,⎯B,⎯C to indicate the absolute orientation of the entire layer. He then adopted the characters σi and τi to indicate the intra- and inter-layers displacement of half-layers (Zvyagin 1967). Later (Zvyagin et al. 1979) the Greek letters were abandoned in favor of the corresponding Roman (si and ti) and with a sign inversion between τi and ti, to make homogeneous the definitions of si and ti. Finally, the “s” and “t” letters were dropped, leaving only their numerical subscripts as orientation characters (Zhukhlistov et al. 1990). These most recent symbols, and the vectors they represent, are here termed Z symbols and Z vectors. As for DA symbols, Z symbols are oriented symbols linked to a space-fixed, orthohexagonal reference with (a, b) axes in (001) plane (see also Zvyagin 1985). For non-orthogonal N-layer polytypes, the period along the c axis of this reference corresponds to 3N layers (Fig. 9). The vector connecting the origin of the octahedral sheet with the nearest interlayer site and vice versa, always looking at the sequence of layers in the same direction, is called intralayer displacement: its projection on the (001) plane has length |a|/3 and corresponds to the vector T2j-2 (or T2j-1, depending on which of the two half-layers is considered) in Figure 2. There are six possible orientations for each half layer, indicated by the six layer-fixed ai axes (i = 1~6). The projection of the intralayer displacement is indicated by the character i = 1,2,…6 when the ai axis is parallel to the space-fixed axis a (Fig. 4). The interlayer displacement is the vector giving the relative displacement between two adjacent layers: it can take any of the six orientations 1~6 described for the intralayer vector, and in some other phyllosilicates, also two independent orientations corresponding to ±b/3 (indicated as “+” and “–” respectively), but it can also be a zero vector (indicated as “0”). In micas, owing to the presence of interlayer cations, only the 0 interlayer displacement occurs. The (a, b) components (sx, sy) of Z vectors are given
Figure 9. The conventional monoclinic cell (dashed lines), the (pseudo)-orthohexagonal cell (solid lines), and the (pseudo)hexagonal cell [(001) base shaded] built overlapping three conventional cells. The scale along c is compressed (modified after Nespolo et al. 2000a).

174 Nespolo & Ďurovič
OD symbol Z symbol (sx, sy) 3 3 (1/3, 0)2 4 (1/6, 1/6)1 5 (-1/6, 1/6)0 6 (-1/3, 0)5 1 (-1/6, -1/6)4 2 (1/6, -1/6)+ + (0, 1/3)– – (0, -1/3)0 * (0, 0)
in Table 3. The complete symbolism, giving the stacking sequence of half layers, is ij0kl0mn0…. For micas containing only M1 layers, i=j, k=l, m=n etc.; the character 0 can be omitted and a shortened symbol IKM… is obtained (Zhukhlistov et al. 1990). M2 layers always correspond to intralayer displacement of the same parity; opposite parity would in fact produce a trigonal prismatic coordination for the Y cations. The Z vector for each layer corresponds to the (001) projection of a pair of intralayer displacement vectors and it is obtained by summing their (sx, sy) components. For micas built by M1 layers only, this is equivalent to twice the components, namely (2sx, 2sy) (Table 3). Z vectors are thus twice as long as DA stacking vectors (and also SY vectors, described below), and directed in the opposite way. Since ±2/3 is translationally equivalent to ∓1/3, in practice the (a, b) components of the Z vectors are the same as those of the intralayer displacements, but with the signs interchanged. The DA and SY stacking vectors are the (001) projections of vectors not passing through a cationic site in the O sheet. On the other hand, Z vectors are the (001) projections of vectors passing through that cationic site. As a consequence, Z vectors can distinguish between M1 and M2 layers, whereas the other two cannot. The latter simply correspond to the vector sum of Z vectors.
The fundamental merit of Z symbols is that they can describe also meso-octahedral polytypes. Their shortcoming is that the symbols describing homo-octahedral mica polytypes are identical with those describing meso-octahedral polytypes consisting of M1 layers, and additional information must be given also. Moreover, in their present form, they cannot handle hetero-octahedral polytypes.
1C) OD symbols. The OD school, inspired by Z symbols, derived the most general symbols to describe mica polytypes (Ďurovič and Dornberger-Schiff 1979; Dornberger-Schiff et al. 1982; Backhaus and Ďurovič 1984; Ďurovič et al. 1984; Weiss and Wiewióra 1986). These symbols consist of a sequence of characters referring to one period, placed between vertical bars; two lines of characters are used; the first line indicates the packet orientations, and the second line the packet-to-packet displacements. A dot “.” separating the orientational characters for packets p2j and q2j+1 indicates the position of Oc layer. The OD symbols are thus expressed:
0 1 2 3
0,1 2,3
T T T Tv * v *
⋅ ⋅
Table 3. OD symbols and Z symbols and the (a, b) components of the corresponding orientation vectors.

Crystallographic Basis of Polytypism and Twinning in Micas 175
where Tj = 0~5, v2j,2j+1 = T2j+T2j+1 (v, T are the vectors corresponding to v and T characters, and the vector sum is taken modulo primitive hexagonal cell), and * indicates null vector (no displacement) (Fig. 4). Note that the parity of the orientational characters is necessarily opposite to that of the displacement characters. The vector sum of v2j,2j+1 over a complete polytype period (hereafter indicated as Σv, for shortness) corresponds to the cn projection of the c axis onto the (001) plane and gives the total displacement, which can correspond to the characters “0”~”5”, “*”, “+” and “–“ (see Tables 3 and 4). In the meso-octahedral family, the v2j,2j+1 characters in the second line are redundant because they follow unequivocally from the T2j·T2j+1··· characters in the first line: simplified symbols |T0 · T1 T2 · T3 …| can also be used. In the hetero-octahedral family the chirality of the packets is taken into account: right- and left-handed packets are indicated by a prime (′) or double prime (“), respectively, substituting the dot, where the chirality is conventionally determined by the direction connecting Ma to Mi (Fig. 10) (Ďurovič et al. 1984). Also in this case the v2j,2j+1 characters in the second line are redundant, and simplified symbols T2j ′ T2j+1 or T2j ″ T2j+1 for the individual packet pairs can be used. Although the v2j,2j+1 displacement characters are redundant in both these families, their vector sum Σv, as shown in the next section, allows the classification of mica polytypes in terms of their reticular features: the complete two-line symbols yield thus additional information. Finally, in the homo-octahedral family, there are only two distinguishable orientations of the packets. This follows from the fact that the Oc layer here is H centered and it can be attached to the Tet layer so that its three equivalent origins can be reached simultaneously by the three T vectors with even- or odd (uneven)- numbered characters, respectively. These two orientations of a packet, differing by a 1800 rotation, are indicated by orientational characters e and u, respectively. In this case, the first line of characters is redundant and simplified symbols consisting just of the line of displacement v2j,2j+1 characters may be sufficient (Dornberger-Schiff et al. 1982).
The OD symbols for the packet orientations were defined with respect to hexagonal axes A1, A2, A3 as indicated in Figure 4. In Table 3 they are described in terms of the (a, b) orthohexagonal identity periods. The orthohexagonal cell used in the OD literature corresponds to the C2 setting (Fig. 1). In practice, for the meso-octahedral family, the OD symbols correspond to (6-Z)(mod 6), where Z are Zvyagin’s characters. For the hetero-octahedral family the same numerical relation holds, but the chirality of the packets is considered. For the homo-octahedral family, Zvyagin uses one of the three e- or u-vectors as representative: 6 or 3, respectively. Going from 0 to 5 instead than from 1 to 6, the OD symbols obey the closure property of the mod function. The corresponding OD vectors are disposed in a clockwise sequence, whereas Z vectors are defined counter-clockwise (Fig. 4), but their crystal chemical basis is the same.
1D) TS symbols (Sadanaga and Takeda 1969; Takeda and Sadanaga 1969) give the relative positions of the TS unit layers and are written as a sequence of N symbols Lj(ΔXj, ΔYj), j = 1-N, where Lj is the type of layer and N is the number of layers in the polytype period. Considering two successive repeats of N layers, (ΔXj, ΔYj) are the (a, b) components of the vector connecting the origin of the last (N-th) layer of a repeat and the origin of the j-th layer of the next repeat (Fig. 2). These symbols respect only the homo-octahedral approximation.
2) Rotational symbols 2A) SY vectors. Smith and Yoder (1956) described the stacking sequence in a way
similar to Dekeyser and Amelinck (1953). The stacking vectors are defined as the (001) projection of the vector connecting two nearest interlayer cations on the two

176 Nespolo & Ďurovič
Tabl
e 4.
Tab
le o
f ve
ctor
sum
s fo
r th
e ni
ne p
ossi
ble
disp
lace
men
t ve
ctor
s ap
pear
ing
in t
he s
truct
ure
of m
ost
com
mon
ph
yllo
silic
ates
. The
indi
vidu
al v
ecto
rs v
are
repr
esen
ted
by th
eir r
espe
ctiv
e ch
arac
ters
“v”
and
the
resu
lt of
sum
mat
ion
shou
ld
be ta
ken
mod
ulo
prim
itive
hex
agon
al c
ell (
cf. F
ig. 4
). Th
ese
nine
vec
tors
for
m a
tran
slat
ion
grou
p w
ith v
ecto
r ad
ditio
n as
the
grou
p op
erat
ion.
OD
Z
0
1 2
3 4
5 *
+ –
6
5 4
3 2
5 0
+ –
0 3
– 1
* 5
+ 0
2 4
6 3
– 5
0 1
+ 6
4 2
1 –
4 +
2 *
0 1
3 5
1 –
2 +
4 0
6 5
3 1
2 1
+ 5
– 3
* 2
0 4
2 5
+ 1
– 3
0 4
6 2
3 *
2 –
0 +
4 3
5 1
3 0
4 –
6 +
2 3
1 5
4 5
* 3
+ 1
– 4
2 0
4 1
0 3
+ 5
– 2
4 6
5 +
0 *
4 –
2 5
1 3
5 +
6 0
2 –
4 1
5 3
* 0
1 2
3 4
5 *
+ –
0 6
5 4
3 2
1 0
+ –
+ 4
3 0
5 2
1 +
– *
+ 2
3 6
1 4
5 +
– 0
– 2
5 4
1 0
3 –
* +
– 4
1 2
5 6
3 –
0 +

Crystallographic Basis of Polytypism and Twinning in Micas 177
Figu
re 1
0. C
onst
ruct
ion
of th
e st
acki
ng s
ymbo
l for
het
ero-
octa
hedr
al m
ica
poly
type
s de
mon
stra
ted
on tw
o on
e-la
yer (
two-
pack
et) p
olyt
ypes
, thr
ough
the
(001
) pr
ojec
tion
of th
e O
c la
yer.
Gra
y sq
uare
s in
dica
te th
e po
sitio
n of
OH
gro
ups
(coi
ncid
ing
in th
e pr
ojec
tion
to th
e in
terla
yer c
atio
ns).
Shad
ed o
ctah
edra
con
tain
M1
(tran
s) si
tes.
Thic
k he
xago
ns a
re d
raw
n th
roug
h th
e lo
wer
and
upp
er a
pica
l oxy
gen
atom
s, as
in D
urov
ic e
t al.
(198
4, F
ig. 5
). Th
ick
solid
arr
ows
are
orie
ntat
iona
l ve
ctor
s T
2j a
nd T
2j+1
, thi
ck d
otte
d ar
row
s ar
e di
spla
cem
ent v
ecto
rs v
2j,2
j+1.
The
chira
lity
(ena
ntio
mor
phou
s ha
nd) i
s de
term
ined
by
the
curv
ed a
rrow
lead
ing
from
M
i to
Ma
arou
nd th
e up
per
OH
gro
up: c
lock
wis
e =
right
-han
ded,
cou
nter
-clo
ckw
ise
= le
ft-ha
nded
. Mi a
nd M
a st
and
for
octa
hedr
al s
ites
with
(M
i)nim
al a
nd
(Ma)
xim
al a
vera
ge X
-ray
scat
terin
g po
wer
, res
pect
ivel
y (m
odifi
ed a
fter D
urov
ic e
t al.1
984)
.

178 Nespolo & Ďurovič
sides of a layer. Becuase interlayer cations and (OH, F) groups overlap in the (001) projection, in practice the methods of Dekeyser and Amelinckx (1953) and of Smith and Yoder (1956) are equivalent; however, Smith and Yoder (1956) did not adopt a symbolic notation. Also these vectors are correct only in the homo-octahedral approximation and cannot thus describe correctly polytypes containing M2 layers.
2B) RTW symbols. Ross et al (1966) introduced a numerical description (RTW symbols) giving the relative rotations between successive stacking vectors representing a sequence of M1 layers. This description is the most immediate, although not the most general (it applies to the homo-octahedral approximation only), to describe the mica-polytype stacking mode and to derive all possible mica polytypes with a given number of M1 layers (Takeda 1971; Mogami et al. 1978; McLarnan 1981). However, the method cannot distinguish between M1 and M2 layers. RTW symbols are orientation-free, rotational symbols written as a sequence on N characters Aj = 0,±1,±2,3, the j-th character giving the rotation angle between j-th and (j+1)-th layers as integer multiple of 60º. A RTW symbol corresponds to the difference, with sign inverted, between pairs of displacement OD characters [Aj = –(v2j,2j+1- v2j-2,2j-1)] or to the difference between pairs of Z characters corresponding to successive M1 layers [Aj = +(Z2j+1-Z2j-1)]. The opposite sign between OD and Z symbols originates from the fact that Z and RTW symbols are defined counter-clockwise, whereas OD symbols are defined clockwise. The closure of the periodicity after N layers is expressed by the condition (Takeda 1971):
( )10 mod 6N
jjA
==∑ (1)
2C) Thompson’s symbols. Thompson (1981) introduced an operatorial description of mica stacking, in which operators N1 and N-1 (N = 1,6) produce 2π/N counterclockwise (N1) or clockwise (N-1) rotation of the M layer. These operators are divided into dot [N = 1(mod 2)] and cross operators [N = 0(mod 2)]. Bailey (1980a,b) gave an alternative description of the polytypism of the micas, by
classifying the six possible directions of the stagger of the tetrahedral sheets within a layer (positive and negative directions of the three hexagonal axes in the plane of the layer). The six possible positions of octahedral cations with respect to a space-fixed reference were divided into two groups, labeled I (negative stagger) and II (positive stagger). The first layer of each polytype was kept with tetrahedral stagger along –a1 (octahedral cation positions I): as a consequence, the axial setting used to derive the polytypes was not the most suitable to identify polytypes from their diffraction pattern, and a final axial transformation is necessary. Subfamily A, subfamily B and mixed-rotation polytypes correspond to sequences of octahedral cations belonging to group I only, to groups I and II alternating, and to groups I and II mixed non-alternating. Bailey’s notation cannot distinguish between M1 and M2 layers and is not adopted here. We instead make reference to OD and Z (collectively termed “orientational symbols” when referring to both, for shortness) and to RTW symbols.
RETICULAR CLASSIFICATION OF POLYTYPES: SPACE ORIENTATION AND SYMBOL DEFINITION
Mica polytypes can belong to five symmetries: H, T, O, M and A (Takeda 1971). In both the Pauling and the Trigonal models, the lattice of triclinic polytypes is metrically monoclinic, and the (001) projection of the c axis, labeled cn, can take three values: 0, |a|/3, |b|/3, on the basis of which mica polytypes are classified into orthogonal, Class a and Class b respectively. The number N of layers building a polytype can be expressed as:

Crystallographic Basis of Polytypism and Twinning in Micas 179
N = 3n(3K+L) (K and n non-negative integers; L=1 or 2) (2) where n defines the Series and L the Subclass; K is a constant entering in the transformation matrices relating axial settings (Nespolo et al. 1998).
The structural model of each polytype, as described by the stacking vectors, has six possible orientations with respect to the space-fixed (a, b) axes, each 60º apart. These orientations correspond to one sequence of characters in the RTW symbols, but to six different sequences of orientational symbols, and are in general non-equivalent. The cn projection may correspond to Σv = ⟨*⟩ (orthogonal polytypes), Σv = ⟨0⟩~⟨5⟩ (Class a polytypes), or to Σv = ⟨+⟩ or ⟨–⟩ (Class b polytypes), i.e. to cn = (0, 0), (±1/3, [0, ±1/3]) and (0, ±1/3) respectively. For non-orthogonal polytypes, cn can be reduced to ⎯(1/3, 0) (Class a) or (0,⎯1/3) (Class b) by means of the C-centering vectors and by rotating the structural model around c*. These six orientations can be grouped in the following way (Nespolo et al. 1999d). 1. Class a polytypes. Each orientation corresponds to a different cn projection, i.e. to a
different character of Σv, from ⟨0⟩ to ⟨5⟩. Among these, there is only one that corresponds to the b-unique setting with an obtuse β angle: that with Σv = ⟨0⟩, i.e. cn = (1/3, 0).
2. Class b polytypes. Three orientations correspond to Σv = ⟨+⟩, i.e. cn = (0, 1/3) (acute α angle) and three others to Σv = ⟨–⟩, i.e. cn = (0,⎯1/3) (obtuse α angle). The three orientations with the same Σv (cn) are equivalent for triclinic polytypes, but not for monoclinic cases. The symmetry elements are oriented according to an a-unique setting with α obtuse. Only one of the three orientations leading to Σv = ⟨–⟩ agrees with such a requirement.
3. Orthogonal polytypes. The six orientations correspond to Σv = ⟨*⟩, i.e. cn = (0, 0), and they are equivalent for hexagonal, trigonal and triclinic polytypes, whereas for orthorhombic and monoclinic polytypes only two orientations, related by 180º rotation around c = c* axis, lead to the correct orientation of the symmetry elements. Because both the reticular features and the OD character are based on the geometry
of the layer stacking in polytypes, some relations between the OD and the reticular classifications can be established (Backhaus and Ďurovič 1984; Nespolo 1999). 1. Subfamily A. These polytypes are described by orientational symbols with characters
of the same parity, i.e. by all-even characters in the RTW symbol. They include the three most common MDO polytypes (1M, 2M1, 3T) and the great majority of non-MDO polytypes found so far. Successive layers are related by 2n×60º rotations; the x component of the stacking vector of each packet (half-layer) is either always +1/3 (odd orientational parity of characters in the orientational symbols) or always -1/3 (even orientational parity of characters in the orientational symbols). As a consequence, in Series 0 [n = 0 in Equation (2), i.e. polytypes with the number of layers not a multiple of 3] the x component of cn cannot be 0 and these polytypes belong to Class a. In Series higher than 0, the number of layers building the polytypes is a multiple of 3 and thus Σv is ⟨*⟩, ⟨+⟩ or ⟨–⟩ (the x component of cn is always 0). Therefore, these polytypes cannot belong to Class a.
2. Subfamily B. These polytypes are described by orientational symbols with characters of alternating parity, i.e. by all-odd characters in the RTW symbol. Successive layers are related by (2n+1)×60º rotations. Only polytypes with an even number of layers appear in this subfamily. In addition, because layers with different orientational parity have an opposite x component of the stacking vector, Σv is ⟨*⟩, ⟨+⟩ or ⟨–⟩ and it is not possible to have a Class a polytype.
3. Mixed-rotation polytypes. These polytypes correspond to orientational symbols with
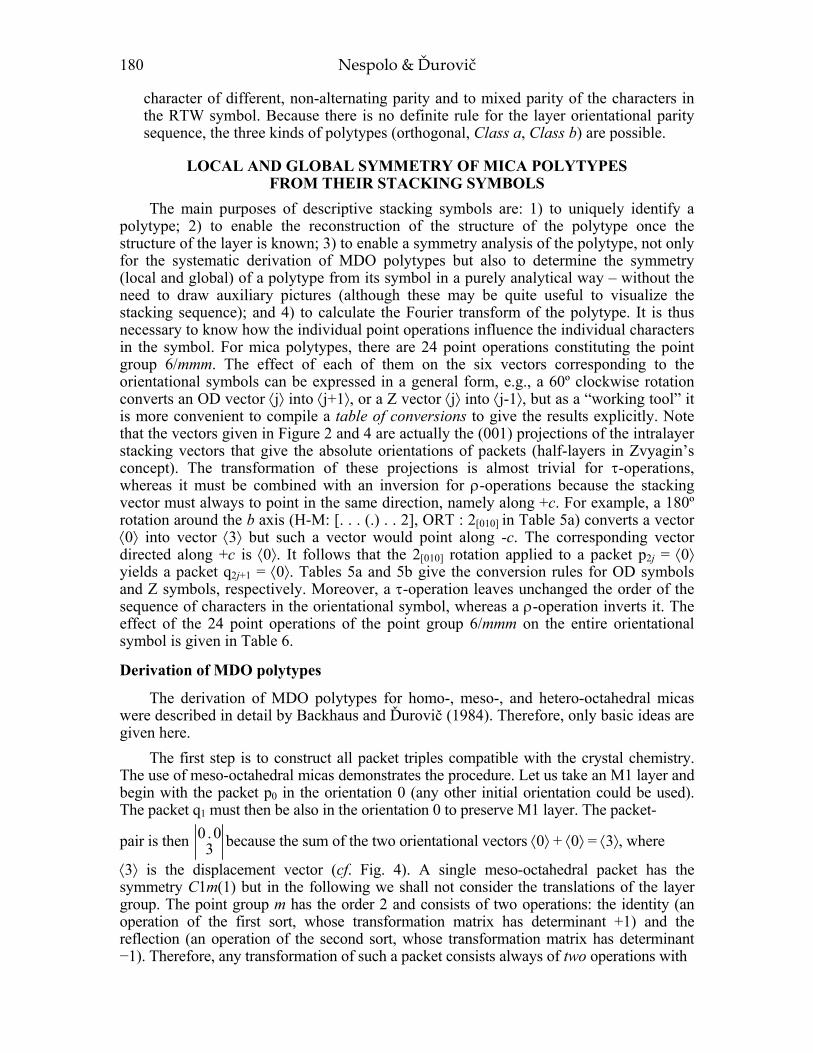
180 Nespolo & Ďurovič
character of different, non-alternating parity and to mixed parity of the characters in the RTW symbol. Because there is no definite rule for the layer orientational parity sequence, the three kinds of polytypes (orthogonal, Class a, Class b) are possible.
LOCAL AND GLOBAL SYMMETRY OF MICA POLYTYPES FROM THEIR STACKING SYMBOLS
The main purposes of descriptive stacking symbols are: 1) to uniquely identify a polytype; 2) to enable the reconstruction of the structure of the polytype once the structure of the layer is known; 3) to enable a symmetry analysis of the polytype, not only for the systematic derivation of MDO polytypes but also to determine the symmetry (local and global) of a polytype from its symbol in a purely analytical way – without the need to draw auxiliary pictures (although these may be quite useful to visualize the stacking sequence); and 4) to calculate the Fourier transform of the polytype. It is thus necessary to know how the individual point operations influence the individual characters in the symbol. For mica polytypes, there are 24 point operations constituting the point group 6/mmm. The effect of each of them on the six vectors corresponding to the orientational symbols can be expressed in a general form, e.g., a 60º clockwise rotation converts an OD vector ⟨j⟩ into ⟨j+1⟩, or a Z vector ⟨j⟩ into ⟨j-1⟩, but as a “working tool” it is more convenient to compile a table of conversions to give the results explicitly. Note that the vectors given in Figure 2 and 4 are actually the (001) projections of the intralayer stacking vectors that give the absolute orientations of packets (half-layers in Zvyagin’s concept). The transformation of these projections is almost trivial for τ-operations, whereas it must be combined with an inversion for ρ-operations because the stacking vector must always to point in the same direction, namely along +c. For example, a 180º
rotation around the b axis (H-M: [. . . (.) . . 2], ORT : 2[010] in Table 5a) converts a vector ⟨0⟩ into vector ⟨3⟩ but such a vector would point along -c. The corresponding vector directed along +c is ⟨0⟩. It follows that the 2[010] rotation applied to a packet p2j = ⟨0⟩ yields a packet q2j+1 = ⟨0⟩. Tables 5a and 5b give the conversion rules for OD symbols and Z symbols, respectively. Moreover, a τ-operation leaves unchanged the order of the sequence of characters in the orientational symbol, whereas a ρ-operation inverts it. The effect of the 24 point operations of the point group 6/mmm on the entire orientational symbol is given in Table 6.
Derivation of MDO polytypes
The derivation of MDO polytypes for homo-, meso-, and hetero-octahedral micas were described in detail by Backhaus and Ďurovič (1984). Therefore, only basic ideas are given here.
The first step is to construct all packet triples compatible with the crystal chemistry. The use of meso-octahedral micas demonstrates the procedure. Let us take an M1 layer and begin with the packet p0 in the orientation 0 (any other initial orientation could be used). The packet q1 must then be also in the orientation 0 to preserve M1 layer. The packet-
pair is then 0 .03 because the sum of the two orientational vectors ⟨0⟩ + ⟨0⟩ = ⟨3⟩, where
⟨3⟩ is the displacement vector (cf. Fig. 4). A single meso-octahedral packet has the symmetry C1m(1) but in the following we shall not consider the translations of the layer group. The point group m has the order 2 and consists of two operations: the identity (an operation of the first sort, whose transformation matrix has determinant +1) and the reflection (an operation of the second sort, whose transformation matrix has determinant −1). Therefore, any transformation of such a packet consists always of two operations with

Crystallographic Basis of Polytypism and Twinning in Micas 181
Table 5a. Conversion of characters appearing in the OD symbols of mica polytypes. The individual operations are characterized by their extended Hermann-Mauguin (H-M) symbols and by the corresponding operations indexed in orthogonal (ORT) C2 –setting axes. Cf. Table 1 and Backhaus and Durovic (1984).
τ-point operations Character conversion by point operation ρ-point operations H-M ORT j : 0 1 2 3 4 5 e u * H-M ORT
1 (6)-1
(3)-1
(2)1
(3)1
(6)1
1 (6)-1 (3)-1 (2)1 (3)1
(6)1
j : 1+j: 2+j: 3+j: 4+j: 5+j:
0 1 2 3 4 5 e u * 1 2 3 4 5 0 u e * 2 3 4 5 0 1 e u * 3 4 5 0 1 2 u e * 4 5 0 1 2 3 e u *
5 0 1 2 3 4 u e *
⎯1 ⎯(6)-1
⎯(3)-1
⎯(2)1 = m(001) ⎯(3)1
⎯(6)1
⎯1 ⎯(6)-1 ⎯(3)-1
⎯(2)1 = m(001) ⎯(3)1
⎯(6)1 ′—′ ′′—′′
′—′′ ′′—′
τ-point operations Character conversion by point operation ρ-point operations H-M ORT j : 0 1 2 3 4 5 e u * H-M ORT
[m . . (.) . . .] [. . . (.) . m .] [. . m (.) . . .] [. . . (.) m . .] [. m . (.) . . .] [. . . (.) . . m]
m(⎯130) m(⎯110) m(100) m(110) m(130) m(010)
5-j : 4-j : 3-j : 2-j : 1-j : -j :
5 4 3 2 1 0 u e * 4 3 2 1 0 5 e u * 3 2 1 0 5 4 u e * 2 1 0 5 4 3 e u * 1 0 5 4 3 2 u e * 0 5 4 3 2 1 e u *
[2 . . (.) . . .] [. . . (.) . 2 .] [. . 2 (.) . . .] [. . . (.) 2 . .] [. 2 . (.) . . .] [. . . (.) . . 2]
2[⎯110] 2[⎯310] 2[100] 2[310] 2[110] 2[010]
′—′′ ′′—′
′—′ ′′—′′
Table 5b. Conversion of characters appearing in the Zvyagin symbols of mica polytypes. The individual operations are characterized by their extended Hermann-Mauguin (H-M) symbols and by the corresponding operations indexed in orthogonal (ORT) C2–setting axes. Cf. Table 1 and Zvyagin (1997).
τ-point operations Character conversion by point operation ρ-point operations H-M ORT j : 6 5 4 3 2 1 0 H-M ORT
1 (6)-1
(3)-1
(2)1
(3)1
(6)1
1 (6)-1 (3)-1 (2)1 (3)1
(6)1
j : 5+j : 4+j : 3+j : 2+j : 1+j :
6 5 4 3 2 1 0 5 4 3 2 1 6 0 4 3 2 1 6 5 0 3 2 1 6 5 4 0 2 1 6 5 4 3 0
1 6 5 4 3 2 0
⎯1 ⎯(6)-1
⎯(3)-1
⎯⎯(2)1 = m(001) ⎯(3)1
⎯(6)1
⎯1 ⎯(6)-1 ⎯(3)-1
⎯⎯(2)1 = m(001) ⎯(3)1
⎯(6)1 [m . . (.) . . .] [. . . (.) . m .] [. . m (.) . . .] [. . . (.) m . .] [. m . (.) . . .] [. . . (.) . . m]
m(⎯130) m(⎯110) m(100) m(110) m(130) m(010)
1-j : 2-j : 3-j : 4-j : 5-j : -j :
1 2 3 4 5 6 0 2 3 4 5 6 1 0 3 4 5 6 1 2 0 4 5 6 1 2 3 0 5 6 1 2 3 4 0 6 1 2 3 4 5 0
[2 . . (.) . . .] [. . . (.) . 2 .] [. . 2 (.) . . .] [. . . (.) 2 . .] [. 2 . (.) . . .] [. . . (.) . . 2]
2[⎯110] 2[⎯310] 2[100] 2[310] 2[110] 2[010]

182 Nespolo & Ďurovič
Table 6. Transformation rules for OD and Z symbol under the effect of the λ-symmetry operations of the hexagonal syngony. ⟨i′⟩,⟨j′⟩,…., ⟨p′⟩ (OD symbols) and ⟨i⟩,⟨j⟩,.…,⟨p⟩ (Z symbols) are the original symbols. The individual operations are characterized by their extended Hermann-Mauguin (H-M) symbols and by the corresponding operations indexed in orthogonal (ORT) C2 –setting axes. Cf. Table 1 (modified after Nespolo et al. 1999).
τ-point operation effect on OD symbol
sequence
effect on Z-symbol
sequence H-M ORT
1 1 ⟨i′⟩,⟨j′⟩,….,⟨p′⟩ ⟨i⟩,⟨j⟩,…. ⟨p⟩ (6)-1 (6)-1 ⟨1+i′⟩,⟨1+j′⟩,….,⟨1+p′⟩ ⟨5+i⟩,⟨5+j⟩,….,⟨5+p⟩ (3)-1 (3)-1 ⟨2+i′⟩,⟨2+j′⟩,….,⟨2+p′⟩ ⟨4+i⟩,⟨4+j⟩,….,⟨4+p⟩ (2)1 (2)1 ⟨3+i′⟩,⟨3+j′⟩,….,⟨3+p′⟩ ⟨3+i⟩,⟨3+j⟩,….,⟨3+p⟩ (3)1 (3)1 ⟨4+i′⟩,⟨4+j′⟩,….,⟨4+p′⟩ ⟨2+i⟩,⟨2+j⟩,….,⟨2+p⟩ (6)1 (6)1 ⟨5+i′⟩,⟨5+j′⟩,….,⟨5+p′⟩ ⟨1+i⟩,⟨1+j⟩,….,⟨1+p⟩
[m . . (.) . . .] m(⎯130) ⟨5-i′′⟩,⟨5-j′′⟩,….,⟨5-p′′⟩ ⟨1-i⟩,⟨1-j⟩,….,⟨1-p⟩ [. . . (.) . m .] m(⎯110) ⟨4-i′′⟩,⟨4-j′′⟩,….,⟨4-p′′⟩ ⟨2-i⟩,⟨2-j⟩,….,⟨2-p⟩ [. . m (.) . . .] m(100) ⟨3-i′′⟩,⟨3-j′′⟩,….,⟨3-p′′⟩ ⟨3-i⟩,⟨3-j⟩,….,⟨3-p⟩ [. . . (.) m . .] m(110) ⟨2-i′′⟩,⟨2-j′′⟩,….,⟨2-p′′⟩ ⟨4-i⟩,⟨4-j⟩,….,⟨4-p⟩ [. m . (.) . . .] m(130) ⟨1-i′′⟩,⟨1-j′′⟩,….,⟨1-p′′⟩ ⟨5-i⟩,⟨5-j⟩,….,⟨5-p⟩ [. . . (.) . . m] m(010) ⟨-i′′⟩,⟨-j′′⟩,….,⟨-p′′⟩ ⟨-i⟩,⟨-j⟩,….,⟨-p⟩
ρ-point operation effect on OD symbol sequence
Effect on Z-symbol sequence H-M ORT
⎯1 ⎯1 ⟨p′′⟩,…., ⟨j′′⟩,⟨i′′⟩ ⟨p⟩….,⟨j⟩,⟨i⟩ ⎯(6)-1 ⎯(6)-1 ⟨1+p′′⟩,…,⟨1+j′′⟩,⟨1+i′′⟩ ⟨5+p⟩,….,⟨5+j⟩,⟨5+i⟩ ⎯(3)-1 ⎯(3)-1 ⟨2+p′′⟩,…,⟨2+j′′⟩,⟨2+i′′⟩ ⟨4+p⟩,….,⟨4+j⟩,⟨4+i⟩
⎯⎯(2)1 = m(001) ⎯⎯(2)1= m(001)
⟨3+p′′⟩,…,⟨3+j′′⟩,⟨3+i′′⟩ ⟨3+p⟩,….,⟨3+j⟩,⟨3+i⟩
⎯(3)1 ⎯(3)1 ⟨4+p′′⟩,…,⟨4+j′′⟩,⟨4+i′′⟩ ⟨2+p⟩,….,⟨2+j⟩,⟨2+i⟩ ⎯(6)1 ⎯(6)1 ⟨5+p′′⟩,…,⟨5+j′′⟩,⟨5+i′′⟩ ⟨1+p⟩,….,⟨1+j⟩,⟨1+i⟩
[2 . . (.) . . .] 2[⎯110] ⟨5-p′⟩,….,⟨5-j′⟩,⟨5-i′⟩ ⟨1-p⟩,….,⟨1-j⟩,⟨1-i⟩ [. . . (.) . 2 .] 2[⎯310] ⟨4-p′⟩,….,⟨4-j′⟩,⟨4-i′⟩ ⟨2-p⟩,….,⟨2-j⟩,⟨2-i⟩ [. . 2 (.) . . .] 2[100] ⟨3-p′⟩,...,⟨3-j′⟩,⟨3-i′⟩ ⟨3-p⟩,….,⟨3-j⟩,⟨3-i⟩ [. . . (.) 2 . .] 2[310] ⟨2-p′⟩,…,⟨2-j′⟩,⟨2-i′⟩ ⟨4-p⟩,….,⟨4-j⟩,⟨4-i⟩ [. 2 . (.) . . .] 2[110] ⟨1-p′⟩,….,⟨1-j′⟩,⟨1-i′⟩ ⟨5-p⟩,….,⟨5-j⟩,⟨5-i⟩ [. . . (.) . . 2] 2[010] ⟨-p′⟩,….,⟨-j′⟩,⟨-i′⟩ ⟨-p⟩,….,⟨-j⟩,⟨-i⟩

Crystallographic Basis of Polytypism and Twinning in Micas 183
the above properties. Accordingly, in the packet pair . 0 .03
. the two packets are related
simultaneously with two ρ–operations, and a look at Table 5a shows that these, converting 0. into .0 and 3 into itself are [. . .(.) . . 2] ≡ 2[010] and an inversion. The packet pair has thus the point symmetry 2/m.
The packet triples p0q1p2 compatible with the Trigonal model in the subfamily A are 0.0 0
3 * , 0 .0 23 * plus its enantiomorphous 0 .0 4
3 * . The two 02τ-operations converting p0 into p2 are in the first case (Table 5a) a translation (isogonal with the identity) and a glide operation (isogonal with […(.)..m(010)]). A continuation of any of these τ-operations leads to the same string …. 0 .0 0 . 0 0 . 0
3 * 3 * 3 * … because any of them converts also displacement characters 3 in the same way. This string has modulus 0.0
3 , the vector ⟨3⟩ is the interlayer vector of this one-layer monoclinic polytype. However, because ⟨3⟩ = +a/3 (acute β angle), it must be re-oriented by a rotation of 180o around c* to bring it into the standard, second setting (obtuse β angle). Evidently, this can be made (Table 5a) by adding 3 to all characters, thus 3.3
0 is obtained. The basis vectors of this 1M polytype with symmetry C12/m1, are a, b, c0-a/3, where c0 is a vector perpendicular to the layer planes with length corresponding to the “layer width” (e.g., a distance between two closest planes of interlayer cations).
The two 02τ-operations for the triple 0 .0 23 * are (Table 5a) a clockwise three-fold screw
rotation (first sort operation, isogonal with (3)-1 ≡ 3[001]) and a glide operation (second sort operation, isogonal with [. . . (.) m . .] ≡ m(110)). A continuation of the (3)-1, through a step-by step application onto the characters in the starting triple, converts 0→2, then 2→4 and 4→0 but also 3→5, 5→1 and 1→3, which closes the period. The resulting symbol 0.0 2 . 2 4.4
3 * 5 * 1 * characterizes a three-layer, trigonal 3T polytype with symmetry P3212 and basis vectors a1, a2, 3c0. A continuation of [. . . (.) m . .] ≡ m(110) converts 0→2 but then 2→0, and 3→5, 5→3 which closes the period. The symbol 0.0 2 . 2
3 * 5 * describes a two-layer monoclinic polytype (glide operation is the global operation here) with an interlayer vector equal to the sum of the two displacement vectors ⟨3⟩ + ⟨5⟩ = ⟨4⟩ (cf. Fig. 4). Also this polytype must be clockwise rotated by 120o, by adding 2 to all characters, to bring it into the standard setting. The final form is 2 . 2 4.4
5 * 1 * , the 2M1 polytype with symmetry C12/c1 and basis vectors a, b, 2c0-a/3.
The packet triple 0 . 0 43 * , enantiomorphous to the previous example, yields analogous
results. The continuation of the (3)1 gives string 0.0 4.4 2 . 23 * 1 * 5 * , a 3T polytype with symmetry
P3112, the enantiomorphous counterpart to P3212. The continuation of [. . . (.) . m .] ≡ m (⎯110)) gives a preliminary symbol 0 .0 4.4
3 * 1 * and, after re-orientation by an anti-clockwise rotation by 120º, 4.4 2 . 2
1 * 5 * , which is the same 2M1 polytype, just with another choice of origin on the glide plane.
This example is instructive: from a pair of packet triples which are enantiomorphous to each other, we obtain, in general, three non-congruent MDO polytypes. Two of them, generated by first-sort operations, contain only packet triples of the one or of the other kind, and these two polytypes form an enantiomorphous pair. The third polytype, generated by second-sort operations, contains both kinds of packet triples, regularly alternating, and it is thus obtained twice in the process of the derivation of MDO

184 Nespolo & Ďurovič
polytypes. Thus, for the meso-octahedral micas of the subfamily A we have obtained the three known MDO polytypes constructed by M1 layers: 1M, 2M1 and 3T. The subfamily B is handled in the same way, yielding MDO polytypes 2O, 2M2 and 6H containing M1 layers.
The derivation of MDO polytypes containing M2 layers is in principle the same; there is just a circumstance that not all the 02τ-operations constructed mechanically are suitable as MDO-generating operations. These details, however, are outside the scope of this paper and the reader should consult Backhaus and Ďurovič (1984). The list of all homo-, meso- and hetero-octahedral MDO polytypes can be found in Table 7, in context with relations of homomorphy described below.
As shown above, whereas monoclinic and orthorhombic polytypes have to be oriented according to the crystallographic conventions, this is irrelevant for orthogonal polytypes of the triclinic, trigonal and hexagonal syngonies. Thus, e.g., the symbol for the 3T polytype is “equally good” in any of the six possible orientations. In general: any of the mutually congruent strings of characters describe the same polytype.
The symmetry analysis from a polytype symbol
The two meso-octahedral MDO polytypes derived in the previous section is now used to demonstrate a “reverse” procedure: to read-out the local and global symmetry from the descriptive symbol. The permanent use of Table 5a (or Table 5b, if Z symbols are to be analyzed) is not emphasized at every step. Before starting such a task, we must check the formal correctness of a symbol: the parity of any displacement character must be opposite to that of the two orientational characters above it which, in turn, must have the same parity. Also the rule T2j + T2j+1 = v2j,2j+1 must be observed. Otherwise, the symbol is wrong.
Let us take an extended (more than one identity period) string of characters corresponding to the 3T polytype, which has six packets within the identity period:
...2 . 2 4.4 0 . 0 2 . 2 4.4 0 .0 2 . 2...5 * 1 * 3 * 5 * 1 * 3 * 5
τ-operations. Evidently, 02[3-1] is the only global non-trivial τ-operation because it converts any packet p or q into p+2 or q+2. In addition, there is a trivial 06τ-operation: a translation by the identity period (and its multiples, of course). The global 04[31] is a consequence. Other τ-operations are only local. The three packet pairs 0.0
3 , 2 . 25 and 4.4
1 have [. . . (.) . . m], [. . . (.) . m .] and [. . . (.) m . .] respectively as local operations converting each of the packet pair into itself, but these operations do not hold for the neighboring packets. There are also other local τ-operations. For example, the 02τ-glide reflection isogonal with [. . . (.) m . .], which is the MDO-generating (global) operation for the polytype 2M1 (see above), has only local character in the 3T polytype.
ρ–operations. Within the packet pair 0 .03 there are two ρ–operations 01⎯[1] and
01[. . . (.) . . 2]. The latter converts not only 0→0, 2→4, and 4→2 (i.e. it mutually converts the two neighboring packet pairs), but also the entire string of characters into itself. Thus, this two-fold rotation is global. Similar statements hold for all two-fold rotations converting any p2j into q2j+1. And analogous results are obtained also for all two-fold rotations converting q2j+1 into p2j+2, i.e. those, operating across the interlayer e.g., 12[. . . (.) 2 . .] converts 0→2, 2→0, 4→4, etc., for the entire string. All of the two-fold axes are in the inter-axial directions so that the space-group type is P3212.

Crystallographic Basis of Polytypism and Twinning in Micas 185
The inversions valid for each packet pair p2j q2j+1 are only local operations. If a string of characters corresponds to a centrosymmetric polytype, then this string, starting and ending with the same character(s), read forwards and backwards, must remain the same. This is not the case in polytype 3T.
Let us now consider the meso-octahedral MDO polytype 2M1 derived above, already in the standard orientation 4.4 2 . 2
1 * 5 * . The only non-trivial τ-operation here is the glide operation isogonal with [. . . (.) . . m], the local mirror reflections hold only for individual M1 layers as in the previous case, and also other τ-operations are local. On the other hand, this polytype is centrosymmetric. This becomes evident if we write down an extended string of characters so that it will contain an odd number of packet pairs pq.
... 4.4 2 . 2 4.4 2 . 2 4.4 2 . 2 4.4 ...1 * 5 * 1 * 5 * 1 * 5 * 1
This symbolism remains the same when read forwards and backwards. In a way similar to the above, also all the two-fold rotations [. . . (.) . . 2] can convert any q2j+1 into p2j+2 and are global: 2→4, 4→2 5→1, 1→5. The other two-fold rotations, converting any p2j into q2j+1, remain local. The space-group type of this polytype is thus C12/c1, taking into account the C-centering with respect to the orthogonal axes a, b.
As an example of a polytype containing also M2 layers, we consider the meso-octahedral polytype identified by the OD symbol |2.4 0.0| (Z symbol 420660). The extended string of characters containing an odd number of packet pairs is:
... 2 . 4 0 . 0 2 . 4 0 . 0 2 . 4 0 . 0 2 . 4 ...3 * 3 * 3 * 3 * 3 * 3 * 3
from which it clearly appears that the polytype is non-centrosymmetric. The only global τ-operation is the trivial 04τ translation (and its multiples) corresponding to the identity period. The packet pair
2 . 43 has no local τ-operations, but 01[…(.)..2] ≡ 2[010] as a local ρ-
operation. The λ-symmetry is C12(1) and the pair of packets corresponds to an M2 layer. Instead, as seen in the example of 3T, the packet pair
0 .03 has […(.)..m] ≡ m(010) as a local
τ-operation, and 23⎯[1] and 23[. . . (.) . . 2] ≡ 2[010] as local ρ-operations. The λ-symmetry is C12/m(1) and the pair of packets corresponds to a M1 layer. The only global ρ-operation for the polytype is [. . .(.) . . 2] ≡ 2[010] located at both the Oc layers. The space-group type is C2.
The complete analysis for the 8 meso-octahedral polytypes of Class a with period up to 2 layers is given in Table 8.

186 Nespolo & Ďurovič
Tab
le 7
. Rel
atio
n of
hom
omor
phy
betw
een
MD
O p
olyt
ypes
of m
icas
. Sho
rtene
d (n
on-r
edun
dant
) OD
sym
bols
are
giv
en fo
r het
ero-
octa
hedr
al p
olyt
ypes
onl
y: fo
r en
antio
mor
phou
s po
lyty
pes,
they
are
sho
wn
in p
aren
thes
es [
the
pack
et p
air
i’j is
ena
ntio
mor
phou
s of
(-i)
”(-j)
, whe
re th
e or
ient
atio
nal c
hara
cter
s ar
e ex
pres
sed
mod
6].
Mod
ified
afte
r Dur
ovic
et a
l (19
84).
subf
amily
A
subf
amily
B
OD
sym
bol
OD
sym
bol
Hom
omor
phou
s M
DO
gro
up
Ram
sdel
l sy
mbo
l H
omo
Mes
o H
eter
o R
amsd
ell
sym
bol
Hom
o M
eso
Het
ero
|3’3
| (|3
”3|)
|3’3
0”0
| 3
.3 0*
|0’0
0”0
| 3
.30
.00
*3
*|3
’3 0
’0| (
|3”3
0”0
|) |5
’1| (
|1”5
|) |1
”5 2
’4|
5.1 0
*1
.5 0*
|5”1
| (|1
’5|)
1.5
2.4
0*
3*
|1’5
2”4
| |2
’4 4
”2|
|5’1
2’4
| (|1
”5 4
”2|)
I 1M
. 0*
uu
2.4
4.2
3*
3*
|2”4
4’2
|
2O.
.0
*3
*u
ue
e
5.1
2.4
0*
3*
1.5
4.2
0*
3*
|5”1
2”4
| (|1
’5 4
’2|)
4.4
2.2
1*
5*
|4’4
2”2
|
|0’2
0”4
| II
2M
1.
.1
*5
*e
ee
e
Non
-MD
O
|0”2
0’4
| 2
.21
.15
*4
*|2
’2 1
”1|
|4’0
5”3
| II
I
2M
2.
.5
*4
*e
eu
u
Non
-MD
O
|4”0
4’3
| |0
’0 4
’4 2
’2| (
|0”0
2”2
4”4
|) |0
”0 4
”4 2
”2| (
|0’0
2’2
4’4
|) 0
.04
.42
.23
*1
*5
*
0.0
2.2
4.4
3*
5*
1*
|0’0
2”2
4’4
0”0
2”2
2’2
4”4
|(|0
”0 4
’4 2
”2 0
’0 4
”4 2
’2|)
|4’2
2’0
0’4
| (|2
”4 4
”0 0
”2|)
4.2
2.0
0.4
3*
1*
5*
2.4
4.0
0.2
3*
5*
1*
|4”2
2”0
0”4
| (|2
’4 4
’0 0
’2|)
|2’4
0’2
4’0
| (|4
”2 0
”4 2
”0|)
2.4
0.2
4.0
3*
1*
5*
4.2
0.4
2.0
3*
5*
1*
|2”4
0”2
4”0
| (|4
’2 0
‘4 2
’0|)
|4’2
4”0
2’0
2”4
0’4
0”2
| (|2
”4 2
’0 4
”0 4
’2 0
”2 0
’4|)
IV
3T
..
.3
*1
*5
*e
ee
ee
e
..
.3
*5
*1
*e
ee
ee
e
Non
-MD
O
|2’4
0”4
0’2
4”2
4’0
2”0
| (|4
”2 0
’2 0
”4 2
’4 2
”0 4
’0|)
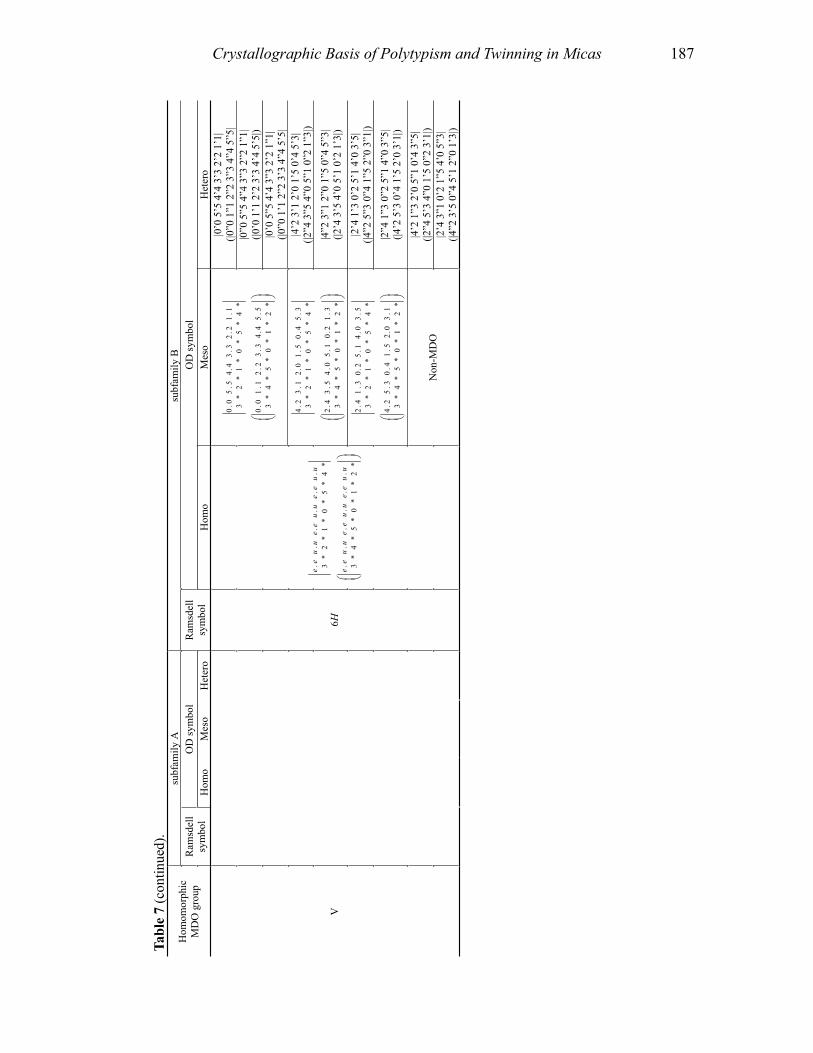
187Crystallographic Basis of Polytypism and Twinning in Micas
Tabl
e 7
(con
tinue
d).
subf
amily
A
subf
amily
B
OD
sym
bol
OD
sym
bol
Hom
omor
phic
M
DO
gro
up
Ram
sdel
lsy
mbo
l H
omo
Mes
o H
eter
o R
amsd
ell
sym
bol
Hom
o M
eso
Het
ero
|0’0
5’5
4’4
3’3
2’2
1’1
| (|0
”0 1
”1 2
”2 3
”3 4
”4 5
”5|
|0”0
5”5
4”4
3”3
2”2
1”1
| (|0
’0 1
’1 2
’2 3
’3 4
’4 5
’5|)
0.0
5.5
4.4
3.3
2.2
1.1
3*
2*
1*
0*
5*
4*
0.0
1.1
2.2
3.3
4.4
5.5
3*
4*
5*
0*
1*
2*
|0’0
5”5
4’4
3”3
2’2
1”1
| (|0
”0 1
’1 2
”2 3
’3 4
”4 5
’5|
|4’2
3’1
2’0
1’5
0’4
5’3
| (|2
”4 3
”5 4
”0 5
”1 0
”2 1
”3|)
4.2
3.1
2.0
1.5
0.4
5.3
3*
2*
1*
0*
5*
4*
2.4
3.5
4.0
5.1
0.2
1.3
3*
4*
5*
0*
1*
2*
|4”2
3”1
2”0
1”5
0”4
5”3
| (|2
’4 3
’5 4
’0 5
’1 0
’2 1
’3|)
|2’4
1’3
0’2
5’1
4’0
3’5
| (|4
”2 5
”3 0
”4 1
”5 2
”0 3
”1|)
2.4
1.3
0.2
5.1
4.0
3.5
3*
2*
1*
0*
5*
4*
4.2
5.3
0.4
1.5
2.0
3.1
3*
4*
5*
0*
1*
2*
|2”4
1”3
0”2
5”1
4”0
3”5
| (|4
’2 5
’3 0
’4 1
’5 2
’0 3
’1|)
|4’2
1”3
2’0
5”1
0’4
3”5
| (|2
”4 5
’3 4
”0 1
’5 0
”2 3
’1|)
V
6H
..
..
..
3*
2*
1*
0*
5*
4*
ee
uu
ee
uu
ee
uu
..
..
..
3*
4*
5*
0*
1*
2*
ee
uu
ee
uu
ee
uu
Non
-MD
O
|2’4
3”1
0’2
1”5
4’0
5”3
| (|4
”2 3
’5 0
”4 5
’1 2
”0 1
’3|)

188 Nespolo & Ďurovič
Tab
le 8
. The
ana
lysi
s of
the
loca
l (se
e Ta
bles
5a
and
5b) a
nd g
loba
l (se
e Ta
ble
6) s
ymm
etry
of t
he e
ight
Cla
ss a
mes
o-oc
tahe
dral
pol
ytyp
es w
ith
perio
d up
to tw
o la
yers
. For
the
deriv
atio
n of
the
inde
pend
ent p
olyt
ypes
see
Bac
khau
s an
d D
urov
ic (1
984)
and
Zvy
agin
(199
7). T
he c
orre
spon
ding
R
amsd
ell s
ymbo
ls a
pply
to th
e ho
mo-
octa
hedr
al p
olyt
ypes
obt
aina
ble
from
the
rela
tion
of h
omom
orph
y. T
he la
yer
grou
ps a
nd s
pace
-gro
up ty
pes
are
give
n in
the
Trig
onal
mod
el: t
he p
ossi
bilit
y of
sym
met
ry re
duct
ion
to a
subg
roup
in th
e re
al st
ruct
ures
shou
ld a
lway
s be
take
n in
to a
ccou
nt.
OD
-Sym
bol
(#)
= M
DO
3.
3 0*
(#)
5.1 0*
(#)
2.4
4.2
3*
3*
(#)
2.4
0.0
3*
3*
4.4
2.2
1*
5*
(#)
0.2
4.0
1*
5*
4.0
2.0
5*
1*
2.0
2.2
1*
5*
Z-Sy
mbo
l 33
0 15
0 42
0240
42
0660
22
0440
64
0260
26
0460
46
0440
p 2
nq2n
+1-o
pera
tion
2 [01
0],
1 2 [
010]
,3-1
(a)
2 [01
0], 3
-1(a
) 2 [
010]
,3-1
(a)
2 [31
0],
1 2 [
310]
,3-1
(a)
2 [31
0],
3-1(a
) 2 [
310]
,31(
a)
p 2n
-ope
ratio
n m
(010
)m
(110
)m
(110
)m
(110
)m
(110
)m
(010
)m
(110
)m
(110
)
q 2n+
1-o
pera
tion
m(0
10)
m(1
10)
m(1
10)
m(1
10)
m(1
10)
m(1
10)
m(0
10)
m(0
10)
p 2nq
2n+1
type
of l
ayer
M
1 M
2 M
2 M
2 M
1 M
2 M
2 M
2 p 2
nq2n
+1-s
ymm
etry
C1
2/m
(1)
C12
(1)
C12
(1)
C12(
1)C1
2/m
(1)
C12(
1)
C12
(1)
C12
(1)
p 2n+
2q2n
+3-o
pera
tion
2 [01
0],
31 (a
) 2 [
010]
,1
2 [31
0],
1 2 [
310]
,3-1
(a)
2 [31
0],
31(a)
2 [
310]
,1
p 2n+
2-o
pera
tion
m(1
10)
m(0
10)
m(1
10)
m(1
10)
m(1
10)
m(1
10)
q 2n+
3-o
pera
tion
m(1
10)
m(0
10)
m(1
10)
m(0
10)
m(0
10)
m(1
10)
p 2n+
2q2n
+3 ty
pe o
f lay
er
M2
M1
M1
M2
M2
M1
p 2nq
2n+1
-sym
met
ry
C12
(1)
C12/
m(1
) C1
2/m
(1)
C12(
1)
C12
(1)
C12
/m(1
) G
loba
l -o
pera
tion
2 [01
0],
1 2 [
010]
2 [
010]
1 2 [
010]
2 [
010]
,1
2 [01
0]
-----
----
- Lo
catio
n p 2
nq2n
+1
q 2n+
1p2n
+2
p 2nq
2n+1
q 2n+
1p2n
+2
p 2nq
2n+1
(2[0
10])
p 2n+
2q2n
+3(2
[010
])q 2
n-1p
2n(1
) q 2
n+1p
2n+3
(1)
p 2nq
2n+1
p 2n+
2q2n
+3
q 2n-
1p2n
q 2n+
1p2n
+2
q 2n-
1p2n
q 2n+
1p2n
+2---
-- --
---
Glo
bal
-ope
ratio
ns
m(0
10),
02t
02t
c (010
),04
t04
tc (0
10),
04t
04t
c (010
),04
t04
tSp
ace-
grou
p ty
pe
C2/m
C2C2
/c
C2C2
/cC2
Cc
C1R
TW sy
mbo
l(b)
0 22
Ram
sdel
l sym
bol(b
) 1M
2M
1(a
) The
se
- o
pera
tions
are
coi
ncid
ence
ope
ratio
ns (o
ne-w
ay m
ovem
ent)
and
not l
ocal
sym
met
ry o
pera
tions
. (b
)Sy
mbo
ls fo
r the
hom
o-oc
tahe
dral
pol
ytyp
es h
omom
orph
ic to
the
mes
o-oc
tahe
dral
pol
ytyp
es li
sted
in th
is ta
ble.

Crystallographic Basis of Polytypism and Twinning in Micas 189
RELATIONS OF HOMOMORPHY AND CLASSIFICATION OF MDO POLYTYPES
Polytypes are usefully classified not only within the same family, but also between different families. On the basis of the number of layers and of the parity of the corresponding characters in the orientational symbols, several meso-octahedral polytypes can be related to one homo-octahedral polytype; similarly, taking into account the chirality of the packets, several hetero-octahedral polytypes can be related to one meso-octahedral polytype. In mathematics, a n → 1 relation is a homomorphism, of which the 1 → 1 relation (isomorphism) is a special case: the n → 1 relation of polytypes of different families is hence termed relations of homomorphy.
The recognition of such relations is also of practical importance. For instance, if during the refinement of a mica structure the homo-octahedral model fails, only the choice between the related meso- or hetero-octahedral models has to be made. All such polytypes have the same framework of all atoms except those octahedrally coordinated. Therefore, they have identical or very similar basis vectors, and the space-group type of the homo-octahedral polytype is their common supergroup. Also their diffraction patterns are closer to one another than to those of other polytypes: the geometry in reciprocal space is virtually the same and also the distribution of intensities is very similar owing to the fact that the framework of non-octahedral atoms in an “average” mica represents about 70 % of the total diffraction power.
The relations of homomorphy can be easily revealed by analyzing the OD symbols (Ďurovič et al. 1984): 1) by substituting the primes (′) or double primes (“) in the symbols of hetero-
octahedral polytypes with dots (.), the corresponding meso-octahedral polytypes are obtained;
2) by substituting the Tj orientational characters in the symbols of meso-octahedral polytypes with “e” (for “even”) or “u” (for “uneven”), the corresponding homo-octahedral polytypes are obtained;
3) the relation of homomorphy between hetero- and homo-octahedral polytypes is obtained by combining steps 1) and 2);
4) some of the hetero-octahedral MDO polytypes are in relation of homomorphy with non-MDO meso-octahedral polytypes, but the further homomorphy to the homo-octahedral family yields again MDO polytypes (for details, see Ďurovič et al. 1984). Note that the relations of homomorphy can, in some cases, make two or more sub-
periods identical although they are different in the original polytype: as a result, polytypes with a different periodicity can be in homomorphy. As an example, let us consider the meso-octahedral polytypes of Class a given in Table 8. Of the six 2-layer polytypes, the following four are homomorphous with the homo-octahedral 2M1 polytype.
4.4 2 . 21 * 5 * ,
0.2 4 . 01 * 5 * ,
4 . 0 2.05 * 1 * ,
2.0 2 . 21 * 5 *
In fact, the relation of homomorphy gives for each: e.e e . e1 * 5 * , for which the shortened
symbol is |15|. The other two polytypes ( 2. 4 4 . 23 * 3 * and 2. 4 0.0
3 * 3 * ), however, are

190 Nespolo & Ďurovič
homomorphous with e.e e .e3 * 3 * . In the homo-octahedral family, this polytype has 1-layer
periodicity, with a shortened symbol |3|, and this corresponds to 1M rotated by 180º about c* (Fig. 11). This apparent reduction of periodicity occurs whenever: 1) the sequence of v2j,2j+1 displacement vectors of a meso-octahedral polytype contains two or more identical sub-periods, which are different for T2j.T2j+1 orientations of the packets; 2) the sequence of T2j.T2j+1 orientation vectors of a hetero-octahedral polytype contains two or more sub-periods which differ only in the chirality of the packets.
The relations of homomorphy in mica structures are summarized in Table 7. Full symbols are given for homo-and meso-octahedral polytypes, shortened symbols (the line of orientational characters) – for hetero-octahedral polytypes. The reason for the somewhat unusual layout of this table is related to the fact that two out of the six homo-octahedral MDO polytypes, 1M and 2O, have the same projection normal to [010] (YZ projection). Thus, for the framework of the non-octahedral atoms in the homo-octahedral MDO polytypes (and also for the corresponding homo-octahedral approximations), there exist five different YZ projections labeled by Roman numbers I to V in the first column of Table 7. The significance of the YZ projections will be explained below in the section “Identification of MDO polytypes”.
As an example for the relations of homomorphy, let us take the hetero-octahedral polytype 2 ' 4 0 '2 4 ' 0
3 * 1 * 5 * (subfamily A). This polytype is homomorphous to the meso-octahedral polytype 2. 4 0.2 4 .0
3 * 1 * 5 * and this, in turn, is homomorphous to the homo-octahedral polytype 3T . . .
3 * 1 * 5 *e e e e e e : all belong to the MDO group I. The two polytypes in the hetero-
and meso-octahedral families are constructed of M2 layers. However, in the homo-octahedral family, the distinction between M1 and M2 layers becomes meaningless: the information about the type of layer is thus lost when applying the relation of homomorphy down to the homo-octahedral family.
From the examples above it is evident that: 1) the homo-octahedral approximation corresponds to applying to a polytype the relation of homomorphy; 2) in micas, the classical Ramsdell notation rigorously applies to homo-octahedral polytypes only.
BASIC STRUCTURES AND POLYTYPOIDS. SIZE LIMIT FOR THE DEFINITION OF “POLYTYPE”
The term polytype implies that there is a family of structures to which the polytype belongs. The original idea of Baumhauer (1912, 1915), who introduced the term polytypism, was that the individual members of a family consist of identical layers and differ only in their stacking mode.
Since that time, different views concerning the notion of polytypism were expressed, but the present official definition recommended by the Ad-hoc Committee on the Nomenclature of Disordered, Modulated and Polytype Structures (Guinier et al. 1984) is very close to the original concept of Baumhauer. According to this definition, “… an element or compound is polytypic if it occurs in several structural modifications, each of which can be regarded as built up by stacking layers of (nearly) identical structure and composition, and if the modifications differ only in their stacking sequence. Polytypism is a special case of polymorphism: the two-dimensional translations within the layers are essentially preserved”. The Ad-hoc Committee, however, admitted that this definition is

Crystallographic Basis of Polytypism and Twinning in Micas 191
Figure 11. Relation of homomorphy between the two-layer meso-octahedral
2 . 4 4 . 23 * 3 * polytype (left) and the one-layer homo-octahedral e . e
3 polytype (right),
illustrated by showing separately the two Oc layers. Solid vectors: packet orientation; dotted vectors: packet-to-packet displacements. Solid circles and open squares represent two different average cations. In the meso-octahedral polytype (left), the two Oc layers have the origin in either of the two cis-sites, where the different average cation is located: they correspond to M2 layers. The packet orientations, given by the vectors connecting the interlayer/OH sites (overlapped in projection) to the origin of the Oc layer, are 2 (packets p0 and q3) and 4 (packets q1 and p2). For both packet pairs, the vector sum (packet-to-packet displacement) is in orientation 3. By applying the relation of homomorphy, i.e., by making identical the content of the three octahedral cation sites, and obtaining the corresponding homo-octahedral polytype (right), both layers are transformed into the type M1, and the packet orientations change into e for both packets. The packet-to-packet displacements do not change. As a consequence, the two layers in the homo-octahedral polytype have the same orientational vectors, but the periodicity is halved. The Σv, now coinciding with v0,1, corresponds to “3” (acute β angle), but can be transformed into “0” (obtuse β angle) by rotating the polytype by 180º about the normal to the layer.

192 Nespolo & Ďurovič
too wide because – except for the two-dimensional periodicity of layers – it imposes no restrictions on the sequence and stacking mode of layers.
The fact that the definition is not sufficiently geometric prompted Ďurovič (1999) to suggest that the layers and their stacking must be limited by the vicinity condition (VC, see the section “Micas as OD structures”), and that a family can encompass only those polytypes which are built on the same structural and symmetry principle, i.e. only those which belong to the same OD groupoid family. This idea was in principle supported also by Makovicky (1997) who, at the same time, proposed to distinguish between proper polytypes, belonging to the same OD groupoid family, and improper polytypes, which cannot be interpreted as such. Recently, Christiansen et al. (1999) suggested a more detailed classification concept related to this subject. Makovicky also accepted the term polytypoids for polytypic substances in which more than 0.25 atoms per formula unit differ in at least one component as proposed by the IMA-IUCr Joint Committee on Nomenclature (Bailey et al. 1977). This term was applied also by Bailey (1980b) for the specific case of micas, and recommended also by the Ad-hoc Committee, as discussed above.
Abstract polytypes
The experience gathered over years with refined periodic structures of polytypic substances indicate that, sensu stricto, each such polytype is an individual polymorph with its own stability field, although the energy differences between polytypes of the same compounds are very small. This is caused by desymmetrization, i.e. by changes in the atomic coordinates of individual layers imposed by the influence of the neighboring layers and it is different for different stacking modes. Thus, even layers in different polytypes of the same substance are not identical. A prominent example in micas (1M and 2M1 polytypes of biotite with the same composition) was given by Takeda and Ross (1975), who not only found significant differences in the constituent layers of the polytypes but also postulated that these differences are "directly related to the atomic and geometric constraints imposed by the adjacent unit layers varying with the relative orientation of the adjacent layers". Desymmetrization occurs even in such less pliable structures as SiC, as convincingly reported by researchers at the former Leningrad Electrotechnical Institute (Sorokin et al. 1982a,b; Tsvetkov 1982; see also Tairov and Tsvetkov 1983) who showed that also the chemical composition (the ratio of Si/C) varies from polytype to polytype grown under (nearly) the same conditions. If these facts were taken absolutely at the face value, the notion of polytypism would loose its unifying significance. In order to overcome these difficulties, the concept of a polytype is often considered an abstract notion referring to a structural type with relevant geometric properties, belonging to an abstract family whose members consist of layers with identical structure and with identical bulk compositions. Such an abstract notion lies at the root of all systematization and classification schemes of polytypes.
In micas (as well as in many other phyllosilicates) the Pauling model and also the homo-octahedral approximation are abstractions which are very useful, among others, for didactic purposes to gain first knowledge, but also for the calculation of identification diagrams of MDO polytypes, and for the calculation of PID functions, described in sections about experimental identification of mica polytypes below. A better approximation, but still an abstraction, is the Trigonal model, which is important for the explanation of subfamilies and for some features in the diffraction patterns. Also, when speaking of a specific polytype, a characteristic sequence of abstract mica layers is intended rather than deviations from stoichiometry, distribution of cations within octahedral sheets, distortion of coordination polyhedra, etc.

Crystallographic Basis of Polytypism and Twinning in Micas 193
Basic structures
Owing to the fact that the energy difference between polytypes of the same substance is very small, the occurrence of different polytypes should be influenced mostly by the kinetics of crystal growth, and the frequency of occurrence of different polytypes is, in principle, directly related to the number of layers in the period. However, this statement is contradicted by the existence of a certain degree of structural control (Smith and Yoder 1956; Güven 1971) that governs the frequency of occurrence of polytypes as a function of the crystallization environment and of the crystal chemistry. As firstly noted by Ross et al (1966), a portion of the stacking sequence of the non-MDO mica polytypes coincides with the stacking sequence of one of the MDO subfamily A polytypes, similarly to what happens in SiC polytypes. The remaining portion represents a deviation from the sequence. For this reason, Baronnet and Kang (1989) introduced the term basic structures to indicate these three MDO polytypes, as well as 2M2 and 1Md-A. The non-MDO polytypes are thus said to belong to one structural series: the three structural series 1M, 2M1 and 3T were defined (Ross et al. 1966; Baronnet 1978; Takeda and Ross 1995). A structural series based on 2M2 has not been found, but its existence cannot be excluded in principle. The causes of the existence of a stacking memory in the basic structures are not well understood. Energy differences between two polytypes of the same family are small. However, the real structures are constructed not by layer archetypes, but by, more or less, desymmetrized layers: the corresponding energy differences may be sufficient to control the original stacking sequence.
However, also when the crystal chemistry is practically identical, a certain degree of structural control exists, as shown by the fact that a few polytypes are clearly dominant, with the others appearing with much lower frequency. A general trend towards a relation between the formation environment, the crystal chemistry and the polytype frequency exists also (Nespolo 2001). The three basic structures may thus be not truly polytypic, even when the crystal chemistry is identical.
HTREM observations and some implications
The application of the High Resolution Transmission Electron Microscopy (HRTEM) (Iijima and Buseck 1978) has made possible the observation of several stacking sequences that would not be revealed by other techniques. At the same time, HRTEM has raised the question of the limits within which an observed stacking sequence should be considered a polytype. Kogure and Nespolo (1999b) stated that the stacking sequences revealed by HRTEM observation can be defined as a polytype only when they are repeated sufficiently to reveal the presence of a memory mechanism reproducing with regularity the stacking sequence; otherwise, they should rather be considered defects. It is questionable whether a sequence repeated only three times, like the 22-layer biotite reported by Konishi and Akai (1990), may be rigorously termed a “polytype”. In such cases it is recommended to speak of “a sequence corresponding to a certain polytype”. In such cases, we described the form as “a sequence corresponding to the polytype XY”. The problem is similar to that of nanocrystals where it is also questionable how many unit cells are necessary to determine a phase.
IDEAL SPACE-GROUP TYPES OF MICA POLYTYPES AND DESYMMETRIZATION OF LAYERS IN POLYTYPES
The ideal space-group type of a given polytype can be derived from the stacking sequence, as described above. However, three kinds of symmetries are required:

194 Nespolo & Ďurovič
1) the stacking symmetry, deduced from the sequence of packet orientations and displacements, which gives the space-group type in the Trigonal model;
2) the structural symmetry, which may be lower than the stacking symmetry because of structural distortions not taken into account by the Trigonal model;
3) the diffractional symmetry, which may be higher than the structural symmetry. This phenomenon is termed diffraction enhancement of symmetry (Ito 1950) and occurs when a crystal is constructed by substructures whose symmetry is higher than that of the crystal itself (e.g., Iwasaki 1972; Matsumoto et al. 1974). In micas, diffraction enhancement of symmetry was observed in the oxybiotite-10A1 from Ruiz Peak, which gave a monoclinic diffraction pattern, despite both the stacking symmetry and the structural symmetry were triclinic (Sadanaga and Takeda 1968). The validity of the local symmetry operations is often only approximate, and the
atomic coordinates can deviate more or less from the values demanded by the corresponding space groupoid, depending on the stacking of the packets in the investigated crystal, and this is phenomenon known as desymmetrization (Ďurovič 1979). The λ-symmetry of the M layers can thus be lower than the λ-symmetry of the layer archetypes described by the Trigonal model (see Table 2 in Ferraris and Ivaldi, this volume). The space-group type corresponding to the stacking symmetry in general does not require the highest λ-symmetry compatible with the family (homo-, meso- or hetero-octahedral) and the type of layer (M1 vs. M2). The layer is thus allowed, although not required, to attain a layer-subgroup. The general trend that results from the structure refinements performed on mica polytypes can be summarized as follows (see Table 9, and Tables 1-3 in Brigatti and Guggenheim, this volume): 1) 1M polytype has been refined only in the highest space-group types and layer-groups
compatible with the type of layer: C2/m and C12/m(1) for the M1 layer; C2 and C12(1) for the M2 layer.
2) The highest space-group type for the 2M1 polytype is C2/c. All but one example of 2M1 polytypes refined so far belong to the meso-octahedral family and are constructed by M1 layers. Most of these polytypes have been refined in C2/c. This space-group type allows a desymmetrization of the layer-group to ⎯C1, which corresponds to the λ-symmetry normally obtained in 2M1 polytypes (Güven 1971; Zussman 1979; Takeda and Ross 1975). An important exception is oxybiotite-2M1 refined by Ohta et al (1982), where the highest λ-symmetry C12/m(1) was observed within experimental erro; this was also the λ-symmetry of coexisting oxybiotite-1M (Ohta et al. 1982). Three studies of meso-octahedral margarite-2M1 refined in the space-group type Cc have been reported (Guggenheim and Bailey 1975, 1978; Joswig et al 1983; Kassner et al. 1993), where the reduction of symmetry was related to the Si-Al ordering, that made the two T sheets no longer equivalent. The layer group is only C1, because of the destruction of the center of symmetry. A further reduction of symmetry was observed in the ephesite-2M1 reported by Slade et al.
Table 9 (next nine pages ). Relevant properties of the MDO polytypes. Only polytypes for which the ccupancies of the octahedral sites were given in the original papers are reported. Following Durovic et al (1984), the effective scattering amplitude is taken directly from the original papers, when reported; otherwise it has been calculated assuming half-ionized atoms, even where the structure was refined using electron or neutron diffraction data. Polytypes built by M2 layers are in bold characters. References are given according to the sequence numbers in the tables of the Brigatti and Guggenheim chapter. For polytypes not reported there, the complete reference is given. (e) = electron diffraction data; (n) = neutron diffraction data; otherwise X-ray diffraction data.

195Crystallographic Basis of Polytypism and Twinning in Micas
Reference Type of mica R factor Space-group type
(M1) (M2) (M3) Fullpolytype symbol
Subfamily A – 1M polytype
Homo-trioctahedral
1-95 Phlogopite 13.1 C2/m 11.0 11.0 11.0 .0 *
u u
1-61 Synthetic iron mica 9.3 C2/m 25.0 25.0 25.0 .0 *
u u
1-97 Synthetic lithian flourphlogopite 7.3 C2/m 10.4 10.4 10.4 .
0 *u u
3-15 Barium mica 7.1 C2/m 8.8 8.8 8.8 .0 *
u u
1-70 Phlogopite (n) 2.0 C2/m 11.7 11.7 11.7 .0 *
u u
1-97 Phlogopite 4.1 C2/m 11.0 11.0 11.0 .0 *
u u
1-72 Fluorophlogopite 6.1 C2/m 11.0 11.0 11.0 .0 *
u u
1-86 Phlogopite (n) 6.6 C2/m 11.9 11.9 11.9 .0 *
u u
1-98 Fluro phlogopite 4.3 C2/m 11.0 11.0 11.0 .0 *
u u
1-104 Synthethic fluormica 3.8 C2/m 9.4 9.4 9.4 .0 *
u u
1-94 Tetraferriphlogopite 4.2 C2/m 10.5 10.5 10.5 .0 *
u u
1-108 Fluoro phlogopite 2.9 C2/m 10.2 10.2 10.2 .0 *
u u
1.108 Tetra germanatian fluoro phlogopite 3.7 C2/m 11.0 11.0 11.0 .
0 *u u
1-69 Silica- and alkali-rich trioctahedral mica
3.0 C2/m 10.6 10.6 10.6 .0 *
u u
1-103 Germanate mica 3.9 C2/m 14.0 14.0 14.0 .0 *
u u
1-102 Germanate mica 5.0 C2/m 19.5 19.5 19.5 .0 *
u u
1-110 Fluoro phlogopite 4.3 C2/m 10.8 10.8 10.8 .0 *
u u
Knurr and Bailey (1986) Phlogopite 3.1 C2/m 12.1 12.1 12.1 .
0 *u u
3-7 Potassium Kinoshitalite (27) 2.5 C2/m 13.4 13.4 13.4 .
0 *u u
1-82 Cs-ferriannite 5.5 C2/m 25.0 25.0 25.0 .0 *
u u
1-45 Magnesian annite (WA8E) 3.9 C2/m 19.9 19.9 19.9 .
0 *u u
1-60 Cs-tetra-ferri-annite 3.9 C2/m 25.0 25.0 25.0 .0 *
u u
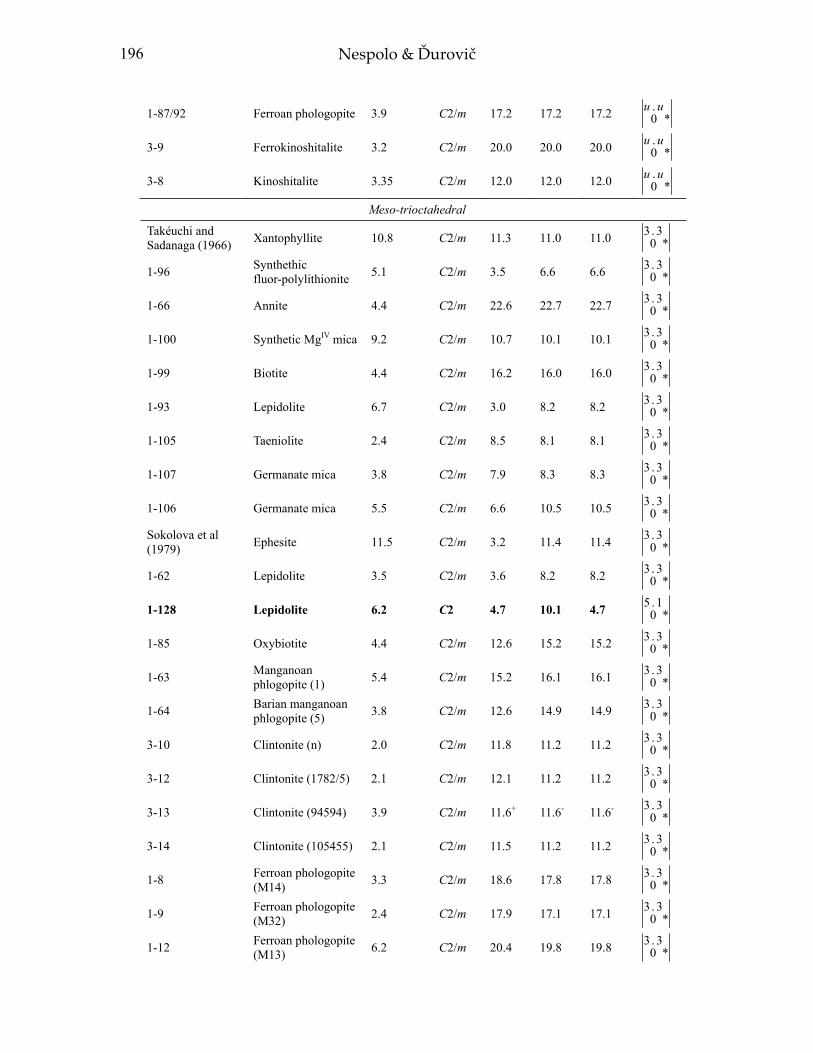
196 Nespolo & Ďurovič
1-87/92 Ferroan phologopite 3.9 C2/m 17.2 17.2 17.2 .0 *
u u
3-9 Ferrokinoshitalite 3.2 C2/m 20.0 20.0 20.0 .0 *
u u
3-8 Kinoshitalite 3.35 C2/m 12.0 12.0 12.0 .0 *
u u
Meso-trioctahedral
Takéuchi and Sadanaga (1966) Xantophyllite 10.8 C2/m 11.3 11.0 11.0 3 . 3
0 *
1-96 Synthethic fluor-polylithionite 5.1 C2/m 3.5 6.6 6.6 3 . 3
0 *
1-66 Annite 4.4 C2/m 22.6 22.7 22.7 3 . 30 *
1-100 Synthetic MgIV mica 9.2 C2/m 10.7 10.1 10.1 3 . 30 *
1-99 Biotite 4.4 C2/m 16.2 16.0 16.0 3 . 30 *
1-93 Lepidolite 6.7 C2/m 3.0 8.2 8.2 3 . 30 *
1-105 Taeniolite 2.4 C2/m 8.5 8.1 8.1 3 . 30 *
1-107 Germanate mica 3.8 C2/m 7.9 8.3 8.3 3 . 30 *
1-106 Germanate mica 5.5 C2/m 6.6 10.5 10.5 3 . 30 *
Sokolova et al (1979) Ephesite 11.5 C2/m 3.2 11.4 11.4 3 . 3
0 *
1-62 Lepidolite 3.5 C2/m 3.6 8.2 8.2 3 . 30 *
1-128 Lepidolite 6.2 C2 4.7 10.1 4.7 5 .10 *
1-85 Oxybiotite 4.4 C2/m 12.6 15.2 15.2 3 . 30 *
1-63 Manganoan phlogopite (1) 5.4 C2/m 15.2 16.1 16.1 3 . 3
0 *
1-64 Barian manganoan phlogopite (5) 3.8 C2/m 12.6 14.9 14.9 3 . 3
0 *
3-10 Clintonite (n) 2.0 C2/m 11.8 11.2 11.2 3 . 30 *
3-12 Clintonite (1782/5) 2.1 C2/m 12.1 11.2 11.2 3 . 30 *
3-13 Clintonite (94594) 3.9 C2/m 11.6+ 11.6- 11.6- 3 . 30 *
3-14 Clintonite (105455) 2.1 C2/m 11.5 11.2 11.2 3 . 30 *
1-8 Ferroan phologopite (M14) 3.3 C2/m 18.6 17.8 17.8 3 . 3
0 *
1-9 Ferroan phologopite (M32) 2.4 C2/m 17.9 17.1 17.1 3 . 3
0 *
1-12 Ferroan phologopite (M13) 6.2 C2/m 20.4 19.8 19.8 3 . 3
0 *

197Crystallographic Basis of Polytypism and Twinning in Micas
1-11 Ferroan phologopite (M73) 2.1 C2/m 19.0 18.2 18.2 3 . 3
0 *
1-10 Ferroan phologopite (M62) 3.5 C2/m 20.4 19.6 19.6 3 . 3
0 *
1-111 Norrishite 7.8 C2/m 2.5 23.3 23.3 3 . 30 *
1-21 Ferroan phlogopite (8) 2.5 C2/m 13.9 15.1 15.1 3 . 3
0 *
1-22 Phlogopite (9) 2.2 C2/m 13.7 14.0 14.0 3 . 30 *
1-23 Ferroan phlogopite (10) 2.2 C2/m 16.3 16.5 16.5 3 . 3
0 *
1-24 Ferroan phlogopite (11) 1.9 C2/m 14.7 16.8 16.8 3 . 3
0 *
1-25 Ferroan phlogopite (12) 2.1 C2/m 14.5 16.1 16.1 3 . 3
0 *
1-26 Ferroan phlogopite (15) 2.3 C2/m 17.5 17.0 17.0 3 . 3
0 *
1-27 Ferroan phlogopite (16) 3.0 C2/m 19.0 18.4 18.4 3 . 3
0 *
1-28 Magnesian annite (17) 2.6 C2/m 18.6 18.4 18.4 3 . 3
0 *
1-112 Protolithionite 3.8 C2/m 20.2 19.4 19.4 3 . 30 *
1-7 Magnesian annite (MP9) 3.1 C2/m 18.7 20.2 20.2 3 . 3
0 *
1-13 Titanian phlogopite (18) 2.0 C2/m 12.9 15.4 15.4 3 . 3
0 *
1-17 Ferroan phlogopite (19) 3.2 C2/m 17.6 18.1 18.1 3 . 3
0 *
1-14 Aluminian phlogopite (20) 2.7 C2/m 16.1 16.9 16.9 3 . 3
0 *
1-15 Ferrian phlogopite (21) 2.3 C2/m 15.3 16.1 16.1 3 . 3
0 *
1-16 Ferroan phlogopite (22) 3.3 C2/m 16.3 17.1 17.1 3 . 3
0 *
1-18 Ferrian phlogopite (23) 3.4 C2/m 16.2 16.8 16.8 3 . 3
0 *
1-19 Ferrian phlogopite (24) 2.7 C2/m 17.1 17.5 17.5 3 . 3
0 *
1-20 Ferroan phlogopite (25) 2.2 C2/m 16.6 17.7 17.7 3 . 3
0 *
Brigatti & Poppi (1993)
Potassium kinoshitalite (26) 2.6 C2/m 14.3 13.3 13.3 3 . 3
0 *
1-6 Biotite 3.33 C2/m 19.0 18.1 18.1 3 . 30 *
1-1 Phlogopite (1a) 2.9 C2/m 13.2 12.9 12.9 3 . 30 *
1-2 Phlogopite (1b) 2.8 C2/m 13.4 12.9 12.9 3 . 30 *
1-3 Phlogopite (2a) 2.9 C2/m 13.2 12.9 12.9 3 . 30 *

198 Nespolo & Ďurovič
1-4 Aluminian phlogopite (3a) 3.0 C2/m 13.3(1) 13.2(1) 13.2(1) 3 . 3
0 *
1-5 Phlogopite (4a) 2.5 C2/m 13.0 12.7 12.7 3 . 30 *
1-36 Phlogopite (Tas27-2Ba) 2.8 C2/m 14.0 13.1 13.0 3 . 3
0 *
1-37 Phlogopite (Tas27-2Bb) 2.5 C2/m 13.7 13.3 13.3 3 . 3
0 *
1-38 Ferroan phlogopite (Tag15-4) 2.8 C2/m 15.7 15.6 15.6 3 . 3
0 *
1-39 Phlogopite (Tag15-3) 2.8 C2/m 14.9 14.8 14.8 3 . 3
0 *
1-32 Ferroan phlogopite (Tpg63-2B) 2.3 C2/m 16.8 16.5 16.5 3 . 3
0 *
1-29 Phlogopite (Tae23-1a) 2.7 C2/m 13.4 13.3 13.3 3 . 3
0 *
1-30 Phlogopite (Tae23-1b) 2.7 C2/m 13.5 13.5 13.5 3 . 3
0 *
1-31 Phlogopite (Tae23-1c) 3.0 C2/m 14.0 13.7 13.7 3 . 3
0 *
1-40 Phlogopite (Tpq16-4A) 2.8 C2/m 13.8 13.6 13.6 3 . 3
0 *
1-35 Phlogopite (Tpt17-1) 2.8 C2/m 13.8 13.4 13.4 3 . 3
0 *
1-33 Tetra-ferri phlogopite (Tas22-1a)
3.2 C2/m 12.9 12.8 12.8 3 . 30 *
1-34 Tetra-ferri phlogopite (Tas22-1b)
3.3 C2/m 13.9 13.1 13.1 3 . 30 *
1-41 Tetra-ferri phlogopite (Tpq16-6B)
3.1 C2/m 14.6 13.8 13.8 3 . 30 *
1-42 Tetra-ferri phlogopite (S1) 3.1 C2/m 13.5 13.1 13.1 3 . 3
0 *
1-43 Tetra-ferri phlogopite (S2) 2.5 C2/m 13.8 13.5 13.5 3 . 3
0 *
Brigatti et al (1997)
Ferroan phlogopite (Tag15-4a) 2.8 C2/m 15.7 15.6 15.6 3 . 3
0 *
1-48 Ferroan phlogopite (Tag15-4b) 2.8 C2/m 15.2 15.4 15.4 3 . 3
0 *
1-49 Ferroan phlogopite (Tpq16-4Aa) 2.8 C2/m 13.8 13.6 13.6 3 . 3
0 *
1-50 Ferroan phlogopite (Tpq16-4Ab) 2.4 C2/m 13.7 13.4 13.4 3 . 3
0 *
Brigatti et al (1997)
Ferroan phlogopite (Tpq16-4Ac) 3.0 C2/m 15.9 15.3 15.3 3 . 3
0 *
Brigatti et al (1997)
Ferroan phlogopite (Tas22-1c) 3.1 C2/m 13.5 13.1 13.1 3 . 3
0 *
3-1 Clintonite (5a) 3.49 C2/m 13.0 12.6 12.6 3 . 30 *
3-2 Clintonite (7c) 3.73 C2/m 13.4 13.3 13.3 3 . 30 *

199Crystallographic Basis of Polytypism and Twinning in Micas
3-3 Clintonite (8a) 3.11 C2/m 13.2 12.9 12.9 3 . 30 *
3-4 Clintonite (8d) 3.18 C2/m 12.7 13.0 13.0 3 . 30 *
3-5 Clintonite (9a) 3.29 C2/m 13.0 13.1 13.1 3 . 30 *
3-6 Clintonite (9b) 2.70 C2/m 12.6 13.0 13.0 3 . 30 *
1-65 rubidian cesian phlogopite 4.5 C2/m 16.0 15.8 15.8 3 . 3
0 *
1-44 Ferroan phlogopite (WA3H) 2.9 C2/m 18.3 18.2 18.2 3 . 3
0 *
1-46 Magnesian annite (WA8H) 3.3 C2/m 19.6 19.3 19.3 3 . 3
0 *
1-47 Ferroan phlogopite (WA23E) 2.8 C2/m 18.8 18.6 18.6 3 . 3
0 *
1-51 Magnesian annite 3.2 C2/m 19.6 18.9 18.9 3 . 30 *
1-55 Magnesian annite 3.6 C2/m 19.1 18.2 18.2 3 . 30 *
1-56 Magnesian annite 3.2 C2/m 19.6 18.8 18.8 3 . 30 *
1-54 Magnesian annite 3.2 C2/m 19.4 18.5 18.5 3 . 30 *
1-53 Magnesian annite 3.1 C2/m 19.9 19.6 19.6 3 . 30 *
1-52 Magnesian annite 3.7 C2/m 19.8 19.2 19.2 3 . 30 *
1-58 Fe-Li rich mica 26 3.3 C2/m 19.6 22.3 22.3 3 . 30 *
1-59 Fe-Li rich mica 33 3.6 C2/m 23.5 239 23.9 3 . 30 *
1-57 Fe-Li rich mica 120 2.6 C2/m 24.7 24.4 24.4 3 . 30 *
1-118 Fe-Li rich mica 130(2) 3.86 C2 12.7 13.0 12.7 5 .1
0 *
Hetero-trioctahedral
1-129 Zinnwaldite 5.7 C2 15.0 11.5 13.5 5 ' 10 *
1-113 Lepidolite 7.3 C2 3.7 11.4 11.5 3 ' 30 *
Zhukhlistov et al (1983) Li-Fe phengite (e) 10.2 C2 8.0 15.1 14.8 3"3
0 *
1-130 Masutomilite 4.6 C2 8.5 11.1 8.1 1 ' 50 *
1-117 Fe-Li rich mica 130(1) 2.96 C2 13.5 12.6 12.8 5 ' 1
0 *
1-123 Fe-Li rich mica 140(1) 2.89 C2 13.8 13.0 13.6 5 ' 1
0 *
1-124 Fe-Li rich mica 140(2) 2.73 C2 13.3 12.4 13.7 5"1
0 *

200 Nespolo & Ďurovič
1-120 Fe-Li rich mica 104 3.34 C2 12.0 12.1 11.8 1 ' 50 *
1-119 Fe-Li rich mica 137 3.63 C2 13.0 13.0 11.3 1 ' 50 *
1-122 Fe-Li rich mica 177 3.39 C2 13.8 12.7 12.8 5 ' 10 *
1-121 Fe-Li rich mica 54b 3.78 C2 11.9 11.6 13.0 5"10 *
1-125 Fe-Li rich mica 24 3.72 C2 14.2 12.3 13.0 5 ' 10 *
1-115 Fe-Li rich mica 55a 3.74 C2 11.3 12.0 9.4 1 ' 50 *
1-116 Fe-Li rich mica 55b 3.21 C2 11.3 13.0 9.9 1 ' 50 *
1-126 Fe-Li rich mica 47 3.31 C2 19.2 15.8 19.4 5"10 *
1-127 Fe-Li rich mica 103 3.63 C2 16.0 14.3 17.6 5"10 *
1-114 Fe-Li rich mica 114 3.35 C2 10.2 8.5 12.2 5"10 *
Meso-dioctahedral
2-3 Ferrous celadonite (e) 10.8 C2/m --- 21.4 21.4 3 . 3
0 *
2-2 Paragonite (e) 12.1 C2/m --- 10.8 10.8 3 . 30 *
4-1 Boromuscovite 3.8 C2/m --- 12.5 12.5 3 . 30 *
Hetero-dioctahedral
2-1 Dioctahedral mica (e) 10.9 C2 --- 12.8 11.5 3"3
0 *Subfamily B – 2O polytype
Homo-trioctahedral
Ferraris et al (2000) Fluor-phlogopite 4.5 Ccmm 12.8 12.8 12.8 . .
0 * 3 *u u e e
Meso-trioctahedral
3-17 Anandite* 6.1 Pnmn 3 . 3 0 .00 * 3 *
3-18 Anandite* 6.4 Pnmn 3 . 3 0 .00 * 3 *
Subfamily A – 2M1 polytype Meso-trioctahedral
1-139 Biotite 5.6 C2/c 15.8 16.3 16.3 4.4 2 . 21 * 5 *
Sartori (1977) Lepidolite 11.3 C2/c 2.3 8.7 8.7 4.4 2 . 21 * 5 *
Sokolova et al (1979) Bityite (e) 11.5 C2/c 2.3 8.7 8.7 4.4 2 . 2
1 * 5 *
1-135 Magnesian annite 4.2 C2/c 19.4 18.6 18.6 4.4 2 . 21 * 5 *
1-138 Lepidolite 9.1 C2/c 3.6 7.5 7.5 4.4 2 . 21 * 5 *
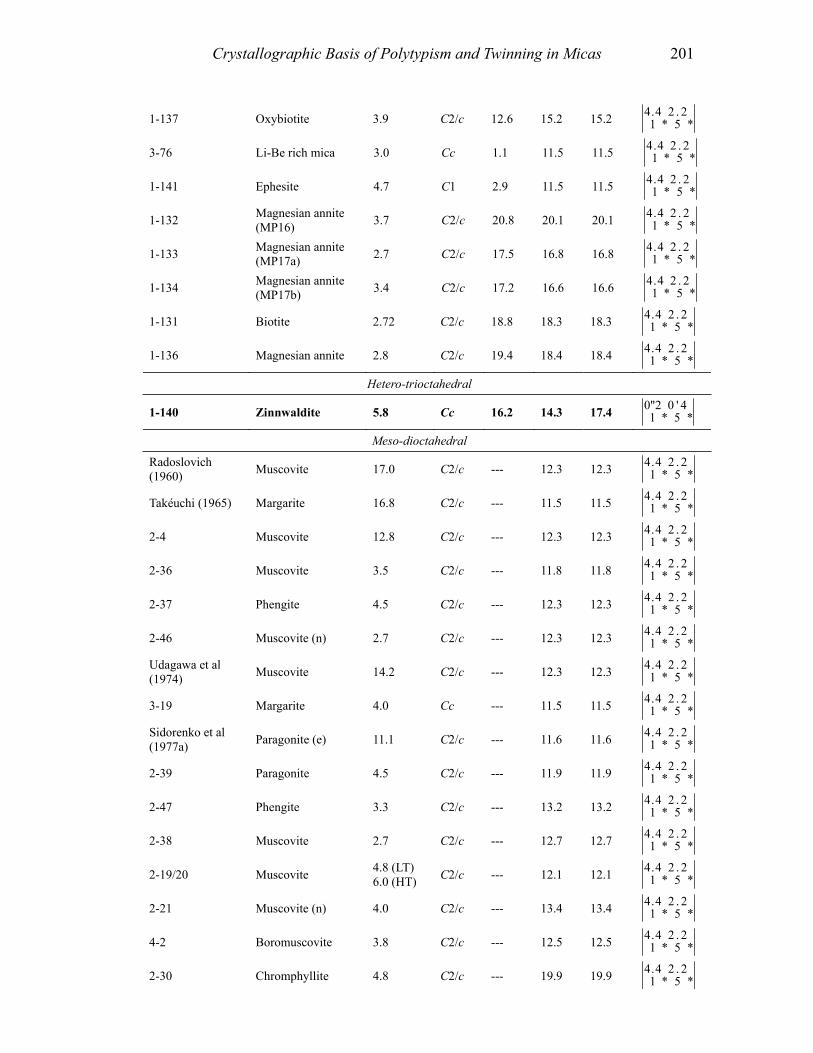
201Crystallographic Basis of Polytypism and Twinning in Micas
1-137 Oxybiotite 3.9 C2/c 12.6 15.2 15.2 4.4 2 . 21 * 5 *
3-76 Li-Be rich mica 3.0 Cc 1.1 11.5 11.5 4.4 2 . 21 * 5 *
1-141 Ephesite 4.7 C1 2.9 11.5 11.5 4.4 2 . 21 * 5 *
1-132 Magnesian annite (MP16) 3.7 C2/c 20.8 20.1 20.1 4.4 2 . 2
1 * 5 *
1-133 Magnesian annite (MP17a) 2.7 C2/c 17.5 16.8 16.8 4.4 2 . 2
1 * 5 *
1-134 Magnesian annite (MP17b) 3.4 C2/c 17.2 16.6 16.6 4.4 2 . 2
1 * 5 *
1-131 Biotite 2.72 C2/c 18.8 18.3 18.3 4.4 2 . 21 * 5 *
1-136 Magnesian annite 2.8 C2/c 19.4 18.4 18.4 4.4 2 . 21 * 5 *
Hetero-trioctahedral
1-140 Zinnwaldite 5.8 Cc 16.2 14.3 17.4 0"2 0 ' 41 * 5 *
Meso-dioctahedral
Radoslovich (1960) Muscovite 17.0 C2/c --- 12.3 12.3 4.4 2 . 2
1 * 5 *
Takéuchi (1965) Margarite 16.8 C2/c --- 11.5 11.5 4.4 2 . 21 * 5 *
2-4 Muscovite 12.8 C2/c --- 12.3 12.3 4.4 2 . 21 * 5 *
2-36 Muscovite 3.5 C2/c --- 11.8 11.8 4.4 2 . 21 * 5 *
2-37 Phengite 4.5 C2/c --- 12.3 12.3 4.4 2 . 21 * 5 *
2-46 Muscovite (n) 2.7 C2/c --- 12.3 12.3 4.4 2 . 21 * 5 *
Udagawa et al (1974) Muscovite 14.2 C2/c --- 12.3 12.3 4.4 2 . 2
1 * 5 *
3-19 Margarite 4.0 Cc --- 11.5 11.5 4.4 2 . 21 * 5 *
Sidorenko et al (1977a) Paragonite (e) 11.1 C2/c --- 11.6 11.6 4.4 2 . 2
1 * 5 *
2-39 Paragonite 4.5 C2/c --- 11.9 11.9 4.4 2 . 21 * 5 *
2-47 Phengite 3.3 C2/c --- 13.2 13.2 4.4 2 . 21 * 5 *
2-38 Muscovite 2.7 C2/c --- 12.7 12.7 4.4 2 . 21 * 5 *
2-19/20 Muscovite 4.8 (LT) 6.0 (HT) C2/c --- 12.1 12.1 4.4 2 . 2
1 * 5 *
2-21 Muscovite (n) 4.0 C2/c --- 13.4 13.4 4.4 2 . 21 * 5 *
4-2 Boromuscovite 3.8 C2/c --- 12.5 12.5 4.4 2 . 21 * 5 *
2-30 Chromphyllite 4.8 C2/c --- 19.9 19.9 4.4 2 . 21 * 5 *

202 Nespolo & Ďurovič
2-5 Mg-, Fe-bearing muscovite 2.54 C2/c 0.64 15.5 15.5 4.4 2 . 2
1 * 5 *
2-6 Mg-, Fe-bearing muscovite 2.96 C2/c 0.97 13.9 13.9 4.4 2 . 2
1 * 5 *
2-7 Mg-, Fe-bearing muscovite 3.58 C2/c 0.46 13.5 13.5 4.4 2 . 2
1 * 5 *
2-8 Mg-, Fe-bearing muscovite 2.92 C2/c 0.44 13.7 13.7 4.4 2 . 2
1 * 5 *
2-9 Mg-, Fe-bearing muscovite 3.93 C2/c 0.84 15.0 15.0 4.4 2 . 2
1 * 5 *
2-10 Mg-, Fe-bearing muscovite 2.89 C2/c 0.32 13.8 13.8 4.4 2 . 2
1 * 5 *
2-11 Mg-, Fe-bearing muscovite 2.78 C2/c 0.49 13.7 13.7 4.4 2 . 2
1 * 5 *
2-12 Mg-, Fe-bearing muscovite 2.11 C2/c 0.38 13.7 13.7 4.4 2 . 2
1 * 5 *
2-13 Mg-, Fe-bearing muscovite 3.87 C2/c 1.73 14.0 14.0 4.4 2 . 2
1 * 5 *
2-14 Mg-, Fe-bearing muscovite 3.12 C2/c 0.88 13.6 13.6 4.4 2 . 2
1 * 5 *
2-15 Mg-, Fe-bearing muscovite 2.80 C2/c 0.39 13.8 13.8 4.4 2 . 2
1 * 5 *
Smyth et al (2000) Phengite 1.3 C2/c --- 11.6 11.6 4.4 2 . 21 * 5 *
2-16 Cr-containing muscovite 2.5 C2/c 0.1 13.8 13.8 4.4 2 . 2
1 * 5 *
2-17 Cr-containing muscovite 3.1 C2/c --- 13.8 13.8 4.4 2 . 2
1 * 5 *
2-18 Cr-containing muscovite 3.3 C2/c 2.1 14.5 14.5 4.4 2 . 2
1 * 5 *
Subfamily B – 2M2 polytype
Meso-trioctahedral
1-144 Lepidolite 7.2 C2/c 2.0 8.4 8.4 2 . 2 1 .15 * 4 *
1-143 Lepidolite 9.6 C2/c 3.0 8.2 8.2 2 . 2 1 .15 * 4 *
1-142 Lepidolite 4.8 C2/c 2.5 8.6 8.6 2 . 2 1 .15 * 4 *
Meso-dioctahedral
2-50 Dioctahedral mica (e) 11.7 C2/c --- 11.2 11.2 2 . 2 1 .1
5 * 4 *
2-49 Nanpingite 5.8 C2/c --- 12.9 12.9 2 . 2 1 .15 * 4 *
Subfamily A – 3T polytype
Hetero-trioctahedral
1-145 Lepidolite 4.7 P3112 5.2 3.4 10.3 4 ' 2 2 '0 0 ' 43 * 1 * 5 *
Pavlishin et al (1981) Protolithionite 3.8 P3112 18.7 14.3 15.6 2 ' 4 0 '2 4 ' 0
3 * 1 * 5 *
1-146 Protolithionite 3.0 P3112 16.1 14.4 17.6 2"4 0"2 4"03 * 1 * 5 *

203Crystallographic Basis of Polytypism and Twinning in Micas
Hetero-dioctahedral
2-53 Muscovite 2.4 P3112 --- 11.5 12.5 0 ' 0 4 '4 2 ' 23 * 1 * 5 *
2-54 Paragonite (e) 13.0 P3112 3.4 9.2 10.3 0 ' 0 4 '4 2 ' 23 * 1 * 5 *
2-51 Phengite (KZ) 3.6 P3112 --- 13.4 13.7 0 ' 0 4 '4 2 ' 23 * 1 * 5 *
2-52 Phengite (DM) 4.5 P3112 --- 12.5 13.0 0 ' 0 4 '4 2 ' 23 * 1 * 5 *
Pavese et al (1997) Phengite (n) 7.0 (LT)
5.0 (HT) P3112 --- 11.5
11.1 (LT) 11.2 (HT)
0"0 4"4 2"23 * 1 * 5 *
Smyth et al (2000) Phengite 0.9 P3112 --- 12.7 13.0 0 ' 0 4 '4 2 ' 23 * 1 * 5 *
*The structure of anandite-2O cannot be described using an orthohexagonal C-centered cell and contains four independent octahedral positions. The symbol of this ‘polytype’ is therefore only an approximation.
(1987), where a different Si-Al ordering in the four tetrahedral sites reduced the space-group type to C1. Only one example of hetero-octahedral 2M1 polytype is known so far: the zinnwaldite refined by Rieder et al (1996). In the hetero-octahedral family, the highest layer-group for both M1 and M2 layers is C12(1): correspondingly, the highest space-group type for 2M1 is Cc, which is realized in this zinnwaldite-2M1. This mica is built up by M2 layers, with local -operations 2[310] and 2[310] for the two layers respectively, as can be easily confirmed by analyzing the OD symbols (Table 9) on the basis of the conversion rules given in Table 5a.
3) The highest space-group type for the 3T polytype is P31,212, which is compatible with the highest layer groups in all the three families, namely C12/m(1) (homo- and meso-octahedral) and C12(1) (hetero-octahedral). We are aware of nine structure refinements of 3T polytypes in which the composition of the O sheet was given. All belong to the hetero-octahedral family, and three of them wereconstructed up by M2 layers. Refinement of meso-octahedral 3T polytypes is desirable to investigate (a) the desymmetrization of the layer group in this polytype; (b) the frequency of occurrence of M2 layers that, at least in Li-rich micas, seems higher than in other polytypes.
4) The highest space-group type for the 2M2 polytype is C2/c, the same as 2M1. All the polytypes refined so far have this symmetry.
5) The polytype 2O has ideal space-group type Ccmm, which was reported only recently in a fluor-phlogopite from the Khibiny massif (Kola Peninsula, Russia) (Ferraris et al 2000). Previously, two examples were reported in anandite (Giuseppetti and Tadini 1972; Filut et al. 1985), where however an unusual crystal chemistry, including tetrahedral Fe3+ and octahedral S2- and Cl-, reduced the space-group type to Pnmn, with some indications of further reduction to P21. The anandite-2O cannot be described with the orthohexagonal C-centered cell and contains four independent octahedral positions, two of which are on mirror planes. The symbols given in Table 9 for anandite-2O are thus only a rough approximation.
In C2/c and P31,212 space-group types there are two independent T sites and the two independent M2/M3 sites. The possibility of cation ordering exists in these groups, and it is often verified in the O sheet, but more rarely in the T sheets (Bailey 1975; 1984; Amisano-Canesi et al. 1994; see also the examples of margarite and ephesite given above). If the -symmetry C12/m(1) is maintained no ordering occurs, although it is not

204 Nespolo & Ďurovič
prevented by the space-group type. Thus, this is an example of local symmetry being higher than that required by the global symmetry. As shown by Güven (1971) and by Zussman (1979), the symmetry in the interlayer is different also, which is ⎯1 in C12/m(1) λ-symmetry and 2[010] in ⎯C1 and C12(1) λ-symmetries (for details see Ferraris and Ivaldi, this volume).
CHOICE OF THE AXIAL SETTING A non-orthogonal mica polytype forms, besides the conventional (double)
monoclinic C-centered cell, both a pseudo-orthorhombic C-centered sextuple cell and a pseudo-hexagonal P triple cell. For hexagonal and trigonal polytypes (ω|| = ω⊥ = 0) the triple cell is rigorously hexagonal. For all others, the orthohexagonal relation b = a31/2 is obeyed only approximately, the deviation being measured either by an angular parameter ε (Donnay et al. 1964) or by a linear parameter η (Zvyagin and Drits 1996), which is a function of ω|| (Fig. 12). For metrically monoclinic polytypes, β (Class a) or α (Class b) of the sextuple and triple cells are in general only close to 90º.
Figure 12. A small portion of the (001) two-dimensional hp lattice of micas. ε and η (exaggerated) are the angular and linear deviations from hexagonality. A1, A2: hexagonal axes (ε = 0. η = 0); aH, bH: orthohexagonal axes (ε = 0. η = 0) of the C1 cell (bH = aH⋅31/2); a, b: pseudo-orthohexagonal axes (ε ≠ 0. η ≠ 0). The figure is drawn for the case b > bH. Black circles: lattice nodes of the crystal lattice; dashed lines: H cell of the twin lattice; dotted lines: C1 cell built on the hexagonal and pseudo-hexagonal meshes (modified after Nespolo et al. 2000a).
The monoclinic setting in which, within the Trigonal model, cn is constant and the
value of the monoclinic angle changes with the number of layers is labeled aS [Class a: cn = ⎯(1/3, 0); S stands for Standard] and bT [Class b: cn = (0,⎯1/3); T stands for Transitional]. The corresponding monoclinic l indices are labeled laS and lbT (Nespolo et al. 1997a). The metric equations in both direct and reciprocal space and the relations between l and h, k indices are given in Table 10. The bT setting is monoclinic a-unique

Crystallographic Basis of Polytypism and Twinning in Micas 205
and does not correspond to any of the settings commonly adopted to describe monoclinic crystals. Nevertheless, it facilitates the comparison of the atomic coordinates with other polytypes (Backhaus and Ďurovič 1984) and is thus the preferred setting to derive the family structure from a single polytype or vice versa. From bT a monoclinic b-unique setting is obtained through the exchange of axes by a → -b; b → -a; c → -c, so that a > b and β > 90º, as in the Smith and Yoder (1956) definition: this setting is labeled bS (Fig. 13). The exchange of axes is adopted when indexing the diffraction pattern (Nespolo et al. 1998; see also Takeda and Ross 1995).
Figure 13. Definition of the aS, bT and bS axial settings of mica polytypes. aS and bS settings have a < b, bT setting has b < a [used by permission of the editor of Mineralogical Journal, from Nespolo (1999) Fig. 2, p. 56].
For each Series and each Class, K = 0 of the Subclass 1, see Equation (2), determines the axial setting of the first polytype of the Series, which is termed the Basic axial setting. All the polytypes belonging to the same Series and the same Class can be indexed in a setting whose axes are parallel to the axes of the Basic axial setting but whose period along c is 3K+L [Eqn. (2)] times the corresponding period of the Basic axial setting. For each Series the angle is constant, within the Trigonal model, and the value of cn, non-translationally reduced, changes with the number of layers: this setting is termed Fixed-angle setting. For the two Classes this setting is symbolized by 3n,aF and 3n,bF, which for

206 Nespolo & Ďurovič
Series 0 are shortened in aF and bF (Nespolo et al. 1997a; 1998) (Fig. 14). This setting is obtained from aS and bS by means of the transformation:
( )( ) ( ) ( )
( ) ( )3 , ;3 , 3 , ;3 ,
1
1
S F
1 0 1 1
0 1 00 0 1
n n n na b a b
L L
L
K L
a b c a b c
−
−
⎡ ⎤− − ⋅ + −⎢ ⎥⎢ ⎥− =⎢ ⎥⎢ ⎥⎣ ⎦
(3)
where L (Subclass) and K are defined in Equation (2). The choice of a common setting for polytypes belonging to different Series is instead geometrically not possible, because these polytypes are not based on the same Basic axial setting (Fig. 14).
GEOMETRICAL CLASSIFICATION OF RECIPROCAL LATTICE ROWS
By considering the lC1 (mod 3) index of reciprocal lattice nodes (Table 10) on rows related by n×60º rotations (0 ≤ n ≤ 5), Nespolo et al (1997b, 2000a) have shown that there are only nine translationally independent rows parallel to c* (Fig. 15) indicated as Ri, 1 ≤ i ≤ 9. In each Ri the same distribution of "present" and "absent" reflections is repeated along a* and b* with 3p and 3q translations (p and q are integers of the same parity). Ri are defined in terms of h and k as: [hi(mod 3), ki(mod 3), l] and are distributed along the edges and diagonals of a rhombus-shaped unit, termed tessellation rhombus (Fig. 15, solid lines), which can tessellate the entire reciprocal space by (3p, 3q) translations. A smaller unit, termed minimal rhombus, can be drawn (Fig. 15, dotted lines), defined by the same Ri each taken only once. Opposite edges are different and, contrary to the tessellation rhombus, the minimal rhombus does not represent a translational unit.
The two rhombi have six possible orientations, which represent equivalent descriptions of the same reciprocal lattice: they simply differ in the distribution of the Ri. Six equivalent rhombi are obtained by applying the five rotations (besides the identity) to the hi, ki indices of each of the nine Ri of the original rhombus and bringing the resulting Ri within the area spanned by the original rhombus through a (3p, 3q) translation between equivalent rows. The rows that can be obtained by rotating the original rhombus are within a star-polygon constructed by the six rhombi with the common origin (Fig. 15). The values of p and q to be considered are those connecting rows internal to the star-polygon but external to the original rhombus with rows internal to the original rhombus, i.e. (0, ±2), (1, ±1) and (2, ±2).
Tabl
es -
21
Tab
le 1
0. M
etric
equ
atio
n in
dire
ct a
nd re
cipr
ocal
spac
e an
d re
latio
n be
twee
n M
iller
indi
ces o
rthog
onal
and
mon
oclin
ic se
tting
s for
the
two
Cla
sses
(afte
r Nes
polo
199
9).
Cla
ssM
etric
equ
atio
ns in
di
rect
spac
e M
etric
equ
atio
ns in
re
cipr
ocal
spac
e re
latio
n be
twee
n l C
1 and
h, k
indi
ces
rela
tion
betw
een
orth
ogon
al a
nd
mon
oclin
ic l
indi
ces
acc
osβ
= -a
/3
a*co
sβ∗
= c*
/3l C
1 = h
(mod
3)
la S. =
(lC
1 – h
)/3
bcc
osα
= -b
/3b*
cosα∗
= c*
/3l C
1 = k
(mod
3)
lb T =
(lC
1 – k
)/3

Crystallographic Basis of Polytypism and Twinning in Micas 207
Figure 14. Schematic view of the axial settings of mica polytypes. Black circles: direct lattice nodes. The number below each node indicates the number of layers of the polytype to which that node belongs. Horizontal axis is ±a or ±b depending on the Class and on the setting used. The c axes of S and F settings are shown as solid and dotted lines respectively. In all settings, the reference is right-handed. The superscript a or b in the S and F symbols is omitted, since the figure is drawn for both Classes (they differ in the label of the horizontal axis). The figure shows that in cases of polytypes with a number of layers multiple of 3, the c axis of the corresponding F setting does not pass on any lattice node: the F setting of the next Series has thus to be used.
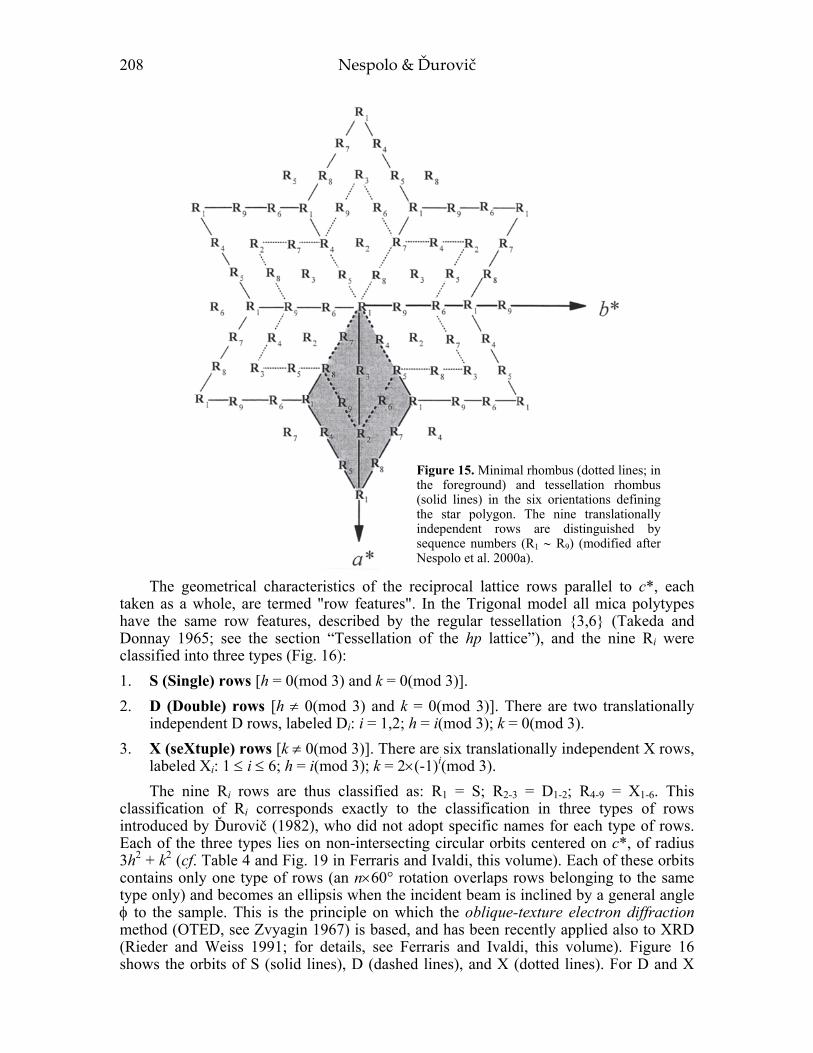
208 Nespolo & Ďurovič
The geometrical characteristics of the reciprocal lattice rows parallel to c*, each taken as a whole, are termed "row features". In the Trigonal model all mica polytypes have the same row features, described by the regular tessellation {3,6} (Takeda and Donnay 1965; see the section “Tessellation of the hp lattice”), and the nine Ri were classified into three types (Fig. 16): 1. S (Single) rows [h = 0(mod 3) and k = 0(mod 3)]. 2. D (Double) rows [h ≠ 0(mod 3) and k = 0(mod 3)]. There are two translationally
independent D rows, labeled Di: i = 1,2; h = i(mod 3); k = 0(mod 3). 3. X (seXtuple) rows [k ≠ 0(mod 3)]. There are six translationally independent X rows,
labeled Xi: 1 ≤ i ≤ 6; h = i(mod 3); k = 2×(-1)i(mod 3). The nine Ri rows are thus classified as: R1 = S; R2-3 = D1-2; R4-9 = X1-6. This
classification of Ri corresponds exactly to the classification in three types of rows introduced by Ďurovič (1982), who did not adopt specific names for each type of rows. Each of the three types lies on non-intersecting circular orbits centered on c*, of radius 3h2 + k2 (cf. Table 4 and Fig. 19 in Ferraris and Ivaldi, this volume). Each of these orbits contains only one type of rows (an n×60° rotation overlaps rows belonging to the same type only) and becomes an ellipsis when the incident beam is inclined by a general angle φ to the sample. This is the principle on which the oblique-texture electron diffraction method (OTED, see Zvyagin 1967) is based, and has been recently applied also to XRD (Rieder and Weiss 1991; for details, see Ferraris and Ivaldi, this volume). Figure 16 shows the orbits of S (solid lines), D (dashed lines), and X (dotted lines). For D and X
Figure 15. Minimal rhombus (dotted lines; in the foreground) and tessellation rhombus (solid lines) in the six orientations defining the star polygon. The nine translationally independent rows are distinguished by sequence numbers (R1 ∼ R9) (modified after Nespolo et al. 2000a).

Crystallographic Basis of Polytypism and Twinning in Micas 209
rows, two types of orbits exist: type I (DI and XI orbits, thick lines) connects one set of six D or X rows, whereas type II (DII and XII orbits, thin lines) connects two sets of six D or X rows. The n×60º rotations about c* lead to an alternate exchange of the two D-type Ri located on the long diagonal of the minimal rhombus, and they exchange the six X-type Ri on the edges of the minimal rhombus in six different ways.
SUPERPOSITION STRUCTURES, FAMILY STRUCTURE AND FAMILY REFLECTIONS
By superposing two or more identical copies of the same polytype translated by a superposition vector (i.e. a vector corresponding to a submultiple of a translation period) a fictitious structure is obtained, which is termed a superposition structure. Among the infinitely possible superposition structures, that structure having all the possible positions of each OD layers is termed a family structure: it exists only if the shifts between
Figure 16. Rotational relation between reciprocal lattice rows parallel to c*. Because of the pseudo-hexagonal symmetry of the 001 r.p., each type of row (S, D, X) lies on a circular orbit around c* with radius 3h + k. Solid, dashed and dotted orbits contain S, D and X rows respectively. D and X orbits are further subdivided into those containing only one set of six rows (DI and XI, thick orbits) and those containing two sets of six rows (DII and XII, thin orbits). The n × 60º rotations, which correspond to the relative orientation of twinned mica individuals, relate only rows of the same type and same set (S, DI, DII, XI, XII), whereas the non-crystallographic rotations typical of plesiotwins relate rows of the same type but of different sets (DI and DII; XI and XII) (modified after Nespolo et al. 2000a).
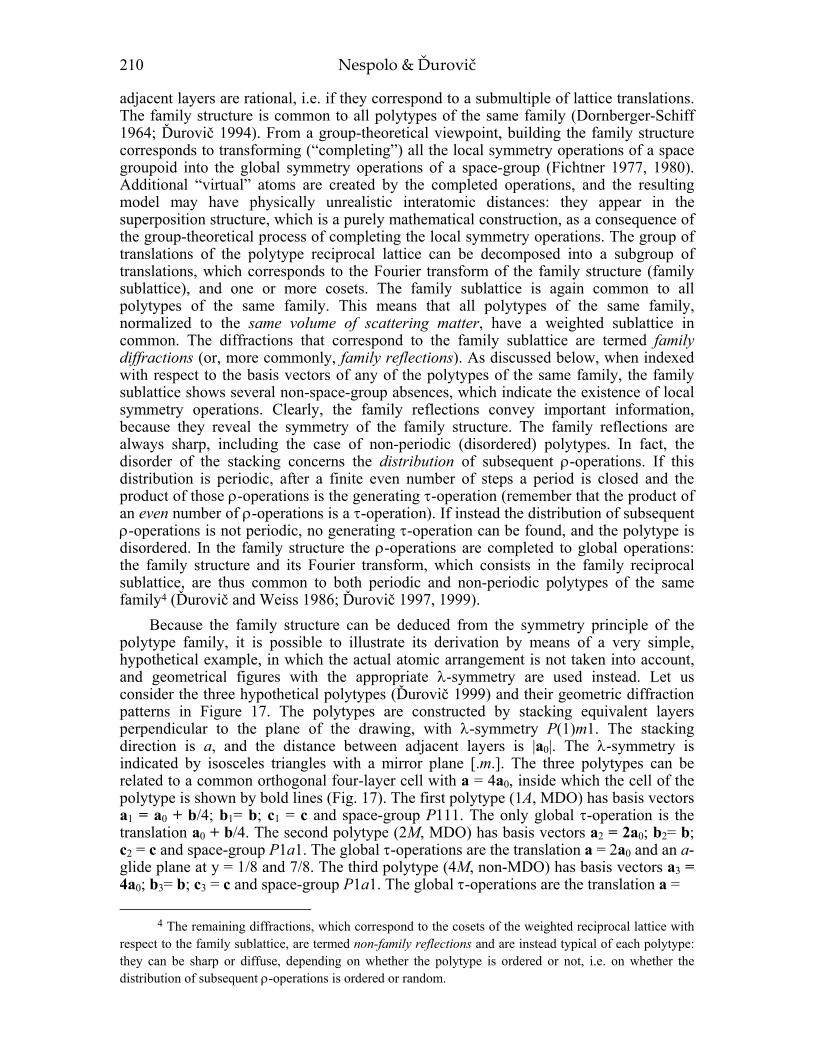
210 Nespolo & Ďurovič
adjacent layers are rational, i.e. if they correspond to a submultiple of lattice translations. The family structure is common to all polytypes of the same family (Dornberger-Schiff 1964; Ďurovič 1994). From a group-theoretical viewpoint, building the family structure corresponds to transforming (“completing”) all the local symmetry operations of a space groupoid into the global symmetry operations of a space-group (Fichtner 1977, 1980). Additional “virtual” atoms are created by the completed operations, and the resulting model may have physically unrealistic interatomic distances: they appear in the superposition structure, which is a purely mathematical construction, as a consequence of the group-theoretical process of completing the local symmetry operations. The group of translations of the polytype reciprocal lattice can be decomposed into a subgroup of translations, which corresponds to the Fourier transform of the family structure (family sublattice), and one or more cosets. The family sublattice is again common to all polytypes of the same family. This means that all polytypes of the same family, normalized to the same volume of scattering matter, have a weighted sublattice in common. The diffractions that correspond to the family sublattice are termed family diffractions (or, more commonly, family reflections). As discussed below, when indexed with respect to the basis vectors of any of the polytypes of the same family, the family sublattice shows several non-space-group absences, which indicate the existence of local symmetry operations. Clearly, the family reflections convey important information, because they reveal the symmetry of the family structure. The family reflections are always sharp, including the case of non-periodic (disordered) polytypes. In fact, the disorder of the stacking concerns the distribution of subsequent ρ-operations. If this distribution is periodic, after a finite even number of steps a period is closed and the product of those ρ-operations is the generating τ-operation (remember that the product of an even number of ρ-operations is a τ-operation). If instead the distribution of subsequent ρ-operations is not periodic, no generating τ-operation can be found, and the polytype is disordered. In the family structure the ρ-operations are completed to global operations: the family structure and its Fourier transform, which consists in the family reciprocal sublattice, are thus common to both periodic and non-periodic polytypes of the same family4 (Ďurovič and Weiss 1986; Ďurovič 1997, 1999).
Because the family structure can be deduced from the symmetry principle of the polytype family, it is possible to illustrate its derivation by means of a very simple, hypothetical example, in which the actual atomic arrangement is not taken into account, and geometrical figures with the appropriate λ-symmetry are used instead. Let us consider the three hypothetical polytypes (Ďurovič 1999) and their geometric diffraction patterns in Figure 17. The polytypes are constructed by stacking equivalent layers perpendicular to the plane of the drawing, with λ-symmetry P(1)m1. The stacking direction is a, and the distance between adjacent layers is |a0|. The λ-symmetry is indicated by isosceles triangles with a mirror plane [.m.]. The three polytypes can be related to a common orthogonal four-layer cell with a = 4a0, inside which the cell of the polytype is shown by bold lines (Fig. 17). The first polytype (1A, MDO) has basis vectors a1 = a0 + b/4; b1= b; c1 = c and space-group P111. The only global τ-operation is the translation a0 + b/4. The second polytype (2M, MDO) has basis vectors a2 = 2a0; b2= b; c2 = c and space-group P1a1. The global τ-operations are the translation a = 2a0 and an a-glide plane at y = 1/8 and 7/8. The third polytype (4M, non-MDO) has basis vectors a3 = 4a0; b3= b; c3 = c and space-group P1a1. The global τ-operations are the translation a =
4 The remaining diffractions, which correspond to the cosets of the weighted reciprocal lattice with respect to the family sublattice, are termed non-family reflections and are instead typical of each polytype: they can be sharp or diffuse, depending on whether the polytype is ordered or not, i.e. on whether the distribution of subsequent ρ-operations is ordered or random.

Crystallographic Basis of Polytypism and Twinning in Micas 211
Figure 17. Schematic representation of three hypothetical structures belonging to the same family. The layers are perpendicular to the plane of the drawing, and their constituent atomic configurations are represented by isosceles triangles with λ-symmetry [.m.]. All structures are related to a common, orthogonal four-layer cell with a = 4a0. The family structure is obtained by superposing two identical copies of the same polytype, translated by b/4, the superposition vector. The diffraction indices refer also to the common cell. Family diffractions correspond to ˆ k = 2k (open circles), and the non-family diffractions, characteristic for individual polytypes, to ˆ k = 2k+1 (close circles) (modified after Durovic and Weiss (1986).

212 Nespolo & Ďurovič
4a0 and an a-glide plane at y = 0 and y = 1/2. The geometric diffraction pattern of each of these polytypes can be divided into two parts: k̂ = 2k (open circles) and k̂ = 2k+1 (full circles). The k̂ = 2k are the family reflections, which define the family reciprocal sublattice, common to all the three polytypes. The Fourier transform of this subgroup of diffraction gives the family structure, with space-group C1m1, a = 2a0, b = b/2: the superposition vector is b/2. The non-family reflections are those for which k̂ = 2k+1: the number of reflections along each row in the four-layer reciprocal cell is the same as the number of layers in the period of the polytype.
Family structure and family reflections of mica polytypes
For micas, the family structure of the Pauling model is nine-fold (the supergroup of translation in direct space has the order nine) and the superposition vectors are ±a/3 and ±b/3; its symmetry is P6/mmm (Dornberger-Schiff et al. 1982). To any of the atoms in the layer, eight additional atoms are generated in the family structure, with coordinates (x±1/3, y); (x, y±1/3) and (x±1/3, y±1/3). The family reflections are those with h = 0(mod 3) and k = 0(mod 3), and correspond to S rows. The subgroup of translations in reciprocal space has the order nine. Because the layer stagger is |a|/3, the family vectors of the Pauling model complete the local symmetry operations of space groupoids to global symmetry operations of space groups after one single layer. Therefore, the period along the c axis of the family structure is c0 = 1/c*1 = c1Msinβ1M and thus corresponds to the vertical distance between two closest interlayer cations. The basis vectors of the family structure are AF1 = A1/3, AF2 = A2/3, CF = c0. (Backhaus and Ďurovič 1984; Ďurovič et al. 1984; Ďurovič 1994).
In the Trigonal model each of the three families (homo-, meso- and hetero-octahedral) splits into two subfamilies, A and B. For both subfamilies the family structure is three-fold and the superposition vectors are ±b/3. To any of the atoms in the layer, two additional atoms are generated in the family structure, with coordinates (x, y±1/3). The family reflections are those with k = 0(mod 3) and correspond to S and D rows. The subgroup of translation in reciprocal space has the order three. The family vectors complete the local symmetry operations of space groupoids to global symmetry operations of space groups after three layers for subfamily A, but after two layers for subfamily B. The basis vectors for the family structure are thus AF1 = (A1+2A2), AF2 = -(2A1+A2), CF. For subfamily A, CF = 3c0; for subfamily B, CF = 2c0. The symmetry of the family structure is H⎯R31m (where the subscript R indicates that the smaller cell is rhombohedral) for subfamily A, and H63/mcm for subfamily B (Ďurovič 1994). The adoption of the H-centered cell allows the description of the family structures and the real structures in the same axes, but additional absences appear in the diffraction pattern (cf. Smrčok et al. 1994, Appendix, for cronstedtite-3T). Mixed-rotation polytypes are OD structures only when the ditrigonal rotation of the tetrahedra is zero. Their family structure and family reflections are those of the Pauling model (S rows).
From the practical viewpoint, as noted by Ďurovič (1982), the family reflections of the nine-fold family structure (S rows) are common to all members of a family and are thus not useful for the purpose of distinguishing individual polytypes. D rows instead are characteristic of all members of a subfamily (A or B, in case of micas), permit to distinguish the kind of polytype (subfamily A, subfamily B or mixed-rotation).
The real layers building micas deviate from their archetypes by several distortions, and the shifts between successive layers are in general not exactly rational. The intensities, but not the geometry, of the family reflections differ from polytype to polytype of the same family, and the divergence increases with the deviation of the real layers from their archetypes. Notwithstanding, the concepts of family structure and family reflections are useful in the identification of twins and polytypes, as shown below.

Crystallographic Basis of Polytypism and Twinning in Micas 213
REFLECTION CONDITIONS In the diffraction pattern of mica polytypes, systematic non-space-group absences
extensively appear. The International Tables for Crystallography term this kind of absences additional reflection conditions (Hahn and Vos 2002). This definition does not provide anything about the kind of information one can get from these absences. As seen above, the absences along S and D rows derive from the existence of local symmetry operations that relate pairs of packets. These local symmetry operations are not accounted for in the space-group type. In the Trigonal model, any mica polytype of a given family is constructed from layer archetypes in which the atoms in each plane are distributed according to a hexagonal pattern. These atoms are either on special positions, or on positions that, without corresponding to any translation-free symmetry operation of the space-group type, have higher translational symmetry. These positions, under the symmetry operations of a space-group type, define sets of points (crystallographic orbits) the eigensymmetry group of which includes additional translations, and are known as extraordinary orbits of space-groups (Wondratschek 1976; Matsumoto and Wondratschek; 1979). The corresponding lattice of translation vectors is a proper superlattice of the polytype lattice. In reciprocal space, these vectors correspond to a sublattice, which shows systematic non-space-group absences when indexed with respect to the basis vectors of the polytype. The OD description is based on the existence of local symmetry operations, whereas the description in terms of crystallographic orbits is based on the points on which those local symmetry operations act. In spite of the different languages, the concepts are basically the same. The approach involving crystallographic orbits is not specifically related to VC structures but it is more general. The possible superlattices were however derived for all space-group types within the same syngony (Engel et al. 1984). There are no derivations yet for the cases in which the superlattice belongs to a Bravais system higher than that of the entire lattice. The superlattice common to all polytypes of a family (family superlattice, i.e. the lattice of the family structure) corresponds to this latter case (with the exception of trigonal-hexagonal polytypes, of which only 3T has been reported so far). A general symmetry analysis of mica polytypism in terms of crystallographic orbits is nowadays a completely open task, but the non-space-group absences along S and D rows are interpretable in terms of extraordinary orbits as well. The deviations of layers from their archetypes correspond to the movement of part of the atoms slightly away from the positions of higher translational symmetry, towards general positions. As a consequence, violations of the non-space-group absences appear as faint reflections between pairs of family reflections. These faint reflections can be recorded in dioctahedral micas (Rieder 1968) and, with longer exposure times, in Li-rich trioctahedral micas (Rieder 1970), but they are almost undetectable in Li-poor trioctahedral micas. This sequence is in accordance with the extent of the structural distortions, which decreases in the same order.
The reflection conditions in the two subfamilies were derived by Nespolo (1999). The number and positions of reflections along the D rows reveal the symmetry of the family structure (H⎯R31m: subfamily A; H63/mcm: subfamily B; P6/mmm: mixed-rotation). In addition, they are particularly useful in evaluating the possible presence of twins. Taking into account that for non-orthogonal polytypes only one out of three of the orthogonal l indices corresponds to integer monoclinic indices, and that subfamily B polytypes necessarily contain an even number of layers, the reflection conditions are (N and N′ are the number of layers in the conventional and orthogonal cell respectively): 1. S rows (family reflections of the nine-fold family structure): one reflection out of N
always occurs, with presence criterion lC1= 0(mod N′). 2. D rows: one reflection (family reflection) out of N occurs for subfamily A polytypes
[presence criterion lC1 = (±N′h/3)(mod N′), “+” for the obverse setting of the family

214 Nespolo & Ďurovič
structure, “–” for the reverse setting], two (family reflections) for subfamily B [equally spaced, at lC1 = 0(mod N′/2)], and N′ (non-family reflections) for mixed-rotation polytypes.
3. X rows: N reflections appear in the c*1 repeat (non-family reflections for all polytypes). One or more of the N reflections along X rows (and for mixed-rotation polytypes
also along D rows) may be very weak or absent. This non-space-group absence is related not to the symmetry of the family structure, as for family reflections, but to the stacking mode within the polytype.
The family structure of subfamily A polytypes admits a primitive rhombohedral cell, and its lattice (family sublattice) can be overlapped for all polytypes belonging to subfamily A only if it is rotated by 180º around the normal to the layer when comparing polytypes built by layers of opposite orientational parity. This is because the rhombohedral primitive cell of the family structure for subfamily A polytypes is in the obverse setting for one orientational parity of the layers (odd orientational parity of the symbols), but in the reverse setting for the other (even orientational parity of the symbols). In Series 0, all polytypes belonging to subfamily A are Class a polytypes. Polytypes belonging to a different Subclass have opposite orientational parity. The aF setting alternates the directions of (a, b) and (a*, b*) axes with the Subclass (Fig. 14) and is exactly the axial setting leading to the overlap of the sublattice built on family reflections. In higher Series, polytypes belonging to subfamily A can be orthogonal or Class b polytypes and there is no longer a 1:1 correspondence.
Subfamily B polytypes show two reflections along D rows. However, polytypes of this subfamily either are orthogonal or belong to Class b, for which the non-right angle is α (before the axes interchange) and the lC1 index of the superlattice nodes does not depend on h. The reciprocal sublattice in this case matches for all polytypes, which is consistent with the fact that the primitive cell of the family structure is hexagonal.
In mixed-rotation polytypes, the family reflections are only those of the nine-fold family structure and appear along S rows. D rows convey important information, because the different number of reflections along the rows, or their diffuseness, unambiguously reveals the mixed-rotation character of the polytype.
NON-FAMILY REFLECTIONS AND ORTHOGONAL PLANES Reciprocal central planes, which have c* in common, can be usefully classified, on
the basis of the rows they contain, into SD and SX. Here we consider the six densest central planes, which are sufficient for a twin/polytype analysis. The three densest central reciprocal planes (r.p., hereafter) are of type SX: 0k*, hhl and⎯hhl. These planes have the shortest separation between pairs of reciprocal lattice rows parallel to c* (about 0.22Å-1), and are followed by the three densest SD central r.p. h0l, h.3h.l and ⎯h.3h.l (about 0.38Å-1). These six central planes are shown in Figure 18, projected onto the (a*, b*) plane. The three SD central planes are 60º apart each, and the same holds for the three central SX planes. The two kinds of planes are each 30º apart. The SD central planes show the symmetry of the family structure. Then, from the intensities measured along one or more X rows, the stacking sequence can be determined. However, the presence of twinning must be excluded before analyzing the intensity distribution, and for this purpose the analysis of the geometry of the diffraction pattern, in particular the number and type of orthogonal planes, is of primary importance. A plane is orthogonal if the direction r* corresponding to the line perpendicular to c* and passing through the origin (a direction that belongs to the orthohexagonal cell) contains a node for each row parallel to c*.

Crystallographic Basis of Polytypism and Twinning in Micas 215
Figure 18. (001) projection of mica reciprocal lattice. Open circles: S rows; open triangles: D rows; close circles: X rows. The six central planes (three SD and three SX) that can commonly be recorded by a photographic technique such as precession camera are indicated (modified after Nespolo et al.1999d). Cf. Figure 4 in Sadanaga and Takeda (1969) and Figure 1 in Durovic (1982).,
In case of a non-orthogonal plane, no nodes are present on r* along the X rows, and the node closest to r* is at a height ±c*1/3N, where N is the number of layers in the conventional cell. If the node on r* or closest to it corresponds to an absent reflection, the orthogonality of the plane must be judged from the position of the two adjacent reflections, whose height is either ±c*1/N (orthogonal plane) or ∓2c*1/3N (non-orthogonal plane). For D rows the family character of the reflections should be considered. In subfamily A polytypes, reflections appear at ±c*1/3 (non-orthogonal SD plane); in subfamily B polytypes, reflections appear at 0 and c*1/2 (orthogonal SD plane); in mixed-rotation polytypes, the D rows correspond to non-family rows and the same criteria given for X rows hold. Finally, S rows always contain a node on r*.
The number and features of the orthogonal planes (as defined above) depend both on the Class (lattice features) and on the subfamily (OD character). These are easily obtained by taking into account that polytypes in subfamily B and in subfamily A Series > 0 never belong to Class a, whereas polytypes in subfamily A Series 0 always belong to Class a. 1. Orthogonal polytypes. In case of subfamily A polytypes, only the three SX central
planes are orthogonal, according to the above definition. For subfamily B and mixed-rotation polytypes, all the six central planes are orthogonal.
2. Class a polytypes. One SX central r.p. is orthogonal: 0kl. 3. Class b polytypes. None of the three SX central planes are orthogonal. In subfamily
A polytypes (Series > 0) the SD central planes are non-orthogonal and thus none of the six densest central planes is orthogonal. In subfamily B, the three densest SD
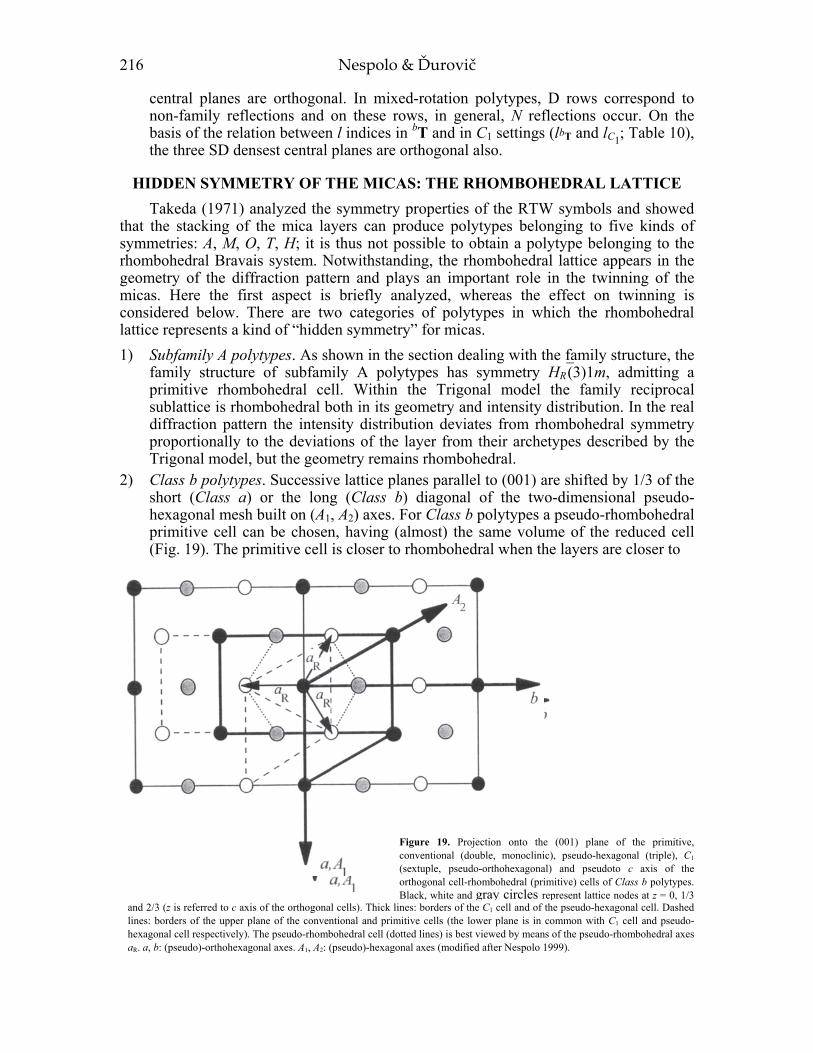
216 Nespolo & Ďurovič
Figure 19. Projection onto the (001) plane of the primitive,conventional (double, monoclinic), pseudo-hexagonal (triple), C1
(sextuple, pseudo-orthohexagonal) and pseudoto c axis of theorthogonal cell-rhombohedral (primitive) cells of Class b polytypes.Black, white and gray circles represent lattice nodes at z = 0, 1/3and 2/3 (z is referred to c axis of the orthogonal cells). Thick lines:b d f h C ll d f h d h l ll D h d
and 2/3 (z is referred to c axis of the orthogonal cells). Thick lines: borders of the C1 cell and of the pseudo-hexagonal cell. Dashedlines: borders of the upper plane of the conventional and primitive cells (the lower plane is in common with C1 cell and pseudo-hexagonal cell respectively). The pseudo-rhombohedral cell (dotted lines) is best viewed by means of the pseudo-rhombohedral axesaR. a, b: (pseudo)-orthohexagonal axes. A1, A2: (pseudo)-hexagonal axes (modified after Nespolo 1999).
central planes are orthogonal. In mixed-rotation polytypes, D rows correspond to non-family reflections and on these rows, in general, N reflections occur. On the basis of the relation between l indices in bT and in C1 settings (lbT and lC1; Table 10), the three SD densest central planes are orthogonal also.
HIDDEN SYMMETRY OF THE MICAS: THE RHOMBOHEDRAL LATTICE Takeda (1971) analyzed the symmetry properties of the RTW symbols and showed
that the stacking of the mica layers can produce polytypes belonging to five kinds of symmetries: A, M, O, T, H; it is thus not possible to obtain a polytype belonging to the rhombohedral Bravais system. Notwithstanding, the rhombohedral lattice appears in the geometry of the diffraction pattern and plays an important role in the twinning of the micas. Here the first aspect is briefly analyzed, whereas the effect on twinning is considered below. There are two categories of polytypes in which the rhombohedral lattice represents a kind of “hidden symmetry” for micas. 1) Subfamily A polytypes. As shown in the section dealing with the family structure, the
family structure of subfamily A polytypes has symmetry HR⎯(3)1m, admitting a primitive rhombohedral cell. Within the Trigonal model the family reciprocal sublattice is rhombohedral both in its geometry and intensity distribution. In the real diffraction pattern the intensity distribution deviates from rhombohedral symmetry proportionally to the deviations of the layer from their archetypes described by the Trigonal model, but the geometry remains rhombohedral.
2) Class b polytypes. Successive lattice planes parallel to (001) are shifted by 1/3 of the short (Class a) or the long (Class b) diagonal of the two-dimensional pseudo-hexagonal mesh built on (A1, A2) axes. For Class b polytypes a pseudo-rhombohedral primitive cell can be chosen, having (almost) the same volume of the reduced cell (Fig. 19). The primitive cell is closer to rhombohedral when the layers are closer to

Crystallographic Basis of Polytypism and Twinning in Micas 217
their archetypes as described by the Trigonal model. The general reflection conditions for the rhombohedral lattice in hexagonal axes, -h+k+l = 3n, expressed in the C1 setting become: -3h+k+2l = 6n. Taking into account the C centering condition, the latter equation corresponds to l(mod 3) = k(mod 3), which is simply an alternative expression of the condition that monoclinic indices are integers, given in Table 10 for the bT setting (Nespolo 1999). Because non-orthogonal polytypes of subfamily A Series > 0 belong to Class b, in
this case the “hidden” rhombohedral symmetry appears both in the family sublattice and in the entire polytype lattice.
TWINNING OF MICAS: THEORY The definition and classification of twinning is given in Appendix A. The pseudo-
symmetries typical of micas made the recognition of the twin laws difficult, and Friedel initially classified mica twins among the “macles aberrantes” (Friedel 1904, p. 222), i.e. oriented crystal associations without either twin plane or twin axis stricto sensu. The derivation of the twin laws for mica polytypes must consider the point groups of the twin lattice and of the lattice of the individual, and the point group of the syngony of the individual. The twin operators are the point symmetry operators of the twin lattice not belonging to the point group of the individual and can be obtained by coset decomposition. The decomposition of the twin lattice point group (order m) yields one subgroup (the point group of the individual, order m′ < m) and n = m/m′-1 cosets corresponding to the twin laws. Hereafter the subgroup corresponding to the point group of the individual is always given first, and the twin laws follow as cosets No. 1 to n. All merohedral polytypes, in any syngony, may undergo twinning by syngonic merohedry: the twin laws depend on the point group of the polytype and should thus be derived case by case (see the example for 3T below). Instead, twins other than by syngonic merohedry can be derived with a general procedure. Hereafter, indexing is given in the (pseudo)orthohexagonal setting of the twin lattice. 1) Polytypes of the orthorhombic syngony with a hP lattice may undergo twinning by
metric merohedry, the twin lattice coinciding with the lattice of the individual. The coset decomposition gives two twin laws:
[ ] [ ] [ ] ( ) ( ) ( ){ }[ ] [ ] [ ] [ ] [ ] ( ) ( ){ }[ ] [ ] [ ] [ ] [ ] ( ) ( ){ }
010 001 100 010 001 100
001 001 110 001 001 130110 130
001 001 310 001 001 110310 110
6 / 1,2 ,2 ,2 , 1, , ,
6 ,6 ,2 ,2 , 6 , 6 , ,
3 ,3 ,2 ,2 , 3 , 3 , , .
mmm m m m
m m
m m
+ − + −⎡ ⎤⎣ ⎦
− + − +⎡ ⎤⎣ ⎦
= ∪
∪ ∪
∪
(4)
All the operators corresponding to the same twin law are equivalent under the action of the symmetry operators of the orthorhombic syngony. If the lattice is only oC, twinning is by pseudo-merohedry. The twin lattice (hP) does not coincide exactly with the lattice of the individual, because for the latter the orthohexagonal relation b = a31/2 is only approximated. However, the two lattices have the three orthohexagonal axes parallel. The coset decomposition is the same as given in Equation (4), but the non-zero obliquity (ω = ω|| ≠ 0, ω⊥ = 0) makes the operators in each of the two cosets not equivalent, as described in detail below.

218 Nespolo & Ďurovič
2) Polytypes of the monoclinic and triclinic syngony with an hP lattice may undergo twinning by metric merohedry. For the monoclinic syngony the coset decomposition gives five twin laws, each with four equivalent twin operators:
[ ] ( ){ } [ ] [ ] ( ) ( ){ }[ ] [ ] [ ] ( ){ } [ ] [ ] [ ] ( ){ }[ ] [ ] ( ){ } [ ] [ ] ( ){ }
010 001 100010 001 100
001 310 001 001 110 001110 130
001 001 001 001310 110110 130
6 / 1, 2 , 1, 2 , 2 , ,
3 , 2 , 3 , 6 , 2 , 6 ,
3 , 2 , 3 , 6 , 2 , 6 ,
mmm m m m
m m
m m
− − − −
+ + + +⎡ ⎤ ⎡ ⎤⎣ ⎦ ⎣ ⎦
= ∪ ∪
∪ ∪ ∪
∪ ∪
(5)
whereas for the triclinic syngony the coset decomposition gives eleven twin laws, each with two equivalent twin operators:
{ } [ ] ( ){ } [ ] ( ){ } [ ] ( ){ }
[ ] [ ]{ } [ ] ( ){ } [ ] [ ]{ } [ ] ( ){ }[ ] [ ]{ } ( ){ } [ ] [ ]{ } ( ){ }
010 001 100010 001 100
001 001 310 001 001 110110 130
001 001 001 001310 110110 130
6 / 1, 1 2 , 2 , 2 ,
3 , 3 2 , 6 , 6 2 ,
3 , 3 2 , 6 , 6 2 , .
mmm m m m
m m
m m
− − − −
+ + + +⎡ ⎤ ⎡ ⎤⎣ ⎦ ⎣ ⎦
= ∪ ∪ ∪ ∪
∪ ∪ ∪ ∪ ∪
∪ ∪ ∪ ∪
(6)
If the lattice of the individual is oC, the first two cosets in Equation (5) and the first four cosets [Eqn. (6)] correspond to metric merohedry, whereas the others correspond to pseudo-merohedry (ω = ω|| ≠ 0, ω⊥ = 0). If the lattice of the individual is mC Class a, the twin laws in Equations (5) and (6) correspond to reticular pseudo-merohedry. The hP twin lattice is a sublattice for the individual, with subgroup of translation 3: the twin index is thus 3.
3) Monoclinic and triclinic Class b polytypes with a two-dimensional hexagonal mesh in the (001) plane and a cn projection of exactly |b|/3 has a hR lattice. Twin elements belonging to the hR lattice but not to the monoclinic or triclinic syngony correspond to the twinning by metric merohedry, whereas twin elements belonging to the hP sublattice but not to the hR lattice correspond to twinning by reticular merohedry. The subgroup of translation defining the hP sublattice is 3, and thus the twin index is 3 also. The coset decomposition gives five (monoclinic syngony) or eleven (triclinic syngony) twin laws: monoclinic syngony:
[ ] ( ){ } [ ] [ ] [ ] ( ){ }[ ] [ ] ( ){ } [ ] [ ] ( ) ( ){ }[ ] [ ] [ ] ( ){ } [ ] [ ] ( ){ }
100 001 110 001100 130
001 001 001 100 001 100110 130
001 310 001 001 001110 310 110
6 / 1, 2 , 1, 3 , 2 , 3 ,
3 , 2 , 3 , 2 , 2 , ,
6 , 2 , 6 , 6 , 2 , 6 , .
mmm m m
m m m
m m
− −
+ +⎡ ⎤⎣ ⎦
− − + +⎡ ⎤⎣ ⎦
= ∪ ∪
∪ ∪ ∪
∪ ∪
(7)
triclinic syngony:
{ } [ ] ( ){ } [ ] [ ]{ } [ ] ( ){ }( ){ } [ ] [ ]{ } [ ] ( ){ } [ ] [ ]{ }
[ ] [ ]{ } [ ] ( ){ } [ ] ( ){ } ( ){ }
100 001 001 110100 130
001 001 001 001 001001110 130
001 001 310 010110 010 310 110
6 / 1, 1 2 , 3 , 3 2 ,
2 , 3 , 3 2 , 6 , 6
6 , 6 2 , 2 , 2 , .
mmm m m
m m
m m m
− −
+ + − −⎡ ⎤⎣ ⎦
+ +⎡ ⎤⎣ ⎦
= ∪ ∪ ∪ ∪
∪ ∪ ∪ ∪ ∪
∪ ∪ ∪ ∪
(8)

Crystallographic Basis of Polytypism and Twinning in Micas 219
The first two [Eqn. (7)] or four [Eqn. (8)] cosets give the twin laws by metric merohedry, the others give the twin laws by reticular merohedry. Twin operators in each coset are equivalent by the action of the symmetry elements of the syngony.
If the two-dimensional mesh in the (001) plane is not rigorously hexagonal (ω|| ≠ 0), or if the cn projection is not exactly |b|/3 (ω⊥ ≠ 0), the hR lattice does not coincide exactly with the lattice of the individual; moreover, the hP sublattice is only an approximate sublattice for the individual. The twin laws derived in Equations (7) and (8) do not change, but they correspond to pseudo-merohedry and reticular pseudo-merohedry instead of metric merohedry and reticular merohedry respectively. The operators in each coset are no longer equivalent.
Choice of the twin elements
The twin element that relates a pair of individuals occurs in the morphology of the twin. Micas show two kinds of twin morphologies: rotation twins, with composition plane (001), and reflection twins, with composition plane (almost) normal to (001). As noted by Friedel (1904), the twin axis for rotation twins is within the composition plane, whereas the twin plane for reflection twins coincides with the composition plane.
Whereas the morphological twin operation is unique, the geometrical operations bringing the twin lattice into self-coincidence are in general more numerous, as shown in the previous section. For zero obliquity, the operations within each coset corresponding to a twin law are equivalent, when considering only the lattice, by the action of the symmetry elements of the individual. The morphological twin operation is termed the representative operation of the coset (Nespolo and Ferraris 2000). For non-zero obliquity, however, they are no longer equivalent and the correct twin operations are those obeying the law of Mallard, which requires that the twin operations are crystallographic operations. As an example, let us consider the decomposition of the point group of the hP twin lattice with respect to the point group of the monoclinic syngony in Equation (5). If the monoclinic polytype has a hP lattice (twinning by metric merohedry) or sublattice (twinning by reticular merohedry) the six two-fold axes in the (001) plane are exactly 30º each apart and each of them is perpendicular to a plane (hk0): the four operations in each coset are truly equivalent, when considering only the lattice. Instead, if the lattice or sublattice of the individual is not exactly hexagonal (twinning by pseudo-merohedry and reticular pseudo-merohedry), either ω|| or ω⊥ (in general both) is non-zero. For ω|| ≠ 0 the 2[310], 2[⎯310], 2[110] and 2[⎯110] are (2n+1)×30±εº apart from 2[010] / 2[100] and they are no longer perpendicular to the (hk0) planes (Fig. 20). Twin axes and twin planes deviate thus from mutual perpendicularity: rotation twins and reflection twins are no longer equivalent, even for centrosymmetric crystals, and are called reciprocal twins (Mügge 1898) or corresponding twins (Friedel 1904, 1926). For ω⊥= 0 the equivalence relations become:
[ ] [ ] [ ] ( ) ( ) [ ]
[ ] [ ] ( ) ( ) [ ]
[ ] [ ] [ ] ( ) ( ) [ ]
[ ] [ ] ( ) ( ) [ ]
[ ] [ ] [ ] ( ) ( ) [ ]
310 010 001 001110 010
010 001 001010310 110
110 010 001 001130 010
010 001 001010110 130
100 010 001 001100 010
2 2 3 2ε 3 2ε
2 2 3 2ε 3 2ε
2 2 6 2ε 6 2ε
2 2 6 2ε 6 2ε
2 2 2 2
m m
m m
m m
m m
m m
− −
+ +⎡ ⎤⎣ ⎦
− −
+ +⎡ ⎤⎣ ⎦
⋅ = ± ⋅ =
⋅ = ± ⋅ =
⋅ = ± ⋅ =
⋅ = ± ⋅ =
⋅ = ⋅ =
∓
∓
∓
∓
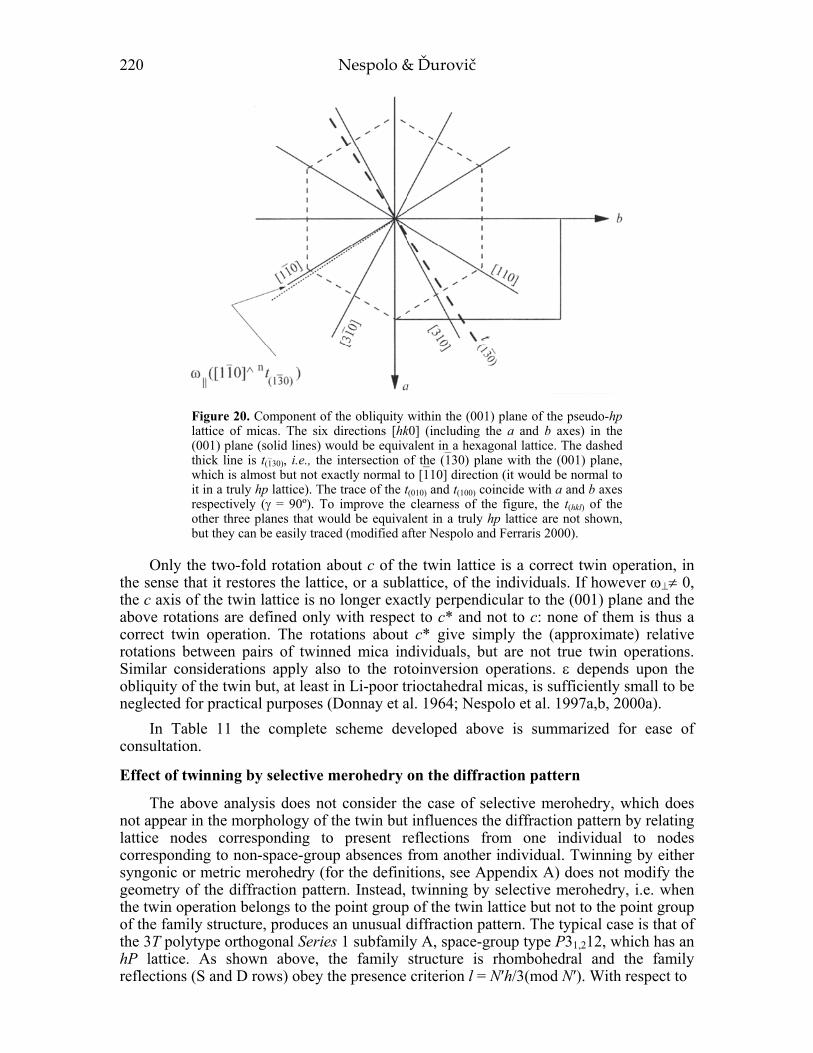
220 Nespolo & Ďurovič
Figure 20. Component of the obliquity within the (001) plane of the pseudo-hp lattice of micas. The six directions [hk0] (including the a and b axes) in the (001) plane (solid lines) would be equivalent in a hexagonal lattice. The dashed thick line is t(⎯130), i.e., the intersection of the (⎯130) plane with the (001) plane, which is almost but not exactly normal to [⎯110] direction (it would be normal to it in a truly hp lattice). The trace of the t(010) and t(100) coincide with a and b axes respectively (γ = 90º). To improve the clearness of the figure, the t(hkl) of the other three planes that would be equivalent in a truly hp lattice are not shown, but they can be easily traced (modified after Nespolo and Ferraris 2000).
Only the two-fold rotation about c of the twin lattice is a correct twin operation, in the sense that it restores the lattice, or a sublattice, of the individuals. If however ω⊥≠ 0, the c axis of the twin lattice is no longer exactly perpendicular to the (001) plane and the above rotations are defined only with respect to c* and not to c: none of them is thus a correct twin operation. The rotations about c* give simply the (approximate) relative rotations between pairs of twinned mica individuals, but are not true twin operations. Similar considerations apply also to the rotoinversion operations. ε depends upon the obliquity of the twin but, at least in Li-poor trioctahedral micas, is sufficiently small to be neglected for practical purposes (Donnay et al. 1964; Nespolo et al. 1997a,b, 2000a).
In Table 11 the complete scheme developed above is summarized for ease of consultation.
Effect of twinning by selective merohedry on the diffraction pattern
The above analysis does not consider the case of selective merohedry, which does not appear in the morphology of the twin but influences the diffraction pattern by relating lattice nodes corresponding to present reflections from one individual to nodes corresponding to non-space-group absences from another individual. Twinning by either syngonic or metric merohedry (for the definitions, see Appendix A) does not modify the geometry of the diffraction pattern. Instead, twinning by selective merohedry, i.e. when the twin operation belongs to the point group of the twin lattice but not to the point group of the family structure, produces an unusual diffraction pattern. The typical case is that of the 3T polytype orthogonal Series 1 subfamily A, space-group type P31,212, which has an hP lattice. As shown above, the family structure is rhombohedral and the family reflections (S and D rows) obey the presence criterion l = N′h/3(mod N′). With respect to

221Crystallographic Basis of Polytypism and Twinning in Micas
Tabl
e 11
. Kin
d of
twin
ning
and
twin
law
s for
mic
a po
lyty
pes c
lass
ified
on
the
basi
s of t
he p
olyt
ype
syng
ony,
pol
ytyp
e la
ttice
and
twin
latti
ce.
Syng
ony
of
the
indi
vidu
al
Lat
tice
of th
e in
divi
dual
Tw
in
latt
ice
Kin
d of
twin
ning
Tw
in la
ws
Twin
in
dex
Rot
atio
n be
twee
n pa
irs o
f ind
ivid
uals
‡Po
lyty
pes
H/T
hP
hP
sy
ngon
ic m
eroh
edry
#
1 #
mer
ohed
ral p
olyt
ypes
O
hP
hP
m
etric
mer
ohed
ry
[310
] (11
0); [
310]
(11
0)
1 ±(
120)
º al
l pol
ytyp
es
oC
hP
pseu
do-m
eroh
edry
[3
10] (
110)
; [31
0] (
110)
1
±(12
0±2
)ºal
l pol
ytyp
es
oC
sy
ngon
ic m
eroh
edry
#
1 #
mer
ohed
ral p
olyt
ypes
A/
MhP
hP
m
etric
mer
ohed
ry
[310
] (11
0); [
310]
(11
0)
[110
] (13
0); [
110]
(13
0)[1
00] (
100)
1
±(12
0)º
±(60
)º(1
80)º
all p
olyt
ypes
oC
hP
pseu
do-m
eroh
edry
[3
10] (
110)
; [31
0] (
110)
[1
10] (
130)
; [11
0] (
130)
1±(
120±
2)º
±(60
±2)º
all p
olyt
ypes
oC
m
etric
mer
ohed
ry
[100
] (01
0)
1 (1
80)º
all p
olyt
ypes
hR
hRm
etric
mer
ohed
ry
[110
] (13
0); [
110]
(13
0)1
±(60
)º al
l pol
ytyp
es
(C
lass
bpo
lyty
pes)
hP
retic
ular
mer
ohed
ry
[310
] (11
0); [
310]
(11
0)
[100
] (10
0)
3±(
60)º
(180
)ºal
l pol
ytyp
es
aC† /m
CC
lass
b
hR
pseu
do-m
eroh
edry
[1
10] (
130)
; [11
0] (
130)
1±(
120±
2)º
all p
olyt
ypes
hP
retic
ular
ps
eudo
-mer
ohed
ry
[310
] (11
0); [
310]
(11
0)
[010
] (01
0)
3±(
60±2
)º(1
80)º
all p
olyt
ypes
aC† /m
CC
lass
a
hPre
ticul
ar
pseu
do-m
eroh
edry
[3
10] (
110)
; [31
0] (
110)
[1
10] (
130)
; [11
0] (
130)
[100
] (10
0)
3±(
120±
2)º
±(60
±2)º
(180
)º
all p
olyt
ypes
M
mC
Cla
ss b
mC
syng
onic
mer
ohed
ry
[100
](10
0)
1 (1
80)º
mer
ohed
ral p
olyt
ypes
m
CC
lass
am
Csy
ngon
ic m
eroh
edry
[0
10](
010)
1
(180
)º m
eroh
edra
l pol
ytyp
es
A m
CC
lass
bm
Cm
etric
mer
ohed
ry
[100
](10
0)
1 (1
80)º
all p
olyt
ypes
m
CC
lass
am
Cm
etric
mer
ohed
ry
[010
](01
0)
1 (1
80)º
all p
olyt
ypes
aC†
Cla
ss b
mC
pseu
do-m
eroh
edry
[1
00](
100)
1
(180
±2)º
all p
olyt
ypes
aC
†C
lass
am
Cps
eudo
-mer
ohed
ry
[010
](01
0)
1(1
80±2
)º al
l pol
ytyp
es
aC†
aC†
syng
onic
mer
ohed
ry
11
0º
mer
ohed
ral p
olyt
ypes
† Th
e un
conv
entio
nal C
cen
tring
of t
riclin
ic p
olyt
ypes
is a
dopt
ed to
pre
serv
e th
e sa
me
pseu
do-o
rthoh
exag
onal
axe
s (a,
b) u
sed
for p
olyt
ypes
of
the
othe
r Bra
vais
syst
ems.
‡ Rot
atio
ns a
bout
c*.
#Sy
mm
etry
ele
men
ts a
nd re
lativ
e ro
tatio
ns d
epen
d on
the
poin
t gro
up o
f the
indi
vidu
al

222 Nespolo & Ďurovič
the period of the family sublattice, 1/3c0, one reflection appears in the 1/c0 repeat, with presence criterion l = h(mod 3). The coset decomposition gives three twin laws:
[ ] [ ] [ ] [ ] [ ]{ } [ ] [ ] [ ] [ ] [ ] [ ]{ }( ) ( ) ( ) ( ) [ ] [ ]{ } ( ) ( ) ( ) [ ] [ ]{ }+−+−
+−−+
∪∪
∪∪=
001001011110010001001001031130100
001001001110011100013310010001001
3,3,ˆ,,,6,6,,,,
6,6,2,2,2,22,2,2,3,3,16
immmmmmm
mmm
(9)
By expressing the twin laws through the Shubnikov’s two-color group notation (in which the twin elements are dashed: Curien and Le Corre 1958), the three twin laws are: 6′2′2; ⎯6′m′2; ⎯3′12/m′. The complete twin [i.e. twin by merohedry or reticular merohedry, in which the number of individuals generated from the original individual is equal to the number of possible twin laws (Curien and Donnay 1959)] contains four individuals and has symmetry 6′/m′′ 2′/m′′ 2/m′′′. The 6′2′2 and⎯6′m′2 twin laws correspond to syngonic selective merohedry class IIA, whereas the⎯3′12/m′ twin law corresponds to syngonic complete merohedry class I (Table A1). In the twins by syngonic selective merohedry, the twin operations do not belong to the point group of the family structure, and the two individuals in the twin are rotated by (2n+1)×60º, whereas layer rotations of subfamily A polytypes are 2n×60º. These twin operations produce the complete overlap of the reflections along X rows and S rows, but not of those along D rows. For example, the⎯h0l family row of one individual is overlapped to the symmetrically independent h0l family row of the other individual. Because of the presence criterion given above, the two reflections from the two individuals in the 1/c0 repeat along D rows are not overlapped, but are separated by 1/3c0 (Fig. 21). The 6′2′2′ and⎯6′m′2 twin laws, although being twin laws by merohedry according to the classical definition, produce the overlap of only one third of the family reflections (those along S rows), behaving thus as twin laws by reticular merohedry with respect to the family structure.
Figure 21. h0l r.p. (SD family plane) of the 3T polytype twinned by selective merohedry. Black circles: family reflections overlapped by the twin operation (common to both individuals). Gray and white circles: family reflections from two individuals rotated by (2n+1) × 60º, not overlapped by the twin operation (modified after Nespolo et al.1999a).

Crystallographic Basis of Polytypism and Twinning in Micas 223
Diffraction patterns from twins
The twin reciprocal lattice results from the overlap of the reciprocal lattices of the individuals. From each individual, lattice rows of the same type (S, D or X) overlap into a single composite row. The reflections along a composite row are perfectly aligned for cn = |a|/3 or |b|/3, but slightly deviate from alignment where cn departs from those ideal values. Because of the physical (non-zero) dimension of the reflections, which for micas are commonly broad and oval-shaped, a zigzag disposition of reflections from different individuals can in practice be observed only for significant deviations of cn, typical of dioctahedral micas and, to a minor extent, for Li-rich trioctahedral micas (Rieder 1970). The zigzag disposition of the reflections along rows parallel to c* is indicative of twinning, but it is normally not noticeable in Li-poor trioctahedral micas. The presence of twinning has thus to be evaluated, in general, from the geometry of the SD and SX central planes.
For non-orthogonal polytypes the metric relations lC1 = h (mod 3) (Class a) and lC1 = k (mod 3) (Class b) hold (see Table 10). Depending upon the twin law(s) (and thus the relative orientation of twinned individuals), non-family reflections from different individuals may either overlap or occur at positions separated by c*1/3N, where N is the number of layers in the repeat unit (Table 10). Where two of the three positions in a c*1/N repeat are occupied, the presence of twinning should be suspected. In contrast, where each of the three positions are occupied, the number of reflections in a c*1 repeat of a non-orthogonal twinned N-layer polytype is the same as that of an untwinned 3N-layer polytype. This phenomenon is known as “apparent polytypism” (Takano and Takano 1958). However, twinning in some cases modifies the appearance of the D rows, which, for subfamily A polytypes, may show two reflections at 1/3 and 2/3 of the c*1 repeat, as in case of selective merohedry. The number and the position of reflections along D rows, as well as the number of orthogonal planes, in most cases allows the presence of twinning to be distinguished. 1. Twinning of subfamily A polytypes in which individuals are rotated by (2n+1)×60º
corresponds to twinning by reticular pseudo-merohedry. This twinning produces a separation of the single reflection on D rows from each individual into two reflections, corresponding to l(c*1) = 1(mod 3) and l(c*1) = 2(mod 3); no reflection appears corresponding to l(c*1) = 0(mod 3); this pattern is clearly different from that of a subfamily B polytypes, where two equally spaced reflections appear. In addition, if rotation is by ±60º, for Series 0 polytypes (Class a) the orthogonal plane of one individual necessarily overlaps a non-orthogonal plane of another individual. The composite diffraction pattern has thus two or three SX orthogonal central planes.
2. Twinning of subfamily A polytypes in which individuals are rotated by 2n×60º corresponds to twinning by reticular pseudo-merohedry for Class a (Series 0), but to pseudo-merohedry for Class b (Series > 0). Twinning produces overlap of the single reflection on D rows from each individual; no reflection appears corresponding to l(c*1) = 0(mod 3). However, for polytypes of Series 0 (Class a) two or three SX planes are orthogonal, depending on the number of individuals. When three such planes appear (three or more twinned individuals), the geometrical features of the diffraction pattern are the same as for orthogonal Series 1 polytypes. This situation corresponds to the 3T polytype vs. twinned 1M. For dioctahedral micas it is distinguished by careful examination of the appearance of weak reflections violating the reflection conditions (e.g., Nespolo and Kogure 1998), whereas for trioctahedral micas different techniques, such as microscopic observation of the crystal surface, may be necessary (e.g., Nespolo and Kuwahara 2001). If the twin involves only two
224 Nespolo & Ďurovič
individuals, successive reflections along X are unequally separated (1/3 and 2/3) and two SX planes are orthogonal: the presence of twinning is thus easily recognized.
3. Subfamily B polytypes either are orthogonal or belong to Class b. In the latter case only three of the five pairs of twin laws correspond to twinning by reticular pseudo-merohedry. However, the corresponding twin operations lead to the overlap of the two reflections on D rows from each individual; no SX plane is orthogonal, whereas the three SD planes are orthogonal. The presence of twinning is not evident.
4. For mixed-rotation polytypes D rows are non-family rows. For Class a polytypes, two individuals rotated by 180º share one orthogonal r.p. 0kl, but reflections are unequally spaced. The presence of twinning is thus evident. In other cases, two or more SX planes are orthogonal, as for subfamily A polytypes of the same Class, but no SD plane is orthogonal. The presence of twinning is again evident. For Class b polytypes the three SD planes are orthogonal and the presence of twinning is not evident. In Tables 12a-12c the complete scheme of the identification process is shown. The
approximated relative rotations between twinned individuals are given: the corresponding twin laws are easily obtained from Table 11. For Class a polytypes (which represent most of the polytypes reported to date) the presence of twinning can be confirmed or excluded by simple inspection of the geometry of the diffraction pattern. Special attention is however needed to distinguish a 3N-layer orthogonal polytype from the spiral twinning of three non-orthogonal N-layer Class a polytypes in which the individuals are rotated by 2n×60º. For polytypes of Class b subfamily A Series 1 the presence of reticular pseudo-merohedry twinning is also evident. In the other cases the presence of twinning cannot be confirmed or excluded by analyzing the geometry of the diffraction pattern.
Allotwinning
The oriented association of two or more crystals differing only in their polytypic character is termed allotwinning, from the Greek αλλος, “different”, with reference to the individuals (Nespolo et al. 1999c). Allotwinning differs from twinning in that the individuals are not identical but have a different stacking sequence. Allotwinning differs also from oriented overgrowth (epitaxy: Royer 1928, 1954) and oriented intergrowth (syntaxy: Ungemach 1935) because the chemical composition is (ideally) identical and, because the building layer(s) are the same, at least two of the three parameters – those in the plane of the layer – are identical also. A cell common to the two individuals can always be found, which in general is a multiple cell for both crystals: the parameter not in the plane of the layer is the shortest one common to the cells of both individuals. As in case of triperiodic epitaxy, a three-dimensional common lattice exists (allotwin lattice): it may coincide with the lattice of one or more individuals or be a sublattice of it. Whereas a triperiodic epitaxy in general may or may not occur, depending on the degree of misfit of the lattice parameters of the individuals, there is no similar condition in allotwinning, because the individuals have a common mesh in the plane of the layer(s) even in polytypes with a different space-group type.
The allotwin operation is a symmetry operation for the allotwin lattice, which may belong to the point group of one or more individuals also. The allotwin of N individuals is characterized by N allotwin indices: the allotwin index of the j-th individual is the order of the subgroup of translation in direct space defining the allotwin lattice with respect to the lattice of the j-th individual.
Tessellation of the hp lattice
Assuming the mica two-dimensional lattice in the (001) plane is hp [ω|| = 0], the lattice can be described through a regular tessellation {3,6}, i.e. an assemblage of equal

225Crystallographic Basis of Polytypism and Twinning in Micas
Tab
le 1
2a. C
lass
ifica
tion
of d
iffra
ctio
n pa
ttern
s for
N =
3K+
L. F
or th
e co
rres
pond
ence
bet
wee
n th
e re
lativ
e ro
tatio
ns o
f tw
inne
d in
divi
dual
s and
the
twin
law
s see
Tab
le 1
1 (a
fter N
espo
lo 1
999)
.
Num
ber o
f ref
lect
ions
in th
e c*
1 rep
eat a
long
reci
proc
al la
ttice
row
s cor
resp
ondi
ng to
fam
ily re
flect
ions
2N
umbe
r of p
lane
s w
ith o
rthog
onal
ap
pear
ance
1[l C
1 0
(mod
3)]
l C
1=
1(m
od 3
) and
2(m
od 3
)[l C
1=
0(m
od N
) and
N/2
(mod
N)]
N
1 (S
X)
Subf
amily
ASe
ries
0 C
lass
a
untw
inne
d po
lyty
pe
----
----
----
- --
----
----
---
Mix
ed-r
otat
ion
Seri
es0
Cla
ss a
un
twin
ned
poly
type
3 (S
X)
Subf
amily
ASe
ries
0 o
rthog
onal
po
lyty
pe u
ntw
inne
d or
±1
20º-t
win
ned
Subf
amily
ASe
ries
0 o
rthog
onal
(±
60º /
180
º)-tw
inne
d po
lyty
pe
----
----
----
- --
----
----
---
3 (S
D)
----
----
----
- --
----
----
---
Subf
amily
B S
erie
s 0Cl
ass b
po
lyty
pe u
ntw
inne
d or
±1
20º-t
win
ned
Mix
ed-r
otat
ion
Seri
es 0
Cla
ss b
po
lyty
pe u
ntw
inne
d or
±12
0º
-twin
ned
6 (S
X a
nd S
D)
----
----
----
- --
----
----
---
Subf
amily
BSe
ries
0 o
rthog
onal
po
lyty
pe
Mix
ed-r
otat
ion
Seri
es 0
orth
ogon
al p
olyt
ype
.

226 Nespolo & Ďurovič
Tab
le 1
2b. C
lass
ifica
tion
of d
iffra
ctio
n pa
ttern
s for
N =
3(3
K+L)
.
Num
ber o
f ref
lect
ions
in th
e c*
1 rep
eat a
long
reci
proc
al la
ttice
row
s cor
resp
ondi
ng to
fam
ily re
flect
ions
2N
umbe
r of
plan
es w
ith
orth
ogon
al
appe
aran
ce
1[l C
1 0
(mod
3)]
l C
1=
1(m
od 3
) and
2(m
od 3
) l C
1=
0(m
od N
) and
N/2
(mod
N)
N
0Su
bfam
ily A
Seri
es 1
Cla
ss b
po
lyty
pe u
ntw
inne
d or
±1
20º-t
win
ned
----
----
- --
----
---
----
----
-
1 (S
X)
----
----
- Su
bfam
ily A
Seri
es 0
Cla
ss a
poly
type
180
º-tw
inne
d --
----
---
Mix
ed-r
otat
ion
Cla
ss a
:Se
ries
1 u
ntw
inne
d po
lyty
pe
Seri
es 0
pol
ytyp
e 18
0º-tw
inne
d
2 (S
X)
Subf
amily
ASe
ries
0 C
lass
a
poly
type
±12
0º-tw
inne
d (tw
o in
divi
dual
s)
Subf
amily
ASe
ries
0 C
lass
apo
lyty
pe ±
60º-t
win
ned
(two
indi
vidu
als)
--
----
---
Mix
ed-r
otat
ion
Seri
es0
Cla
ss a
pol
ytyp
e (±
60º /
±12
0º)-
twin
ned
(two
indi
vidu
als)
3 (S
X)
Subf
amily
ASe
ries
0 C
lass
a
poly
type
±12
0º-tw
inne
d (th
ree
indi
vidu
als)
Su
bfam
ily A
Seri
es 1
orth
ogon
al p
olyt
ype
untw
inne
d or
±12
0º-tw
inne
d
Subf
amily
ASe
ries
0 C
lass
apo
lyty
pe ±
60º-t
win
ned
(thre
e in
divi
dual
s)
Subf
amily
ASe
ries
1or
thog
onal
pol
ytyp
e (±
60º /
±1
80º)-
twin
ned
----
----
- M
ixed
-rot
atio
n Se
ries
0C
lass
a p
olyt
ype
(±60
º / ±
120º
)-tw
inne
d (th
ree
indi
vidu
als)
3 (S
D)
----
----
- --
----
---
Subf
amily
B C
lass
b:
Seri
es 1
pol
ytyp
e un
twin
ned
or
±120
º-tw
inne
d Se
ries
0
poly
type
(±60
º /
180º
)-tw
inne
d
Mix
ed-r
otat
ion
Cla
ss b
:Se
ries
1 p
olyt
ype
untw
inne
d or
±1
20º-t
win
ned
Seri
es
0 (±
60º /
180
º)-tw
inne
d po
lyty
pe
6 (S
X a
nd S
D)
----
----
- --
----
---
Subf
amily
BSe
ries
1
orth
ogon
al
poly
type
M
ixed
-rot
atio
n Se
ries
1 o
rthog
onal
po
lyty
pe

227Crystallographic Basis of Polytypism and Twinning in Micas
Tab
le 1
2c. C
lass
ifica
tion
of d
iffra
ctio
n pa
ttern
s fo
r N =
3n>
1 (3K+
L). F
or th
e co
rres
pond
ence
bet
wee
n th
e re
lativ
e ro
tatio
ns o
f tw
inne
d in
divi
dual
s an
d th
e tw
in la
ws s
ee T
able
11
(afte
r Nes
polo
199
9).
Num
ber o
f ref
lect
ions
in th
e c*
1 rep
eat a
long
reci
proc
al la
ttice
row
s cor
resp
ondi
ng to
fam
ily re
flect
ions
2N
umbe
r of
plan
es w
ith
orth
ogon
al
appe
aran
ce
1[l C
1 0
(mod
3)]
l C
1=
1(m
od 3
) and
2(m
od 3
) l C
1=
0(m
od N
) and
N/2
(mod
N)
N
0Su
bfam
ily A
Seri
es n
Cla
ss b
po
lyty
pe u
ntw
inne
d or
±1
20º-t
win
ned
Subf
amily
ASe
ries
n-1
Clas
s b p
olyt
ype
(±60
º /
180º
)-tw
inne
d --
----
---
----
----
-
1 (S
X)
----
----
- --
----
---
----
----
- M
ixed
-rot
atio
n C
lass
a:
Ser
ies n
pol
ytyp
e un
twin
ned
Se
ries
n-1
pol
ytyp
e 18
0º-tw
inne
d
2 (S
X)
----
----
- --
----
---
----
----
- M
ixed
-rot
atio
n Se
ries
n-1
Cla
ss a
pol
ytyp
e (±
60º /
±12
0º)-
twin
ned
(two
indi
vidu
als)
3 (S
X)
Subf
amily
ASe
ries
n
orth
ogon
al p
olyt
ype
untw
inne
d or
±12
0º-tw
inne
d
Subf
amily
ASe
ries
n
orth
ogon
al p
olyt
ype
(±60
º /
180º
)-tw
inne
d
----
----
- M
ixed
-rot
atio
n Se
ries
n-1
Cla
ss a
pol
ytyp
e (±
60º /
±12
0º)-
twin
ned
(thre
e in
divi
dual
s)
3 (S
D)
----
----
- --
----
---
Subf
amily
B C
lass
b:
Seri
es n
pol
ytyp
e un
twin
ned
or
±120
º-tw
inne
d Se
ries
n-1
(±60
º / 1
80º)-
twin
ned
poly
type
Mix
ed-r
otat
ion
Cla
ss b
:Se
ries
n p
olyt
ype
untw
inne
d or
±1
20º-t
win
ned
Seri
es n
-1 (±
60º /
180
º)-tw
inne
d po
lyty
pe
6 (S
X a
nd S
D)
----
----
- --
----
---
Subf
amily
BSe
ries
n o
rthog
onal
po
lyty
pe
Mix
ed-r
otat
ion
Seri
es n
orth
ogon
al
poly
type

228 Nespolo & Ďurovič
regular 3-gons (triangles), 6 surrounding each vertex, that covers the two-dimensional plane without overlap or interstices (Schläfli 1950). The tessellation {3, 6} defines the hexagonal mesh; its dual, {6, 3}, gives the H centering nodes (Coxeter 1973; 1989). If (u, v) are the coordinates of a node of {3, 6}, which define a vector: r = uA1 + vA2 (10) (A1, A2, c; |A1| =|A2| = a ≅ 5.3Å; γ = 120º), the five other nodes produced by n×60° (0 ≤ n ≤ 5) rotations about the origin are: (u-v, u), (-v, u-v), (-u, -v) (v-u, -u), (v, v-u). If u = v = 1, these nodes together with the origin give the {3, 6} regular tessellation. If u ≠ 1 or v ≠ 1 the compound tessellation {3, 6}[n{3, 6}] is obtained, whose larger mesh has multiplicity n: n = u2+v2-uv (11) (Takeda and Donnay 1965). The length of the vector connecting the origin with a node of coordinates (u, v) is5: r = an1/2 (12) and for the regular tessellation (u = v = 1) r/a = 1. A single set of six nodes with the same r exists when either u or v = 0, v = u or v = 2u: these nodes lie on the six directions corresponding to the reflection lines in the plane. In all other cases, there are two sets of six nodes with the same r, which lie outside the six reflection lines. The generating nodes of the two sets are defined as follows: set I: uI, v; set II: uII, v; v > uII = (v – uI) > uI > 0 (13) In reciprocal space (γ=60º), the relation corresponding to (11a) is given by: set I: H, K; set II: K, H; H = u; K = v – u (14)
These are the conditions in reciprocal space given by Zvyagin and Gorshkov (1966) for the regularity of the secondary reflections in hexagonal nets being derivable from only geometrical considerations based on the superposition of the cells of both lattices. Reciprocal lattice nodes of set I correspond to the orbits S, DI, XI, and those of set II to the orbits DII and XII in Figure 16.
Because the b axis of the C1 orthohexagonal cell is given by b = A1 +2A2, the generating node of set I is always between bC1 and A2 axes, whereas that generating set II is always between A1 and bC1 axes. Nodes belonging to the same set are still related by n×60º rotations, whereas those belonging to different sets are related by a non-crystallographic angle. These sets are symmetrically disposed with respect to the reflection lines in the plane, which thus bisect the rotation angle (Fig. 22, drawn for uI = 1, uII = 3, v = 4). Taking counter clockwise rotations as positive, the angle relating nodes belonging to sets I and II are6:
( ) ( ) ( )
( ) ( )
11/ 2
2' : I II II I ' 2cos 602
: I II II I 60 '
v u modn
+ − −
− +
−⎛ ⎞ϕ → = → ϕ = ⎜ ⎟⎝ ⎠
ϕ → = → ϕ = − ϕ
(15)
5 Takéuchi et al (1972) defined the vector r as r = ⎯uA1+vA2, i.e. with respect to a basis with
interaxial angle 60º: correspondingly in the multiplicity of the mesh (Eq. 8) and in the length of the vector (Eq. 9) the term uv has opposite sign. Their definitions of (u, v) and n values correspond to reciprocal lattice values in our treatment.
6 The definition of the angles ϕ and ϕ′ is given according to Takéuchi et al (1972).

Crystallographic Basis of Polytypism and Twinning in Micas 229
Figure 22. Overlap of two hp lattices rotated about an axis normal to the plane and passing through the origin by the angle ϕ of the compound tessellation {3, 6}[13{3, 6}]. One node out of 13 is restored. Three hexagonal meshes containing each 13 nodes are also shown.
Figure 23. Definition of the tessellation angles ϕ, ϕ', δI, δII. The figure is drawn for the compound tessellation {3, 6}[13{3, 6}].
The relation between ϕ and ϕ′ is derived taking into account that a node belonging to one set is related to the two nearest nodes of the other set by two reflection lines that intersect at the origin. For the regular tessellation, only one set of six nodes with the same r exists, each node being 60º apart: in this case ϕ = ϕ′ = 0º (mod 60º).
The space-fixed b orthohexagonal axis bisects the angle ϕ′ as defined in Equation (15). The angles between b and the directions (uI,v) (δI) and (uII,v) (δII) are simply given by (Fig. 23):
δI = ϕ/2 = 30º - ϕ′/2 δII = -δI(mod 60º) = δI + ϕ′ = 30º + ϕ′/2 (16)

230 Nespolo & Ďurovič
In reciprocal space, n×60º rotations relate nodes on the same type of row and of the same set (S; DI, DII, XI, XII); instead, non-crystallographic rotations relate nodes on the same type of row but of different sets (DI and DII; XI and XII) and do not restore nodes of the same set (cf. Fig. 16).
If u and v (and thus also h and k) are not co-prime integers (i.e. they have a common factor), or if u+v = 0(mod 3) [i.e. k-h = 0(mod 3)], the lattice constructed on the mesh defined by the compound tessellation is multiple. The same lattice is described by a primitive mesh with smaller multiplicity and corresponding to u and v co-prime integers and u+v ≠ 0(mod 3)
Table 13 shows the features of compound tessellations {3, 6}[n{3, 6}] to r = 100Å [Eqn. (12) assuming a = 5.3Å], each of which describes a coincidence-site lattice (CSL) (Ranganathan 1961): the multiplicity n of its mesh is termed coincidence index or Σ factor and corresponds to the order of the subgroup of translation defining the two-dimensional CSL with respect to the hp lattice. As shown in Table 13, the minimal value of the Σ factor for the hp lattice is 7 (see also Pleasants et al. 1996).
Plesiotwinning
If the obliquity is neglected (ω|| = ω⊥ = 0), micas have a hexagonal lattice (orthogonal polytypes) or sublattice (non-orthogonal polytypes). The twin lattice coincides with the lattice of the individual (orthogonal polytypes) or with its (pseudo)hexagonal sublattice (non-orthogonal polytypes) and can be described through the regular tessellation {3,6}. A different kind of oriented crystal association occurs, although less frequently, whose lattice is based on one of the compound tessellations {3, 6}[n{3, 6}], and thus has been termed plesiotwinning, from the Greek πλεσιος, “close to” (Nespolo et al. 1999b). Plesiotwins are characterized by the following features: 1) the lattice common to the individuals (plesiotwin lattice) is always a sublattice for
any of the individuals; the order of the subgroup of translation (plesiotwin index) is usually higher than in twins;
2) the operation relating the individuals corresponds to a symmetry or pseudo-symmetry element of the plesiotwin lattice but not of the individuals, and that element has high indices in the setting of the individuals;
3) pairs of individuals are rotated about the normal to the composition plane by a non- crystallographic angle, even neglecting the obliquity. If Ξ is the hp lattice, two identical such lattices Ξ1 and Ξ2 with an origin in common
can be brought into complete or partial coincidence by keeping Ξ1 fixed and rotating Ξ2 about c*, producing a two-dimensional CSL. The CSL corresponding to the {3, 6}[n{3, 6}] is produced through non-crystallographic rotations of Ξ2 about c*. For orthogonal polytypes the c axis is normal to Ξ and in each lattice plane parallel to Ξ the same two-dimensional CSL is produced. Instead, for non-orthogonal polytypes the c axis is inclined, with a cn projection |a|/3 or |b|/3 (assuming ω⊥ = 0). The rotations normal to Ξ produce an identical CSL every third plane parallel to (001), namely the planes for which the normal to Ξ passes on a lattice point. The multiple cell containing three lattice planes is (ideally) orthogonal and defines either the twin lattice - {3, 6} tessellation - or the plesiotwin lattice - {3, 6}[n{3, 6}] tessellation.
In micas, and more generally in layer compounds, plesiotwinning represents a generalization of the concept of twinning, at least from the lattice viewpoint. In twins the CSL produced in each plane (orthogonal polytypes) or in one plane out of three (non-orthogonal polytypes) has Σ factor 1, whereas in plesiotwins the CSL has Σ factor of n > 1 (n ≥ 7 for the hp lattice). The twin/plesiotwin index is thus 1 (twinning by merohedry)

Crystallographic Basis of Polytypism and Twinning in Micas 231
Table 13. Values of u, v (γ=120º), H, K (γ=60º) and corresponding angles (mod 60º) for the compound tessellation {3, 6}[n{3, 6}] up to r = 100Å (assuming a = 5.3Å).
n r(Å) Set (u, v) (H, K) ϕ ϕ′ δI δII 1# 5.3 I, II (1,1) (1,1) 0º 0º 0º 0º
7 14.0 I (1,3) (1,2)
21°47′ 38°13′ 10°54′ 49°06′ II (2,3) (2,1)
13 19.1 I (1,4) (1,3)
32°12′ 27°48′ 16°06′ 43°54′ II (3,4) (3,1)
19 23.1 I (2,5) (2,3)
13°10′ 46°50′ 6°35′ 53°25′ II (3,5) (3,2)
31 29.5 I (1,6) (1,5)
42°06′ 17°54′ 21°03′ 38°57′ II (5,6) (5,1)
37 32.2 I (3,7) (3,4)
9°26′ 50°34′ 4°43′ 55°17′ II (4,7) (4,3)
43 34.8 I (1,7) (1,6)
44°49′ 15°11′ 22°25′ 37°35′ II (6,7) (6,1)
49 37.1 I (3,8) (3,5)
16°26′ 43°34′ 8°13′ 51°47′ II (5,8) (5,3)
61 41.4 I (4,9) (4,5)
7°20′ 52°40′ 3°40′ 56°20′ II (5,9) (5,4)
67 43.4 I (2,9) (2,7)
35°34′ 24°26′ 17°47′ 42°13′ II (7,9) (7,2)
73 45.3 I (1,9) (1,8)
48°22′ 11°38′ 24°11′ 35°49′ II (8,9) (8,1)
79 47.1 I (3,10) (3,7)
26°00′ 34°00′ 13°00′ 47°00′ II (7,10) (7,3)
91 50.6
I (1,10) (1,9) 49°35′ 10°25′ 24°47′ 35°13′
II (9,10) (9,1) I II
(5,11) (6,11)
(5,6) (6,5)
6º01′ 53º59′ 27º00′ 3º00′
97 52.2 I II
(3,11) (8,11)
(3,8) (8,3)
29º25′ 30º35′ 45º18′ 14º42′
103 53.8 I II
(2,11) (9,11)
(2,9) (9,2)
40º21′ 19º39′ 39º50′ 20º10′
109 55.3 I II
(5,12) (7,12)
(5,7) (7,5) 11º00′ 49º00′ 54º30′ 5º30′
127 59.7 I II
(6,13) (7,13)
(6,7) (7,6)
5º05′ 54º55′ 57º27′ 2º33′
133 61.1
I II
(1,12) (11,12)
(1,11) (11,1)
51º23′ 8º37′ 34º18′ 25º42′
I II
(4,13) (9,13)
(4,9) (9,4)
25º02′ 34º58′ 47º29′ 12º31′
139 62.5 I II
(3,13) (10,13)
(3,10) (10,3)
34º32′ 25º28′ 42º44′ 17º16′
151 65.1 I II
(5,14) (9,14)
(5,9) (9,5)
18º44′ 41º16′ 50º38′ 9º22′
#Regular tessellation {3,6}.
or n (plesiotwinning) for orthogonal polytypes, and 3 (twinning by reticular merohedry) or 3n (plesiotwinning). For ω|| ≠ 0 or ω⊥ ≠ 0 this description is not modified, but the lattice overlap is only approximated and corresponds to pseudo-merohedry (n = 1) and reticular pseudo-merohedry (n > 1): the rotations normal to Ξ are ϕ±2ε, and do not obey

232 Nespolo & Ďurovič
the law of Mallard. These rotations are useful to describe the CSL and the corresponding twin/plesiotwin indices but, as shown dealing specifically with twins, they are not correct twin/plesiotwin operations: the latter correspond instead to two-fold axes in the (001) plane or reflection planes almost normal to (001). The plesiotwin axes and plesiotwin planes have higher indices than the twin axes (Table 14). Note that plesiotwin planes correspond to crystal faces usually not developed in micas: consequently, reflection plesiotwins have a probability of occurrence lower than rotation plesiotwins.
Table 13, continued
n r(Å) Set (u, v) (H, K) ϕ ϕ′ δI δII
157 66.4 I II
(1,13) (12,13)
(1,12) (12,1)
52º04′ 7º56′ 33º58′ 26º02′
163 67.7 I II
(3,14) (11,14)
(3,11) (11,3)
36º31′ 23º29′ 41º44′ 18º16′
169 68.9 I II
(7,15) (8,15)
(7,8) (8,7)
4º25′ 55º35′ 57º48′ 2º12′
181 71.3 I II
(4,15) (11,15)
(4,11) (11,4)
30º09′ 29º51′ 44º55′ 15º05′
193 73.6 I II
(7,16) (9,16)
(7,9) (9,7)
8º15′ 51º45′ 55º52′ 4º08′
199 74.8 I II
(2,15) (13,15)
(2,13) (13,2)
45º54′ 14º06′ 37º03′ 22º57′
211 77.0 I II
(1,15) (14,15)
(1,14) (14,1)
53º10′ 6º50′ 33º25′ 26º35′
217 78.1
I II
(3,16) (13,16)
(3,13) (13,3)
39º41′ 20º19′ 40º09′ 19º51′
I II
(8,17) (9,17)
(8,9) (9.8)
3º53′ 56º07′ 58º03′ 1º57′
223 79.1 I II
(6,17) (11,17)
(6,11) (11,6)
19º16′ 40º44′ 50º22′ 9º38′
229 80.2 I II
(5,17) (12,17)
(5,12) (12,5)
26º45′ 33º15′ 46º38′ 13º22′
241 82.3 I II
(1,16) (15,16)
(1,15) (15,1)
53º36′ 6º24′ 33º12′ 26º48′
247 83.3
I II
(3,17) (14,17)
(3,14) (14,3)
40º58′ 19º02′ 39º31′ 20º29′
I II
(7,18) (11,18)
(7,11) (11,7)
14º37′ 45º23′ 52º41′ 7º19′
259 85.3
I II
(2,17) (15,17)
(2,15) (15,2)
47º39′ 12º21′ 36º11′ 23º49′
I II
(5,18) (13,18)
(5,13) (13,5)
28º47′ 31º13′ 45º37′ 14º23′
271 87.2 I II
(9,19) (10,19)
(9,10) (10,9)
3º29′ 56º31′ 58º16′ 1º44′
277 88.2 I II
(7,19) (12,19)
(7,12) (12,7)
17º17′ 42º43′ 51º22′ 8º38′
283 89.2 I II
(6,19) (13,19)
(6,13) (13,6)
24º01′ 35º59′ 48º00′ 12º00′
301 92.0
I II
(4,19) (15,19)
(4,15) (15,4)
36º58′ 23º02′ 41º31′ 18º29′
I II
(9,20) (11,20)
(9,11) (11,9)
6º37′ 53º23′ 56º42′ 3º18′

Crystallographic Basis of Polytypism and Twinning in Micas 233
Table 13, concluded.
n r(Å) Set (u, v) (H, K) ϕ ϕ′ δI δII
307 92.9 I II
(1,18) (17,18)
(1,17) (17,1)
54º20′ 5º40′ 32º50′ 27º10′
313 93.8 I II
(3,19) (16,19)
(3,16) (16,3)
43º07′ 16º53′ 38º27′ 21º33′
325 95.5 I II
(5,20) (15,20)
(5,15) (15,5)
32º12′ 27º48′ 43º54′ 16º06′
331 96.4 I II
(10,21) (11,21)
(10,11) (11,10)
3º09′ 56º51′ 58º26′ 1º34′
337 97.3 I II
(8,21) (13,21)
(8,13) (13,8)
15º39′ 44º21′ 52º10′ 7º50′
343 98.2 I II
(1,19) (18,19)
(1,18) (18,1)
54º38′ 5º22′ 32º41′ 27º19′
349 99.0 I II
(3,20) (17,20)
(3,17) (17,3)
44º01′ 15º59′ 38º22′ 22º00′
Plesiotwinning is a macroscopic phenomenon that differs from twinning not only in
a geometrical definition but also from a physical viewpoint. Whereas for twins the twin index and the twin obliquity directly influence the probability of twin occurrences, for plesiotwins a similar lattice control is not recognized. In fact, the lowest plesiotwin index for micas is 7, which becomes 21 for non-orthogonal polytypes. The degree of restoration of lattice nodes is too small for a lattice control to be active. The plesiotwin formation is thus structurally controlled. Twins are usually believed to form in the early stages of crystal growth (Buerger 1945), but the formation of twins from macroscopic crystals is also known (e.g., Gaubert 1898; Schaskolsky, and Schubnikow 1933). When two or more nanocrystals interact, they can adjust their relative orientation until they reach a minimum energy configuration, corresponding either to a parallel growth or to a twin. When two macrocrystals interact, the energy barrier to the mutual adjustment is higher, especially at low temperature. If two macrocrystals coalesce or exsolve taking at first a relative orientation corresponding to an unstable atomic configuration at the interface, they tend to rotate until they reach a lower energy configuration. Parallel growth and twinning correspond to minimal interface energy, whereas plesiotwinning corresponds to a less-deep minimum. However, twin orientations are less numerous and are separated by larger angles, whereas plesiotwin orientations are more numerous and separated by smaller angles. In Figure 24 the plot Σ vs. ϕ for the hp lattice is given for Σ ≤ 100 and 0º ≤ ϕ ≤ 60º. Between the two extreme values of ϕ corresponding to crystallographic rotations and to Σ = 1, several discrete values appear, corresponding to Σ > 1 and to non-crystallographic rotations. Only limited adjustments may be necessary to reach plesiotwin orientations, which may thus represent a kind of compromise between the original unstable configuration and the too distant, although more stable, configuration of twins. This kind of origin is supported also by experiments of dispersion into a fluid and drying of flakes of crystals with layer structure: the result was simply a physical overlap of pairs of crystals, which however gave the same orientations of plesiotwins (Sueno et al. 1971; Takéuchi et al. 1972).
TWINNING OF MICAS. ANALYSIS OF THE GEOMETRY OF THE DIFFRACTION PATTERN
A simple and straightforward method to derive the orientations of the individuals in a mica twin or allotwin is introduced. The following analysis is entirely based on the

234 Nespolo & Ďurovič
Tab
le 1
4. P
lesi
otw
in la
ws f
or th
e hP
latti
ce. I
ndic
es o
f ple
siot
win
axe
s and
ple
siot
win
pla
nes a
re g
iven
with
resp
ect t
o th
e or
thoh
exag
onal
a, b
axe
s, in
cou
nter
clo
ckw
ise
orie
ntat
ion
from
b.
Ian
dII a
re g
iven
in T
able
13
for t
he c
orre
spon
ding
tess
ella
tion.
Ple
siot
win
pla
nes c
orre
spon
d to
pla
nes
not d
evel
oped
as c
ryst
al fa
ces:
con
sequ
ently
, ref
lect
ion
ples
iotw
ins h
ave
low
pro
babi
lity
of o
ccur
renc
e.
Com
poun
d te
ssel
latio
n.
{3, 6
}[n{
3, 6
}]
n=7
n=13
n=19
n=31
n=37
n=43
n=49
n=61
Rot
atio
n ab
out c
*
[130
][1
20]
[150
][2
30]
[170
][5
70]
[140
][1
90]
2
I-2[5
10]
[710
][4
10]
[11.
10]
[11.
30]
[13.
10]
[13.
30]
[720
]12
0º+2
I-2 [2
10]
[530
] [7
30]
[750
] [5
20]
[430
][1
1.5
0][1
3.5
0]24
0º+2
I+2
[130
]
[120
]
[150
]
[230
]
[170
]
[570
]
[140
]
[190
]2
II-2
[510
]
[710
]
[410
][1
1.1
0][1
1.3
0][1
3.1
0][1
3.3
0][7
20]
120º
+2II+2
Rot
atio
n pl
esio
twin
s
[210
]
[530
]
[730
]
[750
]
[520
]
[430
]
[11.
50]
[13.
50]
240º
+2II+2
(190
) (1
60)
(1.1
5.0)
(2
90)
(1.2
1.0)
(5
.21.
0)
(1.1
2.0)
(1
.27.
0)
2I+
2(5
30)
( 730
) ( 4
30)
(11.
30)
(11.
90)
(13.
30)
(13.
90)
( 760
) 12
0º+2
I+2
( 230
) (5
90)
( 790
) (7
.15.
0)
( 560
) ( 4
90)
(11
.15.
0)
(13
.15.
0)
240º
+2I-2
(190
) (1
60)
(1.1
5.0)
(2
90)
(1.2
1.0)
(5
.21.
0)
(1.1
2.0)
(1
.27.
0)
2II+2
(530
) ( 7
30)
( 430
) (1
1.3
0)(1
1.9
0)
(13
.30)
(1
3.9
0)
( 760
) 12
0º+2
II-2
Ref
lect
ion
ples
iotw
ins
( 230
) (5
90)
( 790
) (7
.15.
0)
( 560
) ( 4
90)
(11.
15.0
) (1
3.15
.0)
240º
+2II-2
Ples
iotw
in in
dex
orth
ogon
al p
olyt
ypes
7
13
19
31
37
43
49
61
Ples
iotw
in in
dex
non-
orth
ogon
al
poly
type
s 21
39
57
93
11
1 12
6 14
7 18
3

Crystallographic Basis of Polytypism and Twinning in Micas 235
Figure 24. The coincidence index (Σ factor) vs. ϕ plot, in case of two-dimensional hp lattice. ϕ = 0 (parallel growth) and ϕ = 60º (twinning) correspond to Σ = 1. Between these two orientations, a large number of plesiotwin orientations exist, which are shown up to Σ = 100. The plot has been calculated by applying the compound tessellation theory and drawn for counter-clockwise rotations only. Clockwise rotations produce the same Σ in correspondence of 60º – ϕ rotations (modified after Nespolo et al.1999d).
geometry of the diffraction pattern, which is determined by the symmetry of the lattice of the individual, of the twin lattice and of the lattice of the family structure. The diffraction pattern is described within the Trigonal model and in terms of the weighted reciprocal lattice (w.r.l.), i.e. the reciprocal lattice (r.l.) in which each node has a weight corresponding to the resulting intensity. In particular, a node corresponding to a reflection with zero intensity in the Trigonal model is omitted from the w.r.l. The intensities that are actually obtained in a diffraction experiment are clearly influenced by structural deviations from the Trigonal model: two diffraction patterns with the same geometry, and thus considered equivalent hereafter, can thus be different when the actual structure (i.e., with distortions) is taken into account.
Symbolic description of orientation of twinned mica individuals. Limiting symmetry
As seen in the previous section, rotations between pairs of individuals in a mica twin or allotwin are very close to n×60º about c*. The possible orientations of the individuals are thus almost identical to the possible orientations of the layers in a polytype. The absolute orientation of the individuals can be indicated by symbols similar to those used for polytypes. Nespolo et al (2000a) introduced the ZT symbols, where "T" indicates "twin", which are derived from the shortened Z symbols for polytypes. There are four main differences between Z and ZT symbols: 1. Because there cannot be two individuals in a twin oriented in the same way, the
sequence of characters in a ZT symbol never contains the same character twice. 2. The Z symbol of polytypes must take into account the space-group type, whereas ZT
considers only the symmetry of the point group. The orthohexagonal setting of the first individual is taken to coincide with that of the twin lattice: the first individual is

236 Nespolo & Ďurovič
always fixed in orientation ZT = 3 (Fig. 4), and the orientations of the other individuals are determined by the twin laws.
3. Rotation by 180º of the entire twinned edifice around the a axis of the space-fixed reference changes the ZT symbol 3IJ…P into (6-P)…(6-J)(6-I)3; because the order of the individuals in the twin does not influence the diffraction pattern, this sequence of characters is equivalent to 3(6-I)(6-J)…(6-P), which corresponds to inverting the direction of rotation of the individuals in the twin about the cC1 axis. Considering the effect on the lattice, the 3IJ…P → 3(6-I)(6-J)…(6-P) transformation corresponds to reflecting the twin lattice across the (010) plane.
4. For polytypes in which layers are related only by proper motions7, like 3T, two twins operations with the same rotational part and differing only for the proper/improper character of the motion produce the same twin lattice. The corresponding two twin laws are however different, and thus an orientation produced by an improper motion is hereafter distinguished by a small black circle (•) after the ZT symbol. The number of independent orientations of the w.r.l. of an individual is determined
by its limiting symmetry, i.e. the lower symmetry between the ideal crystal lattice (as described by the Trigonal model) and the family structure. The limiting symmetry is given in Table 15, which is easily understood remembering that: 1) for mixed-rotation polytypes the family structure is defined only within the Pauling model and the limiting symmetry always coincides with the symmetry of the polytype lattice; 2) for orthogonal polytypes, the lattice is (pseudo) hexagonal: for both subfamilies the limiting symmetry coincides with that of the family structure; 3) subfamily B polytypes cannot belong to Class a; 4) non-orthogonal subfamily A polytypes belong to Class a for Series 0 but to Class b for Series > 0.
Table 15. Limiting symmetry defining the number of independent lattice orientations. The (idealized) symmetries of the lattice and of the family structure are given. The limiting symmetry corresponds to the lower of the two. For mixed-rotation polytypes the family structure is defined only within the Pauling model and the limiting symmetry by definition coincides with the symmetry of the lattice.
Orthogonal polytypes (hP)
Class a polytypes (mC)
Class b polytypes (hR)
subfamily A (hR)† hR mC (Series 0) hR (Series > 0)
subfamily B (hP)† hP ----- hR
mixed-rotation (hP)‡ hP mC hR
†Trigonal model. ‡Pauling model.
Class a polytypes . Each subfamily A Series 0 polytypes belong to Class a; mixed-rotation polytypes may also belong to Class a. In both cases, the limiting symmetry is mC and the unique axis does not coincide with that of the family structure (b in the polytypes, c in the family structure). Each of the six possible orientations of the individuals correspond thus to independent orientations of the w.r.l. The possible composite twins are obtained by calculating the sequences of ZT symbols for sets of individuals from two to six. The orientation of the first individual is fixed (ZT = 3), and five possible orientations
7 A “motion” is an instruction assigning uniquely to each point of the point space an 'image'
whereby all distances are left invariant. A motion is called proper (also: “first sort”) or improper (also: “second sort”) depending on whether the determinant of the matrix representing it is +1 or -1.

Crystallographic Basis of Polytypism and Twinning in Micas 237
remain where m individuals (1 ≤ m ≤ 5) must be distributed. The number of twins is then:
( )
( )5 5 5
T1 1 1
5 5! 31! 5 !m m m
N m m m m= = =
⎛ ⎞= = =⎜ ⎟ −⎝ ⎠
∑ ∑ ∑ (17)
Table 16 gives the 12 sequences of independent ZT symbols; the other 19 simply correspond to a rotation of the entire twinned edifice followed by a shift of the origin along c, eventually coupled with the inversion of the direction of the rotation of the individuals in the twin [reflection of the lattice across (010)], as in ZT = 341.
Class b polytypes . Non-orthogonal polytypes belong to Class b in subfamily A Series > 0 and in subfamily B. The unique axis is a in the polytypes but c in the pseudo-rhombohedral lattice; the latter coincides with that of the family structure. The limiting symmetry is hR, which for subfamily A coincides both with the symmetry of the family structure and with the (pseudo) symmetry of the lattice. Only two orientations of the w.r.l. of the individual are independent, corresponding to the two parities of ZT symbols. A common symbol is thus used for the three equivalent orientations with the same parity, namely “U” (uneven) and “E“ (even). Twinning by pseudo-merohedry involves individuals with the same orientation parity of ZT symbols and produces complete overlap of the w.r.l. of the individual (neglecting the obliquity). The reciprocal lattice of the twin is thus geometrically indistinguishable from the reciprocal lattice of the individual. The three twins ZT = 35, ZT = 31 and ZT = 351 are equivalent to the single crystal, when considering the geometry of their lattice, and are thus represented as ZT = U. Instead, twinning by reticular pseudo-merohedry involves individuals with an opposite orientation parity of the ZT symbols and, considering the lattice only, they are represented as ZT = UE.
Orthogonal polytypes . In the Trigonal model, the lattice is hP (ω = 0); in the true structure for orthorhombic polytypes the lattice is normally oC but pseudo-hP (ω ≠ 0). For subfamily B and mixed-rotation polytypes the limiting symmetry is hP and there is only one independent orientation of the w.r.l. Twinning is either by complete merohedry or by pseudo-merohedry and does not modify the geometry of the diffraction pattern.
Subfamily A polytypes have an orthogonal lattice only if they belong to Series > 0 and have a 1:1:1 ratio of layers with the three orientations of the same parity (odd or even). The only example reported to date is 3T, which is also the only possible orthogonal polytype in Series 1. Other subfamily A orthogonal polytypes may appear in Series > 1 but are at present unknown. The limiting symmetry is hR and the w.r.l. has two independent orientations, as for Class b polytypes, which correspond to the two settings (obverse/reverse) of the family structure. Twinning is by merohedry (ω = 0, either complete or selective, depending on the twin law) or pseudo-merohedry (ω ≠ 0).
The 3T polytype has three twin laws, two of which correspond to selective merohedry and invert the parity of the ZT symbol, namely ZT = U → ZT = E (6′2′2) or ZT = E• ⎯(6′m′2); the third twin law ⎯(3′12/m′) corresponds instead to complete merohedry and preserves the parity of the ZT symbol (ZT = U → ZT = U•).
Derivation of twin diffraction patterns
The number and disposition of nodes on the reciprocal lattice rows parallel to c* are termed node features and are identified by a symbol Ij, where I is the number of nodes within the c*1 repeat and j is a sequence number. Nespolo et al (2000a) introduced an orthogonal setting for the analysis of twins in terms of Ij, which is termed the twin setting. When dealing with a single polytype, the twin setting coincides with the C1 setting, which
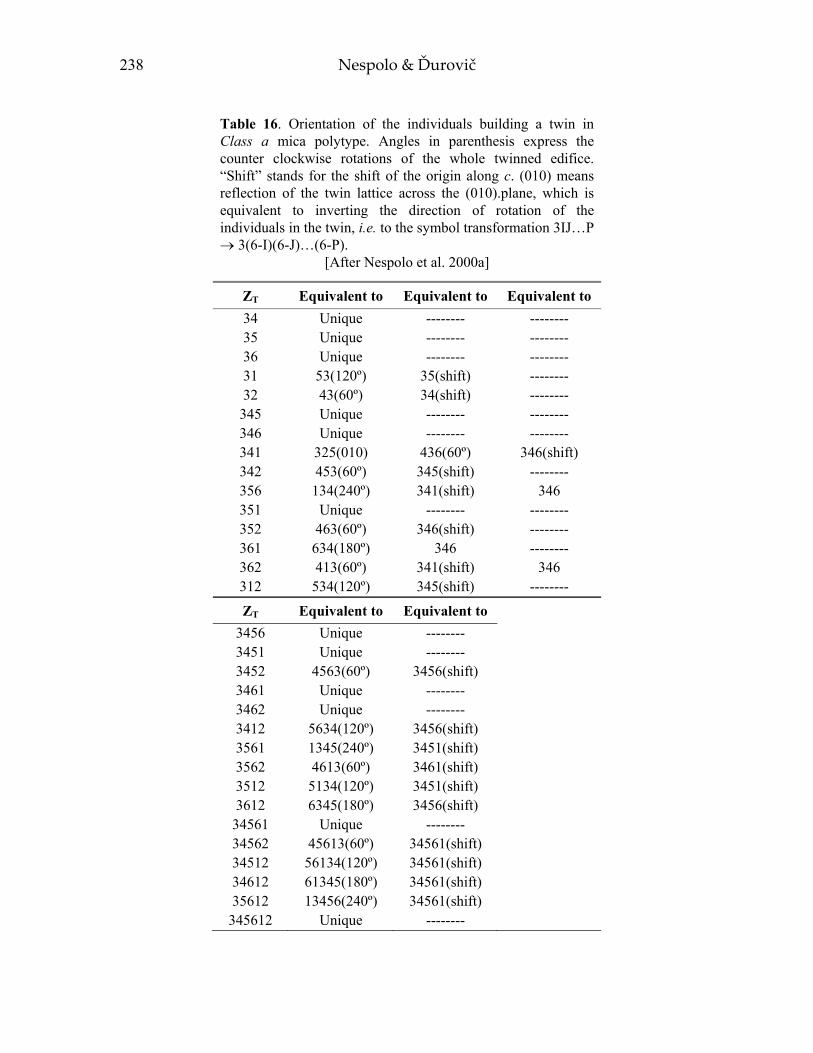
238 Nespolo & Ďurovič
Table 16. Orientation of the individuals building a twin in Class a mica polytype. Angles in parenthesis express the counter clockwise rotations of the whole twinned edifice. “Shift” stands for the shift of the origin along c. (010) means reflection of the twin lattice across the (010).plane, which is equivalent to inverting the direction of rotation of the individuals in the twin, i.e. to the symbol transformation 3IJ…P → 3(6-I)(6-J)…(6-P).
[After Nespolo et al. 2000a]
ZT Equivalent to Equivalent to Equivalent to 34 Unique -------- -------- 35 Unique -------- -------- 36 Unique -------- -------- 31 53(120º) 35(shift) -------- 32 43(60º) 34(shift) --------
345 Unique -------- -------- 346 Unique -------- -------- 341 325(010) 436(60º) 346(shift) 342 453(60º) 345(shift) -------- 356 134(240º) 341(shift) 346 351 Unique -------- -------- 352 463(60º) 346(shift) -------- 361 634(180º) 346 -------- 362 413(60º) 341(shift) 346 312 534(120º) 345(shift) --------
ZT Equivalent to Equivalent to
3456 Unique -------- 3451 Unique -------- 3452 4563(60º) 3456(shift) 3461 Unique -------- 3462 Unique -------- 3412 5634(120º) 3456(shift) 3561 1345(240º) 3451(shift) 3562 4613(60º) 3461(shift) 3512 5134(120º) 3451(shift) 3612 6345(180º) 3456(shift)
34561 Unique -------- 34562 45613(60º) 34561(shift) 34512 56134(120º) 34561(shift) 34612 61345(180º) 34561(shift) 35612 13456(240º) 34561(shift)
345612 Unique --------

Crystallographic Basis of Polytypism and Twinning in Micas 239
is based on the cell of the twin lattice. To compare the geometry of the reciprocal lattice of polytypes with different periods, the twin setting is instead defined to have the shortest period along c* in the C1 setting among all the polytypes considered. The twin setting of the twin lattice is space-fixed and parallel to C1, whereas that of the crystal lattice is crystal-fixed for each of the individuals building a twin. Since the first individual of the twin is space-fixed (ZT = 3 for Class a, or ZT = U for Class b and orthogonal polytypes), its twin setting is parallel to C1. The l index in the twin setting is labeled lT.
Rotations between pairs of individuals are taken counter-clockwise in direct space, and thus clockwise in reciprocal space. The n×60º rotations about c*, which give the approximate rotations between pairs of individuals, overlap only Ri belonging to the same type (S, D or X). Each of the Ri is rotationally related to five other Ri and along each of them a peculiar sequence of lT indices is obtained, which is termed a “Rotational Sequence”. Each Ri generates one rotational sequence, which is shortened to RSi
P(n), where: the superscript P indicates the polytype; i is the same index defining Ri; n points to each of the six characters of the RS. RS1
P corresponds to S rows and thus it is “000000” for all polytypes. The n-th values of RSi
P correspond to the lT indices of the nodes on the row which is related to Ri by (n-1)×60º clockwise rotation. The two RSi
P corresponding to D-type rows (R2-3) on the one hand, and the six RSi
P corresponding to X-type rows (R4-9) on the other, can be transformed into each other by cyclic permutations. Since the orientations of the single-crystal lattices and of the twin lattice are fixed and determined by ZT, also the starting point of each RSi
P is fixed, and the nine RSi
P are independent. The node features of the composite rows are obtained from the corresponding RSi
P by considering their relation with the ZT symbols. A twin of N individuals (2 ≤ N ≤ 6) is identified by N ZT symbols. The lT index of the q-th node coming on i-th row from the j-th individual is given by: [lT(i, j)]q = [RSi
P(n) ]q , n = [(ZT)j+4](mod 6). (18) The node features of composite rows are completely defined by the nine RSi
P and ZT symbols; therefore, there are only nine independent composite rows, for which the symbol Ci is adopted. Ri and Ci share the same row features and thus the description of the reciprocal lattice in terms of the tessellation rhombus and of the minimal rhombus is the same for both the single-crystal lattice and the twin lattice.
Because of the metric relations (Table 10), the lT of both Ci and Ri of the same type and belonging to the same central plane are related by:
( ) ( )
( ) ( )( ){ }3
9 mod6
D 6 D
X 6 X
T i T iq q
T i T iq q
l l
l l
−
−
= −⎡ ⎤ ⎡ ⎤⎣ ⎦ ⎣ ⎦
⎡ ⎤= −⎡ ⎤⎣ ⎦ ⎣ ⎦. (19)
Knowing the lT of one D-type Ci / Ri and three X-type Ci / Ri, the lT of the remaining four Ci / Ri can be calculated. There are thus five truly geometrically independent Ci / Ri (one S-type, one D-type and three X-type), but nine translationally independent Ci / Ri. The distribution of Ij on the Ci of a minimal rhombus is the information necessary to derive and identify the diffraction patterns of mica twins.
A short comparative analysis of the four periodic basic structures (1M, 2M1, 2M2 and 3T) is given below. For these four polytypes the twin setting has a period of c*1/6 along c*: lT (2M1, 2M2) = lC1(2M1, 2M2), but lT (1M, 3T) = 2lC1(1M, 3T). Table 17 gives the Ci and RSP
i. The definition of Ij, is given in Table 18. The rules for combining Ij’s of the individuals into composite Ij’s of the twin are given in Nespolo et al (2000a).

240 Nespolo & Ďurovič
Tabl
e 17
. C
ompo
site
row
s (C
i) an
d R
otat
iona
l Seq
uenc
es (R
S iP ) f
or th
e fo
ur b
asic
pol
ytyp
es
(afte
r Nes
polo
et a
l. 20
00a)
.
Com
posi
te ro
w
Type
h
(mod
3)
k(m
od 3
) R
S1M
RS2M
1 R
S2M2
RS3T
C1
S 0
0 00
0000
00
0000
00
0000
00
0000
C2
D1
1 0
2424
24
4242
42
0000
00 /
3333
33
2424
24
C3
D2
2 0
4242
42
2424
24
0000
00 /
3333
33
4242
42
C4
X1
1 1
2044
02
1022
01 /
4355
44
1212
12 /
4545
45
0000
00 /
2222
22 /
4444
44
C5
X2
2 2
4022
04
2011
02 /
5344
35
2121
21 /
5454
54
0000
00 /
2222
22 /
4444
44
C6
X3
0 1
0220
44
0110
22 /
3443
55
1212
12 /
4545
45
0000
00 /
2222
22 /
4444
44
C7
X4
1 2
2204
40
1102
20 /
4435
53
2121
21 /
5454
54
0000
00 /
2222
22 /
4444
44
C8
X5
2 1
4402
20
2201
10 /
5534
43
1212
12 /
4545
45
0000
00 /
2222
22 /
4444
44
C9
X6
0 2
0440
22
0220
11 /
3553
44
2121
21 /
5454
54
0000
00 /
2222
22 /
4444
44
Tabl
e 18
. Def
initi
on o
f the
I j fo
r the
four
bas
ic p
olyt
ypes
and
thei
r tw
ins.
I ind
icat
es th
e nu
mbe
r of n
odes
on
the
reci
proc
al la
ttice
row.
Th
e su
bscr
ipt j
is a
sequ
entia
l num
ber (
afte
r Nes
polo
et a
l. 20
00a)
.
I j1 1
1 2
1 3
2 1
2 2
2 3
2 4
2 5
2 6
3 1
3 2
3 33 4
3 53 6
3 7
l(mod
6)
0 2
4 0,
2 0,
4 0,
3 1,
4 2,
5 2,
4 0,
2,4
0,1,
4 0,
2,3
0,2,
5 0,
3,4
1,2,
4 2,
4,5
I j4 1
4 24 3
4 44 5
4 65 1
5 25 3
6 1
l(mod
6)0,
1,2,
4 0,
1,3,
4 0,
2,3,
5 0,
2,3,
4 0,
2,4,
5 1,
2,4,
5 0,
1,2,
3,4
0,1,
2,4,
5 0,
2,3,
4,5
0,1,
2,3,
4,5

Crystallographic Basis of Polytypism and Twinning in Micas 241
1M polytype . The c*1 repeat coincides with the polytype period and along each Ri there is only one node, which obeys the relation lT = 2h(mod 6). D-type Ri are either 12 (D1) or 13 (D2) and the RS2-3
1M are "242424" and "424242". The n×60° rotations about c* produce the overlap of all the reciprocal lattice nodes belonging to D-type Ri when n is even, but to their separation when n is odd. X-type RS4-9
1M are the six cyclic permutations of "220440". On the basis of the relation between Ci and RSi
1M (Table 17) seven different Ci appear in the twin lattice. One or two reflections can appear on D-type Ci (lT is never 0), whereas one, two or three reflections can appear on X-type Ci. Nine independent 1M twin patterns occur (Fig. 25).
Figure 25. The nine independent patterns of 1M twins as expressed through the corresponding minimal rhombi. For the ZT = 34 twin, the complete star polygon is given, with the minimal rhombus in it shaded. Inset: l (mod 6) indices of the nodes on reciprocal lattice composite rows [used by permission of the editor of Acta Crystallographica A, from Nespolo et al. (2000a) Fig. 8, p. 143].
When three equally spaced reflections in the c*1 repeat occur along non-family rows, in principle the diffraction pattern may correspond either to a 1M twin (apparent polytypism) or to a 3-layer polytype (real polytypism). The distinction is obtained by applying the geometrical criteria given in Tables 12a-12c. However, 1M twins with ZT = 351 cannot be distinguished geometrically from the 3T polytype (see also Nespolo and Kogure 1998). This ambiguity is removed when weak reflections appear along family rows, which can be expected for dioctahedral and Li-rich trioctahedral micas (Rieder 1968, 1970). The effect of these weak reflections on the twin diffraction pattern is analyzed in Nespolo et al (2000a).
2M1 polytype . Because the parity of layers is opposite for the 2M1 polytype (Z = 220440, T = |4.4 2.2|) with respect to the 1M polytype (Z = 330, T = |3.3|), the threefold family structure has an opposite setting (reverse / obverse) and the corresponding family rows have different reflection conditions, namely k = 0(mod 3), lT = 2h(mod 6) for 1M,

242 Nespolo & Ďurovič
but k = 0(mod 3), lT1 = 4h(mod 6) for 2M1 (Nespolo 1999). One reflection occurs in the c*1 repeat along family Ri, but two along non-family Ri. D-type Ri are the same as in 1M case, but, because of the opposite parity of the layers in the two polytypes, the two RS2-3
2M1 are inverted. X-type Ri have the three possible pairs of values of lT (mod 6): 0 and 3, 1 and 4, 2 and 5. For the X-type Ri the sequence of n×60° rotations corresponds to a double sequence of lT values: 011022 / 344355 or cyclic permutations, producing six independent double RSi
2M1 (Table 6). As for the 1M polytype, the twelve composite twins produce nine different patterns, none of which can be mistaken for that of a 1M twin (Fig. 26).
Figure 26. The nine independent patterns of 2M1 twins as expressed through the corresponding minimal rhombi. Inset: l (mod 6) indices of the nodes on reciprocal lattice composite rows [used by permission of the editor of Acta Crystallographica A, from Nespolo et al. (2000a) Fig. 9, p. 144].
2M2 polytype. Being a Class b polytype, 2M2 has a markedly pseudo-rhombohedral lattice and two of the five pairs of twin laws, namely those corresponding to ±120º rotation about c*, correspond to pseudo-merohedry, whereas the remaining three correspond to reticular pseudo-merohedry. Each of the six n×60º rotations belong to the point group of the family structure (subfamily B), and thus the family sublattice of the individuals is always overlapped. RS2
2M2 and RS32M2 both correspond to the double
sequence 000000/333333, whereas RS4-92M2 correspond to the cyclic permutations of the
double sequence 121212/454545. There are only two kinds of patterns for 2M2 twins. Twinning by pseudo-merohedry gives a pattern geometrically indistinguishable from that of the single crystal (ZT = U). The other pattern corresponds to twinning by reticular pseudo-merohedry (ZT = UE) and differs from the single crystal pattern in the six X-type Ci, which show four reflections in the c*1 repeat (Fig. 27). Neither can be mistaken for any one of the 1M or 2M1 polytypes or twins.
3T polytype . The 3T polytype is an orthogonal subfamily A polytype, for which the six orientations of the structural model are equivalent. They can be grouped into two sets of odd or even parity, corresponding to obverse and reverse setting of the family structure

Crystallographic Basis of Polytypism and Twinning in Micas 243
respectively. Taking odd parities, as in Zvyagin (1967), D-type Ri and RSi3T are the same
as those of 1M polytype. Taking the even orientation instead, as in Backhaus and Ďurovič (1984), D-type Ri and RSi
3T are the same as those of 2M1 polytype. In both cases, there is only one triple sequence of X-type RS3T: 000000/222222/444444. The six orientations of the minimal rhombus are divided into two types, differing for the D-type Ri. The 2n×60° rotations belong to the symmetry of both the individual and the family structure and reproduce the same rhombus. On the other hand, (2n+1)×60° rotations do not belong to either symmetries and thus they exchange the two independent rhombi.
Twinning by complete merohedry (ZT = UU•) by definition produces a diffraction pattern with the same geometrical appearance as the single crystal, which in its turn may be geometrically identical to the pattern of 1M twinned as ZT = 351. In contrast, for twinning by selective merohedry (ZT = UE, UE•, UU•E, UU•E•, UU•EE•), the two D-type Ci correspond to have two reflections at lT = 2(mod 6) and 4(mod 6). This is the same geometrical appearance of 1M twinned as ZT = 3451. The distinction between 1M twins and the 3T polytype (twinned or untwinned) requires by very careful examination of the violation of the additional reflection conditions (Nespolo et al. 2000a).
Figure 27. The two independent patterns of 2M2 twins as expressed through the corresponding minimal rhombi. Inset: l (mod 6) indices of the nodes on reciprocal lattice composite rows.
Derivation of allotwin diffraction patterns
The allotwin laws include the twin laws for each of the individuals, as well as the symmetry operations of the crystal(s) point group(s). The six rotations about c* now must be considered. By indicating the first individual with a superscript and the second one with a subscript, the allotwin ZT = 3
3 must be considered also, whereas the ZT = 33 twin simply corresponds to a parallel growth. Therefore, the number of possible laws increases and depends upon the number of different polytypes undergoing allotwinning.
Because the geometrical appearance of the diffraction pattern of the 3T polytype and of its twins is ideally the same as 1M twinned as ZT = 351 or 3451, the contribution from 3T does not produce an independent pattern: it is not considered in the following systematic analysis.
The three basic monoclinic polytypes can produce 3 binary (two-individual) allotwins (1M-2M1; 1M-2M2; 2M1-2M2) and 1 ternary (three-individual) allotwin (1M-2M1-2M2). Binary (AB) and ternary (ABC) allotwins are indicated by A
B and ABC respectively, where A, B and C represent the ZT symbols for each portion of the allotwin.

244 Nespolo & Ďurovič
These composite allotwins can be described on the following basis: 1. The allotwin is constructed by 2 (binary allotwin) or 3 (ternary allotwin) portions (A,
B, C), each consisting only of individuals of the same polytype, which in turn can be twinned; 1M is taken as the first portion (A) of the allotwin; when 1M is not involved (binary allotwin 2M1-2M2), the portion A is 2M1.
2. Because the individuals building the twin or allotwin are related by point group operations, the A-B-C sequence has no influence on the composite lattice and the two or three portions can be described as juxtaposed and non-mixed; for example, ZT = 34
56 is equivalent to ZT = 35
46. 3. Within each single portion (A, B, C), the restrictions on the possible orientations
derived for the twins are retained, but these restrictions are not applicable when comparing individuals belonging to different portions.
4. The first individual of the first portion (A) is fixed in orientation ZT = 3, but this restriction is not applicable for the first individual of the other portions. Therefore the number of possible orientations for B and C portions must be multiplied by the number of independent orientations of the minimal rhombus, as determined by the limiting symmetry, namely six for 2M1, and two for 2M2. The minimal rhombi of the allotwins are calculated as combinations of the minimal
rhombi of each portion, but the number of minimal rhombi to be considered depends upon the limiting symmetry. Those minimal rhombi of two twins of 1M that are equivalent through an n×60º rotation about c* can produce two independent minimal rhombi when combined with a minimal rhombus of 2M1. Therefore, in the derivation of the reciprocal lattice of 1M-2M1 allotwins, the minimal rhombi of all the thirty-one twins for both polytypes in Table 16 must considered. To these, the minimal rhombus corresponding to the single crystal must be added. Moreover, keeping fixed the minimal rhombi of 1M (first individual in orientation ZT = 3), the six independent orientations of each of the thirty-two minimal rhombi of 2M1 must be considered. For the 2M2 polytype, there are only two independent orientations of the individual w.r.l. (ZT = U or ZT = E) and only one for the twin reciprocal lattice (ZT = UE). In deriving the reciprocal lattice of 1M-2M2 or 2M1-2M2 allotwins, for Class a polytypes only the minimal rhombus of the single crystal and the minimal rhombi of the twenty-three twins related by (2n+1)×60º rotations must be combined with the three (U, E, UE) minimal rhombi of 2M2. The remaining eight minimal rhombi of Class a polytypes are related to some of the other twenty-three by 2n×60º rotations, which are symmetry operations for the minimal rhombi of 2M2 and cannot produce any further independent allotwin minimal rhombus. Finally, for the ternary allotwins 1M-2M1-2M2, the independent minimal rhombi of the binary allotwin 1M-2M1, and those related by (2n+1)×60º rotations, must be combined with the three minimal rhombi of 2M2.
For each combination, the composite minimal rhombus obtained in this way, then rotated by n×60º (0 ≤ n ≤ 5), and finally – for each of these rotations – reflected across (010), is compared with those calculated for the previous combinations and, if equivalent, is discarded. The resulting minimal rhombi are given in Nespolo et al (2000a).
IDENTIFICATION OF MDO POLYTYPES FROM THEIR DIFFRACTION PATTERNS
Theoretical background
The identification of the stacking mode in an MDO polytype is based on two orthogonal projections, which are sufficient to characterize reliably any structure. For

Crystallographic Basis of Polytypism and Twinning in Micas 245
mica structures (but also for other phyllosilicates) the most suitable projections are the XZ and the YZ projections. A Fourier series calculated with coefficients derived from zonal diffractions only, yields a projection of the structure along the zone axis. It follows that the h0l and 0kl nets characterize unambiguously the projections XZ and YZ, respectively. The h0l net contains only the reciprocal rows with family diffractions (S and D rows) and, therefore, this set characterizes the family structure, i.e. the Subfamily. The set of diffractions 0kl contains both S and X rows (not D rows). Whereas the former are common (almost) for all polytypes in both subfamilies and thus useless for identification purposes, the latter are characteristic for any individual polytype and can be used for their identification, unless they are so diffuse that no discernible maxima can be obtained.
Owing to the efficiency of atomic scattering factors as a function of sinϑ/λ, the diffractions close to the origin of the reciprocal lattice are best suited for identification purposes. Moreover, any family structure in micas is trigonal or hexagonal and from Friedel’s law it follows that the reciprocal lattice rows 20l, 13l,⎯13l, ⎯20l, ⎯⎯13l and ⎯13l carry the same information. Therefore, two reciprocal lattice rows, namely 20l and 02l, suffice to identify the subfamily and the MDO polytype, respectively. The positions of diffraction spots and the distribution of their intensities is so characteristic that a mere visual inspection of the diffraction patterns obtained experimentally with that calculated for a homo-octahedral structure with the expected chemical composition, leads to the solution, provided that the presence of twinning has been ruled out. This procedure was described first by Weiss and Ďurovič (1980) and explained in more details by Ďurovič (1981) (see also Ďurovič 1999, p.761).
The recognition of the significance of the YZ projections (and thus also the five MDO groups given in Table 7), which can be derived also directly from the full polytype symbols (Ďurovič et al. 1984), is very important also for the interpretation of HRTEM images (Kogure, this volume).
Identification procedure
The identification of the stacking mode of an MDO polytype in the homo-octahedral approximation is straightforward. It can be performed by visual inspection of the intensity distribution along two rows (one D and one X), and from visual inspection of the geometry of the diffraction pattern. 1. Intensity distribution. a) Calculate F2 values for each of the six homo-octahedral MDO polytypes given in
Table 7 by using average atomic occupations in the octahedral sites, which correspond approximately to the chemical composition of the investigated polytype. Use the space-group type P1 and use a common orthogonal six-layer cell, which can "accommodate" each polytypes. Atomic coordinates from the ideal Pauling model may be used. The F2(0kl) values for the 1M and 2O polytypes must be the same (MDO group I, Table 7) and also the F2 values for the family diffractions must obey the trigonal/hexagonal Laue symmetry. Select the 20l and 02l rows, and construct identification diagrams for the determination of the subfamily (two rows for A and B only) and for the MDO polytype (four rows for the MDO groups I to IV) as indicated in Figure 28, where the size of each circle is proportional to the respective F2 values. In principle, the MDO V row should be given. However, this group contains only the 6H polytype, which has not been reported to date, and can be unambiguously identified by the geometry of its diffraction pattern, which has six orthogonal planes with two reflections in the c*1 repeat along D rows: this geometry cannot be obtained by the twinning of any other polytype. The program DIFK

246 Nespolo & Ďurovič
(Smrčok and Weiss 1993) is very convenient for the calculations of the F2 values. The program contains a subroutine to produce sequences of the F2 values along selected reciprocal rows. This program can be obtained free of charge from Smrčok8.
b) Make a set of precession photographs, three from the SX planes and one from an SD plane. Select the 20l and 02l rows, and compare the intensities with the calculated values. Figure 29 and 30 show three examples.
Figure 28. Visual representation of calculated intensities of diffractions of MDO polytypes of phlogopite. The indexing refers to the six-layer orthogonal cell (C2 cell). Left: intensities along 20l (D row, containing family diffractions) reciprocal lattice row and intensity distribution within subfamilies A and B. Right: intensities along 02l (X row, containing non-family diffractions) reciprocal lattice row and intensity distribution within MDO groups I to IV. The strongest intensity of each subfamily (left) or MDO group (right) is drawn as the largest circle (modified after Weiss and Durovic 1989).
2. Geometry of the diffraction pattern. a) Reciprocal lattice rows parallel to c* in the h0l r.p. have 1 (subfamily A) or 2
(subfamily B) reflections in the c*1 repeat; b) Reciprocal lattice rows parallel to c* in the 0kl r.p. have 1 (1M), 2 (2M1, 2M2 or 2O),
3 (3T) or 6 (6H) reflections in the c*1 repeat; c) 2M1 is the only 2-layer subfamily A polytype; 2M2 and 2O are distinguished because
the 0kl r.p. is orthogonal for the latter but non-orthogonal for the former.
For the determination of the meso- and hetero-octahedral MDO polytypes, a complete structure refinement is necessary, because the occupancy factors of the three
8 E-mail: [email protected]

Crystallographic Basis of Polytypism and Twinning in Micas 247
octahedral sites as well as the sizes of the corresponding octahedra must be determined. A complete structure refinement (e.g., using anomalous scattering) is necessary also to distinguish the two members of an enantiomorphous pair.
Our experience shows that the ideal Pauling model is sufficient for identification purposes because the slight deviations from the actual atomic coordinates owing to desymmetrization are not important in these calculations.
Figure 29. Comparison of observed (obs.) and calculated (calc.) intensities along 02l (X row, containing non-family diffractions) and 20l (D row, containing family diffractions) reciprocal lattice rows of zinnwaldites 1M (MDO group I) and 2M1 (MDO group II), which are essential for the identification of MDO groups I, II and of subfamily A, respectively, Observed intensities are taken from 0kl and h0l precession photographs. The distribution of intensities of 20l diffractions is very similar for both zinnwaldite polytypes, and therefore only the distribution corresponding to the one-layer polytypes is given (modified after Weiss and Durovic 1989).
IDENTIFICATION OF NON-MDO POLYTYPES: THE PERIODIC INTENSITY DISTRIBUTION FUNCTION
The number of non-MDO polytypes in each family is infinite, and increases dramatically with the number of layers (Mogami et al. 1978; McLarnan 1981). The procedure for the identification of MDO polytypes described in the previous section becomes virtually impossible for non-MDO polytypes with longer periods, which require instead a simplified procedure. This simplified procedure was introduced by Takeda (1967) under of the name of Periodic Intensity Distribution (PID). The PID is an

248 Nespolo & Ďurovič
approximation of the Fourier transform of the stacking sequence that can be obtained in a simple way from the diffraction intensities: it is defined within the Trigonal model and the homo-octahedral approximation, and gives thus the correct stacking mode for the case of all-M1 layers. If the polytype contains one or more M2 layers, the stacking mode obtained from PID analysis of the diffraction pattern is simply an approximation: for each M2 layer, the characters
T . T2 2 1v2 2 1+
+j j
i, j are replaced by the characters .
v2 2 1+e e
j, j or .
v2 2 1+u u
i, j , depending on the parity of T2j and T2 j +1, and the displacement character obtained by the PID is simply v2j,2j+1. No indication can be obtained from the PID that the polytype may belong to the hetero-octahedral family. For the meso- and hetero-octahedral family, as well as for the distinction between the two members of an enantiomorphous pair, a complete structure refinement is required, similarly to the case of MDO polytypes. However, only the structural models corresponding to polytypes homomorphic to the homo-octahedral sequence obtained by PID analysis must be considered.
The Fourier transform of a polytype (GN, where N is the number of layers) is given by the Fourier transform of the stacking sequence, which is a fringe function (Lipson and
Figure 30. Comparison of observed (obs.) and calculated (calc.) intensities along 02l (X row, containing non-family diffractions) and 20l (D row, containing family diffractions) reciprocal lattice rows of lepidolite 2M2 (MDO group III), which are essential for the identification of MDO groups III and subfamily B, respectively. Observed intensities are taken from 0kl and h0l precession photographs.
Crystallographic Basis of Polytypism and Twinning in Micas 249
Taylor 1958), modulated by the Fourier transform of the layer (Gj):
( ) ( ) ( ), , ,1
exp 2NNj x j y j z jj
G hkl G hkl i t h t k t lπ=
= + +∑ (20)
where tx,j, ty,j, tz,j are the (x, y, z) components of the stacking vector relating the j-th and the (j+1)-th layers (Takeda 1967). When the shifts between the building layers are rational and the rotations belong to the symmetry of the layer(s), their Fourier transform (Gj), which is a continuous function in the direction lacking periodicity, can be factorized from the expression of the structure factor GN. Thus, GN takes the simple form of the product of the layer transform and of the stacking sequence transform. The second term expresses the periodicity in reciprocal space appearing when a structure is constructed by a translation of subunits. This is the case of polytypes of binary compounds like SiC and ZnS (Tokonami and Hosoya 1965; Tokonami 1966; Farkas-Jahnke 1966; Dornberger-Schiff and Farkas-Jahnke 1970; Farkas-Jahnke and Dornberger-Schiff 1970). In micas, the M layers are instead related by rotations belonging not to the layer symmetry but to the idealized symmetry of the Ob plane (with the obvious exception of the 1M polytype) and the same simplification is in principle not possible. However the Fourier transform of the M layer in the six possible orientations is almost unmodified in a subspace of the reciprocal space (Takeda 1967). By removing the modulating effect of the layer, the approximated Fourier transform of the stacking sequence is obtained. This is known as the Periodic Intensity Distribution (PID) function (Takeda 1967; Sadanaga and Takeda 1969; Takeda and Sadanaga 1969). Comparison of calculated and observed PID values along non-family reciprocal lattice rows parallel to c* is in principle sufficient to identify any mica polytype (Takeda and Ross 1995; Nespolo et al. 1999d).
PID in terms of TS unit layers
A single type of non-polar unit layer (the M layer) is sufficient to describe polytypism of micas: the M layer is stacked with both translations along c and rotations about c* which do not belong to the layer symmetry. A different choice, employing more than one type of layers, is more suitable to describe the symmetry of the layer stacking and to simplify the process of identification of the stacking mode. As shown above, two kinds of non-polar OD layers (Tet and Oc) and one kind of polar OD packet (with two opposite orientations, p2j and q2j+1) are necessary to describe the OD character of mica polytypes. To compute the PID, Sadanaga and Takeda (1969) and Takeda and Sadanaga (1969) introduced the non-polar TS unit layers, which are defined within the Trigonal model. The two layers D and T would be sufficient to describe any mica polytypes if two orientations, related by 180º rotation about c*, were permitted. To avoid the use of this rotation, which does not belong to the layer symmetry, four TS layers, including also the D* and T* layers, are employed. The relative positions of TS unit layers are given by the TS symbols, written as a sequence of N symbols Lj(ΔXj, ΔYj), 1 ≤ j ≤ N, where Lj is the kind of layer (D, D*, T, T*), and (ΔXj, ΔYj) are the (A1, A2) components in hexagonal axes of the total shift vector between the j-th TS layer and the N-th TS layer of the previous repeat (Fig. 2,3). The j-th TS unit layer is defined by the relation between the j-th and the (j+1)-th M layers and corresponds to the pair of packets q2j-1p2j. D and D* layers correspond to 2n×60º rotations between q2j-1 and p2j [i.e. the RTW symbol is Aj = 0(mod 2); q2j-1 and p2j have the same orientation parity], T and T* layers correspond to (2n+1)×60º rotations between q2j-1 and p2j [i.e. Aj = 1(mod 2); q2j-1 and p2j have an opposite orientation parity].
In the homo-octahedral approximation the two OD packets (p2j and q2j+1) describing each layer have the same OD symbol, and the two half-layers of an M layer have the

250 Nespolo & Ďurovič
same Z symbol. If “u” (uneven) and “e” (even) are the orientation parities of OD symbols of the OD packets, or of Z symbols of half M layers, the following equalities are obtained from Figure 3:
D = u0u; D* = e0e; T = e0u; T* = u0e (21)
The Fourier transform of an N-layer mica polytype [Eqn. (20)] in terms of TS unit layers in hexagonal axes becomes:
( ) ( ) ( )∑ = ⎟
⎠⎞
⎜⎝⎛ −
+Δ+Δπ=N
j jjRjN
NjLKHiLHKGLHKG
1
1YX2exp.. . (22)
The Fourier transform of the j-th TS unit layer, Gj(HK.LR), is two-dimensionally periodic and the reciprocal lattice coordinate in the direction lacking periodicity is not restricted to integral values but is a real variable, labeled LR. In Equation (22), Gj plays a role analogous to that of the atomic scattering factor in the expression of the structure factor.
Because the j-th and the (j+1)-th TS layers must connect two packets p2j and q2j+1 with the same orientation parity (to preserve the octahedral coordination of the M cations), there are only eight possible pairs of TS unit layers (DD; D*D*; TT*; T*T; DT*; D*T; TD; T*D*). In addition, to match the cation positions, the layer stacked over a D or T layer must be shifted by –a/3, whereas the layer stacked over a D* or T* layer must be shifted by +a/3. Within the Pauling model only the octahedral cations have different coordinates in the four TS unit layers. However, their contribution to the layer Fourier transform becomes identical when the following conditions are satisfied:
( ) ( ) ( ) ( ) ( )( ) ( ) ( )
0 mod 3 ,all ; 1 mod 3 , 1 mod 3 ; 2 mod 3 , 2 mod 3
0 mod 3 ,all ; 0 mod 3 , 0 mod 3
H K H K H K
h k h k
= = ≠ = ≠
= ≠ ≠ .(23)
Consequently, Gj is identical for all j (Gj = G0) and the contribution of the Fourier transform of the layer can be extracted from the summation in Equation (22), obtaining the PID function SN:
( ) ( )
( )( )∑ = ⎟
⎠⎞
⎜⎝⎛ −
+Δ+Δπ=≅N
j jjR
NN
NjLKHi
LHKGLHKGLHKS
10
1YX2exp... . (24)
Within the Trigonal model also the Ob atoms have different coordinates, but again their contribution to Gj in all the four TS unit layers is the same when:
0,all ; 0,all ;0,all ;
H K K H H Kh k h k
= = = −= = ±
. (25)
For these reflections, Gj = G0 and Equation (24) holds again. PID is thus defined in a subspace of the reciprocal space, which narrows from subfamily A polytypes to mixed-rotation polytypes, but always includes at least the three r.p. 0kl, hhl,⎯hhl.
The procedure for computing PID from the stacking mode is illustrated in Appendix B. A concrete example is hereafter analyzed in details for the 8A2 polytype. The PID is computed from the RTW symbols of the stacking sequence with the program PTST98

Crystallographic Basis of Polytypism and Twinning in Micas 251
(Nespolo et al. 1999d). This program can be obtained free of charge from its first author9.
Derivation of PID from the diffraction pattern
The PID analysis of the diffraction pattern can be performed both in XRD and SAED (Selected Area Electron Diffraction) techniques. The experimental PID is easily obtained from the diffraction pattern once the data reduction has been applied. However, a complete data reduction is in general not necessary, because the stacking sequence is determined by the best match between the PID obtained from the diffraction pattern and the PID computed for all the homo-octahedral stacking candidates. For polytypes with a limited period, a direct visual comparison of the intensities with the computed PID can reveal the correct homo-octahedral stacking sequence (Ross et al. 1966). The experimental PID function is obtained from the intensities in a 0.1Å-1 repeat, within which the variation of the experimental factors is small, and the PIDs from several repeats are finally weighted, so that possible uncertainties are further reduced. For example, in general, the improvement in PID obtained by applying the absorption correction is smaller than the approximation of describing the mica structure with the TS layers, which are defined within the Trigonal model. Complete data reduction may improve the quality of the match of the experimental PID with that computed from the correct stacking sequence, but it does not change the sequence of stacking candidates. In other words, the homo-octahedral stacking sequence that best matches the experimental PID is not replaced by a different candidate when a more complete data reduction is applied. Some uncertainties can however be expected for a less complete data reduction in the hypothetical case of a long-period polytype (for which the number of possible stacking sequences is high) with a poor quality of the reflections, and consequently large uncertainties on the experimental PID, if two candidates show relatively close matches with the experimental PID. Such a hypothetical case has not appeared so far, but this is a possibility.
A particularly intriguing case may occur when polytypes with different periodicities are in relation of homomorphy. As shown above, this may happen if a sub-periodicity exists in the sequence of v2j,2j+1 displacement vectors of meso-octahedral polytypes, or in the sequence of T2j,T2j+1 orientation vectors of hetero-octahedral polytypes when the chirality of the packets is neglected. In general, the number of reflections in the c*1 repeat corresponds to the number of layers in the full-period polytype. However, when the chemical difference between the family of the full-period polytype and the family of the shorter homomorphous polytype becomes smaller, some of the reflections weaken: if these weak reflections are overlooked, the homo-octahedral stacking sequence obtained from the PID analysis corresponds to an apparent periodicity shorter than the correct one. The visual comparison of the intensities, if performed, involves only the meso-octahedral polytypes homomorphous with the homo-octahedral polytype indicated by the PID, but with the same number of layers and the mistake may be overlooked. Special attention is necessary not to miss weak reflections along X rows.
The general guidelines for the PID derivation from the diffraction pattern is summarized as follows: 1. For X-ray diffraction, the effect of the absorption on the PID is normally negligible for
the purpose of polytype identification, if a sufficient number (e.g., four or more) of periods along the same row are considered and the corresponding PIDs are weighted. The LP factors are critical, however, if the diffraction pattern is taken with a precession camera, because the Lorentz-polarization effect in the precession motion is severe.
9 E-mail: [email protected]

252 Nespolo & Ďurovič
2. For electron diffraction, the near-flatness of the Ewald sphere reduces greatly the effect of the experimental factors on the intensities. The pattern is, however, no longer kinematical, and the dynamical effects in general must be taken into account. However, the intensity ratio between adjacent reflections in a reciprocal lattice row can be treated as kinematical, and the PID analysis applies to electron diffraction as well (Kogure and Nespolo 1999b).
3. Equation (24) is based on the approximation of the trigonal distribution of each kind of atom in the layer and G0 is thus an approximation of the Fourier transform of the layer. In the regions of reciprocal space where G0 passes through zero and changes sign, the relative error becomes large and Equation (24) is no longer applicable. In the practice of mica-polytype identification, the periods corresponding to l intervals including those regions should not be used to derive PID from the intensities. These intervals depend on the chemical composition: in the diffraction pattern they include very faint reflections and are easily recognized.
4. The square root of the intensities, partially reduced when necessary, gives an approximant of the structure factors. By dividing these by the Fourier transform of the layer, an un-weighted, un-scaled PID is obtained. The mean value of PID along several period of the same reciprocal lattice row is computed, and the result is brought on the same scale [see Appendix B, Eqn. (B.4)].
EXPERIMENTAL INVESTIGATION OF MICA SINGLE CRYSTALS FOR TWIN / POLYTYPE IDENTIFICATION
Here we present the general guidelines for the experimental investigation of an unknown mica single crystal. The following represents an ideal outline and note that, depending on the availability and quality of the sample, and on the experimental equipment accessible to the investigator, not all the following steps may be possible. The local-scale investigation by TEM is described in detail by Kogure (this volume) and is thus not discussed here.
Morphological study
The first step in the investigation of a mica single crystal consists in a morphological observation under the polarizing microscope. The sample should be observed immersed in a high refractive-index medium (an index oil if available; a natural fluid such as clove oil or glycerin may be used also) and not in air; otherwise the presence of twinning can be easily missed. In case of reflection twins [composition plane (quasi) normal to (001)] a twin results in different extinction positions under crossed polarizers and no complete extinction of light occurs for any orientation of the crystal. Instead, for rotations twins [composition plane parallel to (001)] the presence of twinning may be missed if the sample is observed only on one of the two surfaces, in case the uppermost crystal of a twin is larger than the others. A negative result from the morphological observation should thus be prudently taken as not conclusive about the absence of twinning.
Surface microtopography
The second step should possibly involve a surface microtopography, which gives important information on both twinning and polytypism. The microtopography of a mica surface reveals spiral and parallel step patterns on the (001) crystal surfaces. Different techniques have been developed for this kind of investigation, such as phase-contrast microscopy, multiple-beam interferometry (e.g., Tolansky and Morris 1947a,b), surface decoration in TEM (Bassett 1958) and Atomic Force Microscopy. Three kinds of information, useful for the study of polytypism, are obtained by surface microtopography: 1) shape of the spirals; 2) height of the spiral step(s): 3)
Crystallographic Basis of Polytypism and Twinning in Micas 253
presence/absence of interlacing (Sunagawa 1964; Sunagawa and Koshino 1975). Micas of metamorphic origin are formed by alteration of the original rock and spiral
growth is commonly not observed on the surface, which instead presents step systems as a consequence of Ostwald ripening typical of environments in which crystals grow or dissolve via a thin film of vapor or solution owing to an interstitial solvent (Sunagawa et al. 1975; Tomura et al. 1979). In contrast, micas formed in magmatic environments invariably show growth spirals on their surfaces, more or less polygonalyzed depending upon the strength of the solid-fluid interaction (Sunagawa 1977, 1978). A zigzag stacking sequence (i.e. a stacking sequence different from 1M) appears at the surface with an interlaced pattern: interlacing unambiguously indicates that the crystal under investigation is not 1M. In the case of metamorphic micas, multiple steps split into N unit layers with rhombic form, where N is the number of layers in the period of the polytype. In the case of magmatic micas, it is the spiral turn that decomposes into N unit layers. In both cases, the cause of interlacing is the anisotropy of the advancing rate, which is faster along the stagger direction and slower normal to it (Frank 1951; Verma 1953). No interlacing appears on the surface of the 1M polytype, because all the layers have the same stagger direction. The interlacing pattern of growth spirals is also observed in other phyllosilicates, and was exploited to identify kaolinite (single-layer, no interlacing), dickite (two-layer kaolinite with 60º or 120º rotations) and nacrite (two-layer kaolinite with 180º rotations) of hydrothermal metasomatic origin (Sunagawa and Koshino 1975).
The shape of the growth spirals is controlled by the whole-layer symmetry, rather than by the symmetry of the sheet exposed on the growing surface. Typical growth spirals of trioctahedral micas are five-sided and show the monoclinic metric symmetry of the mica layer (Sunagawa 1964; Sunagawa and Tomura 1976) (Fig. 31). This shape of the growth spirals can be described as deriving from a regular hexagon through elongation and truncation. The growth is more rapid along [100] (the direction of the stagger) and results in longer sides parallel to the a axis (perpendicular to [010], the direction of slower growth), and the other four shorter edges and more largely spaced sides [±310, 3±10], corresponding to faster growth. The two sides ⎯[310] and ⎯[⎯310] are truncated to form a single line, eventually with a denticulated pattern, parallel to b. Truncation is not observed in 1:1 phyllosilicates, where there is no layer stagger. It is also not observed in dioctahedral micas: the reasons for this difference between trioctahedral and dioctahedral micas are not clear (Sunagawa and Koshino 1975; Sunagawa 1978). Because n×60º rotations are not equivalent when applied to a pentagonal spiral, the relative rotations of each component clearly appear at a surface observation and reveal the direction of stagger of each layer (Fig. 32). For short-period polytypes this information alone is sufficient to determine the stacking sequence. The height of the spiral step can also be directly measured by multiple-beam interferometry (step height as thin as 2.3Å were measured in hematite: Sunagawa 1960) and AFM (Kuwahara et al. 1998). In this way, Sunagawa et al (1968) identified polytypes 1M, 2M1, 2M2, 2O and 3T in synthetic fluor-phlogopite, and confirmed the presence of polytypes with longer period, whose stacking sequence was however too complex to be identified only on the basis of the surface morphology.
Also the presence of twinning is clearly shown by surface microtopography. Sunagawa and Tomura (1976) reported beautiful examples of five-sided plateau-like patterns on the (001) face of phlogopite. These patterns derive from the agglutination of thin platy crystals, formed in the vapor phase and moving around as “flying magic carpets” while they are growing, onto the surface of a larger crystal, on which they settle with equal probability on any of the n×60º rotations, making thus either a parallel or a
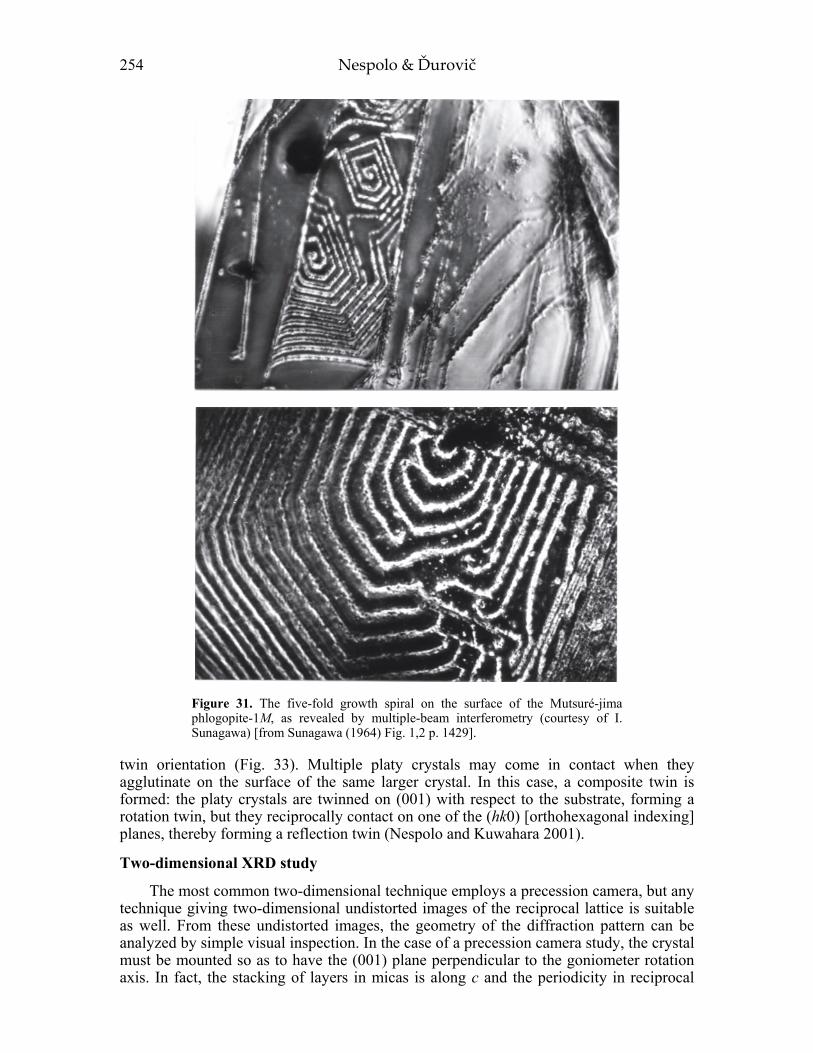
254 Nespolo & Ďurovič
Figure 31. The five-fold growth spiral on the surface of the Mutsuré-jima phlogopite-1M, as revealed by multiple-beam interferometry (courtesy of I. Sunagawa) [from Sunagawa (1964) Fig. 1,2 p. 1429].
twin orientation (Fig. 33). Multiple platy crystals may come in contact when they agglutinate on the surface of the same larger crystal. In this case, a composite twin is formed: the platy crystals are twinned on (001) with respect to the substrate, forming a rotation twin, but they reciprocally contact on one of the (hk0) [orthohexagonal indexing] planes, thereby forming a reflection twin (Nespolo and Kuwahara 2001).
Two-dimensional XRD study
The most common two-dimensional technique employs a precession camera, but any technique giving two-dimensional undistorted images of the reciprocal lattice is suitable as well. From these undistorted images, the geometry of the diffraction pattern can be analyzed by simple visual inspection. In the case of a precession camera study, the crystal must be mounted so as to have the (001) plane perpendicular to the goniometer rotation axis. In fact, the stacking of layers in micas is along c and the periodicity in reciprocal
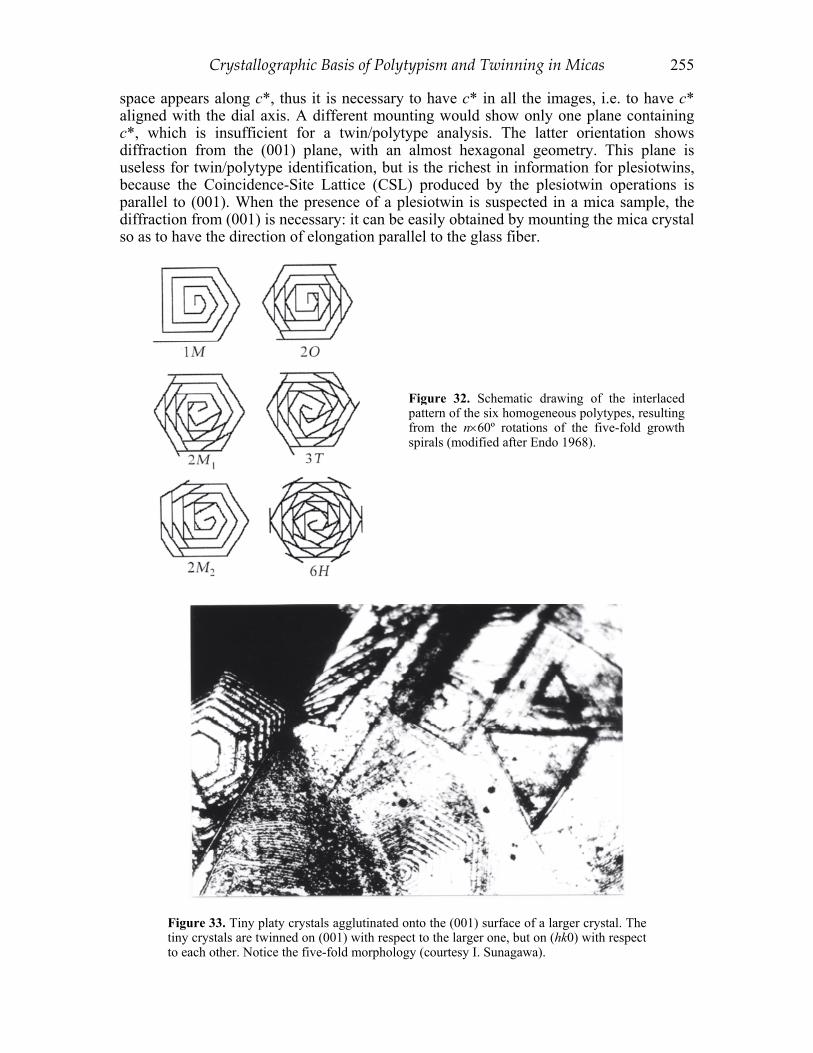
Crystallographic Basis of Polytypism and Twinning in Micas 255
space appears along c*, thus it is necessary to have c* in all the images, i.e. to have c* aligned with the dial axis. A different mounting would show only one plane containing c*, which is insufficient for a twin/polytype analysis. The latter orientation shows diffraction from the (001) plane, with an almost hexagonal geometry. This plane is useless for twin/polytype identification, but is the richest in information for plesiotwins, because the Coincidence-Site Lattice (CSL) produced by the plesiotwin operations is parallel to (001). When the presence of a plesiotwin is suspected in a mica sample, the diffraction from (001) is necessary: it can be easily obtained by mounting the mica crystal so as to have the direction of elongation parallel to the glass fiber.
Figure 33. Tiny platy crystals agglutinated onto the (001) surface of a larger crystal. The tiny crystals are twinned on (001) with respect to the larger one, but on (hk0) with respect to each other. Notice the five-fold morphology (courtesy I. Sunagawa).
Figure 32. Schematic drawing of the interlaced pattern of the six homogeneous polytypes, resulting from the n×60º rotations of the five-fold growth spirals (modified after Endo 1968).

256 Nespolo & Ďurovič
The radiation to be employed initially can be either a short wavelength (e.g., Mo) or a longer wavelength (e.g., Cu of Fe). Mo is preferable for making easier the orientation of the crystal, but its wavelength is too short for the study of long-period polytypes, or even for twins of polytypes with period longer than three layers, resulting in an insufficient resolution between two successive reflections. Cu or Fe radiation is suitable for longer period polytypes (≤ 10-12 layers). The separation of the reflections can be improved by increasing the crystal-to-film distance, with slightly longer exposure times. This avoids the weakening of the reflections occurring when employing a longer wavelength. The choice of the radiation to employ initially is thus the result of a compromise between the ease of orienting the crystal (Mo) and the need of proper resolution. With some practice the orientation of a mica crystal on the precession camera becomes routine even with Cu radiation, which can thus be selected as the best compromise. For longer period polytypes, Fe or Cr radiation becomes necessary to obtain sufficient resolution, once the crystal is oriented.
For investigating the possibility of apparent polytypism, one SD plane and three SX central planes must be recorded. From these planes, the geometry of the diffraction pattern is analyzed on the basis of the criteria given in Tables 12a-12c. If the crystal is twinned or allotwinned, the nine translationally independent rows forming a minimal rhombus, obtained from these four planes, allow the determination of the relative rotations between the individuals (see the example of ZT = 3
4 1M-2M1 allotwin below). If the crystal is not twinned, the stacking sequence in the homo-octahedral approximation can be obtained from the geometry of the diffraction pattern (MDO polytypes) or from the PID obtained along one or more X rows (non-MDO polytypes). This is the final stacking sequence if the polytype is composed of only M1 layers, otherwise it represents the homomorphic equivalent of the correct stacking sequence. In the meso-octahedral family, if the meso-octahedral character is pronounced (large difference between the average cations), the real stacking sequence can in principle be found by comparing the experimental intensities with the intensities computed for all the meso-octahedral polytypes homomorphic to the homo-octahedral polytype obtained by the PID analysis. When the meso-octahedral character is not pronounced, the distinction is much more difficult. Moreover, as discussed in “Derivation of PID from the diffraction pattern”, when the sequence of displacement vectors contains one or more sub-periods, weak reflections occur along the X rows, and care must be taken to observe them. In both the meso- and the hetero-octahedral family, the true stacking sequence can be obtained only from a complete structure refinement, because the occupancies of the octahedral sites, and the sizes of the corresponding octahedra, must be refined. Unfortunately, the quality of the sample is often not sufficient to allow a complete data collection, and only the stacking sequence of the homomorphic polytype (PID stacking sequence) can be obtained.
Diffractometer study
Once the stacking sequence in the homo-octahedral approximation is determined, if the quality of the crystal permits, the final stage consists of intensity measurements (usually by diffractometric measurement) and a structure refinement. The radiation to be employed is the same used in the preliminary (two-dimensional) study. The strongly anisotropic shape of mica crystals indicates applying an absorption correction through a ψ-scan procedure, rather than an analytical correction. Knowing the structure of the single layer and the homo-octahedral stacking sequence, the starting model is already very close to the final result, but the presence of one or more M2 layers must be determined. In other words, the meso- and hetero-octahedral stacking sequences, and not only the homomorphic sequence revealed by the PID, should be employed also as starting models, otherwise the presence of M2 layers may be overlooked. For instance, consider a hypothetical N-layer meso-octahedral polytype with biotitic composition, and suppose,
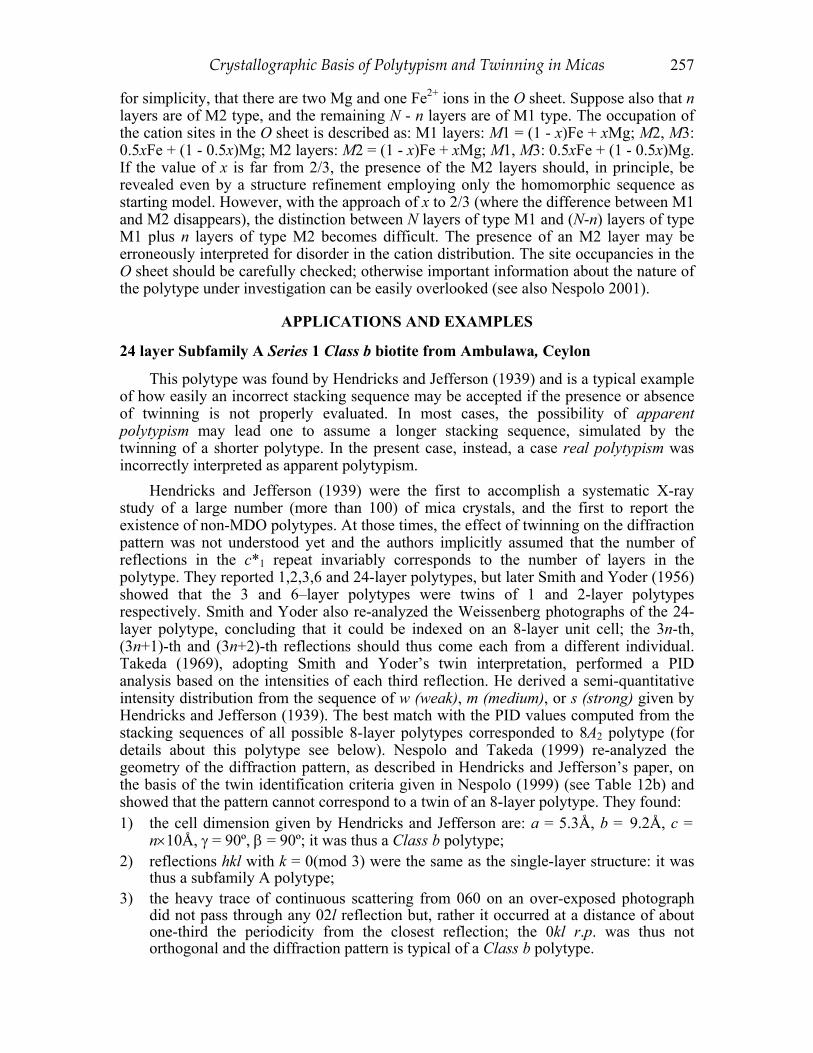
Crystallographic Basis of Polytypism and Twinning in Micas 257
for simplicity, that there are two Mg and one Fe2+ ions in the O sheet. Suppose also that n layers are of M2 type, and the remaining N - n layers are of M1 type. The occupation of the cation sites in the O sheet is described as: M1 layers: M1 = (1 - x)Fe + xMg; M2, M3: 0.5xFe + (1 - 0.5x)Mg; M2 layers: M2 = (1 - x)Fe + xMg; M1, M3: 0.5xFe + (1 - 0.5x)Mg. If the value of x is far from 2/3, the presence of the M2 layers should, in principle, be revealed even by a structure refinement employing only the homomorphic sequence as starting model. However, with the approach of x to 2/3 (where the difference between M1 and M2 disappears), the distinction between N layers of type M1 and (N-n) layers of type M1 plus n layers of type M2 becomes difficult. The presence of an M2 layer may be erroneously interpreted for disorder in the cation distribution. The site occupancies in the O sheet should be carefully checked; otherwise important information about the nature of the polytype under investigation can be easily overlooked (see also Nespolo 2001).
APPLICATIONS AND EXAMPLES
24 layer Subfamily A Series 1 Class b biotite from Ambulawa, Ceylon
This polytype was found by Hendricks and Jefferson (1939) and is a typical example of how easily an incorrect stacking sequence may be accepted if the presence or absence of twinning is not properly evaluated. In most cases, the possibility of apparent polytypism may lead one to assume a longer stacking sequence, simulated by the twinning of a shorter polytype. In the present case, instead, a case real polytypism was incorrectly interpreted as apparent polytypism.
Hendricks and Jefferson (1939) were the first to accomplish a systematic X-ray study of a large number (more than 100) of mica crystals, and the first to report the existence of non-MDO polytypes. At those times, the effect of twinning on the diffraction pattern was not understood yet and the authors implicitly assumed that the number of reflections in the c*1 repeat invariably corresponds to the number of layers in the polytype. They reported 1,2,3,6 and 24-layer polytypes, but later Smith and Yoder (1956) showed that the 3 and 6–layer polytypes were twins of 1 and 2-layer polytypes respectively. Smith and Yoder also re-analyzed the Weissenberg photographs of the 24-layer polytype, concluding that it could be indexed on an 8-layer unit cell; the 3n-th, (3n+1)-th and (3n+2)-th reflections should thus come each from a different individual. Takeda (1969), adopting Smith and Yoder’s twin interpretation, performed a PID analysis based on the intensities of each third reflection. He derived a semi-quantitative intensity distribution from the sequence of w (weak), m (medium), or s (strong) given by Hendricks and Jefferson (1939). The best match with the PID values computed from the stacking sequences of all possible 8-layer polytypes corresponded to 8A2 polytype (for details about this polytype see below). Nespolo and Takeda (1999) re-analyzed the geometry of the diffraction pattern, as described in Hendricks and Jefferson’s paper, on the basis of the twin identification criteria given in Nespolo (1999) (see Table 12b) and showed that the pattern cannot correspond to a twin of an 8-layer polytype. They found: 1) the cell dimension given by Hendricks and Jefferson are: a = 5.3Å, b = 9.2Å, c =
n×10Å, γ = 90º, β = 90º; it was thus a Class b polytype; 2) reflections hkl with k = 0(mod 3) were the same as the single-layer structure: it was
thus a subfamily A polytype; 3) the heavy trace of continuous scattering from 060 on an over-exposed photograph
did not pass through any 02l reflection but, rather it occurred at a distance of about one-third the periodicity from the closest reflection; the 0kl r.p. was thus not orthogonal and the diffraction pattern is typical of a Class b polytype.

258 Nespolo & Ďurovič
An 8-layer subfamily A polytype cannot belong to Class b; a twin of an orthogonal or Class a polytype cannot produce a diffraction pattern typical of Class b polytype. Therefore, the diffraction pattern reported by Hendricks and Jefferson was actually from a 24-layer polytype (Series 1), whose stacking sequence has not been resolved, and not a twin of the 8A2 polytype. On the basis of Takeda’s (1969) analysis of a subset of reflections, it can be inferred that Hendricks and Jefferson’s 24-layer polytype probably possesses a stacking sequence related to that of 8A2, belonging thus to the 2M1 structural series also.
This example shows the danger of blindly applying a powerful method such as the PID. The direct determination of the polytype stacking sequence is easily obtained through comparison of the PID from the diffraction pattern with the PID computed for all the theoretical candidates, i.e. the polytypes with the same number of layers and the same OD character (subfamily A, subfamily B, or mixed-rotation). The correct stacking sequence corresponds to the best match between the experimental and the theoretical PID. If the presence of twinning is overlooked the experimental PID corresponds to the weighted mean of the PID from each individual, where the weight is the volume of the individuals. In contrast, as in the case of the 24-layer polytype shown here, if twinning is incorrectly assumed, the experimental PID is only a portion of the “true” PID. For a short-period polytype, with a limited number of candidates, the match with the computed PID is probably insufficient, and this should alert the investigator. However, for a longer period polytype a reasonable match may occur by chance, because the difference between the two closest PID decreases with the increase of the number of layers. Because the PID match is evaluated on a relative basis, taking the best match as the correct one, the possibility of a wrong interpretation exists. The presence/absence of twinning must therefore be correctly analyzed before PID analysis is applied to the diffraction pattern. 8A2 (subfamily A Series 0 Class a) oxybiotite from Ruiz Peak, New Mexico
This polytype was identified by Nespolo and Takeda (1999) in the oxybiotite from Ruiz Peak (New Mexico). Figure 34 is the diffraction pattern corresponding to the h0l (SD) r.p., with the geometry typical of a subfamily A polytype. Figure 35 shows the diffraction pattern corresponding to the⎯hhl (SX) r.p., which is non-orthogonal and with eight reflections in the c*1 repeat along X rows. The diffraction pattern is that of the subfamily A Series 0 Class a polytype and thus excludes the possibility of twinning: the crystal is an 8-layer polytype. Out of 9212 possible 8-layer homo-octahedral polytypes, only 94 belong to subfamily A (Ross et al 1966). Comparison of theoretically computed and experimentally recorded PID values was performed only for the 94 subfamily A homo-octahedral polytypes.
In Table 19, the l indices in the three axial settings (C1, aS and aF) and the l̂ = l (mod 8) index are given, together with the corresponding observed structure factors corrected for the Lorentz and polarization effects, the Fourier transform of the single layer, the ratio of the latter two terms, and the scaled PID [Eqn. (B.4)]. The PID was not computed in the two periods in which the single-layer Fourier transform undergoes a sign change. The PID along the remaining five periods has been assigned weights (Table 20). The stacking sequences of all possible 8-layer homo-octahedral subfamily A polytypes were generated by the PTGR program (Takeda 1971). The PID of each polytype was computed by the PTST98 program (Nespolo et al. 1999d) and the closeness to the observed pattern was evaluated by means of an RPID index defined by analogy with the reliability index used structure refinements, namely:
( ) ( )
( )1
N N Nj jo cj
PID Nj o
S Shkl hklR
S hkl=
−=
∑ (26)

Crystallographic Basis of Polytypism and Twinning in Micas 259
Figure 34. Precession diffraction pattern corresponding to the h0l SD r.p. of 8A2 polytype (Cu Kα). The a* axes of the three settings, C1, aS and aF, are shown [used by permission of the editor of Mineralogical Journal, from Nespolo and Takeda (1999) Fig. 2, p. 108].
Figure 35. Precession diffraction corresponding to the⎯hhl SX r.p. of 8A2 polytype (CuKα). The [⎯110]* directions of the three settings C1, aS and aF are shown. In aF setting the origin of PID is by definition in correspondence of l = 0(mod N). PID has been obtained from the intensities measured along the five periods indicated in the figure [used by permission of the editor of Mineralogical Journal, from Nespolo and Takeda (1999) Fig. 3, p. 109].

260 Nespolo & Ďurovič
Table 19. Derivation of PID from measured intensities of 8A2 polytype. Observed structure factors (Fo) have been obtained from the intensities measured in five periods along the⎯11l reciprocal lattice row of aF setting (⎯11l of aS setting.). SLFT stands for Single Layer Fourier Transform (after Nespolo and Takeda 1999).
Period l(C1) l(aS) l(aF) l̂ Fo SLFT Fo/SLFT PID
1
85 28 31 7 .25 12.99 .02 .0282 27 30 6 .25 16.77 .01 .0279 26 29 5 83.33 20.65 4.04 4.4476 25 28 4 38.63 24.53 1.574 1.7373 24 27 3 47.01 28.28 1.66 1.8370 23 26 2 83.00 31.77 2.61 2.8767 22 25 1 168.75 34.86 4.84 5.3264 21 24 0 40.70 37.43 1.09 1.20
2
61 20 23 7 .22 39.34 .00 .0058 19 22 6 30.06 40.51 .74 .5755 18 21 5 183.05 40.85 4.48 3.4752 17 20 4 76.75 40.31 1.90 1.4749 16 19 3 91.39 38.88 2.35 1.8246 15 18 2 169.81 36.57 4.64 3.5943 14 17 1 246.62 33.46 7.37 5.7040 13 16 0 32.92 29.65 1.11 .86
3
13 4 7 7 24.77 12.46 1.99 1.4610 3 6 6 33.28 15.41 2.16 1.587 2 5 5 111.86 17.64 6.33 4.654 1 4 4 23.28 19.11 1.21 .891 0 3 3 41.45 19.78 2.10 1.54
-2 -1 2 2 60.84 19.64 3.10 2.27-5 -2 1 1 134.28 18.71 7.18 5.26-8 -3 0 0 30.39 16.98 1.79 1.31
4
-35 -12 -9 7 18.80 22.08 .85 .62-38 -13 -10 6 20.98 26.78 .78 .57-41 -14 -11 5 172.90 30.99 5.58 4.07-44 -15 -12 4 89.73 34.58 2.59 1.89-47 -16 -13 3 99.68 37.43 2.66 1.94-50 -17 -14 2 188.67 39.46 4.78 3.49-53 -18 -15 1 288.53 40.59 7.10 5.19-56 -19 -16 0 28.74 40.83 .70 .51
5
-59 -20 -17 7 .22 40.21 .00 .01-62 -21 -18 6 52.30 38.78 1.34 1.26-65 -22 -19 5 172.66 36.64 4.71 4.42-68 -23 -20 4 57.59 33.88 1.70 1.59-71 -24 -21 3 51.37 30.65 1.68 1.57-74 -25 -22 2 86.01 27.06 3.18 2.98-77 -26 -23 1 129.75 23.25 5.58 5.23-80 -27 -24 0 26.51 19.35 1.37 1.28
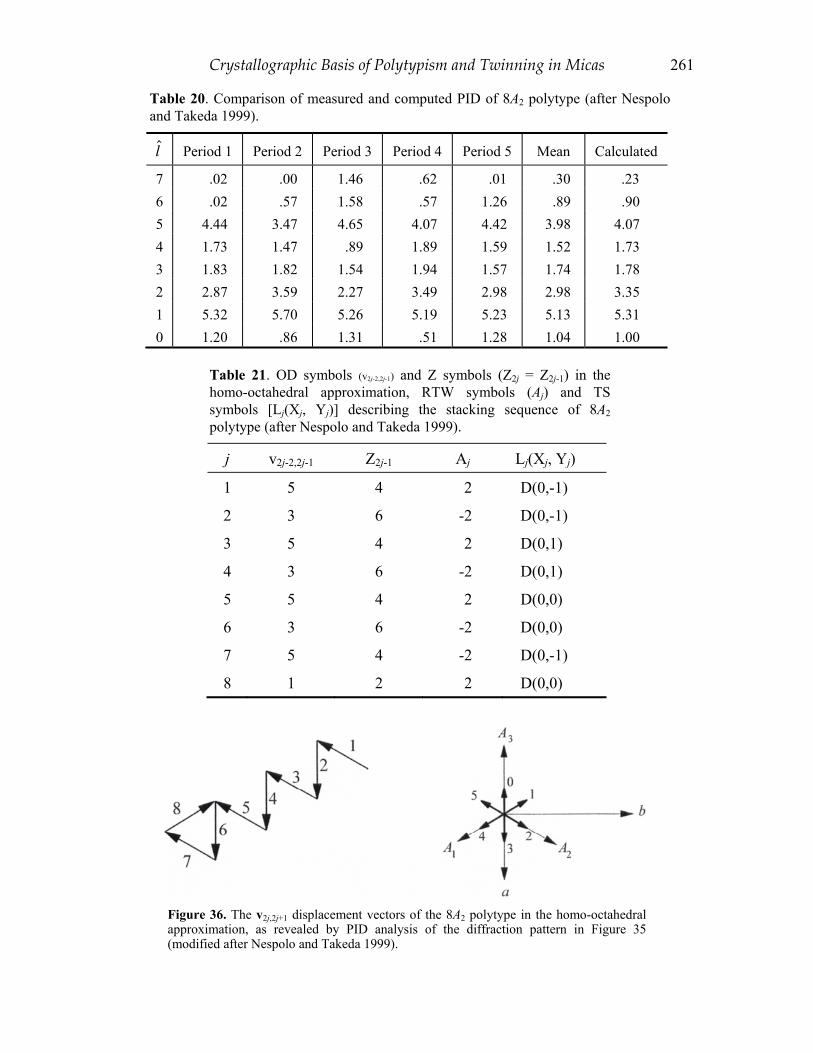
Crystallographic Basis of Polytypism and Twinning in Micas 261
Table 20. Comparison of measured and computed PID of 8A2 polytype (after Nespolo and Takeda 1999).
l̂ Period 1 Period 2 Period 3 Period 4 Period 5 Mean Calculated
7 .02 .00 1.46 .62 .01 .30 .23 6 .02 .57 1.58 .57 1.26 .89 .90 5 4.44 3.47 4.65 4.07 4.42 3.98 4.07 4 1.73 1.47 .89 1.89 1.59 1.52 1.73 3 1.83 1.82 1.54 1.94 1.57 1.74 1.78 2 2.87 3.59 2.27 3.49 2.98 2.98 3.35 1 5.32 5.70 5.26 5.19 5.23 5.13 5.31 0 1.20 .86 1.31 .51 1.28 1.04 1.00
Table 21. OD symbols (v2j-2,2j-1) and Z symbols (Z2j = Z2j-1) in the homo-octahedral approximation, RTW symbols (Aj) and TS symbols [Lj(Xj, Yj)] describing the stacking sequence of 8A2 polytype (after Nespolo and Takeda 1999).
j v2j-2,2j-1 Z2j-1 Aj Lj(Xj, Yj)
1 5 4 2 D(0,-1)
2 3 6 -2 D(0,-1)
3 5 4 2 D(0,1)
4 3 6 -2 D(0,1)
5 5 4 2 D(0,0)
6 3 6 -2 D(0,0)
7 5 4 -2 D(0,-1)
8 1 2 2 D(0,0)
Figure 36. The v2j,2j+1 displacement vectors of the 8A2 polytype in the homo-octahedral approximation, as revealed by PID analysis of the diffraction pattern in Figure 35 (modified after Nespolo and Takeda 1999).

262 Nespolo & Ďurovič
The best match corresponded to RPID = 0.04 (computed PID values for this sequence are in Table 20); the second best match to RPID = 0.33. This clearly shows that the homo-octahedral stacking sequence has been uniquely identified. By employing the cell dimensions of the refined 1M polytype from the same sample (Ohta et al. 1982), the approximate cell parameters of this polytype was calculated through the axial transformations given in Equation (3) and the results are: a = 5.3Å, b = 9.2Å, c = 79.6Å, α = 90º. β = 91.3º, γ = 90º. The symbols for the homo-octahedral stacking sequence are given in Table 21, and the corresponding vector sequence is in Figure 36. The space-group type is ⎯C1, derived by applying the transformation rules given in Table 6.
1M-2M1 oxybiotite allotwin ZT = 34 from Ruiz Peak, New Mexico
This allotwin was also identified in the Ruiz-Peak oxybiotite and represents an example of apparent polytypism.
Figures 37-40 present the diffraction patterns from three SX planes. The shortest separation between successive reflections along c* of X rows is c*1/6: the apparent period is six layers and thus the l index of all the reflections are expressed as (mod 6). Figure 40 shows the diffraction pattern from an SD plane of the same sample which, with one reflection for c*1 repeat, has the typical appearance of a subfamily A polytype. The presence of twinning is not evident from this plane.
In principle, the investigated sample may be either a six-layer polytype, or a twin or allotwin involving the 2M1 polytype. However, two of the SX planes (Fig. 37 and 38) are orthogonal (i.e. reflections are present at l = 0 of the orthogonal six-layer cell, along each row parallel to c*). This geometry of the reciprocal lattice is impossible for a 6-layer subfamily A polytype, which would belong to Class b and should therefore have all the SX planes non-orthogonal (Table 12b). It follows that the sample is a twin or allotwin of the 2M1 polytype.
Figure 41 shows the star polygon, comprised by the six possible orientations of the tessellation rhombus and the minimal rhombus, drawn by reporting the l (mod 6) indices of the reflections occurring in the four planes above, and applying the (3p, 3q) translations between translationally equivalent reciprocal lattice rows. None of the six orientations of the minimal rhombus matches any of the nine independent minimal rhombi which are possible for the 2M1 twins (Fig. 26). The sample is thus an allotwin. The pattern cannot involve a 3T crystal, otherwise three reflections corresponding to l = 0(mod 6), l = 2(mod 6) and l = 4(mod 6) would be present along all X rows. The sample is thus a 1M-2M1 allotwin. The shaded minimal rhombus matches the computed minimal rhombus of the 1M-2M1 allotwin with relative rotation of 60º between the two individuals and it corresponds to ZT = 34 in Nespolo et al (2000a).
The cell of the allotwin lattice has a period of 6c0 along c and contains six lattice planes of the 1M polytype and three lattice planes of the 2M1 polytype. Of these, only the plane with z = 0(mod 6) has all the nodes from both polytypes overlapped by the allotwin operation, whereas in all the other lattice planes the nodes from the two polytypes are separated. Consequently, the allotwin index of 1M is 6, and that of 2M1 is 3.
{3,6}[7{3,6}] biotite plesiotwin from Sambagawa, Japan
Sadanaga and Takéuchi (1961) performed a systematic study of micas of volcanic origin, and reported several examples of 1M twinning, and also one example of 2M1 twinning. Takéuchi et al (1972) foresaw that micas from a different environment, namely metamorphic, could reveal different kinds of “twinning” and investigated by electron diffraction a large number of small biotite crystals from the Sambagawa metamorphic belt in the Besshi area, Japan. They found several twins of the same type reported by

Crystallographic Basis of Polytypism and Twinning in Micas 263
Figure 37. Precession diffraction pattern from the first SX plane (SX1) of the allotwin ZT = 3
4. The l index of the reflections is expressed (mod 6) [used by permission of the editor of Acta Crystallographica B, from Nespolo et al. (2000b) Fig. 7, p. 644].
Figure 38. Precession diffraction pattern from the second SX plane (SX2) of the allotwin ZT = 3
4 (60º from SX1). l index as in Figure 37 [used by permission of the editor of Acta Crystallographica B, from Nespolo et al. (2000b) Fig. 8, p. 644].

264 Nespolo & Ďurovič
Figure 39. Precession diffraction pattern from the third SX plane (SX3) of the allotwin ZT = 34 (120º from SX1). l index as in Figure 37 [used by permission of the editor of Acta Crystallographica B, from Nespolo et al. (2000b) Fig. 9, p. 645].
Figure 40. Precession diffraction pattern from an SD plane of the allotwin ZT = 34 (30º
from SX3). l index as in Figure 37 [used by permission of the editor of Acta Crystallographica B, from Nespolo et al. (2000b) Fig. 10, p. 645].
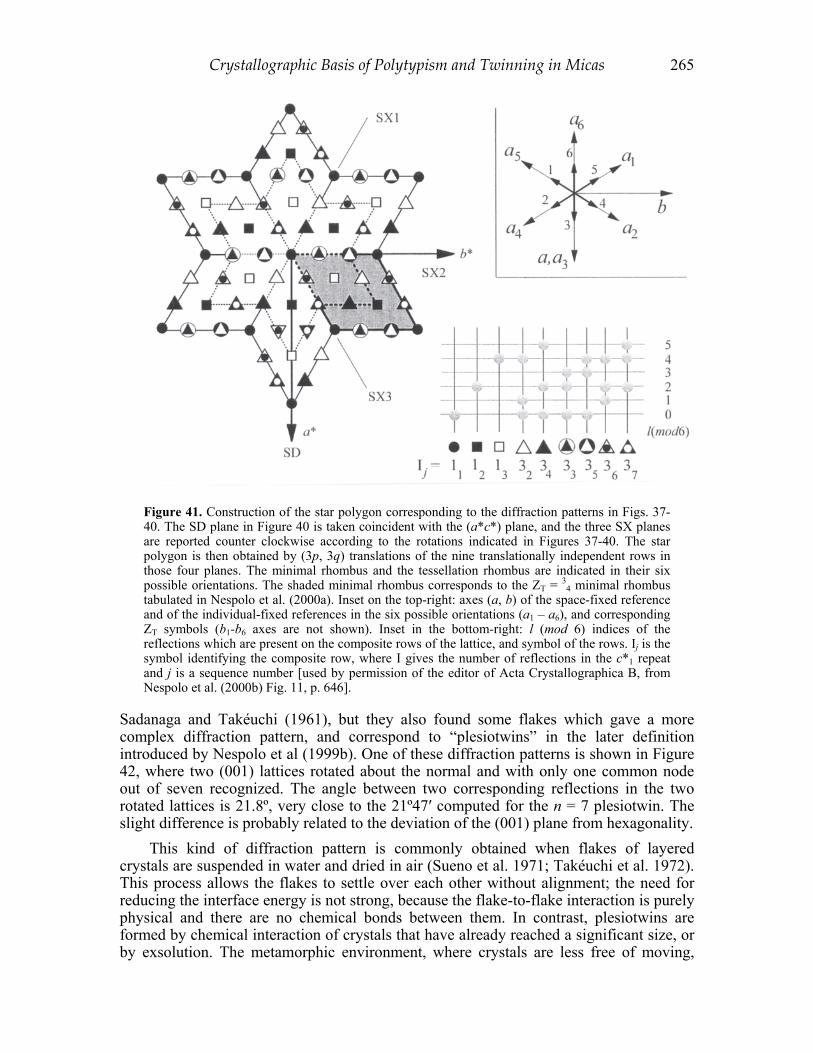
Crystallographic Basis of Polytypism and Twinning in Micas 265
Figure 41. Construction of the star polygon corresponding to the diffraction patterns in Figs. 37-40. The SD plane in Figure 40 is taken coincident with the (a*c*) plane, and the three SX planes are reported counter clockwise according to the rotations indicated in Figures 37-40. The star polygon is then obtained by (3p, 3q) translations of the nine translationally independent rows in those four planes. The minimal rhombus and the tessellation rhombus are indicated in their six possible orientations. The shaded minimal rhombus corresponds to the ZT = 3
4 minimal rhombus tabulated in Nespolo et al. (2000a). Inset on the top-right: axes (a, b) of the space-fixed reference and of the individual-fixed references in the six possible orientations (a1 – a6), and corresponding ZT symbols (b1-b6 axes are not shown). Inset in the bottom-right: l (mod 6) indices of the reflections which are present on the composite rows of the lattice, and symbol of the rows. Ij is the symbol identifying the composite row, where I gives the number of reflections in the c*1 repeat and j is a sequence number [used by permission of the editor of Acta Crystallographica B, from Nespolo et al. (2000b) Fig. 11, p. 646].
Sadanaga and Takéuchi (1961), but they also found some flakes which gave a more complex diffraction pattern, and correspond to “plesiotwins” in the later definition introduced by Nespolo et al (1999b). One of these diffraction patterns is shown in Figure 42, where two (001) lattices rotated about the normal and with only one common node out of seven recognized. The angle between two corresponding reflections in the two rotated lattices is 21.8º, very close to the 21º47′ computed for the n = 7 plesiotwin. The slight difference is probably related to the deviation of the (001) plane from hexagonality.
This kind of diffraction pattern is commonly obtained when flakes of layered crystals are suspended in water and dried in air (Sueno et al. 1971; Takéuchi et al. 1972). This process allows the flakes to settle over each other without alignment; the need for reducing the interface energy is not strong, because the flake-to-flake interaction is purely physical and there are no chemical bonds between them. In contrast, plesiotwins are formed by chemical interaction of crystals that have already reached a significant size, or by exsolution. The metamorphic environment, where crystals are less free of moving,

266 Nespolo & Ďurovič
favors the formation of plesiotwins. Plesiotwins, are less probable in a magmatic environment. In the presence of a fluid phase, crystals are more free to move and can overcome the kinetic barrier towards the more stable configuration of twins.
Figure 42. Composite diffraction pattern (right) produced by a single flake (left) of metamorphic biotite-1M from the Sambagawa belt (courtesy Y. Takéuchi). Several pseudo-hexagonal lattices are overlapped with different orientation; two of these are rotated by 21.8º, close to the 21º47′ angle corresponding to the {3,6}[7{3,6}] composite tessellation. The two crystals to which these lattice belong form a plesiotwin with Σ factor 7 and plesiotwin index 21 [used by permission of the editor of Zeitschrift für Kristallographie, from Takéuchi et al (1972) Fig. 6, p. 219].

Crystallographic Basis of Polytypism and Twinning in Micas 267
APPENDIX A. TWINNING: DEFINITION AND CLASSIFICATION
Twinning is the oriented association of two or more individuals10 of the same crystalline compound, in which pairs of individuals are related by a geometrical operation termed twin operation. The twin operation is a symmetry operation that belongs to a crystallographic point group; it cannot belong to the symmetry of the crystal, otherwise it would produce a parallel growth instead of a twin. The lattice common to the twinned individuals is called twin lattice: it can either coincide (exactly or approximately) with the lattice of the individuals, or be a sublattice (exact or approximated) of them. A Twin element is a symmetry or pseudo-symmetry element for the twin lattice with respect to which the twin operation is defined. Twin index (n) is the order of the subgroup of translation in direct space defining the twin lattice, and coincides with the ratio of the number of lattice nodes of the individual to the number of nodes restored, exactly or approximately, by the twin operation. Twin obliquity (ω) is the angle, in the crystal setting of the individual, 1) between a twin axis and the normal to the lattice plane which is quasi-normal to the twin axis (rotation twins), or 2) between the normal to a twin plane and the rational direction closest to it (rotation twins).. The point group of the twin has the common symmetry of the individuals, as modified by the twin operation and may be lower, the same or higher than the point group of the single crystal (Friedel 1904, 1926; Buerger 1954).
The French school (Bravais 1851; Mallard 1879; Friedel 1904, 1926) gave a classification of twinning based on the twin index and obliquity, introducing the four categories of merohedry (n = 1, ω = 0), reticular merohedry (n > 1, ω = 0), pseudo-merohedry (n = 1, ω > 0), reticular pseudo-merohedry (n > 1, ω > 0). Twinning by merohedry has been further subdivided on the basis of the point groups of the Bravais class of the lattice, of the Bravais class of the space group, of the individual and, for OD structures, of the family structure (Table A1). The kind of merohedry the French school considered is that in which the Bravais class of lattice and the Bravais class of the space group coincide, and it has now been renamed syngonic merohedry. The case in which the Bravais class of the lattice is accidentally higher than the Bravais class of the space group includes two kinds of twinning: one is again a syngonic merohedry (the twin operations belong to the point group of the Bravais class of the space group), and the other is termed metric merohedry (the twin operations belong to the point group of the Bravais class of the lattice but not to the point group of the Bravais class of the space group) (Nespolo and Ferraris 2000).
For each crystal family except the hexagonal, the “point group of the Bravais class of the space group” is tantamount to say “point group of the syngony”, because there is a 1:1 correspondence between crystal family, syngony and Bravais system, and for this reason the term “syngonic merohedry” was introduced. However, two syngonies (trigonal and hexagonal) and two lattices (hR and hP) correspond to the hexagonal crystal family. A trigonal crystal with lattice hR twinned within the same crystal family (h) may have two kinds of twinning: syngonic merohedry, with twin elements belonging to the hR lattice (only merohedral crystals) and reticular merohedry, with twin elements belonging to the hP sublattice of the hR lattice (twin index 3). Instead, a trigonal crystal with lattice hP twinned within the same crystal family (h) has only one kind of twinning and the twin elements belong to the hP lattice. This twinning corresponds to a syngonic merohedry.
10 The term “individual” is used to indicate one crystal of a twin, and the term “single crystal” to mean an untwinned crystal. Other authors (e.g., Hahn et al. 1999) use “component” instead of “individual”.

268 Nespolo & Ďurovič
Tab
le A
1. C
lass
ifica
tion
of tw
inni
ng. (
p)TL
= p
oint
gro
up o
f the
Tw
in L
attic
e; p
(BC
L) =
poi
nt g
roup
of t
he B
rava
is C
lass
of t
he L
attic
e of
th
e in
divi
dual
; p(B
CSG
) = p
oint
gro
up o
f the
Bra
vais
Cla
ss o
f the
Spa
e G
roup
of t
he in
divi
dual
;’ p(
La) =
Lau
e po
int g
roup
of t
he in
divi
dual
; p(
T) =
Tw
in p
oint
gro
up;
p(FS
) =
poin
t gr
oup
of t
he F
amily
Stru
ctur
e. T
he p
oint
gro
up o
f th
e tw
ins
has
the
com
mon
sym
met
ry o
f th
ein
divi
dual
s, as
mod
ified
by
the
twin
ope
ratio
n (s
ee A
ppen
dix
B).
Mod
ified
afte
r Nes
polo
et a
l. (1
999a
) and
Nes
polo
and
Fer
raris
(200
0).
p(TL
) = p
(BC
L)
p(TL
) = p
(BC
SG) =
p(T
) p(L
a)
p(TL
) =p(
BC
SG)
p(T)
> p
(La)
p(TL
) p
p(B
CSG
)p(
La
p(TL
) > p
(BC
L)
p(B
CSG
)
= 0
, n =
1
= 0
, n =
1
= 0
, n =
1
> 0
, n =
1
= 0
, n >
1
> 0
, n >
1
Syng
onic
Mer
ohed
ry c
lass
IIA
M
etric
Mer
ohed
ry c
lass
IIB
TPG
F
SPG
TPG
> F
SPG
TP
G
FSPG
TPG
> F
SPG
Sy
ngon
ic M
eroh
edry
Cla
ss I
Syng
onic
C
ompl
ete
Mer
ohed
ry
Syng
onic
Se
lect
ive
Mer
ohed
ry
Met
ricC
ompl
ete
Mer
ohed
ry
Met
ric S
elec
tive
Mer
ohed
ry
Pseu
do-
mer
ohed
ry
Ret
icul
arm
eroh
edry
Ret
icul
ar
pseu
do-
mer
ohed
ry

Crystallographic Basis of Polytypism and Twinning in Micas 269
Syngonic merohedry is subdivided, on the basis of the ratio between the order of the lattice point group and the order of the individual point group, into hemihedry (order 2), tetartohedry (order 4) and ogdohedry (order 8, possible only for the point group 3).
Where the Laue symmetry of the individual is the same as the twin symmetry, the corresponding twins belong to class I. The diffraction pattern does not differ from that of a single crystal, unless anomalous scattering is substantial. The inversion center can always be chosen as a twin operation and the set of intensities collected from a twin is indistinguishable from that collected from a single crystal. Instead, when the Laue symmetry of the crystal is lower than the twin symmetry, the twins belong to class II and are then subdivided into class IIA (syngonic merohedry) and class IIB (metric merohedry). The twin operations relate non-equivalent reflections, and the presence of twinning may hinder a correct derivation of the symmetry from the diffraction pattern. In particular, when the number of individuals coincides with the order of the twin operation and the volumes of the individuals are identical, the symmetry of the diffraction pattern is higher than the Laue symmetry of the individual. An incorrectly chosen space-group type may thus be assumed in the initial stage of the structure refinement (Catti and Ferraris 1976; Nespolo and Ferraris 2000).
In the case of OD structures, class II twins are further subdivided. The family structure may correspond to a Bravais system different from both the crystal lattice and the twin lattice. When the point group of the family structure is a subgroup of the point group of the twin lattice and twinning is by class II merohedry (both IIA and IIB), one or more of the twin laws do not belong to the point group of the family structure. This kind of twin law corresponds to merohedry for the polytype but to reticular merohedry for the family structure. These twin operations produce incomplete overlap of the family reciprocal sublattice; in particular, in terms of the polytype lattice, they overlap some of the nodes with zero weight of an individual to nodes with non-zero weight of another individual, and vice versa. Therefore, peculiar violations of the non-space-group absences along family rows appear in the diffraction pattern, where indexed in terms of the actual structure. This modifies the diffraction pattern, whose geometry no longer corresponds to that of the single crystal. This kind of merohedry, which restores only a part of the family sublattice of OD structures, is termed selective merohedry, whereas twinning by merohedry of OD structures in which the twin operation belongs to the point group of the family structure and restores the whole family reciprocal sublattice is termed complete merohedry (Nespolo et al. 1999a).
In the case of layer compounds, it is useful to decompose the obliquity into two components, within and outside the plane of the layer, which for micas is (001). Labeling t(hkl) the “trace” of a plane (hkl) on the (001) plane, the component of the obliquity within the (001) plane (ω||) corresponds to the angle between the normal nt(hkl) to t(hkl) and the direction [hk0] quasi normal to t(hkl), i.e. ω||([hk0]^ nt(hkl)) (Fig. 20). The component normal to the (001) plane (ω⊥) corresponds to the angle between the normal to the (001) plane and the lattice row quasi-normal to (001). ω⊥ measures the deviation of the c axis of the triple and sextuple cells of non-orthogonal polytypes from the normal to (001); for Class b polytypes it measures also the deviation of the rhombohedral [111] direction, i.e. ω⊥([111]R^[001]*) (Fig. B1). ω|| measures the deviation from hexagonality of the (001) plane and is thus related to ε. In both the Pauling and the Trigonal models, non-orthogonal polytypes are metrically monoclinic, because γ = 90º, ω||([100]^nt(100)) = 0 and ω||([010]^nt(010)) = 0, but ω|| is non-zero for the other four directions that would be equivalent in a hexagonal lattice. Imposing ω|| = 0 for each of these four directions, the two-dimensional lattice in the (001) plane becomes hp, but the three-dimensional lattice

270 Nespolo & Ďurovič
is only pseudo-hP, because the c axis of the triple cell is not exactly perpendicular to (001). Imposing instead ω⊥ = 0, an oC lattice is obtained. Finally, imposing both ω|| = 0 and ω⊥ = 0, the lattice becomes hP, and for Class b polytypes the lattice is centered.
APPENDIX B. COMPUTATION OF THE PID FROM A STACKING SEQUENCE CANDIDATE.
The calculation of the PID function requires the following steps. Step 1. Conversion from RTW symbols into “provisional” OD or Z symbols in the
homo-octahedral approximation, by simply looking for Σv = “*”, “0” or “–” [i.e. cn = (0, 0), ⎯(1/3, 0) or (0,⎯1/3). This is straightforwardly obtained by means of a simple addition cycle:
2 ,2 1 2 2,2 1
2 1 2 1 2 2 1
v v A
Z Z A ;Z Zj j j j j
j j j j j
+ − −
+ − −
= −
= + = (B.1)
where j = 1~N. The initial value is fixed as v0,1 = 3 or Z1 = 3; if the resulting cn projection does not take one of the three expected values, v0,1 or Z1 is incremented and Equation (B.1) is recalculated.
Step 2. Derivation of the correct homo-octahedral OD or Z symbol, by analyzing the symmetry properties. For orthogonal and Class b polytypes the symbols obtained from Equation (B.1) may correspond to an orientation of the symmetry elements not compatible with the space-group type. In such a case, the sequence of characters must be changed, by making v0,1 or Z1 taking one of the other values with the same parity. This is equivalent to rotating the structural model around c* by 2n×60º. The correct sequence is found when the characters in the OD or Z symbols are related by symmetry operators located along the lattice directions compatible with the space-group type requirements (Table 5a,b).
Step 3. Expression of the stacking operators rj, which give the displacement between the (j-1)-th and the j-th TS layers, as a function of OD or Z symbols and calculation of TS symbols. The relation of the stacking operators rj with OD or Z symbols is straightforward for orthogonal polytypes, whereas for non-orthogonal polytypes the
Figure A1. Perspective view of the lattice of Class bmica polytypes. The monoclinic conventional cell (doubly primitive, thick dotted lines), the pseudo-rhombohedral cell (primitive, solid thin lines) and the pseudo-orthohexagonal cell C1 (sextuply primitive, thick solid lines) are shown. Thick dotted-dashed line: [111] row of the pseudo-rhombohedral cell. Thick dotted line: direction normal to (001). Thin dotted lines: directions normal to (001) passing through the C-centering nodes on two successive lattice planes of the monoclinic conventional cell. ω⊥ is the component of the obliquity normal to the (01) plane. Black, gray and white circles represent lattice nodes at z = 0, 1/3 and 2/3 respectively (z is referred to c axis of the C1 cell). The stagger of the layer at z = 1/3 is -(b+δ)/3. For the ideal case δ = 0, ω⊥ = 0 (modified after Nespolo and Ferraris 2000).

Crystallographic Basis of Polytypism and Twinning in Micas 271
Subclass must be taken into account. OD and Z symbols for non-orthogonal polytypes always correspond to ⎯(1/3, 0) (Class a) or (0,⎯1/3) (Class b). The PID is most conveniently expressed in the (3
na, 3nb)F axial setting, which corresponds to cn = ⎯(1/3, 0) or (0,⎯1/3) for Subclass 1 and cn = (1/3, 0) or (0, 1/3) for Subclass 2. It follows that for orthogonal polytypes and Subclass 1 polytypes the stacking operators simply coincide with OD or Z symbols (rj = v2j-2,2j-1 or rj = Z2j-1), wherease for Subclass 2 polytypes they are related by a 180º rotation around c* (rj = v2j-2,2j-1 + 3 or rj = Z2j-1 + 3).
Step 4. Computation of PID (SN) as a function of the (a, b) components of TS symbols. The components of the j-th TS layer referred to the (a, b) axes are indicated as (Xj, Yj), to distinguish from the components in (A1, A2) axes, which were labeled (ΔXj, ΔYj) (Eqn. (22) and (24)). (Xj, Yj) are equal to the sum of the (xrj, yrj) components of the stacking operators from the first to j-th stacking operators. However, because the c axis of the (3na,3nb)F axial setting is displaced -1/3(n+1) (where n is the Series) along a or b (depending upon the Class), the additional displacement (–j/3(n+1), 0) (Class a) or (0, –j/3(n+1)) (Class b) must be added to the (Xj, Yj) component of the j-th TS symbol to express the layer stacking of non-orthogonal polytypes with respect to (3na,3nb)F axial setting. In this way, TS symbols for Series 0 subfamily A polytypes always have Xj = 0 (c axis passing through the origin of each layer).
( ) ( )( ) ( )
( ) ( )
r r1
r r 11
r r 11
: X ,Y ,
: X ,Y , ,03
: X ,Y , 0,3
i i
i i
i i
jj j i
jj j ni
jj j ni
Orthogonal polytypes x y
jClass a polytypes x y
jClass b polytypes x y
=
+=
+=
⎧⎪ =⎪⎪ −⎪ ⎛ ⎞= +⎨ ⎜ ⎟
⎝ ⎠⎪⎪ −⎛ ⎞= +⎪ ⎜ ⎟⎪ ⎝ ⎠⎩
∑
∑
∑
(B.2)
Finally, in Class b the axes exchange a ↔ b expresses PID in the 3nbF axial setting. The complete TS symbols Lj(Xj, Yj) are obtained from Table 5 and Equation (B.2), and the PID function SN is:
( ) ( ) ( )1 1
1ˆ ˆ ˆexp 2 X Y modN NN Nj j jj j
jS hkl S hkl i h k l l l NN
π= =
−⎛ ⎞ ⎡ ⎤= = + + =⎜ ⎟ ⎣ ⎦⎝ ⎠∑ ∑ (B.3)
with the normalizing condition:
( ) 22
1ˆN N
jjS hkl N
=⎡ ⎤ =⎣ ⎦∑ . (B.4)
Symmetry of the PID
Nespolo et al (1999d) have analyzed the symmetry of the PID in relation to the kind of polytype present. The results are briefly summarized here: for details, refer to the original paper.
For Series 0 polytypes there is a well-determined relation between the PID sequences along rows related by 2n×60º:
( ) ( )lNkhSlkhS NN ˆ,,ˆ,2,2 −= (B.5)
which, for the reciprocal lattice rows commonly used in the PID analysis, become:
( ) ( ) ( ) ( ) ( ) ( )lNSlSlNSlSlNSlS NNNNNN ˆ,11ˆ22;ˆ,11ˆ22;ˆ,02ˆ04 −=−=−= (B.6)

272 Nespolo & Ďurovič
For all OD polytypes (both subfamilies A and B) of Series 0, the PID has also a translational symmetry reminiscent of that relation between pairs of translationally equivalent rows defining a minimal rhombus:
( ) ( )lhkSlNkNhS NN ˆˆ,3,3 =++ . (B.7)
For subfamily A of Series 0 PID values have a trigonal symmetry:
( ) ⎟
⎠⎞
⎜⎝⎛ −=⎟
⎠⎞
⎜⎝⎛=
±±
lNkkSlkkSlkS NNN ˆ,ˆˆ,2,0 . (B.8)
which, for the reciprocal lattice rows commonly used in PID analysis, is expressed as:
( ) ( ) ( ) ( ) ( ) ( )lNSlNSlNSlSlSlS NNNNNN ˆ,11ˆ,11ˆ,20ˆ11ˆ11ˆ02 −=−=−=== (B.9)
For Series > 0, subfamily A polytypes either are orthogonal or belong to Class b; in the latter case the symmetry of the PID must take into account a shift of the origin. Class b polytypes have a pseudo-rhombohedral primitive lattice, which thus allows three equivalent orientations, related by 2n×60º rotations about c*. For monoclinic polytypes, only one of the three orientations leading to cn = (0,⎯1/3) corresponds to a correct disposition of the symmetry elements (a-unique setting for a < b). Instead, for triclinic polytypes these three orientations are truly equivalent. Z, OD and TS symbols are different for the three orientations, but they describe three equivalent orientations of the structural model. PID values expressed for a given reciprocal lattice row in a certain orientation of the structural model correspond to a different row in another orientation. For Series > 0 the c axis of the (3
na, 3nb)F setting is displaced by 1/3n for each layer and the length of the axis displacement is a submultiple of the layer stagger: therefore, the origin of the PID is not the same in the three orientations of the structural model. An example is given for the 3A1 polytype in Table 14 of Nespolo et al (1999d). The existence of a similar ambiguity in chlorite was reported by Brindley et al (1950).
ACKNOWLEDGMENTS We wish to acknowledge Prof. Giovanni Ferraris (Torino University), Prof. Hiroshi
Takeda (Chiba Institute of Technology), Prof. Yoshio Takéuchi (Nihon University, Tokyo), Prof. Takeo Matsumoto (Kanazawa University), Prof. Ichiro Sunagawa (Yamanashi Institute of Gemology and Jewelry Arts), Prof. Boris B. Zvyagin (IGEM – Russian Academy of Sciences, Moscow) and Prof. Theo Hahn (RWTH, Aachen) for several profitable discussions; Prof. Maria Franca Brigatti (Modena University) and Prof. S. Guggenheim (University of Illinois at Chicago) for letting us obtain the tables of their chapter while this manuscript was in preparation. The manuscript was reviewed by Prof. Stefano Merlino (University of Pisa) and Prof. Stephen. Guggenheim (University of Illinois at Chicago), to whom we express our gratitude.
REFERENCES Amelinckx S, Dekeyser W (1953) Le Polytypisme des Minéraux Micacés et Argileux. Premiére partie:
observations et leaurs interprétations. C R XIX Congr Geol Int’l, Comité International pour l'Étude des Argiles, Alger, fascicule XVIII, 1-22
Amisano-Canesi A, Chiari G, Ferraris G, Ivaldi G, Soboleva SV (1994) Muscovite- and phengite-3T: crystal structure and conditions of formation. Eur J Mineral 6:489-496
Arnold H (1996) Transformations in crystallography. Sect. 5 in International Tables for Crystallography Vol. A, 5th edition. Th Hahn (ed) Dordrecht / Boston / London: Kluwer Academic Publishers (in press)
Backhaus K-O, Ďurovič S (1984) Polytypism of micas. I. MDO polytypes and their derivation. Clays Clay Minerals 32:453-463
Bailey, SW (1975) Cation Ordering and Pseudosymmetry in Layer Silicates. Am Mineral 60:175-187

Crystallographic Basis of Polytypism and Twinning in Micas 273
Bailey SW (1980a) Classification and Structures of the Micas. Rev Mineral 13:1-12 Bailey SW (1980b) Crystal chemistry of true Micas. Rev Mineral 13:13-60 Bailey SW (1984) Review of cation ordering in micas. Clays Clay Miner 32:81-92 Bailey SW, Frank-Kamenetskii A, Goldsztaub S, Kato A, Pabst A, Schulz H, Taylor HFW, Fleischer M,
Wilson AJC (1977) Report of the International Mineralogical Association (IMA) - International Union of Crystallography (IUCr) Joint Committee on Nomenclature. Acta Crystallogr A33:681-684
Baronnet A (1978) Some aspects of polytypism in crystals. In Progr Crystal Growth Charact Vol. 1, Pergamon Press, p 151-111
Baronnet A, Kang ZC (1989) About the origin of mica polytypes. Phase Trans 16/17:477-493 Bassett G (1958) A new technique for decoration of cleavage and slip steps on ionic crystal surface. Phil Mag
3:1042-1043 Baumhauer H. (1900) Über die Kristallform des Muscovit. Z Kristallogr 32:164-176 Baumhauer H (1912) Uber die Kristalle des Carborundums. Z Kristallogr 50:33-39 Baumhauer H. (1915) Uber die verschiedenen Modifikationen des Carborundums und die Erscheinung der
Polytypie. Z Kristallogr 55:249-259 Brandt H (1927) Über eine Verallgemeinerung des Gruppenbegriffes. Mathematische Annalen 96:360-366 Bravais M (1851) Etudes cristallographiques. Troisieme partie. Des macles et des hemitropies. J Ecole
Polytechn XX (XXXIV) 248-276 Brigatti MF, Guggenheim S (2001) Mica crystal chemistry and influence of intensive variables on atomistic
models (this book) Brigatti MF, Poppi L (1993) Crystal chemistry of Ba-rich trioctahedral micas-1M. Eur J Mineral 5:857-871 Brigatti MF, Lalonde AE, Medici L (1997) Crystal chemistry of IVFe3+-rich phlogopites: A combined single-
crystal X-ray and Mössbauer study. Proc. 11th Int. Clay Conf. Ottawa, Canada, 317-327 Brindley GW, Oughton BM, Robinson K (1950) Polymorphism of the chlorites. I. Ordered structures. Acta
Crystallogr 3:408-416 Brooke HJ, Miller WH (1852) An elementary introduction to mineralogy, by the late William Phillips.
London: Longman, Brown, Green, and Longmans, XI+700 p Buerger MJ (1945) The genesis of twin crystals. Am Mineral 30:469-482 Buerger MJ (1954) The diffraction symmetry of twins. Anaias de Acad Bras de Ciencias 26:111-12 Catti M, Ferraris G (1976) Twinning by merohedry and X-ray crystal structure determination. Acta
Crystallogr A32:163-165 Christiansen CC, Makovicky E, Johnsen O (1999) Homology and typism in heterophyllosilicates: An
alternative approach. N Jb Miner Abh, 175:153-189 Coxeter HSM (1973) Regular polytopes, 3rd edition. Dover Publication Inc. New York Coxeter HSM (1989) Introduction to Geometry, 2nd edition. John Wiley and Sons New York Curien H, Donnay JDH (1959) The Symmetry of the Complete Twin. Am Mineral 44:1067-1070 Curien H, Le Corre Y (1958) Notations des macles à l'aide du symbolisme des groupes de couleurs de
Choubnikov. Bull Soc franç Minér Crist 81:126-132 Dekeyser W, Amelinckx S (1953) Le Polytypisme des Minéraux Micacés et Argileux. Deuxiéme partie:
discussion et extension. Comptes Redus de la XIX session Congrès Geologique International, Comité International pour l'Étude des Argiles, Alger, fascicule XVIII
Des Cloizeaux A (1862) Manuel de Mineralogie, vol. 1. Paris Donnay G, Morimoto N, Takeda H, Donnay JDH (1964) Trioctahedral One-Layer Micas. I. Crystal Structure
of a Synthetic Iron Mica Acta Crystallogr 17:1369-1373 Dornberger-Schiff K (1959) On the nomenclature of the 80 plane groups in three dimensions. Acta
Crystallogr 12:173 Dornberger-Schiff K (1964) Grundzüge einer Theorie von OD-Strukturen aus Schichten. Abh dtsch Akad
Wiss Berlin, Kl f Chem 3:107 p Dornberger-Schiff K (1966) Lehrgang über OD-strukturen. Berlin: Akademie-Verlag 135p Dornberger-Schiff K (1979) OD Structures, - a Game and a Bit more. Kristall und Technik 14:1027-1045 Dornberger-Schiff K, Backhaus K-O, Ďurovič S (1982) Polytypism of micas: OD-Interpretation, stacking
symbols, symmetry relations. Clays Clay Miner 30:364-374 Dornberger-Schiff K, Farkas-Jahnke M (1970) A direct method for the determination of polytype structures. I.
Theoretical Basis. Acta Crystallogr A26:24-34 Dornberger-Schiff K, Grell H (1982) Geometrical properties of MDO polytypes and procedures for their
derivation. II. OD families containing OD layers of M > 1 kinds and their MDO polytypes. Acta Crystallogr A38:491-498
Ďurovič S (1974) Notion of “packets” in the theory of OD structure of M>1 kinds of layer. Examples: Kaolinites and MoS2. Acta Crystallogr B30:76-78
Ďurovič S (1979) Desymmetrization of OD structures. Kristall und Technik 14:1047-1053

274 Nespolo & Ďurovič
Ďurovič S (1981) OD-Charakter, Polytypie und Identifickation von Schichtsilikaten. Fortschr Mineral 59:191-226
Ďurovič S (1982) Ordered and disordered polytypes of sheet silicates and their diffraction apttern assuming ideal ditrigonalization of tetrahedral sheets. 9th Conf on Clay Mineralogy and Petrology, Zvolen, 127-134
Ďurovič S (1994) Significance of superposition structures in the polytypism of phyllosilicates. In Aperiodic ’94 Proceedings of the International Conference on Aperiodic Crystals. G Chapuis, W Paciorek (ed) World Scientific, Singapore / New Jersey / London / Hong Kong, p 595-599
Ďurovič S (1997) Fundamentals of OD theory. In Modular aspects of minerals / EMU Notes in Mineralogy, vol. 1. S Merlino (ed) Eötvös University press, Budapest, p 1-28
Ďurovič S (1999) Layer stacking in general polytypic structures. Sect. 9.2.2 in International Tables for Crystallography, Vol. C (Ed. ACJ Wilson, E Prince) Dordrecht / Boston / London: Kluwer Academic Publishers, 752-765
Ďurovič S, Dornberger-Schiff K (1979) New fully descriptive polytype symbols for basic polytypes of clay minerals. Eight Conference on Clay Mineralogy and Petrology, Teplice, 19-25
Ďurovič S, Weiss Z (1986) OD structures and polytypes. Bull Minéral 109:15-29 Ďurovič S, Weiss Z, Backhaus K-O (1984) Polytypism of micas. II. Classification and abundance of MDO
polytypes. Clays Clay Miner 32:454-474 Endo Y (1968) Growth Spirals and Polytypism of Fluor-phlogopite. J Mineral Soc Jpn 8, Spec. issue 2:39-41
(in Japanese) Engel P, Matsumoto T, Steinamann G, Wondratschek H (1984) The non-characteristic orbits of the space
groups. Z Kristallogr Supplement Issue No. 1 Farkas-Jahnke M (1966) Direct method for the determination of polytype structures. Acta Crystallogr
21:A173 Farkas-Jahnke M, Dornberger-Schiff K (1970) A Direct Method for the Determination of Polytype Structures.
II. Determination of a 66R Structure. Acta Crystallogr A26:35-41 Ferraris G Gula A, Ivaldi G, Nespolo M Sokolova E, Uvarova Yu, Khomyakov AP (2001) First structure
determination of an MDO-2O mica polytype associated with a 1M polytype. Eur J Miner 13: 1013-1023 Fichtner K (1965) Zur Existenz von Gruppoiden verschiedener Ordnungsgrade bei OD-Strukturen aus
gleichartigen Schichten. Wiss Z TU Dresden 14:1-13 Fichtner K (1977) Zur Symmetriebeschreibung von OD-Kristallstrukturen durch Brandtsche und
Ehresmannsche Gruppoide. Beitr z algebra u Geometrie 6:71-99 Fichtner K (1980) On groupoid in crystallography. MATCH, commun math comput chem 9:21-40 Filut MA, Rule AC, Bailey SW (1985) Crystal structure refinement of anandite-2Or, a barium- and sulfur-
bearing trioctahedral mica. Am Mineral 70:1298-1308 Frank FC (1951) The growth of carborundum; dislocations and polytypism. Phil Mag 42:1014-1021 Franzini M (1966) Nuovi dati sulla struttura delle miche triottaedriche. Atti Soc Tosc Sci Nat, Mem Ser A
73:620-631 Franzini M (1969) The A and B mica layers and the crystal structure of sheet silicates. Contrib Mineral Petrol
21:203-224 Franzini M, Schiaffino L (1963a) Polimorfismo e leggi di geminazione delle biotiti. Atti Soc Tosc Sci Nat,
Mem Ser A 70:60-98 Franzini M, Schiaffino L (1963b) On the crystal structure of biotite. Z Kristallogr 119:297-309 Friedel G (1904) Étude sur les groupements cristallins. Extrait du Bullettin de la Société de l'Industrie
minérale, Quatrième série, Tomes III e IV. Saint-Étienne, Societè de l’Imprimerie Thèolier J. Thomas et C., 485 p
Friedel G. (1926) Leçons de Cristallographie, Berger-Levrault, Nancy, Paris, Strasbourg, 602 p Gaubert P (1896) Sur la production artificielle de la macle des spinelles dans les cristaux d’azotate de plomb.
Bull Soc franç Minér 19:431-434 Giuseppetti G, Tadini C (1972) The Crystal Structure of 2O brittle mica: Anandite. Tschermaks Mineral
Petrol Mitt 18:169-184 Goldschmidt V (1918) Atlas der Krystallformen, band IV. Heidelberg: Carl Winters
Universitätsbuchhandlung Grell H (1984) How to choose OD layers. Acta Crystallogr A40:95-99 Griffen DT (1992) Silicate Crystal Chemistry. Oxford University Press, Oxford Guggenheim S, Bailey SW (1975) Refinement of the margarite structure in subgroup symmetry. Am Mineral
60:1023-1029 Guggenheim S, Bailey SW (1978) The refinement of the margarite structure in subgroup symmetry:
corrections, further refinement and comments. Am Mineral 63:186-187 Guinier A, Bokij GB, Boll-Dornberger K, Cowley JM, Ďurovič S, Jagodzinski H, Khrisna P, DeWolff PM,
Zvyagin BB, Cox DE, Goodman P, Hahn Th, Kuchitsu K, Abrahams SC (1984) Nomenclature of

Crystallographic Basis of Polytypism and Twinning in Micas 275
Polytype Structures. Report of the International Union of crystallography Ad-Hoc Committee on the Nomenclature of Disordered, Modulated and Polytype Structures Acta Crystallogr A40:399-404
Güven N (1971) Structural Factors Controlling Stacking Sequences in Dioctahedral Micas. Clays Clay Miner 19:159-165
Hahn Th, Vos A (2002) Reflection conditions. Sect. 2.13 in International Tables for Crystallography, Vol. A 5th edition. Th Hahn (ed) Dordrecht / Boston: London: Kluwer Academic Publishers (in press)
Hahn T, Janovec V, Klapper H (1999) Bicrystals, twins and domain structures – A Comparison. Ferroelectrics 222:11-21
Hendricks SB, Jefferson ME (1939) Polymorphism of the micas with optical measurements. Am Mineral 24:729-771
Iijima S, Buseck PR (1978) Experimental study of disordered mica structure by high-resolution electron microscopy. Acta Crystallogr A34:709-719
International Tables for Crystallography Vol. A. (2002) 5th edition. Th Hahn (ed) Dordrecht / Boston / London: KLuwer Academic Publishers (in Press)
Ito T (1935) On the symmetry of rhombic pyroxenes. Z Kristallogr 90:151-162 Ito T (1938) Theory of twinned space groups. J Japan Assoc Mineral Petr Econ Geol 20:201-210 (in
Japanese) Ito T (1950) X-ray studies on polymorphism. Maruzen Co., Tokyo, 231 pp Ito T, Sadanaga R (1976) On the crystallographic space groupoids. Proc Jpn Acad 52:119-121 Iwasaki H (1972) On the diffraction enhancement of symmetry. Acta Crystallogr A28:253-261 Jackson WW, West J (1931) The crystal structure of muscovite KAl2(AlSi3)O10(OH)2. Z Kristallogr 76:211-
227 Joswig W, Takéuchi Y, Fuess H (1983) Neutron-diffraction study on the orientation of hydroxyl groups in
margarite. Z. Kristallogr 165:295-303 Kassner D, Baur WH, Joswig W, Eichhorn K, Wendschuh-Josties M, Kupčik V (1993) A test of the
importance of weak reflections in resolving a space-group ambiguity involving the presence or absence of an inversion centre. Acta Crystallogr B49:646-654
Kogure T, Nespolo M (1999a) First occurrence of a disordered stacking sequence including (±60º 180º) in Mg-rich annite. Clays Clay Miner 48:784-792
Kogure T, Nespolo M (1999b) A TEM study of long-period mica polytypes: determination of the stacking sequence of oxybiotite by means of atomic-resolution images and Periodic Intensity Distribution (PID) Acta Crystallogr B55:507-516
Kokscharow NV (1875) Materialen zur Mineralogie Russlands. Vol. 7. St. Petersburg Konishi H, Akai J (1990) HRTEM observation of new complex polytype of biotite from dacites in
Higashiyama hills, Niigata, Central Japan. Clay Science 8:25-30 Knurr RA, Bailey SW (1986) Refinement of Mn-substituted muscovite and phlogopite. Am Mineral 34:7-16 Kuwahara Y, Uehara S, Aoki Y (1998) Surface microtopography of lath-shaped hydrothermal illite by
tapping-mode™ and contact-mode AFM. Clays Clay Miner 46:574-582 Lipson H, Taylor CA (1958) Fourier Transforms and X-Ray Diffraction, Bell, London Mackovicky E (1997) Modularity – different types and approaches. In Modular aspects of minerals / EMU
Notes in Mineralogy, vol. 1. S Merlino (ed) Eötvös University press, Budapest, p 315-343 Mallard E (1879) Traité de Cristallographie geometrique et physique, Vol. I. Paris: Dunod. 372pp Marignac C (1847) Notices minéralogiques. Suppl Bibl Universe Genève, arch Sci Phys Nat 6:293-304 Matsumoto T, Kihara K, Iwasaki H (1974) Conditions for the diffraction enhancement of symmetry of types 1
and 2. Acta Crystallogr A30:107-108 Matsumoto T, Wondratschek H (1979) Possible superlattices of extraordinary orbits in 3-dimensional space. Z
Kristallogr 150:181-198 Mauguin MCh (1927) Êtude du mica muscovite au moyen des rayons X. CR Acad Sci Paris 185:288-291 Mauguin MCh (1928) Etude de Micas au moyen du rayons X. Bull Soc franç Minér Crist 51:285-332 McLarnan TJ (1981) The number of polytypes in sheet silicates. Z Kristallogr 155:247-268 Merlino S (1990) OD structures in mineralogy. Per Mineral 59:69-92 Mogami K, Nomura K, Miyamoto M, Takeda H, Sadanaga R (1978) On the number of distinct polytypes of
mica and SiC with a prime layer-number. Can Mineral 16:427-435 Mügge O (1898) Über Translationen und verwandte Erscheinungen in Krystallen. N Jb Miner Geol Paläontol
1:71-158 Nespolo M (1999) Analysis of family reflections of OD-mica polytypes, and its application to twin
identification. Mineral J 21:53-85 Nespolo M (2001) Perturbative theory of mica polytypism. Role of the M2 layer in the formation of
inhomogeneous polytypes. Clays Clay Miner 49:1-23

276 Nespolo & Ďurovič
Nespolo M, Ferraris G (2000) Twinning by syngonic and metric merohedry. Analysis, classification and effects on the diffraction pattern. Z Kristallogr 215:77-81
Nespolo M, Kogure T (1998) On the indexing of 3T mica polytype. Z Kristallogr 213:4-12 Nespolo M, Kuwahara Y (2001) Apparent polytypism in the Ruiz Peak ferric phlogopite. Eur J Mineral 13 (in
press) Nespolo M, Takeda H (1999) Inhomogeneous mica polytypes: 8-layer polytype of the 2M1 structural series
determined by the Periodic Intensity Distribution (PID) analysis of the X-ray diffraction pattern. Mineral J 21:103-118
Nespolo M, Takeda H, Ferraris G (1997a) Crystallography of mica polytypes. In Modular aspects of minerals / EMU Notes in Mineralogy, vol. 1. S Merlino (ed) Eötvös University press, Budapest, p 81-118
Nespolo M, Takeda H, Ferraris G, Kogure T (1997b) Composite twins of 1M mica: derivation and Identification. Mineral J 19:173-186
Nespolo M, Takeda H, Ferraris G (1998) Representation of the axial settings of mica polytypes. Acta Crystallogr A54:348-356
Nespolo M, Ferraris G, Ďurovič S (1999a) OD character and twinning – Selective merohedry in class II merohedric twins of OD polytypes. Z Kristallogr 214:776-779
Nespolo M, Ferraris G, Takeda H, Takéuchi Y (1999b) Plesiotwinning: oriented crystal associations based on a large coincidence-site lattice. Z Kristallogr 214:378-382
Nespolo M, Kogure T, Ferraris G (1999c) Allotwinning: oriented crystal association of polytypes – Some warnings on consequences. Z Kristallogr 214:1-4
Nespolo M, Takeda H, Kogure T, Ferraris G (1999d) Periodic Intensity Distribution (PID) of mica polytypes: symbols, structural model orientation and axial settings. Acta Crystallogr A55:659-676
Nespolo M, Ferraris G, Takeda H (2000a) Twins and allotwins of basic mica polytypes: theoretical derivation and identification in the reciprocal space. Acta Crystallogr A56:132-148
Nespolo M, Ferraris G, Takeda H (2000b) Identification of two allotwins of mica polytypes in reciprocal space through the minimal rhombus unit. Acta Crystallogr B56:639-647
Ohta T, Takeda H, Takéuchi Y (1982) Mica polytypism: similarities in the crystal structures of coexisting 1M and 2M1 oxybiotite. Am Mineral 67:298-310
Pabst A (1955) Redescription of the single layer structure of the micas. Am Mineral 40:967-974 Pauling L (1930) The structure of micas and related minerals. Proc Nat Ac Sci 16:123-129 Pavese A, Ferraris G, Prencipe M, Ibberson R (1997) Cation site ordering in phengite 3T from the Dora-Maira
massif (western Alps): a variable-temperature neutron powder diffraction study. Eur J Mineral 9:1183-1190
Pavlishin VI, Semenova TF, Rozhdesvenskaya IV (1981) Protolithionite-3T: structure, typomorphism and practical importance. Mineral Zh 3:47-60 (in Russian)
Peacock MA, Ferguson RB (1943) The morphology of muscovite in relation to the crystal lattice. Univ Toronto, Studies in Mineral 48:65-82
Pleasants PA, Baake M, Roth J (1996) Planar coincidences for N-fold symmetry. J Math Phys 1029-1058 Radoslovich EW (1960) The structure of muscovite KAl2(Si3Al)O10(OH)2. Acta Crystallogr 13:919-932 Ramsdell LS (1947) Studies on silicon carbide. Am Mineral 32:64-82 Ranganathan S (1966) On the geometry of coincidence-site lattices. Acta Crystallogr 21:197-199 Rieder M (1968) Zinnwaldite: Octahedral ordering in lithium-iron micas. Science 160:338-1340 Rieder M (1970) Lithium-iron micas from the Krušné hory Mountains (Erzgebirge): Twins, epitactic
overgrowths and polytypes, Z Kristallogr 132:161-184 Rieder M, Weiss Z (1991) Oblique-texture photographs: more information from powder diffraction. Z
Kristallogr 197:107-114 Rieder M, Hybler J, Smrčok L, Weiss Z (1996) Refinement of the crystal structure of zinnwaldite 2M1. Eur J
Mineral 8:1241-1248 Ross M, Takeda H, Wones DR (1966) Mica polytypes: systematic description and identification. Science
151:191-193 Rieder M, Cavazzini G, D’yakonov YuS, Frank-Kamenetskii VA, Gottardi G, Guggenheim S, Koval’ PV,
Müller G, Neiva AMR, Radoslowich EW, Robert JL, Sassi FP, Takeda H, Weiss Z, Wones DR (1998) Nomenclature of the micas. Clays and Clay Miner 46:586-595
Royer L (1928) Recherches expérimentales sur l’épitaxie ou orientation mutuelle de cristaux d’espèces differentes. Bull Soc franç Minér Crist 51:7-159
Royer L (1954) De l’épitaxie; quelques remarques sur le problèmes qu’elle soulève. Bull Soc franç Minér Crist 77:1004-1028
Sadanaga R (1978) omplex structures and space groupoids. Rec Progr Nat Sci Jpn 3:143-151 Sadanaga R, Ohsumi K (1979) Basic theorems of vector symmetry in crystallography. Acta Crystallogr
A35:115-122

Crystallographic Basis of Polytypism and Twinning in Micas 277
Sadanaga R, Sawada T, Ohsumi K, Kamiya K (1980) Classification of superstructures by symmetry. J Jpn Assoc Min Petr Econ Geol, Spec. Issue No. 2:23-29
Sadanaga R, Takeda H (1968) Monoclinic diffraction patterns produced by certain triclinic crystals and diffraction enhancement of symmetry. Acta Crystallogr B24:144-149
Sadanaga R, Takeda H (1969) Description of mica polytypes by new unit layers. J Mineral Soc Japan 9:177-184 (in Japanese)
Sadanaga R, Takéuchi Y (1961) Polysynthetic twinning of micas. Z Kristallogr 116:406-429 Sartori F (1977) The crystal structure of a 2M1 lepidolite. Tschermaks Min Petr Mitt 24:23-37 Sartori F, Franzini M, Merlino S (1973) Crystal Structure of a 2M2 Lepidolite. Acta Crystallogr B29:573-578 Schaskolsky M, Schubnikow A (1933) Über die künstliche herstellung gesetzmäβiger kristallverwachsungen
des kalialauns. Z Kristallogr 85:1-16 Schläfli L (1950) Gesammelte mathematische Abhabndlungen (Vol. 1) Birkhäuser, Basel Sidorenko OV, Zvyagin BB, Soboleva SV (1975) Crystal structure refinement for 1M dioctahedral mica. Sov
Phys Crystallogr 20:332-335 Sidorenko OV, Zvyagin BB, Soboleva SV (1977a) Refinement of the crystal structure of 2M1 paragonite by
the high-voltage electron diffraction method. Sov Phys Crystallogr 22:554-556 Sidorenko OV, Zvyagin BB, Soboleva SV (1977b) The crystal structure of 3T paragonite. Sov Phys
Crystallogr 22:557-560 Smith JV, Yoder HS (1956) Experimental and theoretical studies of the mica polymorphs, Mineral Mag
31:209-235 Slade PG, Schultz PK, Dean C (1987) Refinement of the Ephesite structure in C1 symmetry. N Jb Mineral
Mh 1987:275-287 Smrčok Ĺ, Ďurovič S, Petříček V, Weiss Z (1994) Refinement of the crystal structure of cronstedtite-3T.
Clays Clay Miner 42:544-551 Smrčok L, Weiss Z (1993) DIFK91: a program for the modelling of powder diffraction patterns on a PC. J
Appl Cryst 26:140-141 Smyth JR, Jacobsen SD, Swope RJ, Angel RJ, Arlt T, Domanik K, Holloway JR (2000) Crystal structures and
compressibilities of synthetic 2M1 and 3T phengite micas. Eur J Mineral 12:955-963 Sokolova GV, Aleksandrova VA, Drits VA, Bairakov VV (1979) Crystal structures of two brittle Lithia
micas. In Kristallokhimiya i Struktura Mineralov. Frank-Kamenetskii VA (ed) Nauka, Moscow, p 55-66 (in Russian)
Sorokin ND, Tairov YuM, Tsvetkov VF, Chernov MA (1982a) The laws governing the changes of some properties of different silicon carbide polytypes. Dokl Akad Nauk SSSR 262:1380-1383 (in Russian)
Sorokin ND, Tairov YuM, Tsvetkov VF, Chernov MA (1982b) Crystal-chemical properties of the polytypes of silicon carbide. Sov Phys Crystallogr 28:539-542
Sueno S, Takeda H, Sadanaga R (1971) Two-dimensional regular aggregates of layered crystals. Mineral J 6:172-185
Sunagawa I (1960) Mechanism of crystal growth, etching and twin formation of hematite. Mineral J 3:59-89 Sunagawa I (1964) Growth spirals on phlogopite crystals. Am Mineral 49:1427-1434 Sunagawa I (1977) Natural crystallization. J Crystal Growth 42:214-223 Sunagawa I (1978) Vapour growth and epitaxy of minerals and synthetic crystals. J Crystal Growth 45:3-12 Sunagawa I (1984) Growth of crystal in nature. In Material Science of the Earth’s Interior. I Sunagawa (ed)
Terra Publishing Company, Tokyo - D. Reidel Publishing Company, Dordrecht / Boston / Lancaster, p 63-105
Sunagawa I, Endo J, Daimon N, Tate I (1968) Nucleation, growth and polytypism of fluor-phlogopite from the vapour phase. J Crystal Growth 3,4:751
Sunagawa I, Koshino Y (1975) Growth Spirals on Kaolin Group Minerals. Am Mineral 60:407-412 Sunagawa I, Koshino Y, Asakura M, Yamamoto T (1975) Growth mechanism of some clay minerals.
Fortschr Miner 52:217-224 Sunagawa I, Tomura S (1976) Twinning in phlogopite. Am Mineral 61:939-943 Tairov YuM, Tsvetkov VF (1983) Progress in controlling the growth of polytypic crystals. In Crystal Growth
and Characterization of Polytype Structures. P Krishna (ed) Pergamon Press, Oxford / New York / Toronto / Sydney / Paris / Frankfurt, p 111-162
Takano Y, Takano K (1958) Apparent polytypism and Apparent Cleavage of the Micas. J Mineral Soc Jpn 3:674-692 (in Japanese)
Takeda H (1967) Determination of the layer stacking sequence of a new complex mica polytype: A 4-layer Lithium Fluorophlogophite. Acta Crystallogr 22:845-853
Takeda H (1969) Existence of complex mica polytype series based on 2M1 sequence. Jpn Crystallogr Assoc Autumn Meeting, Iwate, 2-3 (in Japanese)
Takeda H (1971) Distribution of mica polytypes among space gGroups. Am Mineral 56:1042-1056

278 Nespolo & Ďurovič
Takeda H, Donnay JDH (1965) Compound tessellations in crystal structures. Acta Crystallogr 19:474-476 Takeda H, Haga N, Sadanaga R (1971) Structural investigation of polymorphic transition between 2M2-, 1M-
Lepidolite and 2M1 Muscovite. Mineral J 6:203-215 Takeda H, Ross M (1975) Mica polytypism: dissimilarities in the crystal structures of coexisting 1M and 2M1
biotite. Am Mineral 60:1030-1040 Takeda H, Ross M (1995) Mica polytypism: identification and origin. Am Mineral 80:715-724 Takeda H, Sadanaga R (1969) New unit layers for micas. Mineral J 5:434-449 Takéuchi Y (1965) Structures of brittle micas. Proc. 13th Natl. Conf. Madison, Wisconsin, 1964, Clays Clay
minerals. Pergamon Press, 1-25 Takéuchi Y. (1971) Polymorphic or polytypic changes in biotites, pyroxenes, and wollastonites. J Mineral Soc
Jpn 10:Spec. Issue No. 2:87-99 (in Japanese) Takéuchi Y, Haga N (1971) Structural Transformation of Trioctahedral Sheet Silicates. Slip mechanism of
octahedral sheets and polytypic changes of micas. Mineral Soc Japan Spec Pap 1:74-87 (Proc. IMA-IAGOD Meetings '70, IMA Vol.)
Takéuchi Y, Sadanaga R (1966) Structural studies of brittle micas. I. The structure of xantophyllite refined. Mineral J 4:424-437
Takéuchi Y, Sadanaga R, Aikawa N (1972) Common lattices and image sets of hexagonal lattices, and their application to composite electron-diffraction patterns of biotite. Z Kristallogr 136:207-225
Thompson JB Jr (1981) Polytypism in complex crystals: contrast between mica and classical polytypes. In Structure and Bonding vol. II. M O'Keefe, A Navrotsky (ed), Academic Press, San Diego / London / Burlington, p 167-196
Tokonami M (1966) The structure determination of the 96R polytype of SiC by a direct method. Mineral J 4:401-423
Tokonami M, Hosoya S (1965) A systematic method for unravelling a periodic vector set. Acta Crystallogr 18:908-916
Tolansky S, Morris PG (1947a) An interferometric survey of the mica. Mineral Mag 28:137-145 Tolansky S, Morris PG (1947b) An interferometric examination of synthetic mica. Mineral Mag 28:146-150 Tomura S, Kitamura M, Sunagawa I (1979) Surface microtopography of metamorphic white micas. Phys
Chem Miner 5:65-81 Tschermak G (1878) Die Glimmergruppe (I. Theil) Z Kristallogr 2:14-50 Tsvetkov V F (1982) Problems and prospects of growing large silicon carbide crystals. Izv Leningr
Elektrotekh Inst 302:14-19 (in Russian) Udagawa S, Urabe K, Hasu H (1974) The crystal structure of muscvite dehydroxylate. J Japan Assoc Mineral
Petr Econ Geol 58:381-389 (in Japanese, with English Abstract) Ungemach H (1935) Sur la Syntaxie et la Polytypie. Z Kristallogr 91:1-22 Verma AR (1953) Crystal Growth and Dislocations. London: Butterworths, 182p Weiss Z, Ďurovič S (1980) OD interpretation of Mg-vermiculite. Symbolism and X-ray identification of its
polytypes. Acta Crystallogr A36:633-640 Weiss Z, Ďurovič S (1989) A united classification and X-ray identification of phyllosilicate polytypes.
Collected abstracts, 9th International Clay Conference, Strasbourg (France), p. 430 Weiss Z, Wiewióra A (1986) Polytypism of micas. III. X-ray Diffraction Identification. Clays Clay Minerals
34:53-68 Wondratschek H (1976) Extraordinary orbits of space groups. Theoretical considerations. Z Kristallogr
143:460-470 Wondratschek H (2002) Introduction tp space-groups. Sect. 8 in international Tables for Crystallography, Vol.
A,5th edition. The Hahn (ed) Dordrecht / Boston: London: Kluwer Academic Publishers (in press) Zhukhlistov AP, Zvyagin BB, Shuriga TN (1983) Electron-diffraction investigation of the crystal structure of
di-trioctahedral Li,Fe-phengite 1M. Sov Phys Crystallogr 28:518-521 Zhukhlistov AP, Zvyagin BB, Pavlishin VI (1990) Polytypic 4M modification of Ti-biotite with nonuniform
alternation of layers, and its appearance in electron-diffraction patterns from textures. Sov Phys Crystallogr 35:232-236
Zussman J (1979) The crystal chemistry of micas. Bull Mineral 102:5-13 Zvyagin BB (1962) A theory of polymorphism of micas. Sov Phys Crystallogr 6:571-580 Zvyagin BB (1967) Electron diffraction analysis of clay mineral structures. New York: Plenum Press, 364 p Zvyagin BB (1985) Polytypism in contemporary crystallography. Sov Phys Crystallogr 32:394-399 Zvyagin BB (1988) Polytypism of crystal structures. Comput Math Applic 16:569-591 Zvyagin BB (1993) A contribution to polytype systematics. Phase Trans 43:21-25 Zvyagin BB (1997) Modular analysis of crystal structures. In Modular aspects of minerals / EMU Notes in
Mineralogy, vol. 1. S Merlino (ed) Eötvös University press, Budapest, p 345-372 Zvyagin BB, Drits VA (1996) Interrelated features of structure and stacking of kaolin mineral layers Clays
Clay Miner 44:297-303

Crystallographic Basis of Polytypism and Twinning in Micas 279
Zvyagin BB, Gorshkov AI (1966) Effects of secondary diffraction in selected area patterns of mineral crystals superimposed with a relative rotation around the primary beam. Sixth Internat. Congress for Electron Microscopy, Kyoto. In Electron Microscopy 1966 Vol. I. R Uyeda (ed) Maruzen, Tokyo, p 603-604
Zvyagin BB, Vrublevskaya ZV, Zhukhlistov AP, Sidorenko OV, Soboleva SV, Fedotov AF (1979) High-voltage electron diffraction in the study of layered minerals. Moscow: Nauka Press, 224 pp. (in Russian)

1529-6466/02/0046-0005$05.00 DOI:10.2138/rmg.2002.46.05
5 Investigations of Micas Using Advanced Transmission Electron Microscopy
Toshihiro Kogure Department of Earth and Planetary Science
Graduate School of Science, The University of Tokyo 7-3-1 Hongo, Bunkyo-ku Tokyo 113-0033 Japan
INTRODUCTION After a long history of development and improvement, recent transmission electron
microscopes (TEMs) with various analytical functions have become important in material science and engineering. These functions include not only obtaining magnified images of specimens, but also electron-diffraction patterns, chemical analyses, and chemical-state analyses with spacial resolution far greater than other methodologies. It is impossible to cover all of these functions considering page limitations and, more importantly, considering the author’s knowledge and ability even for topics limited to studies of mica. This chapter focuses on the investigations of mica using high-resolution transmission electron microscopy (HRTEM). HRTEM is generally defined as a technique to obtain information about atomic structures in crystals from TEM images formed by phase contrast at high magnifications. Although HRTEM is just one of many functions in TEMs, several examples in sections below demonstrate that HRTEM often plays a decisive role in determining the local atomic arrangements in mica.
An early study of mica by HRTEM was reported by Buseck and Iijima (1974). They clearly observed three dark lines representing a mica layer (the lines correspond to the two tetrahedral sheets and one octahedral sheet) and that cleavage was formed at the interlayer. During a quarter century after this pioneering work, many HRTEM studies for mica and related phyllosilicates have been reported (for instance, see the references in Baronnet 1992). These included many studies of mica, e.g., polytypism, transformations, defects and interface research. In the following section, recent HRTEM and related techniques are briefly reviewed. Next, two topics of HRTEM investigation, polytype and defect analyses are presented based on studies, mainly by the author and his colleagues.
TEMS AND RELATED TECHNIQUES FOR THE INVESTIGATION OF MICA Transmission electron microscopy
After the invention of TEM by E.E. Ruska in 1932, this apparatus was improved rapidly in response to requests from many fields of science. In the 1950s, lattice fringes in crystals were recorded (Menter 1956), which indicated an exciting possibility that a tool was possible to observe atomic arrangements in a crystal directly on a screen. Imaging theory for HRTEM developed in the 1960s showed that contrast in magnified images can be observed, which corresponds to the projection of the electrostatic potential in specimens with a resolution (referred to as “point resolution”: δ) defined by the following equation:
δ = 0.66 Cs1/4 λ3/4
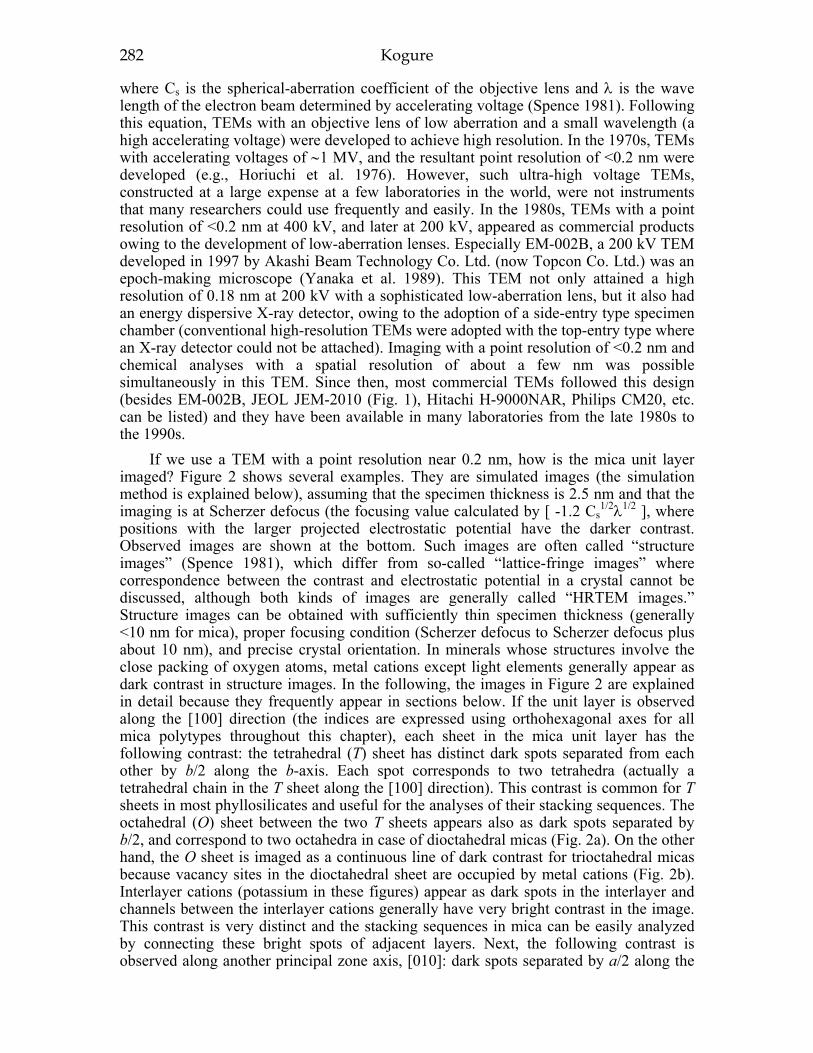
282 Kogure
where Cs is the spherical-aberration coefficient of the objective lens and λ is the wave length of the electron beam determined by accelerating voltage (Spence 1981). Following this equation, TEMs with an objective lens of low aberration and a small wavelength (a high accelerating voltage) were developed to achieve high resolution. In the 1970s, TEMs with accelerating voltages of ∼1 MV, and the resultant point resolution of <0.2 nm were developed (e.g., Horiuchi et al. 1976). However, such ultra-high voltage TEMs, constructed at a large expense at a few laboratories in the world, were not instruments that many researchers could use frequently and easily. In the 1980s, TEMs with a point resolution of <0.2 nm at 400 kV, and later at 200 kV, appeared as commercial products owing to the development of low-aberration lenses. Especially EM-002B, a 200 kV TEM developed in 1997 by Akashi Beam Technology Co. Ltd. (now Topcon Co. Ltd.) was an epoch-making microscope (Yanaka et al. 1989). This TEM not only attained a high resolution of 0.18 nm at 200 kV with a sophisticated low-aberration lens, but it also had an energy dispersive X-ray detector, owing to the adoption of a side-entry type specimen chamber (conventional high-resolution TEMs were adopted with the top-entry type where an X-ray detector could not be attached). Imaging with a point resolution of <0.2 nm and chemical analyses with a spatial resolution of about a few nm was possible simultaneously in this TEM. Since then, most commercial TEMs followed this design (besides EM-002B, JEOL JEM-2010 (Fig. 1), Hitachi H-9000NAR, Philips CM20, etc. can be listed) and they have been available in many laboratories from the late 1980s to the 1990s.
If we use a TEM with a point resolution near 0.2 nm, how is the mica unit layer imaged? Figure 2 shows several examples. They are simulated images (the simulation method is explained below), assuming that the specimen thickness is 2.5 nm and that the imaging is at Scherzer defocus (the focusing value calculated by [ -1.2 Cs
1/2λ1/2 ], where positions with the larger projected electrostatic potential have the darker contrast. Observed images are shown at the bottom. Such images are often called “structure images” (Spence 1981), which differ from so-called “lattice-fringe images” where correspondence between the contrast and electrostatic potential in a crystal cannot be discussed, although both kinds of images are generally called “HRTEM images.” Structure images can be obtained with sufficiently thin specimen thickness (generally <10 nm for mica), proper focusing condition (Scherzer defocus to Scherzer defocus plus about 10 nm), and precise crystal orientation. In minerals whose structures involve the close packing of oxygen atoms, metal cations except light elements generally appear as dark contrast in structure images. In the following, the images in Figure 2 are explained in detail because they frequently appear in sections below. If the unit layer is observed along the [100] direction (the indices are expressed using orthohexagonal axes for all mica polytypes throughout this chapter), each sheet in the mica unit layer has the following contrast: the tetrahedral (T) sheet has distinct dark spots separated from each other by b/2 along the b-axis. Each spot corresponds to two tetrahedra (actually a tetrahedral chain in the T sheet along the [100] direction). This contrast is common for T sheets in most phyllosilicates and useful for the analyses of their stacking sequences. The octahedral (O) sheet between the two T sheets appears also as dark spots separated by b/2, and correspond to two octahedra in case of dioctahedral micas (Fig. 2a). On the other hand, the O sheet is imaged as a continuous line of dark contrast for trioctahedral micas because vacancy sites in the dioctahedral sheet are occupied by metal cations (Fig. 2b). Interlayer cations (potassium in these figures) appear as dark spots in the interlayer and channels between the interlayer cations generally have very bright contrast in the image. This contrast is very distinct and the stacking sequences in mica can be easily analyzed by connecting these bright spots of adjacent layers. Next, the following contrast is observed along another principal zone axis, [010]: dark spots separated by a/2 along the
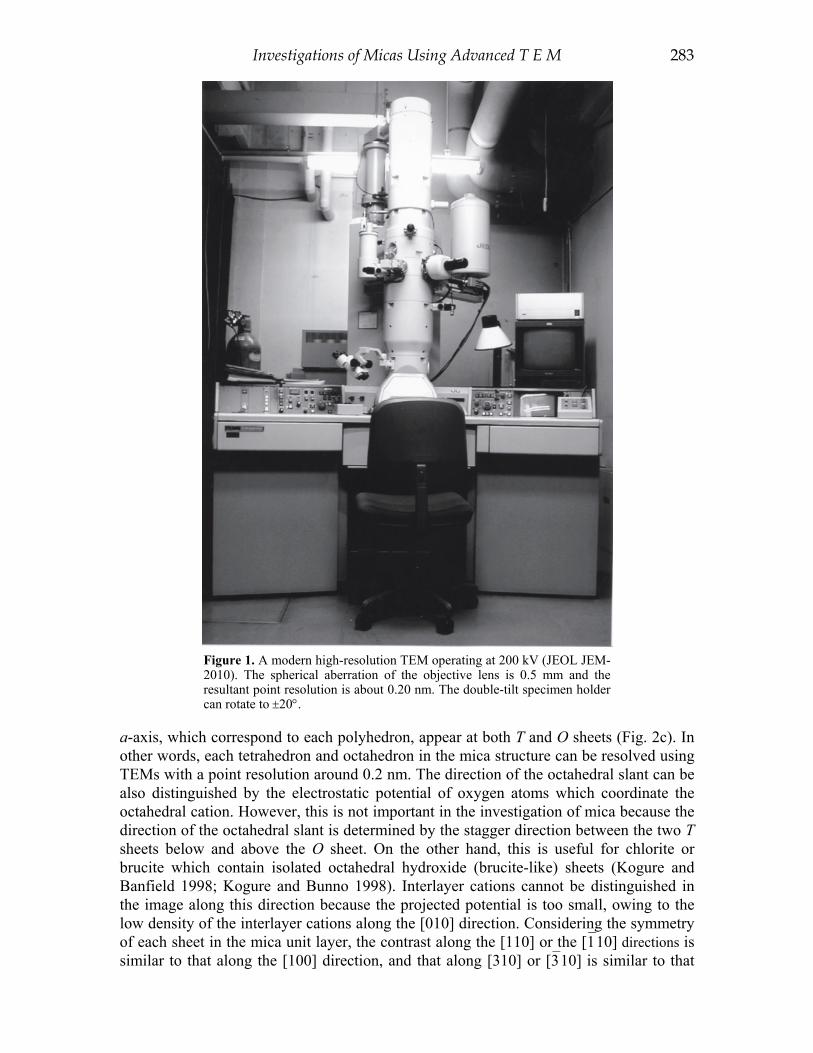
Investigations of Micas Using Advanced T E M 283
nn
Figure 1. A modern high-resolution TEM operating at 200 kV (JEOL JEM-2010). The spherical aberration of the objective lens is 0.5 mm and the resultant point resolution is about 0.20 nm. The double-tilt specimen holder can rotate to ±20°.
a-axis, which correspond to each polyhedron, appear at both T and O sheets (Fig. 2c). In other words, each tetrahedron and octahedron in the mica structure can be resolved using TEMs with a point resolution around 0.2 nm. The direction of the octahedral slant can be also distinguished by the electrostatic potential of oxygen atoms which coordinate the octahedral cation. However, this is not important in the investigation of mica because the direction of the octahedral slant is determined by the stagger direction between the two T sheets below and above the O sheet. On the other hand, this is useful for chlorite or brucite which contain isolated octahedral hydroxide (brucite-like) sheets (Kogure and Banfield 1998; Kogure and Bunno 1998). Interlayer cations cannot be distinguished in the image along this direction because the projected potential is too small, owing to the low density of the interlayer cations along the [010] direction. Considering the symmetry of each sheet in the mica unit layer, the contrast along the [110] or the [1⎯10] directions is similar to that along the [100] direction, and that along [310] or [3⎯10] is similar to that

284 Kogure
ffff
Figure 2. The correspondence between crystal structures (right), simulated images (center), and observed images (left) of mica. (a) Muscovite-2M1 viewed along [100]. (b) Annite-2M1 viewed along [100]. (c) Annite-2M1 viewed along [010]. The parameters for the simulation are; defocus = -42 nm (Scherzer focus) and specimen thickness = 2.5 nm.
along [010]. Other general [hk0] directions form three dark lines at the 2:1 layer and the brightest line at the interlayer in the image with the proper imaging condition. It was very recent, after Banfield and Murakami (1998), that the contrast along the [010] direction was utilized to investigate the atomic arrangements in phyllosilicates. Before that, most HRTEM works for mica and other phyllosilicates were performed only by imaging along [100]/[110]/[1⎯10], mainly owing to the limited resolution of TEMs. However, the
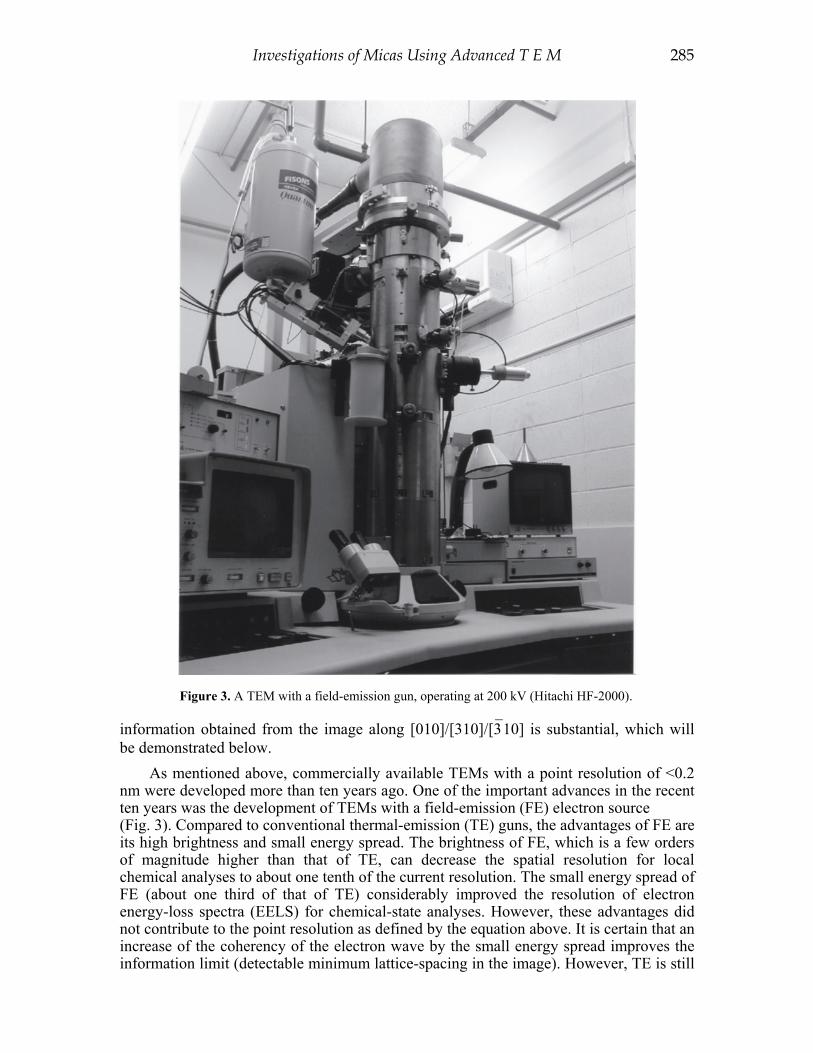
Investigations of Micas Using Advanced T E M 285
information
Figure 3. A TEM with a field-emission gun, operating at 200 kV (Hitachi HF-2000).
information obtained from the image along [010]/[310]/[3⎯10] is substantial, which will be demonstrated below.
As mentioned above, commercially available TEMs with a point resolution of <0.2 nm were developed more than ten years ago. One of the important advances in the recent ten years was the development of TEMs with a field-emission (FE) electron source (Fig. 3). Compared to conventional thermal-emission (TE) guns, the advantages of FE are its high brightness and small energy spread. The brightness of FE, which is a few orders of magnitude higher than that of TE, can decrease the spatial resolution for local chemical analyses to about one tenth of the current resolution. The small energy spread of FE (about one third of that of TE) considerably improved the resolution of electron energy-loss spectra (EELS) for chemical-state analyses. However, these advantages did not contribute to the point resolution as defined by the equation above. It is certain that an increase of the coherency of the electron wave by the small energy spread improves the information limit (detectable minimum lattice-spacing in the image). However, TE is still

286 Kogure
sufficient for obtaining structure images with a spherical aberration of present objective lenses (wave numbers larger than the inverse of the point resolution must be excluded by the objective aperture to obtain structure images, which means that the improved information limit by FE has no advantage for imaging). Of course structure images do not need to be obtained at every data-obtaining session and an improved information limit is useful for some purposes. Furthermore, recently it was demonstrated that the spherical aberration can be decreased drastically by a new design of the objective lens (Urban et al. 1999). Probably, 200 kV TEMs with a point resolution of <0.15 nm will be available in the near future. FE is necessary for such next generation TEMs because such a low point resolution defined by the above equation cannot be attained with TE owing to its limited coherency of the electron wave.
Although there are other recent “hot” topics for HRTEM, e.g., energy-filtered (EF) TEMs and Z-contrast imaging for scanning TEMs, few investigations with respect to silicates using these new techniques have been reported to date.
New recording media for beam-sensitive specimens
In addition to the improvements of TEMs themselves, advances in related technologies have also advanced HRTEM investigations of materials. For instance, there have been advances in the technology of the recording media for HRTEM images. The most important advance is the utilization of new recording media, i.e., high-resolution imaging-plates (IP) and high-sensitivity CCD cameras.
Electron radiation damage is probably the biggest problem for HRTEM recording of silicate minerals including mica, although the damage is dependent on the structures and compositions of the silicates. Generally, phyllosilicates belong to the category of beam-sensitive materials like the zeolite group. Among phyllosilicates, radiation damage strongly depends on the species of octahedral cation. In our experience, iron-bearing phyllosilicates are, in general, more tolerant against electron radiation than magnesium or aluminum-bearing phyllosilicates. For mica, for instance, this tolerance decreases in the sequence: annite >> phlogopite > muscovite. The structure images of muscovite could be recorded on conventional film with a skilled operator and a few exposure chances. New recording media are expected to produce HRTEM images with a very low electron dose. Both sensitivity and resolution of the media are important for this purpose. For instance, if the sensitivity of the media improves, HRTEM images can be recorded at a lower dose on the specimen. However, if the resolution of the media is lower also, images need to be recorded at higher magnification, which results in lower brightness on the media with the same beam intensity on the specimen. Hence more electron dose on the specimen is necessary to record the images.
High-resolution IP for TEMs was developed by Fuji Photo Film Co. Ltd., Japan (Oikawa et al. 1994). The sensitivity of IP is about ten thousand times greater than that of conventional films. Although the resolution of IP was improved recently (25 μm / pixel), it is still lower than that of conventional films whose resolution is estimated to be about 10 μm. Hence HRTEM images recorded on IP generally require about three times higher magnification than conventional film to obtain the same resolution of the images. In addition, quantum noise is deleterious if electron dose is too low. Despite these problems, high-resolution IP is still useful for HRTEM recording of beam sensitive specimens. For instance Nespolo and Kogure (1998) successfully reported a HRTEM image of phengitic muscovite using the IP. It was impossible to record the HRTEM images of this mineral on conventional films because radiation damage was very rapid. Another merit of IP is its wide dynamic range and good linearity between the darkness in the recorded images and the photon or electron dose. This is useful for the quantitative analyses of X-ray and

Investigations of Micas Using Advanced T E M 287
electron-diffraction patterns. For instance, in the investigations of mica using TEMs, Kogure and Nespolo (1999) analyzed intensities of electron-diffraction patterns quantitatively using IP to determine the stacking sequences of long-period polytypes of biotite.
Slow-scan CCD cameras, commercialized by Gatan Inc., USA, are also useful to record HRTEM images of beam-sensitive specimens because of their high sensitivity. Although a slow-scan CCD camera is presently more expensive than an IP system (not IP itself), it is more convenient because digitized images can be obtained on a computer in a few seconds and the results can be checked immediately. Recently HRTEM images of beam-sensitive zeolite minerals were successfully recorded using slow-scan CCD cameras (Pan and Crozier 1993; Sasaki et al. 1995). To obtain HRTEM images, focus setting is very critical. In our experience the specimen was often damaged during focusing, before recording to IP. Thus, slow-scan CCD cameras may be more suitable to record HRTEM images of beam-sensitive specimens. Sample preparation techniques
Because cleavage in most phyllosilicates, including mica, is perfect, and because most important structural information is obtained from HRTEM images along [hk0] directions (parallel to the cleavage), easy sample preparation techniques are not useful for HRTEM observations. For example, dispersing crushed specimens of mica on microgrids cannot be applied because the platy fragments are oriented normal to the beam direction. In early HRTEM investigations, ultramicrotomy (thin sectioning) was used for sample preparation (Iijima and Buseck 1978). However, the specimen obtained using ultramicrotomy is generally too thick to obtain structure images; specimen thickness of several nanometers is required. The ion-milling method, which was developed in the 1970s to prepare electrically transparent specimens for inorganic materials, is most suitable for HRTEM investigations mica. This method also has several problems, e.g., dehydration in vacuum (this is also inevitable in TEMs) and radiation damage by high-energy Ar+ ion. In the author’s experience, halloysite becomes amorphous during milling when the incident angle of the ion gun is large. However, there are no known mica samples which have been reported having problems in the preparation of the specimen for HRTEM using ion-milling. Considerable numbers of point defects are known to occur in mica by ion-milling (presumably via knock-on process) but such defects cause few problems in most HRTEM images.
If the mineral to investigate is in a petrographic thin section, the TEM specimen is prepared by extracting the area containing the mineral and by thinning with ion-milling. Large single crystals are embedded in resin, then cut in the appropriate direction, mechanically thinned to several tens of micrometers, and ion-milled. For powder specimens containing flakes (most phyllosilicates are composed of flakes when they are powdered) TEM specimens are prepared in the following way in the author’s laboratory: the powder and epoxy resin are pinched together between two glass slides. Sufficient force is applied to the glass slides during hardening of the epoxy resin to orient the flaks parallel to the glass slides. Then the specimen and glass slides are cut and thinned together. Do not rotate the specimen during ion-milling and set the specimen such that the incident ion beam is nearly perpendicular to the glass slides. Otherwise mica specimens are not thinned owing to different etching rate between the specimens and the glass slides. If the specimen is not rotated, the specimen varies in thickness (Fig. 4). Variations in thickness are often preferable for HRTEM because very wide thin areas are generally not necessary in many HRTEM observations. If thin areas are too wide, the specimen is easily bent and the orientation of the crystal gradually changes by electron radiation during the observation.
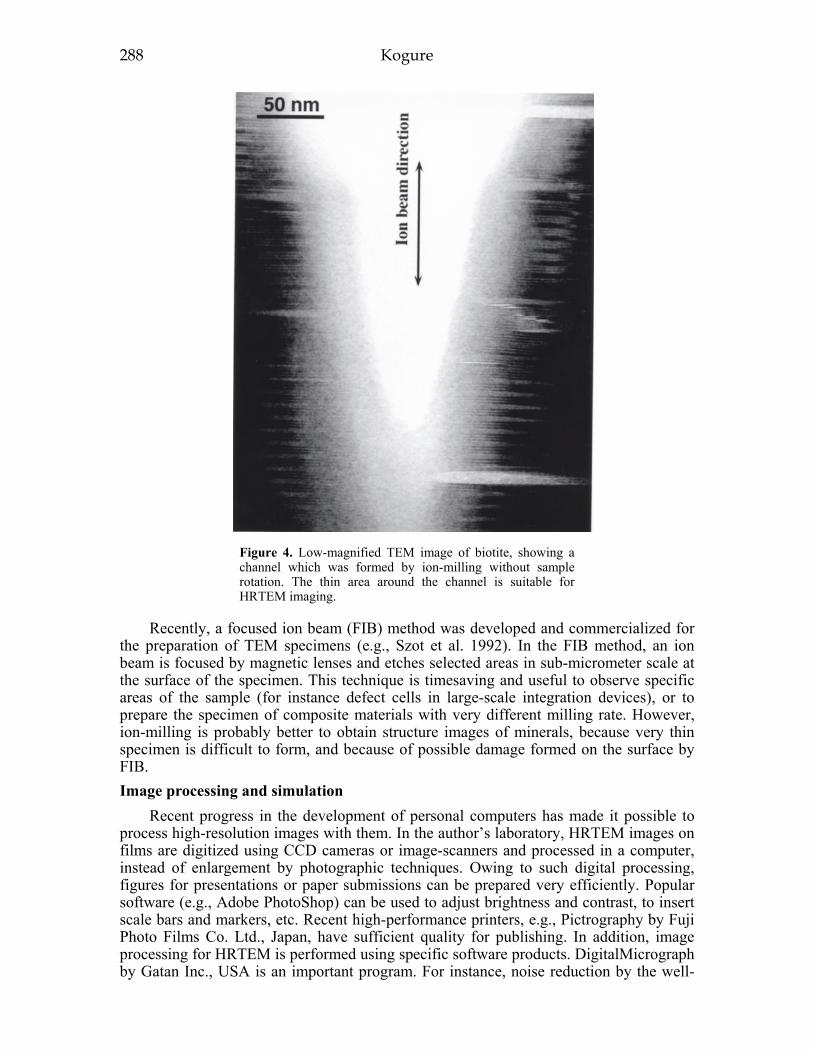
288 Kogure
Figure 4. Low-magnified TEM image of biotite, showing a channel which was formed by ion-milling without sample rotation. The thin area around the channel is suitable for HRTEM imaging.
Recently, a focused ion beam (FIB) method was developed and commercialized for the preparation of TEM specimens (e.g., Szot et al. 1992). In the FIB method, an ion beam is focused by magnetic lenses and etches selected areas in sub-micrometer scale at the surface of the specimen. This technique is timesaving and useful to observe specific areas of the sample (for instance defect cells in large-scale integration devices), or to prepare the specimen of composite materials with very different milling rate. However, ion-milling is probably better to obtain structure images of minerals, because very thin specimen is difficult to form, and because of possible damage formed on the surface by FIB. Image processing and simulation
Recent progress in the development of personal computers has made it possible to process high-resolution images with them. In the author’s laboratory, HRTEM images on films are digitized using CCD cameras or image-scanners and processed in a computer, instead of enlargement by photographic techniques. Owing to such digital processing, figures for presentations or paper submissions can be prepared very efficiently. Popular software (e.g., Adobe PhotoShop) can be used to adjust brightness and contrast, to insert scale bars and markers, etc. Recent high-performance printers, e.g., Pictrography by Fuji Photo Films Co. Ltd., Japan, have sufficient quality for publishing. In addition, image processing for HRTEM is performed using specific software products. DigitalMicrograph by Gatan Inc., USA is an important program. For instance, noise reduction by the well-
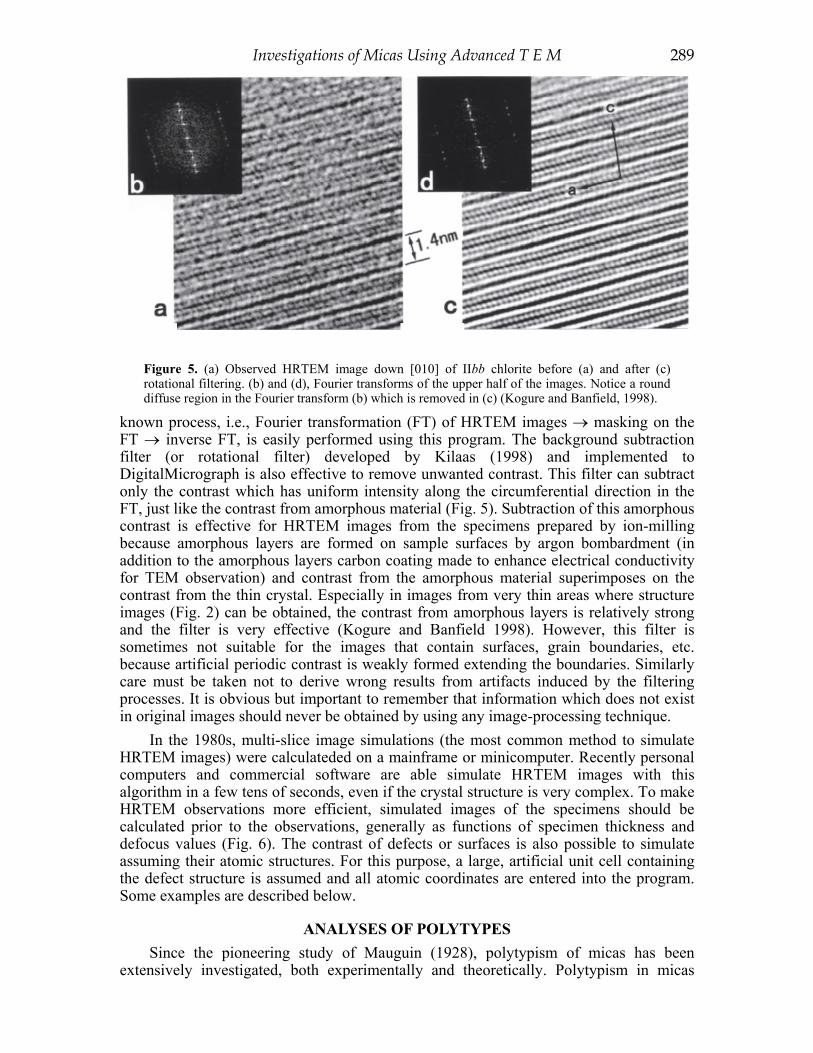
Investigations of Micas Using Advanced T E M 289
hhh
Figure 5. (a) Observed HRTEM image down [010] of IIbb chlorite before (a) and after (c) rotational filtering. (b) and (d), Fourier transforms of the upper half of the images. Notice a round diffuse region in the Fourier transform (b) which is removed in (c) (Kogure and Banfield, 1998).
known process, i.e., Fourier transformation (FT) of HRTEM images → masking on the FT → inverse FT, is easily performed using this program. The background subtraction filter (or rotational filter) developed by Kilaas (1998) and implemented to DigitalMicrograph is also effective to remove unwanted contrast. This filter can subtract only the contrast which has uniform intensity along the circumferential direction in the FT, just like the contrast from amorphous material (Fig. 5). Subtraction of this amorphous contrast is effective for HRTEM images from the specimens prepared by ion-milling because amorphous layers are formed on sample surfaces by argon bombardment (in addition to the amorphous layers carbon coating made to enhance electrical conductivity for TEM observation) and contrast from the amorphous material superimposes on the contrast from the thin crystal. Especially in images from very thin areas where structure images (Fig. 2) can be obtained, the contrast from amorphous layers is relatively strong and the filter is very effective (Kogure and Banfield 1998). However, this filter is sometimes not suitable for the images that contain surfaces, grain boundaries, etc. because artificial periodic contrast is weakly formed extending the boundaries. Similarly care must be taken not to derive wrong results from artifacts induced by the filtering processes. It is obvious but important to remember that information which does not exist in original images should never be obtained by using any image-processing technique.
In the 1980s, multi-slice image simulations (the most common method to simulate HRTEM images) were calculateded on a mainframe or minicomputer. Recently personal computers and commercial software are able simulate HRTEM images with this algorithm in a few tens of seconds, even if the crystal structure is very complex. To make HRTEM observations more efficient, simulated images of the specimens should be calculated prior to the observations, generally as functions of specimen thickness and defocus values (Fig. 6). The contrast of defects or surfaces is also possible to simulate assuming their atomic structures. For this purpose, a large, artificial unit cell containing the defect structure is assumed and all atomic coordinates are entered into the program. Some examples are described below.
ANALYSES OF POLYTYPES Since the pioneering study of Mauguin (1928), polytypism of micas has been
extensively investigated, both experimentally and theoretically. Polytypism in micas

290 Kogure
nnnn
Figure 6. Simulated images of 2M1 annite viewed along [100], as functions of defocus value and specimen thickness.
arises from the existence of six stagger directions, each with a length of |a|/3 in the (001) projection, between two tetrahedral sheets in a 2:1 layer and the subsequent stacking of such 2:1 layers with respect to the stagger direction (Smith and Yoder 1956). Such stacking sequences can also be expressed by the relative rotation with a multiple of 60° between adjacent layers. Polytypes in which the position of any layer relative to the others and the transition from a layer to the adjacent layers are the same or equivalent for all layers are called homogenous polytypes, whereas the remaining polytypes are called inhomogeneous polytypes (Zvyagin 1988). Homogeneous polytypes are also known as “simple” (Smith and Yoder 1956) or “standard” (Bailey 1980) polytypes and are subdivided into three families of MDO (Maximum Degree of Order) polytypes

Investigations of Micas Using Advanced T E M 291
(Backhaus and Durovic 1984). Inhomogeneous polytypes are also known as “complex” (Smith and Yoder 1956). Inhomogeneous polytypes are relatively rare and their occurrence seems to be related to several factors, among which crystal chemistry and crystal-growth conditions are important (Baronnet 1980).
The relative rotations between successive layers classify mica polytypes into three types: subfamily A [polytypes in which (0°, ±120°) rotations between adjacent layers only occur], subfamily B [polytypes in which the rotation is by (±60°, 180°)] and mixed-rotation (polytypes in which both kinds of rotations occur) (Backhaus and Durovic 1984; Nespolo 1999). Previous workers showed that subfamily A polytypes are much more abundant than the others, both in natural and in synthetic samples. Within subfamily A, the three homogeneous polytypes, identified by Ramsdell (1947) notation as 1M, 2M1 and 3T and several inhomogeneous polytypes with more complex stacking sequences were found, including 1Mr-n(120) disordered structures (Ross et al. 1966). Only homogeneous polytypes were reported in subfamily B: 2M2 is relatively common in lithium micas, and it was also found in some dioctahedral micas containing high-Al (Drits et al. 1966; Zhukhlistov et al. 1973) or Cs (Ni and Huges 1996); 2O was found in the brittle mica anandite (Giuseppetti and Tadini 1972; Filut et al. 1985), and 6H is still unknown. The 180º rotation is by far the less common rotation in micas: it was found only in anandite-2O (Giuseppetti and Tadini 1972; Filut et al. 1985) and in fluoropolylithionite-4A5 (Takeda 1967).
X-ray diffraction is the traditional and most commonly used technique to investigate mica polytypes and related sheet silicates. Oblique-texture electron diffraction is also successfully employed (Zvyagin 1967; Zvyagin et al. 1979). On the other hand, Iijima and Buseck (1978), and Amouric et al. (1978) demonstrated that the stacking sequence in mica polytypes could be directly determined by observing the stagger direction in each 2:1 layer using HRTEM. After that, several research groups applied this technique to investigate mica polytypes (e.g., Tomura et al. 1978; Amouric and Baronnet 1983; Baronnet and Kang 1989; Konishi and Akai 1990; Bigi and Brigatti 1994; Xu and Veblen 1995). The investigation of polytypism using HRTEM has several advantages compared to X-ray diffraction techniques because a much smaller specimen volume is necessary. Also, HRTEM can investigate specimens containing considerable stacking disorder or microtwins, which are common in mica and are often obstacles for diffraction techniques. However, as Iijima and Buseck (1978) noted, the HRTEM technique in early studies was generally not sufficient to determine completely the stacking sequence of micas in which (±60º, 180°) rotations are included, because the stacking sequence was derived from images recorded only along one of the [100], [110], or [1⎯10] direction (see Fig. 7 and the explanation below). In other words, the earlier HRTEM studies assumed that the speci- mens belong to subfamily A. As mentioned above, this assumption is generally accept- able, except for micas with specific compositions and most results obtained in previous works are probably valid. However, complete determination of stacking sequences, including any rotations, must be provided in future investigations of polytypism.
As shown in Figure 7, The HRTEM image taken along one of the [100], [110], and [1⎯10] directions can distinguish the shift direction in each layer with an angle of (0°, 180°), (60°, 120°) or (-60°, -120°) from the beam direction, but it cannot distinguish between the directions in each of the three pairs. A second HRTEM image of the same layer is necessary, which is obtained by rotating the specimen by 60° (along the other direction of [100], [110], or [⎯110]) or 30° (along one of the [310], [010] or [3⎯10] directions). It is difficult to rotate the specimen by 60° in a commercially available TEM with a high-resolution pole-piece. Analyses of stacking sequences in layer silicates
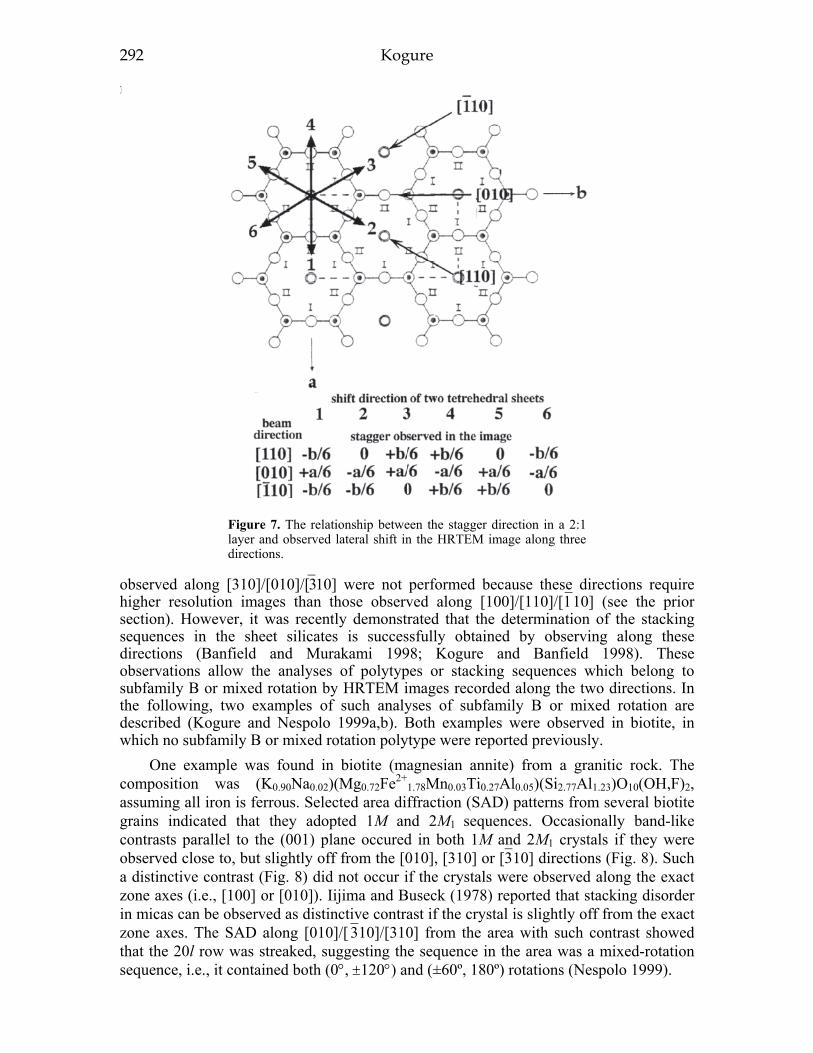
292 Kogure
mmmm
Figure 7. The relationship between the stagger direction in a 2:1 layer and observed lateral shift in the HRTEM image along three directions.
observed along [310]/[010]/[⎯310] were not performed because these directions require higher resolution images than those observed along [100]/[110]/[1⎯10] (see the prior section). However, it was recently demonstrated that the determination of the stacking sequences in the sheet silicates is successfully obtained by observing along these directions (Banfield and Murakami 1998; Kogure and Banfield 1998). These observations allow the analyses of polytypes or stacking sequences which belong to subfamily B or mixed rotation by HRTEM images recorded along the two directions. In the following, two examples of such analyses of subfamily B or mixed rotation are described (Kogure and Nespolo 1999a,b). Both examples were observed in biotite, in which no subfamily B or mixed rotation polytype were reported previously.
One example was found in biotite (magnesian annite) from a granitic rock. The composition was (K0.90Na0.02)(Mg0.72Fe2+
1.78Mn0.03Ti0.27Al0.05)(Si2.77Al1.23)O10(OH,F)2, assuming all iron is ferrous. Selected area diffraction (SAD) patterns from several biotite grains indicated that they adopted 1M and 2M1 sequences. Occasionally band-like contrasts parallel to the (001) plane occured in both 1M and 2M1 crystals if they were observed close to, but slightly off from the [010], [310] or [3⎯10] directions (Fig. 8). Such a distinctive contrast (Fig. 8) did not occur if the crystals were observed along the exact zone axes (i.e., [100] or [010]). Iijima and Buseck (1978) reported that stacking disorder in micas can be observed as distinctive contrast if the crystal is slightly off from the exact zone axes. The SAD along [010]/[ 3⎯10]/[310] from the area with such contrast showed that the 20l row was streaked, suggesting the sequence in the area was a mixed-rotation sequence, i.e., it contained both (0°, ±120°) and (±60º, 180º) rotations (Nespolo 1999).

Investigations of Micas Using Advanced T E M 293
Figure 8. A bright-field image to show a band-like contrast in biotite. The beam direction is near, but slight off from the [010], [310] or [3⎯10] direction (Kogure and Nespolo 1999a).
Figure 9 shows filtered HRTEM images from such an area recorded along (a) [110] and (b) [010]. The corresponding layers in the two images could be identified by reference to an impurity chlorite unit layer embedded in the biotite crystal. From the two stagger directions at each layer (white arrows in Fig. 9) obtained from the two images, the shift direction of the tetrahedral sheets in each layer and, consequently, the stacking sequence can be completely determined, as indicated in the table in Figure 7. Figure 10 shows the shift directions of all layers in an area in the sample (including the layers in Fig. 9) with the distinctive contrast occurring in a 2M1 crystal, determined by the analysis of the HRTEM images. The bold arrows correspond to the 2:1 layers with different parity in Z symbols (Zvyagin et al. 1979; Zhukhlistov et al. 1973) from those of the host 2M1 crystal. At both sides of these layers, stacking sequences with ±60° and 180° rotations are present. Locally, a 2O sequence with six repeats and a 4A8 sequence, corresponding to RTW rotational symbols 2⎯233 (Ross et al. 1966; Takeda and Ross 1995), with three repeats, are formed. Such an irregular stacking sequence was probably formed by some modifying events during the crystal growth of the biotite, such as the lateral coalescence of two or more small crystallites, which may introduce one or more layers with different orientation (Baronnet 1973; Penn and Banfield 1998; Kogure and Nespolo 1999b). It is, in fact, well known that as soon as two crystals come into contact, new growth layers start to crystallize from the point where they coalesce (Sunagawa et al. 1975). It cannot be definitely stated whether this reported occurrence is unique or similar (±60°, 180°) rotations may have been overlooked by previous studies which did not emphasize TEM images of micas along [310], [010] or [310], i.e., the orientation for detecting (±60°, 180°) rotations.
Another example is the determination of the stacking sequence of a very long-period (inhomogeneous), mixed-rotation polytype, discovered in an oxybiotite (dehydrogenated biotite with ferric iron) sample from the Ruiz Peak rhyodacite, New Mexico, USA. In this sample, Ross et al. (1966) identified several inhomogeneous polytypes by X-ray diffraction. SAD patterns revealed the existence of many kinds of polytypes, namely 1M,

294 Kogure
Figure 9. Filtered HRTEM images of biotite layers, recorded down [110] (a) and [010] (b). The white arrows indicate the shift of the tetrahedral sheets in each 2:1 layer. In (a), the arrows connect dark spots which correspond to potassium ions at the interlayer, the lateral shift of which is the same as that of the stagger of two tetrahedral sheets in a 2:1 layer (Kogure and Nespolo 1999a).

Investigations of Micas Using Advanced T E M 295
Figure 10. The stacking sequences of biotite layers, as determined by two HRTEM images along different directions. The bold arrows correspond to the 2:1 layers that have different Z symbols from those in the original 2M1 sequence. The arrows between two white arrowheads correspond to the biotite layers in Figure 10. Inset in the corner: Z symbols and vectors in projection (001) with reference to the space-fixed setting (a, b axes) (Kogure and Nespolo 1999a).
2M1, 3T and several inhomogeneous polytypes, including long-period forms. These inhomogeneous polytypes can be easily identified using bright-field images similar to that in Figure 8 (the diffraction condition is slightly tilted slightly from the zone-axes) with relatively lower magnification. Figure 11 shows one of these images, which indicates a long-period, inhomogeneous polytype. From these images, the period of the polytype along c* is determined to be ~36 nm and the stacking sequence of each periodic unit is probably the same owing to their same contrast. The SAD pattern clearly consists of non-streaked diffraction spots with the periodicity corresponding to 36 nm on 02l reciprocal lattice rows (Fig. 12b). This polytype has also an unusual feature: it shows a periodic contrast in the image recorded along the direction near to [3⎯10] (Fig. 11b). Figure 12c shows the 13l reciprocal lattice rows, where several reflections are clearly seen in the 0.1 Å-1
repeat, indicating this polytype as a mixed-rotation form (Nespolo 1999).

296 Kogure
Figure 11. (a) A one-dimensional lattice image of a 36-layer polytype observed near the [100] direction; (b) shows the corresponding SAD pattern. (c) A one-dimensional lattice image in the same area but rotated about c* by 30° from the crystal orientation in (a); (d) shows the corresponding SAD pattern. The arrows in (a) and (c) indicate a cleavage surface (Kogure and Nespolo 1999b).

Investigations of Micas Using Advanced T E M 297
Figure 12. (a) 0kl SAD pattern from the 36-layer polytype. The diameter of the SA aperture corresponds to about 2 micrometers. The faint diffraction spots between 00l spots with 0.1 Å-1 repeat are related to multiple diffraction. (b) Magnified image of 02l reciprocal lattice row in the square box in (a). The separation of diffraction spots corresponds to 360 Å periodicity and no extra spots or apparent streak are observed. (c) Magnified image of the 13l reciprocal lattice row in the SAD pattern projected along [3⎯10]. The appearance of several diffraction spots within 0.1 Å-1 repeat proves the mixed-rotation nature of this 36-layer polytype (Kogure and Nespolo 1999b).
Figure 13 shows HRTEM images recorded down [100] and [3⎯10] at the same area in this 36-layer polytype. The black arrow in Figure 13b indicates the position of a cleaved surface, which was used as a marker to identify the same unit layer among these figures. The projection of the stacking vector of each layer could be traced as indicated by white arrows in the figures, and the direction of the stacking vector could be determined by these two arrows. These analyses revealed that the inhomogeneous polytype under inves- tigation has a 36 layers repeat unit with Z, RTW and TS (Takeda and Sadanaga 1969) symbols in Table 1. The stacking sequence is illustrated in Figure 14; it can also explain periodic intensity distribution (PID) (Takeda and Ross 1995) in the electron diffraction patterns in Figure 12 (Kogure and Nespolo 1999b). This polytype is probably the longest period in mica reported to date and moreover, the first mixed-rotation polytype found in biotite. The number of the repeating units exceeds one hundred, and it may be referred to as a “polytype.” Several other polytypes with shorter periodicities have been found during the observation of this sample, but all of them belong to subfamily A, as revealed by one-dimensional lattice images near [010], [310] or [3⎯10] and SAD patterns. These results suggest that the 36-layer mixed rotation polytype is a very rare example. However, it has been proved that polytypes in this subfamily (with sufficiently repeating units can be formed in biotite if some special growth condition takes place.
It is easy to find other mica specimens to investigate with similar stacking sequences ff

298 Kogure
Table 1. Symbols describing the stacking sequence of the 36-layer mixed-rotation polytype. [From Kogure and Nespolo (1999b), Table 1, p. 510.]
n Z RTW TS
1 2 2 D*(10,-1) 2 4 -2 D*(-7,0) 3 2 2 D*(3,-1) 4 4 -2 D*(13,0) 5 2 2 D*(-4,-1) 6 4 -2 D*(6,0) 7 2 2 D*(-11,-1) 8 4 0 D*(-1,0) 9 4 0 D*(9,1) 10 4 -2 D*(-8,-1) 11 2 2 D*(2,1) 12 4 -2 D*(12,-1) 13 2 2 D*(-5,1) 14 4 -2 D*(5,-1) 15 2 2 D*(-12,1) 16 4 -2 D*(-2,-1) 17 2 2 D*(8,1) 18 4 2 D*(-9,-1) 19 6 -2 D*(1,-1) 20 4 -2 D*(11,0) 21 2 2 D*(-6,-1) 22 4 -2 D*(4,0) 23 2 0 D*(-13,-1) 24 2 2 D*(-3,1) 25 4 -2 D*(7,-1) 26 2 2 D*(-10,1) 27 4 -2 D*(0,-1) 28 2 -1 T*(10,1) 29 1 2 D(2,0) 30 3 –2 D(-6,0) 31 1 2 D(13,-1) 32 3 -2 D(5,-1) 33 1 2 D(-3,1) 34 3 -2 D(-11,1) 35 1 2 D(8,0) 36 3 -1 T(0,0)
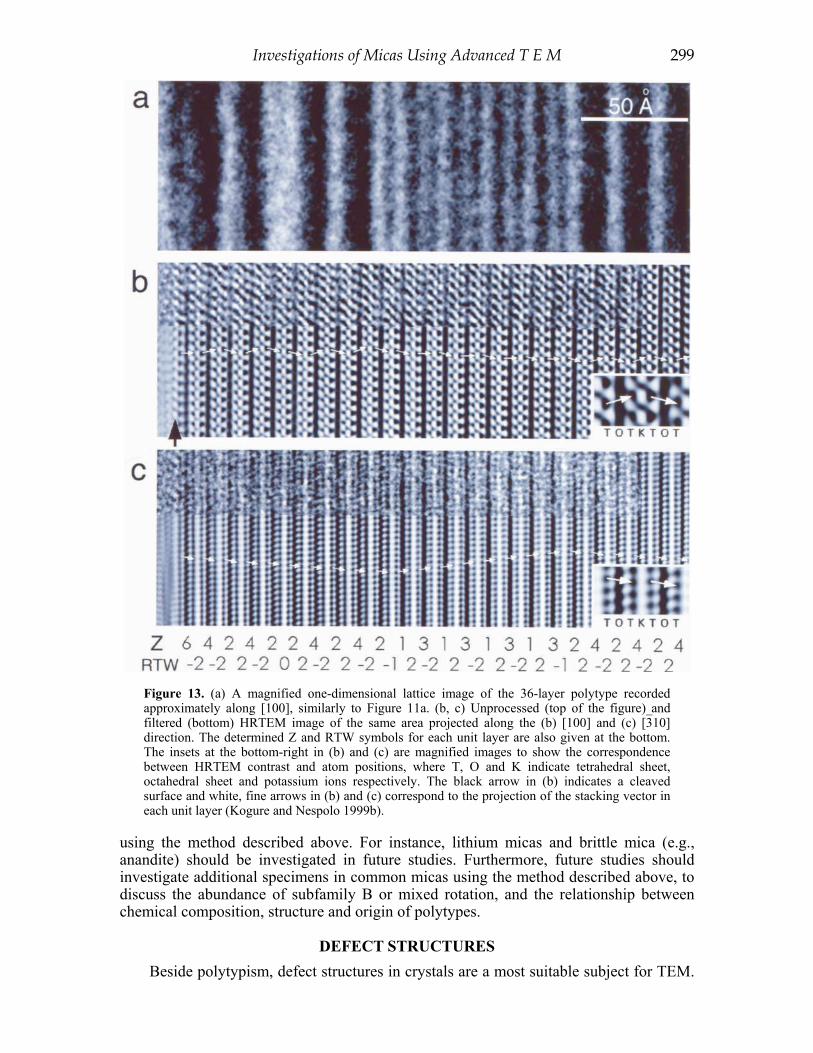
Investigations of Micas Using Advanced T E M 299
Figure 13. (a) A magnified one-dimensional lattice image of the 36-layer polytype recorded approximately along [100], similarly to Figure 11a. (b, c) Unprocessed (top of the figure) and filtered (bottom) HRTEM image of the same area projected along the (b) [100] and (c) [3⎯10] direction. The determined Z and RTW symbols for each unit layer are also given at the bottom. The insets at the bottom-right in (b) and (c) are magnified images to show the correspondence between HRTEM contrast and atom positions, where T, O and K indicate tetrahedral sheet, octahedral sheet and potassium ions respectively. The black arrow in (b) indicates a cleaved surface and white, fine arrows in (b) and (c) correspond to the projection of the stacking vector in each unit layer (Kogure and Nespolo 1999b).
using the method described above. For instance, lithium micas and brittle mica (e.g., anandite) should be investigated in future studies. Furthermore, future studies should investigate additional specimens in common micas using the method described above, to discuss the abundance of subfamily B or mixed rotation, and the relationship between chemical composition, structure and origin of polytypes.
DEFECT STRUCTURES Beside polytypism, defect structures in crystals are a most suitable subject for TEM.

300 Kogure
gg
Figure 14. The stacking sequences of the 36-layer polytype, determined by the two HRTEM images along different directions. The arrows indicate the stacking with ±60° rotation.
In particular, planar defects have been investigated successfully using HRTEM and such defect structures are common in phyllosilicates, including micas. Stacking faults are also regarded as planar defects but they are closely related to polytypism, which has been described above. Here we will discuss other types of planar defects which are important for micas. They include defects related to the initial stages of the transformation of micas to other minerals, e.g., mica to chlorite, mica to vermiculite, mica to kaolinite and the decomposition of mica at high temperature. The transformation of mica of igneous origins to chlorite is a common alteration phenomenon near the earth’s surface. The crystal structure of chlorite consists of a 2:1 layer, and a brucite-like hydroxide interlayer sheet with positive charge instead of alkali or alkali-earth cations as in mica. Figure 15 shows the structure image of (trioctahedral) chlorite observed along the two principal zone axes. In the initial stage of chloritization, it is observed that chlorite layers, which are easily identified with their different (001) spacing (about 1.4 nm) or with the contrast at the interlayer, are embedded in biotite to form a biotite-chlorite interstratification (Fig. 16). Such chloritization of mica was reported in early HRTEM studies and its transformation mechanism was discussed. Iijima and Zhu (1982) and Olives and Amouric (1984) reported a 1.4 nm chlorite-like structure in biotite, which they interpreted to be formed via the replacement of a potassium interlayer planes by a brucite-like sheet. On the other hand, Veblen and Ferry (1983) reported another chloritization mechanism involving formation of one chlorite layer from two biotite layers by the removal of two potassium interlayer sheets and two tetrahedral

Investigations of Micas Using Advanced T E M 301
jjj
Figure 15. The crystal structure of chlorite (IIbb) and corresponding simulated images down (a) [100] and (b) [010]. Simulation parameters are: defocus = -40 nm; specimen thickness = 2 nm; and the composition assumed at all octahedral sites is Mg0.5Fe0.5.
Figure 16. A HRTEM image of a biotite-chlorite interstratified structure projected along [100]/[110]/[1⎯10]. The difference of the tip positions between biotite layers and chlorite layers is related to the difference to the resistance of beam radiation.
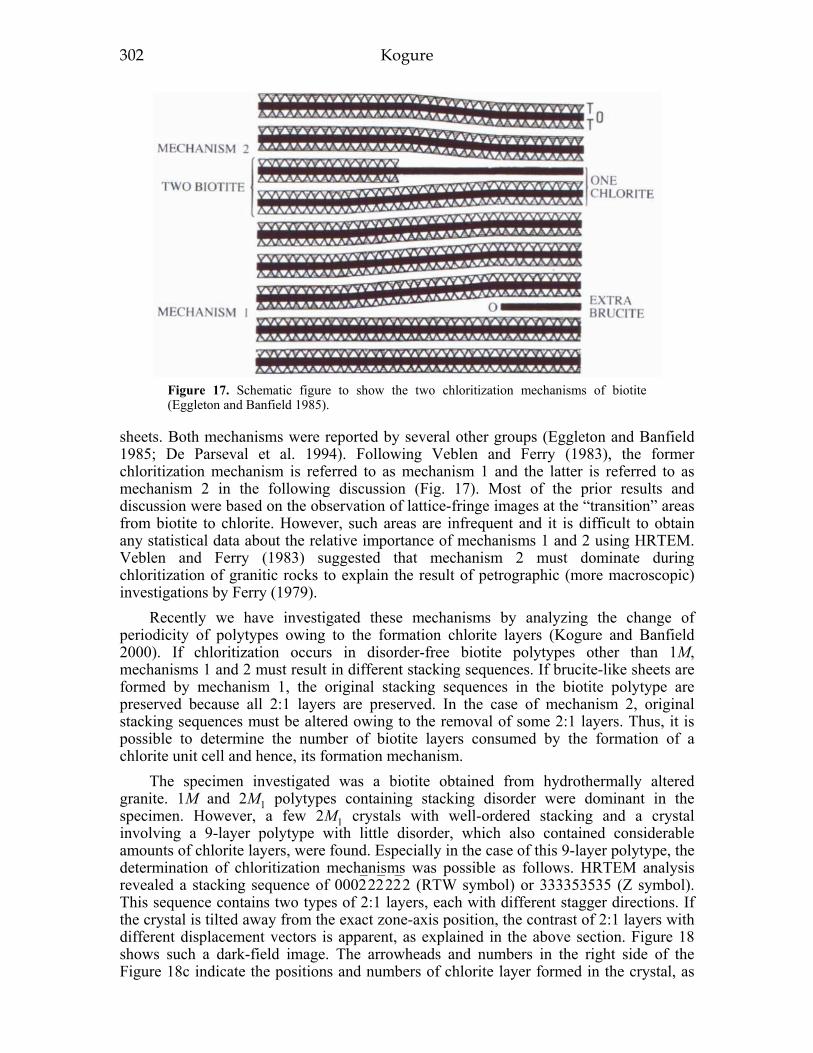
302 Kogure
Figure 17. Schematic figure to show the two chloritization mechanisms of biotite (Eggleton and Banfield 1985).
sheets. Both mechanisms were reported by several other groups (Eggleton and Banfield 1985; De Parseval et al. 1994). Following Veblen and Ferry (1983), the former chloritization mechanism is referred to as mechanism 1 and the latter is referred to as mechanism 2 in the following discussion (Fig. 17). Most of the prior results and discussion were based on the observation of lattice-fringe images at the “transition” areas from biotite to chlorite. However, such areas are infrequent and it is difficult to obtain any statistical data about the relative importance of mechanisms 1 and 2 using HRTEM. Veblen and Ferry (1983) suggested that mechanism 2 must dominate during chloritization of granitic rocks to explain the result of petrographic (more macroscopic) investigations by Ferry (1979).
Recently we have investigated these mechanisms by analyzing the change of periodicity of polytypes owing to the formation chlorite layers (Kogure and Banfield 2000). If chloritization occurs in disorder-free biotite polytypes other than 1M, mechanisms 1 and 2 must result in different stacking sequences. If brucite-like sheets are formed by mechanism 1, the original stacking sequences in the biotite polytype are preserved because all 2:1 layers are preserved. In the case of mechanism 2, original stacking sequences must be altered owing to the removal of some 2:1 layers. Thus, it is possible to determine the number of biotite layers consumed by the formation of a chlorite unit cell and hence, its formation mechanism.
The specimen investigated was a biotite obtained from hydrothermally altered granite. 1M and 2M1 polytypes containing stacking disorder were dominant in the specimen. However, a few 2M1 crystals with well-ordered stacking and a crystal involving a 9-layer polytype with little disorder, which also contained considerable amounts of chlorite layers, were found. Especially in the case of this 9-layer polytype, the determination of chloritization mechanisms was possible as follows. HRTEM analysis revealed a stacking sequence of 0002⎯22⎯22⎯2 (RTW symbol) or 333353535 (Z symbol). This sequence contains two types of 2:1 layers, each with different stagger directions. If the crystal is tilted away from the exact zone-axis position, the contrast of 2:1 layers with different displacement vectors is apparent, as explained in the above section. Figure 18 shows such a dark-field image. The arrowheads and numbers in the right side of the Figure 18c indicate the positions and numbers of chlorite layer formed in the crystal, as

Investigations of Micas Using Advanced T E M 303
pp
Figure 18. (a) Diffraction condition to form the dark-field image in (b) and (c). The beam direction is close to [100]/[110]/[1⎯10]. The arrow indicates the reflections selected by the objective aperture to form the dark-field image. (b) A dark-field image of a portion of the 9-layer polytype biotite crystal containing many chlorite layers. (c) A magnified image around the center of (b). The arrowheads and figures in the right indicate the positions and numbers of chlorite layers determined from higher resolution images. The left figures indicate the distances (Å) between corresponding biotite layers in two or three polytype units (Kogure and Banfield 2000).
determined by a higher-resolution image. In the upper and lower portions in Figure 18c, where no chlorite layers are formed, three distinct lines are highlighted. These three lines correspond to the three 2:1 layers with the same displacement vector (“5” in Z symbol) in
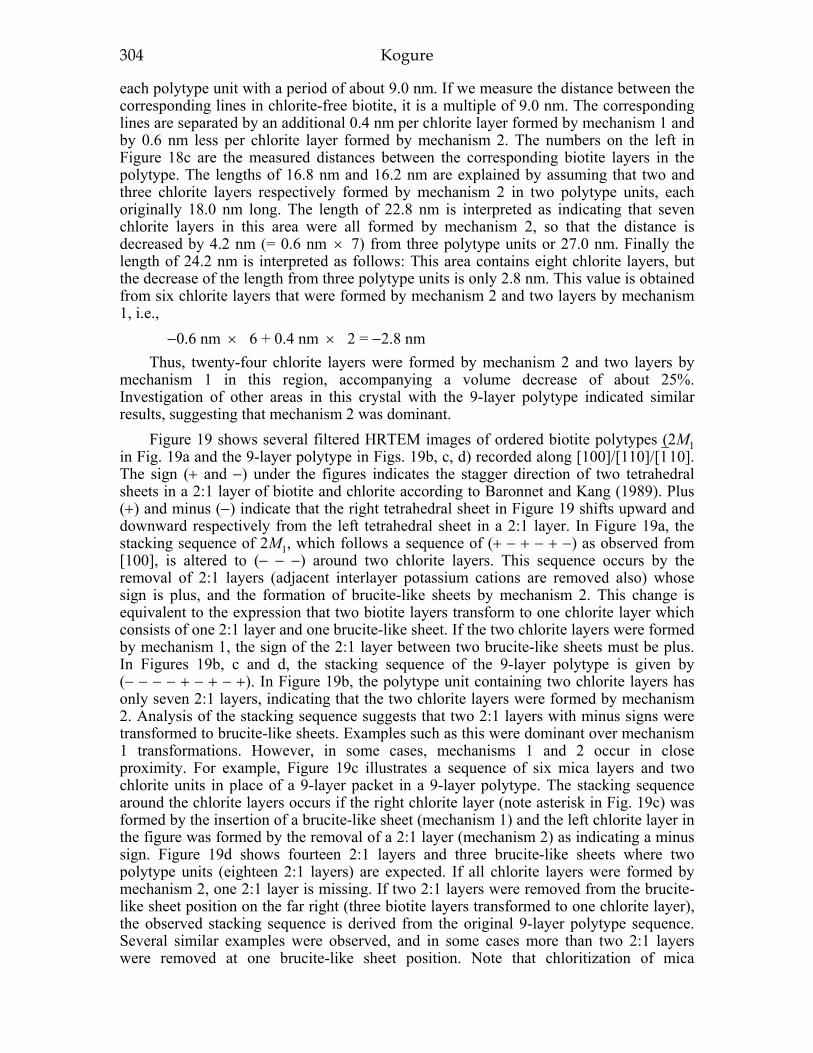
304 Kogure
each polytype unit with a period of about 9.0 nm. If we measure the distance between the corresponding lines in chlorite-free biotite, it is a multiple of 9.0 nm. The corresponding lines are separated by an additional 0.4 nm per chlorite layer formed by mechanism 1 and by 0.6 nm less per chlorite layer formed by mechanism 2. The numbers on the left in Figure 18c are the measured distances between the corresponding biotite layers in the polytype. The lengths of 16.8 nm and 16.2 nm are explained by assuming that two and three chlorite layers respectively formed by mechanism 2 in two polytype units, each originally 18.0 nm long. The length of 22.8 nm is interpreted as indicating that seven chlorite layers in this area were all formed by mechanism 2, so that the distance is decreased by 4.2 nm (= 0.6 nm × 7) from three polytype units or 27.0 nm. Finally the length of 24.2 nm is interpreted as follows: This area contains eight chlorite layers, but the decrease of the length from three polytype units is only 2.8 nm. This value is obtained from six chlorite layers that were formed by mechanism 2 and two layers by mechanism 1, i.e.,
−0.6 nm × 6 + 0.4 nm × 2 = −2.8 nm Thus, twenty-four chlorite layers were formed by mechanism 2 and two layers by
mechanism 1 in this region, accompanying a volume decrease of about 25%. Investigation of other areas in this crystal with the 9-layer polytype indicated similar results, suggesting that mechanism 2 was dominant.
Figure 19 shows several filtered HRTEM images of ordered biotite polytypes (2M1 in Fig. 19a and the 9-layer polytype in Figs. 19b, c, d) recorded along [100]/[110]/[1⎯10]. The sign (+ and −) under the figures indicates the stagger direction of two tetrahedral sheets in a 2:1 layer of biotite and chlorite according to Baronnet and Kang (1989). Plus (+) and minus (−) indicate that the right tetrahedral sheet in Figure 19 shifts upward and downward respectively from the left tetrahedral sheet in a 2:1 layer. In Figure 19a, the stacking sequence of 2M1, which follows a sequence of (+ − + − + −) as observed from [100], is altered to (− − −) around two chlorite layers. This sequence occurs by the removal of 2:1 layers (adjacent interlayer potassium cations are removed also) whose sign is plus, and the formation of brucite-like sheets by mechanism 2. This change is equivalent to the expression that two biotite layers transform to one chlorite layer which consists of one 2:1 layer and one brucite-like sheet. If the two chlorite layers were formed by mechanism 1, the sign of the 2:1 layer between two brucite-like sheets must be plus. In Figures 19b, c and d, the stacking sequence of the 9-layer polytype is given by (− − − − + − + − +). In Figure 19b, the polytype unit containing two chlorite layers has only seven 2:1 layers, indicating that the two chlorite layers were formed by mechanism 2. Analysis of the stacking sequence suggests that two 2:1 layers with minus signs were transformed to brucite-like sheets. Examples such as this were dominant over mechanism 1 transformations. However, in some cases, mechanisms 1 and 2 occur in close proximity. For example, Figure 19c illustrates a sequence of six mica layers and two chlorite units in place of a 9-layer packet in a 9-layer polytype. The stacking sequence around the chlorite layers occurs if the right chlorite layer (note asterisk in Fig. 19c) was formed by the insertion of a brucite-like sheet (mechanism 1) and the left chlorite layer in the figure was formed by the removal of a 2:1 layer (mechanism 2) as indicating a minus sign. Figure 19d shows fourteen 2:1 layers and three brucite-like sheets where two polytype units (eighteen 2:1 layers) are expected. If all chlorite layers were formed by mechanism 2, one 2:1 layer is missing. If two 2:1 layers were removed from the brucite-like sheet position on the far right (three biotite layers transformed to one chlorite layer), the observed stacking sequence is derived from the original 9-layer polytype sequence. Several similar examples were observed, and in some cases more than two 2:1 layers were removed at one brucite-like sheet position. Note that chloritization of mica

Investigations of Micas Using Advanced T E M 305
mmmmm
Figure 19. Filtered HRTEM images of ordered biotite polytypes containing a few chlorite layers, recorded down [100]/[110]/[1⎯10]. The unfiltered portions of the images are inserted around the center of (a) and (b). The signs at the bottom of each figure indicate the direction of lateral shift between two tetrahedral sheets in a 2:1 layer. The long square brackets in (b), (c) and (d) indicate 9-layer polytype units without chlorite layers. The signs in the parentheses are the shift directions of removed 2:1 layers via mechanism 2 (see text), expected from polytypic sequences in biotite. (Kogure and Banfield 2000).

306 Kogure
Figure 20. A HRTEM image of hydrobiotite. The interlayer regions indicated by arrows have a continuous white line contrast compared to adjacent biotite interlayer regions, suggesting that potassium is depleted in these interlayer regions. They are considered to be formed by the collapse of vermiculite layers (modified from Kogure and Murakami 1996).
accompanies a considerable volume decrease with release of silica and alkali ions. Biotite to vermiculite is a typical transformation of mica, occurring during weather-
ing (alteration at low temperatures). In vermiculite, the interlayer is occupied commonly by magnesium ions coordinated by H2O molecules with a larger interlayer volume than in biotite. The layer charge is decreased mainly by the oxidation of iron. In partially weathered biotite, biotite-vermiculite regular interstratification is often observed, which is called “hydrobiotite” (Gruner 1934). This mineral is identified by X-ray diffraction with a peak at 1.1-1.2 nm and a broad 2.5 nm peak. The d(001) value of vermiculite is about 1.5 nm owing to an expanded interlayer region, but it is generally collapsed to about 0.95 nm in vacuum during sample preparations by ion-milling or TEM observations. Thus, it is often difficult to distinguish the vermiculite layer from the biotite layer by a one-dimensional lattice fringe (Murakami et al. 1993). An exception was found by Banfield and Eggleton (1988) where they observed that the vermiculite interlayer was not collapsed. This collapsed vermiculite layer can be identified by recording structure images (Kogure and Murakami 1996). At a vermiculitized interlayer, the contrast from potassium dose not occur and adjacent tetrahedral sheets across the interlayer are staggered (Fig. 20). Careful examination also reveals that the (001) value of the vermiculite is slightly smaller than that of biotite. This biotite to vermiculite transition is formed via replacement of potassium ions by hydrated ions (Kogure and Murakami 1996). Mica transitions to kaolinite were also investigated using HRTEM (Ahn and Peacor 1987; Singh and Gilkes 1991). However, these results depend on simple one-dimensional lattice-fringe images and the atomic detail of the transition is not clear.
Another example involves planar defects found in biotite, which were probably formed by oxidation of biotite at high temperatures (Kogure and Nespolo 2000). The specimen used is oxybiotite from the Ruiz Peak ash flow, which was described above. Two kinds of planar defects were found, although they were not abundant in the specimen. The numbers of each defect observed are similar. One of the two defects is
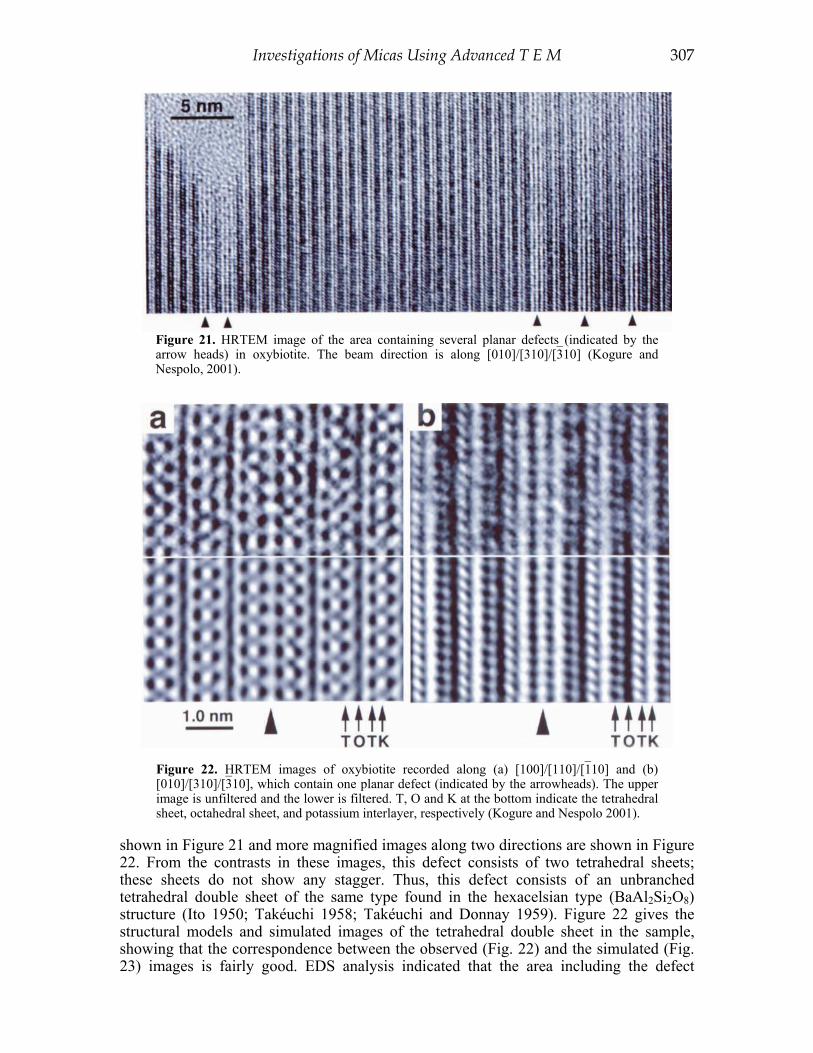
Investigations of Micas Using Advanced T E M 307
mmm Figure 21. HRTEM image of the area containing several planar defects (indicated by the arrow heads) in oxybiotite. The beam direction is along [010]/[310]/[3⎯10] (Kogure and Nespolo, 2001).
Figure 22. HRTEM images of oxybiotite recorded along (a) [100]/[110]/[1⎯10] and (b) [010]/[310]/[3⎯10], which contain one planar defect (indicated by the arrowheads). The upper image is unfiltered and the lower is filtered. T, O and K at the bottom indicate the tetrahedral sheet, octahedral sheet, and potassium interlayer, respectively (Kogure and Nespolo 2001).
shown in Figure 21 and more magnified images along two directions are shown in Figure 22. From the contrasts in these images, this defect consists of two tetrahedral sheets; these sheets do not show any stagger. Thus, this defect consists of an unbranched tetrahedral double sheet of the same type found in the hexacelsian type (BaAl2Si2O8) structure (Ito 1950; Takéuchi 1958; Takéuchi and Donnay 1959). Figure 22 gives the structural models and simulated images of the tetrahedral double sheet in the sample, showing that the correspondence between the observed (Fig. 22) and the simulated (Fig. 23) images is fairly good. EDS analysis indicated that the area including the defect

308 Kogure
mmmm
Figure 23. (a) Structural model and (b) simulated images of the planar defect (unbranched tetrahedral double sheet) within 1M biotite. Scherzer defocus (-42 nm) and the specimen thickness of 5 nm were used for the simulation (Kogure and Nespolo 2001).
is deficient in Mg and Fe and richer in Si and Al, supporting the proposed model (Kogure and Nespolo 2000). The other defect type is shown in Figure 24. From this image, the defect probably consists of three octahedral sheets which appear similar to that in the biotite structure. Because the information from the image was limited, the complete structure was not determined. This defect is characterized by excess Fe and Mg, and a deficiency of Si and Al, compared to surrounding biotite, by EDS analyses. In particular, the excess of Fe is greater than that of Mg. Better resolution of the image and chemical analyses are necessary to solve the atomic structure of the defect.
Figure 24. HRTEM image of the area which contain a planar defect, probably consisting of three octahedral sheets. The beam direction is along [010]/[310]/[3⎯10] (Kogure and Nespolo 2001).
An examination of the relationship between the planar defects and the polytypic features of the host biotite shows the formation mechanism of the defects. The period of the polytype unit including the tetrahedral double sheet is shortened relative to the period

Investigations of Micas Using Advanced T E M 309
Figure 25. Filtered HRTEM images of ordered polytypes containing planar defects. (a) 2M1 polytype containing the defect shown in Figure 21. (b) 3T polytype containing the defect shown in Figure 24. The beam direction is along (a) [110] and (b) [100] (orthohexagonal indexing) (Kogure and Nespolo 2001).
without the defect by about 0.2 nm and the period including the defect shown in Figure 24 is lengthened by about 1.0 nm (Fig. 25). From this result, the former defect was probably formed by the removal of an octahedral sheet from the biotite unit layer and the latter defect was formed by the insertion of a Fe/Mg-rich structure at an octahedral sheet in the biotite. Although electrical neutrality is maintained by oxidation of Fe2+ and dehydrogenation, it is obvious that locally Pauling's electrostatic valence rule (Pauling 1929) is not satisfied at the trioctahedral sheet with considerable amounts of trivalent cation and no vacancy sites. Consequently, the octahedral sheet in oxybiotite must be unstable, resulting in some structural changes around the octahedral sheet. The observed results are consistent with this hypothesis. In general, in oxidizing conditions at high temperature iron-rich biotite decomposes to K-rich feldspar (sanidine), magnetite (or hematite) and hydrogen gas components, via a biotite phase rich in ferric iron and poor in hydrogen, namely oxybiotite (Wones and Eugster 1965). This decomposition of biotite is probably initiated with the formation of the planar defects as shown in Figures 21 and 24. Probably after the density of the defects in biotite is increased to a certain level during the high-temperature oxidation process, the biotite structure decomposes and transforms to sanidine, and magnetite or hematite. If this hypothesis is correct, previous experimental studies devoted to biotite oxidation mechanisms employing the Mössbauer spectros-copy and/or X-ray diffraction (e.g., Ferrow 1987; Redhammer et al. 1993) should be

310 Kogure
reconsidered, because these bulk methods cannot detect the presence of these defects. It is also recommended to investigate the microstructure of synthetic oxybiotite before and near to the decomposition temperature by HRTEM.
CONCLUSION Advanced HRTEM can distinguish each Si-tetrahedral column along the beam
direction in silicates. Recent investigations of mica using HRTEM, including our studies as described above, have revealed various new structures of mica, which are not found using other techniques. Although their volume ratio in the specimen is often small, these new structures can give new insights for stabilities, crystal growth, transformations, and other various properties of mica. The specimens described above were mostly limited to biotite. Biotite was studied because it is a important rock-forming minerals. Also, this mica is sufficiently tolerant to electron radiation during HRTEM imaging. Other micas need to be investigated, although radiation-damage problems for HRTEM may be encountered. Mica and other phyllosilicates are really fascinating materials for HRTEM. Collaborations of electron microscopists and researchers who apply other techniques will bring many ideas and new results for this mineral group in the future.
ACKNOWLEDGMENTS I thank my colleague, Dr. Massimo Nespolo, National Institute for Material
Sciences, Japan for the intimate collaboration in the study of mica. I have learned so much from Professor Jillian F. Banfield, University of Wisconsin-Madison, through the collaboration with her during her stay at the University of Tokyo, Japan. I appreciate Professor Takashi Murakami and Osamu Tachikawa, Department of Earth and Planetary Science, Graduate School of Science, the University of Tokyo, Japan for supporting and encouraging my research. I also appreciate Professor Hiroshi Takeda, Chiba Institute of Technology, Japan and Professor Yoshio Takéuchi, Nihon University, Japan for valuable suggestions and discussions. I am grateful to Dr. Malcom Ross, U.S. Geological Survey, for providing the specimen. I thank Dr. Alain Baronnet, CRMC2-CNRS, Campus de Luminy, France for his suggestive reviews of many of our papers, including the present one. Finally I deeply thank Professor Stephen Guggenheim, University of Illinois at Chicago, and Dr. Paul H. Ribbe, the series editor of Reviews in Mineralogy and Geochemistry for making great efforts to improve the manuscript. Electron microscopy was carried out in the Electron Microbeam Analysis Facility of the Department of Earth and Planetary Science, the University of Tokyo.
REFERENCES Amouric M, Baronnet A (1983) Effect of early nucleation conditions on synthetic muscovite polytypism as
seen by high resolution transmission electron microcopy. Phys Chem Minerals 9:146-159 Amouric M, Baronnet A, Finck C (1978) Polytypisme et desordre dans les micas dioctaedriques
synthetiques: Etude par imagerie de reseau. Mater Res Soc Bull 13:627-634 (in French) Backhaus K-O, Durovic S (1984) Polytypism of micas. I. MDO polytypes and their derivation. Clays Clay
Miner 32:453-463 Bailey SW (1980) Crystal chemistry of true micas. Rev Mineral 13:13-60 Banfield JF, Eggleton RA (1988) Transmission electron microscope study of biotite weathering. Clays Clay
Minerals 36:47-60 Banfield JF, Murakami, T (1998) Atomic-resolution transmission electron microscope evidence for the
mechanism by which chlorite weathers to 1:1 semi-regular chlorite-vermiculite. Am Mineral 83:348-357
Baronnet A (1973) Sur les origines des dislocations vis et des spirales de croissance dans les micas. J Cryst Growth 19:193-198
Baronnet A (1980) Polytypism in micas: A survey with emphasis on the crystal growth aspects. In Current Topics in Materials Science Vol. 5, E Kaldis (ed) North-Holland Publishing Company, p 447-548

Investigations of Micas Using Advanced T E M 311
Baronnet A (1992) Polytypism and stacking disorder. Rev Mineral 27:231-288 Baronnet A, Kang ZC (1989) About the origin of mica polytypes. Phase Transitions 16/17:477-493 Bigi S, Brigatti MA (1994) Crystal chemistry and microstructures of plutonic biotite. Am Mineral 79:63-72 Buseck PR, Iijima S (1974) High resolution electron microscopy of silicates. Am Mineral 59:1-21 De Parseval P, Amouric M, Baronnet A, Fortune J, Moine B, Ferret J (1994) HRTEM study of the
chloritization of mica in the talc-chlorite deposit at Trimous (Pyrenees, France). Eur J Mineral 6:123-132
Drits VA, Zvyagin BB, Tokmakov PP (1966) Gümbelite—A dioctahedral mica 2M2. Trans (Dokl) Acad Sci SSSR: Earth Sci Section 170:156-159
Eggleton RA, Banfield JF (1985) The alteration of granitic biotite to chlorite. Am Mineral 70:902-910 Ferrow E (1987) Mössbauer and X-ray studies on the oxidation of annite and ferriannite. Phys Chem
Minerals 14:270-275 Ferry JM (1979) Reaction mechanisms, physical conditions, and mass transfer during hydrothermal
alteration of mica and feldspar in granitic rocks from South-Central Maine, USA. Contrib Mineral Petrol 68:125-139
Filut MA, Rule AC, Bailey SW (1985) Crystal structure refinement of anandite-2Or, a barium- and sulfur-bearing trioctahedral mica. Am Mineral 70:1298-1308
Giuseppetti G, Tadini C (1972) The Crystal Structure of 2O Brittle Mica: Anandite. Tschermaks mineral petrogr Mitt 18:169-184
Gruner JW (1934) The structures of vermiculites and their collapse by dehydration. Am Mineral 19:557-575
Horiuchi S, Matsui Y, Bando Y (1976) A high resolution lattice image of Nb12O29 by means of a high voltage electron microscope newly constructed. Japan J Appl Phys 15:2483-2484
Iijima S, Buseck PR (1978) Experimental study of disordered mica structure by high-resolution electron microscopy. Acta Crystallogr A34:709-719
Iijima S, Zhu J (1982) Muscovite-biotite interface studied by electron microscopy. Am Mineral 67:1195-1205
Ito T (1950) X-ray studies on polymorphism. Maruzen Co., Tokyo, 231 p Kilaas R (1998) Optical and near-optical filters in high-resolution electron microscopy. J Microsc 190:45-
51 Kogure T, Banfield JF (1998) Direct identification of the six polytypes of chlorite characterized by semi-
random stacking. Am Mineral 83:925-930 Kogure T, Banfield JF (2000) New insights into biotite chloritization mechanism via polytype analysis. Am
Mineral 85:1202-1208 Kogure T, Bunno M (1998) Microstructure of nemalite, fibrous iron-bearing brucite. Mineral J 20:127-133 Kogure T, Murakami T (1996) Direct identification of biotite/vermiculite layers in hydrobiotite using high-
resolution TEM. Mineral J 18:131-137 Kogure T, Nespolo M (1999a) First finding of a stacking sequence with (±60°, 180°) rotation in biotite.
Clays Clay Minerals 47:784-792 Kogure T, Nespolo M (1999b) A TEM study of long-period mica polytypes: determination of the stacking
sequence of oxybiotite by means of atomic-resolution images and Periodic Intensity Distribution (PID). Acta Crystallogr B55:507-516
Kogure T, Nespolo M (2001) Atomic structures of planar defects in oxybiotite. Am Mineral 86:336-340 Konishi H, Akai J (1990) HRTEM observation of new complex polytype of biotite from dacites in
Higashiyama hills, Niigata, central Japan. Clay Sci 8:25-30 Mauguin MCH (1928) Etude de Micas au moyen du rayons X. Bull Soc fr Minéral Cristallogr 51:285-332 Menter JW (1956) The direct study by electron microscopy of crystal lattices and their imperfections. Proc
R Soc London A236:119 Murakami T, Sato T, Wartanabe T (1993) Microstructure of illite/smectite at 123K: A new method for
HRTEM examination. Am Mineral 78:465-468 Nespolo M (1999) Analysis of family reflections of OD mica polytypes, and its application to twin
identification. Mineral J 21:53-85 Nespolo M, Kogure T (1998) On the indexing of 3T mica polytype. Z Kristallogr 213:4-12 Ni Y, Hughes JM (1996) The crystal structure of nanpingite-2M2, the Cs end-member of muscovite. Am
Mineral 81:105-110 Oikawa T, Ogura N, Hosokawa F, Inatsuki K, Honda T, Ishida Y (1994) Application of 25 μm-Pixel
Imaging Plate. Abstr Int’l Conf Electron Microscopy 13-Paris, p 223-224 Olives J, Amouric M (1984) Biotite chloritization by interlayer brucitization as seen by HRTEM. Am
Mineral 69:869−871 Pan M, Crozier PA (1993) Low-dose high-resolution electron-microscopy of zeolite materials with a slow-
scan CCD camera. Ultramicroscopy 48:332-340

312 Kogure
Pauling L (1929) The principles determining the structure of complex ionic crystals. J Am Chem Soc 51:1010-1026
Penn RL, Banfield JF (1998) Imperfect oriented attachment: dislocation generation in defect-free nanocrystals. Science 281:969-971
Ramsdell LS (1947) Studies on silicon Carbide. Am Mineral 32:64-82 Redhammer GJ, Beran A, Dachs E, Amthauer G (1993) A Mössbauer and X-ray diffraction study of
annites synthesized at different oxygen figacities and crystal chemical implications. Phys Chem Minerals 20:382-394
Ross M, Takeda H, Wones DR (1966) Mica polytypes: Systematic description and identification. Science 151:191-193
Sasaki Y, Suzuki T, Ikuhara, Y (1995) Direct observation of channel structures in zeolite Y and A with a slow-scan charge-coupled-device camera. J Am Ceram Soc 78:1411-1413
Smith JV, Yoder HS (1956) Experimental and theoretical studies of the mica polymorphs. Mineral Mag 31:209-235
Spence JCH (1981) Experimental High-resolution Electron Microscopy. Oxford: Clarendon Press, 370 p Sunagawa I, Koshino Y, Asakura M, Yamamoto T (1975) Growth mechanism of some clay minerals.
Fortschr Mineral 52:217-224 Szot J, Hornsey R, Ohnishi T, Minagawa S (1992) Focused ion beam micromachining for transmission
electron microscopy specimen preparation of semiconductor laser diodes. J Vac Sci Technol B10:575-579
Takeda H (1967) Determination of the layer stacking sequence of a new complex mica polytype: A 4-layer lithium fluorophlogophite. Acta Crystallogr 22:845-853
Takeda H, Sadanaga R (1969) New unit layers for micas. Mineral J 5:434-449 Takeda H, Ross M (1995) Mica polytypism: Identification and origin. Am Mineral 80:715-724 Takéuchi Y (1958) A detailed investigation of the structure of hexagonal BaAl2Si2O8 with reference to its
α–β inversion. Mineral J 2:311-332 Takéuchi Y, Donnay G (1959) The crystal structure of hexagonal CaAl2Si2O8. Acta Crystallogr 12:465-470 Tomura S, Kitamura M, Sunagawa I (1978) High resolution electron microscopy of dioctahedral mica.
Mineral J 9:129-136 Urban K, Kabius B, Haider M, Rose H (1999) A way to higher resolution: spherical aberration correction
in a 200kV transmission electron microscope. J Electron Microsc 48:821-826 Veblen DR, Ferry JM (1983) A TEM study of the biotite-chlorite reaction and comparison with petrologic
observations. Am Mineral 68:1160-1168 Wones DR, Eugster HP (1965) Stability of biotite: Experiment, theory, and application. Am Mineral
50:1228-1272 Xu H, Veblen DR (1995) Periodic and nonperiodic stacking in biotite from the Bingham Canyon porphyry
copper deposit, Utah. Clays Clay Minerals 43:159-173 Yanaka T, Moriyama K, Buchanan R (1989) A new ultra-high resolution TEM, EM-002B, with a unique
UHR objective lens configuration. Proc Mater Res Soc Symp 139:271-276 Zhukhlistov AP, Zvyagin BB, Soboleva SV, Fedotov AF (1973) The crystal structure of the dioctahedral
mica 2M2 determined by high voltage electron diffraction. Clays Clay Minerals 21:465-470 Zvyagin BB (1967) Electron diffraction analysis of clay mineral structures. New York: Plenum Press, 364
p Zvyagin BB (1988) Polytypism of crystal structures. Comput Math Appl 16:569-591 Zvyagin BB, Vrublevskaya ZV, Zhukhlistov AP, Sidorenko OV, Soboleva SV, Fedotov AF (1979) High-
voltage Electron Diffraction in the Study of Layered Minerals. Moscow: Nauka Press, 224 p (in Russian)

1529-6466/02/0046-0006$05.00 DOI:10.2138/rmg.2002.46.06
6 Optical and Mössbauer Spectroscopy of Iron in Micas M. Darby Dyar
Department of Earth and Environment Mount Holyoke College
South Hadley, Massachusetts 01075 [email protected]
INTRODUCTION The spectroscopic study of iron in micas is generally focused on one or both of two
goals: determination of the relative amounts of Fe2+ and Fe3+ present, and assessment of the distribution of those ions among the one tetrahedral and two octahedral sites in the mica structure. Historically, nine different means have been used to address these goals: wet chemistry, optical, Mössbauer (MS), synchrotron X-ray absorption near-edge (XANES), X-ray photoelectron (XPS), and electron energy-loss spectroscopies (EELS), electron microprobe (EPMA), indirect calculation methods, and X-ray diffraction structure refinements (SREF). Sample requirements for all these techniques vary from the need for oriented, doubly-polished single grains to large quantities of homogeneous powder. Bulk sample analysis (milligram and larger masses) requires significant analyst skills, is done reliably at relatively few laboratories and has been controversial (particularly with the Mössbauer community). Measurements at the scale of microbeam analysis (picogram) have historically yielded inconsistent results (in the case of electron microprobe or indirect calculation methods) or have been until very recently confined to a few experimental studies. Because of these problems and the dichotomy of scale between the available analytical techniques, the importance of oxidation state measurements has often been ignored during the last 40 years despite (and in some cases, because of) the efforts of the spectroscopic community. However, the ability to measure the oxidation states and site occupancies of Fe in micas, particularly at micrometer scales, has long been a necessity for mineralogists, petrologists, and geochemists.
In this paper, existing work on the primary spectroscopic methods for studying Fe in micas is discussed and reviewed. Other techniques will not be covered in detail here for a variety of reasons:
Site assignments for Fe and other cations can be made using structure refinements based upon X-ray diffraction studies, and that subject is well reviewed by other papers in this volume (Brigatti and Guggenheim, this volume; Ferraris, this volume).
Although wet chemical techniques are the methods of choice for high precision results when abundant, homogeneous samples are available, opinions about optimal procedures vary (Whipple 1968) and the majority of wet chemical analyses of micas have already been reviewed thoroughly by Foster (1960, 1964). An excellent overview of the Pratt and Wilson wet chemical methods, showing the former method to be more accurate when compared to Mössbauer results, is given in Lalonde et al. (1998).
Electron microprobe microscale Fe3+/ΣFe was first attempted by Albee and Chodos (1970), who studied Fe Lα/Lβ X-ray line ratios, but they realized that the wavelength dispersive system on their probe fell significantly short of the (~1 eV) energy resolution needed to discriminate the valence related effects. Since that pioneering work, many others have tried to push the current technology for the electron probe to produce Fe3+/ΣFe. Höfer et al. (1994) provided consistent Fe3+/ΣFe for a limited suite of garnet samples, but uncertainties about changes in soft X-ray line shapes and other artifacts of

314 Dyar
light element analysis as a function of site coordination are not addressed in that study (cf. Bastin and Heijligers 1991). Furthermore, as noted by Raeburn et al. (1993), the presence of hydroxyl ligands may eliminate differences between Fe3+ and Fe2+ with this method. Most importantly, the fundamental drawback of electron probe Fe3+/ΣFe data remains the constraint that WDS monochromator crystals achieve at best 6-20 eV resolution. Such resolution is insufficient to resolve the X-ray line energy changes (1-3 eV) that result from changes in oxidation state.
XANES work on micas is discussed by Mottana et al. (this volume), Tombolini et al. (2002), Dyar et al. (2001), and briefly in the Appendix, though comparisons of Fe3+/ΣFe results from this technique with other methods will bear further discussion in this chapter.
There have been few XPS studies of micas. However, a set of key papers by Raeburn et al. (1997a,b) demonstrated the untility of this technique for measuring Fe3+/ΣFe in thin sections. Accordingly, an Appendix is provided here to point the reader toward key references in this field, and comparions of XPS studies with results of other methods will be presented.
Recent advances in instrumentation have made possible the study of FeL2,3 spectra via the techniques of EELS and the related technique of energy-loss near-edge spectroscopy (ELNES). Although work applying this technique to the study of micas has not yet been published, such studies are no doubt imminent, so a few key references to this method are included in the Appendix.
Finally, the indirect method of estimating Fe3+ and Fe2+ in micas based upon perfect stoichiometry is fraught with problems. In principle, this method ought to work for mineral species for which the identity and abundance of every element present can be determined accurately and precisely. However, ALL errors associated with each element analyzed propagate through the calculation scheme onto the calculated Fe3+/ΣFe, and can result in physically meaningless results (e.g., negative abundances of Fe3+). Relevant error estimates are seldom quoted in such studies! The problem is exacerbated in micas because invariant H contents must be assumed, despite the well-documented non-stoichiometry of H in such standard references as Deer et al. (1992). Furthermore, such Fe3+ recalculation schemes are especially strongly influenced by their dependence on measured SiO2 content because: (1) Si typically contributes 30-60% of the total cation content, so its standard deviation contributes a large amount of the total uncertainty in the analysis; (2) Si4+ is a highly charged cation, so even small errors in its abundance are amplified by a factor of four or more, when applied to the variation of Fe3+/ΣFe on calculated total charge; and (3) although the apparent precision of Si determinations by electron microprobe often appears excellent when considered in terms of X-ray counting statistics, the accuracy of the measurements is often less good and can be a major source of error in Fe3+ determinations unless very carefully addressed (Delaney et al. 1998).
In this paper, the optical and Mössbauer spectroscopic techniques for measuring Fe2+ and Fe3+ and determining their site occupancies will be examined. For each of these methods, an overview of practice and theory will be presented. Although there have been other reviews of optical spectroscopy (Rossman 1984) and Mössbauer spectroscopy (Kalinchenko et al. 1973; Ericsson et al. 1977; Heller-Kallai and Rozenson 1981; Pollack and Stevens 1986; Dyar 1987; Redhammer 1998; Murad 1998; Rancourt 1998), emphasis here is on historical and international inclusiveness, and discussion is restricted to micas rather than to the broader topic of clay minerals. Because they predate the other methods, optical studies will be discussed here first, followed by a discussion of the Mössbauer studies that constitute the majority of spectroscopic studies of mica. XPS and EELS spectroscopies are discussed in the Appendix, as they represent emerging technologies
Optical and Mössbauer Spectroscopy of Iron in Micas 315
for analyzing Fe in micas. At the end of this paper, a comparison of Mössbauer, XPS, XANES, and wet chemical results will be presented to provide a context for discussion of the different technique’s advantages and disadvantages.
The goals of this work are to characterize recent technological advances, review existing literature, and speculate on future contributions of each of the types of spectroscopy used to study Fe in micas. It is hoped that this review will allow the reader to evaluate the advantages and disadvantages of all these spectroscopic methods, and facilitate informed choices of appropriate techniques for future work.
OPTICAL SPECTROSCOPY The original studies of optical spectra of micas arose from an interest in the variable
colors of muscovite and phlogopite (e.g., Hall 1941), which formed the basis for commercial classification of their electrical properties. However, subsequent research has used optical spectroscopy to delve into the assignment of Fe2+ and IVCT bands, as well as the issue of the site occupancy of Fe3+ and its effect on color and pleochroism. Current instrumentation
A detailed description of the instrumentation for optical spectroscopy can be found in Rossman (1988), but a brief update is provided here because the technology is moving very rapidly in this area. The conventional scanning, phototube system described in Rossman (1988) is still available, made by a variety of companies including Varian, Hewlett-Packard, Perkin Elmer, and Shimadzu, and complete systems at this writing cost between 20,000 and 40,000 US dollars, depending on the system and, particularly, on the wavelength range covered. Also, a number of companies such as Acton/Roper, Labsphere, and Oriel Optics make components that the user can assemble into a spectrometer. In some cases, the companies will assemble the components into a complete system. However, these systems are now only a part of the total picture. Medium resolution PC card spectrometers, such as the unit built by Ocean Optics, are also available; they work with fiber optics and are quite modest in price: just a few thousand dollars (U.S.) for the basic spectrometer. The newest spectrophotometers are making a transition from scanning instruments to array (1-D and 2-D) systems with diode arrays and CCD arrays (2-D, but they can be used as a 1-D detector as well); the latter are very sensitive. In the near future, spectrophotometers using tunable laser technology will be available (e.g., Wang et al. 1998).
Some drawbacks remain with the commercial packages, however. Packages for anisotropic measurements are not currently available, and most of the polarization accessories available from the major companies are film polarizers that are not useful. Furthermore, only a few of the commercial systems (such as the one made by Jobin Yvon, Inc.) work in the NIR. Most basic systems are designed for silicon detectors that go from about 200-1150 nm (G.R. Rossman, pers. comm. 2000). For this reason, astute users are well served to build their own equipment.
There is, at this writing, no method for determining quantitative site occupancies or total cation contents from optical spectra, because the ε value from Beer’s law is unknown for micas. Prospects for such calculations are doubtful because the ε value would have to be studied in detail across a range of mica compositions and concentrations to be useful, and sample preparation for mica spectroscopy is difficult. A typical procedure for obtaining spectra of two vibration directions in a mica is as follows. Each mica crystal must be oriented with its cleavage perpendicular to a glass thin section, and then UV-hardening epoxy is used to maintain it in that geometry. After hardening, the mica + epoxy blob is then removed from the thin section, and two mutually parallel

316 Dyar
faces are polished on each sample perpendicular to cleavage (preferably in a known orientation relative to a and b). Sample thickness must generally be less than 100 μm. It is not surprising that most workers have studied micas using cleavage plates, thus potentially missing useful information that is obtained when light can be polarized parallel to c. Review of existing work
Commercial use of micas as mechanical and electrical insulators provoked one of the first definitive studies of color in mica by Judd (1945). He visually quantified a lightness index (based on absorption coefficient) and a hue index to distinguish between ruby and non-ruby muscovites. Although ultimately Dhar et al. (1959) proved that there is little correlation among visual properties and resistivity, interest in mica spectroscopy continued around the world. In 1948, Melankholin (1948) obtained the first absorption curves for micas, and ascribed their colors to the presence of iron in both the octahedral and tetrahedral sites. Optical spectra of muscovite by Popper (1951) and Dobrowolski (1959) documented the position of the UV absorption edge, and Grum-Grzhimaylo et al. (1955) observed that the intensities of the Fe bands were not linearly related to FeO and Fe2O3 contents. Ruthberg et al. (1963) determined that lines at 440 and 580 nm could be used to quantitatively distinguish between green and pink mica colors. At around the same time, Finch (1963) reported polarized absorption spectra of the two vibration directions in muscovite, and refined Ruthberg et al.’s (1963) color scheme by using a ratio of optical densities at 495 nm (green) and 680 nm (red) to describe color quantitatively. Marfunin et al. (1967) reported a biotite spectrum with bands at 1031, 833, 625, 476, 457, and 403 nm.
Figure 1. Visible region spectrum of green phlogopite with only octahedral Fe3+ and Fe2+, compared with reddish-brown phlogopite with [4]Fe3+, [6]Fe3+, and [6]Fe2+, replotted from Grum-Grzhimaylo and Rimskaya-Korsakova (1964). Spectra are taken from two orientations of a (001) cleavage flake, with the beam polarized in the plane of β and γ. Note that the band at 442 nm is present in both spectra, so it can be assigned to [6]Fe3+. These spectra also have bands assigned by several subsequent workers to [4]Fe3+ at 380, 400, 490, and 535 nm, and to [6]Fe2+ at 870 and 1100 nm.
Emphasis soon shifted to understanding the site assignments of the bands observed. A pioneering paper by Grum-Grzhimaylo and Rimskaya-Korsakova (1964; translated in1965) compared two phlogopites for which chemical analysis indicated the presence and absence of [4]Fe3+. A green phlogopite with only octahedral Fe2+ and Fe3+ was contrasted with a reddish-brown tetra-ferriphlogopite (Fig. 1). They noted the

Optical and Mössbauer Spectroscopy of Iron in Micas 317
resemblance between their tetra-ferriphlogopite spectra and those of [4]Fe3+ in orthoclase and correctly assigned the bands at 400, 490, and 530 nm to [4]Fe3+. Similar assignments were confirmed by Faye and Hogarth (1969; Table 1). This subject was later carefully studied by Pavlishin et al. (1978), who published spectra of micas with [4]Fe3+ peaks at 525-530 nm, 493-494 nm, 436-447 nm, and 400 nm. Most recently, unpublished work by Dyar and Rossman (in preparation) determined via comparison with Mössbauer spectra of a suite of Fe-rich micas that the peak at 440 nm must be assigned to [6]Fe3+ because it is present in many samples that lack [4]Fe3+. However, the peaks surrounding it at 385, 405, 455, 490, and 520 nm must arise from [4]Fe3+.
Table 1. Peak assignments in optical spectra of Fe in micas.
Position (cm-1) Position (nm) Assignment Citation(s) 50,000 212 O-Fe3+CT 7 41,320 242 [M]Fe3+ or Fe2+-Mg CT? 7 36,360 275 [M]Fe2+, [4]Fe3+, or [M]Fe2+-[M]Ti CT? 7 27,250 367 [M]Fe3+ 2, 7, 18 26,600 376 [M]Fe3+ 2, 3, 7 26,315 380 [4]Fe3+ or [M]Fe2+ 7, 14, 19 24,875 402 [M]Fe2+ 7, 8, 14, 19 24,690 405 [M]Fe3+ or [M]Fe2+ 1, 3, 7, 11, 12 23,525 425 [M]Fe2+-[M]Ti CT? 7, 8 22,600 442 [M]Fe3+ or [4]Fe3+ or [M]Fe3+ 2, 4, 7, 9, 11, 14, 15, 19 22,000 455 [M]Fe2+ or [M]Fe3+ or [4]Fe3+ 3, 5, 7, 14, 17, 19 20,750 482 [M]Fe3+ or [M]Fe3+ 7, 9, 17 20,400 490 [M]Fe3+ or [4]Fe3+ 1, 4, 11, 12, 14, 15, 17, 18, 19 19,650 509 [M]Fe3+ or [4]Fe3+ 1, 2, 4, 7, 9, 11, 14, 15, 18 17,120 585 [M]Fe3+ or [4]Fe3+ 2, 3, 7, 9, 12, 18, 19 14,300 700 [M]Fe3+ 2, 14, 18, 19 14,000 714 Fe2+-Fe3+ IVCT or single ion Fe2+ 3, 4, 5, 6, 7, 8, 10, 12, 13, 14, 18, 19 11,350 880 [M]Fe2+ 2, 4, 5, 6, 7, 8, 12, 13,14, 15, 18, 19 9,300 1,075 M]Fe2+ 2, 4, 5, 6, 7, 8, 12, 13, 14, 15, 18, 19 ———————————————————————————————————————————— 1Grum-Grzhimaylo and Rimskaya-Korsakova(1964); 2Faye (1968a); 3Faye (1968b); 4Faye and Hogarth (1969); 5Manning (1969); 6Robbins and Strens (1972); 7Karickhoff and Bailey (Karickhoff and Bailey, 1973); 8Sekino et al. (1975); 9Richardson (1975; 1976); 10Smith (1977); 11Pavlishin et al. (1978); 12Klein and Lehmann (1979); 13Smith et al. (1980); 14Bakhtin (1980); 15Farmer and Boettcher (1981); 16Finch et al. (1982); 17Bakhtin et al. (1986), 18Zhe et al. (1986); and 19Dyar and Rossman (in preparation). Note that for purposes of clarity this is only a partial compilation.
Faye (1968a) was the first to interpret the bands observed in mica spectra in terms of
ligand field theory. He assigned the broad bands at 862 (5Eg) and 1053 nm (5Eg) to [6]Fe2+ and peaks at 365 (4E), 376 (4T2), 442 (4A1
4E), 509 (4T2), 571 (4T2), and 680 nm (4T1) to [6Fe3+, and tentatively assigned these transitions to specific states as noted. In a later paper (Faye 1968b), biotite spectra were used to suggest the presence of a highly polarized intervalence charge transfer band at 714 nm (Fig. 2). These conclusions were further supported by the work of Robbins and Strens (1972) and Karickhoff and Bailey (1973). Low temperature optical spectra of micas were collected by Smith (1977) in order to evaluate the temperature dependence of the band at 715 nm. They observed that its intensity nearly doubles at liquid helium temperatures, suggesting thermal depopulation
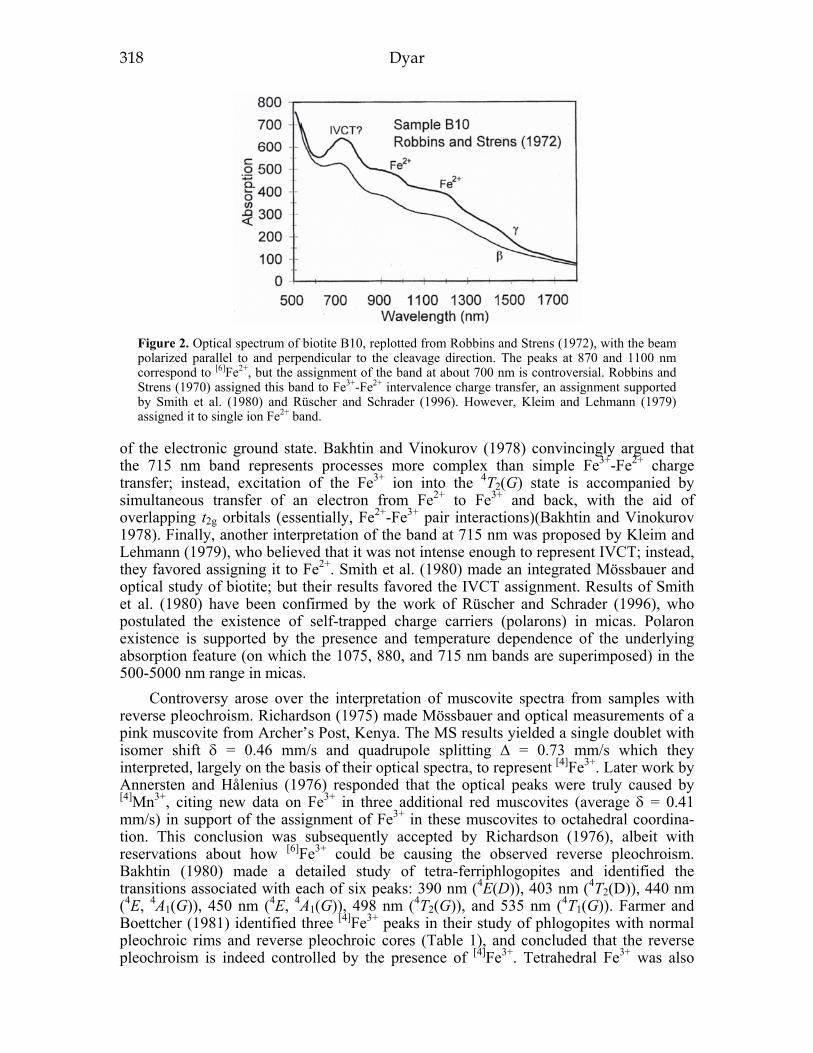
318 Dyar
Figure 2. Optical spectrum of biotite B10, replotted from Robbins and Strens (1972), with the beam polarized parallel to and perpendicular to the cleavage direction. The peaks at 870 and 1100 nm correspond to [6]Fe2+, but the assignment of the band at about 700 nm is controversial. Robbins and Strens (1970) assigned this band to Fe3+-Fe2+ intervalence charge transfer, an assignment supported by Smith et al. (1980) and Rüscher and Schrader (1996). However, Kleim and Lehmann (1979) assigned it to single ion Fe2+ band.
of the electronic ground state. Bakhtin and Vinokurov (1978) convincingly argued that the 715 nm band represents processes more complex than simple Fe3+-Fe2+ charge transfer; instead, excitation of the Fe3+ ion into the 4T2(G) state is accompanied by simultaneous transfer of an electron from Fe2+ to Fe3+ and back, with the aid of overlapping t2g orbitals (essentially, Fe2+-Fe3+ pair interactions)(Bakhtin and Vinokurov 1978). Finally, another interpretation of the band at 715 nm was proposed by Kleim and Lehmann (1979), who believed that it was not intense enough to represent IVCT; instead, they favored assigning it to Fe2+. Smith et al. (1980) made an integrated Mössbauer and optical study of biotite; but their results favored the IVCT assignment. Results of Smith et al. (1980) have been confirmed by the work of Rüscher and Schrader (1996), who postulated the existence of self-trapped charge carriers (polarons) in micas. Polaron existence is supported by the presence and temperature dependence of the underlying absorption feature (on which the 1075, 880, and 715 nm bands are superimposed) in the 500-5000 nm range in micas.
Controversy arose over the interpretation of muscovite spectra from samples with reverse pleochroism. Richardson (1975) made Mössbauer and optical measurements of a pink muscovite from Archer’s Post, Kenya. The MS results yielded a single doublet with isomer shift δ = 0.46 mm/s and quadrupole splitting Δ = 0.73 mm/s which they interpreted, largely on the basis of their optical spectra, to represent [4]Fe3+. Later work by Annersten and Hålenius (1976) responded that the optical peaks were truly caused by [4]Mn3+, citing new data on Fe3+ in three additional red muscovites (average δ = 0.41 mm/s) in support of the assignment of Fe3+ in these muscovites to octahedral coordina-tion. This conclusion was subsequently accepted by Richardson (1976), albeit with reservations about how [6]Fe3+ could be causing the observed reverse pleochroism. Bakhtin (1980) made a detailed study of tetra-ferriphlogopites and identified the transitions associated with each of six peaks: 390 nm (4E(D)), 403 nm (4T2(D)), 440 nm (4E, 4A1(G)), 450 nm (4E, 4A1(G)), 498 nm (4T2(G)), and 535 nm (4T1(G)). Farmer and Boettcher (1981) identified three [4]Fe3+ peaks in their study of phlogopites with normal pleochroic rims and reverse pleochroic cores (Table 1), and concluded that the reverse pleochroism is indeed controlled by the presence of [4]Fe3+. Tetrahedral Fe3+ was also

Optical and Mössbauer Spectroscopy of Iron in Micas 319
reported by Il’chenko et al. (1990), Yao et al. (1993), and Khomenko (1994). The work of Khomenko and colleagues focused on integrating optical spectroscopy
into broader work within a geologic or petrologic context. These papers included Khomenko et al. (1988), who correlated color with different types of granite complexes, Khomenko et al. (1991), who related biotite color to magmatic evolution in the Volynsky megablock complex, Ukranian Shield, and Khomenko et al. (1994), who correlated oxygen fugacity with optical bands.
Optical spectra of clintonite are quite similar to those of the di- and trioctahedral micas (Fig. 3). Manning (1969) observed the [6]Fe2+ bands at 1110 nm and 833 nm and the IVCT band at 680 nm. Sekino et al. (1975) observed the same bands, as well as peaks at 395 and 448 nm, which he attributed (after the work of Faye) to [6]Fe2+. Work on clintonite from Crestmore, California by Dyar and Rossman (in preparation) found similar peaks to those of previous workers, but by virtue of correlation with Mössbauer peaks, assigned the latter two peaks to [4]Fe3+ (Fig. 4).
Figure 3 (upper). The optical spectrum of clintonite from the Doshinkubo ore deposit in Saita-ma, Japan, replotted from Sekino et al. (1975). This clintonite has only octahedral Fe3+ and Fe2+. Figure 4 (lower). Peak positions of the lower (y axis) and upper (x axis) velocity peaks that com-prise the tetrahedral Fe3+ doublet in biotiite, muscovite, and clin-tonite. A plot with some of these data was interpreted by Rancourt (1992) to suggest that different fields occur for true and brittle micas, but the addition of more recent data blurs this distinction, making it arbitrary. Data from A: Manpov & Sitdikov (1974) B: Ericsson et al. (1977) C: Sanz et al. (1978) D: Shinno & Suwa (1981) E: Smith et al. (1983) F: Dyar & Burns (1986) G: Longworth et al. (1987) H: Ferrow (1987a) I: Homonnay et al. (1988) J: Redhammer et al. (1995) K: Cruciani et al. (1995) L: Pietzsch & Schmidt (1990) M: Daynyak et al. (1984a,b) N: Annersten & Olesch (1978)
Other papers incorporating optical data on micas included Seal et al. (1981), who characterized giant radiohaloes in biotite; Finch et al. (1982), who coupled Mössbauer data with their earlier work correlating color with optical properties; and Bakhtin et al. (1986), who also integrated Mössbauer and optical work on micas. Smith et al. (1983) studied manganese-bearing phlogopites and identified bands associated with [6]Fe3+-[6]Mn2+ transitions. Zhe et al. (1986) reported data on heat-treated muscovite and phlogopite, as did Rudenko and Sakharov (1989).
320 Dyar
Summary After extended work, the consensus of workers is that assignment of the bands at 880
and 1075 nm to [6]Fe2+; at 385, 405, 455, 490, and 520 nm to [4]Fe3+; and at 440 nm to [6]Fe3+ are robust. The exact mechanism responsible for the Fe2+-Fe3+ CT or Fe2+-Fe3+ pair interaction or single ion Fe2+ band at 700 nm is still a matter of debate, though the latter explanation seems to be favored by the most recent papers (e.g., Rüscher and Schrader 1996). In the next decades, further studies of small polaron absorption in micas should continue to shed light on the interpretation of the lower energy region of the visible spectrum.
MÖSSBAUER SPECTROSCOPY (MS) The first Mössbauer spectra of a mica were published by Pollak et al. (1962), and
since then more than 250 studies have used this method to examine site occupancy and valence state of iron in a wide range of mica compositions, with the results related to everything from petrologic studies to physical properties. Recent advances in this field have been made in the following areas: instrumentation, recoil-free fraction effects, thickness effects, texture effects, and fitting techniques. Accordingly, each of these topics wil be discussed briefly here, followed by a discussion of the literature on the Mössbauer effect in micas, arranged by mica sub-group. Current instrumentation
Although the focus of this paper is on the results of spectroscopic studies of Fe in micas, several new advances in the technology for Mössbauer spectrometers are worth mentioning because they will impact future mica studies. At the present time, there are only three manufacturers of commercial spectrometers: Web Research Co., WissEl-Wissenschaftliche Elektronik GmbH, and FAST ComTec GmbH. The basic gamma counting hardware and velocity control hardware are all very similar (Kr gas counters, PC based data acquisition and linear electric motors), but there are many variations on this “standard” unit, e.g. Conversion Electron detectors, resonant detectors, etc. for special applications. Low and high temperature systems and high field systems are also readily available.
Highly specialized spectrometers are also in use. The Mössbauer milliprobe developed by Catherine McCammon at Universität Bayreuth has the capability to measure spectra on absorbers with diameters smaller than 500 μm (McCammon 1994), providing the potential for measurements on samples with extremely small grain sizes. Mössbauer technology has been adapted for inclusion on martian landers (Klingelhofer et al. 1995) including the Mars 2003 Rovers, where it is hoped that clay minerals may be characterized. At the University of Michigan, a wide-angle Mössbauer spectrometer design using 77 argon gas proportional counters has the capability for analyzing extremely small samples with very low iron contents at count rates 100 times those of conventional units (Moon et al. 1996). This unit holds great promise for the analysis of muscovites and other low-iron micas. Recoil-free fraction effects
The area of the peaks in each Mössbauer doublet roughly corresponds to the amount of Fe actually present in that site (in fact, this is often assumed), but with some caveats. The first of these is the effect of differential recoil by Fe atoms in different sites. It is well-known that the area of a Mössbauer doublet (pair of peaks) is a function of peak width Γ, sample saturation G(x), and the Mössbauer recoil-free fraction f. Bancroft (1969; 1973) uses the following formulations for area ratios in a mineral where there is only a single site for Fe, and it may be occupied by either Fe3+ or Fe2+:

Optical and Mössbauer Spectroscopy of Iron in Micas 321
C = [Γ(Fe3+) + f (Fe3+) + G(X)(Fe3+)] / [Γ(Fe2+) + f (Fe2+) + G(X)(Fe2+)] A(Fe3+)/A(Fe2+) = C [N(Fe3+)/N(Fe2+)]
N is the “true” amount of each species and C is the “correction factor. So the degree of correspondence between peak areas and actual Fe occupancy depends on three assumptions, namely that (1) the linewidths of the Fe2+ and Fe3+ peaks are the same; (2) saturation corrections are unnecessary if samples are correctly prepared as thin absorbers (Rancourt et al. 1993a), and (3) the amount of recoil-free fraction for both Fe2+ and Fe3+ in those sites is the same. The equal linewidth assumption is only reasonable in end members, but most fitting routines can allow linewidths to vary. Thickness corrections can also be dealt with (see below). Recoilless fractions depend greatly on local bond strengths and angles (Hawthorne 1988), and thus different values of f are likely in cases where two sites have radically different geometries.
There are three ways to address this differential recoilless emission problem. The first, somewhat “brute force” method is to measure the Fe3+/Fe2+ in a number of samples of a given mineral species using an independent technique (e.g., wet chemistry), and then to calculate a value for C based on the first of the equations just given. This method was used by Bancroft and Brown (1975), who inferred an average value of C = 0.98±0.04 for biotite. However, this clearly represents something of an oversimplification. The second is to calculate f using EPR single crystal measurements, as described in Tennant (1992) and Tennant et al. (1992). The third approach is to actually measure f for each valence and site in each composition range of interest, but these calculations are not trivial. To calculate f, Mössbauer spectra of the mineral of interest are acquired over a range of temperatures, usually 20-50 K up to 600-800 K at 10-50° increments. Next, the Mössbauer temperature (an approximation of the Debye temperature, θD) and the intrinsic isomer shift (δI) are calculated based on a fit of the Debye integral to the experimental data. Finally, the recoil-free fraction for each site is calculated using the relation
f = exp[-6 ER/kθD[1/4 + T/θD)2∫(xdx)/(ex – 1)]] where ER is the recoil energy, related to the transition energy, Eγ by ER = Eγ
2/2Mc2. Further information on this method can be found in Herberle (1971) and Grant (1995).
Such measurements of the recoilless fractions for Fe3+ and Fe2+ in assorted minerals by DeGrave and VanAlboom (1991) have shown that f values are strongly mineral-, site-, and composition-dependent. They reported values of fRT = 0.872 for Fe3+ and fRT = 0.745 for Fe2+ in celadonite. Rancourt (1994a) found that recoilless fractions were equal for all sites in a synthetic annite within experimental error. A related thesis by Royer (1991) made a detailed study of site-specific recoilless fractions in Fe-bearing trioctahedral micas and apparently found larger f values for Fe3+ in micas than for Fe2+ (as reported in Rancourt 1994a). Thus, there is no consensus on appropriate f values to use for micas; in fact, this parameter is probably so composition-dependent that it must be calculated for every sample if precise results are required. Given this circumstance, it is probably not surprising that most workers have just ignored recoilless fractions altogether. For the purposes of this review, it is worth noting that nearly all the Mössbauer work done on micas before 1990 assumes equality of f values for Fe2+ and Fe3+, and this assumption contributes to the inherent errors of those measurements. Thickness effects
Absorber thickness, which is the amount of sample present in the gamma-ray flux (usually expressed as the number of Mössbauer nucleii per centimeters squared), must always be carefully considered in Mössbauer experiments. This subject has been dealt with in detail by Chandra and Lokanathan (1977), Shimony, (1965), Blamey (1977),

322 Dyar
Long (1983), Sarma et al. (1980), Ping and Rancourt (1992), and Rancourt et al. (1993a); the last study is particularly useful in that it utilizes micas as an example. These papers deal with the consequences of the judgment call made by an experimenter when considering how much sample to use. Two characteristic thicknesses can be calculated for any given material with known composition using expressions developed by Long et al. (1983): a thin absorber thickness, tthin, which produces spectra without the effects of thickness that can include incorrect spectral areas, peak heights, widths, and line shapes; and an ideal absorber thickness, tthick, which is defined to give the largest signal to noise ratio in a given time (Rancourt et al. 1993a). Although it might seem obvious to always use the former, acquisition of such spectra can often require great lengths of time because so little sample is present, and the quality of the resultant spectra can be insufficient for measurements involving accurate determinations of site populations.
How important is this effect for micas? It is apparent from calculations presented by Rancourt (1989) and data in Hargraves et al. (1990) that small spectral contributions are always overestimated when thickness effects are considered. This conclusion has considerable implications for Mössbauer spectra of micas because the Fe3+ peaks are often small relative to those of Fe2+, and therefore vulnerable to exaggeration by thickness effects. For example, consider a sample with an average value (for micas, cf. Rancourt et al. 1994a) of f = 0.5, and an ideal absorber thickness of 3.3 × 10¹⁸ 57Fe/cm2. If a doublet in this sample has an area of 10% of the total area, then its true area when corrected for thickness is 7% (see Fig. 5 in Rancourt 1989). An apparent area of 30% would have a true area of 26%, and so on. These error estimates are only approximations, as they apply to fits using Lorentzian lines that are well-separated; the problems are aggravated in situations where peak overlap occurs (as is frequently the case with micas!).
A more quantitative assessment of the errors attributable to thickness variations comes from work by Rancourt et al. (1994a) on a synthetic annite with an ideal thickness of 53 mg Fe/cm2 . They compared their annite spectrum with simulated spectra for variable thicknesses, and calculated representative Fe3+/ΣFe ratios of 11.0-11.2% at 0-53 mg Fe/cm2, 11.5% at 61 mg Fe/cm2, and 11.7% at 90 mg Fe/cm2. For that sample, the results of applying the full thickness correction procedure of Rancourt (1989) yielded the same site-specific relative doublet areas as those obtained from the raw spectra.
Most of the Mössbauer studies of mica in the literature either use unweighed samples for which it is impossible to calculate (or correct for) the ideal thickness, or use thicknesses of 5-10 mg/cm2 of Fe because that range was originally recommended by Greenwood and Gibb (1971) and subsequently suggested by Hawthorne (1988). In these circumstances, a peak with an apparent area of 10% would have a true area of <5%, and peak with 25% of the total area would have a true area of <17%, and so on. Accordingly, readers of Mössbauer literature on micas must be wary of high error bars on small peaks. This is especially true in cases where the samples studied were available in large quantities (so that it was easy to obtain sufficient sample to pack 5-10 mg Fe/cm2 into the mount), and less true in cases where the authors had to work hard (i.e., hand pick or synthesize) to obtain sufficient quantities to generate spectra. Studies using the latter approach, such as Dyar (1990) are more likely to have used sample thicknesses closer to tthin. Future workers in this field would do well to report sample thicknesses and the steps they have taken to deal with them. Texture effects and other sources of error
Apart from thickness and differential recoilless emission effects, several other factors may influence Mössbauer measurements in micas and contribute to their errors (Dyar 1984 1986, 1989; Waychunas 1986, 1989). Of these, the most difficult to assess is
Optical and Mössbauer Spectroscopy of Iron in Micas 323
the issue of sample heterogeneity (see Comparison of Techniques, below). Aside from fitting models, which are discussed in a subsequent section, other sources of error include (but are not limited to) factors such as external vibrations, changes in temperature, counter saturation effects, and texture effects (caused by non-random orientation of grains in sample mounts). Most of these errors can be corrected by adjustments to experimental set-up. In particular, Rancourt (1994a) suggests that texture effects can be avoided by mounting micas in petroleum jelly; other workers suggest using a mixture of sugar and acetone or other transparent powder to coat sample grains before mounting (Annersten 1975b; Bancroft and Brown 1975; Clark 1967; Dyar 1990).
Texture effects were suggested by Rancourt et al. (1992) to be the main cause of artifacts attributed to [4]Fe3+ by Dyar (1990), a suggestion that was disputed by Dyar (1993a), and further discussed by Rancourt (1993). Subsequent work on subsets of Dyar’s samples by XRD (Swope 1997) and wet chemistry (C. Grant, pers. comm.) confirmed the presence of Fe3+ in these micas, but assigned it to highly distorted M1 sites in the structure rather than in tetrahedral sites. Thus, texture effects were not responsible for the presence of the [4]Fe3+ doublets, but the area assigned to them is better reassigned to octahedral coordination. Work is in progress to refit these spectra with quadrupole splitting models, and to make thickness corrections to those results, where appropriate. Techniques for fitting Mössbauer spectra
The Mössbauer spectrum observed when a transmission experiment is done (as during typical mineralogical experiments) depends on a number of factors already discussed, including recoil-free emission and absorption of gamma rays, non-resonant absorption through the Compton and photoelectron effects, and self-absorption in the source. The signal that arrives at the detector in a Mössbauer apparatus is called the transmission integral, and it represents the signal as a function of the relative velocity between the source and absorber. If a thin-absorber approximation is made (Margulies and Ehrman 1961), then the transmission integral becomes a simple sum of pure Lorentzian peaks. When the conditions for the thin-absorber approximation do not apply, as is often the case in mineralogical studies, then the line shapes are not Lorentzian, and a compromise must be made in the model by which the spectrum is treated.
The best way to fit that signal (i.e., the spectrum it generates) continues to be a matter of debate because as yet, there is no analytical solution for the transmission integral (Vanderberghe et al. 1994). Therefore, various methods for simplifying the problem of fitting the spectra exist; in order to be thoroughly equipped for mineralogical studies, a lab must be able to use any and all of the existing methods. These include fitting (1) pure Lorentzian line shapes; (2) a Gaussian distribution of Lorentzian line shapes, known as a Voigt line shape (Voigt 1912); and (3) quadrupole splitting or hyperfine field distributions (Ping et al. 1991; Rancourt and Ping ,1991). Only the first of these procedures is commonly in use worldwide, largely because commercial software for the latter methods has only recently become available.
However, the approach of fitting quadrupole splitting distributions (QSD) has been shown to be superior to the Lorentzian-based approach in spectra in which there are poorly resolved quadrupole pairs, as is certainly the case in mica spectra. It works best in samples where the Fe atoms are not surrounded by a perfectly homogeneous array of neighbors and next nearest neighbors; again, this scenario is almost always true of naturally-occurring micas. Effectively, the QSDs model the local distortions and atomic disorder surrounding the Fe atoms, rather than simply reflecting the ideal point symmetries of the relevant sites (Rancourt 1994a). In a series of papers (Rancourt 1994a,b; Rancourt et al. 1994a), Rancourt and coworkers convincingly demonstrate that

324 Dyar
the QSD method performs better than Lorentzian fits in a number of ways. Fits with Lorentzian doublets tend to overestimate the spectral backgrounds, put large wings or tails on the main absorption peaks, and give unphysically large linewidths (Rancourt 1994a).
How much does this affect the resultant Fe3+/ΣFe ratios? An example from Rancourt (1994a) serves to illustrate the effects. Spectra of three micas (two biotites and an annite) were fit with either multiple Lorentzian doublets or a Voigt-based quadrupole splitting distribution (QSD) of peaks. The Lorentzian fits yielded Fe3+/ΣFe ratios of 8.62, 22.17, and 18.79, while the QSD fits gave values of 10.60, 25.44, and 17.52 respectively, for the three samples. Based upon this author's considerable recent experience in fitting mica spectra both ways, these differences are typical.
If the desired goal of the Mössbauer experiment is to discriminate site occupancies, however, then use of the QSD model is imperative. Rancourt (1994a) shows the inadequacy of Lorentzian doublets for fitting spectra of naturally-occurring samples. Rancourt (1994b) further notes that “fitting with Lorentzian doublets can at best give phenomenological characterizations of spectra, whereas QSDs are true physical quantities amenable to theoretical calculations and crystal chemical interpretation.” He goes on to demonstrate that Mössbauer spectra of 2:1 sheet silicates cannot resolve the octahedral Fe2+ cis (M2) and trans (M1) sites, and supports his contention that “interpretations in terms of octahedral Fe2+ cis and trans sites are incorrect and cannot be used to even estimate cis/trans site population ratios.” Rancourt (1994b) then concludes by strongly stating that “we recommend that spectroscopists now break from this admittedly compelling interpretation [of Lorentzian line shape doublets assigned to cis and trans sites] to consider the QSD.” It is important to note here that Rancourt was not the first to reach this conclusion. Studies by Goodman (1976), Mineeva (1978), Bookin et al. (1978), Ballet and Amthauer (1986) and others had earlier come to similar conclusions using through work on the EFG in micas. The QSD method of Rancourt is an elegant way of making the same point.
The third paper (Rancourt et al. 1994a) goes on to speculate about possible interpretations of the QSD fits to mica spectra, and suggests that they represent population distributions of local distortion environments that may be a function of such factors as the number of neighboring small trivalent octahedral cations and the number of adjacent tetrahedral sites that are occupied by Fe3+ in the place of Al3+. Again in keeping with the results and ideas of earlier workers (Ballet and Amthauer 1986; Goodman 1976; Mineeva 1978), Rancourt et al. (1994a) find that the variations in QSD parameters cannot be related to any single compositional parameter (such as Fe/(Fe+Mg)), and suggest than more work in this area is required.
A more likely cause of variation around octahedral sites is hydrogen contents. The chief difference between the trans M1 site and the cis M2 site is the location of the hydroxyls, which are located in opposite and adjacent corners of the octahedra, respectively. Study of the many biotite analyses published before 1970 shows that biotite rarely contains a stoichiometric four H atoms per formula unit, and of course, halogen substitution is also common (Deer et al. 1992; Foster 1960, 1964). More recent work using modern techniques reinforces this conclusion; for example, biotite from the Cape Ann locality has only 1.50 H atoms p.f.u. (Dyar and Rossman, in prep.). The observed H variation can sometimes be explained by oxy-substitution involving Fe3+ (Dyar 1993b; Dyar et al. 1991), but more commonly it is involved in more complex coupled substitutions (Feeley and Sharp 1996; Feldstein et al. 1996). If the hydroxyls are replaced by oxygen or halogen atoms, the geometry of the cis and trans sites adjacent to them will change, and numerous permutations to the coordination polyhedra will occur. It seems

Optical and Mössbauer Spectroscopy of Iron in Micas 325
more likely that the variations in QSD parameters and multiplicities may relate to these near neighbors of the Fe atoms, as also noted by Rancourt et al. (1996).
These papers have serious implications for interpreting all of the previous work on Mössbauer in micas. Most importantly, they demonstrate the futility of attempting to extract ordering information about micas from the areas of [M1]Fe2+ and [M2]Fe2+ doublets. However, they do not necessarily negate the efforts of the majority of previous workers whose main interest has been characterization of Fe3+/ΣFe ratios. For those studies, the critical but now informed reader should be aware that a small amount of additional error is imposed by use of the Lorentzian rather than QSD model. In many cases, quoted error bars on Fe3+/ΣFe ratios are already sufficiently large to accommodate this additional error. Review of existing Mössbauer data
Biotite, phlogopite, and trioctahedral micas. Following Pollak et al. (1962), early workers to apply the technique of Mössbauer spectroscopy were Marfunin et al. (1967), who included a biotite in his survey of various silicates, and Häggström et al. (1969), who were the first (erroneously, as later shown by Rancourt and coworkers) to assign the Fe2+ doublet with highest QS to the cis site, and the lower QS to the trans site. Many of the subsequent workers (Bancroft and Brown 1975; Bowen et al. 1969; Cimbalnikova et al. 1977; Ericsson et al. 1977; Hogg and Meads 1970; Sanz et al. 1978; Yonggang 1986) were less interested in site assignments and more concerned with measuring Fe3+/ΣFe using Mössbauer and then comparing it to wet chemical results.
Other workers concerned themselves with characterizing tetrahedral Fe3+ (e.g. Rancourt et al. 1994b). Hogarth et al. (1970) were the first to report [4]Fe3+ in two phlogopite samples from Quebec with parameters of δ = 0.19 and 0.21 mm/s and Δ = 0.44 and 0.44 mm/s, respectively. Annersten et al. (1971) acquired the Mössbauer spectrum of a ferriphlogopite synthesized to have iron only in the tetrahedral site, and reported parameters of δ = 0.17 mm/s and Δ = 0.50 mm/s. Manapov and Sitdikov (1974, 1975) reported [4]Fe3+ in naturally-occurring samples, though some of their parameters of δ = 0.06-0.24 mm/s and Δ = 0.35-0.50 mm/s might be considered slightly low by more modern standards. Pavlishin et al. (1978) studied tetra-ferriphlogopites and what they called “tetraferribiotites” (probably tetra-ferri-annite) with Mössbauer, XRD, optical, and FTIR spectra, and confirmed the presence of [4]Fe3+ and its parameters. Shinno and Suwa (1981) also reported Mössbauer spectra of phlogopites with reverse pleochroism, which were found to contain Fe3+ only in the tetrahedral sites. Dyar and Burns (1986) reported data on naturally-occurring ferriannite from Australia, with parameters similar to those measured by Annersten et al. (1971). Detailed understanding of the steric reaction to [4]Fe3+ substitution was provided by Ferrow (1987b), who showed that tetrahedral layer rotation decreases the separation between Fe3+ and the surrounding ligands, thereby increasing the Δ value observed for [4]Fe3+. Rancourt et al. (1992) suggested that the position of the higher velocity peak in the [4]Fe3+ doublet might be characteristic of true micas (0.37-0.49 mm/s) and brittle micas (0.56-0.66 mm/s), but a compilation of data assembled for this paper suggests that this distinction may not be real (Fig. 4). Mizutani et al. (1991) synthesized 1:1 and 2:1 phyllosilicates and noted that the Fe-O tetrahedra in the 2:1 samples were more deformed than those in the 1:1 phyllosilicates. Cruciani et al. (1995) documented both Mössbauer and XANES evidence for [4]Fe3+ in tetra-ferriphlogopite from the Araxa carbonatite. Babushkina et al. (1997, 1999) also found [4]Fe3+ in phlogopite from Baltic Shield lamproites.
Several studies looked at the thermal oxidation and dehydroxylation of biotite, including Rice and Williams (1969), Bagin et al. (1980), Vicente-Hernandez et al.

326 Dyar
(1983), and Mathew and Charma (1991). Ivanitskiy (1975a) concluded that Fe-rich biotite oxidizes more easily than low-Fe biotite. They reported that increasing the Fe3+ contents of biotite introduces considerable octahedral distortion to the structure, as represented by increasing Δ values, and they showed that oxidation takes place via the (now well-known) reaction: Fe2+ + OH- → Fe3+ + O2- + H+ .
Hogg and Meads (1975) performed heat treatments at temperatures between 200°C and 1000°C and examined the color change and Mössbauer spectra. They concluded that oxidation is the primary change with heating below 400°C, while dehydrogenation predominates from 400-500°C; little change occurs above that temperature. They attributed changes in the intensities and linewidths of the Fe2+ doublets to formation of very distorted Fe2+(O5OH) sites (as suggested above). A similiar conclusion was reached by Tripathi et al. (1978). Gendler et al. (1978) also studied the oxidation products of biotite at temperatures up to 900 K, and observed the growth of a Fe3+ doublet with δ = 0.40 mm/s and Δ = 1.34 mm/s. They suggested that the successive loss of H during oxidation distorts the Fe3+ octahedra and leads to an increase in its Δ, similar to the idea proposed by Ivanitskiy (1975a). Additional experiments by Chandra and Lokanathan (1982), Ferrow (1987a), Pol’shin et al. (1994), and Rancourt et al. (1993b) supported those of previous work. A later study by Sanz et al. (1983) further corroborated these conclusions using Mössbauer in conjuction with IR. By integration with IR data (e.g., Vedder and Wilkins 1969), the eventual consensus of these workers is that dehydroxylation of micas occurs in three steps: dehydrogenation from 400-800°C, dehydration up to 800°C, and loss of OH groups above 1000°C. Burkhard et al. (1999) used Mössbauer and other techniques to better constrain this process, identifying three “episodes” at characteristic temperatures during the dehydration process. Guseinov (1999) correlated these breakdown processes with variations in ion conductivity in biotite; the products of such reactions were discussed in a review by Ferrow (1998) and examined in detail in Ferrow et al. (1999). Finally, the dissolution kinetics of biotite were studied by Blomquist et al. (1996) and Malmström and Banwart (1997).
The sign of magnetic coupling in biotite was studied by Ballet and Coey (1982) and Townsend and Longworth (1985). The latter work determined that both Fe3+-Fe3+ pairs and Fe2+-Fe2+ pairs are coupled ferromagnetically. This result was disputed by Ballet (1986). However, later work by Longworth et al. (1987) also found Fe3+ spins to be ferromagnetic (positive) in two biotites and their oxidized equivalents. They agreed with Ballet and Coey (1982) that Fe2+-Fe3+ superexchange is positive.
Chandra and Lokanathan (1977) were the first to study the electric field gradient in micas; they determined that the direction of the principal Z axis is close to the normal to the cleavage plane. Ericsson et al. (1977) also recorded spectra at different angles. In a thought-provoking paper, Mineeva (1978) used calculations of lattice EFG tensors to suggest that the two Fe3+ doublets frequently fitted to Mössbauer spectra of micas could not represent M1 and M2 occupancies. Instead, Mineeva (1978) made the alternative suggestion that these two doublets represent two Fe3+ populations: [M1+M2]Fe3+ and Fe3+ in defect sites such as would be produced by H vacancies, F occupancy, and variable next nearest neighbor cations. This prescient conclusion, which was subsequently supported by Bakhtin et al. (1986), would eventually be fully substantiated by the work of Rancourt and coworkers as described above.
A formalized analysis of the EFG was also employed by Bagin et al. (1980); their model effectively explained the large quadrupole splitting that is associated with octahedral Fe3+, again using vacancies as part of their model. More recently, an elegant paper by Aldridge et al. (1986) used molecular orbital methods to model the electronic structure of biotite. They showed that iterative extended Hückel theory calculations of

Optical and Mössbauer Spectroscopy of Iron in Micas 327
clusters containing only Fe ions surrounded by their oxygen neighbors can be used to correlate the calculated and experimental optical and Mössbauer parameters in most tetrahedral, octahedral, or 8-coordinated minerals, though the authors were less pleased with results of calculations based on the more complex multiple scattering Xα method. However, their methods show great potential for future understanding of complex mica spectra, as shown by their subsequent work (Aldridge et al. 1991).
Tripathi and Lokanathan (1978) reported the Mössbauer spectrum of a ferric manganophyllite, which has Fe3+ parameters of δ = 0.38 mm/s and 0.36 mm/s and Δ = 1.82 mm/s and 0.75 mm/s, similar to those of dehydrogenated samples. Manganese-bearing phlogopites studied by Smith et al. (1983), however, had “normal” values of Fe3+ quadrupole splitting ranging from 0.56 to 1.22 mm/s for tetrahedral and octahedral Fe3+. Manganese biotite was studied by Gongbao and Shurong (1986); their low-Al sample also contained [4]Fe3+.
Zinnwaldite was examined by Herzenberg et al. (1968) and Hogg and Meads (1970); both observed high values of Δ of 3.13 mm/s and 2.65 mm/s; later work by Levillain et al. (1981) confirmed these data by measuring a sample with Δ = 2.61-2.72 mm/s. Levillain et al. (1981) also deduced linear relationships between Li contents and Δ values that are probably related to site distortions introduced by the large Li ion into the structure. A dependence of Δ on OH:F substitution was also observed. Minor confusion over their site assignments for Fe2+ was clarified by Heller-Kallai (1982) and Levillain et al. (1982). Work by Djemai (1992) used a combined Mössbauer, XRD, and IR approach to study Mn-rich zinnwaldite. They found that Fe2+ is ordered among octahedral sites, and that Fe3+ is present in M(2) sites. A related study of lepidolite by Levillain et al. (1977) reported Fe2+ doublets with Δ of 2.99 and 3.13 mm/s, supporting the idea that Li does distort the nearby octahedra.
An intruguing study by Ivanitskiy et al. (1975b,c) examined the effects of irradiation on biotite, such as might occur in association with uranium deposits. Their starting biotite had a Mössbauer spectrum with a single Fe3+ doublet with parameters of δ = 0.54 mm/s and Δ = 0.76 mm/s. That sample was then exposed to a radiation dose of 2.5 × 10¹⁰ rads, which is equivalent to a 2.5 × 10⁸ year dose in radioactive ore lodes. Its Mössbauer spectrum mimicked those of biotites found around naturally-occurring deposits; all of them had a second, broader Fe3+ doublet at δ = 0.50-0.61 mm/s and Δ = 1.64-1.83 mm/s that was attributed to the radiation damage (though no single responsible mechanism could be identified).
Clarification of Fe-bearing mica terminology was one of the goals of Dyar and Burns (1986). Their data on the mica at Cape Ann, Massachusetts, type locality for annite, showed it to be an oxy-biotite with significant Fe3+ contents (Fig. 5-A). The mica in the Pikes Peak granite of Colorado was shown to be the closest composition to the Fe2+ end-member, annite (Fig. 5-B), as proposed by Winchell (1925).
Interesting work by Redhammer et al. (1993, 1995, 1998) used Mössbauer to examine the fundamental conclusion of Eugster and Wones (1962); namely, that: annite must contain a small oxy-component in order to be stable, as a result of the steric constraint for the octahedral layer to match the tetrahedral layer. Redhammer et al. (1993) synthesized annites over a range of temperature and oxygen fugacity and confirmed the prediction of Eugster and Wones (1962), showing that Fe3+ contents of annite cannot be reduced below 10% even if extremely reducing conditions are imposed. As a phlogopite component is introduced to the annite composition, this value decreases to about 1-2% Fe3+ (Redhammer et al. 1995).
Several recent studies of synthetic micas have made effective use of quadrupole

328 Dyar
Figure 5. (A) Mössbauer spec-trum of annite from Devil’s Slide, Pikes Peak, Colorado, U.S.A. This sample most closely resembles the ideal Fe2+ end member analogue of phlogopite. (B) Mössbauer spectrum of biotite from Cape Ann, Massachusetts, which con-tains both [6]Fe3+ and [6]Fe2+. These are newly collected spectra on the same mounts used by Dyar and Burns (1986).
splitting distributions. Rancourt et al. (1996) found four Fe2+ contributions corresponding to Fe2+O4(OH)2, Fe2+O4(OH)F, cis-Fe2+O4F2, and trans-Fe2+O4F2 octahedra, and also characterized Fe3+ components. Redhammer (1998) examined a broad compositional range of synthetic trioctahedral micas using the QSD approach and found systematic variations in the QSDs with chemical composition. Redhammer et al. (2000) complemented Mössbauer data with crystal structure refinements and IR spectra to examine the effect of incorporation of Al-Tschermak molecules into synthetic annite, and determined that the substitution of Al is primarily controlled by steric limits on the ditrigonal distortion of the tetrahedral rings.
A number of more recent studies have used the Mössbauer method to obtain data to aid in understanding a petrologic problem. Homonnay et al. (1988) studied the Fe3+ contents of upper mantle phlogopites, as represented by phlogopite extracted from a clinopyroxene-phlogopite xenolith. Dyar (1990) showed that Fe3+ stays constant in metapelitic rocks over a temperature range from lower garnet to Ksp + sillimanite grade rocks that coexist with graphite and ilmenite. Dudko et al. (1991) studied 160 biotites from the Ukranian Shield and, like Guidotti and Dyar (1991), found a relationship between the amount of Fe3+ in biotite and the bulk composition/assemblage. Kleiman et al. (1992) used Mössbauer to distinguish between eruptive vs. postmagmatic processes in ash-flow tuffs from Argentina. Votyakov et al. (1994a,b) studied 48 biotites from Ural granitoids and related rocks, and determined that three series of biotites corresponding to magnetite-bearing (highest Fe3+ biotite), magnetite-free, and titanomagnetite-bearing (lowest Fe3+ biotite) rocks were present. LaLonde et al. (1996) examined the petrologic significance of Fe-bearing micas from Mont Saint-Hilaire, Québec, noting the presence of [4]Fe3+ despite the high Al contents of the rocks.
Pol'shin et al. (1972a,b) were the first to study the temperature variation of quadrupole splitting in biotite, followed by Annersten (1974), Royer (1991) and Christie et al. (1992a,b). Christie et al. (1992a) examined the magnetically ordered ground state of synthetic annite at TC ≈ 58K. Other Mössbauer spectra of trioctahedral micas are reported

Optical and Mössbauer Spectroscopy of Iron in Micas 329
in Ghosh et al. (1978), Radukic et al. (1980), Smith et al. (1980), Goodman (1976), Levillain et al. (1977), Amirkhanov et al. (1982a,b; 1974), Babushkina and Nikitina (1985), Sanz et al. (1984), Bashkirov et al. (1987), and Earley et al. (1990).
Muscovite, celadonite, glauconite, and dioctahedral micas. It might be expected that dioctahedral micas, having just one octahedral site, would be simpler to study by Mössbauer. However, these micas often have some trioctahedral component, which means that their M1 sites are not completely vacant. Also, dioctahedral micas are generally lower in total iron contents than their trioctahedral analogs, so that Mössbauer work (or any other bulk technique, for that matter) presents a far greater challenge. Considerable care must be taken to prepare samples with highest purity, avoiding grains with oxide staining or Fe-rich inclusions that can result in erroneous results (e.g., Ballet and Amthauer 1986; Chang et al. 1993). For these reasons, there are fewer studies of muscovite and relatively more work on celadonite and glauconite. Each of these species will be treated separately here for the sake of clarity.
The first muscovite analysis using Mössbauer spectroscopy was done by Weaver et al. (1967), who measured a single doublet assigned to Fe2+ with parameters of δ = 1.15 mm/s and Δ = 2.40 mm/s. Bowen et al. (1969) followed with a comparative study of biotite and muscovite, noting that their average quadrupole splitting for Fe2+ in muscovite (Δ = 2.93 mm/s) was distinctly higher than that in biotite (Δ = 2.46 mm/s). Hogg and Meads (1970) also noticed this difference, reporting average Δbiotite = 2.63 mm/s vs. Δmuscovite = 3.01 mm/s, as did Ericsson et al. (1977), who found Δmuscovite = 3.05 mm/s. These differences are not surprising given the distortions introduced in the mica structure by M1 vacancies.
Muscovite spectra reported by Hogg and Meads (1970) include two doublets assigned to Fe2+. Their work was followed by an extensive, integrated, optical and Mössbauer study of 14 common pegmatitic muscovites by Finch et al. (1982). [6]Fe3+ in a single doublet at δ = 0.37 mm/s and Δ = 0.84 mm/s predominated in all but one of their Mössbauer spectra. The Fe3+ peaks were relatively wide (Γ = 1.07 mm/s), far above the natural linewidth of 0.19 mm/s, however, and this was interpreted as a suggestion of multiple site occupancy and/or disorder in next neighbor occupancies. Finch et al. (1982) used two doublet fits for muscovite (as did Hogg and Meads 1970 and Ballet and Amthauer 1986) in a study of the mica EFG tensor. This result was difficult to explain when it was thought that the doublets should represent only the fully occupied M2 sites in these dioctahedral samples. Ballet and Amthauer (1986) reluctantly assigned the smaller of their two Fe2+ doublets to M1 occupancy, but they noted that “it is sometimes not clear whether two such doublets, let us say for Fe2+, correspond to M1 and M2, i.e., the octahedral sites with OH ligands in trans and cis positions respectively or to a mathematical feature of the lineshapes, which would be due chiefly to the various distributions of vacancies, M2+ or M3+ cations, among the neighboring octahedral sites (or even M3+ or M4+ cations among tetrahedral sites)(Goodman 1976; Mineeva 1978).” Of course, the latter interpretation has subsequently been supported by the work of Rancourt and coworkers mentioned above, as well as in Shabani et al. (1998).
Later studies of the EFG tensor in muscovite by Bonnin and Muller (1981) and Aldridge et al. (1987) quantified the EFG in muscovite, but noted that it is aligned differently in different samples. They attributed these differences to varying Fe2+ and Fe3+ concentrations in edge-sharing M1-M2 and M1-M1 octahedra. They also made the assumption of equal populations in M1 and M2 sites, which we now know to be unprovable by the Mössbauer technique.
Sharov et al. (1985) examined changes in muscovite with heating, and saw a change

330 Dyar
in site assignment of Fe3+ from high Δ sites (Δ = 1.04 mm/s) to low Δ sites (Δ = 0.71-0.96 mm/s) with increasing temperature. Although this trend is the reverse of that observed in biotite by Gendler et al. (1978), it still suggests changes in site distortion as the amount of Fe3+ in the structure increases. Zhe et al. (1986) also studied heated muscovite using Mössbauer and optical spectra. They found two octahedral Fe3+ doublets in samples heated to 800-1100°C.
A few petrologic studies of muscovite have been made using Mössbauer. Pietzsch and Schmidt (1990) examined ten muscovites and lepidolites from pegmatites in northern Mozambique, but could find no well-defined relationships between genetic classification of the pegmatites and Mössbauer results. Guidotti et al. (1994) determined that Fe3+/ΣFe in muscovite reflects the opaque assemblage in the rocks but is independent of metamorphic grade (Fig. 6).
Figure 6. Mössbauer spectrum of an iron-rich muscovite from a western Maine metapelite (data from Guidotti et al. 1994). This samples contains 82% of its total Fe as Fe3+. Such a large amount of Fe3+ might be ex-pected because this muscovite coexists with both magnetite and hematite. Spectrum is newly collected data on the same mounts used by Guidotti et al. (1994). Data are of rela-tively poorer quality because there is far less total Fe in muscovite.
Mössbauer spectra of muscovite were also included in Ballet et al. (1979) and Yonggang (1986). Celadonite spectra were reported by Daynyak et al. (1984a), with average Δ = 0.40 mm/s (δ values were not given) and by Wang (1990), who observed peaks with δ = 0.35, 1.14, and 1.13 mms/s and Δ = 0.42, 1.86, and 2.62 mm/s, respectively.
Glauconite has been the subject of extensive Mössbauer study because it is relatively iron-rich and of great importance in understanding marine diagenesis and paleoenviron-ments. Its study presents challenges, however, because the material often called glauconite is usually mineralogically heterogeneous. Thus care must be taken to examine specimens for homogeneity before they can be effectively studied using this bulk technique. The spectrum of a glauconite from Hurricane Mountain, NH (Francis et al., in preparation) is shown in Figure 7.
Hofmann et al. (1967), Taylor et al. (1968), Arnott (1968), Bowen et al. (1969), Cimbálniková et al. (1973), and Raclavasky et al. (1975) were the earliest reports of Mössbauer spectra of glauconite; these studies focused on characterizing the quadrupole splitting that is present around 0.24-0.49 mm/s for Fe3+ and 1.0-1.3 mm/s for Fe2+. Annersten (1975a) showed two Fe2+ and one Fe3+ doublets; his reported Δ values ranged from 1.65-2.90 mm/s, more similar to biotite than to muscovite. Malysheva et al. (1975; 1976) examined 24 glauconite samples and established a correlation between temperature (over the range from 200-500°C) and the quadrupole splitting of Fe3+. They also noted a

Optical and Mössbauer Spectroscopy of Iron in Micas 331
Figure 7. Mössbauer spectrum of an unusual non-marine glaucon-ite from Hurricane Mountain, New Hampshire, U.S.A. Tetra-hedral Fe3+ dominates the spec-trum. Unpublished data from Francis et al. (in prep.).
distinct difference in Mössbauer parameters between celadonite (δ = 0.53 and 0.47 mm/s, Δ = 1.19 and 0.37 mm/s) and glauconite (δ = 0.0.45-0.50 mm/s and Δ = 0.42-1.07 mm/s). Glauconite spectra were also included in Eyrish and Dvorechenskaya (1976) with Fe3+ Δ values ranging from 0.32-0.94 mm/s. Rolf et al. (1977) found no correlation between glauconite age and site population, and observed a preference for Fe3+ to occupy the M2 site, as had been seen by Cimbálniková et al. (1973).
All these preexisting site assignments were clarified by Rozenson and Heller-Kallai (1978). They related the Mössbauer spectra of glauconite to those of smectites, and showed that for both minerals, there is an inverse relationship between b cell dimension and Fe3+ quadrupole splitting. This behavior is explained by the fact that increasing the total Fe3+ in the octahedral sheets decreases the misfit between octahedral and tetrahedral sheets, thus decreasing the distortions of the octahedral sites and decreasing Δ for Fe3+. The same general trend is seen for Fe2+, but the same explanation cannot be used, because decreasing Δ values for Fe2+ imply a tendency toward distorted rather than regular sites.
Bookin et al. (1978) undertook the interpretation of celadonite and glauconite on the basis of structural modelling using EFGs. They calculated that celadonite has six configurations of differently-charged cations in the octahedral layer with respect to Fe3+, which could give rise to six different quadrupole splittings. A related approach to fitting was also used by Bukin et al. (1979), who proposed overlapping doublets corresponding to various configurations of Fe3+ surrounded by divalent and trivalent neighbors. This model was refined by Daynyak et al. (1984b) and Daynyak and Drits (1987), who combined crystal structure simulations and EFG calculations to show that R3+ and R2+ cations in the M1 site of celadonite are ordered (i.e., each R2+ cation is surrounded by R3+ cations, and vice versa). Further work by Townsend et al. (1987) also concluded that Fe3+ cations are highly ordered on the cis site in glauconite, though with varying neighbors and nearest neighbors. More recent models (Daynyak et al. 1992) of the glauconite structure have shown that it is composed of celadonite-like and illite-like domains that may give rise to the local order seen in the Mössbauer models. These calculations explain why many spectroscopists (Cardile and Brown 1988; De Grave et al. 1985; DeGrave and Geets 1979; Govaert et al. 1979; Kotlicki et al. 1981) puzzled over the proper number of Fe3+ peaks to fit to glauconite and celadonite spectra, and noted the large peakwidths for Fe3+ (McConchie et al. 1979). They also suggest the usefulness of the QSD approach in future work.
The temperature dependence of Mössbauer parameters of celadonite was charac-

332 Dyar
terized by Bowen et al. (1989), who then calculated the Debye temperatures and values of δI to be 570 K and 0.61 mm/s for [M2]Fe3+ and 380 K and 1.35 mm/s for [6]Fe2+.
Finally, these studies were corroborated in recent work by Drits et al. (1997), who used a combination of IR, Mössbauer, and EXAFS to further describe the environment around the Fe atoms in celadonite and glauconite. They found that Fe3+ doublets could be assigned to specific set of local cation arrangements, while Fe2+ ordering in cis sites creates domain structures.
Govaert et al. (1979) successfully correlated the green color of glauconite with its Fe2+/Fe3+ ratio, and similar results were obtained by DeGrave and Geets (1979). DeGrave et al. (1985) studied 16 glauconites from within a well-defined petrologic context, and found no relationship between Mössbauer parameters and either K contents or age of the samples. Chen (1985) also used Mössbauer to study the relationships between glauconite composition (especially K2O, FeO, and Fe2O3) and its distribution among sedimentary facies in Chinese localities, and similar work was done in northern Siberia by Gorokhov et al. (1995) and in the Ukraine by Gorokhov et al. (1997).
Johnston and Cardile (1987) and Cardile and Brown (1988) reported the presence of tetrahedral Fe3+ in glauconite, but their parameters (δ = -0.10-0.25 mm/s and Δ = 0.11-0.30 mm/s) do not compare well with those of [4]Fe3+ in biotite as discussed above. Other glauconite spectra were reported by Amirkhanov et al. (1984) and Odin et al. (1988).
Brittle and interlayer-deficient micas. Clintonite was first studied by Annersten and Olesch (1978). Its Mössbauer spectrum has doublets that were assigned to [M1]Fe2+, [M2]Fe2+, [6]Fe3+, and [4]Fe3+. In all but one of the five samples analyzed, the majority of Fe was [4]Fe3+ with parameters of δ = 0.24-0.27 mm/s and Δ = 0.49-0.52 mm/s that are comparable to those found in biotite. A second study by Wang and Zhengmin (1992) reported nearly identical parameters. A typical clintonite spectrum for a sample from Crestmore, California, U.S.A. is shown in Figure 8.
There is only one report of an anandite spectrum in the literature, from the single known locality at Wilagedera, Ceylon. Filut et al. (1985) describe a Mössbauer spectrum run by G.A. Waychunas; it has 45.6% of the total Fe as Fe3+, with 1.40 a.p.f.u. [4]Fe3+. This sample was re-run in the author’s lab, and its spectrum is shown in Figure 9.
Figure 8. Mössbauer spectrum of clintonite (formerly called xanthophyllite) from Crestmore, California (Harvard Mineral-ogical Museum sample 108087). Spectra of this sample were described by Annersten and Olesch (1978) as sample #4.

Optical and Mössbauer Spectroscopy of Iron in Micas 333
Figure 9. Mössbauer spectrum of anandite from Wilagedera, Ceylon, studied by Filut et al. (1985). This spectrum is from unpublished work by the author.
Although there is an extensive literature on montmorillonite (which lies outside the domain of this paper), a few authors focused their effort on illite alone. The earliest spectrum of illite was given by Weaver et al. (1967), who showed spectra dominated by octahedral Fe3+. Raclavasky et al. (1975) acquired data on four illites, but used too narrow a velocity range to see their high velocity Fe2+ peaks. Coey (1980) showed four MS spectra of illite, but the samples were poorly characterized. Many workers (Ericsson et al. 1977; Michael and McWhinnie 1980; Russell and Montano 1978; Saporoschenko et al. 1980) studied two of Ward’s illites (#35 and 36), both of which were shown to contain impurities (Malathi et al. 1969). Johnson and Cardile (1987) reported five doublets in the spectrum of South Australian illite: [4]Fe3+, [M1]Fe3+, [M2]Fe3+, [M1]Fe2+, and [M2]Fe2+. Much of the resultant confusion in the literature was clarified by Murad and Wagner (1994), who fitted a single broad doublet each to Fe3+ and to Fe2+ for all but one of their samples (in which a third doublet for [4]Fe3+ was required). They noted that Fe-rich illites have noticeably higher Fe3+/ΣFe than Fe-poor illites, perhaps reflecting more dioctahedral character in the Fe-rich group. Higher Fe2+ samples had higher quadrupole splitting, suggesting that Fe2+ substitution into the illite structure causes increasing octahedral distortion. Summary
Mössbauer spectroscopy has been used extensively to characterize Fe valence and site occupancy in mica minerals, including biotite, phlogopite, manganophyllite, zinnwaldite, muscovite, celadonite, glauconite, clintonite, anandite, and illite. Although it is now clear that reports of ordering between the M1 and M2 sites based on Mössbauer data alone are not tenable, this technique can successfully distinguish between Fe3+ in tetrahedral and octahedral sites. Reliable, consistent determinations of Fe3+/ΣFe are also made by this technique. Great improvements in fitting models and instrumentation over the last decade have been made, and it is clear that a new era for interpretation of Mössbauer spectra of micas has arrived that may require re-examination of old spectral data. Software for fitting spectra with quadrupole splitting distributions is now commercially available, so the next few decades should result in a shift to superior fits, and yet more interesting studies of the Mössbauer spectra of micas.

334 Dyar
COMPARISON OF TECHNIQUES Three other spectroscopic methods are used in the study of Fe in micas, though all
are so recently developed that there are a limited number of studies using them: XPS, EELS, and XANES spectroscopies. These techniques have an advantage over Mössbauer and wet chemistry because they are truly micro-scale techniques, though their resolution is variable. A brief summary of each of these methods is given in the Appendix to this paper. In the following section, these techniques are compared to Mössbauer and wet chemical results of mica studies, in order to facilitate comparisons among these methods.
Results of wet chemical, Mössbauer, XPS, and XANES studies of micas are shown in Figure 10. Figure 10A shows a comparison of wet chemical results vs. Mössbauer data for trioctahedral micas in 15 of the papers cited here. With only a few outliers that can probably be explained by either impurities or experimental error by analysts, there is good agreement between the two data sets. This plot shows that despite the known problems with Lorentzian fits (as discussed earlier in this paper), data from the pre-QSD-fit literature can still be used with confidence if Fe3+/ΣFe results are the subject of interest, as long as the error bars on the older measurements are realistically quoted as ±3 to ±5% absolute.
Figures 10B and 10C are replotted from Raeburn et al. (1997a,b); they show comparisons of XPS to wet chemistry and XPS to Mössbauer results on the same suite of samples. The methods agree well within the stated error bars, even though the Mössbauer results are based on fits to Lorentzian shapes. Figures 10D and 10E show synchrotron micro-XANES (SmX) results (from Dyar et al. 2001) plotted against wet chemistry and Mössbauer results. Again, there is qualitatively good agreement, but it is clear there are some problems here. As noted above, most of the error in the SmX measurements probably results from orientation effects (Gunter et al. 2002). However, there is also at least ±5% absolute error on wet chemistry as well as the Mössbauer data. Finally, for completeness, Figure 10F shows a comparison of the few data points for which we have both XPS and SmX data on the same samples, and again, there is only qualitative agreement between the two methods.
It is common in such comparisons to place all of the “blame” for disagreement among methods upon the techniques themselves; a true skeptic might judge that some of these methods are not worth pursuing. However, the samples used in these comparisons are all naturally-occurring specimens, prepared as mineral separates from rocks with many iron-bearing phases; the majority of them are biotites from metapelitic rocks in northwestern Maine (Guidotti and Dyar 1991). Others are from scattered igneous parageneses, and were also prepared as separates from multiphase rocks. Thus, two problems with regard to the materials studied are likely. First, it is possible that the samples studied were not pure, and that other phases such as chlorite, oxides, or hornblende may be contaminating the separates (cf. Dyar et al. 2002). In all cases the samples were carefully checked under a microscope for purity, but a small amount of impurity is always possible. Second, the micas studied may themselves be heterogeneous. Preliminary measurements on biotites in metapelites by synchrotron micro-XANES using a 10 × 15 μm beam suggest that Fe3+/ΣFe variations of at least 20% (absolute) can be found within individual grains (Dyar et al. 1997; Lowe 2000). If this variation is typical (and given the well-established zoning of other major elements in naturally-occurring minerals at thin section scales, it probably is), then it must be the major source of error in all bulk measurements of such samples. Furthermore, disagreement between microanalytical methods might well be attributed to their differing resolutions (e.g., 2 mm × 250 μm for XPS, 10× 15 μm for XANES, and 3× 3 Å for EELS) because the scale of heterogeneities is variable from sample to sample.

Optical and Mössbauer Spectroscopy of Iron in Micas 335
Figure 10. (A) Comparison of wet chemical and Mössbauer results on biotites. Results suggest that excellent agreement can be obtained between these techniques, even when Lorentzian line shapes are used to fit the Mössbauer spectra. (B,C) Comparison of XPS data with wet chemical (B) and Mössbauer (C) results on biotites, adapted from Raeburn et al. (1997a,b). (D,E) SmX results on Fe3+/ΣFe in micas plotted against wet chemical (D) and Mössbauer (E) data. (F) Comparison of XPS with XANES data on the same samples.
(A) data from Bowen et al. (1969), Hogarth et al. (1970), Hogg and Meads (1970), Annersten (1974), Manapov and Sitdikov (1974), Ivanitskiy et al. (1975a,b), Bancroft and Brown (1975), Cimbálniková et al. (1977), Ericsson et al. (1977), Sanz et al. (1978), Shinno and Suwa (1981); Amirkhanov et al. (1982a), Gongbao and Shurong (1986), Yonggang (1986). (F) XANES data are from Dyar et al. (2001) and XPS data are from (Raeburn et al. 1993).

336 Dyar
In this review, Mössbauer spectroscopy has been shown to be significantly improved to a very precise art, largely due to the worker of Rancourt, Redhammer, and their coauthors. Given homogeneous samples (such as synthetics), the most recent studies have proposed several elegant solutions for interpretation of quadrupole splitting distributions as well as for measurement of Fe3+/ΣFe. However, it is likely that Mössbauer and wet chemical (i.e., bulk) studies of Fe in micas have reached the limits of their usefulness with respect to elucidating redox processes in rock-forming minerals because these materials are inherently heterogeneous. The precision of these methods is now better than the reproducibility of the results from aliquot to aliquot in any given natural occurrence (expect in very rare cases where grain to grain heterogeneities are consistently averaged out), so further improvements in these techniques are unlikely to produce new geologic insights. It remains for the new microscale methods to further understanding of the exact amount of oxidation and the redox equilibria at a thin section and smaller scales in micas; these revalations should be expected to revolutionize this field in the coming decade.
CONCLUSIONS Spectroscopic studies of mica are generally oriented toward yielding information on
either the site occupancy of iron or its valence state. Of the methods reviewed here, none is especially well-suited to assessing site occupancy in a quantitative fashion. It is now generally recognized that Mössbauer spectroscopy cannot distinguish between M1 and M2 occupancy of either Fe2+ or Fe3+ in micas, although quantitative information about [4]Fe3+ occupancy vs. total M-site occupancy can be obtained. Optical spectroscopy can identify [4]Fe3+, [6]Fe3+, and [6]Fe2+, but relative amounts cannot be quantified. XPS, EELS, and XANES do not yield direct information on site occupancy, although their line shapes and intensities are influenced by site geometries. In short, spectroscopic studies are best suited to addressing issues concerning octahedral vs. tetrahedral site occupancy, and poorly suited to determining M1/M2 occupancies. Workers interested in assessing geologic or mineralogic problems in which M1/M2 site ordering is important should seek out other non-spectroscopic techniques such as single crystal X-ray diffraction structure refinements.
However, studies of Fe3+/ΣFe in micas can employ an array of techniques depending on the size, homogeneity, and physical state of the samples of interest. Wet chemistry remains the method of choice when large amounts of pure, homogeneous sample and an experienced analyst are available. If the material to be studied is abundant in amount (i.e., 10-100 mg), free of inclusions, and homogeneous on a grain-to-grain scale, then careful study by Mössbauer using thickness corrections and quadrupole splitting distributions to model its sites can yield detailed information about Fe3+/ΣFe. Unfortunately, it is likely that most naturally-occurring samples do not meet these criteria.
In order to obtain true understanding of redox processes in naturally-occurring micas, microanalyical techniques must be employed. If the material can be prepared as beveled grains or thinned thin sections and the region of interest is the top 10-100 Å, then XPS or EELS can be used. For in situ analysis of Fe3+/ΣFe at 10×15 μm resolution in standard thin sections, synchrotron micro-XANES shows the best potential.
Ongoing development of the microanalytical techniques summarized here should eventually result in even more precise and accurate spectroscopic Fe3+/ΣFe ratios on a variety of different sample types, and may someday yield site occupancy information as well. Although many analytical problems remain to be worked out, major advances in understanding mica crystal chemistry and paragenesis can be expected in the next twenty years as technology facilitates continued improvements in the spectroscopic study of microscale behavior of Fe2+ and Fe3+.
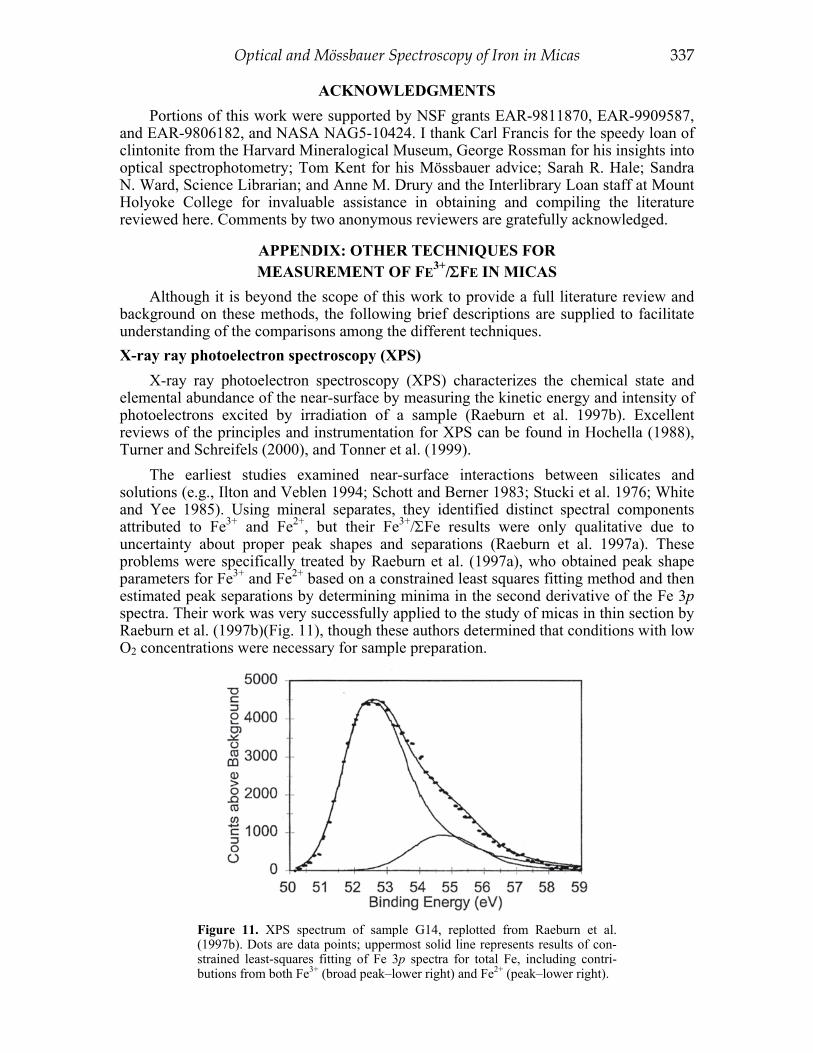
Optical and Mössbauer Spectroscopy of Iron in Micas 337
ACKNOWLEDGMENTS Portions of this work were supported by NSF grants EAR-9811870, EAR-9909587,
and EAR-9806182, and NASA NAG5-10424. I thank Carl Francis for the speedy loan of clintonite from the Harvard Mineralogical Museum, George Rossman for his insights into optical spectrophotometry; Tom Kent for his Mössbauer advice; Sarah R. Hale; Sandra N. Ward, Science Librarian; and Anne M. Drury and the Interlibrary Loan staff at Mount Holyoke College for invaluable assistance in obtaining and compiling the literature reviewed here. Comments by two anonymous reviewers are gratefully acknowledged.
APPENDIX: OTHER TECHNIQUES FOR MEASUREMENT OF FE3+/ΣFE IN MICAS
Although it is beyond the scope of this work to provide a full literature review and background on these methods, the following brief descriptions are supplied to facilitate understanding of the comparisons among the different techniques. X-ray ray photoelectron spectroscopy (XPS)
X-ray ray photoelectron spectroscopy (XPS) characterizes the chemical state and elemental abundance of the near-surface by measuring the kinetic energy and intensity of photoelectrons excited by irradiation of a sample (Raeburn et al. 1997b). Excellent reviews of the principles and instrumentation for XPS can be found in Hochella (1988), Turner and Schreifels (2000), and Tonner et al. (1999).
The earliest studies examined near-surface interactions between silicates and solutions (e.g., Ilton and Veblen 1994; Schott and Berner 1983; Stucki et al. 1976; White and Yee 1985). Using mineral separates, they identified distinct spectral components attributed to Fe3+ and Fe2+, but their Fe3+/ΣFe results were only qualitative due to uncertainty about proper peak shapes and separations (Raeburn et al. 1997a). These problems were specifically treated by Raeburn et al. (1997a), who obtained peak shape parameters for Fe3+ and Fe2+ based on a constrained least squares fitting method and then estimated peak separations by determining minima in the second derivative of the Fe 3p spectra. Their work was very successfully applied to the study of micas in thin section by Raeburn et al. (1997b)(Fig. 11), though these authors determined that conditions with low O2 concentrations were necessary for sample preparation.
Figure 11. XPS spectrum of sample G14, replotted from Raeburn et al. (1997b). Dots are data points; uppermost solid line represents results of con-strained least-squares fitting of Fe 3p spectra for total Fe, including contri-butions from both Fe3+ (broad peak–lower right) and Fe2+ (peak–lower right).

338 Dyar
The work of Raeburn et al. (1997a,b) used a 2 mm × 250 μm collection area, which is admittedly much larger than true microbeam techniques (but much smaller than bulk methods!). However, their results compare extremely well with those of wet chemistry and Mössbauer. Given the relatively wide availability of XPS instrumentation, this technique has great potential for future studies. Electron energy-loss spectroscopy (EELS)
Recent advances in instrumentation have made possible the study of Fe L2,3 spectra via the technique of EELS and the related technique of energy-loss near-edge spectroscopy (ELNES). These methods have been used to study Ti, Mn, and Fe oxidations states in non-silicate systems by several workers, including Taftø and Krivanek (1982), Leapman et al. (1982), Otten et al. (1985), Paterson and Krivanek (1990), Colliex et al. (1991) and Van der Laan and Kirkman (1992); more general references to the method can be found in Egerton (1986). Although this technique has not yet been used to study micas, it seems appropriate to mention it here in passing, because such data on micas will undoubtedly be forthcoming in the near future.
EELS and ELNES differ from XAS and XANES (which use 1s → 3d transitions, or K edge absorptions, cf. Mottana et al., this volume) in that they explore the L2,3 (or even M2,3 ) edges of 3d metals, which contain a different type of information. The L absorptions result from dipole transitions from core 2p to empty 3d states, and their energies and transition probabilities depend on local electronic structure because of the large Coulomb interaction between these two levels (Cressey et al. 1993). L-edge spectra have advantages over XAS and XANES spectra because the 2p → 3d transitions are dipole-allowed (compared with the spin forbidden transitions observed in XAS) and the intrinsic core-hole lifetime broadening is 3 to 4 times smaller for L-level transitions than for K-level ones, such that peak widths are on the order of 0.1-0.3 eV instead of 1.0 eV (Cressey et al. 1993). Also, EELS can be coupled with TEM (parallel electron energy-loss spectroscopy, of PEELS) instead of a synchrotron, so it can take advantage of the high spatial resolution and greater accessibility of TEM.
As an example of the application of this technique to silicates, Cressey et al. (1993) used the synchrotron at Daresbury to study the L-edge XAS spectra of spinel, glass, and amphibole, and obtained excellent agreement between stoichiometric or Mössbauer results and their best-match simulations of experimental spectra. Garvie et al. (1994) used ELNES of oxides and silicates to characterize peak shapes and to describe valence-specific structures in their spectra that are characteristic of multiple valence states of Fe, Cr, and Mn. Van Aken et al. (1998) recorded EELS spectra in a TEM and carefully characterized the energies of the Fe L3-edge for Fe2+ (707.8 eV and 710.5 eV) and Fe3+ (708.0 eV and 709.5 eV). They developed a universal calibration curve for determining Fe3+/ΣFe based upon the integral white-line intensity ratio of I(L3)/I(L2). Van Aken et al. (1999) used Fe M2,3 edges to develop a quantitative method for Fe3+/ΣFe determinations based on characteristic Fe3+ (4.2 eV) and Fe2+ (2.2 eV) peaks. Garvie and Buseck (1998) use Fe L2,3 spectra to show excellent agreement between Fe3+/ΣFe measured by EELS and conventional methods. These techniques offer the exciting prospect of resolution of Fe3+ variations on a scale as small as 3 Å, though their sampling depth is barely 100 μm. Their main drawback is the need to study only thinned edges of grains, which prohibits analysis of grains in situ in standard thin sections, so these techniques will be dominantly mineralogical, rather than petrological tools. X-Ray absorption spectroscopy (XAS)
Although the topic of X-ray absorption spectroscopy (XAS) is thoroughly covered elsewhere in this volume by Mottana et al. (this volume), its use in predicting Fe3+/ΣFe

Optical and Mössbauer Spectroscopy of Iron in Micas 339
contents in micas is not discussed in detail, so a very brief summary will be supplied here in order to faciltate understanding of Figure 10. This technique (sometimes called synchrotron micro-XANES, or SmX) uses the position and, to a lesser extent, the intensity of peaks in the Fe K pre-edge to determine Fe3+/ΣFe contents. One of the first major advances in this field was a paper by Bajt et al. (1994), which used a calibration line based on Gaussian line shape fits to single peaks for each pre-edge. The resultant pre-edge peak energies from synthetic fayalite (Fe2SiO4, 0% Fe3+), natural magnetite (Fe3O4, 66.7% Fe3+), and hematite (Fe2O3, 100% Fe3+) are used to derive a calibration line for determining Fe3+ contents of unknowns from pre-edge energy.
In a more sophisticated approach, recent work by Galoisy and Calas (1999, 2001) employed single mineral species to represent each type of Fe valence and coordination. Reference spectra of andradite are used for [6]Fe3+, augite glass for [4,5]Fe2+, berlinite for [4]Fe3+, staurolite for [4]Fe2+, and siderite for [6]Fe2+. Pseudo-Voigt line shapes were used to deconvolute the pre-edge spectra into 2 to 4 peaks each, and then spectra of unknowns are fit to linear combinations of the pure reference spectra. This method effectively uses the distribution of each pre-edge peak, so it uses both intensity and position. A useful improvement on this method would utilize spectra of endmember micas containing only [6]Fe2+, [6]Fe3+, or [4]Fe3+.
Finally, recent work by Dyar et al. (2001) has created a mica-specific calibration line based on pre-edge positions of micas for which wet chemical or Mössbauer Fe3+/ΣFe contents were known (Fig. 12). Based upon this calibration line, Fe3+/ΣFe contents of unknown micas can be determined. However, results from this calibration are almost indistinguishable from those of the Bajt et al. (1994) method. Thus, the Bajt et al. (1994) calibration method was used to produce the Fe3+/ΣFe results shown in Figure 10.
Figure 12. Calibration line for evaluating Fe3+/ΣFe in micas based on the position of the centroid of the Fe K edge. Line shown is the best fit to the data. This regression line is then used to predict the percent Fe3+ in the same suite of unknowns, which results in an almost perfect 1:1 relationship between percent Fe3+ predicted by SmX and percent Fe3+ determined by bulk methods. Wet chemical data: triangles; Mössbauer data: circles. The equation of this calibration line almost exactly matches the calibration line for oxides developed by Bajt et al. (1994).
340 Dyar
REFERENCES Albee AL, Chodos AA (1970) Semiquantitative electron microprobe determination of Fe2+/Fe3+ and
Mn2+/Mn3+ in oxides and silicates and its application to petrologic problems. Am Mineral 55:491-501 Aldridge LP, Bill E, Bläs R, Lauer S, Marathe VR, Sawaryn A, Trautwein AX Winkler H (1986) Electronic
structure of Fe in some minerals, derived from iterative extended Huckel theory (IEHT), multiple scattering Xα (MS-Xα) calculations, and Mössbauer measurements. Am Mineral 71:1015-1021
Aldridge LP, Finch J, Gainsford A, Ross C Tennant W (1987) Electric-field gradient in muscovites. Am Mineral 72:528-536
Aldridge LP, Finch J, Gainsford GJ, Patterson KH Tennant WC (1991) Single-crystal Mössbauer studies of 1M biotite. Phys Chem Minerals 17:583-590
Amirkhanov KI, Anojhina LK, Chalabov RI Gabitova RU (1982a) Interpretatsiya kaliy-argonovogo vozrasta dokembriyskikh biotitov i flogopitov po Messbauerivskim spektram zheleza. Dokl Akad Nauk SSSR 262:1236-1238
Amirkhanov KI, Anokhina LK (1974) Issledovaniye kvadrupol'nogo rasshchepleniya messbauerovskikh spektrov 57Fe v raznovozrastnykh mineralakh. [Investigating quadrupole splitting of Mössbauer spectra of 57Fe in minerals of different age.] Dokl Akad Nauk SSSR 218:919-920
Amirkhanov KI, Anokhina LK, Chalabov RI Gabitova RU (1982b) Interpretation of potassium-argon age of Precambrian biotite and phlogopite from Moessbauer spectra of iron. Dokl Akad Nauk SSSR 262:202-204
Amirkhanov KI, Anokhina LK, Gabitova RU, Nikolayeva IV, Chalabov RI (1984) Messbauyehrovskaya spektroskopiya 57Fe i tipomorfnyye priznaki mineralov gruppy glaukonita. [Mössbauer spectroscopy of 57Fe and typomorph particularities of the mineral group of glauconite.] Dokl Akad Nauk SSSR 275: 967-970
Annersten H (1974) Mössbauer studies of natural biotites. Am Mineral 59:143-151 Annersten H (1975a) A Mössbauer characteristic of ordered glauconite. N Jahrb Mineral Monatsh 8:
378-384 Annersten H (1975b) Mössbauer study of iron in natural and synthetic biotites. Fortschr Mineral 52:
583-590 Annersten H, Devanaryanan S, Häggstrom L Wappling, R (1971) Mössbauer study of synthetic ferri-
phlogopite KMg3Fe3+Si3O10(OH)2. Phys Stat Solidi B48:K137-K138 Annersten H, Hälenius U (1976) Iron distribution in pink muscovite, a discussion. Am Mineral 61:
1045-1052 Annersten H, Olesch M (1978) Distribution of ferrous and ferric iron in clintonite and the Mössbauer
characteristics of ferric iron in tetrahedral coordination. Can Mineral 16:199-203 Arnott RA (1968) Mössbauer Studies of Iron in Glauconite. PhD dissertation, University of Wisconsin–
Madison, 115 p Babushkina MS, Nikitina LP (1985) Mössbauer study of cation distribution and energetics of biotite solid
solution. In Applications of the Mössbauer Effect: Applications in Other Fields. YMe Kagan, ISe Lyubutin (eds) Alma-Ata, USSR 5:1683-1687
Babushkina M, Lepekhina E, Nikitina L, Ovchinnikov N, Lokhov K (1999) Composition and crystal structure defects of micas from lamproites. Eur Union Geol Abstr 4:641
Babushkina MS, Nikitina LP, Ovchinnikov NO, Savva EV, Lukianova LI, Genshaft YS (1997) Compositions and real structures of phlogopites from the Kostomuksha lamproites. Zapiski Vserossiaeiskogo mineralogicheskogo obshchestva 16:71-84
Bagin VI, Gendler TS, Dainyak LG, Kuz'min RN (1980) Mössbauer, thermomagnetic, and X-ray study of cation ordering and high-temperature decomposition in biotite. Clays Clay Minerals 28:188-196
Bajt S, Sutton SR, Delaney JS (1994) Microanalysis of iron oxidation states in islicates and oxides using X-ray absorption near-edge structure (XANES). Geochimica et Cosmochimica Acta 58:5209-5214
Bakhtin AI (1980) Kristallokhimiya tetraferriflogopitov po dannym opticheskoy spektroskopii. [Crystal chemistry of tetraferriphlogopites based on optical spectroscopy.] Geokhimiya 1980:910-914
Bakhtin AI, Bulatov FM, Guziyev IS (1986) The crystallochemical informativeness of optical and Mössbauer spectra for ferromagnesian micas. Geochem Int’l 23:100-105
Bakhtin AI, Vinokurov VM (1978) Exchange-coupled pairs of transition metal ions and their effect on the optical absorption spectra of rock-forming silicates. Geokhimya 1:87-95
Ballet O (1986) Comment on "Magnetism in biotites". Phys Chem Minerals 13:281 Ballet O, Amthauer G (1986) Room-temperature Mössbauer study of the EFG tensor at the iron sites in
sheet silicates. J Phys C: Solid State Phys 19:7099-7112 Ballet O, Coey JMD (1982) Magnetic properties of sheet silicates: 2:1 layer minerals. Phys Chem Minerals
8:218-229

Optical and Mössbauer Spectroscopy of Iron in Micas 341
Ballet O, Coey JMD, Massenet O (1979) Electric field gradient at Fe2+ sites in trioctahedral layer silicates. J Phys C2 40:283-285
Bancroft GM (1969) Quantitative site populations in silicate minerals by the Mössbauer effect. Chem Geol 5:255-258
Bancroft GM (1973) Mössbauer Spectroscopy. An Introduction for Inorganic Chemists and Geochemists. McGraw Hill, New York
Bancroft GM, Brown JR (1975) A Mössbauer study of coexisting hornblendes and biotites: quantitative Fe3+/Fe2+ ratios. Am Mineral 60:265-272
Bashkirov SS, Bulatov FM, Yakovlev VV (1987) Utochneniye rasshifrovki slaborazreshennykh GR-spektrov sloistykh silikatov. [Refinement of gamma-ray spectra identification for laminated silicates.] Mineralogicheskiy Zh 9:90-92
Bastin GF, Heijligers HJM (1991) Quantitative electron probe microanalysis of ultra-light elements (boron-oxygen). In Electron Probe Quantification. KFJ Heinrich, Newbury DE (eds) Plenum Press, New York, p 145-151
Blamey PJ (1977) The area of a single line Mössbauer absorption spectrum. Nucl Instr Methods 142: 553-557
Blomquist J, Kjäll P, Malmström M, Banwart S (1996) Mössbauer studies of the weathering process in some mica minerals. Conf Proc, Int’l Conf Appl Mössbauer Effect 1995, SIF, Bologna, 721-724
Bonnin D, Muller S (1981) Study of the electric-field gradient in muscovite by the Mössbauer spectrometry of iron. Phys Stat Solidi C–Basic Res 105:647-657
Bookin AS, Dainyak LG, Drits VA (1978) Interpretation of the Mössbauer spectra of layer silicates on the basis of structural modeling. Abstr 11th Mtg Int’l Mineral Assoc 3:58-59
Bowen LH, Weed SB, Stevens JG (1969) Mössbauer study of micas and their potassium-depleted products. Am Mineral 54:72-84
Bowen LH, DeGrave E, Reid DA (1989) Mössbauer study of a California desert celadonite and its pedo-genically-related smectite. Phys Chem Minerals 16:697-703
Bukin AE, Dainak LG, Dric WA (1979) Interpretasia YaGR-spetrov 57Fe soderzhashchikh sloistikh silikatov na osnovie structurrnogo modelirovania. Kationnoe uporiadothenie v structurakh mineralov. Nauka, Moscow, p 23-41
Burkhard DJM, Ulmer GC, Redhammer G, Myer GH (1999) Dynamic electrochemicwal assessment of redox reactions in natural micas between 613 and 1373 K at 105 Pa. Am Mineral 84:493-505
Burns RG, Solberg TC (1988) 57Fe-bearing oxide, silicate, and aluminosilicate minerals. In Spectroscopic Characterization of Minerals and Their Surfaces 415:263-282. LM Coyne, SWS McKeever, DF Blake (eds) Am Chem Soc, Los Angeles, California
Cardile CM, Brown IWM (1988) An 57Fe Mössbauer spectroscopic and x-ray diffraction study of New Zealand glauconite. Clay Minerals 23:13-25
Chandra R, Lokanathan S (1977) Electric field gradient in biotite mica. Phys Stat Solidi 83:273-280 Chandra U, Lokanathan S (1982) A Mössbauer study of the effect of heat treatment on biotite micas. J Phys
D: Appl Phys 15:2331-2340 Chang C-M, Wang M-K, Pan Y-C, Tseng P-K, Chen P-Y (1993) Refinement of nontronite, celadonite and
sepiolite Mössbauer spectra at 77 K temperature. J Geol Soc China 36:189-202 Chen R (1985) Study of the mineralogical characteristics and sedimentary environment of glauconite from
some regions in China. Petrol Res 5:91-101 Christie IAD, Rancourt DG, Kodama H, Robert JL (1992a) Use of high and low temperature Mössbauer
measurements in the determination of the magnetic structure of micas. EOS, Trans Am Geophys Union 73:97
Christie IAD, Rancourt DG, Lamarche G (1992b) Low temperature Mössbauer spectroscopy and magnetism of synthetic annite mica. Hyper Interact 68:315-318
Cimbálniková A, Raclavsky K, Hejl V, Sitek J (1977) Iron in biotites and its Mössbauer spectroscopy. 7th Conf Clay Mineralogy and Petrology, Karlovy Vary, Czechoslovakia, p 77-84
Cimbálniková A, Raclavsky K, Lipka J (1973) Zelezo v glaukonitech a jeho Mössbauerova spectroskopie. 6th Conf Clay Minerals, p 57-65
Clark MG, Bancroft GM, Stone AJ (1967) Mössbauer spectrum of Fe2+ in a square planar environment. J Chem Phys 47:4250-4261
Coey JMD (1980) Clay minerals and their transformation studied with nuclear techniques: the contribution of Mössbauer spectroscpoy. Atomic Energy Rev 18:73-124
Colliex C, Manoubi T, Ortiz C (1991) Electron energy-loss spectroscopy near-edge fine structure in the iron-oxygen system. Phys Rev B 44:11402-11411
Cressey G, Henderson CMB, van der Laan G (1993) Use of L-edge X-ray absorption spectroscopy to characterize multiple valence states of 3d transition metals; a new probe for mineralogical and geochemical research. Phys Chem Minerals 20:111-119

342 Dyar
Cruciani G, Zanazzi PF, Quartieri S (1995) Tetrahedral ferric iron in phlogopite; XANES and Mössbauer compared to single-crystal X-ray data. Eur J Mineral 7:255-265
Daynyak LG, Besson Z, Slonimskaya MV, Chubar' K, Drits VA, Kameneva MY (1987) Interpretatsiya IK-spektrov dioktaedricheskikh slyud v oblasti valentnykh kolebaniy OH-grupp. [Interpretation of infrared spectra of dioctahedral micas in the region of stretching vibrations of OH-groups.] Mineralogicheskiy Zh 9:46-54
Daynyak LG, Bukin AS, Drits VA (1984a) Interpretation of Mössbauer spectra of dioctahedral Fe3+ containing layer silicates; Part 3, Celadonite. Sov Phys Crystallogr 29: 186-191
Daynyak LG, Bukin AS, Drits VA (1984b) Interpretatsiya messbauerovskikh spektrov dioktaedricheskikh Fe3+-Soderzhashchikh sloistykh silikatov; III, Seladonit. [Interpretation of Mössbauer spectra of dioctahedral Fe3+-containing layered silicates; III, Celadonite.] Kristallografiya 29:312-321
Daynyak LG, Drits VA (1987) Interpretation of Mössbauer spectra of nontronite, celadonite glauconite. Clays Clay Minerals 35:363-372
Daynyak LG, Drits VA, Heifits LM (1992) Computer simulation of cation distribution in dioctahedral 2:1 layer silicates using IR-data; application to Mössbauer spectroscopy of a glauconite sample. Clays Clay Minerals 40:470-479
De Grave E, Van Alboom A (1991) Evaluation of ferrous and ferric Mössbauer fractions. Phys Chem Minerals 18:337-342
De Grave E, Vandenbruwaene J, Elewaut E (1985) An 57Fe Mössbauer effect study on glauconites from different locations in Belgium and northern France. Clay Minerals 20:171-179
Deer WA, Howie RA, Zussman J (1992) An Introduction to the Rock-Forming Minerals. Longman Scientific and Technical, Essex, UK, 696 p
DeGrave E, Geets S (1979) 57Fe Mössbauereffektmetingen aan Belgische glauconieten. Bull Belgische Vereniging Geol 88:237-251
Delaney JS, Dyar MD, Sutton SR, Bajt S (1998) Redox ratios with relevant resolution: Solving an old problem using the synchrotron microXANES probe. Geology 26:139-142
Dhar RN, Mandal SS, Roy SR (1959) Electrical properties of Indian micas—d.c. resistivity. Central Glass Ceramic Inst Bull (India) 6:29036
Djemai A (1992) Distribution of cations in masutomillite, Mn analog of zinnwaldite. Abstr 29th Int’l Geol Congr, Tsukuba—Kyoto, Japan, p 531
Dobrowolski JA (1959) Mica interference filters with transmission bands of very narrow half-widths. J Optical Soc Amer, 49:794-806
Drits VA, Dainyak LG, Muller F, Besson G, Manceau A (1997) Isomorphous cation distribution in celadonites, glauconites, and Fe-illites determined by Infrared, Mössbauer, and EXAFS spectroscopies. Clay Minerals 32:153-179
Dudko VS, Belevtsev RY, Pol'shin EV (1991) O soderzhanii Fe3+ v biotitakh iz granatsoderzhashchikh metapelitov. Mineralogicheskiy Zh 13:90-94
Dyar MD (1984) Precision and interlaboratory reproducibility of measurements of the Mössbauer effect in minerals. Am Mineral 69:1127-1144
Dyar MD (1986) Practical application of Mössbauer goodness-of-fit parameters for evaluation of real experimental results: A reply. Am Mineral 71:1266-1267
Dyar MD (1987) A review of Mössbauer data on trioctahedral micas; evidence for tetrahedral Fe3+ and cation ordering. Am Mineral 72:102-112
Dyar MD (1989) Applications of Mössbauer goodness-of-fit parameters to experimental spectra: Further discussion. Am Mineral 74:688
Dyar MD (1990) Mössbauer spectra of biotites from metapelites. Am Mineral 75:656-666 Dyar MD (1993a) Mössbauer spectroscopy of tetrahedral Fe3+ in trioctahedral micas; discussion. Am
Mineral 78:665-668 Dyar MD, Guidotti CV, Holdaway MJ, Colucci M (1993b) Prevalence of oxysubstitution in common rock-
forming hydrous silicates. Geochim Cosmochim Acta 57:2913-2918 Dyar MD, Burns RG (1986) Mössbauer spectral study of ferruginous one-layer trioctahedral micas. Am
Mineral 71:955-965 Dyar MD, Colucci MT, Guidotti CV (1991) Forgotten major elements: Hydrogen and oxygen variation in
biotite from metapelite. Geology 19:1029-1032 Dyar MD, Delaney JS, Sutton SR, Guidotti CV (1997) In situ microanalysis and partitioning of
ferric/ferrous in metapelite from western Maine. Geol Soc Am Ann Mtg, Salt Lake City, Utah, p A399 Dyar MD, Delaney JS, Sutton SR (2001) XANES spectra of Fe-rich micas. Eur J Mineral 13:1079-1098 Dyar MD, Lowe EW, Guidotti CV, Delaney JS (2002) Fe3+ and Fe2+among silicates in metapelites: A
synchrotron micro-XANES study. Am Mineral (in press) Earley DI, Ilton E, Veblen DR (1990) Cu uptake by high- and low-F biotite buring experimental
weathering of biotite with CuSO4 solutions. Geol Soc Am Ann Meeting, Dallas, Texas, p A152

Optical and Mössbauer Spectroscopy of Iron in Micas 343
Egerton RF (1986) Electron Energy-Loss Spectroscopy in the Electron Microscope. Plenum Press, New York
Ericsson T, Wäppling R, Punakivi K (1977) Mössbauer spectroscopy applied to clay and related minerals. Geologiska Foreningens i Stockholm Forhandlingar 99:229-244
Eugster HP, Wones DR (1962) Stability relstions of the ferruginous biotite, annite. J Petrol 3:82-125 Eyrish MV, Dvorechenskaya AA (1976) Mössbauer study of the position and role of Fe3+ ions in the
structure of clay minerals (and their relation to the crystal chemistry of the minerals). Geochem Int’l 13:79-87
Farmer GL, Boettcher AL (1981) Petrologic and crystal-chemical significance of some deep-seated phlogopites. Am Mineral 66:1154-1163.
Faye GH (1968a) The optical absorption spectra of certain transition metal ions in muscovite, lepidolite, and fuchsite. Can J Earth Sci 5:31-38
Faye GH (1968b) The optical absorption spectra of iron in six-coordinate sites in chlorite, biotite, phlogopite and vivianite; some aspects of pleochroism in the sheet silicates. Can Mineral 9:403-425
Faye GH, Hogarth DD (1969) On the origin of "reverse pleochroism' of a phlogopite. Can Mineral 10:25-34
Feeley TC, Sharp ZD (1996) Chemical and hydrogen isotope evidence for in situ dehydrogenation of biotite in silicic magma chambers. Geology 24:1021-1024
Feldstein SN, Lange RA, Vennemann T, O'Neil JR (1996) Ferric-ferrous ratios, H2O contents, and D/H ratios of phlogopite and biotite from lavas of different tectonice regimes. Contrib Mineral Petrol 126:51-66
Ferrow E (1987a) Mössbauer and X-ray studies on the oxidation of annite and ferrianite. Phys Chem Minerals 14:270-275
Ferrow E (1987b) Mössbauer effect and X-ray diffraction studies of synthetic iron bearing trioctahedral micas. Phys Chem Minerals 14:276-280
Ferrow EA (1998) Some examples of the application of Mössbauer spectroscopy and transmission electron microscopy to micas. Hyper Interact 117:159-173
Ferrow EA, Kalinowski BE, Veblen DR, Schweda P (1999) Alteration products of experimentally weathered biotites studied by high-resolution TEM and Mössbauer spectroscopy. Eur J Mineral 11:999-1010
Filut MA, Rule AC, Bailey SW (1985) Crystal structure refinement of anandite-2OR, a barium- and sulfur-bearing trioctahedral mica. Am Mineral 70:1298-1308
Finch J (1963) A colorimetric classification of Australian pegmatitic muscovite. Am Mineral 48:525-554 Finch J, Gainsford AR, Tennant WC (1982) Polarized optical absorption and 57Fe Mössbauer study of
pegmatitic muscovite. Am Mineral 67:59-68 Foster MD (1960) Interpretation of the composition of trioctahedral micas. U S Geol Surv Prof Paper
354-B:11-49 Foster MD (1964) Water content of micas and chlorites. U S Geol Soc Prof Paper 0474-F:F1-F15 Galoisy L, Calas G, Arrio MA (1999) High resolution XANES spectra of iron in minerals and volcanic
glasses: Information from the pre-edge region. EOS Trans Am Geophys Union 80:F114 Galoisy L, Calas G, Arrio MA (2001) High-resolution XANES spectra of iron in minerals and glasses:
structural information from the pre-edge region. Chem Geol 174:307-319 Garvie LAJ, Buseck PR (1998) Ratios of ferrous to ferric iron from nanometre-sized areas in minerals.
Nature 396:667-670 Garvie LAJ, Craven AJ, Brydson R (1994) Use of electron-energy loss near-edge fine structure in the study
of minerals. Am Mineral 79:411-425 Gendler TS, Daynyak LG, Kuz'man RN (1978) Parameters of the Mössbauer spectrum of Fe3+ ions in
biotite, and continuity of biotite-oxybiotite transition at 300-900K. Geokhimiya 11:1633-1638 Ghosh D, Bahel BM, Raman KV (1978) Studies on valence states and co-ordination behaviour of iron in
biotite and vermiculite using Mössbauer spectroscopy. J Indian Soc Soil Sci 26:397-398 Gongbao W, Shurong C (1986) Mössbauer study of manganese biotite from Kuiqi, China. 14th Int’l
Mineral Assoc Mtg, Stanford, California, p 269 Goodman BA (1976) The Mössbauer spectrum of a ferrian muscovite and its implications in the
assignment of sites in dioctahedral micas. Mineral Mag, 40:513-517 Gorokhov IM, Yakovleva OV, Semikhatov MA, Ivanovskaya TA (1995) Mössbauer spectra of globular
phyllosilicates of the glaucontie series; the middle Riphean Debengda Formation of the Olenek Uplift, northern Siberia. Lithol Mineral Resources 30:556-571
Gorokhov IM, Yakovleva OV, Kutyavin EP (1997) “Rejuvenated” Al-glauconite in Vendian-Cambrian deposits of Podolina Dniester Region, Ukraine: Rb-Sr and K-Ar systematics and 57Fe Mössbauer spectra. Lithol Mineral Resources 32:541-558

344 Dyar
Govaert A, De Grave E, Quartier H, Chambaere D, Robbrecht G (1979) Mössbauer analysis of glauconites of different Belgian finding places. Int’l Conf Appl Mössbauer Effect, Kyoto, Japan, p 442-444
Grant CA (1995) Sources of experimental and analytical error in measurements of the Mössbauer effect in amphibole. PhD dissertation, Chemistry Dept, University of Oregon, Eugene, 213 p
Greenwood NB, Gibb TC (1971) Mössbauer Spectroscopy. Chapman and Hall, London, 45 p Grum-Grzhimaylo SV, Anikina EN, Belova EN, Tolstikhina KI (1955) Curves of spectral absorption and
other physical constants of natural micas. Zapiski Vsesoyuznogo Mineralogicheskogo Obshchestva 9:90-119
Grum-Grzhimaylo SV, Rimskaya-Korsakova OM (1964) O spektrakh pogloshcheniya flogopitov, soder-zhashchikh trexvalentnoya zhelezo v chetvernoy koordinatsii. Dokl Akad Nauk SSSR 156:847-850
Grum-Grzhimaylo SV, Rimskaya-Korsakova OM (1965) Absorption spectra of phlogopite holding tirvalent iron in fourfold coordination. Geochem Int’l 123-125
Guidotti CV, Dyar MD (1991) Ferric iron in metamorphic biotite and its petrologic and crystallogchemical implications. Am Mineral 76:161-175
Guidotti CV, Yates MG, Dyar MD, Taylor M (1994) Petrogenetic implications of Fe3+ content of muscovite in pelitic schists. Am Mineral 79:793-795
Gunter ME, Dyar MD, Delaney JS, Sutton SR, Lanzirotti A (2002) Effects of preferred orientation on microscale XANES measurements of Fe3+/∑Fe in biopyriboles. 33rd Ann Lunar Planet Sci Conf, Abstr #1654
Guseinov AA (1999) Relationship between ion conductivity and the heat-induced processes of oxidation and dehydroxylation in ferrous-magnesian micas. Geochem Int’l 37:87-90
Häggstrom L, Wappling R, Annersten H (1969) Mössbauer study of iron-rich biotites. Chem Phys Lett 4:107-108
Hall JA (1941) The relation between colour and chemical composition in the biotites. Am Mineral 26: 29-33
Hargraves P, Rancourt DG, Lalonde AE (1990) Single-crystal Mössbauer study of phlogopite mica. Can J Phys 68:128-144
Hawthorne FC (1988) Mössbauer spectroscopy. Rev Mineral 18:255-339 Heller-Kallai L (1982) Mössbauer studies of synthetic and natural micas on the polylithionite-siderophyllite
join: Comment. Phys Chem Minerals 8:98 Heller-Kallai L, Rozenson I (1981) The use of Mössbauer spectroscopy of iron in clay minerals. Phys
Chem Minerals 7:223-238 Herberle J (1971) The Debye integrals, the thermal shift, and the Mössbauer fraction. In IJ Gruverman (ed)
Mössbauer Effect Methodology 7:299-308, Plenum Press, New York Herzenberg CL, Riley DL, Lamoreaux R (1968) Mössbauer absorption in zinnwaldite mica. Nature
219:364-365 Hochella MF Jr (1988) Auger electron and X-ray photoelectron spectroscopies. Rev Mineral 18:573-638 Höfer HE, Brey GP, Schulz-Dobrick B, Oberhansi R (1994) The determination of the oxidation state of
iron by electron microprobe. Eur J Mineral 6:407-418 Hofmann U, Fluck E, Kuhn P (1967) Mössbauer spectrum of the iron in glauconite. Angew Chem Int’l Edn
6:561-562 Hogarth DD, Brown FF, Pritchard AM (1970) Biabsorption, Mössbauer spectra, and chemical investigation
of five phlogopite samples from quebec. Can Mineral 10:710-722 Hogg CS, Meads RE (1970) The Mössbauer spectra of several micas and related minerals. Mineral Mag
337:606-614 Hogg CS, Meads RE (1975) A Mössbauer study of thermal decomposition of biotites. Mineral Mag 40:
79-88 Homonnay Z, Kuzmann E, Vertes A, Kubovics I, Solymos KG, Szabo C (1988) Mössbauer study of
phlogopites from upper mantle ultramafic xenoliths (Alcsucsdoboz, Hungary). J Radioanal Nuclear Chem 127:289-297
Il'chenko YA, Grinchenko VF, Khomenko VM, Zinchenko OV (1990) Kristallokhimicheskiye osobennosti biotitov severo-zapadnoy chasti Ukrainskogo shchita po dannym IK- i opticheskoy spektroskopii. [Crystal chemical characteristics of biotite in the northwestern Ukrainian Shield according to infrared and optical spectroscopic data.] Mineralogicheskiy Zh 12: 8-18
Ilton ES, Veblen DR (1994) Chromiun sorption by phlogopite and biotite in acidic solutions at 25°C; insights from X-ray photoelectron spectroscopy and electron microscopy. Geochim Cosmochim Acta 58:2777-2788
Ivanitskiy VP, Kalinechenko AM, Matyash IV, Khomyak TP (1975a) Mössbauer and PMR studies of oxidation and dehydroxylation in biotite. Geochem Int’l 12:145-151
Ivanitskiy VP, Matyash IV, Rakovich FI (1975b) Effects of irradiation on the Mössbauer spectra of biotites. Geochem Int’l 12:151-157

Optical and Mössbauer Spectroscopy of Iron in Micas 345
Ivanitskiy VP, Matyash IV, Rakovich FI (1975c) Vliyaniye radioaktivnykh izlucheniy na messbauerovskiye spektry biotitov. [Effects of irradiation on the Mössbauer spectra of biotites.] Geokhimiya 1975:850-857
Johnston JH, Cardile CM (1987) Iron substitution in montmorillonite, illite, and glauconite by 57Fe Mössbauer spectroscopy. Clays Clay Minerals 35:170-176
Judd DB (1945) Color standard for ruby mica. J Res Nat’l Bur Standards 35:245-256 Kalinichenko AM, Litovchenko AS, Matyash IV, Pol'shin EV, Ivaniskiy VP (1973) Osobennosti
kristallokhimii sloistykh silikatov po dannym radiospektroskopy. Naukova Dumka, Kiev, p 108 Karickhoff SW, Bailey GW (1973) Optical absorption spectra of clay minerals. Clays Clay Minerals 21:
59-70 Khomenko VM (1994) Optical absorption spectra of rock-forming biotites and phlogopites. Abstr 16th Gen
Mtg Int’l Mineral Assoc 16:202 Khomenko VM, Galiy SA, Kogut KV, Grinchenko VF (1991) Geneticheskiye aspekty opticheskoy
spektroskopii porodoobrazuyushchikh temnotsvetnykh mineralov mafit-ul'tramafitovykh kompleksov severo-zapada Ukrainskogo shchita. [Genetic aspects of optical spectroscopy of rock-forming dark-colored minerals of mafic-ultramafic complexes of the southwestern Ukrainian Shield.] Mineralogicheskiy Zh 13:22-30
Khomenko VM, Grinchenko VF, Platonov AN, Zinchenko OV (1988) Priroda i tipomorfnoye znacheniye okraski biotita granitoidnykh kompleksov (na primere severo-zapada Ukrainskogo shchita). [The nature and typomorphical significance of biotite coloration: Example of northwestern Ukrainian Shield.] Mineralogicheskiy Zh 10:23-31
Kleiman LE, Saragovi C, Puglisi C, de Kanter FL (1992) Biotite oxidation processes in ash-flow tuffs (Mendoza, Argentina): A Mössbauer spectroscopy and chemical study. Chem Geol 97:251-264
Kliem W, Lehmann G (1979) A reassignment of the optical absorption bands in biotites. Phys Chem Minerals 4:65-75
Klingelhofer G, Held P, Teucher R, Foh J, Kankeleit E (1995) Mössbauer spectroscopy in space. Hyper Interact 95:305-339
Kotlicki A, Szczyrba J, Wiewióra A (1981) Mössbauer study of glauconites from Poland. Clay Minerals 16:221-230
LaLonde AE, Rancourt DG, Chao GY (1996) Fe-bearing trioctahedral micas from Mont Saint-Hilaire, Quebec, Canada. Mineral Mag 60:447-460
Lalonde AE, Rancourt DG, Ping JY (1998) Accuracy of ferric/ferrous determination in micas: A comparison of Mössbauer spectroscopy and the Pratt and Wilson wet-chemical methods. Hyper Interact 117:175-204
Leapman RD, Grunes LA, Fejes PL (1982) Study of the L2,3 edges in the 3d transition metals and their oxides by electron-energy-loss spectroscopy with comparison to theory. Phys Revs B 26:614-635
Levillain C, Maurel P, Menil F (1981) Mössbauer studies of synthetic and natural micas on the polylithionite-siderophyllite join. Phys Chem Minerals 7:71-76
Levillain C, Maurel P, Menil F (1982) Mössbauer studies of synthetic and natural micas on the polylithionite-siderophyllite join: Reply. Phys Chem Minerals 8:99-100
Levillain C, Maurel P, Menil F (1977) Localization of iron in a lepidolite mica from granite de Beauvior (French Massif central) by chemical and Mössbauer methods. Bull Soc fr Minéral Cristallogr 100:137-142
Long GJ, Cranshaw TE, Longworth G (1983) The ideal Mössbauer effect absorber thicknesses. Mössbauer Effect Ref Data J 6:42-49
Longworth G, Townsend MG, Provencher R, Kodama H (1987) Magnetic interaction in biotites and oxidised biotites. Phys Chem Minerals 15:71-77
Lowe EW (2000) Ferric/ferrous ratios as indicators of metamorphic grade and oxidation state in metapelites. B.A. thesis, Earth and Environment, Mount Holyoke College, South Hadley, Massachusetts, 245 p
Malmström M, Banwart S (1997) Biotite dissolution at 25°C; the pH dependence of dissolution rate and stoichiometry. Geochim Cosmochim Acta 61:2779-2799
Malathi N, Puri SP, Saraswat IP (1969) Mössbauer studies of iron in illite and montmorillonite. J Phys Soc Japan 26:680-683
Malysheva TV, Kazakov GA, Satarova LM (1975) Stepen' prigodnosti glaukonitov dlya opredeleniya absolyutnogo vozrasta K/Ar metodom po dannym messbauerovskoy spektroskopii. [The degree criteria of glauconite for the determination of ages by the K/Ar method of absolute dating with the use of Mössbauer spectroscopy.] Sostoyaniye metodicheskikh issledovaniy v oblasti absolyutnoy geokhronologii, p 72-84
Malysheva TV, Kazakov GA, Satarova LM (1976) Mössbauer data on sediment epigenesis temperatures. Geochem Int’l 13:1-8

346 Dyar
Manapov RA, Sitdikov BS (1974) Issledovaniye biotitov metamorficheskikh porod dokembriyskogo fundamenta Tatarskogo svoda metodom gamma-rezonansnoy spektroskopii. [Mössbauer study of biotites from the metamorphic rocks of the Precambrian basement in the Tatar Dome.] Geokhimiya 1974:1415-1420
Manapov RA, Sitdikov BS (1975) Mössbauer study of biotites from the metamorphic rocks of the Precambrian basement in the Tatar Dome. Geochem Int’l 11:976-980
Manning PG (1969) On the origin of colour and pleochroism of astrophyllite and brown clintonite. Can Mineral 9:662-677
Marfunin AS, Mineyeva RM, Mkrtchyan AR, Nyussik YM, Fedorov VY (1967) Opticheskaya i messbauerovskaya spektroskopiya zheleza v porodoobrazuyushchikh silikatakh. [Optical and Moessbauer spectroscopy of iron in rock-forming silicates.] Izvestiya Akad Nauk SSSR. Seriya Geologicheskaya 10:86-102
Margulies S, Ehrman JR (1961) Transmission and line broadening of resonance radiation incident on a resonant absorber. Nucl Instr Meth 12:131-137
Mathew J, Charma AL (1991) Thermal oxidation of natural biotite using Mössbauer technique. Indian J Pure Appl Phys 29:147-149
McCammon CA (1994) A Mössbauer milliprobe: Practical considerations. Hyper Interact 92:1235-1239 McConchie DM, Ward JB, McCann VH, Lewis DW (1979) A Mössbauer investigation of glauconite and
its geological significance. Clays Clay Minerals 27:339-348 Melankholin NM (1948) The coloration of micas. Doklady Akad Nauk SSSR 4:223-229 Michael PJ, McWhinnie WR (1980) Mössbauer and ESR studies of the thermochemistry of illite and
montmorillonite. Polyhedron 8:2709-2718 Mineeva RM (1978) Relationship between Mössbauer spectra and defect structure in biotites from electric
field gradient calculations. Phys Chem Minerals 2:267-277 Mizutani T, Fukushima Y, Kobayashi T (1991) Synthesis of 1:1 and 2:1 iron phyllosilicates and
characterization of their iron state by Mössbauer spectroscopy. Clays Clay Minerals 39:381-386 Moon N, Coffin CT, Steinke DC, Sands RH, Dunham WR (1996) A high-sensitivity Mössbauer
spectrometer facilitates the study of iron proteins at natural abundance. Nucl Instr Meth Phys Res B 119:555-564
Murad E, Wagner U (1994) The Mössbauer spectrum of illite. Clay Minerals 29:1-10 Murad E (1998) Clays and clay minerals: What can Mössbauer spectroscopy do to help understand them?
Hyper Interact 117:39-70 Odin GS, Desprairies A, Fullagar PD, Bellon H, Decarreau A, Froehlich F, Zelvelder M, Odin GSe (1988)
Nature and geological significance of celadonite. In GS Odin (ed) Green marine clays: oolitic ironstone facies, verdine facies, glaucony facies and celadonite-bearing facies; a comparative study. 45:337-398 Elsevier, Amsterdam
Otten MT, Miner B, Rask JH, Buesck PR (1985) The determination of Ti, Mn, and Fe oxidation states in minerals by electron energy-loss spectroscopy. Ultramicroscopy 18:285-290
Paterson JH, Krivanek OL (1990) ELNES of the 3d transition-metal oxides. II. Variations with oxidation state and crystal structure. Ultramicroscopy 32:319-325
Pavlishin VI, Platonov AN, Pol'shin EV, Semenova TF, Starova GL (1978) Slyudy s zhelezom v chetvernoy koordinatsii. [Micas with iron in four-fold coordination.] Zapiski Vsesoyuznogo Mineralogicheskogo Obshchestva 107:165-180
Pietzsch C, Schmidt W (1990) Mössbauer investigations of dioctahedral pegmatitic micas. J Radioanal Nucl Chem 145:47-53
Ping JY, Rancourt DG (1992) Thickness effects with intrinsically broad absorption. Hyper Interact 71:1433-1436
Ping JY, Rancourt DG, Stadnik ZM (1991) Voigt-based methods for arbitrary shape quadrupole splitting distributions (QSD's) applied to quasi-crystals. Hyper Interact 69:493-496
Pollack H, Stevens JG (1986) Phyllosilicates: A Mössbauer evaluation. Hyper Interact 29:1153-1156 Pollak H, DeCoster M, Amelinckx S (1962) Mössbauer effect in biotite. Phys Stat Solidi 2:1653-1659 Pol'shin EV, Litovchenko AS, Il'chenko YA, Ishutina OD, Shepel' SI (1994) O mekhanizme okisleniya i
degidraksilatsii biotita. [Mechanism of oxidation and dehydration of biotite.] Mineralogicheskiy Zh 16:27-36
Pol'shin EV, Matyash IV, Tepikin VE, Ivanitskii VP (1972a) Mössbauer effect at 57Fe nuclei in biotite. Sov Phys Crystallogr 17:278-280
Pol'shin EV, Matyash IV, Tepikin VY, Ivanitskiy VP (1972b) Effekt Messbauera na yadrakh 57Fe v biotite. [The Mössbauer effect on the 57Fe nuclei in biotite.] Kristallografiya 17:328-331
Popper P (1951) Transmission of natural and synthetic mica in the ultra-violet. Nature 168:1119-1120 Raclavasky K, Sitek J, Lipka J (1975) Mössbauer spectroscopy of iron in clay minerals. 5th Int’l Conf
Mössbauer Spectroscopy, Proc Part II, p 368-371

Optical and Mössbauer Spectroscopy of Iron in Micas 347
Radukic G, Slivka J, Marinkov L (1980) Odredivanje rasporeda fero i feri gvozda u strukturi biotita iz Moessbauer-ovog spektra. [Examination of the arrangement of Fe2+ and Fe3+ in biotite structure from Mössbauer spectra.] Glasnik Prirodnjackog Muzeja u Beogradu, Ser A: Mineralogija, Geologija, Paleontologija 35:13-19
Raeburn SP, Ilton ES, Veblen DR (1997a) Quantitative determination of the oxidation state of iron in biotite using X-ray photoelectron spectroscopy: I. Calibration. Geochim Cosmochim Acta 61:4519-4530
Raeburn SP, Ilton ES, Veblen DR (1997b) Quantitative determination of the oxidation state of iron in biotite using X-ray photoelectron spectroscopy: II. In situ analysis. Geochim Cosmochim Acta 61:4531-4537
Raeburn SP, Kerrick DM, Gorshe R, Barth G (1993) Quantitative microbeam determination of iron valence by XPS and XES—revisited. EOS Trans Am Geophys Union 74:161
Rancourt DG (1989) Accurate site populations from Mössbauer spectroscopy. Nucl Instr Meth Phys Res B44:199-210
Rancourt DG (1993) Mössbauer spectroscopy of tetrahedral Fe3+ in trioctahedral micas: Reply. Am Mineral 78:669-671
Rancourt DG (1994a) Mössbauer spectroscopy of minerals I. Inadequacy of Lorentzian-line doublets in fitting spectra arising from quadrupole splitting distributions. Phys Chem Minerals 21:244-249
Rancourt DG (1994b) Mössbauer spectroscopy of minerals II. Problem of resolving cis and trans octahedral Fe2+ sites. Phys Chem Minerals 21:250-257
Rancourt DG (1998) Mössbauer spectroscopy in clay science. Hyper Interact 117:3-38 Rancourt DG, Dang MZ, Lalonde AE (1992) Mössbauer spectroscopy of tetrahedral Fe3+ in trioctahedral
micas. Am Mineral 77:34-43 Rancourt DG, McDonald AM, Lalonde AE, Ping JY (1993a) Mössbauer absorber thickness for accurate
site populations in Fe-bearing minerals. Am Mineral 78:1-7 Rancourt DG, Ping JY (1991) Voigt-based methods for arbitrary-shape static hyperfine parameter
distributions in Mössbauer spectroscopy. Nucl Instr Meth Phys Res B58:85-97 Rancourt DG, Ping JY, Berman RG (1994a) Mössbauer spectroscopy of minerals III. Octahedral-site Fe2+
quadrupole splitting distributions in the phlogopite-annite series. Phys Chem Minerals 21:258-267 Rancourt DG, Christie IAD, Royer M, Kodama H, Robert JL, Lalonde AE, Murad E (1994b)
Determination of accurate [4]Fe3+, [6]Fe3+, and [6]Fe2+ site populations in synthetic annite by Mössbauer spectroscopy. Am Mineral 79:51-62
Rancourt DG, Ping, JY, Robert JL (1996) Octahedral site Fe2+ quadrupole splitting distributions from Mössbauer spectroscopy along the (OH,F) join. Phys Chem Minerals 23: 63-71
Rancourt DG, Tume P, Lalonde AE (1993b) Kinetics of the (Fe2+OH) mica > Fe3+O2- mica + H oxidation reaction in single-crystal biotite studied by Mössbauer spectroscopy. Phys Chem Minerals 20:276-284
Redhammer GJ, Beran A, Dachs E, Amthauer G (1993) A Mössbauer and X-ray diffraction study of annites synthesized at different oxygen fugacities and crystal chemical implications. Phys Chem Minerals 20:382-394
Redhammer GJ, Dachs E, Amthauer G (1995) Mössbauer spectroscopic and X-ray powder diffraction studies of synthetic micas on the join annite KFe3AlSi3O10(OH)2-phlogopite KMg3AlSi3O10(OH)2. Phys Chem Minerals 22:282-294
Redhammer GJ (1998) Characterisation of synthetic trioctahedral micas by Mössbauer spectroscopy. Hyper Interact 117:85-115
Redhammer GJ, Beran A, Schneider J, Amthauer G, Lottermoser W (2000) Spectroscopic and structural properties of synthetic micas on the annite-siderophyllite binary: Synthesis, crystal structure refinements, Mössbauer, and infrared spectroscopy. Am Mineral 85:449-465
Rice CM, Williams JM (1969) A Mössbauer study of biotite weathering. Mineral Mag 37: 210-221 Richardson SM (1975) A pink muscovite with reverse pleochroism from Archer's Post, Kenya. Am Mineral
60:73-78 Richardson SM (1976) Iron distribution in pink muscovite: A reply. Am Mineral 61:1051-1052 Robbins DW, Strens RGJ (1972) Charge-transfer in ferromagnesian silicates: The polarized electronic
spectra of trioctahedral micas. Mineral Mag 38:551-563 Rolf RM, Kimball CW, Odom IE (1977) Mössbauer characteristics of Cambrian glauconite, central U.S.A.
Clays Clay Minerals 25:131-137 Rossman GR (1984) Spectroscopy of micas. Rev Mineral 13:145-181 Royer M (1991) MSc thesis, Physics University of Ottawa, Ottawa, 111 p Rozenson I, Heller-Kallai L (1978) Mössbauer spectra of glauconites reexamined. Clays Clay Minerals
26:173-175 Rudenko SS, Sakharov AN (1989) Ob okraske zhelezosoderzhashchikh muskovitov. [The color of iron-
bearing muscovite.] Voprosy Geokhimii i Tipomorfizm Mineralov 4:150-162

348 Dyar
Rüscher CH, Schrader G (1996) Temperature dependence of small polaron absorption in biotites. Phys Chem Minerals 23:243-245
Russell PE, Montano PA (1978) Magnetic hyperfine interactions of iron containing minerals in coals. J Appl Phys 49:1573-1575
Ruthberg S, Barnes MW, Noyce RH (1963) Correlation of muscovite sheet mica on the basis of color, apparent optic angle, and absorption spectrum. J Res Nat’l Bur Std A, Phys Chem 67A:309-324
Sanz J, Gonzales-Carreno T, Cancedo R (1983) On dehydroxylation mechanisms of a biotite in vacuo and in oxygen. Phys Chem Minerals 9:14-18
Sanz J, Meyers J, Vielvoye L, Stone WEE (1978) The location and content of iron in natural biotites and phlogopites; a comparison of several methods. Clay Minerals 13:45-52
Sanz J, Serratosa JM, Stone WEE (1984) Local ordering in trioctahedral micas; study by NMR, IR and Mössbauer spectroscopies. 27-y mezhdunarodnyy geologicheskiy kongress, 27(Vol. IX, Part 2): 178-179
Saporoschenko M, Twardowska H, Smith GV, Hinckley CC, Shiley RH, White WA (1980) Mössbauer studies of illites and gheat-treated illite as related to coal-conversion processes. Fuel 59:767-771
Sarma PR, Prakash V, Tripathi KC (1980) Optimization of the absorber thickness for improving the quality of a Mössbauer spectrum. Nucl Instr Meth 178:167-171
Schott J, Berner RA (1983) X-ray photoelectron studies of the mechanisms of iron silicate dissolution during weathering. Geochm Cosmochim Acta 47:2233-2240
Seal M, Vance ER, Demayo B (1981) Optical spectra of giant radiohaloes in Madagascan biotite. Am Mineral 66:358-361
Sekino H, Kanishawa S, Harada K, Ishikawa Y (1975) Aluminian xanthophyllite and paragonite from Japan. Mineral Mag 40:421-423
Shabani AAT, Rancourt DG, Lalonde AE (1998) Determination of cis and trans Fe2+ populations in 2M1 muscovite by Mössbauer spectroscopy. Hyper Interact 117:117-129
Sharov AS, Sorokina NA, Goncharov GN, Sakharov AN (1985) Mössbauer and EPR studies of iron states in muscovite. In YM Kagan IS Lyubutin (eds) Int’l Conf on the Applications of the Mössbauer Effect, 5: 1775-1778, Alma-Ata, USSR
Shimony U (1965) Condition for maximum single-line Mössbauer absorption. Nucl Instr Meth 37:348-350 Shinno I, Suwa K (1981) Mössbauer spectra of phlogopites with inverse pleochroism; special reference to
asymetric quadripolar ramifications. Ganseki Kobutsu Kosho Gakkai-Shi [= J Japan Assoc Mineral Petrol Econ Geol] 76:122-129
Smith G (1977) Low-temperature optical studies of metal-metal charge-transfer transitions in various minerals. Can Mineral 15:500-507
Smith G, Hälenius U, Annersten H, Ackermann L (1983) Optical and Mössbauer spectra of manganese-bearing phlogopites; Fe3+IV-Mn2+VI pair absorption as the origin of reverse pleochroism. Am Mineral 68:759-768
Smith GH, Howes B, Hasan Z (1980) Mössbauer and optical spectra of biotite: A case for Fe2+-Fe3+ interactions. Phys Stat Solidi 57:K187-K192
Stucki JW, Roth CB, Baitinger WE (1976) Analysis of iron-bearing clay minerals by electron spectroscopy from chemical analysis (ESCA). Clays Clay Minerals 24:289-292
Swope J (1997) Single crystal X-ray and neutron diffraction studies of: the crystal chemical effects of OH=O substitution in mantle rutile and of Cl-OH substitution in biotite, and the crystal chemistry of 1M ferromagnesian trioctahedral micas. PhD dissertation, Dept Geological Sciences, University of Colorado, Boulder, 85 p
Taftø J, Krivanek OL (1982) Site-specific valence determination by electron energy-loss spectroscopy. Phys Rev Lett 48:560-563
Taylor GL, Ruotsala AP, Keeling RO Jr (1968) Analysis of iron in layer silicates by Mössbauer spectroscopy. Clays Clay Minerals 16:381-391
Tennant WC (1992) Analysis of single-crystal Mössbauer data in low symmetry 57Fe centers. J Phys: Cond Matter 4:6993-7008
Tennant WC, Finch J, Aldridge LP, Gainsford GJ (1992) The electric field gradient and mean squared displacement tensor in 1M biotites investigated by Mössbauer spectroscopy. J Phys: Cond Matter 4:5447-5459
Tombolini F, Brigatti MF, Marcelli A, Cibin G, Mottana A, Guili G (2002) Local and average Fe distribution in trioctahedral micas: XAS analysis and XRD determinations. Eur J Mineral (in press)
Tonner BP, Droubay T, Denlinger J, Meyer-Ilse W, Warwick T, Rothe J, Kneedler E, Pecher K, Nealson K, Grundl T (1999) Soft X-ray spectroscopy and imaging of interfacial chemistry in environmental specimens. Surf Interface Anal 27:247-258
Townsend MG, Longworth G (1985) Sign of the magnetic coupling of Fe2+ and Fe3+ in biotite. Phys Chem Minerals 12:141-144

Optical and Mössbauer Spectroscopy of Iron in Micas 349
Townsend MG, Longworth G, Ross CAM, Provencher, R (1987) Ferromagnetic or antiferromagnetic Fe3+ spin configurations in sheet silicates. Phys Chem Minerals 15:64-70
Tripathi RP, Chandra U, Chandra R, Lokanathan S (1978) A Mössbauer study of the effects of heating biotite, phlogopite and vermiculite. J Inorg Nucl Chem 40:1293-1298
Tripathi RP, Lokanathan S (1978) Mössbauer study of Mg- and Mn-rich amphiboles and micas. Indian J Pure Appl Phys 16:888-892
Turner NH, Schreifels JA (2000) Surface analysis: X-ray photoelectron spectrscopy and Auger electron spectroscopy. Analyt Chem 72:99R-110R
Van der Laan G, Kirkman IW (1992) The 2p absorption spectra of 3d transition metal compounds in tetrahedral and octahedral symmetry. J Phys: Cond Matter 4:4189-4204
vanAken PA, Liebscher B, Styrsa VJ (1998) Quantitative determination of iron oxidation states in minerals using Fe L2,3-edge electron energy-loss near-edge structure spectroscopy. Phys Chem Minerals 25:323-327
vanAken PA, Styrsa VJ, Woodland AB, Redhammer GJ (1999) Microanalysis of Fe3+/Fe in oxide and silicate minerals by investigation of electron energy-loss near-edge structures (ELNES) at the Fe M2,3 edge. Phys Chem Minerals 26:548-590
Vanderberghe RE, DeGrave E, de Bakker PMA (1994) On the methodology of the analysis of Mössbauer spectra. Hyper Interact 83:29-49
Vedder W, Wilkins RWT (1969) Dehydroxylation and rehydroxylation, oxidation, and reduction of micas. Am Mineral 54:482-509
Vicente-Hernandez J, Vicente MA, Robert M, Goodman BA (1983) Evolution des biotites en fonction des conditions d’oxydo-reduction du milieu. Clay Minerals 18:267-275
Voigt W (1912) Über das Gesetz der Intensitätsverteilung innerhalb der Linien eines Gasspektrums. Sitzungsberichte der mathematisch-physikalischen. Klasses der Königlich Bayerischen Akademie der Wissenschaften, p 603-620
Votyahov SL, Borodina NS, Bykov VN, Bushlyakov IN, Mironov AB, Pal'guyeva GV (1994a) Intracrystalline distribution of ironions in biotites from Ural Granitoids. Geochem Int’l 31:81-93
Votyakov SL, Vorodina NS, Bykov VN, Bushlyakov IN, Mironov AB, Pal'guyeva GV (1994b) Vnutrikristallicheskoye raspredeleniye ionov zheleza v biotitakh iz granitoidov Urala. Geokhimiya 2:239-251
Wang MK (1990) Mössbauer analyses of celadonite and sepiolite. J Chinese Agric Chem Soc, 28:1-5 Wang J, Zhengmin C (1992) A mineralogical study of clintonite from Hanxing (Handan-Xingtai) area,
Hebei Province. Yanshi Kuangwuxue Zazhi [= Acta Petrologica et Mineralogica] 11:339-346 Wang ZF, Rossman GR, Blake GA (1998) A new microsampling visible infrared spectrometer based on
optical parametric oscillator technology. Spectroscopy 13:44-47 Waychunas GA (1986) Performance and use of Mössbauer goodness of fit parameters: Response to spectra
of various signal/noise ratios and possible misinterpretations. Am Mineral 71:1261-1265 Waychunas GA (1989) Applications of Mössbauer goodness-of-fit parameters to experimental spectra: A
discussion of random noise versus systematic effects. Am Mineral 74:685-687 Weaver CE, Wampler JM, Pecuil TE (1967) Mössbauer analysis of iron in clay minerals. Science 156:504-
508 Whipple ER (1968) Quantitative Mössbauer Spectra and Chemistry of Iron: Earth and Atmospheric
Science. PhD dissertation, Massachusetts Institute of Technology, Cambridge, 187 p White AF, Yee A (1985) Aqueous oxidation-reduction kinetics associated with coupled electron-cation
transfer from iron-containing silicates at 25°C. Geochim Cosmochim Acta 49:1263-1275 Winchell AN (1925) Studies in the mica group. Am J Sci 5th series 9:309-327 Yao S, Abe A, Ito H (1993) Optical absorption spectra and chemical composition of Indian ruby muscovite.
Nendo Kagaku [= Journal Clay Science Society of Japan] 33:92-101 Yonggang L (1986) Mössbauer study of the biotites and muscovites from some granites in Panxi area,
Sichuan, China. Yanshi Xuebao [= Acta Petrologica Sinica] 2:83-90 Zhe L, Changlu D, Wei H, Li Y (1986) A study on Mössbauer effect and optical absorption spectra of
heated muscovites. Dizhi Kexue [= Scientia Geologica Sinica] 1986:358-364

1529-6466/02/0046-0007$05.00 DOI:10.2138/rmg.2002.46.07
7 Infrared Spectroscopy of Micas Anton Beran
Institut für Mineralogie und Kristallographie Universität Wien–Geozentrum
Althanstraße 14, A-1090 Wien, Austria [email protected]
INTRODUCTION Infrared (IR) spectroscopy can provide information about details of the atomic
structure, lattice dynamics and the chemistry of mineral phases that may not be readily obtained from other analytical techniques. IR spectra originate in transitions between vibrational energy levels of vibrating atomic groups and they are observed as absorption spectra. The classification of the vibrational quantum states and the description of the spectroscopic interaction are greatly simplified by exploiting the symmetry of the vibrating atomic groups. The mathematical framework of group theory is the basis of the quantitative description of the symmetry relations possessed by the vibrating groups. In the classical model of vibrational theory, point masses that are connected by elastic springs are allowed to undergo certain vibrational displacements about their equilibrium position. If the restoring force is directly proportional to the displacement of the point masses that represent the atoms of the vibrating group, then the vibrational motion is “harmonic“. The restoring force and the vibrational displacement of the atoms are related by a proportionality factor, named the force constant. This constant corresponds to the spring constant and is a measure of the bond strength.
Changes in the number or positions of IR absorption bands are mostly analyzed in terms of structural changes. In order to make a full correlation between vibrational spectra and structure, it would be necessary to know the atomic displacements associated with each vibrational mode. A reliable approach for discerning the origin of particular IR absorption bands is to combine theoretical considerations with empirical observations of phases having the same structure but differing in composition. By simply using the “harmonic oscillator model“ for the energetics of IR-active vibrations, the substitution of one element by another will shift the wavenumber of a vibration according to the masses and the bonding behaviour of the respective atoms and vibrating groups and will also modify the shape of the respective absorption band.
The vibrations of the mica group minerals can be roughly separated in a vibrational region of hydroxyl groups, and in a lattice vibrational region, comprising vibrations of the Si(Al)O4 tetrahedra, of the octahedrally coordinated cations, and of the highly coordinated interlayer cations. This separation is complete for the high-energy OH stretching vibrations, occurring in the 3750-3550 cm-1 region. Absorption bands in the 1200-700 cm-1 region are essentially due to Si-O stretching vibrations and are weakly influenced by other vibrations of the crystal structure. The Si-O bending vibrations in the 600-300 cm-1 region usually show a coupling with stretching and bending vibrations of the cation-oxygen octahedra lying in a similar spectral region. Vibrations of the interlayer cations are localized in the range of 400-50 cm-1. A detailed review article with extensive literature on the classification of absorption bands was given by Farmer (1974), and a condensed review was presented by Rossman (1984).
“Illite“ and “glauconite“ are interlayer deficient micas with a large volume in compositional space, typically occurring in the clay-size fraction. Since these minerals are often vaguely defined, they are not considered for the discussion of spectroscopic data (Muller et al. 2000).

352 Beran
LATTICE VIBRATIONS Far-IR region
The K-O vibrations in micas give weak absorption bands in the 110-80 cm-1 range of the far-IR, whereas Na-O vibrations occur at higher frequencies in the 120-100 cm-1 range. In the brittle micas, containing interlayer Ca, the vibrations are located near 135 cm-1 (Farmer 1974). According to Tateyama et al. (1977), the K-O stretching vibration for 2M muscovite is centered at 108 cm-1, and that for 1M phlogopite at 90 cm-1. The wavenumbers show a linear correlation with the mean K-O distances of the six “inner“ oxygen atoms that measure 2.855 Å for muscovite and 2.970 Å for phlogopite. The assignment of the bands is essentially based on their absence in pyrophyllite and talc. On the basis of known d(001) interplanar spacings, b lattice constants, and observed wavenumbers of the K-O stretching vibration, these authors propose two equations to calculate the K-O bond length and the tetrahedral rotation angle (Bailey 1987).
A systematic study of far-IR spectra of mainly synthetic hydrous layer silicates was presented by Velde and Couty (1985). Controlled substitutions in the various structural sites of tri- and dioctahedral micas permit the identification of the ions that contribute to the vibrations and the corresponding absorption bands, respectively. From the band shifts due to the OH/OD, Na/K/Ca, Si/Ge, Al/Ga, Mg/Co, Fe/Ni substitutions it is apparent that it is not possible to attribute any low-frequency band solely to interlayer ion stretching vibrations. The cations that dominate the observed modes, especially in the 160-70 cm-1 region, seem to be Si and Al, which does not exclude the existence of interlayer ion stretching vibrations. Simple mass ratio calculations on the basis of a band at 112 cm-1 for muscovite and at 98 cm-1 for paragonite show that there is a problem with the assumption of a simple interlayer ion stretching vibration. The substitution of Si by Al in dioctahedral K-mica causes an increase of the band position in the 115-85 cm-1 region, which evidently shows that substitutions in non-interlayer sites influence the band positions in this region. A band at 135 cm-1 in margarite is explained by a more complex substitution of K + Si = Ca + Al. It is concluded that the change in frequency is more affected by the change in ionic charge than by the mass change. Velde and Couty (1985) could not confidently identify vibrations involving only the interlayer ions and their surrounding oxygen atoms in pure stretching modes. There seem to be more significant contributions from vibrations in the silica framework. Significant IR absorptions at 140 and 80 cm-1 in biotite and 170 and 110 cm-1 in lepidolite were attributed by Loh (1973) to internal vibrations of the MeO6 octahedra. Due to the heavier Fe2+ ions at the octahedral sites, the energies of these vibrations in biotite are at lower wavenumbers than the corresponding vibrations in lepidolite, with the lighter Li and Al ions in octahedral coordination.
According to Schroeder (1990) frequencies of the interlayer vibrational mode are centered at 108 cm-1 in muscovite, 102 cm-1 in celadonite, 87 cm-1 in phlogopite, 95 cm-1 in F-rich plogopite and 76 cm-1 in biotite. Solid solution of OH and F in trioctahedral structures significantly affects these modes; increasing frequency is related to increasing F contents. Multivariate statistical analysis reveals a strong correlation between the vibrational frequency and the octahedral sheet composition. Sheet dimensions and distortions are largely controlled by the composition of the octahedral layer. The strong characteristic band in the 110-80 cm-1 region shows no pleochroic effects in the (001) plane, suggesting it is due to a torsional motion involving basal oxygen vibratrions relative to the interlayer cation.
Polarized measurements using single crystal flakes reveal no in-plane and out-of-plane dichroic character of bands at 110, 91 and 83 cm-1 for muscovite, phlogopite and biotite, respectively, and proved the assignment to vibrations of the oxygen atoms that constitute the cage in which K is located (Laperche and Prost 1991). Weak pleochroic

Infrared Spectroscopy of Micas 353
bands in the 190-125 cm-1 region are assigned to in-plane and out-of-plane vibrations of K atoms. In a detailed polarized study of muscovite, Diaz et al. (2000) have identified two in-plane modes at 107 and 110 cm-1 and one out-of-plane mode at 134 cm-1 for the vibrations of K. In the 107 cm-1 vibration the K ions vibrate parallel to b, in the vibration at 110 cm-1 the K motion is parallel to a. These observations match the approximate C3i symmetric environment of K although the site symmetry is only C2.
McKeown et al. (1999) published the results of factor group analysis for the phlogopite structure (mainly on the basis of Raman spectroscopic data) with a separate listing for the contributions from K, M1, M2, T4O10 sheets and OH. The normal modes are divided into 14Ag + 13Bg + 14Au + 19Bu, including three acoustic modes, one Au and two Bu. The IR active Au and Bu modes have contributions from all atomic sites in the structure. The modes found in the IR spectra at 90 and 156 cm-1 (Tateyama et al. 1977; 92 and 161 cm-1 in Loh 1973) are reasonably close to calculated Bu modes at 85 and 156 cm-1. An assignment of the band at 156 cm-1 to the K-O stretching vibration as an essential vibrational contribution would be consistent with the calculated eigenmodes. Mid-IR region
Trioctahedral micas. In a detailed calorimetric study of phlogopite by Clemens et al. (1987) spectroscopic data on synthetic samples were also presented. The IR spectra in the 1400-200 cm-1 region are similar to those reported by Farmer (1974). The observed Raman bands in the 1200-600 cm-1 region are not well resolved, showing halfwidths of 20-30 cm-1. This is consistent with a high degree of tetrahedral Al/Si disorder. A distinct band at 826 cm-1 is associated with the presence of tetrahedral Al in the phlogopite structure. This band can be correlated with the presence of Al-O-Al linkages and hence Al/Si disorder. As stated by Clemens et al. (1987), the IR spectra of phlogopite are not sensitive to differences in the stacking sequences.
A band assignment for phlogopite in the 1100-350 cm-1 region based on studies of chemical analogues is presented by Jenkins (1989). Table 1 summarizes the structural assignments. The synthetic phases used in this study comprise phlogopite, Na-phlogopite, Ni-phlogopite, and phlogopite analogues with replacement of Si by Ge and Al by Ga, clintonite, CaMg2Al(SiAl3O10)(OH)2, Ge-clintonite, and Ga-clintonite. Octahedrally coordinated Mg is expected to have absorption maxima in the range of 480-350 cm-1. The rather sharp band at 690 cm-1 may be due to an Si-O stretching vibration coupled with an Mg-O vibration. The 592 cm-1 band is assigned to an OH librational mode that is affected by the octahedral cation environment.
A convenient reference frame for discerning the lattice vibrations attributable to tetrahedrally coordinated Si and Al is afforded by talc (Fig. 1). The stretching and bending frequencies of Si-O at around 1000 and 500 cm-1, respectively, closely match those observed for phlogopite. The substitution of one fourth of the Si by Al results in a general broadening and displacement of the absorption bands and in the appearance of additional bands in the 900-500 cm-1 region. These effects are probably related to the partial disorder of Al and Si in the tetrahedral sheets and/or to coupling of Si-O and Al-O vibrations. The substitution of Ge for Si causes the greatest change of any studied substitution (Fig. 1). Vibrations that are strongly related to tetrahedral Al can be identified by comparing the phlogopite spectrum with that of low-Al phlogopite and Ga-phlogopite. All the bands from 820-590 cm-1 are less intense in low-Al phlogopite and are shifted to slightly lower wavenumbers in Ga-phlogopite. There is a systematic change in the intensity of the bands at 822 and 752 cm-1 with increasing substitution of Ga for Al. There is a well-defined inverse correlation between the increasing intensity of the 752 cm-1 band and the decreasing intensity of the 822 cm-1 band. In agreement with Clemens

354 Beran
et al. (1987), it is proposed by Jenkins (1989) that the 822/995 cm-1 band ratio may provide an easy aid to determine the amount of tetrahedral Al in phlogopite. In clintonite with much higher tetrahedral Al, lower tetrahedral Si and lower octahedral Mg, the Al-O vibrations at 820 and 660 cm-1 cause the most prominent bands (Fig. 1). The Si-O vibrations at 995, 960, 520, and 460 cm-1 are greatly reduced in intensity. Bands at 690
Table 1. Observed absorption bands in cm–1 and suggested band assignments for the synthetic micas: phlogopite (Jenkins 1989), annite (Redhammer et al. 2000), muscovite and margarite (Langer et al. 1981) in the mid-IR lattice vibrational region. Horizontal lines: band positions within 10 cm-1. [Al] = Al in octahedral coordination; libr = librational mode.
phlogopite annite muscovite margarite 1113 Si-O 1078 Si-O 1065 Si-O 1021 Si-O 1028 Si-O 1027 Si-O 995 Si-O 992 Si-O 996 Si-O-Si 960 Si-O 959 Si-O 937 Si-O-Al 925 Si-O-Al 915 Si-O-Al 912 OH libr 910 OH libr 870 Al-O 877 Al-O-Al 844 Al-O 822 Al-O 831 Al-O 824 Al-O 805 Al-O-Al 760 Al-O 768 Si-O-Si 751 Al-O-Al 725 Si-O-Al 727 Si-O-[Al] 727 Si-O-[Al] 706 Si-O-Si 700 Si-O-[Al] 690 Si-O-Mg 690 Si-O-[Al] 672 Si-O-Al 655 Al-O-Al 631 Si-O-Al 619 Si-O 610 Si-O 592 OH libr 580 Si-O 587 Si-O 592 OH libr 571 Al-O 553 Si-O 555 Si-O 539 Si-O-[Al] 541 Si-O-[Al] 520 Si-O 520 Si-O 515 Si-O 495 Mg-O 492 Si-O 481 Si-O 480 Si-O 460 Si-O 459 Si-O 445 Si-O 410 OH libr 415 OH libr 397 Si-O 381 Si-O 375 Si-O-Mg 368 Si-O

Infrared Spectroscopy of Micas 355
Figure 1 (left). IR powder spectra of (a) synthetic talc, (b) synthetic phlogopite, (c) Ge-phlogopite, (d) Ga-phlogopite, and (e) synthetic clintonite (after Jenkins 1989)
Figure 2 (right). Schematic detail of the phlogopite structure illustrating calculated atomic motions for the IR active Bu mode at 408 cm-1 according to McKeown et al. (1999). The diagram in the upper and lower part corresponds to c-axis and b-axis projections, respectively. Arrows are drawn to scale, indicating the relative amplitude of the motion for each atom
and 375 attributed to Si-O-Mg vibrations are absent probably because of the decreased abundance of both Mg and Si. The most intense Al-associated vibration at 820 cm-1 is probably an out-of-plane Al-O vibration, as its frequency matches the 822 cm-1 band in phlogopite. This band would not be sensitive to in-plane order/disorder. The band at 660 cm-1 may prove to be an in-plane Al-O-Al vibration because of its intensity and close correspondence with the in-plane Al-O-Al band in phlogopite at 655 cm-1.
The lattice vibrational region 1200-400 cm-1 of an Al-phlogopite (Mg2.5Al0.5) (Si2.5Al1.5) with varying fluorine content was studied by Papin et al. (1997). A band at 812 cm-1 corresponds to the band at 822 cm-1 in phlogopite and is assigned to a perpendicular Al-O vibration. A band at 762 cm-1 is explained by a tilting motion of the tetrahedron. A band doublet at 704/672 cm-1 is attributed to Si-O-Si and Si-O-Al vibrations. Two low-intensity broad bands observed at around 610 and 860 cm-1 in the spectrum of the F-free endmember are assigned to bending motions of OH groups since they progressively vanish

356 Beran
with increasing F content. The main feature of the various spectra along the OH-F join is the systematic shift of the main Si-O stretching band from 994 to 1021 cm-1 as the F content increases. This band shift indicates a shortening of the Si-O bond lengths and presumably also for the Al-O distances as OH groups are replaced by fluorine (Levillain and Maurel 1980).
In the vibrational analysis of phlogopite by McKeown et al. (1999), the band assignments are based on a comparison of the calculated IR active Au and Bu mode frequencies with experimental IR data (Loh 1973; Clemens et al. 1987). Calculated bands at 361, 408, 474, 570, and 584 cm-1 are dominated by O-T-O bending modes. T-O-T bending modes essentially result in bands at 713 and 716 cm-1. Bands at 800 and 809 cm-1 are assigned to M-O stretching modes and bands at 1030, 1035, and 1093 cm-1 to T-O stretching vibrations. As one example, the O-T-O bending vibrations that give rise to the 408 cm-1 band are illustrated after McKeown et al. (1999) in Figure 2 (M1 xz-translatory motion, + K xz-translatory motion + O1-T-O2 bending). According to these authors, the Au and Bu species eigenmodes can be grouped into three frequency ranges. Above 800 cm-1 modes are dominated by T-O stretching and O-T-O bending motions internal to the sheets. Below 800 cm-1, modes can contain mixtures of K, M1, M2, and internal sheet motions. At frequencies below 450 cm-1, lattice modes that can contain motions from all atoms in the structure dominate, especially sheet motions that mix with M and (F,OH) displacements. Specific eigenmode assignments do not agree particularly well with literature data. This is likely due to the fact that the assignments made by Loh (1973), Clemens et al. (1987), and Jenkins (1989) are based on the symmetry of isolated vibrating groups, whereas the eigenmodes calculated by McKeown et al. (1999) are based on the complete structure. However, general observations agree within these studies, but discrepancies are seen in the details.
Effects of tetrahedral isomorphic substitution on the IR spectra of fluorine micas were demonstrated by Kitajima and Takusagawa (1990), comparing the spectrum of taeniolite, KMg2Li(Si4O10)F2 with those of the substituted analogues with compositions KMg2+xLi1-x(Zx Si4-xO10)F2 (Z = Ga, Al, B) and KMg2Li(GexSi4-xO10)F2, with x = 0.0-1.0. The 1118 cm-1 band in taeniolite is assigned to the stretching vibration of Si-O apical, the 964 cm-1 band to in-plane Si-O vibrations (Kitajima et al. 1991).
In a recent paper by Redhammer et al. (2000) on spectroscopic features of the binary annite, KFe2+
3(Si3AlO10)(OH)2,-siderophyllite, KFe2+2Al(Si2Al2O10)(OH)2, IR spectra in
the 1200-400 cm-1 region were presented and are shown in Figure 3 (see also Table 1). The band assignments support the data given by Jenkins (1989) for phlogopite. Dominating bands at 998 cm-1 in siderophyllite and 992 cm-1 in annite, and 970 and 959 cm-1, respectively, are due to the in-plane Si-O stretching vibrations. Two weak shoulders in the spectra of the Al-poor micas at around 870 cm-1 evolve to a broad band absorption with increasing Al content. Probably this band corresponds to the 915 cm-1 band of phlogopite that is assigned to the in-plane Si-O-Al vibration. Weak bands at 672 and 631 cm-1 evolving to a clearly resolved band doublet with increasing Al content are assigned to in-plane Si-O-Al vibrations. A weak band showing a shift from 571 to 548 cm-1 is assigned to an Al-O bending mode. In the broad absorption region centered at around 450 cm-1, several bands overlap that are generated by M-O stretching motions in the octahedra and by Si-O bending vibrations. A very weak band at around 500 cm-1 in the Al-poor samples evolves to a pronounced peak at 530 cm-1 in the Al-rich samples. This band is assigned to Al-O modes in the octahedra.
Dioctahedral micas. IR spectra of synthetic micas of the muscovite, KAl2(Si3AlO10)(OH)2,-aluminoceladonite, KMgAl(Si4O10)(OH)2, series were presented by Velde (1978). Representative spectra in this series are shown in Figure 4. Assignments

Infrared Spectroscopy of Micas 357
Figure 3. FTIR powder spectra for synthetic micas on the annite-siderophyllite (sid) binary. (a) sid 12, (b) sid 25, (c) sid 37, (d) sid 50, (e) sid 75, (f) sid 87, (g) sid 100 (Redhammer et al., 2000)
Figure 4. IR powder spectra for synthetic micason the muscovite-alumoceladonite (ce) join. (a)synthetic muscovite, (b) synthetic ce 50, (c)synthetic ce 80 (Velde 1978)

358 Beran
of the vibrational modes are based mainly on the descriptions given by Farmer (1974). A significant shift of two bands, from 1062 to 1100 cm-1 and from 533 to 515 cm–1, is directly related to the compositional change of the mica from muscovite to celadonite. The first band is due to the Si-O apical stretching vibration. Since the band does not appear to change its width with varying composition, it can be assumed that the Si for Al substitution in one tetrahedron does not greatly affect this mode in another tetreahedron. Data for margarite and clintonite show that the band shift occurs in the same manner but in a different extent. Band positions and band assignments of muscovite and margarite are summarized according to Langer et al. (1981) in Table 1. The second band shift (533-515 cm–1) is that of the O-Si-O bending vibration and the wavenumber decreases as the composition becomes tetrasilicic. There are several bands that do not follow a consistent pattern of change from one end member to the other in the compositional series. A weak broad band centered at around 940 cm-1 in muscovite, assigned to an Al-OH libration absorption, changes to a sharp more intense band and shifts to a constant wavenumber at 910 cm–1 (Fig. 4). This change occurs at a composition of 50 mol% MgAl-celadonite, indicating that ordering occurs in the two octahedral sites of the structure. A significant mode that can indicate if there is tetrahedral ordering would be the Al-O-Si bending vibration, which is attributed to the band at 750 cm-1. There is a rapid decrease of this band between 50 and 60 mol% MgAl-celadonite composition. This suggests that the tetrahedral sites are ordered to a certain extent between muscovite and 50 mol% celadonite and that this ordering follows a reverse trend noted for the octahedral sites where Mg/Al ordering appears to begin at intermediate muscovite-aluminoceladonite composition. For muscovite, Velde (1980) proposed a domain-type ordering with respect to the symmetry plane with two Al atoms in a hexagonal ring, leaving other rings to contain only Si atoms.
Synthetic and natural 2M1 dioctahedral micas were studied by Langer et al. (1981) with special reference to tetrahedral Al/Si order/disorder effects on the IR spectra. As demonstrated by Figure 5 the spectra of synthetic margarites in the range below 1200 cm-1 show particularly well resolved, sharp bands, implying complete tetrahedral Al/Si ordering. The poorer resolution of the bands in the spectra of natural margarites is probably due to layer disordering and solid solution with other endmembers. Synthetic muscovite and paragonite show poorer spectral resolution coupled with higher halfwidths of the bands when compared to the IR spectra of synthetic margarite. The lack of fine structure in the lattice vibrational spectra of synthetic muscovite and paragonite can be due to disordering of Al and Si in the tetrahedral sites of these micas. Bands present at around 805 and 750 cm-1 in muscovite and paragonite, respectively, do not occur in margarite (Table 1). This is explained by ordering with respect to tetrahedral Al and Si which is most likely fundamental to the margarite structure with a tetrahedral Al/Si ratio of one. Due to this ordering, no Al-O-Al vibrations should occur. Apparently these bands originate from tetrahedral Al-O-Al vibrations rather than from Si-O-Al. The absence of a strong band around 750 cm-1 in boromuscovite with (Si3.06B0.77Al0.17)4.00 (Foord et al. 1991) may result from the substitution of tetrahedral B for Al, thus supporting the assignment of this band to tetrahedral Al-O-Al vibrations. The Si-O-Al vibration should be very strong in the Al/Si ordered phase margarite. The high intensity of the band at 925 cm-1 in margarite compared to the corresponding band in muscovite at 937 cm-1, both assigned to Si-O-Al vibrations, is in accordance with the fact that the number of the Si-O-Al bonds in the ordered phase margarite is higher than in the disordered phase muscovite (Table 1). The absorption behaviour of margarite polymorphs was studied in detail by Velde (1980). Most of the bands are sharpened and intensified as the polymorph changes from 1Md to 1M and then 2M. Bands at 510 and 725 cm-1 are lost in 1Md margarite. Bands at 612 and 446 cm-1 are greatly strengthened in the 2M form. These bands are likely to be combinations of Si-O bending vibrations.

Infrared Spectroscopy of Micas 359
Figure 5 (left). IR powder spectra of (a) synthetic 2M paragonite, (b) synthetic 2M margarite, and (c) 2M margarite from Naxos, Greece (after Langer et al. 1981)
Figure 6 (right). Polarised IR single-crystal spectra in the OH stretching frequency region of (a) a phlogopite cleavage plate (thickness = 0.004 cm), (b) a muscovite cleavage plate (thickness = 0.003 cm) at 0° (perpendicular to (001); continuous line) and 45° (dotted line) angles of incidence (after Serratosa and Bradley 1958). Note the different molar OH absorption coefficients for the 3710 cm-1 band in trioctahedral phlogopite and the 3620 cm-1 band in dioctahedral muscovite
The synthesis of micas along the solid solution series margarite-paragonite and their IR spectroscopic investigation by Franz et al. (1977) reveals the existence of a miscibility gap in the 400-600°C temperature range at 1-6 kbar pH2O . Band intensity ratios were used for the determination of the chemical composition. At about 600°C the gap lies between margarite 30 and 45 and broadens up to margarite 20 and 55 at about 400°C.
OH STRETCHING VIBRATIONS Polarized measurements
Much attention has been given to the analysis of OH stretching bands of micas occurring in an isolated region of the spectrum ranging from about 3750 to 3550 cm-1 (Farmer 1974). Using polarized radiation, the pleochroic scheme of IR absorption bands, measured on oriented crystal sections, makes it possible to impose defined constraints on the orientation of the OH dipoles. In a fundamental polarised IR study, Tsuboi (1950) determined the position of the H atom in the structure of muscovite. The variation of absorption intensity of the OH stretching band with the direction of the electric vector of

360 Beran
the polarised radiation that passes through a muscovite cleavage plate was examined in detail. IR spectroscopic work using polarized radiation on oriented single-crystals of minerals with constitutional OH groups was initiated e.g. on azurite (Tillmanns and Zemann 1965), layer silicates (Serratosa and Bradley 1958) and especially muscovite by Tsuboi (1950). Later on, this method was extended to OH dipoles in nominally anhydrous minerals (Beran 1999). As demonstrated by Serratosa and Bradley (1958), phlogopite shows substantially no absorption when the electric vector of the light is normal to the OH bond axis, but shows increasing absorption at 3710 cm-1 as the mica flake is tilted against the IR beam (Fig. 6). A muscovite flake demonstrates stronger but less variable absorption at 3620 cm-1 at different angles of incidence. Because the OH group is excited into vibration only when the electric vector is aligned with the OH bond, this result demonstrates that in phlogopite the OH group is oriented essentially normal to the cleavage plane. The spectra of the dioctahedral micas indicate that the OH groups are inclined from the normal to the cleavage plane because of the vacancies in the coordinating cation sites. In the case of muscovite, the angle between the OH direction and the ab plane amounts to 16° and the angle between the projection of the OH direction onto the ab plane and the b axis is 30-32°. Quantitative water determination
Attempts have been made by Rouxhet (1970) to determine absorption coefficients of OH stretching bands in micas. For the calculation of the molar OH absorption coefficient (ε), the absorbance values (A) and the absolute H2O concentration values (c) have to be known. The basis of the quantitative IR spectroscopic water determination is the “Lambert-Beer’s law“ in the form ε = a/c, where the absorption coefficient a = A/t (t is the thickness of the measured crystal plate; Beran et al. 1993). From the data of Rouxhet (1970) for integrated absorption coefficients determined by polarized IR measurements and the water content determined by thermal extraction, the integrated molar absorption coefficients (εi) for muscovites have been calculated to values ranging from 21000-23000 l.mol-1
H2O.cm-2. For phlogopites these values are ranging from 6800-9100 l.mol-1H2O.cm-2.
It is important to note that Paterson (1982) calculated the integrated molar absorption coefficient for muscovite on the basis of the ε value given by Scholze (1960) and by taking proper account of an “anisotropy factor“ to 23400 l.mol-1
H2O.cm-2. From a linear calibration curve for the water content in minerals established by Libowitzky and Rossman (1997) on the basis of Paterson’s (1982) diagram, the εi value for muscovite is calculated to 30300 and that for phlogopite to 10600 l.mol-1
H2O.cm-2. These values are in fair agreement with those determined from the measured values of Rouxhet (1970), clearly demonstrating that the integrated molar absorption coefficient of muscovite is proportionally 2.5 to 3 times larger than that of phlogopite. Hydrogen bonding
A hydrogen bond O-H...O is conveniently characterized by the distance between donor and acceptor oxygens. A distance that is shorter than 2.5 Å is considered a very strong bond, a distance between 2.5 and 2.7 Å defines a strong bond, and a separation over 2.7 Å characterises a weak hydrogen bond. Most information on hydrogen bonding systems is obtained from the band position of the OH stretching mode (Hadzi and Bratos 1976). Bands above 3200 cm-1 indicate weak hydrogen bonds, strong bonds give broad bands absorbing at 3200-1600 cm-1, and very strong hydrogen bonds give extremely broad bands below 1600 cm-1. The bandwidth increases by orders of magnitude from weak to very strong bonds. The upper energy limit of OH absorption bands in minerals is observed at around 3750 cm-1 (Beran and Libowitzky 1999). Correlation diagrams of the OH stretching frequencies versus O-H...O distances are presented by Novak (1974) and especially for minerals by Libowitzky (1999).

Infrared Spectroscopy of Micas 361
The OH stretching frequencies of dioctahedral micas are typically lower than those
of trioctahedral micas. A comprehensive model for hydrogen bonding in tri- and dioctahedral micas has been established from experimental data on synthetic phases in the K2O-MgO-Al2O3-SiO2-H2O system by Robert and Kodama (1988). The variable content of tetrahedrally and octahedrally coordinated Al is used to represent mica compositions. The trioctahedral micas investigated belong to phlogopite solid solutions, comprising eastonite, KMg2Al(Al2Si2O10)(OH)2, and tetrasilicic Mg-mica (TMM) K(Mg2.5V0.5)(Si4O10)(OH)2 (V = vacancy). The dioctahedral micas belong to the join muscovite-aluminoceladonite (Velde 1978). According to Vedder (1964) OH stretching bands are designated with N (“normal“) for OH bonded to 3 Mg, I (“impurity“) for OH bonded to 2 Mg and 1 Al and V (“vacancy“) for OH adjacent to an octahedral vacancy. N, I, and V bands are observed in phlogopite solid solutions, whereas in the phengitic series all OH bands belong to the V-type. In an OH stretching frequency (νOH) versus total Al content (AlT) diagram, the data points define four lines (Fig. 7). Local charge imbalances on oxygen atoms generated by Si/Al substitutions, lead to weak O-H...O bonds, responsible for the negative slopes of lines A, B, and C. Because of the tilting of the OH dipole away from the c* direction in I-type environments, repulsive K-H interaction is weakened as AlT increases, which explains the steep slope of line C. In V-type environments, the charge imbalance on an apical oxygen of a tetrahedra is high if this oxygen is bonded to a (MgMg) pair. This generates strong O-H...O apical bonds and low OH stretching frequencies at 3592 cm-1 in TMM. Underbonding on apical O decreases with increasing Al content, explaining the positive slope of line D. The N and I bands of the high-Al Na-mica preiswerkite, Na(Mg2Al)(Si2Al2O10)(OH)2, fit in with the model established for K-micas. It is noticeable that the I band of preiswerkite and the V band of muscovite have almost the same energy at 3620 cm-1. Tetrahedral Si ordering around V-type OH groups occurs on the whole of the join TMM (Al-free)-phlogopite (AlT = 1). The TMM possesses both the highest N-type wavenumber (3735 cm-1) and the lowest V-type wavenumber (3592 cm-1). The wavenumber of N-type OH groups is the highest among all OH stretching wavenumbers of the micas. Each N-type OH is bonded to 3 Mg and directed toward interlayer K. The OH dipole is surrounded by a nearly regular hexagonal ring of SiO4 tetrahedra. Because of the purely siliceous composition of the tetrahedral layer, no excess negative charge is created on the tetrahedra; the distance
Figure 7. Slightly modified diagram of Robert and Kodama (1988) relating OH stretching frequencies (νOH) in cm-1 and total Al contents (AlT = sum of tetra-hedrally and octahedrally coordinated Al) in a.f.u. TMM – tetrasilicic Mg-mica, phl – phlogopite, east – eastonite, prswk – preiswerkite, mus – muscovite, ce – aluminoceladonite. Continuous lines correspond to measured data points, dotted lines to calculated extrapolations

362 Beran
between OH and surrounding oxygen atoms of tetrahedra is as large as possible, and the K-H repulsive interaction is high. Therefore the OH bond strength is as high as possible, which explains the high OH stretching wavenumber. The evolution of mica composition along the join TMM-phlogopite does not change the repulsive K-H interaction, but the progressive replacement of Si by Al creates residual negative charges on oxygen atoms of aluminous tetrahedra. At the same time, the slight distortion of the tetrahedra shortens the O-H...O distances. These two phenomena favour the development of stronger O-H...O hydrogen bonds (Fig. 7).
According to Melzer (2000), OH absorption spectra from phlogopites with incompletely filled interlayers show a significant band at 3675 cm-1. Since the intensity of this band correlates with the measured vacancy concentrations, this band may be assigned to the presence of interlayer vacancies and is not attributed to Al in octahedral coordination.
Picosecond infrared saturation-recovery measurements have been performed on the OH stretching vibration of muscovite and biotite by Heilweil (1986). Vibrational population lifetimes at room temperature have average values of 92+/-13 ps for the OH vibrations of muscovites and 221+/-22 ps and 87+/-33 ps for the high- and low-frequency OH vibrations, respectively, of biotites, indicating that high-frequency OH vibrations have the longest lifetimes. The lifetime is clearly affected by the local charge distribution and the hydrogen bonding system.
Near-infrared OH combination bands for muscovite are reported to occur at 4548, 4260, and 4100 cm-1, at 4448, 4297, 4200, and 4100 cm-1 for phlogopite and at 4435, 4255, and 4175 cm-1 for biotite (Post and Noble 1993). Cation ordering
In the spectra of trioctahedral micas, the primary OH stretching frequency is about 3710 cm-1, but it can vary with substitutions in the octahedral and tetrahedral sheets. The stretching frequencies are affected by the octahedral cations to which the OH groups are coordinated, by interlayer cations, and by the configuration and the charge distribution of the surrounding tetrahedral lattice. The correlation of octahedral ion electronegativity with OH stretching frequencies in di- and trioctahedral micas was studied by Velde (1983). It is instructive to consider the talc-Ni talc series where the six-fold coordinated cations are Mg and Ni (Wilkins and Ito 1967). There are eight possible ways of distributing two types of cations over the three octahedral sites coordinating the OH group. Since the three cation sites are in a pseudo-trigonal arrangement (“Mg(OH)2-type“ coordination) that introduces a degeneracy, the number of resolvable bands reduces to four, i.e. (Mg Mg Mg), (Mg Mg Ni), (Mg Ni Ni), (Ni Ni Ni). The cation distribution can be partially derived from the intensities of these bands (Fig. 8). The position of the resolved band maxima is determined by the electronegativity of the cations coordinating the OH group. The OH stretching frequency in talc is located at 3677 cm-1. In phlogopite the electric field associated with interlayer K, which lies directly above the OH on the O-H axis, raises the frequency significantly. Wavenumbers ranging from 3704 to 3712 cm-1 are commonly found in natural phlogopites; a value of 3724 cm-1 has been reported by Clemens et al. (1987) for synthetic phlogopite of ideal composition, suggesting little or no vibrational coupling between OH sites. On substitution of Fe2+ for Mg in the phlogopite-biotite series, the four components seen in the talc-Ni talc series can no longer be resolved, but the contour of the OH stretching absorption is well reproduced on the assumption that all four talc frequencies are displaced upwards by about 35 cm-1.
In synthetic annites two prominent bands at 3667 and 3535 cm-1 with two shoulders at 3625 and 3575 cm-1 are present (Redhammer et al. 1993). The band at 3667 cm-1 is

Infrared Spectroscopy of Micas 363
Figure 8. IR powder spectra of synthetic members of the talc-Ni talc (Ni tc) series in the OH stretching vibrational region. (a) Ni tc 99, (b) Ni tc 77, (c) Ni tc 48, (d) Ni tc 24, (e) Ni tc 16, (Wilkins and Ito 1967)
Figure 9. FTIR powder spectra for synthetic micas on the annite-siderophyllite (sid) binary in the OH stretching frequency region. (a) synthetic annite, [Fe3+] = 15 % of total Fe, (b) synthetic annite, [Fe3+] = 31 % of total Fe, (c) sid 50, (d) sid 100, (Redhammer et al., 2000)
attributed to OH bonded to three Fe2+ ions whereas the other bands can be assigned to OH surrounded by two cations and a vacancy, especially the band at around 3535 cm-1 that is assigned to OH with two Fe3+ and a vacancy. The spectra of highly oxidized samples indicate that vacancies are primarily connected with Fe3+ ions. It is also concluded that the charge balance necessary for the substitution of Fe2+ by Fe3+ is achieved by the mechanism 3 Fe2+ = 2 Fe3+ + V(oct). In annite at least 10 % of the Fe2+ ions are substituted by Fe3+ in order to match the larger octahedral layer to the smaller tetrahedral layer.
As is evident from Figure 9, up to seven bands are observed in the OH stretching region of micas on the annite-siderophyllite binary, which corresponds to OH groups adjacent to 3 Fe2+ (N bands), to OH groups coordinated by Fe2+, Al and Fe3+ (I bands), and to configurations having one octahedral vacancy (V bands) (Redhammer et al. 2000).
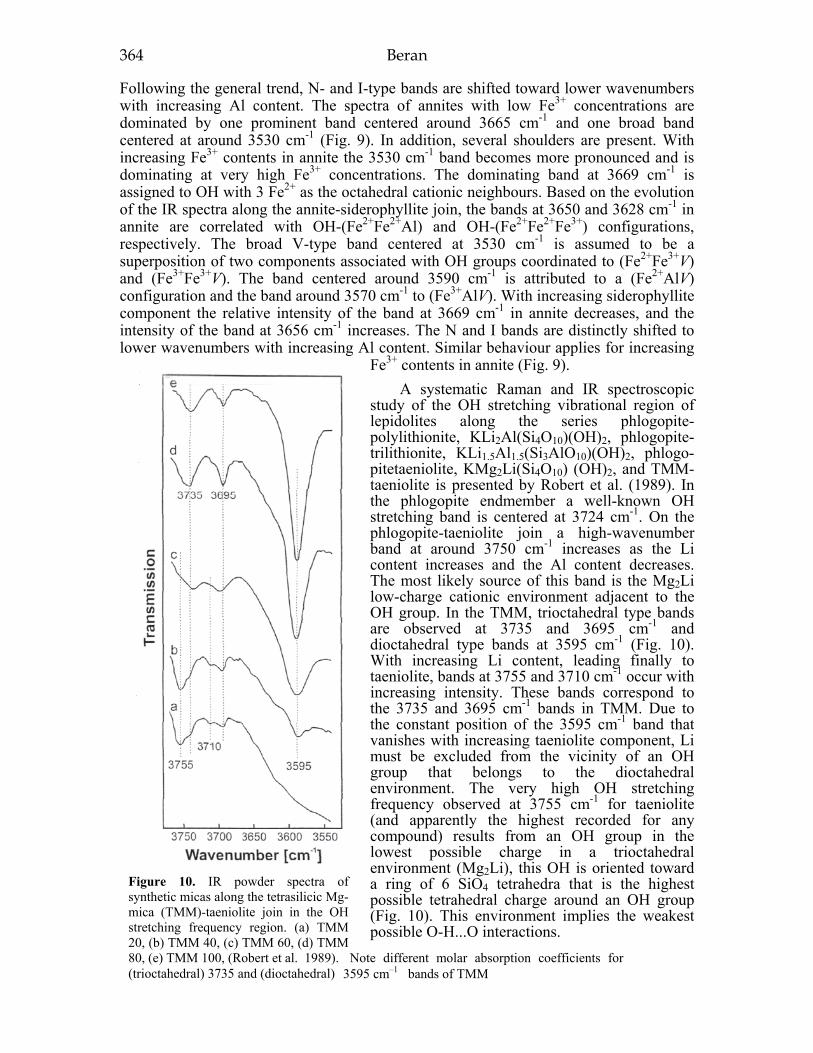
364 Beran
Following the general trend, N- and I-type bands are shifted toward lower wavenumbers with increasing Al content. The spectra of annites with low Fe3+ concentrations are dominated by one prominent band centered around 3665 cm-1 and one broad band centered at around 3530 cm-1 (Fig. 9). In addition, several shoulders are present. With increasing Fe3+ contents in annite the 3530 cm-1 band becomes more pronounced and is dominating at very high Fe3+ concentrations. The dominating band at 3669 cm-1 is assigned to OH with 3 Fe2+ as the octahedral cationic neighbours. Based on the evolution of the IR spectra along the annite-siderophyllite join, the bands at 3650 and 3628 cm-1 in annite are correlated with OH-(Fe2+Fe2+Al) and OH-(Fe2+Fe2+Fe3+) configurations, respectively. The broad V-type band centered at 3530 cm-1 is assumed to be a superposition of two components associated with OH groups coordinated to (Fe2+Fe3+V) and (Fe3+Fe3+V). The band centered around 3590 cm-1 is attributed to a (Fe2+AlV) configuration and the band around 3570 cm-1 to (Fe3+AlV). With increasing siderophyllite component the relative intensity of the band at 3669 cm-1 in annite decreases, and the intensity of the band at 3656 cm-1 increases. The N and I bands are distinctly shifted to lower wavenumbers with increasing Al content. Similar behaviour applies for increasing
Fe3+ contents in annite (Fig. 9). A systematic Raman and IR spectroscopic
study of the OH stretching vibrational region of lepidolites along the series phlogopite-polylithionite, KLi2Al(Si4O10)(OH)2, phlogopite-trilithionite, KLi1.5Al1.5(Si3AlO10)(OH)2, phlogo-pitetaeniolite, KMg2Li(Si4O10) (OH)2, and TMM-taeniolite is presented by Robert et al. (1989). In the phlogopite endmember a well-known OH stretching band is centered at 3724 cm-1. On the phlogopite-taeniolite join a high-wavenumber band at around 3750 cm-1 increases as the Li content increases and the Al content decreases. The most likely source of this band is the Mg2Li low-charge cationic environment adjacent to the OH group. In the TMM, trioctahedral type bands are observed at 3735 and 3695 cm-1 and dioctahedral type bands at 3595 cm-1 (Fig. 10). With increasing Li content, leading finally to taeniolite, bands at 3755 and 3710 cm-1 occur with increasing intensity. These bands correspond to the 3735 and 3695 cm-1 bands in TMM. Due to the constant position of the 3595 cm-1 band that vanishes with increasing taeniolite component, Li must be excluded from the vicinity of an OH group that belongs to the dioctahedral environment. The very high OH stretching frequency observed at 3755 cm-1 for taeniolite (and apparently the highest recorded for any compound) results from an OH group in the lowest possible charge in a trioctahedral environment (Mg2Li), this OH is oriented toward a ring of 6 SiO4 tetrahedra that is the highest possible tetrahedral charge around an OH group (Fig. 10). This environment implies the weakest possible O-H...O interactions.
Figure 10. IR powder spectra of synthetic micas along the tetrasilicic Mg-mica (TMM)-taeniolite join in the OH stretching frequency region. (a) TMM 20, (b) TMM 40, (c) TMM 60, (d) TMM 80, (e) TMM 100, (Robert et al. 1989). (trioctahedral) 3735 and (dioctahedral)
Note different molar absorption coefficients for 3595 cm–1 bands of TMM

Infrared Spectroscopy of Micas 365
Robert et al. (1989) also propose a new system of nomenclature for OH stretching bands including the number of charges: TRI or DI designate trioctahedral- or dioctahedral-type OH stretching bands. The number of cationic charges bonded to the OH is added to the symbol, e.g. TRI-5 (OH bonded to Mg2Li or Li2Al), TRI-6 (OH bonded to Mg3 or AlMgLi), and TRI-7 (OH bonded to Mg2Al or Al2Li). Similarly the dioctahedral type band of TMM is named DI-4 (OH bonded to Mg2); in muscovite this band would be named DI-6 (OH bonded to Al2).
The OH absorption spectra of synthetic dioctahedral muscovite, paragonite, and margarite were studied by Langer et al. (1981). From the fact that the OH stretching frequencies are centered almost at the same wavenumber in all three micas, it may be concluded that neither the type of the interlayer cation nor the occupancy of the tetrahedral positions affects the frequency of the OH stretching vibration. One striking feature of the OH absorption band is the behaviour of the halfwidth, which is similar for muscovite and paragonite but about five times larger than that of margarite. This can be interpreted in terms of Al/Si ordering in margarite against disordered tetrahedral Al/Si in muscovite and paragonite. In margarite the sharp band centered at 3634 cm-1 shows a strong shoulder at 3630 cm-1. As a consequence of the tetrahedral Al/Si ordering, two different sets of O-H...O distances exist, leading to two stretching bands. The OH band in synthetic muscovite shows a fine structure with two high-energy shoulders attached at 3659 and 3644 cm-1 to the maximum at 3629 cm-1; the corresponding band positions in paragonite are at 3666, 3650 and 3631 cm-1. Depending on the various local Al/Si distributions, which cause different Al/Si configurations of the acceptor oxygen atoms, the O-H...O interactions are energetically different, which results in the broad OH stretching band.
Two distinct positions of hydrogen in muscovite are discussed by Liang et al. (1998) on the basis of FTIR PAS (Photo Acoustic Spectroscopy) and neutron diffraction data. The intensity of the high-frequency shoulder increases relative to the maximum intensity to the OH stretching band envelope as the mirror speed decreases from 2.5 kHz to 5 Hz. The increase in relative intensity of the shoulder indicates that there are at least two unique bands in the muscovite spectrum indicating more than one symmetrically distinct OH group. Collectively, these results indicate triclinic symmetry. The driving force for the symmetry lowering involves cooperative ordering of hydrogen atoms over two distinct positions in the structure of this muscovite. OH-F replacement
Investigations of the synthetic OH-F TMM system, K(Mg2.5V0.5)(Si4O10)(OH,F)2, by Robert et al. (1993) demonstrate that fluorine strongly favours the trioctahedral sites. The partition coefficient of F between tri- and dioctahedral sites, present in equal amounts, is about 20. This behaviour is interpreted in terms of local charge balance around the OH group. In the trioctahedral environment, the OH group acts as a “point charge“; it has negligible interaction with the tetrahedral oxygen atoms and can be easily replaced by fluorine. In dioctahedral sites the OH group is hydrogen bonded and its replacement by F is difficult. The situation of OH groups in muscovite is similar to that of dioctahedral OH in TMM. However, muscovite is trisilicic and exhibits various local Al/Si distributions that result in a broad complicated OH stretching band with maxima at 3659, 3644, and 3629 cm-1 (Langer et al. 1981). It is suggested that those OH band that exhibit the highest wavenumber are more easily replaced by fluorine. The common correlation between Li and F in lepidolites may be explained by the same crystal chemical model, since the OH groups act as point charges in these micas with high OH stretching wavenumbers. In the OH stretching region of synthetic Al-phlogopite with a complete OH-F solid solution, K(Mg2.5Al0.5)(Si2.5Al1.5)O10(OH,F)2 (Papin et al. 1997), two main bands are observed at

366 Beran
3703 and 3653 cm-1 that are assigned to OH groups adjacent to Mg3 and to Mg2Al, respectively. Each band is double and exhibits a minor low-wavenumber component, which can be interpreted from the variable composition of 6 TO4 rings (Si4Al2 or Si3Al3). Along the (OH-F) mica join, the 3703 cm-1 band vanishes faster than the 3653 cm-1 band, which reflects the partitioning of F in favour of the 3 Mg sites with a partition coefficient of 3. The partitioning of F in favour of the 3 Mg sites can be interpreted from local charge balance considerations and explains why octahedrally coordinated Al and F are negatively correlated. Compared to the TMM, the main OH stretching band assigned to OH groups adjacent to 3 Mg is shifted towards lower wavenumbers. This shift is due to the tetrahedral composition effect, Si4 in TMM and Si2.5Al1.5 in Al-phlogopite.
Dehydroxylation mechanisms The dehydroxylation mechanisms of a biotite in the temperature range 300-800°C at
controlled oxygen pressures were studied by Sanz et al. (1983) on the basis of IR and Mössbauer data. At low pressure, the lack of oxygen delays oxidation of Fe2+ and simultaneous loss of hydrogen but favours the loss of OH associated with octahedral vacancies. Significant V-type bands of biotite occur in the 3620-3560 cm-1 range. It is concluded that all OH groups initially coordinated to Fe2+ must be lost during the oxidation process. In air, the thermal decomposition of OH coordinated to Fe2+ in trioctahedral environment occurs at 400-600°C and at 500-800°C for OH associated with vacancies. In vacuum, the dehydrogenation related to the oxidation of Fe2+ occurs at temperatures of 600-800°C, while the dehydroxylation of OH associated with vacancies appears at 400-600°C. An interesting feature is the complete independence of the mechanisms by which OH groups coordinated to Fe2+ and OH groups linked to a vacancy are lost.
The dehydration behaviour of a muscovite cleavage flake was studied by Aines and Rossman (1985) using high-temperature IR spectroscopy. No essential changes in the hydrogen speciation occur prior to dehydration at 750°C. The OH stretching band shifts slightly to lower wavenumbers at 590°C and there is a slight decrease in the integrated absorbance. Upon cooling the original room temperature spectrum is once more obtained. No new OH absorptions form during dehydration above 750°C; there is a monotonic decrease in intensity of the original band around 3620 cm-1.
Heating induces the dehydroxylation of muscovite and the dehydrogenation of biotite as a consequence of Fe2+ oxidation. These processes also drastically change the K-OH group interaction. At the dehydroxylation temperatures, the structure of muscovite is only partially disturbed, whereas the structure of phlogopite is completely destroyed (Prost and Laperche 1990). During the dehydroxylation process the K-O vibrational bands of muscovite shift from 110 to 97 cm-1; no significant frequency shift of the K-O vibration at 93 cm-1 occurs for heat-treated phlogopite until the sample is dehydroxylated. The inverse K-O band shift in biotite from 78 to 91 cm-1 is related to the oxidation of Fe2+ which induces a dehydrogenation of OH groups.
Data obtained by TGA and IR spectroscopy on the structural transformation of layer silicates during dehydroxylation-rehydroxylation reactions were recently published by Muller et al. (2000). An IR spectrum of norrishite was presented by Eggleton and Ashley (1989). This mineral has the ideal structural formula K(Mn3+
2Li)(Si4O12) and is comparable to oxy-biotite in its low OH content that was determined to 0.66 wt.% H2O+ in a natural sample. It was shortly discussed whether norrishite originally formed with Mn2+ and the normal OH content of other micas and subsequently became oxidized and dehydroxylated. A strong decrease of OH band intensities with increasing (Mn,Zn) content in phlogopite was reported by Papin and Robert (2000). The progressive loss of

Infrared Spectroscopy of Micas 367
protons is explained by the presence of Mn in the trivalent state. Excess hydroxyl
Synthetic Ge-muscovite crystals exhibit a Ge deficiency and an excess of Al and display additional OH vibrations at 3480 and 1165 cm-1, compared to ideal Ge-muscovite (Ackermann et al. 1993). The substitution mechanism Ge4+ + O2- = Al3+ + OH- leads to Ge-muscovites with the general formula KAl2(Ge3-xAl1+x O10-x(OH)x)(OH)2 (x = 0.15). The additional OH groups presumably replace some of the apical oxygen atoms of the tetrahedral sheet. This substitution is likely to occur in tetrahedra occupied by Al. The “normal“ OH stretching vibration of muscovite at 3629 cm-1 is found at 3640 cm-1 in single-crystal spectra of Ge-muscovite. The bands at 3640, 3480, and 1165 cm-1 show a similar pleochroic behaviour within the ac plane.
Excess OH in partially dioctahedral micas of the K2O-MgO-BeO-SiO2-H2O system, described as a TMM-KMg3(Si3.5M2+
0.5)O10(OH)2 solid solution series with tetrahedrally coordinated M2+ cations, were reported by Robert et al. (1995). This is demonstrated by the increase of a broad band at 3700 cm-1. The most likely hydrogen acceptors are the strongly underbonded apical oxygens of M2+ (Be or Mg) tetrahedra adjacent to two octahedrally coordinated Mg and an octahedral vacancy. NH4 groups
The IR spectrum of tobelite is dominated by OH stretching vibrations at around 3600 cm-1, distinct NH stretching vibrations of the NH4 group with maxima at 3320, 3160, and 3050 cm-1 and the NH4 bending vibration centered at 1430 cm-1. A weak band at 2865 cm-1 is attributed to the first overtone of the bending vibration. Despite significant shifts in band positions, the tobelite spectrum shows that NH4 vibrations are readily perceived in dioctahedral micas (Shigorova et al. 1981; Voncken et al. 1987). An IR spectrum of tobelite from the type locality at Tobe, Ehime Prefecture, Japan was given by Higashi (1982).
FTIR spectroscopy is potentially the fastest technique available for the determination of low ammonium concentrations. Boyd (1997) presented the IR spectra of NH4 bearing muscovite and biotite and proposed the calibration of the specific 1430 cm-1 band by capacitance manometry.
ACKNOWLEDGMENTS
I am grateful to M. Darby Dyar and Giancarlo Della Ventura for their constructive reviews of the manuscript. Wolfgang Zirbs is thanked for his technical help.
REFERENCES Ackermann L, Langer K, Rieder M (1993) Germanium muscovites with excess hydroxyl water, KAl2[Ge3-
xAl1+xO10-x(OH)x(OH)2] and the question of excess OH in natural muscovites. Eur J Mineral 5:19-29 Aines RD, Rossman GR (1985) The high temperature behavior of trace hydrous components in silicate
minerals. Am Mineral 70:1169-1179 Bailey SW (1987) Crystal chemistry of the true micas. Rev Mineral 13:13-60 Beran A (1999) Contribution of IR spectroscopy to the problem of water in the Earth’s mantle. In Wright
K, Catlow R (eds) Microscopic properties and processes in minerals. Kluwer Acad Publ, Dordrecht, The Nethellands, p 523-538
Beran A, Libowitzky E (1999) IR spectroscopy and hydrogen bonding in minerals. In Wright K, Catlow R (eds) Microscopic Properties and Processes in Minerals. Kluwer Acad Publ, Dordrecht, The Netherlands , p 493-508
Beran A, Langer K, Andrut M (1993) Single crystal infrared spectra in the range of OH fundamentals of paragenetic garnets, omphacite and kyanite in an eclogitic mantle xenolith. Mineral Petrol 48:257-268

368 Beran
Boyd SR (1997) Determination of the ammonium content of potassic rocks and minerals by capacitance manometry: A prelude to the calibration of FTIR microscopes. Chem Geol 137:57-66
Clemens JD, Circone S, Navrotsky A, McMillan PF, Smith BK, Wall VJ (1987) Phlogopite: High temperature solution calorimetry, thermodynamic properties, Al-Si and stacking disorder, and phase equilibria. Geochim Cosmochim Acta 51:2569-2578
Diaz M, Farmer VC, Prost R (2000) Characterization and assignment of far infrared absorption bands of K+ in muscovite. Clays Clay Minerals 48:433-438
Eggleton RA, Ashley PM (1989) Norrishite, a new manganese mica, K(Mn3+2Li)Si4O12, from the Hoskins
mine, New South Wales, Australia. Am Mineral 74:1360-1367 Farmer VC (1974) The layer silicates. In Farmer VC (ed) The infrared spectra of minerals. Mineral Soc,
London, 331-363 Foord EE, Martin RF, Fitzpatrick JJ, Taggart JE Jr, Crock JG (1991) Boromuscovite, a new member of the
mica group, from the Little Three mine pegmatite, Ramona district, San Diego County, California. Am Mineral 76:1998-2002
Franz G, Hinrichsen T, Wannemacher E (1977) Determination of the miscibility gap on the solid solution series paragonite-margarite by means of the infrared spectroscopy. Contrib Mineral Petrol 59:307-316
Hadzi D, Bratos S (1976) Vibrational spectroscopy of the hydrogen bond. In Schuster P et al (eds) The Hydrogen Bond—Recent developments in theory and experiments, Vol 2. North-Holland Publ Co, Amsterdam, p 565-611
Heilweil EJ (1986) Vibrational population lifetimes of OH(v = 1) in natural crystalline micas. Chem Phys Lett 129:48-54
Higashi S (1982) Tobelite, a new ammonium dioctahedral mica. Mineral J 11:138-146 Jenkins DM (1989) Empirical study of the infrared lattice vibrations (1100-350 cm-1) of phlogopite. Phys
Chem Minerals 16:408-414 Kitajima K, Takusagawa N (1990) Effects of tetrahedral isomorphic substitution on the IR spectra of
synthetic fluorine micas. Clay Minerals 25:235-241 Kitajima K, Taruta S, Takusagawa N (1991) Effects of layer charge on their IR spectra of synthetic fluorine
micas. Clay Minerals 26:435-440 Langer K, Chatterjee ND, Abraham K (1981) Infrared studies of some synthetic and natural 2M1
dioctahedral micas. N Jb Mineral Abh 142:91-110 Laperche V, Prost R (1991) Assignment of the far-infrared absorption bands of K in micas. Clays Clay
Minerals 39:281-289 Levillain C, Maurel P (1980) Étude par spectrométrie infrarouge de l’influence de la liaison hydrogène sur
les fréquences d’élongation des liaisons Si-O dans les micas potassiques. C R Acad Sci Paris 290 D:1385-1388
Liang J-J, Hawthorne FC, Swainson IP (1998) Triclinic muscovite: X-ray diffraction, neutron diffraction and photo-acoustic FTIR spectroscopy. Can Mineral 36:1017-1027
Libowitzky E (1999) Correlation of O-H stretching frequencies and O-H...O hydrogen bond lengths in minerals. Mh Chemie 130:1047-1059
Libowitzky E, Rossman GR (1997) An IR absorption calibration for water in minerals. Am Mineral 82:1111-1115
Loh E (1973) Optical vibrations in sheet silicates. J Phys C: Solid State Phys 6:1091-1104 McKeown DA, Bell MI, Etz ES (1999) Raman spectra and vibrational analysis of the trioctahedral mica
phlogopite. Am Mineral 84:970-976 Melzer S (2000) The determination of vacancy concentrations in phlogopitic micas by IR-spectroscopy. J
Conf Abstr 5, EMPG VIII Bergamo, p 69 Muller F, Drits V, Plancon A, Robert J-L (2000) Structural transformation of 2:1 dioctahedral layer
silicates during dehydroxylation-rehydroxylation reactions. Clays Clay Minerals 48:572-585 Novak A (1974) Hydrogen bonding in solids. Correlation of spectroscopic and crystallographic data. Strct
Bonding 18:177-216 Papin A, Robert J-L (2000) Mn and Zn in synthetic micas, under different oxygen fugacities. J Conf Abstr
5, EMPG VIII Bergamo, p 81 Papin A, Sergent J, Robert J-L (1997) Intersite OH-F distribution in an Al-rich synthetic phlogopite. Eur J
Mineral 9:501-508 Paterson MS (1982) The determination of hydroxyl by infrared absorption in quartz, silicate glasses and
similar materials. Bull Minéral 105:20-29 Post JL, Noble PN (1993) The near-infrared combination band frequencies of dioctahedral smectites,
micas, and illites. Clays Clay Minerals 41:639-644 Prost R, Laperche V (1990) Far-infrared study of potassium in micas. Clays Clay Minerals 38:351-355

Infrared Spectroscopy of Micas 369
Redhammer GJ, Beran A, Dachs E, Amthauer G (1993) A Mössbauer and X-ray diffraction study of annites synthesized at different oxygen fugacities and crystal chemical implications. Phys Chem Minerals 20:382-394
Redhammer GJ, Beran A, Schneider J, Amthauer G, Lottermoser W (2000) Spectroscopic and structural properties of synthetic micas on the annite-siderophyllite binary: Synthesis, crystal structure refinement, Mössbauer and infrared spectroscopy. Am Mineral 85:449-465
Robert J-L, Kodama H (1988) Generalization of the correlations between hydroxyl-stretching wavenumbers and composition of micas in the system K2O-MgO-Al2O3-SiO2-H2O: A single model for trioctahedral and dioctahedral micas. Am J Sci 288-A:196-212
Robert J-L, Beny J-M, Beny C, Volfinger M (1989) Characterization of lepidolites by Raman and infrared spectrometries. I. Relationships between OH-stretching wavenumbers and composition. Can Mineral 27:225-235
Robert J-L, Beny J-M, Della Ventura G, Hardy M (1993) Fluorine in micas: Crystal-chemical control of OH-F distribution between trioctahedral and dioctahedral sites. Eur J Mineral 5:7-18
Robert J-L, Hardy M, Sanz J (1995) Excess protons in synthetic micas with tetrahedrally coordinated divalent cations. Eur J Mineral 7:457-461
Rossman GR (1984) Spectroscopy of micas. Rev Mineral 13:145-181 Rouxhet PG (1970) Hydroxyl stretching bands in micas: A quantitative interpretation. Clay Minerals
8:375-388 Sanz J, González-Carreno T, Gancedo R (1983) On dehydroxylation mechanisms of a biotite in vacuo and
in oxygen. Phys Chem Minerals 9:14-18 Scholze H (1960) Über die quantitative UR-spektroskopische Wasserbestimmung in Silikaten. Fortschr
Mineral 38:122-123 Schroeder PA (1990) Far infrared, X-ray powder diffraction, and chemical investigation of potassium
micas. Am Mineral 75:983-991 Serratosa JM, Bradley WF (1958) Determination of the orientation of OH bond axes in layer silicates by
infrared absorption. J Phys Chem 62:1164-1167 Shigorova TA, Kotov NV, Kotel’nikova YN, Shmakin BM, Frank-Kamenetskiy VA (1981) Synthesis,
diffractometry, and IR spectroscopy of micas in the series from muscovite to the ammonium analog. Geochem Int’l 18:76-82
Tateyama H, Shimoda S, Sudo T (1977) Estimation of K-O distance and tetrahedral rotation angle of K-micas from far-infrared absorption spectral data. Am Mineral 62:534-539
Tillmanns E, Zemann J (1965) Messung des Ultrarot-Pleochroismus von Mineralen. I. Der Pleochroismus der OH-Streckfrequenz in Azurit. N Jb Mineral Mh 1965:228-231
Tsuboi M (1950) On the position of the hydrogen atoms in the crystal structure of muscovite, as revealed by the infra-red absorption study. Bull Chem Soc Japan 23:83-88
Vedder W (1964) Correlations between infrared spectrum and chemical composition of mica. Am Mineral 49:736-768
Velde B (1978) Infrared spectra of synthetic micas in the series muscovite-MgAl celadonite. Am Mineral 63:343-349
Velde B (1980) Cell dimensions, polymorph type, and infrared spectra of synthetic white micas: The importance of ordering. Am Mineral 65:1277-1282
Velde B (1983) Infrared OH-stretch bands in potassic micas, talcs and saponites; influence of electronic configuration and site of charge compensation. Am Mineral 68:1169-1173
Velde B, Couty R (1985) Far infrared spectra of hydrous layer silicates. Phys Chem Minerals 12:347-352 Voncken JHL, Wevers JMAR, van der Eerden AMJ, Bos A, Jansen JBH (1987) Hydrothermal synthesis of
tobelite, NH4Al2Si3AlO10(OH)2, from various starting materials and implications for its occurrence in nature. Geol Mijnbouw 66:259-269
Wilkins RWT, Ito J (1967) Infrared spectra of some synthetic talcs. Am Mineral 52:1649-1661

1529-6466/02/0046-0008$05.00 doi:10.2138/rmg.2002.46.08
8 X-Ray Absorption Spectroscopy of the Micas
Annibale Mottana1,2, Augusto Marcelli2, Giannantonio Cibin2, and M. Darby Dyar3
1 Università degli Studi Roma Tre, Dipartimento di Scienze Geologiche Largo S. Leonardo Murialdo 1, I-00146 Roma RM, Italy
2 Istituto Nazionale di Fisica Nucleare, Laboratori Nazionali di Frascati Via Enrico Fermi 40, I-00044 Frascati RM, Italy
3 Mount Holyoke College, Department of Earth and Environment 50 College Street, South Hadley, Massachusetts 01075
INTRODUCTION X-ray absorption spectroscopy (XAS) has developed into a powerful tool for the
study of all types of materials since the early 1970s, when strong sources such as synchrotrons became available from which experimental spectra with high signal to noise ratios and fine spectral details could be recorded. Just a little earlier, some physical theories had been conceived to explain the XAS spectra, which until then had been recorded using conventional X-ray sources (Sayers et al. 1970, 1971; Stern 1974; Lee and Pendry 1975; Pendry 1983). As soon as new, well-resolved experimental data became available, those theories developed into practical methods by which XAS spectra could be numerically computed and theoretically understood (Kutzler et al. 1980; Natoli et al. 1980; Durham et al. 1982; Natoli et al. 1990; Filipponi et al. 1991; Rehr et al. 1992; Tyson et al. 1992; Zabinsky et al. 1995; Filipponi and Di Cicco 2000; see Rehr and Albers 2000 for a recent review). At present, a full range of applications in material science makes routine use of XAS, and numerous reviews have been published that highlight its potentials in all fields of modern research (e.g., Stern and Heald 1983; Teo 1986; Bianconi 1988; Gurman 1989; Lytle 1989; Henderson et al. 1991).
Specifically for mineral science, XAS became definitively established in the middle 1980s, after a period of parasitical development during which the technical and theoretical principles of the method were adapted and finalized to all types of Earth materials: the crystalline ones, mostly, as well as those in the glassy state (cf. Brown et al. 1978; Calas et al. 1980, 1984; Waychunas et al. 1983, 1986; Davoli et al. 1987, 1988; Brown and Parks 1989; Bassett and Brown 1990; see Brown et al. 1988, 1995 for reviews).
Currently, the main advantages of synchrotron-activated XAS in mineral studies can be outlined as follows:
(a) XAS is element-specific, and can be used for multi-atomic compounds (most natural minerals) with no loss of information on any individual atom, the concentration of which in the sample may range from 100 wt % as in a pure element down to few parts per million (ppm) as in a very diluted natural mixture.
(b) XAS is a local structural probe: although the sample is irradiated by photons, the physical probe is the excited electron. The mean free path of the photoelectron is system-dependent, but it is small. As a result, the excited electron probes a small cluster around the photo-absorbing site (Müller et al. 1982). In other words, it can detect only a few shells of neighbors around the absorbing atom (typically up to a distance of ca. 0.6∼0.9 nm), thus giving information mainly on short-range order that is impossible to gather

372 Mottana, Marcelli, Cibin & Dyar
otherwise on either ordered (i.e., crystalline) or disordered (i.e., glassy) systems. (c) XAS is recorded by means of a brilliant photon beam that is strongly linearly
polarized in the plane of the synchrotron ring (in this review we will neglect other polarization states now available in modern storage rings using special insertion devices). Moreover, the beam can be focussed down to very small areas (0.1 × 0.2 μm: microXANES, i.e., SmX: Dyar et al. 2001; <100 nm: Kaulich et al. 2000). Thus, XAS can give information on the local site anisotropy of the material.
(d) XAS is a very fast process, the estimated time of the photon absorption excitation being of the order of 10-16 s, so that spectra may easily distinguish physical processes that happen on longer time-scales. Moreover, the availability of brilliant and intense sources now allows collection of XAS spectra with high signal to noise ratios in a short time (<1 s), thus following the dynamics of reaction processes practically in real time on a very short time scale (s to min). The so-called dispersive EXAFS system (Phizackerley et al. 1983; Dartige et al. 1986) has reached the same resolution as that of standard double-crystal monochromators, and opened the field of time-resolved XANES experiments to investigate structural dynamical processes.
(e) Extended XAS (i.e., EXAFS: Extended X-ray Absorption Fine Structure [spectroscopy]) provides average interatomic distances accurate to ±0.002 nm, and average coordination numbers accurate to ±10-20%, at least for the nearest or next-nearest-coordination shells. Polarized X-ray absorption spectra show a strong dichroism for anisotropic sites. Moreover, in the single scattering approximation that best describes polarized EXAFS spectra (i.e., P-EXAFS; cf. Benfatto et al. 1989), oscillations originating at a particular scattered atom can appear or disappear depending on whether or not the electric field is directed towards that atom.
(f) Near-edge XAS (i.e., XANES: X-ray Absorption Near-Edge Structure [spectroscopy]), although not yet fully quantitative, provides high-quality information on oxidation state, symmetry, coordination and bonding of atoms in their local environment; furthermore, it gives some indication of bond distances and angles. While in EXAFS the electron scattering is weak and the observed modulation of the absorption cross-section barely reaches 5% of the total signal, in XANES the electron scattering is much stronger and the modulated signal is significantly larger. Nevertheless, quantitative interpretation of near-edge experiments is never simple: some theoretical help may be obtained from recently developed computer codes (Joly 2001).
(g) XAS can be used as a bulk method to look for information on samples that are very fine-grained (powders), even using impure mixes (provided that the associated material does not contain the atom to be probed in the mineral). Alternatively, it can be used on oriented specimens, provided suitable crystals are available, which can be oriented either crystallographically or morphologically on the sample holder. Using a special set up, XAS can even be used to scan only the surface of a mineral (SEXAFS) or the interface between two contacting layers (e.g., the fresh substrate and its transformation crust). Polarized XAS spectra have been widely used in this context to determine separate interatomic distances on planes parallel and normal to a surface plane. In the XANES spectra of anisotropic clusters the polarization dependence of the absorption cross-section allows the multiple-scattering contributions due to a set of atoms in a particular direction or on a plane to be selectively recorded. Therefore, the orientation and angular distribution of neighboring atoms can be easily determined by changing the relative position between the incident beam and the sample. In angular-resolved XAS spectroscopy, dichroism is usually very large and appears both in the threshold region for the molecular-like bound excitations, producing the white-line, and upwards, all along the spectrum up to the EXAFS region. The interpretation of polarized XANES spectra in terms of multiple-scattering theory allows the role of a selected group
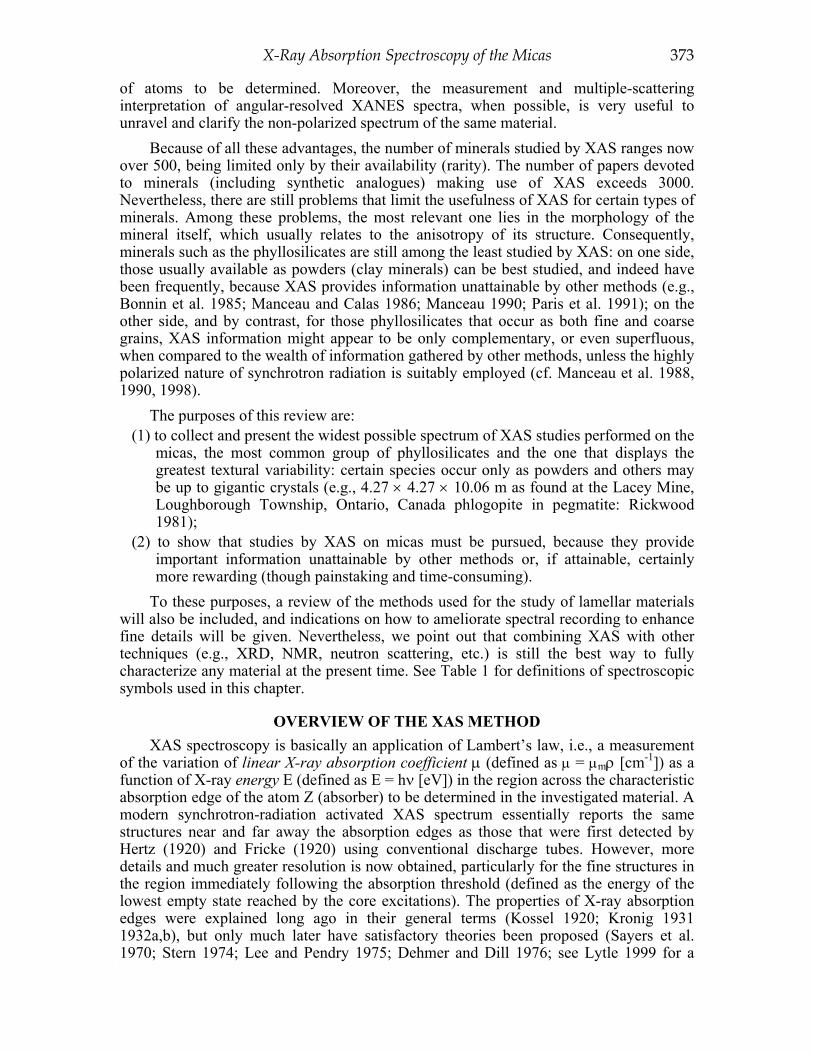
X-Ray Absorption Spectroscopy of the Micas 373
of atoms to be determined. Moreover, the measurement and multiple-scattering interpretation of angular-resolved XANES spectra, when possible, is very useful to unravel and clarify the non-polarized spectrum of the same material.
Because of all these advantages, the number of minerals studied by XAS ranges now over 500, being limited only by their availability (rarity). The number of papers devoted to minerals (including synthetic analogues) making use of XAS exceeds 3000. Nevertheless, there are still problems that limit the usefulness of XAS for certain types of minerals. Among these problems, the most relevant one lies in the morphology of the mineral itself, which usually relates to the anisotropy of its structure. Consequently, minerals such as the phyllosilicates are still among the least studied by XAS: on one side, those usually available as powders (clay minerals) can be best studied, and indeed have been frequently, because XAS provides information unattainable by other methods (e.g., Bonnin et al. 1985; Manceau and Calas 1986; Manceau 1990; Paris et al. 1991); on the other side, and by contrast, for those phyllosilicates that occur as both fine and coarse grains, XAS information might appear to be only complementary, or even superfluous, when compared to the wealth of information gathered by other methods, unless the highly polarized nature of synchrotron radiation is suitably employed (cf. Manceau et al. 1988, 1990, 1998).
The purposes of this review are: (1) to collect and present the widest possible spectrum of XAS studies performed on the
micas, the most common group of phyllosilicates and the one that displays the greatest textural variability: certain species occur only as powders and others may be up to gigantic crystals (e.g., 4.27 × 4.27 × 10.06 m as found at the Lacey Mine, Loughborough Township, Ontario, Canada phlogopite in pegmatite: Rickwood 1981);
(2) to show that studies by XAS on micas must be pursued, because they provide important information unattainable by other methods or, if attainable, certainly more rewarding (though painstaking and time-consuming).
To these purposes, a review of the methods used for the study of lamellar materials will also be included, and indications on how to ameliorate spectral recording to enhance fine details will be given. Nevertheless, we point out that combining XAS with other techniques (e.g., XRD, NMR, neutron scattering, etc.) is still the best way to fully characterize any material at the present time. See Table 1 for definitions of spectroscopic symbols used in this chapter.
OVERVIEW OF THE XAS METHOD XAS spectroscopy is basically an application of Lambert’s law, i.e., a measurement
of the variation of linear X-ray absorption coefficient μ (defined as μ = μmρ [cm-1]) as a function of X-ray energy E (defined as E = hν [eV]) in the region across the characteristic absorption edge of the atom Z (absorber) to be determined in the investigated material. A modern synchrotron-radiation activated XAS spectrum essentially reports the same structures near and far away the absorption edges as those that were first detected by Hertz (1920) and Fricke (1920) using conventional discharge tubes. However, more details and much greater resolution is now obtained, particularly for the fine structures in the region immediately following the absorption threshold (defined as the energy of the lowest empty state reached by the core excitations). The properties of X-ray absorption edges were explained long ago in their general terms (Kossel 1920; Kronig 1931 1932a,b), but only much later have satisfactory theories been proposed (Sayers et al. 1970; Stern 1974; Lee and Pendry 1975; Dehmer and Dill 1976; see Lytle 1999 for a bbbb

374 Mottana, Marcelli, Cibin & Dyar
Table 1. Definitions of spectroscopic symbols.
Symbol Property ρ electron density h Planck’s constant ν photon frequency k photoelectron wavenumber E photon energy EF Fermi energy σ(E) absorption cross section Mif matrix element of the electronic transition δ Dirac delta function Ei energy of the initial state Ef energy of the final state Ψf(r1, r2,...., rn) final many-body radial wave function Ψi(r1, r2,...., rn) initial many-body radial wave function rn vector describing the position of the n-th electron ε polarization vector of the radiation α fine-structure constant mL(ε) matrix element, between the radial part of the wave function calculated
inside the sphere of the absorbing atom and the corresponding func-tion of the absorbing atom, which chooses the final angular momentum L
Im imaginary part unit matrix
l orbital angular momentum tli atomic t-matrix element of the atom at site i
a = δij δLL' tli diagonal matrix of atomic t-matrix elements describing the scattering process (i-j) of the L spherical wave photoelectron
= HijLL' (1- δij) free amplitude propagator of the photoelectron in the spherical wave
state from site i with angular momentum L to site j with angular momentum L'
Ml,l±1 atomic dipole transition matrix element for the photoabsorbing atom (radial part only)
δl0 phase shift of the absorbing atom
αF total absorption coefficient α0 atomic absorption coefficient χn the n-th contribution arising from all multiple scattering pathways
beginning and ending at the central atom, and involving n-1 neighboring atoms.
P1(cosφ) Legendre polynomials fi(ω) scattering amplitudes of the i-th atom Rtot= ri+rij+rj total length of the triangle composed by the absorbing atom and the i-th
and j-th atoms.

X-Ray Absorption Spectroscopy of the Micas 375
historical review). Even more recently a long-lasting attempt has been dedicated to developing a complete and unifying theory for XAS (Natoli 1983; Natoli and Benfatto 1986; see Davoli and Paris 1990, and Rehr and Albers 2000, for reviews).
For theoretical as well as for practical purposes, a XAS spectrum is normally divided in two regions: (1) the X-ray absorption near-edge structure (XANES) region, and (2) the extended X-ray absorption fine structure (EXAFS) region. EXAFS
In the absorption coefficient formalism, the EXAFS signal is substantially due to interference of the outgoing photoelectron wave from the absorbing atom with the back-scattered wave from each surrounding atom. Hence EXAFS provides information about the pair distribution function.
EXAFS spectra were adequately recorded even at the time when conventional X-ray spectrometers were used, and indeed rotating-anode X-ray sources with brightness in the range 108∼109 photons.s-1.mm-2.mrad-2.(0.1% bandwidth)-1 are still in use that produce fine spectra. Despite representing only a few percent of the total absorption, EXAFS was also the first region of the XAS spectrum that found a theoretical interpretation resting on sound physical principles (Sayers et al. 1970; Stern 1974). Fitting methods with calculations based on Fourier analysis now provide quantitative data with a high degree of reliability (Sayers et al. 1971; Teo et al. 1977; Teo and Lee 1979). For a full coverage of the EXAFS method the reader is referred to classical works such as those by Lee et al. (1981), Hayes and Boyces (1982), Stern and Heald (1983), and Teo (1986), and to the recent review by Rehr and Albers (2000).
EXAFS structures occur in the form of wide, low-frequency oscillations that in most systems start at energies ca. 50∼100 eV higher than the absorption threshold and progressively damp out to within 13∼15 Å-1 [k (Å-1)= √2m/(h/2π)2 (E - EF)] or even more, depending on the edge of the measured atom and on the system (Borowski et al. 1999). These oscillations arise from back-scattering of photoelectrons of high kinetic energy involved in a single-scattering (SS) process with the nearest neighbors, during which the outgoing and back-scattered photoelectron waves undergo constructive and destructive interference. In the multiple-scattering formalism, EXAFS signals correspond to the single scattering paths of the photoelectron involved in the absorption process. EXAFS spectra can be analyzed to extract information about the distance from the absorber and its neighbors, in some cases extending to several shells as far away as ca. 0.6∼0.7 nm (or even more in the case of super-focussing, when the arrangement of neighboring atoms in the structure is collinear: cf. Kuzmin and Parent 1994; Kuzmin et al. 1995) as well as about the number and type of the back-scatterers. The frequencies of the back-scattering photoelectron waves are roughly inversely proportional to the distance between the absorber and its neighboring atom shells. However, frequency and distance are not exactly proportional because the photoelectron undergoes a phase shift, as a result of the interaction of the outgoing and back-scattered waves with the potentials of the absorbing and back-scattering atoms. Such a phase shift is typically ca. 0.02-0.05 nm and is characteristic of a particular absorber to back-scatterer atom pair. The amplitude of the scattered wave reflects primarily the number and type of atoms located around the absorber, but it is reduced by the interference of several effects. Nevertheless, when all these limitations are well considered, the EXAFS function can be adequately modeled, in the single-scattering, spherical wave approximations, as being the sum of the scattering contributions from each shell of neighboring atoms up to a distance that may reach as much as ~0.5 to ∼0.6 nm depending on the investigated system, this distance being determined by the inelastic losses undergone by the photoelectron along its mean-free path.

376 Mottana, Marcelli, Cibin & Dyar
EXAFS provides information on the local structure around the absorber on an almost instantaneous time scale (10-16 s), so it is a most efficient method to detect time-dependent reactions or atom re-orderings for the investigated compound. However, the resolution of EXAFS for interatomic distances is bound to be large (±0.002 nm at best) because static and vibrational atom disorder in most solids is large. Furthermore, Holmes et al. (1988) showed that errors increase with the order of the investigated shell: they may be as low as ±0.001 nm for the first-shell distances, and up to ±0.005 nm for the fourth-shell ones. The determined coordination numbers are also affected by high errors, such as ~10% (i.e., ±0.2 atoms) for the nearest-neighbor shell, increasing to ~20% (i.e., ±0.5 atoms) for the second shell. For higher order shells, the error may be so large (ca. 50%) as to practically make the determination irrelevant. Normally, the coordination numbers determined by fitting EXAFS spectra are lower than the expected theoretical ones. Results become worse and worse as the coordination number increases, and may be very difficult to evaluate even when using complex analytical methods (Díaz-Moreno et al. 2000). Indetermination in the coordination numbers is also partially due to the presence of multi-electron processes superimposed on the EXAFS oscillations (Deutsch and Hart 1984; Filipponi et al. 1987; Chaboy et al. 1994).
In the analysis of EXAFS spectra, neglecting multi-electron excitations, all these effects are accounted for by the Debye-Weller factor, which measures the mean square deviation of the absorber to scatterer interatomic distance from its average length. In order to minimize these effects, EXAFS spectra are increasingly often recorded at low temperature, where the signal to noise ratio is higher than at ambient temperature, and the scanned reciprocal space longer. Yet, there are satisfactory EXAFS determination carried out at extremely high temperatures, and many limitations of the EXAFS technique in determining coordination numbers can be overcome using the additional information contained in the XANES region. XANES
The XANES spectrum is certainly the most conspicuous and interesting part of the total absorption spectrum and, with the availability of third generation synchrotron radiation sources having brightness in the range 1015∼1021 photons.s-1.mm-2.mrad-2
(0.1% bandwidth)-1, it can be recorded even for atoms highly diluted in the investigated material (trace elements: down to 50 ppm). Qualitative XANES analysis is now well established, and there is consensus that XANES spectra contain information on the oxidation state of the investigated atom, on its coordination in the structure, and on the form and orientation of the first-coordination polyhedron around it. However, XANES spectra for a long time were impossible to interpret quantitatively, and even now their full understanding is hampered by the complexity of the crystal structure of most minerals. However, XANES examination allows extraction of reliable information on the electronic and structural properties of the system under investigation. In fact, while in a crystalline material, that can be oriented in the scattering geometry, the pair distribution function may be sufficient to determine the complete crystal structure, in disordered materials (e.g., glasses) all directional information is lost. In other words, the radius of the first coordination sphere is not simply correlated with bond angles that involve at least the three-atom correlation functions. Thus, methods such X-ray diffraction (or neutron scattering, EXAFS, and others that do not provide more than the pair distribution function) make many subtle correlations of non-crystalline systems inaccessible. By contrast, XANES contain a structural information that is not confined to a pair correlation function between different atoms only, but it also explains atomic correlation functions at high order (Benfatto et al. 1986; Filipponi et al. 1990).
The generally strong scattering power of the atoms of the medium for low kinetic

X-Ray Absorption Spectroscopy of the Micas 377
energy photoelectrons favors multiple scattering (MS) processes. At higher energies such as those at which the atomic scattering power becomes small, a single scattering (SS) regime occurs. Consequently, by decreasing the photoelectron kinetic energy, a gradual transformation from the EXAFS regime to the XANES regime takes place. Therefore, the EXAFS part of the XAS spectrum probes the first-order or pair correlation function of the atomic distribution near the absorbing atom, while the XANES part probes the triplet and the higher orders of the atomic distribution function. Indeed, the growth of XANES was stimulated by interest in the determination of higher order correlation functions of local atomic distributions in complex systems and multiple-scattering theories have been used in recent years to solve the XANES spectra of crystals, amorphous solids, surfaces, biological molecules, liquids, catalysts and chemical compounds.
The first successful attempt at extracting this kind of information for metal atoms in both tetrahedral and octahedral coordinations was carried out on liquid systems (Garcia et al. 1986), and only recently have similar studies on solid systems become satisfactory (Wu et al. 1996; Mottana et al. 1997, 1999). However, XANES spectra are still difficult to fully interpret quantitatively, because experimental data sometimes exhibit such a richness in structures as to make it difficult to unravel them one by one, while theory has to face the significant problem of finding out a good potential that enables describing large atom clusters. Essentially: the period of “fingerprinting” use of XANES is over, and although significant theoretical work is in progress, the time of its full appreciation has not yet come, except for a few, fairly simple systems.
A XANES spectrum consists of a sequence of features (i.e., peaks) that are characterized for their relative intensity (generally given as arbitrary units) and energy position (eV). Indeed, although the general characteristics of the XANES spectra are mainly determined by the atomic distribution of the atoms neighboring the absorber (local site symmetry), while being almost independent of crystalline order, the observed features are actually system-dependent, particularly for their intensity. Consequently, XANES spectra are usually divided in three regions (Natoli and Benfatto 1986; Fig. 1):
(a) the edge region, or low-energy XANES region, from the absorption threshold (i.e., the energy of the first allowed transition, that represents the lowest energy state reached by the core excitations) up to ca. 10 eV above;
(b) the full-multiple-scattering (FMS) region, up to ca. 20-30 eV above the absorption threshold;
(c) the intermediate-multiple-scattering (IMS) region, from ca. 20-30 eV above threshold upwards to ca. 50-100 eV.
The edge region contains a few weak features caused by electronic transitions to empty bound states; the FMS region contains an infinite number of multiple-scattering contributions; and, finally, the IMS region contains a small number (e.g., n < 4) of multiple-scattering contributions that are limited only by the core-hole lifetime process and by the inelastic photoelectron-valence electron scattering, mainly related to the overall structural properties of the material. This last region is bound with and actually merges into
(d) the single-scattering (SS) region, which is the EXAFS region mentioned above. The distribution of peaks and the ensuing separation of them in the three region is never straightforward, and in some systems they even overlap to a certain extent. However, if this theoretical description of XANES spectra is adopted (Natoli 1983; Natoli and Benfatto 1986; see Benfatto et al. 2001), then the two alternative theories of single- and multiple-scattering (Sayers et al. 1970 and Lee and Pendry 1975, respectively) can be unified and the treatment of the entire XAS spectrum traced back to a unique, complete, and physically coherent theory.

378 Mottana, Marcelli, Cibin & Dyar
Figure 1. The full XAS spectrum of a high-Z atom showing (insets) the different energy regions discussed in the text: pre-edge (left) and edge (right) region. Traditionally, XANES is the region of the spectrum where the photoelectron undergoes multiple scattering, and EXAFS that of the single-scattering regime.
The edge region contains a few, normally weak features caused by electronic transitions to empty excitonic states that are controlled primarily by the selection rules for mainly dipolar (less quadrupolar) electronic transitions. These transitions can be explained by the molecular-orbital theory (Obashi 1978), which has been applied for many years to the interpretation of edge spectra. At the beginning, the quantum mechanical selection rules that control the transition probabilities in the edge region were considered to be the same as those for optical spectra (Brown et al. 1988), for which a theoretical framework was already known. Indeed, although Shulman et al. (1976) were the first to recognize that pre-edge features can arise from 1s ↔ 3d transitions (based upon the observation that Zn2+, with a 3d10 configuration, has no pre-edge features), their entire assignment relied upon calculations, in the framework of the ligand-field theory, of the atomic or molecular final states of an atomic cluster that considered only the first shell. This theory proved to be inadequate. However, their method allows interpretation of the features occurring in the energy range 5 to 10 eV around the threshold only (pre-edge (PE) region). The first study that reached agreement between theory and experiment in the XANES study of solids, over a wide energy range that encompassed all the XANES region up to 50 eV above threshold, was by Bianconi et al. (1982). In that investigation, the experimental features in the XAS spectra of solids were associated to shape resonances, in which electrons are trapped in a molecular group, of the same type as those discussed by Dehmer and Dill (1976) for diatomic molecules.
The features just above the absorption threshold (called PE features) arise from different mechanisms: (1) the quadrupole mechanism (Balzarotti et al. 1980; Dräger et al. 1988); (2) the mixture of the transition metal 4p-states with the 3d ones owing to the non-
0 100 200 300 400 500 600 700
Abs
orpt
ion
(Arb
. Uni
ts)
E (eV)
XANES (MS) EXAFS (SS)

X-Ray Absorption Spectroscopy of the Micas 379
centrosymmetric symmetry of the coordination polyhedron around the absorbing atom (p ↔ d mixture; Ravel et al. 1993), and (3) the dipole-allowed transitions of the transition metal 1s electrons to the unoccupied 3d states of the neighboring transition metal atoms (band effect: Bianconi et al. 1985; Uozumi et al. 1992; Vedrinskii et al. 1997). Several additional factors contribute to intensity and energy of features in the pre-edge region, including spin state, oxidation state, and site geometry.
The intensity of peaks is related to transition probabilities. The 1s ↔ nd transitions in the pre-edge region are formally dipole-forbidden, but they have non-zero probabilities due to electric quadrupole transitions (Cabaret et al. 1999; Joly et al. 1999). This quadrupolar coupling is extremely weak (Hahn et al. 1982), about two orders of magnitude smaller than electric dipole coupling (Bair et al. 1980; Brouder 1990); however, in the cases where the cation occupies a non-centrosymmetric site, most of the intensity of the pre-edge features results from hybridization between the 3d and 4p states. In iron-bearing compounds, where the electric-dipole mechanism is fundamentally intense, a very small amount of 4 p↔ 3d mixing can have a dramatic effect on the intensity of the pre-edge feature (Roe et al. 1984; Randall et al. 1995; Westre et al. 1997). Consequently: (1) the greater the amount of 4p mixing into the 3d orbitals, the greater the intensity of the resultant pre-edge features; (2) the relatively symmetrical octahedral sites display little electric dipole coupling, but as site asymmetry increases, so does the 4p mixing into 3d orbitals. In micas, the tetrahedral sites have point symmetries of Td, so they are more distorted than the octahedral sites for which point symmetries may be C1, C2, or C2h. Accordingly, for a transition element occurring in both the tetrahedral and octahedral sites, the pre-edge tetrahedral peak will be far more intense. This effect is illustrated in Figure 2 for two micas that contain Fe3+ in different types of coordination (cf. Dyar et al. 2001).
Brown et al. (1988) quantified the increase in pre-edge intensity to be from 0.7∼2.0%
of the main edge for [6]Fe2+, to 5∼7% of the main edge for [4]Fe2+, and up to 15% of the main edge for [4]Fe3+. Galoisy et al. (2001) further noted that pre-edge intensity varies
Figure 2. Effect of coordination on pre-edge peak intensity: the lower intensity spectrum is taken from a Pikes Peak annite, which has been shown to contain only octahedral Fe3+ and Fe2+; the higher intensity spectrum is from a synthetic tetra-ferriphlogopite (after Dyar et al. 2001). Note that peak positions and intensities vary independently, and as a function of both coordination and oxidation state.

380 Mottana, Marcelli, Cibin & Dyar
inversely with coordination number for non-centrosymmetric environments, such that Ioct < I5-fold < Itet. Finally, the transition probability (and thus the relative intensity of the peak) is increased if the number of empty states in the d orbitals is large. For example: the pre-edge spectrum of a mineral containing vanadium, an atom which may occur in four valence states (V2+, V3+, V4+, and V5+, having configurations of 3d4, 3d3, 3d2, and 3d1, respectively), would be most intense for the V5+ (Delaney et al. 2000; cp. Wong et al. 1984; and also Cressey et al. 1993, and Schofield et al. 1995, for L-edge spectra).
The energy position of the peaks in the pre-edge region is also important, because it has a first-order relationship to oxidation state. Shulman et al. (1976) showed that pre-edge transitions differ from their analogous optical transitions because the number of transitions present (i.e., the strong field many-electron states) must be modeled for the d(n+1) excited state. This assumes that the dominant effect of the 1s core-hole is an increase in potential because it is spherically symmetrical (Westre et al. 1997). This 1s hole is so close to the nucleus that the outer orbitals see a configuration equivalent to that of the next highest ion in the periodic chart, with a fully occupied 1s shell. So, the final state of the ion, rather than having an atomic number Z with a 1s hole, is instead best approximated by that of a different nucleus with atomic number Z+1 (Shulman et al. 1976; Lee and Beni 1977): XANES spectra will show the energy levels predicted by the optical spectra for these Z+1 states. For example, the best analogs for Fe XANES spectra are Co optical spectra (of which, unfortunately, there are relatively few). However, for minerals, studies of this type on the pre-edge region are rare. Thus, it is necessary to fall back upon simple models based on fundamental principles. Tanabe-Sugano diagrams have been calculated for most simple coordination polyhedra, and from these the identity, if not the precise energy, of the peaks in any given pre-edge can sometimes be approximated.
Only recently have the energy separations of the pre-edge features of elements in different oxidation states and coordinations precisely been measured: e.g., in a series of minerals excluding the micas Petit et al. (2001) determined the energy separation between the average pre-edge centroid positions for Fe2+ and Fe3+ to be 1.4 ± 0.1 eV. Additionally, the pre-edge transitions for Fe in different coordination polyhedra relevant to micas can be summarized as follows (Calas and Petiau 1983; Galoisy et al. 2001): (1) [6]Fe2+ pre-edges should be composed of (at least) three peaks corresponding, from lowest to highest energies, to the T1g(4F), T2g(4F), and T1g (4P) states respectively; a fourth predicted transition, A2g, is not visible because it is a two-electron transition with low probability. For Fe3+ in either tetrahedral or octahedral coordination, two electronic transitions are expected: (2) for [6]Fe3+, the 5T2g(5D) state is lower in energy than the 5Eg(5D) state by approximately 1.1∼1.5 eV (Westre et al. 1997); (3) for [4]Fe3+, the states reverse in energy, as expected, on going from the octahedral to the tetrahedral coordination, with a smaller separation of about 0.6 eV (Westre et al. 1997), as predicted by crystal field theory.
Given that the current peak width with existing technology is roughly 0.9 eV, the [6]Fe3+ transitions can barely be resolved, and the [4]Fe3+ site shows only a single intense pre-edge. Furthermore, distortions from ideal octahedral symmetries to tetrahedral and square pyramidal geometries (as are found in most mineral spectra) allow for 3d ↔ 4p mixing, and affect both the intensity and energy distribution in the pre-edge region. So, while these simple models (three component peaks in pre-edge spectra of [6]Fe2+, two for [6]Fe3+, and one for [4]Fe3+) represent the best approximations for currently available data, we await better technology for higher resolution to improve our understanding of the complexity of transitions represented in the pre-edge region of micas, the more so as very satisfactory pre-edge calculations have been proven to be feasible in other systems (Ruiz-

X-Ray Absorption Spectroscopy of the Micas 381
López and Muñoz-Páez 1991) even in the polarized setting, which best accounts for the layered structure of the micas (Joly et al. 1999).
The full multiple-scattering (FMS) region of a XANES spectrum is dominated by multiple-scattering resonances of photoelectrons ejected at low kinetic energy, even when the binding energy is great. In particular, this region contains several intense resonances (including the white-line, i.e., the most intense resonance) that arise from superposition of contributions from the multiple-scattering interactions undergone by the photoelectron along its pathways, as well as from the atom electronic properties. Thus, most information contained in the FMS region relates to long- as well as short-range order, but all contributions are interwoven in such a way as to make interpretation in terms of multiple-scattering rather difficult. Only lately has suitable de-convolution software been developed (Benfatto et al. 2001) that is based on sound physical principles rather than being a mere mathematical peak fitting. Therefore, information on the electronic properties of the system can now be obtained.
The FMS region of XANES spectra may provide information about bond length. Indeed, the continuum part of the spectrum, where multiple-scattering features of the photoelectrons can be easily resolved, is sensitive to both coordination geometry and interatomic distances. The effect of the interatomic distance d has been shown to shift the multiple-scattering resonances, first in diatomic molecules with a given geometry (Dell'Ariccia et al. 1984; Bianconi et al. 1985), following the relationship kr d = const, where kr is the wave vector of the photoelectron at resonance; this relationship is valid only for small variations of d (< ~10%).
In solid compounds, the extraction of this kind of information is essentially based on the relationship known as Natoli’s rule (1983, 1985):
Er - Eb = const / d(A-L)2
where Er and Eb are the energies of the resonance feature and of the electron bound state, respectively, and d(A-L) is the distance from the absorber to its ligand. This formula does not need any determination of average interstitial potential, and is certainly true for the bound states at the K edges of transition metals (e.g., 1s to 4p transition). One of the major fields of application for such a formula is related to disordered or non-crystalline materials. However, it is seldom used for crystalline substances and, in particular, it has never been applied to any mica.
The intermediate multiple-scattering (IMS) region is a region that shares the multiple-scattering behavior of XANES and the single-scattering behavior of EXAFS. It usually consist of few, fairly weak and broad features (however sharper and stronger than the SS oscillations that follow) that mostly arise from interactions of the photo-electron with atoms in distant shells, at a high order (e.g., 4th or even 6th shell: Cabaret et al. 1996; Wu et al. 1996), or with preferential paths inside the first shell. This implies that the IMS region is strongly affected by the medium- to long-range orders of the studied structure, so that the similarity of IMS regions often represents a substantial proof of overall structure identity among the members of a complex solid solution series undergoing chemically-driven structural ordering (e.g., omphacite pyroxenes: Mottana et al. 1997, 1999).
Multiple scattering theory. At the end of this general overview of the practice of XAS spectroscopy, a short overview of the underlying theory is advisable that will clarify some statements otherwise acritically given. The short presentation that follows is based on the multiple-scattering theory as developed over the years by C.R. Natoli and coworkers (Natoli 1983; Natoli and Benfatto 1986; Natoli et al. 1980, 1990; Tyson et al.
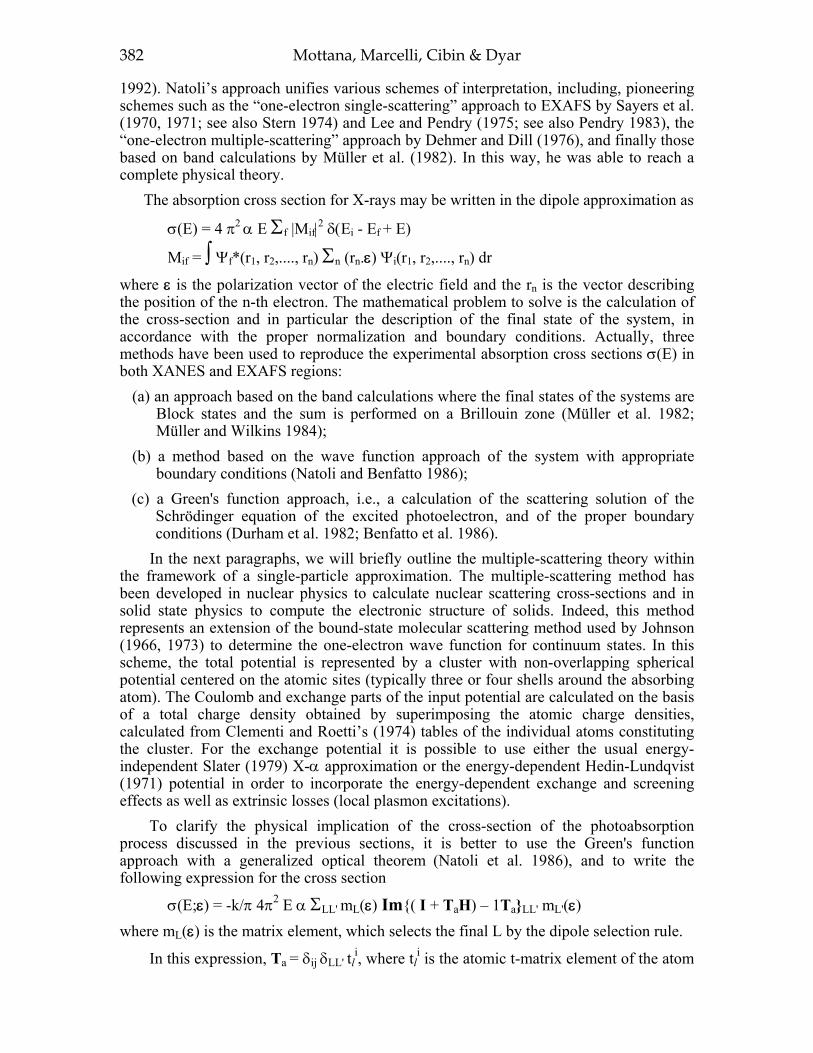
382 Mottana, Marcelli, Cibin & Dyar
1992). Natoli’s approach unifies various schemes of interpretation, including, pioneering schemes such as the “one-electron single-scattering” approach to EXAFS by Sayers et al. (1970, 1971; see also Stern 1974) and Lee and Pendry (1975; see also Pendry 1983), the “one-electron multiple-scattering” approach by Dehmer and Dill (1976), and finally those based on band calculations by Müller et al. (1982). In this way, he was able to reach a complete physical theory.
The absorption cross section for X-rays may be written in the dipole approximation as
σ(E) = 4 π2 α E Σf |Mif|2 δ(Ei - Ef + E)
Mif = ∫ Ψf*(r1, r2,...., rn) Σn (rn.ε) Ψi(r1, r2,...., rn) dr
where ε is the polarization vector of the electric field and the rn is the vector describing the position of the n-th electron. The mathematical problem to solve is the calculation of the cross-section and in particular the description of the final state of the system, in accordance with the proper normalization and boundary conditions. Actually, three methods have been used to reproduce the experimental absorption cross sections σ(E) in both XANES and EXAFS regions:
(a) an approach based on the band calculations where the final states of the systems are Block states and the sum is performed on a Brillouin zone (Müller et al. 1982; Müller and Wilkins 1984);
(b) a method based on the wave function approach of the system with appropriate boundary conditions (Natoli and Benfatto 1986);
(c) a Green's function approach, i.e., a calculation of the scattering solution of the Schrödinger equation of the excited photoelectron, and of the proper boundary conditions (Durham et al. 1982; Benfatto et al. 1986).
In the next paragraphs, we will briefly outline the multiple-scattering theory within the framework of a single-particle approximation. The multiple-scattering method has been developed in nuclear physics to calculate nuclear scattering cross-sections and in solid state physics to compute the electronic structure of solids. Indeed, this method represents an extension of the bound-state molecular scattering method used by Johnson (1966, 1973) to determine the one-electron wave function for continuum states. In this scheme, the total potential is represented by a cluster with non-overlapping spherical potential centered on the atomic sites (typically three or four shells around the absorbing atom). The Coulomb and exchange parts of the input potential are calculated on the basis of a total charge density obtained by superimposing the atomic charge densities, calculated from Clementi and Roetti’s (1974) tables of the individual atoms constituting the cluster. For the exchange potential it is possible to use either the usual energy-independent Slater (1979) X-α approximation or the energy-dependent Hedin-Lundqvist (1971) potential in order to incorporate the energy-dependent exchange and screening effects as well as extrinsic losses (local plasmon excitations).
To clarify the physical implication of the cross-section of the photoabsorption process discussed in the previous sections, it is better to use the Green's function approach with a generalized optical theorem (Natoli et al. 1986), and to write the following expression for the cross section
σ(E;ε) = -k/π 4π2 E α ΣLL' mL(ε) Im{( I + TaH) – 1Ta}LL' mL'(ε) where mL(ε) is the matrix element, which selects the final L by the dipole selection rule.
In this expression, Ta = δij δLL' tli, where tl
i is the atomic t-matrix element of the atom

X-Ray Absorption Spectroscopy of the Micas 383
at site i, describing its scattering power for a l spherical wave incident on it, while H = Hij
LL(1 - δij) is the free amplitude propagator of the photoelectron in the spherical wave state from site i with angular momentum L to site j with angular momentum L' and is the unit matrix. Looking with care at the last equation, it is clear that all the geometrical information about the medium around the photoabsorber is contained in the inverse matrix (I + TaH)-1. When the modulus of the maximum eigenvalue, ρ(TaH), of the matrix TaH is less than one, it is possible to expand the inverse in series (Natoli and Benfatto 1986) that are absolutely convergent relative to some matrix norm, so that
σ(E;ε) = Σn>0 σn(E;ε)
where
σn(E;ε) = -4π E α κ ΣLL' mL(ε) Im{(-1)n (TaH)n Ta}LL' mL'(ε).
In this expression, the term n = 0 represents the smoothly varying "atomic" cross section while the generic n term is the contribution to the photoabsorption cross section coming from processes in which the photoelectron has been scattered (n - 1) times by the surrounding atoms before returning to the photoabsorbing site. The unpolarized absorption coefficient, which is proportional to the total cross section, is given by
(Benfatto et al. 1986):
αF ≈ hν {(l + 1) Ml,l+1 χl+1 + l M l,l-1χl-1} where l is the orbital angular momentum of the core initial state (l = 0 for a K level), Ml,l±1 is the atomic dipole transition matrix element for the photoabsorbing atom, and
χl = {(2l + 1) sin2δl0}-1 Σm Im {( I + TaH)-1Ta}lm,lm
is the quantity that contains the structural geometrical information. Here, δl0 is the phase
shift of the absorbing atom. The total absorption coefficient can be expanded as a series
αF = α0 (1 + Σn>2 χn) where the first element α0 is the atomic absorption coefficient and the second term α1 is always zero because H1m,1m= 0. For the K edge, in the plane-wave approximation, the expression for n = 2 is the usual backscattering amplitude, i.e., the EXAFS signal times the atomic part. Actually, the first multiple-scattering contribution is the α3 term, which can be written (Benfatto et al. 1989) as
α3 = α0 Σi≠jIm { P1(cosφ) fi(ω) fj(θ) exp(2i(δ10 + kRtot))/kririjrj }
where rij is the distance between atoms i and j, fi(ω) and fj(θ) are the relative scattering amplitudes, which now depend on the angles in the triangle that joins the absorbing atom to the neighboring atoms located at sites ri and rj, and Rtot= ri + rij + rj. In this expression, cosφ = - ri
.rj, cosω = –ri.rij and cosθ = ri
.r ij. As a consequence, the n = 3 term and all terms with n higher than 2 contain information about the higher order correlation function. It is possible to observe also that, in this framework, because of P1(cosφ) = cosφ, there is a selection rule in the pathways. As an example, consider the α3 term: in all the cases where ri is perpendicular to rj, the corresponding MS term does not contribute to the total cross section because cosφ = 0. Neglecting multi-electron contributions, this description makes clear the distinction between the FMS and IMS regions in a XANES spectrum, and assigns any differences to the local geometrical structure of the system.

384 Mottana, Marcelli, Cibin & Dyar
In a practical way, in the analysis of XANES spectra of condensed systems the first step is to identify the size of the relevant cluster of atoms (Garcia et al. 1986; Benfatto et al. 1986), i.e., the cluster of atoms around the central absorbing atom. The size of this cluster may range from the smallest one, including only the nearest neighbors, to clusters including several surrounding shells. Neither translation symmetry nor site symmetry of such a cluster is required, and the finite size of the cluster is determined only by the mean free-path for elastic scattering of the photoelectron and by the core-hole life time. In the energy range 1∼10 eV, where the mean free-path becomes longer than 0.1 nm, the size limitation due to the core-hole lifetime is the most important parameter. Actually, the contribution of further shells can be reduced or cancelled out by different degree of structural disorder. Experimental spectra recording
Recent advances in X-ray spectroscopy of minerals are mainly related to the development of synchrotron radiation sources that overcame the limitations in energy range, intensity and stability of radiation that conventional X-ray tubes had. Currently, the availability of third generation electron storage rings and of special sources generated by insertion devices (wigglers and undulators) offers brilliant, tunable, and polarized sources in a wide range of energy, from IR to hard X-rays, and opens up new opportunities to all material sciences.
A schematic view of an experimental setup at one modern facility for X-ray absorption spectroscopy studies in the conventional transmission mode is shown in Figure 3. However, experimental setup and detection methods depend on several factors, the most important being the energy range of the X-rays to be used. In turn, this strictly depends upon the absorption edges to be analyzed. In the study of micas, it is opportune to investigate both low Z atoms (i.e., Na, Mg, Al, Si, K, etc.) and high Z atoms (e.g., Ti, V, Cr, Mn, Fe, etc). Such different energy ranges require different types of monochromators: (1) the soft X-ray energy range (<1 KeV) needs glancing incidence grating monochromators; (2) the X-ray energy range 1∼3 KeV needs special crystals like YB66 (Wong et al. 1990, 1999), InSb, quartz or beryl; and (3) the hard X-ray energy range (>4 KeV) requires double reflection Si or Ge crystals, the reflecting crystal plane being properly chosen to the purpose of achieving best resolution and high intensity. Moreover, the soft X-ray range requires special beam lines and experimental chambers and, because of the strong absorption of the radiation at these wavelengths in air, high (HV) or ultra-high vacuum (UHV) conditions are compulsory. The strong photon absorption of gases prevents the use of photo-ionization chambers; thus, in HV or UHV
Storage Ring
Slit
Monochromatorcrystals
Incident flux (IO)Ionization Chamber Transmitted flux (I1)
Ionization Chamber
e-
Sample
Figure 3. Schematic representation of a modern experimental setup for X-ray absorption spectroscopy in the transmission mode.

X-Ray Absorption Spectroscopy of the Micas 385
conditions, electron detection systems are usually employed. Metal grids can be used to monitor beam intensity, either by means of electron multipliers (channeltron) that collect all electrons extracted by the photon beam, or by direct measurement of the drained photo-electron current (Stöhr et al. 1980).
The detection system depends on the concentration of absorbing atoms in the material and photon energy. For bulk experiments using hard X-rays (i.e., with hν > 4 KeV) on samples with concentrations above 10-3 (atomic ratio), standard X-ray transmission techniques are used. The incident and transmitted fluxes are typically measured by photo-ionization chambers. In the soft X-ray range (i.e., with hν < 1000 eV), absorption spectra may be efficiently measured by recording core-hole decay products. If we describe the inner-shell photo-ionization process as a two-step process, then in the first step the photon excites a core-hole electron pair, and in the second step the recombination process of the core-hole takes place. There are many channels suitable for core-hole recombination. These channels may produce the emission of photons, electrons, or ions, all of which are collected by special detectors. The recombination channel that is normally used to record bulk XAS spectra of dilute systems is the direct radiative core-hole decay that produces X-ray fluorescence lines. When fluorescence lines have high photon energies, this technique probes the bulk. In Figure 4 a beam line with an apparatus to record absorption spectra in the fluorescence mode is schematically represented.
Figure 4. Schematic representation of an apparatus designed to record X-ray absorption spectra in the fluorescence mode.
In the soft X-ray range, the Auger recombination has a higher probability than the radiative recombination (Stöhr et al. 1984). Because the energy of the Auger electrons is characteristic of a particular atom, the selective photoabsorption cross-section of an atomic species (in particular those chemisorbed on a surface) can be measured by monitoring the intensity of its Auger electrons as a function of photon energy. An intense Auger line is selected by an electron analyzer operating in constant final state (CFS) mode with an energy window of a few eV. A standard experimental setup for this type of XAS measurement is shown in Figure 5 (modified after Stöhr et al. 1984). Note, however, that Auger electrons arise from the uppermost impinged layers of atoms; consequently, this type of measurement is essentially probing the surface of the sample, i.e., it competes with surface EXAFS (i.e., SEXAFS), rather than with bulk XAS. For
Incident flux (IO)
Ionization ChamberSample
Fluorescence Detector

386 Mottana, Marcelli, Cibin & Dyar
mmm
Figure 5. Schematic representation of a standard experimental setup for surface X-ray absorption measurements.
bulk measurements, the total electron yield (TEY), which has been found to be proportional to the absorption coefficient (Gudat and Kunz 1972), is used. This technique measures the integral yield over the entire energy range of the emitted electrons. The advantage of this method is that maximum counting rates are obtained, since all the emitted electrons over a large solid angle can be collected by applying a positive voltage to the detector. Another detection method used is the low-energy partial electron yield (PEY), where only the secondary electrons within a kinetic energy window around the maximum in the inelastic part of the electron energy distribution curve (EDC) are collected. Because of the long escape depth for low-energy electrons, the bulk absorption recording with this method makes use of an electron analyzer.
High resolution, on the order of 0.15-0.2 eV (i.e., a resolving power in the range 104), is experimentally demanding in XANES spectroscopy because important physical information can be extracted from small variations in the intensity and/or energy shift of an absorption peak. For this reason, careful preparation of homogeneous pinhole-free samples and suppression of high harmonics in the incident photon beam are required. Using crystal monochromators, the energy band width ΔE of the photon beam monochromatized by Bragg diffraction is determined by the angular divergence ΔΘ and by the crystal rocking curve. In synchrotron radiation beam lines, the angular divergence depends upon the intrinsic vertical spread of the radiation, which is determined by both the energy of the electron beam circulating in the storage ring and the source size, i.e., the diameter of the electron beam and its divergence at the emission point as determined by the electron optics. Resolution can be improved by changing either the crystal or the reflection plane. In a double-crystal monochromator, two parallel reflections produce a monochromatised photon beam parallel to the incident one. These two reflections reduce the tails of the rocking curve, and consequently increase the resolution, but they leave the higher-order harmonic reflection content like that of a single reflection (Greaves et al. 1983). Less common are other types of high-resolution crystal monochromators with special geometries that make use of antiparallel reflections. Finally, high-resolution XANES spectra may be measured using higher-order reflections. Harmonic rejection may be achieved in devices with two crystals by detuning one crystal with respect to the other. In fact, when the two crystals are misaligned, the intensity of the harmonics drops off much more rapidly than the intensity of the fundamental, because bandwidth ωn(λ) is
Incident Flux (IO
)Metal Grid Sample
e-
Channeltrons
e-

X-Ray Absorption Spectroscopy of the Micas 387
αε
αx
z
y
Sam
ple
surf
ace
hν
ε
much narrower for n > 1 harmonics than for the fundamental one. The higher-order harmonic content in the synchrotron radiation beam is due to the intense continuum of the primary beam extending towards high energies, and it represents a significant contribution in all the high-energy third-generation synchrotron sources. Actually, rejection of higher-order harmonics may be obtained using either mirrors behaving as low-band pass filters, and/or by detuning crystals, or even by means of undulator sources. Optimization of spectra
Orientation effect. Most experimental XANES spectra on micas were measured on powders, obtained by grinding hand-picked grains that had been gently settled on a flat sample-holder after dispersion in a liquid. The resulting mounts were considered to be randomly oriented, regardless of their grain-size homogeneity and distribution. However, experience gathered on other sheet-silicates (e.g., Manceau 1990; Manceau et al. 1988, 1990, 1998) has shown that, even in fine-grained powders, crystallite orientation strongly affects the shape of the final spectrum: primarily, it changes peak intensity, which is a significant component of the information and certainly reflects onto its quality (see above). If this is indeed the case, then among the mica XANES spectra performed so far (Table 2) only a few can be considered to be reliable. These include work by Osuka et al. (1988, 1990), Mottana et al. (1997) and Sakane et al. (1997), in which no special care was taken, but the investigated micas, being synthetic, were so homogeneously fine-grained (1 μm) as to certainly lie on the sample-holder with their c axis more or less orthogonal to its surface and with their a and b axes oriented at random on it.
A theoretical study of the orientation effect has been recently presented for self-supporting clay-mineral thin films by Manceau et al. (1998), who also propose a tridimensional system of coordinates to record spectra in a standard setting. Their method, slightly modified by Cibin et al. (2001), has been adopted by Mottana et al. (in preparation) for single crystal mica blades (Fig. 6). Another approach used by Dyar et al. (in prep.) uses mica single crystals mounted on fibers in goniometer heads, which are then fitted onto a spindle stage mounted with the plane of rotation perpendicular to the path of the beam.
Figure 6. The coordinate system applicable to angular measurements on self-supporting phyllo-silicate films as used for micas (Cibin et al. 2001; cf. Manceau et al. 1998, Fig. 2). Z-Y is the plane onto which the sample lies, with the X-ray beam impinging along X and linearly polarized on X-Y; α is the incidence (rotation) angle between the electric field vector ε and Y.
For a perfectly random distribution of very small crystals (powder) there would be
no angular variation effect on the experimental XAS spectra; however, for a fully oriented crystal structure such as that of a mica blade lying flat on the sample-holder, the amplitude of the scattered photoelectron wave depends on the angle α between the

388 Mottana, Marcelli, Cibin & Dyar
electric field vector ε of the impinging beam and the layers in the structure. This angle can be determined either by rotating the sample-holder on its vertical axis, or by preparing suitably oriented thin sections to be glued on the sample-holder in its routine setting orthogonal to the X-ray beam (α = 0°).
Mottana et al. (in preparation) operated at SSRL at the 3-3 beamline (Hussain et al. 1982; Cerino et al. 1984), which is equipped with a double-crystal monochromator made
Table 2. Published XAS data on mica species materials.

X-Ray Absorption Spectroscopy of the Micas 389
of efficient crystals such as YB66 (Wong et al. 1990 1999). They scanned single-crystal mica blades lying flat on the vertical sample-holder and optically-oriented in such a way as to have a ≅ b // Z. Here Z is an axis lying parallel to the mica surface (Fig. 6). The synchrotron beam first impinges the mica at right angle (α = 0°); then the blade is rotated and α increased up to 60∼80°, this being the maximum angle allowed by the mechanics of the sample compartment and the geometry of detection, which uses channeltrons. Therefore, the electric vector ε always lies on the horizontal plane, but it impinges two almost perpendicular sections of the mica structure so as to scan its atoms under different angles, with their atomic bonds and angles geometrically modified.
The orientation effects observed in this way are clearly visible in a natural muscovite compositionally close to the end member (Fig. 7). It is quite clear that orientation dramatically affects the intensity of all peaks, including the white-line, but also—although to a much lesser extent—the positions of some of them, by as much a 5 eV. A comparison between Figure 7 and the Al K-edge spectrum reported by Mottana et al. (1997; cf. Fig. 4) for synthetic muscovite, which is expected to be randomly oriented owing to its very fine-grained powdery nature, shows that best agreement is attained for a rotation angle α in between 45 and 70°.
Figure 7. Changes in an Antarctica muscovite Al K-edge spectrum due to changing the orientation of the same crystal blade against the impinging, horizontally-polarized synchrotron radiation beam. In the right panel a magnified view of the white-line intensity as a function of the α rotation angle.
A similar comparison between the Fe K-edge spectra of a phlogopite single crystal rotated in the same way (Fig. 8) and the several Fe XANES spectra of phlogopites in the literature (Table 1) confirms that best agreement is obtained when the crystal is rotated at α ca. 45°. Indeed, later work (unpublished) showed that best agreement for the same sample, when scanned as both single crystal (at various angles) and as a settled homogeneous powder having a grain size of ca. 5 μm, is obtained when α is equal or very close to the “magic angle” value 54.7° (Pettifer et al. 1990).
Changes with orientation are also clearly evident in the XANES spectra of a number of di- and tri-octahedral micas and one brittle mica, respectively at the Mg (phlogopite: Fig. 9), Si (muscovite: Fig. 10, and tetra-ferriphlogopite: Fig. 11), K (muscovite: Fig. 12), and Fe (clintonite: Fig. 13, and tetra-ferriphlogopite: Fig. 14) K edges. Such changes
E (eV)

390 Mottana, Marcelli, Cibin & Dyar
imply
Figure 8. Changes in a Franklin phlogopite Fe K-edge spectrum due to changing the orientation of the same crystal blade against the impinging, horizontally-polarized synchrotron radiation beam. In the right panel a magnified view of the changes undergone as a function of the α rotation angle by the edge and FMS regions (top) and by the IMS region (bottom).
Figure 9. Changes in the FMS region of a Franklin phlogopite Mg K-edge spectrum due to changing the orientation of the same crystal blade against the impinging, hori-zontally-polarized synchrotron radiation beam.
imply displacements in the peak positions from 0 up to 5 eV, and variation in the intensities by as much as 50%, with even reversals in the intensity of the edge top (Fig. 9) or appearance viz. disappearance (Fig. 11) of certain features. Most commonly, these changes occur gradually and trend always in the same direction, thus demonstrating their dependence upon the gradual rotation applied to the crystal. In turn, this rotation mostly reflects changes in the lengths of the bonds lying in the polarization plane, excited in the photoabsorption process, or in the lengths of multiple-scattering paths which are also probed in that geometry. Such spectral changes affect both the FMS and IMS regions, thus showing their dependence mostly upon the geometry of the section of the crystal that is being scanned by the synchrotron beam, as cosα. However, unexpected changes such as the one at the white-line in the phlogopite Mg K-edge spectrum (Fig. 9), or the sudden
1300 1310 1320 1330 1340
0º30º45º70º
Energy (eV)
Abs
orpt
ion
(Arb
. Un.
)
Philgopite Mg K edge
E (eV)

X-Ray Absorption Spectroscopy of the Micas 391
Figure 10. Changes in an Antarctica muscovite Si K-edge spectrum due to changing the orientation of the same crystal blade against the impinging, horizontally-polarized synchrotron radiation beam. In the right panel a magnified view of the changes undergone by the edge and FMS regions.
Figure 11. Changes in a Tapira tetra-ferriphlogopite Si K-edge spectrum due to changing the orientation of the same crystal blade against the impinging, horizontally-polarized synchrotron radiation beam. In the right panel a magnified view of the changes undergone by the edge and FMS regions.
appearance of a new low-energy peak, as in the muscovite Al and Si K-edge spectra (Figs. 7 and 10) and in the tetra-ferriphlogopite Si K-edge spectrum (Fig. 11), demonstrate the possibility that the electronic properties of the absorbing atom are also involved. We have to underline here that this interpretation of the near-edge structure is fully equivalent to the interpretation that is based on local geometrical distributions, such
392 Mottana, Marcelli, Cibin & Dyar
lk
Figure 12. Changes in an Antarctica muscovite K K-edge spectrum due to changing the orientation of the same crystal blade against the impinging, horizontally-polarized synchrotron radiation beam. In the right panel a magnified view of the changes undergone by the edge and FMS regions.
Figure 13. Changes in a Lago della Vacca clintonite Fe K-edge spectrum due to changing the orientation of the same crystal blade against the impinging, horizontally-polarized synchrotron radiation beam. In the right panel a magnified view of the changes undergone by the edge (top) and IMS regions (bottom).
as those expected when the different local atomic distributions in the micas are being compared.
To summarize, in order to obtain XANES spectra that may be meaningfully compared, we recommend orienting the sample, when a single crystal, always at the same angle of rotation α = 54.7°. This is essentially the same conclusion reached by Manceau et al. (1998) for the self-supporting clay films they experimentally investigated by

X-Ray Absorption Spectroscopy of the Micas 393
fffffffff
Figure 14. Changes in a Tapira tetra-ferriphlogopite Fe K-edge spectrum due to changing the orientation of the same crystal blade against the impinging, horizontally-polarized synchrotron radiation beam. In the right panel a magnified view of the changes undergone by the edge (top) and FMS and IMS regions (bottom).
polarized EXAFS and theoretically interpreted by performing full multiple-scattering calculations. Furthermore, we also recommend recording a full XAS spectrum of the same sample, after grinding it and settling in water for precisely determined times so as to obtain a well-classified powder possibly in the grain size range 1 to 2 μm.
Dyar et al. (2000) used a different method of studying the orientation effects on the pre-edge region of Fe-bearing micas, with similar results. In that study, the micro-XANES probe at the National Synchrotron Light Source (NSLS), Brookhaven, NY, was used, allowing a beam size of 10 × 15 μm. Because the beam is smaller, samples on the order of 30 × 30 × 100 μm (orders of magnitude smaller than those used by other workers) could be studied, and concerns about sample homogeneity lessened. Each crystal was oriented with its cleavage perpendicular to a glass thin section, and then UV-hardening epoxy was used to maintain it in that geometry. The mica+epoxy was removed from the thin section, and two mutually parallel faces were polished on each sample perpendicular to cleavage (though in an unknown orientation relative to the a and b axes: see Fig. 15). This preparation permitted acquisition of spectra in two important directions
Figure 15. Optical orientation of a model mica crystal showing the random position of the thin section cut across cleavage and used for microXANES measurements (Dyar et al. 2001).

394 Mottana, Marcelli, Cibin & Dyar
perpendicular and parallel to cleavage by simple rotation of the sample. A further advantage of this method is that parallel studies of the optical and IR absorption spectra of the identical crystals could be made. In more recent work (Dyar et al. in prep.) single crystals were analyzed while mounted on goniometer heads, so the beam could be polarized along the X, Y, and Z optical orientations.
As with the work of Mottana et al. (in preparation), changes in peak intensity and, to a lesser extent, energy, were observed by Dyar et al. (2001) as a function of sample orientation. At the main edge, the difference in the intensity of the highest energy peak relative to the other prominent peak or peaks is generally greatest when the synchrotron beam is polarized in the direction of the cleavage plane, with a few exceptions. In the pre-edge region, intensity variations were also observed, but the maxima and minima were not necessarily parallel or perpendicular to cleavage, and the orientation at which maximum intensity occurred was different for various samples. This implies that there are variations in peak intensity not only perpendicular and parallel to the mica cleavages, but also within the sheets themselves as a function of orientation with respect to the unconstrained position in the XY plane. Such a conclusion is not surprising in a monoclinic mineral species: the XANES probe is sampling different bonds at different orientations relative to noncentrsymmetric Fe sites (Dyar et al. 2001; in prep.).
Spectrum fitting. In standard XAS experiments, signal to noise (S/N) ratios in the range 103∼104 can be achieved. However, to fully enhance XANES potentials, these are not enough, especially in the soft-X-ray energy range where such ratios are only achieved after a perfect preparation of the sample. Consequently, with a lower S/N ratio, the best understanding of XANES critically depends upon a careful fitting of the experimental spectrum during which no fine details get lost.
The standard procedure in XAS spectrum analysis follows two steps: the experimental spectrum is (1) corrected for background contributions from lower energy absorption edges by linear or polynomial fitting of the base line, then (2) normalized at high energy, i.e., close to the upper end of the XANES region at an energy position where no obvious features can be seen. In addition, for pre-edge analysis the contribution of the absorption jump is subtracted by an arctangent function. This procedure leaves a profile of the entire K-edge region that consists of a number of features, occasionally partially superimposed, that can be either evaluated visually or fitted by Gaussian or Lorentzian curves. The numerical values of the fitted curves (energy and intensity, with errors and significance bars) can then be used as solid data for interpretation. This standard procedure assures accuracy in energy position ±0.1 eV for the pre-edge, and ±0.03 eV for all other regions of the XANES spectrum. Both values are well within resolution, which increases with energy from ca. 0.3 to ca. 1.5 eV on going from the Na K-edge to the Fe one (Schaefers et al. 1992). Accuracy in the intensity measurements is estimated to be better than 10%. However, such intense structures as the "white line" are affected mainly by the harmonics content.
At all synchrotron sources, a step preliminary to all this standard procedure consists of calibrating the energy positions of all peaks against standards (usually metal foils). An alternative way is to calibrate them against a “glitch”, i.e., a spurious absorption at constant energy in the spectra that is due to a planar defect present in the monochromator crystal (cf. Wong et al. 1999, for YB66). When high thermal loads heat the monochromator crystals, a further systematic correction is applied that takes into account the decrease of the ring current (and heat load) with time.
As a matter of fact, in most mica studies a careful fitting procedure is seldom applied, and the “fingerprinting” method of evaluation is still predominant (Table 1). A

X-Ray Absorption Spectroscopy of the Micas 395
recent improvement in the fitting procedure is based upon a novel software (Benfatto et al. 2001). However minor the error induced by such evaluation may be, any concomitant carelessness in taking into account orientation effects would, at the end, result in crowding the literature with spectra useless for interlaboratory comparisons. Systematics
XAS studies on micas: a catalogue. Table 1 lists all XAS studies carried out on micas that could be retrieved in the relevant literature. They are presented in the alphabetical order of the di- and tri-octahedral mica species nomenclature approved recently (Rieder et al. 1998) and are further subdivided on the basis of the investigated atom.
Almost all investigated samples are natural and are therefore intermediate in composition. However, some of them are close enough to end member compositions as to make it possible to classify them accordingly. Only seven true end members corresponding to natural mica species have been studied so far by XAS, i.e., the Tapira tetra-ferriphlogopite (Giuli et al. 2001) and the six synthetic micas investigated by Mottana et al. (1997). Even all other synthetic micas (Osuka et al. 1988 1990; Sakane et al. 1997) are intermediate, as they are doped crystals obtained for technological purposes. Furthermore, among the synthetic micas quite a few have no natural counterpart (Soma et al. 1990; Han et al. 2001). XAS studies on otherwise insufficiently characterized samples, or on samples with composition being complex solid solutions from the crystal-chemical viewpoint, are listed at the bottom of Table 1, in the section that accounts for the approved series names (cf. Rieder et al. 1998 Table 4).
The first XAS spectra ever recorded on micas were those by Brytov et al. (1979) at the Si and Al K edges. However, as all these spectra were recorded in the late 1970s and early 1980s using a conventional X-ray tube as the source, they are practically useless for present-days studies because of the limited resolution: in practice, only the general shape is worth examining (e.g., Jain et al. 1980 Fig. 1). Nevertheless, these early attempts deserve to be remembered, for both the pioneering effort they record and their historical significance.
The earliest synchrotron-activated experimental XAS spectrum for any mica was Calas et al.’s (1984) chromium muscovite at the Cr K edge. Although noisy, particularly in the pre-edge region, this spectrum satisfactorily compares with the recent spectrum of a similar mica at the same edge (Brigatti et al. 2001; see below), thus suggesting not only the high level of technical skill of the operators, but also that comparison of power spectra collected at very different times and on widely different synchrotron storage rings can be confidently made, provided the basic requirements of energy calibration and background subtraction were carefully applied (see above).
Occasionally, mica has been used also to support epitaxially-grown layers that have been investigated by XAS (e.g., Blum et al. 1986; Drozdov et al. 1997). Although reported in Table 1, these XAS studies actually do not belong to mica studies. Finally, there has never been a spectrum published so far but those presented above to which the above-given precautions on orientation effects were applied (see also Dyar et al. 2001 and in prep.). Even the spectra that will be described in the following were obtained on ground powders, presumed to be homogeneous in their grain-size and randomly oriented, but never tested for those conditions.
Determination of the oxidation state. Determining the effective charge on the absorbing atom from the chemical shift of the X-ray absorption threshold is a fundamental issue for XANES. However, a direct measure of the "ionization threshold" or "continuum threshold" (i.e., the energy at which the electron is excited in the

396 Mottana, Marcelli, Cibin & Dyar
continuum: e.g., the Fermi level in metals) is not possible because of the lack of any signature of it. Therefore, XANES is not a direct probe of core-level binding energy as other methods are (e.g., XPS or ESCA). However, there is evidence in both gas molecules and solid compounds that the energy shift of the first bound excited state at the absorption threshold follows the binding energy shift of the core level. Moreover, a linear dependence between core-level binding energy and atomic effective charge has been measured (Belli et al. 1980). By contrast, no linear relationship between the measured shift of the first strong multiple-scattering resonance and the effective atomic charge on the ion exists. The energy of multiple-scattering resonances is strongly dependent on interatomic distance, so their chemical shifts are much larger than that of the core excitation. Actually, the variation of the effective charge on an atom is often increased and a linear correlation with core-level binding energy indeed exists; however, this effect is always system-dependent. Moreover, within the same structure any correlation among the parameters of the potential is certainly confined only to small changes of the interatomic distances (e.g., less than 10%).
Correct identification of the oxidation state of 3d transition metals is indeed important, but the quantification of the oxidation ratio is even more important in the case of potentially multivalent minerals such as the micas, a group where the number of elements occurring with more than one oxidation state is significant (Fe, Mn, Cr, V and possibly Ti: cf. Table 1) and their amounts may be so large as to even become essential and determine new end members. All transition element K-edge spectra display a pre-edge (Belli et al. 1980) and, mostly, all features of the pre-edge are strong enough to be easily recorded experimentally. Position and intensity of the peaks occurring in the pre-edge region can be reliably used to determine the oxidation state(s) of the absorbing atom (e.g., Waychunas 1987). However, as already seen (Fig. 2, above), coordination too plays a role, so that care must be made in discriminating the two effects, and to this purpose spectra need to be properly deconvoluted.
As discussed above, the energy position of the peaks in the pre-edge region may be directly related to the increase in the oxidation state of the absorber atom: e.g., the pre-edge feature of Fe3+ is generally ca. 2∼3 eV higher in energy than the corresponding feature for Fe2+ (Waychunas et al. 1983; cf. Petit et al. 2001). The amount of such a “chemical shift” is different for the different transition elements, and depends on the final state reached by the electron. Implicitly, this weakens the possibility of reliably determining the oxidation state of a given atom when it occurs in different coordination sites of the same compound. However, when a significant part of the atom occurs in a tetrahedrally-coordinated site, the relevant pre-edge is strongly intensified owing to d-p mixing, and the determination of the oxidation state of the tetrahedral atom is made fairly easy to measure: e.g., amounts of Cr3+ in tetrahedral coordination as small as 0.5% could be detected even in the presence of a significant amount of Cr3+ in octahedral coordination (Brigatti et al. 2001; see below). Consequently, subtraction of the tetrahedrally-coordinated component can be made. The residual pre-edge spectrum of the octahedrally-coordinated atoms is then de-convoluted into its components to determine their oxidation state(s).
Bajt et al. (1994 1995) and Sutton et al. (1995) have pushed the practice of pre-edge examination further to reach an effective quantification of the oxidation states for Fe, the atom which most frequently occurs in two oxidation states in the same site of minerals. They have developed, and Galoisy et al. (2001) and Petit et al. (2001) have recently improved upon, a procedure that makes use of the known positions of pre-edge peaks of Fe K-XANES spectra in mineral standards to fit a calibration line giving the Fe3+/ΣFe ratios of various minerals (Fig. 16).

X-Ray Absorption Spectroscopy of the Micas 397
Figure 16. Plot of “pre-edge peak energy” vs. “Fe3+/ΣFe” for well characterized standards. The trend is linear with a correlation coefficient of 0.99 (after Sutton et al. 1995, p. 1465, Fig. 3).
However, extensive additional work by Dyar et al. (2001) on suites of Fe3+ and Fe2+ end members confirms that the energies of the end-member pre-edges vary considerably for several different mineral groups, and thus no single mineral species can be used to model all cases of any type of Fe (Fig. 17). Because different mineral groups have variably distorted coordination polyhedra, use of mineral group-specific standard end members will ultimately be necessary to interpret pre-edge positions assigned to different transitions. Examples of using this method to determine of the Fe3+/ΣFe ratios of a number of rock-forming micas are given elsewhere (Dyar et al. 2001).
Determination of local coordination geometry. The position and intensity of the peaks in the pre-edge region do not solely depend upon the oxidation state of the absorber transition metal, but also upon the shape of the site (coordination polyhedron) where the absorber is located in the structure (Calas and Petiau 1983). An increase in coordination number provokes a positive energy shift, while the intensity of the peak is proportionally reduced (Waychunas et al. 1983). The first attempt at using the pre-edge features to determine quantitatively site geometry
is Waychunas’ (1987) for the Ti K-edge of a suite of silicate and oxide minerals, including a biotite from Antarctica. He fitted Gaussian features to the entire edge region, and found that individual features are insensitive to changes in the Ti-O bond length, but sensitive to valence, with Ti3+ at ca. 2.0 eV lower energy than Ti4+. Moreover, the intensity of the second pre-edge feature at ca. 4969 eV turned out to be sensitive to both octahedral site distortion and to presence of tetrahedral Ti4+. A correlation was found for silicates between intensity and bond-angle variance σ2 in the octahedral Ti site, and for biotite σ2 could be quantified to be ca. 30 deg2, in fair agreement with the value computed from the X-ray diffraction crystal structure determination (Ohta et al. 1982). Cruciani et al. (1995) essentially followed the same

398 Mottana, Marcelli, Cibin & Dyar
gggg
Figure 17. Variation of the absolute pre-peak energy vs. Fe3+ content in the end-members of several mineral groups; after Delaney et al. (in preparation).
Figure 18. Experimental Cr K-edge spectra for the Anatoki River and Westland chromium muscovites, a synthetic SrCrO4 standard for tetrahedral Cr6+ (top) and an Outukumpu uvarovite standard for octahedral Cr3+ (bottom). See text for discussion (Brigatti et al. 2001, Fig. 6).
5990 6000 6010 6020 6030 6040 6050E (eV)
Anatoki river
Westland
Uvarovite
SrCrO4
Abs
orpt
ion
(arb
.uni
ts)

X-Ray Absorption Spectroscopy of the Micas 399
Figure 19. Pre-edge fit of the Westland chromium muscovite Cr K-edge spectrum of Figure 18 and (inset) its de-convolution in two Gaussian components (Brigatti et al. 2001 Fig. 7).
procedure when trying to determine the [4]Fe3+ contents of a series of natural phlogopites, but came to a purely speculative result owing to the insufficient resolution of the monochromator crystal and the extremely low amount of sample available.
As an example of successful evaluation, we report the case of two chromium muscovites worked out by Brigatti et al. (2001) at the Cr K pre-edge; the procedure they followed is the one developed by Peterson et al. (1997) for oxides. The Anatoki River and Westland chromium muscovites Cr K-edge spectra were compared with a synthetic SrCrO4 standard, for tetrahedral Cr6+, and a natural uvarovite, for octahedral Cr3+ (Fig. 18). The Anatoki River muscovite Cr K-edge spectrum proved to be too noisy for further evaluation, but the Westland one, after subtraction of the edge contribution by a pseudo-Voigt function, had its pre-edge resolved in two Gaussian components: at 5991.3 eV and 5994.0 eV, respectively (Fig. 19). The second Gaussian component appears in the experimental spectrum only as a skew tail at the end of the pre-edge, owing to interference with the rapidly rising slope leading to the edge. However, after subtracting this interference, it can be reliably measured for both energy and intensity. The evaluation step that follows involves interpretation. If the second-component intensity is assumed to be the same as that of the single, symmetrical Gaussian pre-edge feature of a SrCrO4 standard in which the Cr6+ is entirely in tetrahedral coordination, then it can be appraised that amount of [4]Cr in muscovite, if any, cannot exceed 0.4-0.5% of total Cr (cf. Lee et al. 1995). By contrast, if both Gaussian components are considered to be due to [6]Cr3+, as in the uvarovite standard, and interpreted as a way to measure the distortions of the muscovite octahedral sites where Cr3+ is possibly hosted, then their relative

400 Mottana, Marcelli, Cibin & Dyar
1560 1565 1570 1575 1580 1585 1590 1595
Abs
orpt
ion
(Arb
. Un.
)
E (eV)
Albite
Phlogopite
Polilithionite
Grossularia
intensities (1.3 and 1.2% nau [= normalized absorption units]) show that these two sites are very similar. Indeed, this is nothing more than an extension to Cr of the method for quantitatively determination of site distortion for octahedra centered by Ti4+ calibrated by Waychunas (1987).
In the case of the already-mentioned Fe K pre-edge of tetra-ferriphlogopite, where Fe3+ is entirely in the tetrahedral site, the pre-edge is twice as strong and shifted to higher energy (ca. 2 eV) relative to annite, where Fe is mostly in the octahedral site (Fig. 2). This apparent irregularity can be explained by comparing the sharp single peak of tetra-ferriphlogopite, a synthetic endmember, and the broad, probably double peak of the Pikes Peak annite, the Fe of which is entirely octahedral, but partly Fe2+ and partly Fe3+. Clearly, the oxidation effect is more important than the coordination effect in determining the position of the Fe K pre-edge. However, the strong intensity of the tetra-ferriphlogopite peak also suggests that its Fe is constrained in a more tightly-bound coordination polyhedron than the annite one. Note, however, that there is an underlying problem in the pre-edge region that needs a more careful evaluation, and not only in these systems: this problem is the amount of quadrupolar effects present (see Giuli et al. 2001, for additional evaluation).
Figure 20. Shift of the white-line in the FMS region of the Al K-edge spectra of two synthetic micas as a result of two different coordination geometries: in phlogopite the Al atoms are entirely in a tetrahedral site geometry, and in polylithionite in an octahedral site geometry, as they are in the reference albite and grossular natural standards, respectively (Mottana et al. 1997, Fig. 3).
Coordination geometry also plays a role in shaping the FMS region of a XANES spectrum. This effect was clearly documented for the Al K edges of certain synthetic micas by Mottana et al. (1997), who showed that there is a shift of at least 2 eV between [4]Al as in phlogopite and albite, and [6]Al as in polylithionite and grossular (Fig. 20). Moreover, they found that it is possible, although difficult, to recognize the concomitant presence in the spectra of two white-line features arising from contributions of the same atom occurring in two different geometries ([4]Al and [6]Al in zinnwaldite and
A1 K edge

X-Ray Absorption Spectroscopy of the Micas 401
1290 1300 1310 1320 1330 1340
Abs
orpt
ion
(Arb
. Un.
)
E (eV)
Phlogopite
Tetra-ferriphlogopite
Biotite
Clintonite
Mg K edge
preiswerkite: Mottana et al. 1997 Fig. 4). Thus, the FMS region of the XANES spectrum of a mineral with Al in two coordinations can be seen as the weighted combination of the contributions arising from the two Al atoms, although the general appearance of the spectrum (and its ensuing evaluation) is somewhat blurred by next nearest neighbor effects due to the presence of other atoms in the same sites substituting for the absorber Al (cf. the muscovite vs. bityite spectra: Mottana et al. 1997 Fig. 4).
In the following we will document visually and sparingly comment upon a series of XANES spectra obtained at different K edges for the powders of a number of natural micas close to the end members. The present state of our investigation, which is still under way, compels us to defer to a later moment for drawing conclusions (Mottana et al., in preparation): micas are no simple systems, and XAS literature is already cluttered by faulty reasoning and wrong conclusions reached when hastily evaluating even simpler systems!
Figure 21. Experimental Mg K-edge spectra for the powders of four natural tri-octahedral micas.
Figure 21 shows the experimental Mg K-edge spectra of three tri-octahedral micas (phlogopite, tetra-ferriphlogopite, and biotite) and one brittle mica (clintonite). All spectra are very similar and have no pre-edges, as magnesium is not a transition element. The FMS regions consist of three features, like the K edge of talc (Wong et al. 1995). However, the relative intensities of the three features differ significantly among the four spectra suggesting that there are substantial differences in the local order of their Mg that may be resolved via comparison with spectra taken for other absorbers. Note, moreover, that the three features in the clintonite spectrum are possibly doubled.
Figure 22 shows the experimental Al K edge spectra of three tri-octahedral micas (phlogopite, annite, biotite) and one di-octahedral mica (muscovite). Again, Al is not a transition element, therefore the spectra have no distinct pre-edges. The FMS regions are apparently simpler than the ones occurring in the Mg K-edge spectra above, but in fact

402 Mottana, Marcelli, Cibin & Dyar
they
Figure 22. Experimental Al K-edge spectra for the powders of three natural tri-octahedral and one natural di-octahedral mica.
they contain the same three features, although with strongly different intensities and energies (cf. Mottana et al. 1999). Possibly, the fact that non-precisely oriented powders were used affects the recorded features (cp. this muscovite spectrum with that in Fig. 7). The IMS regions are poor in features, but they display shifts and relative differences that are enormous, considering the similarity of the local structures that originate such differences. The significant role of the outer shells around the Al absorber appears to be well depicted here, but it will create great problems when interpreting the spectra from a quantitative viewpoint.
Figure 23 shows the experimental Si K-edge spectra of five micas: four tri- and one di-octahedral one. Nowhere is there a pre-edge, and the entire XANES spectrum is dominated by the strong white-line of Si in tetrahedral coordination (cf. Li et al. 1994; Li et al. 1995a). The regions in between FMS and IMS (inset) undergo subtle but significant variations as a result of changes in the local and medium-range ordering occurring in the relevant structures for the volumes that surround the Si tetrahedra. Such variations may also occur in the energies of certain peaks, but this variation is also certainly due to the tri- vs. di-octahedral structure of the investigated mica (inset: cf. muscovite with the other micas).
The experimental K K-edge spectra of the same five micas are shown in Figure 24. These XANES spectra are rather complex, both to record experimentally and to reckon with. The FMS regions have no strong white-lines, and only small differences show up in the intensities of their IMS regions (inset). However, their analysis suggests that the K coordination number is less than the expected 12, possibly 8 or even 6. In a case like this, only XANES simulations by the multiple-scattering code may be able to reveal safely the actual site geometry around the potassium atom.
Finally, Figure 25 shows the experimental Fe K-edge spectra of two trioctahedral
1550 1560 1570 1580 1590 1600 1610 1620
Abs
orpt
ion
(Arb
. Un.
)
E (eV)
Al K edge
Phlogopite
Annite
Biotite
Muscovite

X-Ray Absorption Spectroscopy of the Micas 403
mu
Figure 23. Experimental Si K-edge spectra for the powders of five natural micas. The strong differences displayed by a portion of their FMS and IMS regions is shown as inset.
micas (biotite and tetra-ferriphlogopite) and one brittle mica (clintonite). Iron is a transition element, therefore all spectra exhibit significant pre-edges (inset), each one of them having properties of its own. In particular, the tetra-ferriphlogopite pre-edge is a singlet (cf. Fig. 2), as is the clintonite one, but at 1 eV lower energy. Fe is tetrahedrally-coordinated in both micas, but in the former one it is Fe3+ and in the latter one an additional contribution arising from Fe2+ is likely. The biotite pre-edge is weak, because it mostly arises from octahedral Fe2+. The three pre-edges require a deconvolution of the same sort as the one previously demonstrated for the Cr pre-edge of muscovite (Fig. 19) in order to reveal all the information they contain. The FMS regions of these spectra are dominated by the Fe white-line, which undergoes energy variations accounting for differences in both coordination and oxidation state. The presence of significant variations in the medium- to long-range ordering occurring in these mica structures is made evident by their greatly different IMS regions (and also by their EXAFS regions: cf. Giuli et al. 2001).

404 Mottana, Marcelli, Cibin & Dyar
Figure 24. Experimental K K-edge spectra for the powders of five natural micas. The strong differences displayed by a portion of their FMS and IMS regions are shown as an inset.
ACKNOWLEDGMENTS Our XAS work on minerals has enjoyed the support of numerous suggestions,
discussions and contributions in many stages and levels over a number of years, the five more recent ones dedicated mostly to the micas. We thank all these colleagues, since it is by this form of synergy that we could carry out and develop our project over the years. A special thank goes to Maria Franca Brigatti, Jesús Chaboy, Paola De Cecco, Giancarlo Della Ventura, Gabriele Giuli, Antonio Grilli, Cristina Lugli, Jeff Moore, Takatoshi Murata, Eleonora Paris, Marco Poppi, Agostino Raco, Jean-Louis Robert, Claudia Romano, Michael Rowen, Francesca Tombolini, Hal Tompkins, Curtis Troxel, Joe Wong, Ziyu Wu and all others who allowed us to use for this review some of the data recorded together during painstaking sessions at the source. Most experimental XAS was carried out at SSRL, which is operated by Stanford University on behalf of D.O.E. Furthermore, M.D.D. acknowledges the insight and assistance of her collaborators at the N.S.L.S., Brookhaven National Laboratory: Jeremy Delaney, Tony Lanzirotti and Steve Sutton. Financial supports for our experimental work and for its evaluation and interpretation were granted by M.U.R.S.T. (Project COFIN 1999 “Phyllosilicates: crystal-chemical, structural and petrologic aspects”), C.N.R. (Project 99.00688.CT05 “Igneous and metamorphic micas”), and I.N.F.N. (Project “DAΦNE-Light”) in Italy, and by N.S.F.

X-Ray Absorption Spectroscopy of the Micas 405
EAR-9909587 and EAR-9806182, and D.O.E.-Geosciences DE-FG02.92ER14244 in U.S.A. Critical readings by C.R. Natoli and a unknown referee improved the quality of this paper in a substantial manner.
Figure 25. Experimental Fe K-edge spectra for the powders of two natural tri-octahedral micas and one natural brittle mica. The pre-edge regions are shown as inset.
REFERENCES Bair RA, Goddard WA (1980) Ab initio studies of the X-ray absorption edge in Cu complexes. I. Atomic
Cu2+ and Cu(II)Cl2. Phys Rev (Condens Matt) B22:2767-2776 Bajt S, Sutton SR, Delaney JS (1994) Microanalysis of iron oxidation states in silicates and oxides using
X-ray absorption near-edge structure (XANES). Geochim Cosmochim Acta 58:5209-5214 Bajt S, Sutton SR, Delaney JS (1995) Microanalysis of iron oxidation states in Earth and planetary
materials. Physica B208&209:243-244 Balzarotti A, Comin F, Incoccia L, Piacentini M, Mobilio S, Savoia A (1980) K-edge absorption of
titanium in the perovskites SrTiO3, BaTiO3, and TiO2. Solid State Commun 35:145-149 Bassett WA, Brown GE Jr (1990) Synchrotron radiation in the Earth sciences. Ann Rev Earth Planet Sci
18:387-447 Belli M, Scafati A, Bianconi A, Mobilio S, Palladino L, Reale A, Burattini E (1980) X-ray absorption near-
edge structures (XANES) in simple and complex Mn compounds. Solid State Commun 35:355-361 Benfatto M, Congiu Castellano A, Daniele A, Della Longa S (2001) MXAN: A new software procedure to
perform geometrical fitting of experimental XANES spectra. J Synchrotron Rad 8:267-269 Benfatto M, Natoli CR, Brouder C, Pettifer RF, Ruiz Lopez MF (1989) Polarized curved wave EXAFS:
Theory and application. Phys Rev B39:1936-1939 Benfatto M, Natoli CR, Bianconi A, Garcia J, Marcelli A, Fanfoni M, Davoli I (1986) Multiple scattering
regime and higher order correlations in X-ray absorption spectra of liquid solutions. Phys Rev B34:5774-5781
Bianconi A (1988) XANES spectroscopy. In DC Koningsberger, R Prins (eds) X-ray Absorption: Principles, applications, techniques of EXAFS, SEXAFS, and XANES. Wiley, New York, p 573-662
406 Mottana, Marcelli, Cibin & Dyar
Bianconi A, Dell'Ariccia M, Durham PJ, Pendry JB (1982) Multiple-scattering resonances and structural effects in the X-ray absorption near-edge spectra of FeII and FeIII hexacyanide complexes. Phys Rev B26:6502-6508
Bianconi A, Fritsch E, Calas G, Petiau J (1985) X-ray absorption near-edge structure of 3d transition elements in tetrahedral coordination. The effects of bond-length variation. Phys Rev B32:4292-4295
Bianconi A, Incoccia L, Stipcich S (1983) EXAFS and Near-edge Structure (Springer Ser Chem Phys Vol. 27). Berlin, Springer-Verlag
Blum L, Abruna HD, White J, Gordon JG II, Borges GL, Samant MG, Melroy OR (1986) Study of underpotentially deposited copper on gold by fluorescence detected surface EXAFS. J Chem Phys 85:6732-6738
Bonnin D, Calas G, Suquet H, Pezerat H (1985) Site occupancy of Fe3+ in Garfield nontronite: a spectroscopic study. Phys Chem Minerals 12:55-64
Borowski M, Bowron DT, De Panfilis S (1999) High-energy X-ray absorption spectroscopy at ESRF BM29. J Synchrotron Rad 6:179-181
Brigatti MF, Galli E, Medici L, Poppi L, Cibin G, Marcelli A, Mottana A (2001) Chromium-containing muscovite: crystal chemistry and XANES spectroscopy. Eur J Mineral 13:377-389
Brown GE Jr, Calas G, Waychunas GA, Petiau J (1988) X-ray absorption spectroscopy: Applications in Mineralogy and Geochemistry. Rev Mineral 18:431-512
Brown GE Jr, Farges F, Calas G (1995) X-ray scattering and X-ray absorption studies of silicate melts. Rev Mineral 32:317-410
Brown GE Jr, Keefer KD, Fenn PM (1978) Extended X-ray absorption fine structure (EXAFS): study of iron-bearing silicate glasses: iron coordination environment and oxidation state. Geol Soc Am Ann Meet Abstr Progr 10:373
Brown GE Jr, Parks GA (1989) Synchrotron-based X-ray absorption studies of cation environments in Earth materials. Rev Geophys 27:519-533
Brytov IA, Konashenok KI, Romashchenko YuN (1979) Crystallochemical effects on Al K and Si K emission and absorption spectra for silicate and aluminosilicate minerals. Geochem Int’l 16:142-154
Cabaret D, Joly Y, Renevier H, Natoli CR (1999) Pre-edge structure analysis of Ti K-edge polarized X-ray absorption spectra in TiO2 by full-potential XANES calculations. J Synchrotron Rad 6:258-260
Cabaret D, Sainctavit P, Ildefonse Ph, Flank A-M (1996) Full multiple-scattering calculations on silicates and oxides at the Al K edge. J Phys: Condens Matt 8:3691-3704
Calas G, Brown GE Jr, Waychunas GA, Petiau J (1984) X-ray absorption spectroscopic studies of silicate glasses and minerals. Phys Chem Minerals 15:19-29
Calas G, Levitz P, Petiau J, Bondot P, Loupias G (1980) Ètude de l’ordre local autour du fer dans les verres silicatés naturels et synthétiques à l’aide de la spectrométrie d’absorption X. Rev Phys Appl 15: 1161-1167
Calas G, Manceau A, Novikoff A, Boukili H (1984) Comportement du chrome dans les minéraux d’altération du gisement de Campo Formoso (Bahia, Brésil). Bull Minéral 107:755-766
Calas G, Petiau J (1983) Coordination of iron in oxide glasses through high-resolution K-edge spectra: information from the pre-edge. Solid State Commun 48:625-629
Cerino J, Stöhr J, Hower N, Bachrach R (1984) An ultra-high-vacuum double crystal monochromator beam line for studies in the spectral range 500-4000 eV. Nucl Instr Meth Phys Res 172:227-236
Chaboy J, Marcelli A, Tyson TA (1994) Influence of double-electron transitions on the EXAFS I edges of rare-earth systems. Phys Rev B49:11652-11661
Cibin G, Marcelli A, Mottana A (2001) Polarised X-ray absorption spectra at the Al K edge in Na+ β- and β”-aluminas. Europhys Lett (submitted)
Clementi E, Roetti C (1974) Roothan-Hartree-Fock atomic wavefunctions. In Atomic Data and Nuclear Data Tables 14:177-478. Academic Press, New York
Cressey G, Henderson CMB, van der Laan G (1993) Use of L-edge X-ray absorption spectroscopy to characterize multiple valence states of 3d transition metals; a new probe for mineralogical and geochemical research. Phys Chem Minerals 20:111-119
Cruciani G, Zanazzi PF, Quartieri S (1995) Tetrahedral ferric iron in phlogopite: XANES and Mössbauer compared to single-crystal X-ray data. Eur J Mineral 7:255-265
Dartyge E, Fontaine A, Tourillon G, Cortes R, Jucha A (1986) X-ray absorption spectroscopy in dispersive mode and by total reflection. Phys Lett 113A:384-388
Davoli I, Paris E (1990) Principles and recent developments of XANES spectroscopy. In A Mottana, F Burragato (eds) Absorption Spectroscopy in Mineralogy. Elsevier, Amsterdam, p 206-226
Dehmer JL, Dill D (1976) Molecular effects on inner-shell photoabsorption. K-shell spectrum of N2. J Chem Phys 65:5327-5334
Delaney JS, Sutton SR, Newville M, Jones JH, Hanson B, Dyar MD, Schreiber H (2000) Synchrotron micro-XANES measurements of vanadium oxidation state in glasses as a function of oxygen fugacity:

X-Ray Absorption Spectroscopy of the Micas 407
experimental calibration of data relevant to partition coefficient determination. 31st Ann Lunar Planet Sci Confe
Dell'Ariccia M, Gargano A, Natoli CR, Bianconi A (1984) A calculation of C K-shell X-ray absorption spectra of C2Hn (n = 2, 4, 6) oriented molecules: correlation between position of the multiple scattering resonance in the continuum and the C-C bond length. LNF-INFN Report LNF-84-51 (P)
Deutsch M, Hart M (1984) Single X-ray photon excitation of two and three electrons in nickel. Phys Rev A29: 2946-2948
Díaz-Moreno S, Muñoz-Páez A, Chaboy J (2000) X-ray absorption spectroscopy (XAS) study of the hydratation structure of yttrium(III) cations in liquid and glassy states: eight or nine-fold coordination? J Phys Chem A2000:1278-1286
Doyle CS, Traina SJ, Ruppert H, Kandelewicz T, Rehr JJ, Brown GE Jr (1999) XANES studies at the Al K-edge of aluminum-rich surface phases in the soil environment. J Synchrotron Rad 6:621-623
Dräger G, Frahm R, Materlik G, Brümmer O (1988) On the multiplet character of the X-ray transitions in the pre-edge structure of Fe K absorption spectra. Phys Status Solidi 146:287-294
Drits VA, Dainyak LG, Muller F, Besson G, Manceau A (1997) Isomorphous cation distribution in celadonites, glauconites and Fe-illites determined by infrared, Mössbauer and EXAFS spectroscopies. Clay Minerals 32:153-179
Drozdov YuN, Klyuenkov EB, Lentovskaya NE, Mazo LA, Suslov LA (1997) Fullerene C60 layers on mica and sapphire. Poverkhnost (3):8-13 528
Durham PJ, Pendry JB, Hodges VH (1982) Calculation of X-ray absorption spectra based on the multiple scattering theory. Comput Phys Commun 25:193-205
Dyar MD, Delaney JS, Sutton SR (2000) Advances in interpretation of Fe XANES pre-edge spectra, and resultant improvements in microanalysis of ferric/ferrous ratios on thin sections. 31st Ann Lunar Planet Sci Conf
Dyar MD, Delaney JS, Sutton SR (2001) Fe XANES spectra of iron-rich micas. Eur J Mineral 13: 1079-1098
Dyar MD, McCammon C, Schaefer MW (eds) (1996) Mineral Spectroscopy: A Tribute to Roger G. Burns. Geochem Soc Spec Publ No. 5, 465 p
Filipponi A, Di Cicco A (2000) GNXAS: a software package for advanced EXAFS multiple-scattering calculations and data-analysis. Task Quarterly 4:575-669
Filipponi A, Di Cicco A, Benfatto M, Natoli CR (1990) The three-body correlation function in amorphous silicon probed by X-ray absorption spectroscopy. Europhys Lett 13:319-325
Filipponi A, Di Cicco A, Tyson TA, Natoli CR (1991) Ab initio modeling of X-ray absorption spectra. Solid State Commun 78:265-275
Filipponi A, Evangelisti F, Bernieri E, Mobilio S (1987) Double-electron excitation at the Si K-edge of amorphous silicon. J Phys Colloq 48, C9:961-964
Fricke H (1920) K-characteristic absorption frequencies for the chemical elements magnesium to chromium. Phys Rev 16:202-215
Fuhrmann M, Bajt S, Schoonen MAA (1998) Sorption of iodine on minerals investigated by X-ray absorption near-edge structure (XANES) and 125I tracer sorption experiments. Appl Geochem 13: 127-141
Galoisy L, Calas G, Arrio MA (2001) High-resolution XANES spectra of iron in minerals and glasses: structural information from the pre-edge region. Chem Geol 174:307-319
Garcia J, Benfatto M, Natoli CR, Bianconi A, Davoli I, Marcelli A (1986) Three particle correlation function of metal ions in tetrahedral coordination determined by XANES. Solid State Commun 58:595-599
Giuli G, Paris E, Wu ZY, Brigatti MF, Cibin G, Mottana A, Marcelli A (2001) Experimental and theoretical XANES and EXAFS study of tetra-ferriphlogopite. Eur J Mineral 13 (in press)
Greaves GN, Durham PJ, Diakun G, Quinn P, Hart M, Siddons DP (1983) An order-sorting monochromator for synchrotron radiation. Nucl Instr Meth Phys Res 208:335-339
Gudat W, Kunz C (1972) Close similarity between photoelectric yield and photoabsorption spectra in the soft-X-ray range. Phys Rev Lett 29:169-172
Gurman SJ (1989) Structural information in extended X-ray absorption fine structure (EXAFS).In SS Hasnain (ed) Synchrotron Radiation and Biophysics. Ellis Horwood, Chichester, UK, p 9-42
Guttler B, Niemann W, Redfern SAT (1989) EXAFS and XANES spectroscopy study of the oxidation and deprotonation of biotite. Mineral Mag 53:591-602
Hahn JE, Scott RA, Hodgson KO, Doniach S, Desjardins SE, Solomon EI (1982) Observation of an electric quadrupole transition in the X-ray absorption spectrum of a Cu(II) complex. Chem Phys Lett 88: 595-598
Han Y-S, Choi S-H, Kim D-K (2001) Ion exchange and fixation of rare-earth cation into expandable tetrasilicic fluorine mica. J Synchrotron Rad 8:731-733

408 Mottana, Marcelli, Cibin & Dyar
Hasnain SS (1989) Synchrotron Radiation and Biophysics. Ellis Horwood, Chichester, UK, 368 p Hasnain SS (1991) X-ray Absorption Fine Structure. Ellis Horwood, Chichester, UK, 792 p Hawthorne FC (ed) (1988) Spectroscopic methods in Mineralogy and Geology. Rev Mineral 18, 698 pp Hayes TM, Boyces JB (1982) Extended X-ray absorption fine structure. Solid State Phys 37:173-351 Heald SM, Amonette JE, Turner GD, Scott AD (1995) An XAFS study of the oxidation of structural iron in
biotite mica by solutions containing Br2 or H2O2. Physica B208&209:604-606 Heald SM, Stern EA (1977) Anisotropic X-ray absorption in layered compounds. Phys Rev B16:5549-5559 Hedin L, Lundqvist BI (1971) Explicit local exchange-correlation potentials. J Phys C4:2064-2083 Henderson CMB, Charnock JM, Helz GR, Kohn SC, Patrick RAD, Vaughan DJ (1991) EXAFS in Earth
science research. In SS Hasnain (ed) X-ray Absorption Fine Structure. Ellis Horwood, Chichester, UK, p 573-578
Hertz G (1920) Über Absorptionslinien im Röntgenspektrum. Physik Z 21:630-632 Holmes DJ, Batchelor DR, King DA (1988) Surface structure determination by SEXAFS: The reliability of
bond lengths and coordination numbers from multi-shell analyses. Surface Sci 230:476-492 Huggins FE, Huffman GP (1996) Application of XAFS spectroscopy to coal geochemistry. In MD Dyar, C
McCammon, MW Schaefer (eds) Mineral Spectroscopy: A tribute to Roger G. Burns. Geochem Soc Spec Publ No. 5:11-23
Hussain Z, Umbach E, Shirley DA, Stöhr J, Feldhaus J (1982) Performance and application of a double crystal monochromator in the energy region 800<hν<4500 eV. Nucl Instr Meth Phys Res 195:115-131
Ildefonse Ph, Sainctavit P, Calas G, Flank A-M, Lagarde P (1998) Aluminum X-ray absorption near-edge structure in model compounds and Earth surface minerals. Phys Chem Minerals 25:112-121
Ildefonse Ph, Kirkpatrick RJ, Montez B, Calas G, Flank A-M, Lagarde P (1994) 27Al MAS NMR and aluminum X-ray absorption near-edge structure of imogolites and allophanes. Clays Clay Minerals 42:276-287
Jagannatha Rao B, Chetal AR (1982) An X-ray K-absorption study of muscovite mica. J Phys D: Appl Phys 15:L195-L197
Jain DC, Chandra U, Garg KB, Sharma BK (1980) X-ray absorption study of some iron-rich micas. J Phys D: Appl Phys 13:1113-1120
Johnson KH (1966) Multiple-scattering model for polyatomic molecules. J Chem Phys 45:3085-3095 Johnson KH (1973) Scattered-wave theory of the chemical bond. Adv Quantum Chem 7:143-185 Joly Y (2001) X-ray absorption near-edge structure calculations beyond the muffin-tin approximation. Phys
Rev B63:125120-1-10 Joly Y, Cabaret D, Renevier H, Natoli CR (1999) Electron population analysis by full-potential X-ray
absorption simulations. Phys Rev Lett 82:2398-2401 Kaiser P, Bonnin D, Frétigny C, Cortes R, Manceau A (1989) Ètude EXAFS en polarisation de composés
lamellaires. J Chim Phys 86:1699-1706 Kaulich B, Barrett R, Salomé M, Oestreich S, Susini J (2000) X-ray imaging with sub-100-nm spatial
resolution at 4 KeV. ESRF Newsletter 34:27-28 Kemner KM, Hunter DB, Bertsch PM, Kirkland JP, Elam WT (1997) Determination of site specific
binding environments of surface sorbed cesium on clay minerals by Cs-EXAFS. J Phys IV 7, Colloq 2, Supp J Phys III d’Avril 1997, C2:777-779
Kincaid BM, Eisenberger P (1975) Synchrotron radiation study of the K-edge photoabsorption spectra of Kr, Br2 and GeCl4: comparison of theory and experiment. Phys Rev Lett 34:1361-1364
Koch EE (1983) Handbook on Synchrotron Radiation (Vol. 1b). North-Holland, New York, 506 p Koningsberger DC, Prins R (1988) X-ray absorption: Principles, Applications, Techniques of EXAFS,
SEXAFS, and XANES. Wiley, New York, 673 p Kossel W (1920) Zum Bau der Röntgenspektren. Z Phys 1:119-134 Kronig RL (1931) Zur Theorie der Feinstruktur in den Röntgenabsorptionsspektren. Z Phys 70:317-323 Kronig RL (1932a) Zur Theorie der Feinstruktur in den Röntgenabsorptionsspektren. II. Z Phys 75:191-210 Kronig RL (1932b) Zur Theorie der Feinstruktur in den Röntgenabsorptionsspektren. III. Z Phys 75:
468-475 Kutzler FW, Natoli CR, Misemer DK, Doniach S, Hodgson KO (1980) Use of one electron theory for the
interpretation of near-edge structure in K-shell X-ray absorption spectra of transition metal complexes. J Chem Phys 73:3274-3288
Kuzmin A, Parent Ph (1994) Focusing and superfocusing effects in X-ray absorption fine structure at the iron K edge in FeF3. J Phys: Conden Matt 6:4395-4404
Kuzmin A, Purans J, Parent Ph (1995) Influence of the focusing effect on XAFS in ReO3, WO3-x and FeF3. Physica B208&209:45-46
Lee JF, Bajt S, Clark SB, Lamble GM, Langton CA, Oji L (1995) Chromium speciation in hazardous, cement-based waste forms. Physica B208 and 209:577-578

X-Ray Absorption Spectroscopy of the Micas 409
Lee PA, Beni G (1977) New method for the calculation of atomic phase shifts: applications to extended X-ray absorption fine structure (EXAFS) in molecules and crystals. Phys Rev B15:2862-2883
Lee PA, Citrin PH, Eisenberger P, Kincaid BM (1981) Extended X-ray fine structure: Its strength and limitations as a structural tool. Rev Modern Phys 53:769-806
Lee PA, Pendry JB (1975) Theory of extended X-ray absorption fine structure. Phys Rev B11:2795-2811 Li D, Bancroft, GM Fleet, ME Feng, XH (1995a) Silicon K-edges XANES spectra of silicate minerals.
Phys Chem Minerals 22:115-122 Li D, Bancroft GM, Fleet ME, Feng XH, Pan Y (1995b) Al K-edge XANES spectra of aluminosilicate
minerals. Am Mineral 80:432-440 Li D, Bancroft GM, Kasrai M, Fleet ME, Secco RA, Feng XH, Tan KH, Yang BX (1994) X-ray absorption
spectroscopy of silicon dioxide (SiO2) polymorphs: The structural characterization of opal. Am Mineral 79:622-632
Lytle FW (1989) Experimental X-ray absorption spectroscopy; pp. 135-223 In H Winick, D Xian, M Ye, T Huang (eds) Applications of synchrotron radiation. Gordon and Breach, New York
Lytle FW (1999) The EXAFS family tree: a personal history of the development of extended X-ray absorption fine structure. J Synchrotron Rad 6:123-134
Manceau A (1990) Distribution of cations among the octahedra of phyllosilicates: Insight from EXAFS. Can Mineral 28:321-328
Manceau A, Bonnin D, Kaiser P, Frétigny C (1988) Polarized EXAFS of biotite and chlorite. Phys Chem Minerals 16:180-185
Manceau A, Bonnin D, Stone WEE, Sanz J (1990) Distribution of iron in the octahedral sheet of trioctahedral micas by polarized EXAFS. Comparison with NMR results. Phys Chem Minerals 17: 363-370
Manceau A, Calas G (1986) Nickel-bearing clay minerals: II. Intracrystalline distribution of nickel: an X-ray absorption study. Clay Minerals 21:341-360
Manceau A, Chateigner D, Gates WP (1998) Polarized EXAFS, distance-valence least-squares modeling (DVLS) and quantitative texture analysis approaches to the structural refinement of Garfield nontronite. Phys Chem Minerals 25:347-365
Mottana A, Burragato F (1990) Absorption Spectroscopy in Mineralogy. Elsevier, Amsterdam-Oxford-New York-Tokyo, 294 p
Mottana A, Murata T, Wu ZY, Marcelli A, Paris E (1997) The local structure of Ca-Na pyroxenes. I. XANES study at the Na K-edge. Phys Chem Minerals 24:500-509
Mottana A, Murata T, Wu ZY, Marcelli A, Paris E (1999) The local structure of Ca-Na pyroxenes. II. XANES studies at the Mg and Al K-edges. Phys Chem Minerals 27:20-33
Mottana A, Robert J-L, Marcelli A, Giuli G, Della Ventura G, Paris E, Wu Z (1997) Octahedral versus tetrahedral coordination of Al in synthetic micas determined by XANES. Am Mineral 82:497-502
Müller JE, Jepsen O, Wilkins JW (1982) X-ray absorption spectra: K-edges of 3d transition metals, I-edges of 3d and 4d metals, and M-edges of palladium. Solid State Commun 42:365-368
Müller JE, Wilkins JW (1984) Band-structure approach to the X-ray spectra of metals. Phys Rev B29: 4331-4348
Natoli CR (1983) Near-edge absorption structure in the framework of the multiple scattering model. Potential resonance on barrier effects. In A Bianconi, L Incoccia, S Stipcich (eds) EXAFS and Near-edge Structure. Springer Ser Chem Phys 27:43-47
Natoli CR (1985) Distance dependence of continuum and bound state of excitonic resonances in X-ray Absorption Near-edge Structure (XANES). In KO Hodgson, B Hedman and JE Penner-Hahn (eds) EXAFS and Near-edge Structure III (Springer Proceed Phys). Berlin, Springer-Verlag, p 38-42
Natoli CR, Benfatto M (1986) A unifying scheme of interpretation of X-ray absorption spectra based on multiple scattering theory. In P Lagarde, D Raoux, J Petiau (eds) EXAFS and Near-Edge Structure IV. J Phys 47-C8, p 11-23
Natoli CR, Benfatto M, Brouder C, Ruiz Lopez MZ, Foulis DL (1990) Multichannel multiple-scattering theory with general potentials. Phys Rev B42:1944-1968
Natoli CR, Benfatto M, Doniach S (1986) Use of general potentials in multiple scattering theory. Phys Rev A34:4682-4694
Natoli CR, Misemer DK, Doniach S, Kutzler FW (1980) First-principles calculation of X-ray absorption-edge structure in molecular cluster. Phys Rev B22:1104-1108
Obashi, M (1978) X-ray Fe K absorption edges of [Fe(CN)6]4- and Fe(CN)6]3-. Japan J Appl Phys 17: 563-566
Ohta T, Takeda H, Takéuchi Y (1982) Mica polymorphism: Similarities in the crystal structures of coexisting 1M and 2M1 oxybiotite. Am Mineral 67:298-310

410 Mottana, Marcelli, Cibin & Dyar
Osuka T, Morikawa H, Marumo F, Daimon N, Udagawa Y, Toji K (1988) An EXAFS study of local structures around cobalt atoms in synthetic fluormicas. Rep Res Lab Engineer Mater, Tokyo Inst Techn 13:1-6
Osuka T, Shimizugawa Y, Morikawa H, Marumo F, Udagawa Y, Tohji K (1990) An EXAFS study of coordination of Mn atoms in synthetic manganoan fluormicas [in Japanese, English abstr]. Kobutsugaku Zasshi 19:209-218
Paris E, Mottana A, Mattias P (1991) Iron environment in a montmorillonite from Gola del Furlo (Marche, Italy). A synchrotron radiation XANES and a Mössbauer study. Mineral Petrol 45:105-117
Pendry JB (1983) X-ray absorption near-edge structure. Comments Solid State Phys 10:219-231 Peterson ML, Brown GE Jr, Parks GA, Stein CL (1997) Differential redox and sorption of Cr(III/VI) on
natural silicate and oxide minerals: EXAFS and XANES results. Geochim Cosmochim Acta 61: 3399-3412
Petit P-E, Farges F, Wilke M, Solé VA (2001) Determination of the iron oxidation state in Earth materials using XANES pre-edge information. J Synchrotron Rad 8:952-954
Pettifer RF, Brouder C, Benfatto M, Natoli CR, Hermes C, Ruiz López MF (1990) Magic-angle theorem in powder X-ray-absorption spectroscopy. Phys Rev B42:37-42
Phizackerley RP, Rek ZU, Stephenson GB, Conradson SD, Hodgson KO, Matsushita T, Oyanagi H (1983) An energy-dispersive spectrometer for the rapid measurement of X-ray absorption spectra using synchrotron radiation. J Applied Crystallogr 16:220-232
Randall CR, Shu L, Chiou Y-M, Hagen KS, Ito M, Kitajima N, Lachicotte RJ, Zang Y, Que L (1995) X-ray absorption pre-edge studies of high-spin iron(II) complexes. Inorg Chem 34:1036-1039
Ravel B, Stern EA, Yacobi Y, Dogan J (1993) Ti lead titanate is not a classic case of a displacive ferro-electric phase-transition. Japan J Applied Phys Supp 32-2:782-784
Rehr JJ, Albers RC (2000) Theoretical approaches to X-ray absorption fine structure. Rev Modern Phys 72:621-654
Rehr JJ, Zabinsky ZI, Albers RC (1992) Higher-order multiple scattering calculations of X-ray-absorption fine structure. Phys Rev Lett 69:3397-4000
Rickwood PC (1981) The largest crystals. Am Mineral 66:885-907 Rieder M, Cavazzini G, D’yakonov YuS, Frank-Kamenetskii VA, Gottardi G, Guggenheim S, Koval’ PV,
Müller G, Neiva AMR, Radoslovich EW, Robert J-L, Sassi FP, Takeda H, Weiss Z, Wones DR (1998) Nomenclature of the micas. Can Mineral 36:905-912
Roe AL, Schneider DJ, Mayer RJ, Pyrz JW, Widom J, Que L Jr (1984) X-ray absorption spectroscopy of iron-tyrosinate proteins. J Am Chem Soc 106:1676-1681
Ruiz-López MF, Muñoz-Páez AM (1991) A theoretical study of the XANES spectra of rutile and anatase. J Phys: Condens Matter 3:8981-8990
Sakane H, Okabe M-O, Suzuki T (1997) Local structure of the interlayer ion in synthetic fluorine mica. J Phys IV 7, Colloque 2, Supplément J Physique III d’Avril 1997, C2:1165-1166
Sayers DE, Lytle FW, Stern EA (1970) Point scattering theory of X-ray K absorption fine structure. Adv X-ray Anal 13:248-271
Sayers DE, Stern EA, Lytle FW (1971) New technique for investigating noncrystalline structures: Fourier analysis of the extended X-ray absorption fine structure. Phys Rev Lett 27:1204-1207
Schaefers F, Müller BR, Wong J, Tanaka T, Kamimura Y (1992) YB66: a new soft X-ray monochromator crystal. Synchrotron Rad News 5[2]:28-30
Schofield PF, Henderson CMB, Cressey G, van der Laan G (1995) 2p X-ray absorption spectroscopy in the Earth sciences. J Synchrotron Rad 2:93-98
Shulman RG, Yafet Y, Eisenberger P, Blumberg WE (1976) Observation and interpretation of X-ray absorption edges in iron compounds and proteins. Proc Nat’l Acad Sci 73:1384-1388
Slater JC (1979) Quantum Theory of Molecules and Solids. New York, McGraw-Hill, 467 p Soma M, Tanaka A, Seyama H, Hayashi S, Hayamizu K (1990) Bonding states of sodium in tetrasilicic
sodium fluor mica. Clay Sci 8:1-8 Spiro C, Wong J, Maylotte DH, Lamson S, Glover B, Lytle FW, Greegor RB (1984) Nature of potassium
impurities in coal; pp. 368-370 In KO Hodgson, B Hedman, JE Penner-Hahn (eds) EXAFS and near-edgeedge structure III (Springer Proc Phys). Berlin, Springer-Verlag
Stebbins JF, McMillan PF, Dingwell DB (1995) Structure, dynamics and properties of silicate melts. Rev Mineral 32, 616 p
Stern EA (1974) Theory of extended X-ray absorption fine structure. Phys Rev B10:3027-3037 Stern EA, Heald SM (1983) Basic principles and applications of EXAFS; pp. 955-1014 In EE Koch (ed)
Handbook on Synchrotron Radiation (Vol. 1b). North-Holland, New York Stöhr J, Jaeger R, Feldhaus J, Brennan S, Norman D, Apai G (1980) Extended absorption fine structure
studies above the carbon, nitrogen, oxygen, and fluorine K absorption edges. Appl Optics 19: 3911-3919

X-Ray Absorption Spectroscopy of the Micas 411
Stöhr J, Noguera C, Kendelewicz T (1984) Auger and photoelectron contributions to the electron-yield surface extended X-ray-absorption fine-structure signal. Phys Rev B30:5571-5579
Sutton SR, Bajt S, Delaney J, Schulze D, Tokunaga T (1995) Synchrotron X-ray fluorescence microprobe: Quantification and mapping of mixed valence state samples using micro-XANES. Rev Sci Instrum 66:1464-1467
Teo BK (1986) EXAFS: Basic Principles and Data Analysis (Inorganic Chemistry Concepts 9). Springer-Verlag, Berlin, 349 p
Teo BK, Lee PA (1979) Ab initio calculation of amplitude and phase function for extended X-ray absorption fine structure (EXAFS) spectroscopy. J Am Chem Soc 101:2815-2830
Teo BK, Simons AL, Eisenberger P, Kincaid BM (1977) EXAFS: approximations, parameterization, and chemical transferability of amplitude functions. J Am Chem Soc 99:3854-3856
Tyson TA, Hodgson KO, Natoli CR, Benfatto M (1992) General multiple-scattering scheme for the computation and interpretation of X-ray-absorption fine structure in atomic clusters with applications to SF6, GeCl4, and Br2 molecules. Phys Rev B46:5997-6019
Uozumi T, Okada K, Kotani A, Durmeyer O, Kappler JP, Beaurepaire E, Parlebas JC (1992) Experimental and theoretical investigation of the pre-peaks at the Ti K-edge absorption spectra in TiO2. Europhys Lett 18:85-90
Vedrinskii RV, Kraizman VL, Novakovich AA, Demekhin PhV, Urazhdin SV, Ravel B, Stern EA (1997) Pre-edge fine structure (PEFS) of the K-XAS for the 3d atoms in compounds: A new tool for quantitative atomic structure determination. J Phys IV 7, Colloq 2, Supp J Phys III d’Avril 1997, C2:107-110
Waychunas GA (1987) Synchrotron radiation XANES spectroscopy of Ti in minerals: Effects of Ti bonding distances, Ti valence, and site geometry on absorption edge structure. Am Mineral 72:89-101
Waychunas GA, Apted MJ, Brown GE Jr (1983) X-ray K-edge absorption spectra of Fe minerals and model compounds: I. Near-edge structure. Phys Chem Minerals 10:1-9
Waychunas GA, Brown GE Jr, Apted MJ (1986) X-ray K-edge absorption spectra of Fe minerals and model compounds: II. EXAFS. Phys Chem Minerals 13:31-47
Westre TE, Kennepohl P, DeWitt JG, Hedman B, Hodgson KO, Solomon EI (1997) A multiplet analysis of Fe K-edge 1s-3d pre-edge features of iron complexes. J Am Chem Soc 119:6297-6314
Winick H, Xian D, Ye M, Huang T (1989) Applications of synchrotron radiation (Proc CCAST Symp, June 1988, Beijing. Ser Part: China Center Adv Sci Technol Series, Vol. 4). Gordon and Breach, New York, 626 p
Wong J, Lytle FW, Messmer RP, Maylotte DH (1984) A study of the K-edge absorption spectra of selected vanadium compounds. Phys Rev B30:5596-5610
Wong J, Rek ZU, Rowen M, Tanaka T, Schaefers F, Müller B, George GN, Pickering IJ, Via G, DeVries B, Brown GE Jr, Fröba M (1995) New opportunities in 1-2 keV spectroscopy. Physica B208&209:220-222
Wong J, Shimkaveg G, Goldstein W, Eckart M, Tanaka T, Rek ZU, Tompkins H (1990) YB66: A new soft-X-ray monochromator for synchrotron radiation. Nucl Instr Methods Phys Res A291:243-249
Wong J, Tanaka T, Rowen M, Schäfers F, Müller BR, Rek ZU (1999) YB66—A new soft-X-ray mono-chromator for synchrotron radiation. II. J Synchrotron Rad 6:1086-1095
Wu ZY, Marcelli A, Mottana A, Giuli G, Paris E, Seifert F (1996) Effects of higher-coordination shells in garnets detected by XAS at the Al K-edge. Phys Rev B54:2976-2979
Zabinsky SI, Rehr JJ, Ankudinov A, Albers RC, Eller MJ (1995) Multiple scattering calculations of X-ray absorption spectra. Phys Rev B52:2995-3006

1529-6466/02/0046-0009$0500 DOI:10.2138/rmg.2002.46.09
9 Constraints on Studies of Metamorphic K-Na White Micas
Charles V. Guidotti Department of Geological Sciences
University of Maine Orono, Maine 04469
Francesco P. Sassi Dipartimento di Mineralogia e Petrologia
Università Padova Corso Garibaldi, 37-35137
Padova, Italy [email protected]
INTRODUCTION Micas have been studied for many important and highly interesting reasons by a
wide range of workers, e.g., engineers, physicists, chemists, and Earth scientists. Our focus includes only aspects related to the Earth sciences, specifically the mineralogy and petrology of natural metamorphic rocks, and particularly the occurrence of micas in such rocks. Mineralogists and petrologists have studied micas extensively in order to understand the controls on their genesis, and hence, that of the rocks containing them. Mineralogists have also studied them with a focus aimed at understanding their very interesting crystallochemical aspects irrespective of their petrologic implications.
By far the most common micas are (1) the trioctahedral Fe-Mg micas broadly described as “biotites,” and (2) the dioctahe dral “white” micas muscovite, paragonite and margarite. An enormous literature exists on the mineralogical and petrologic aspects of these two groups. For our purposes we will concentrate on the dioctahedral, Na-K “white” micas as found in metamorphic rocks, especially metapelites. Some discussion of the “biotites” will be included when it provides especially good opportunities for addressing the goals of this paper.
There can be a complete merging of approaches and aims of the mineralogic and petrologic studies of micas, but not uncommonly they are conducted quite independently and unconcerned with each other. We believe this is unfortunate as will become clear in our presentation below. Despite the merging of some studies over both petrology and mineral-ogy, for the purposes of our discussion we will define them as end-member approaches as follows.
Mineralogic studies are concerned with innate aspects of the minerals themselves, with little or no regard for the petrologic setting from which the mineral has been obtained; e.g., studies of samples from museum collections. Commonly such studies try to gain insights regarding the compositional and crystal structural (a crystallochemical understanding) or physical (e.g., compressibility or thermal expansion) nature of the minerals. Usually studies aimed at developing a crystallochemical understanding also consider the impact of the compositional variation that can occur in a mineral on its other properties. This generalized characterization of mineralogy includes many specialized approaches, most of which involve the expensive use of highly sophisticated, modern instrumentation.
Petrologic studies focus mainly on the rocks, typically being less concerned with the

414 Guidotti & Sassi
innate aspects of the minerals themselves. However, petrologists are extremely interested in the compositions of the minerals in rocks. To a large degree they focus on the minerals present and their compositional variations to gain insights regarding the values of those petrologically important intensive parameters of most concern for the petrogenesis (i.e., P and T), and activities of H2O and other volatiles) of a given rock. They consider crystallo-chemical and structural aspects of the minerals (e.g., polytype, ordering state, etc.) to a much lesser degree. Based on thermodynamic formulations for a presumed equilibrium in a rock, petrologists try to calculate quantitatively the values of the intensive parameters that prevailed. In many cases this requires use of thermodynamic solution models for the minerals having compositional variation. However, such models require insights on crystallochemical and related structural properties of the mineral, or making assumptions about the nature of these properties.
Even if conducted in the stand-alone fashion described above, both the mineralogic and petrologic studies have the potential of contributing significantly to advancing knowledge. However, not uncommonly studies conducted in this isolated fashion miss out on very important insights, and in some cases they can lead to demonstrably incorrect conclusions. The broad goal of this paper is to outline some constraints and difficulties for Na-K mica studies and to point out how in various ways isolated, stand-alone approaches can compromise to varying degrees the results of otherwise very careful work. We will primarily use examples drawing on our own familiarity with a portion of the literature on K-Na white micas (with subordinate attention to biotite). We begin with a section that includes those background aspects of white mica studies we believe are necessary for presenting the discussions in subsequent sections needed for attaining our goal. The next section focuses on the constraints and drawbacks arising from stand-alone mineralogic and petrologic research and also suggests how appropriate selection of samples might mitigate or eliminate some of the problems. In the final section we’ll suggest some general conceptual approaches to the study of rock-forming micas that may aid in maximizing the petrologic and mineralogic insights gained from future studies. We will end with a plea for greatly expanded interaction and collaboration between mineralogists and petrologists pursuing studies that might best described as “petrologic mineralogy.”
EFFECTS OF PETROLOGIC FACTORS ON WHITE MICA CHEMISTRY In order to discuss how stand-alone petrologic and mineralogic studies might
compromise to varying degrees the results of otherwise productive work, we first provide a brief overview of the main compositional variations exhibited by the natural white micas, and then we provide a brief overview of how the chemistry of these micas responds to variation of the prevailing petrologically relevant intensive parameters.
It is this abbreviated, overview focus that makes the coverage below different from the fairly detailed review of these matters given by Guidotti and Sassi (1998a) and the review of the usually less common and less significant compositions of the white micas given by Guidotti and Sassi (1998b). Important compositional variations
As a fairly close first approximation, the rock-forming white micas can be described as crystalline solutions among three end-member compositions, Ms muscovite [K2Al4(Al2Si6O20)(OH)4], Pg paragonite [Na2Al4(AlSi6O20)(OH)4], and Mrg margarite [Ca2Al4(Al4Si4O20)(OH)4], (Kretz 1983 mineral symbols, unless otherwise designated in parentheses after the first usage of a mineral name). These phases plot on a plane, Figure 1a, in the tetrahedron

Constraints on Studies of Metamorphic K,Na White Micas 415
pppp
Figure 1. (a, upper) White mica and feldspar planes in the system Al2O3-KAlSi3O8-NaAlSi3O8-CaAl2Si8O8 at a given activity of H2O; (b, lower) The white mica and feldspar planes viewed separately. Based on Figures 1 and 2 in Guidotti (1984).
Al2O3-KAlSi3O8-NaAlSi3O8-CaAl2Si8O8 (at a given activity of H2O and Qtz present). As seen in Figure 1b, the nature of the crystalline solution among the three micas is very similar in many respects to that among the three feldspar end-member compositions. The one big difference is that under no known conditions is complete solution achieved among any pair of mica end-members.
The nature of and controls on the solvus relationship between Ms and Pg are fairly well determined although the details remain elusive (see Guidotti et al. 1994a,b). Ms can contain up to 38 mol % of Pg in solution and Pg can contain up to 15 mol % of Ms in solution. The Pg-Mrg solvus is still only poorly known, and virtually no solution occurs between Ms and Mrg. Because the substitution of Mrg in Pg is usually small (typically <<5 mol %), and negligible in Ms, our discussions below will not include Mrg in a detailed fashion. However, it should be noted that Mrg can be an important rock-forming mineral as shown especially by the work of M. Frey and his co-workers (Frey 1978; Frey and Niggli 1972; Frey and Orville 1974; Frey et. al. 1982).
By far the most important deviations from the white mica plane defined above, both quantitatively and in terms of their mineralogic and petrologic significance, are shown by phengites. According to the new IMA Nomenclature of Micas (Rieder et al. 1998),

416 Guidotti & Sassi
“phengite” is a series name, referring to pota ssic dioctahedral micas between, or close to, the joins muscovite- aluminoceladonite and muscovite- celadonite. Therefore, in muscovites the aluminoceladonite [Al-Cd = K2[(Mg,Fe2+)2(Al)2](Si8O20)(OH)4] substitution ( i.e., SiIV +(Fe2+,Mg)VI ↔ AlIV + AlVI ), is very important from all points of view. As discussed by Thompson (this volume), this substitution combines two cation exchanges; FeMg-1 and Al2Mg-1Si-1, the latter commonly called the Tschermak exchange. Furthermore, the Fe3+VI ↔ AlVI substitution is also very important, and commonly referred to as the “ ferrimuscovite” (“Fe 3+-Ms”) substitution. Although the “Fe 3+-Ms” end member [(K,Na)2(Fe3+)4(Al2Si6O20)(OH)4] is not known and only hypothetical, Rieder et al. (1998) included the term ferrimuscovite in the list of the “formerly erroneously used” names, but they consider it as a “not necessarily discredited” term. The “Fe 3+-Ms” substitution typically accompanies the Al-Cd substitution, thereby representing solution to celadonite (Cd) [K2[(Mg,Fe2+)2(Fe3+)2](Si8O20)(OH)4] itself, but it can also be significant in rocks with Ms having virtually no Al-Cd substitution (e.g., Guidotti et al. 1994c). Hence, it is important in terms of the Fe3+/Fetot and Mg/Fe2+ ratios of all Ms. The Al-Cd and “Fe 3+-Ms” substitutions are both negligible in Pg. The various deviations from the white mica plane discussed above are summarized in Figure 2.
Figure 2. Semi-quantitative illustration of the main compositional deviations typically shown by rock-forming white micas from the white mica plane shown in Figure 1. Based on Figure 1.1 in Guidotti and Sassi (1998a) and Figure 1 in Rieder et al. (1998). The shaded volume in the muscovite field represents the compositional range of the phengite series.

Constraints on Studies of Metamorphic K,Na White Micas 417
Much less important deviations from the ideal white mica plane, both quantitatively and in terms of mineralogic and petrologic significance, are the substitution of Ti in VI sites, vacancies in the Alkali sites, and solution toward the trioctahedral micas. Presumably due to some combination of crystallochemical constraints, these substitutions are virtually non-existent in Pg and Mrg. Two other, usually only minor, substitutions worthy of at least brief comment below are replacement of (OH) by F, Cl, or O, and replacement of alkalis by NH4
+. Although substitution of Ti into Ms is usually insignificant in amount, it is well
established that it is systematically related to the prevailing temperature (T) and to the mineral assemblage in which the Ms occurs. Obviously, substitution of Ti for Al in VI sites requires compensating substitution(s) in other sites, but the specific nature of these substitutions remains ambiguous and disputed. Fortunately, only in a few rocks subjected to both high T and high P does the amount of Ti in otherwise typical Ms rise to levels (0.36-0.56 atoms pfu) at which it may become significant with respect to Ms overall solution behavior (see references in Table 3.1 of Guidotti and Sassi 1998a).
Typically, the ΣVI cations in Ms exceeds by small amounts the ideal 4.0 apfu, suggesting some solution toward a trioctahedral mica. This small excess was discussed in the review of Guidotti (1984) and briefly again by Guidotti and Sassi (1998a). Its importance appears to be minor in terms of significance in most mineralogic and petrologic studies although experimental work by Massonne and Schreyer (1986) suggest that the excess may increase with P. However, this does not appear to have been documented yet based on data from natural samples. The apparent absence of this substitution in Pg and Mrg does seem to suggest a crystalchemistry constraint: it may be related to some systematic difference in their octahedral sheet vs. that of Ms.
In contrast to Pg and Mrg, the ΣAlkali sites of Ms is typically less than the ideal 2.0, especially in lower-grade metapelites. In some cases values as extreme as Σ < 1.80 have been observed for Ms for which there is no reason to question the quality of the analytical work (indeed, the compositional volume of the “true dioctahedral micas” proposed by Rieder et al. (1998) in their Figure 1 considers still lower alkali values, down to 1.7). Various conflicting suggestions have been proposed to explain the ΣAlkali < 2.0 and are reviewed by Guidotti and Sassi (1998a, and especially1998b). That Pg, even if coexisting with Ms, exhibits virtually no evidence of ΣAlkali < 2.0, certainly supports the veracity of the observation for Ms in terms of the elements that can be analyzed by EMPA. However, it remains ambiguous as to whether ΣAlkali < 2.0 reflects substitution of H20, H30+, vacancies, or NH4
+ into the Alkali sites of Ms. The circumstance that, in general, ΣAlkali < 2.0 is most pronounced in lower-grade schists, may have a petrologic-mineralogic significance: more efforts to understand it are justified.
Finally, substitution of the anions F, Cl, and O-2 for (OH)- merit at least some mention. Of these three, albeit fairly minor, F is most significant: it occurs at levels that clearly indicate a systematic and preferential fractionation of F into any coexisting Bt (see Robert et al.,1993, for a crystallochemical explanation of this partitioning). The same is probably true of Cl, but the amounts are so low that a clearly systematic fractionation pattern between the two micas is not so obvious. Typically, the Ms of metamorphic parageneses contains F in amounts ranging up to only about 0.25 wt %, but in unusual cases involving F-saturated assemblages it can be as high as 2.65 wt % (see review by Guidotti 1984). In the context of oxidation/reduction reactions, Dyar et al. (1993) have suggested O-2 replacing (OH)- in Ms, but the case for this substitution is considered less compelling in Ms than in Bt.

418 Guidotti & Sassi
Controls of mica composition by petrologic factors General statements. Of paramount interest to petrologists is the determination of the
values for the petrologically relevant intensive parameters prevailing during formation of igneous and metamorphic rocks. This interest arises from the fact that knowing the values of these parameters enables meaningful constraints to be put on the nature of various large-scale geologic processes, e.g., the orogenic processes that result in mountain belts. For such large-scale processes the most commonly sought after intensive parameters are P and T and then the prevailing activities of several key volatiles, especially H2O, CO2, and O2. Our discussion below includes only this petrologically relevant subset of intensive variables.
One of the primary ways petrologists obtain values for the prevailing intensive parameters is by determination of the compositions of crystalline solution minerals that formed in the equilibria established during formation of a rock. A key constraint on this approach is that a simple and direct relationship exists between mineral compositions and the intensive parameters only under certain special conditions that arise directly out of the derivation of the Gibbs Phase Rule. This circumstance requires special awareness by users of geotheromobarometric methods. Indeed, although the majority of metamorphic petrologists appreciate it, some still seem to ignore this constraint, and not uncommonly, mineralogists fail to appreciate it. Specifically, a simple, direct relationship between the intensive parameters and the mineral compositions exists only if the phase rule variance of the mineral assemblage is such that assigning values to the intensive parameters makes the system invariant.
Various terms have been used to designate such assemblages, e.g., limiting assemblages (Guidotti and Sassi 1976, p. 111). It should be noted that such assemblages basically conform to the p = c part of the Goldschmidt Mineralogic Phase Rule (p ≤ c ). Only very rarely does this situation prevail with complete rigor in natural systems, due to the presence of components in the minerals being considered in addition to the main constituents making up the minerals. These extra constituents add degrees of freedom so that, even if the intensive parameters are fixed, the equilibrium is not invariant: hence the compositions of the crystalline solutions will not be rigorously related to the intensive parameters. Nonetheless, ways exists to overcome such a drawback. With some care and thought, one can commonly minimize such effects and still use the compositions of the minerals to assign at least upper and/or lower limits for the values of the intensive parameters.
A further tool for geothermobarometry is based on how the chemical constituents are distributed among the different mineral phases of a rock. Indeed, situations exist for which it is possible to gain information on the values of the intensive parameters based on the distribution of cations or anions between two coexisting phases, without their specific compositions being fixed for a given set of values of the intensive parameters. Illustrations of this commonly used approach include the garnet-biotite geothermometer first proposed by Ferry and Spear (1978), followed by an ever growing list of subsequent recalibrations, (e.g., Holdaway 2000). Another example is the feldspar geothermometer, first proposed on an empirical, qualitative basis by Barth (1951, 1962) and subsequently recalibrated numerous times since into a supposedly quantitative format (e.g., Brown and Parsons 1981, 1985; Green and Usdansky 1986).
A large number of attempts at determination of the intensive parameters prevailing during geologic/petrologic processes suffer from various inherent deficiencies that are largely a result of a need for a better understanding of the intrinsic properties of the minerals themselves. Exclusive consideration of very carefully chosen samples (that have attained chemical equilibrium or closely approached thereto) and awareness of the
Constraints on Studies of Metamorphic K,Na White Micas 419
constraints imposed by the Phase Rule are necessary for removal of these deficiencies. Stimulating appropriate sophisticated work by mineralogists and promoting cooperative interplay between mineralogists and petrologists is the primary goal pursued in this paper.
Compositional controls by petrologically relevant intensive parameters, examples. Only a few of the most clear-cut, petrologically important examples need be considered here.
T-EFFECTS: The effects of T on white mica compositions are most clearly seen in terms of the Na/(Na+K) ratios of the phases Ms and Pg. Temperature also impacts the substitutions in the VI and IV sites, but with the exception of Ti substituting into VI sites, the VI and IV substitutions are also significantly controlled by P. Consequently, they will be considered mainly below in the context of the effects of P on white mica composition.
The effects ofon the Na/(Na+K)ratios of the white micas are readily seen in the context of the “idealized” AKNa limiting asse mblages aluminum silicate (Al-Sil) + Ms + Pl +/- Kfs (+ Qtz + H2O). With the appropriate considerations taken into account, i.e., that these assemblages in nature are not a true limiting assemblages, the following continuous dehydration reactions exist among the minerals (Guidotti and Sassi 1976):
(Na, K)-Ms + Qtz ↔ Al-Sil + Ab + K-richer Ms + H2O (1)
(Na, K)-Ms + Qtz + Na-Pl ↔ Al-Sil + Na-Kfs + H2O (2) As Reaction (2) proceeds, the remaining Ms becomes K-richer, and the remaining Pl
Ca-richer. It should be noted that various authors have used the term “net transfer” reaction (Thompson and Thompson 1976, but referred to Na-end member phases so as to facilitate direct thermodynamic calculations) for what was called a continuous reaction by Evans and Guidotti (1966). As seen graphically on an AKNa diagram, Figure 3a, left, the three phase field Alsil + Msss + Plss migrates to the K-rich side of composition space as Reaction (1) proceeds to the right in response to temperature increase. As seen on Figure 3a, right, the three phase field Al-Sil + Msss + Kfsss or, taking into account the Ca in the Pl, Figure 3b, the four-phase volume Al-Sil + Msss + Kfsss + Plss in the AKNa +Ca system, migrates to K-richer portions of composition space (see Fig. 9c in Evans and Guidotti 1966).
The effects of T on the Na/(Na+K) ratio of the white micas, Figure 4, is also readily perceived in the assemblage Ms + Pg, i.e., the well known solvus assemblage. Two types of reaction are involved in the closing of the Ms–Pg solvus limbs, one being an exchange reaction and the other a net transfer reaction (Thompson and Thompson 1978), neither of them involving any dehydration. The geothermometric possibilities of this solvus were considered right from its early recognition (Eugster 1956), and attempts to refine its calibration have continued essentially to the present (Guidotti et al. 1994a,b; Roux and Hovis 1996). The calibration for rocks formed at less than 8 kbar can be considered as good at least on a semi-quantitative basis (Blencoe et al. 1994), but at higher P it is only qualitative at best. As shown by Guidotti et al. (1994b), at higher pressures, the extensive substitutions in the VI and IV sites (see P-EFFECTS below) have a very large, still uncalibrated, effect on the Na/(Na+K) ratio of Ms. Moreover, the innate effects (if any) of P on the solvus limbs of the ideal Ms–Pg solvus are not yet determined. That the effects of P on the solvus limbs is still unquantified is most unfortunate because by far it is in high-P rocks as in eclogitic terrains that the Ms + Pg pair most commonly occurs. In rocks formed at <8 kbar the pair is not widespread because it can crystallize only in rocks having bulk Al2O3-contents higher than typical of most mica schists.
Finally, it is well established that the Ti-content of Ms increases as a function of T-increase. That the increase occurs for Ms in assemblages that are Al, Ti, and Si-saturated,

420 Guidotti & Sassi
Figure 3. (a, upper left) AKNa diagram illustrating graphically the results of Reaction (1) ( ---- ), and the effects of Ca-content of Pl on Ms composition ( –-–- ). (upper right) AKNa diagram illustrating graphically the results of Reaction (2) in a Ca-free system. (b, lower) AKNa-Ca diagram illustrating graphically the results of Reaction (2). (At a given activity of H2O for each diagram).
Figure 4 Effects of (T) on Ms + Pg Na/(Na+K) ratio. Based on Figure 22 of Guidotti (1984).

Constraints on Studies of Metamorphic K,Na White Micas 421
clearly demonstrates that the saturation limit of Ti in Ms increases as T increases. However, the details of the substitution mechanism remain unresolved. Moreover, in most cases the amount of Ti is not great. Hence, it has little significance for geothermometry or in terms of influencing the solution properties of Ms.
aH2O-EFFECTS. It is immediately clear from the statements of Equations (1) and (2) that the magnitude of aH2O will effect the Na/(Na+K) ratio of Ms in a fashion directly opposite that of T. Calculations in Cheney and Guidotti (1979) illustrate an attempt to consider quantitatively these opposing effects. Excluding the solvus case, any suggestion of the Na/(Na+K) ratio of Ms giving information on the prevailing temperature at which the rocks formed, must also include a consideration of the matter in terms of what aH2O value prevailed during recrystallization. Indeed, for rocks formed at some uniform P, a consideration of the interplay of T, aH2O, and Ms Na/(Na+K) ratio can be used to make inferences as to whether or not aH2O was buffered by the mineral assemblage present (Evans and Guidotti 1966; Guidotti 1970, 1974; Guidotti and Sassi 1976).
P-EFFECTS. The effects of P on the composition of Pg are observed to be minor at most. In contrast, the effects of P on the composition of Ms are extensive, affecting mainly the VI and IV sites but also the interlayer site. As discussed above, the effect of P on the Na/(Na+K) ratio of Ms is mainly a response to the effects of the VI and IV substitutions on the degree of non-ideality for the Na-K substitution in Ms. This effect is large but not yet calibrated. Hence, at this point, nothing can be said about it serving as a geobarometer.
The effects of P-increase on the substitutions in VI and IV sites is extensive and has been known at least since Ernst (1963). It consists primarily of the Al-Cd substitution described above. Concomitantly, this substitution is usually accompanied by variable amounts of the “Fe 3+-Ms” substitution which, according to Comodi and Zanazzi (1995, 1997) and the discussion in Guidotti et al. (2000), is also favored by P-increase. As discussed in those papers, for Ms at high pressures, these substitutions along with a decrease of the Na/(Na+K) ratio are such that they help to relieve internal structural strains that would destabilize Ms crystals.
In order to avoid the difficult distinction between the “Fe 3+-Ms” and Al-Cd substitutions (due to the inability of EMPA to distinguish Fe2+ from Fe3+
), the very first attempts to calibrate Al-Cd substitution as a geobarometer (commonly called the phengite geobarometer) (Velde 1965, 1967) switched to using the Si-content as a measure of the degree of this substitution as a function of P. The presently used calibration of this geobarometer is that initially based on experimental work of Massonne and Schreyer (1987) on the moderately Al-rich, excess silica assemblage Ms + Ksp + Phl + Qtz in the KMASH system. They showed a strong, almost linear increase of Si with P (to 24 kbar) and a moderate Si decrease with T (to 700°C.) In principle it is a good calibration because it involves a limiting assemblage, so that the compositions of the minerals should be a function of the intensive parameters. Subsequent experimental studies also in the KMASH system, Massonne and Schreyer (1989) expanded the calibration to include two additional limiting assemblages, phengite + Phl + Qtz and phengite + Tlc + Ky + Qtz or coesite, the latter being an Al-saturated assemblage. A geobarometer for Al-saturated parageneses is very useful because some high-pressure rocks contain Ky instead of Kfs which occurs in relatively Al-poor rocks. As discussed in Guidotti and Sassi (1998a), the Al-Cd and Cd-contents also increase greatly at high pressures in Al-saturated rocks, albeit to a lesser degree than in Kfs-bearing rocks. The experiments of Domanik and Holloway (1996) have also documented this in terms of Mg, Al-Cd in Al-saturated compositions at pressures up to 11.5 GPa. Additional experimental calibration work on a phengite-based geobarometer by Massonne and Szpurka (1997) in the systems K2O-MgO-Al2O3-SiO2-H2O and K2O-FeO-Al2O3-SiO2-H2O has tried to take into account that in nature phengite typically has

422 Guidotti & Sassi
considerable Fe2+ replacing Mg. However, questions continue to persist regarding several aspects of the adequacy of
these several experimental calibrations. They include, first, whether equilibrium was achieved in the experiments, and second, the restricted range of the chemical system used in their experiments. The experiments involved only the Mg or Fe2+ end-members of Al-Cd and merged the results by means of thermodynamic calculations involving a theoretical phengite activity model. Furthermore, they also ignored any effects by the “Fe 3+-Ms” substitution, which is very important in nature and could have an unpredictable impact on the theoretical phengite activity model (see “Petrologic studies” sub-section below). These various phengite geobarometers probably should be recalibrated in a combined Mg and Fe2+-bearing system, taking into explicit consideration the implications of the extensive “Fe 3+-Ms” substitutions, that typically accompa ny the Fe and Mg, Al-Cd substitutions in nature.
Finally, brief mention was made above that, at both very high P and T, substitution of Ti into VI sites of Ms might be favored. However, at this point there is little further that can be said.
fO2-EFFECTS. The impact on Ms composition caused by differing fO2 conditions during crystallization has received very little attention by petrologists, this despite that fact that of the albeit usually relatively small total Fe contained in Ms, much of it is Fe3+ (even in reduced rocks, i.e., those containing graphite). In low-Al rocks which involve moderately oxidizing conditions (Mag-bearing), the amount of Fe3+ in Ms can be quite significant: e.g., Baldelli et al. (1989), reported up to ca. 6.0 wt % Fe2O3. In low-Al rocks involving highly oxidized conditions (Hem + Kfs-bearing), Kanehira and Banno (1960) reported Ms with up to 9.10% Fe2O3. It is probable that most of the Fe reported in Table 4 of Carswell et al. (2000) (reported as 4.91 to 9.67 wt % of FeO) is actually Fe2O3.
In Mag- or Hem-bearing rocks most of the Fe in Ms is Fe3+. That Ms would have a relative affinity to take in Fe3+ is not unexpected given that Hem and Crn are isostructural phases and the dioctahedral sheet in Ms is structurally essentially a Crn- or Hem-like sheet. Moreover, Mössbauer data on samples from W. Maine with coexisting Ms, Bt and Chl (e.g., Dyar 1990; Dyar et al. 1993; Guidotti et al. 1994c) and more recent, in progress, XANES work on these same samples, confirms that the Fe3+/Fe2+ ratio in Ms is systematically the highest of these three layer silicates. Guidotti and Sassi (1998a) have reviewed the original literature discussing the controls on and amounts of “Fe 3+-Ms” substitution that can occur in the Ms of metapelitic assemblages. The key point is that, even for graphite-bearing rocks, any discussions involving the use of the Mg/(Mg+Fe2+) ratio in Ms are very likely to be seriously flawed if it is assumed that all of the Fe is Fe2+.
P/T-EFFECTS ON MS POLYTYPE. Although strictly speaking, the control by intensive parameters on the Ms polytypes in metamorphic rocks is not a compositional control, it appears to be intimately interrelated with such controls. Specifically, Sassi et al (1994) presented arguments that the 3T polytype is stabilized under conditions involving a high P to T ratio, conditions that would markedly facilitate the Al-Cd and “Fe 3+-Ms” substitutions. In contrast, other authors (e.g., Stoeckert 1985) have emphasized the importance of an Mg-rich phengite composition for the formation of the 3T polytype. Indeed, the vast majority of 3T Ms occurrences are in high-P rocks in which the Ms is also rich in Al-Cd and “Fe 3+-Ms.”
This problem will be discussed below in the sub-section below dealing with The effects of P, T, and compositional variation on the polytype. There, we will take into account the new results by Smyth et al. (2000) and the fact that Ms in lower P rocks is invariably the 2M1 polytype, even for cases in which the Ms is rich in Al-Cd and “Fe 3+-Ms.”

Constraints on Studies of Metamorphic K,Na White Micas 423
CATION FRACTIONATION IN NON-LIMITING ASSEMBLAGES. Cation fractionation has been used extensively and effectively by petrologists for geothermobarometry using both limiting and non-limiting assemblages. However, in cases involving the white micas this approach has not been used very extensively. Some attempts have been made to use the partitioning of Mg and Fe between Ms and other phases (e.g., Krogh and Råheim 1987; Green and Hellman 1982; Hynes and Forest 1988). However, the results are dubious because of use of the ratio Mg/(Mg+Fe) in which it was assumed that all Fe was Fe2+.
MAXIMIZING INFORMATION FROM MICA STUDIES; SAMPLE SELECTION CONSTRAINTS
As stated above, the goals in this section include discussion of constraints that exist for white mica studies plus how stand-alone studies in petrology and mineralogy of micas can compromise to varying degrees the value and results of otherwise fruitful work. In these contexts, we will discuss the following:
(1) cases in which useful information can be overlooked or incorrect conclusions drawn,
(2) ways to maximize useful information and minimize useless, misleading, or incorrect information,
(3) constraints on selection of study samples to address (1) and (2). Due to our greater familiarity with white micas, we will mainly use them to pursue
goals (1)-(3). When especially useful for our purposes, examples involving Bt will be considered. To the extent feasible, we will treat the details of (1)-(3) separately in terms of petrologic studies and mineralogic studies.
However, we must first consider an important general constraint applying in varying degrees and ways to both petrologic and mineralogic studies: it applies to the choice of specific samples on which a study is to be conducted. The reason this constraint exists is very simple, but commonly overlooked even by experienced workers. We are all familiar with the constraint in mathematics that a system of equations can not be solved uniquely unless the number of unknowns is equaled by the number of equations interrelating the unknowns. In selecting samples for extracting insights based on crystalline solution phases and the phases coexisting therewith, a similar type of general constraint applies to varying degrees. For purposes of our discussion of such sampling selection constraints, one can distinguish in a general way two petrologic and two mineralogic types of studies.
The petrologic types of studies we consider can be outlined as follows. (1) Obtaining qualitative or quantitative values of intensive parameters based on the
compositions of micas and the coexisting phases. Here the analogy with the mathematics example is rigorously exact and, as discussed previously, is a direct manifestation of the Gibbs Phase Rule.
(2) Making thermodynamic calculations involving equilibria among micas and other phases (e.g., geothermobarometry). Here it is commonly necessary to make large extrapolations in order to interrelate the thermodynamic solution properties of natural minerals with those of the end-member minerals tabulated in thermodynamic data bases. Great care is required in sample selection, in order to be certain that the required extrapolations have some validity. Extrapolation from an end-member involving only two constituents, (e.g., the Na/(Na+K) or Mg/(Mg+Fe2+) ratios), may be quite valid. However, as the number and amounts of concomitant variations by other additional elements increases, meaningful extrapolation becomes more tenuous. Similar care is required in using

424 Guidotti & Sassi
empirically calibrated geothermobarometers if they were formulated based on mineral compositions radically different from those of the rocks of interest.
The mineralogic types of studies we consider here attempt to understand the crystalchemistry of micas and hence, their bearing on the related crystalline solution properties. They can be outlined as follows.
(1) Experiments aimed at extracting important data, (e.g., thermodynamic data such as enthalpies of solution, volumes of mixing, compressibility, etc.). These studies require extreme care in sample selection if one wants the data to have meaning with regard to some selected components. To attain this extreme care, such studies are commonly conducted on synthetic materials of simplified model compositions, despite their inherent potential drawbacks due to features differing significantly from the natural phases of ultimate interest (defect structures, differing ordering states, etc.). Such types of drawbacks may also occur using natural samples: examples will be described below of such studies using natural materials (e.g., calorimetry and other thermodynamic studies), in which it seems that adequate caution was not taken in selecting the samples.
(2) Studies aimed at understanding the crystallochemical behavior of the micas. These include ascertaining how a given substitution affects various structural features such as cell dimensions, bond lengths, bond angles, elastic constants, etc. Also included would be studies aimed at ascertaining the nature of any ordering of cations on specific structural sites, any impact of a given substitution on other compositional aspects of a mica, and any effects of compositional variation on the polytype that occurs.
In the above described (1) and (2) mineralogical studies the aim typically is to compare of how changing one variable effects some other variable(s). When only one variable is changing, it can be fairly simple to perceive and measure how this change affects the other variable(s). When instead several things are concomitantly varying in an independent fashion, it may be very difficult to discern the effects of the various interactions among them.
In summary, if samples are not chosen with considerable care and foresight, many of the above mentioned types of studies will have outcomes ranging from compromised to meaningless, and sometimes even misleading. The high cost in time and money of these studies mandates that they be done in ways that maximize the insights obtained. Specific examples of petrologic and mineralogic studies involving micas are now described illustrating the above outlined pitfalls and how they could have been avoided. Petrologic studies
From our particular perspective, the goals of petrologic studies are determination of how, in the context of a given rock bulk composition, the intensive variables interrelate with the chemistry, polytypism, textural, and physical aspects of the minerals (primarily the white micas) in metamorphic rocks. In principle, if the minerals are in chemical equilibrium, or at least close thereto, interrelationships among mineral chemistry, bulk composition and intensive variables should be well defined inasmuch as they are constrained by the laws of chemistry. The interrelationships involving the intensive parameters and polytypism, textures, and physical aspects of the minerals may be less well defined because the laws controlling them are less well understood. Our emphasis is primarily on the mineral chemistry and secondarily on polytypism and some physical aspects like the elastic constants.
Twenty or thirty years ago arguments indicating that the rocks being studied have approached chemical equilibrium were an important part of all metamorphic petrology

Constraints on Studies of Metamorphic K,Na White Micas 425
papers. Unfortunately, in recent years it has become quite common in papers to ignore discussion of this crucial constraint, and in some cases it is evident to a reader that the study involved minerals clearly not forming an equilibrium assemblage. Here it is worth making a plea that workers again make much more explicit efforts to present arguments on whether equilibrium was attained in the rocks on which they worked. Essene and Peacor (1995) have emphasized how, in the absence of at least an approach to equilibrium, attempts to determine quantitatively values of the intensive parameters are not feasible.
In addition to the above outlined equilibrium problem, some key, mineralogy-related difficulties occur which may prevent attaining of the goals of petrologic studies. They include they include the following, largely interrelated topics:
(1) failing to define rigorously the system and assemblages to be considered, (2) lack of various types of fundamental data for the minerals of the given rocks, (3) having to make unconstrained (unreasonable?) extrapolations, extending from
the simple, end-member phase compositions on which the fundamental thermo-dynamic properties are based, to the complex compositions of the minerals present in rocks,
(4) failing to take into account the presence of significant amounts of various components in addition to those intrinsic to the mineral itself.
These are discussed in some detail below. Failing to define explicitly the system and assemblages to be considered.
Fortunately, the problems discussed in this subsection will seem trivial or obvious to many petrologists. Nonetheless, they deserve some comment because of a fairly large number of petrologic papers which seem to be unaware of these potential pitfalls. The key point to be recognized is that it is essential to organize observations into an appropriate comparative basis before attempting to assess the effects of changes of the intensive variables on the compositions of phases, or make thermodynamic calculations. Until the observations are arranged into a legitimately comparative basis, application of sophisticated approaches are less likely to bear fruit. Moreover, it will be more difficult for a reader to assess the validity of the assertions regarding things like geothermobarometry.
Again, fortunately, it is a relatively easy matter (at least for most white mica-bearing parageneses) to arrange petrologic observations into a proper comparative basis so that the implications of the follow-up approaches will be significantly enhanced. An essential step is to choose the chemical system which most fully describes the micas and key phases with which they coexist. Most typically, this will involve the long ago defined AKNa and AFM systems (Thompson 1957 and 1961, respectively) or some newer variant thereof. For very high-P parageneses, some adjustment of these systems or choice of a new system may be required. Organization of samples according to which limiting or non-limiting assemblage they contain is the next highly important step, as well illustrated by the above discussed “phengite” geobarometer. Failing to do this can result in merging/mixing not only assemblages having different thermodynamic variance, but also differing Al-contents in the micas, something that effects not only the extent of any Al-Cd- and Cd-substitution but also the Na/(Na+K) ratios of the feldspars and micas.
After establishing the gross nature of the assemblages, it is important to make an assessment as to whether or not each assemblage is saturated with regard to the elements Si, Ti, Al, and Fe3+. Unfortunately, many workers fail to consider the question of saturation for one or more of the four elements listed thereby, throwing open to question some aspects of their petrologic results. Of course, the question of Si- or Al-saturation is a bit academic as very few mica-bearing rocks lack Qtz and most petrologic workers are aware of the effects of Al-saturation or lack thereof. Because the amount of Ti in white

426 Guidotti & Sassi
micas (but not in Bt!), is usually low, ignoring its saturation is probably of little consequence, unless Bt is abundant in the rock considered, and except possibly in some high-T,P rocks (see above discussion of Ms compositional variation). Ignoring Fe3+, which clearly is the cation most commonly disregarded by petrologists, may have in many cases a negative impact (see below in last part of sub-section “Petrologic studies”). As discussed in some detail by Guidotti et al. (1994c) and Guidotti and Sassi (1998a), most of the key points for focusing on the amount and significance of Ti and Fe3+ in white micas can be obtained merely by consideration of what accessory phases (Gr, Mag, Ilm, Hem, Py, Po, Rt) are present in a given rock.
Lack of fundamental data for the minerals of the given rocks. To a con-siderable degree we refer here to problems over which purely petrologic workers have little control. Unfortunately, petrologists, dealing with natural parageneses, ignore them and go on to make hypotheses and draw conclusions that will be seriously compromised if and when the fundamental data becomes available.
Although the fundamental thermodynamic data for the end-member phases and systems relevant to common rocks now seems to be quite adequate (e.g., Berman 1988 or Holland and Powell 1998), some serious gaps still exist for quantitative treatment of equilibria in mixed composition space. In particular, at least for the micas, there is a dearth of data needed for quantitative treatment of the specific, common equilibria that occur in nature. Reasons for this dearth will be discussed below in the “Mineralogic studies” sub-section. At least three missing data sets that can be listed for the micas:
(1) information on the existence and nature of cation ordering; (2) a lack of the experimental and crystallochemical data needed to formulate more
meaningful solution models; (3) measurements of the elastic properties of the phases. With regard to cation ordering on sites, some data do exist for micas, but unfortunately
many of them are of poor quality or obtained from samples having features making them of little use for insertion into petrologic studies (see below in “Mineralogic studies” sub-section). The lack of crystallochemical data needed to formulate more meaningful solution models arises for much the same reasons, but fortunately, as discussed below, in order to rectify this problem, some studies have been done and others are underway. As for the elastic properties of the white micas, some good progress has been made on obtaining information on the elastic properties of the white micas (e.g., Comodi and Zanazzi 1995, 1997; Catti et al. 1994; Faust and Knittle 1994; Pavese et al. 1999; Smyth et al. 2000; Symmes 1986; Vaughn and Guggenheim 1986). However, more is needed as described below, especially concomitant determinations of the elastic properties at both high-T and high-P. In the case of the rock-forming biotites, little data on the elastic properties as a function of P and T exists other than that from the pioneering study of Hazen and Finger (1978).
Unconstrained extrapolations of thermodynamic properties. The various quantitative thermodynamic calculations involving the equilibria among natural minerals use the thermodynamic data of the end-member compositions of the minerals as a starting point. However, in order to extrapolate these calculations so that they apply to the compositions of actual minerals occurring in a given rock, it is necessary to make adjustments which will relate the composition of each mineral to its thermodynamic properties. As discussed in some detail in Spear (1993), making these adjustments, requires the use of activity models with the word model emphasized by Spear. When using such models, one assumes that it represents accurately the way in which the thermodynamic energy of a mineral varies in response to compositional variation from some end-member composition standard state of the mineral. In simple

Constraints on Studies of Metamorphic K,Na White Micas 427
cases such models probably work well, but in the case of many complex, common rock-forming minerals the models become very complicated, involving aspects that usually include both ideal and non-ideal mixing of the components involved in the deviation from the end-member composition. Even in the case of mixing for an ideal ionic solution, complications arise in formulating an activity model due to questions as to how the mixing occurs in terms of the various crystallographic sites. Hence, it quickly becomes much less certain that a proposed activity model really represents the way in which the thermodynamic energy of the mineral relates to that of the end-member composition. Still more complications arise due to the common occurrence of non-ideal mixing on the various crystallographic sites.
In the case of relatively simple compositional variations, e.g., Na ↔ K exchange between Ms and Pg (Roux and Hovis 1996) or the exchange AlIV + AlVI ↔ Fe2+ + Si for iron-biotites, (Benisek et al.,1996), it has been feasible to obtain some guidance using various approaches for formulation of the proposed activity models. Such guidance has come from thermodynamic, experimental, and crystallochemical approaches. Many similar studies exist, but only rarely do they consider the mixing of three or more constituents. Unfortunately, this is typically the case for complex minerals such as the rock-forming micas. Some of the relatively rare experimental studies considering mixing of three or more components involve the Grt end-members (e.g., Koziol 1996; Koziol and Newton 1989). Of course, the literature on rock-forming minerals is replete with now hundreds of papers using mathematical manipulations in attempts to model solutions. The fact that such a multitude of papers exists bears witness to the difficulty of dealing with systems having too many degrees of freedom.
In the case of the micas, there is considerable observational evidence that the occurrence of one substitution can directly impact another substitution and hence, the nature of the mixing in the latter substitution. Some examples include the effect of Ms Fm-content on its Na ↔ K exchange (Guidotti et al. 1994a), the effect of Bt Mg/(Mg+Fe2+)ratio on the Ti-content of Bt (Guidotti et al. 1977; Henry and Guidotti, 2000) and also on the F ↔ OH exchange (Munoz and Ludington 1974; Valley et al. 1982). Obviously, activity models must reflect these sorts of interactions among and between sites. In some cases (Powell and Holland 1998) activity models have been proposed for micas to reflect these types of complex interactions, but as yet they seem to be largely theoretical constructs with little in the way of direct testing of the validity of the models.
Petrologists are aware of lack of the crystallochemical, thermodynamic, and experimental data needed for formulation of observation-constrained, realistic activity models for describing the solution properties of the complex compositions of typical rock-forming micas (and other minerals). Hence, it is understandable that, notwithstanding their uncertainty, they find it tempting and necessary to turn to idealized, theoretical activity models. In the DISCUSSION section below some suggestions will be made regarding use of the crystallochemical and thermodynamic measurement techniques to obtain some of the data needed to constrain better mica activity models for the specific mica compositions most appropriate for some common petrologic situations.
Failing to take into account the presence of significant amounts of addi-tional components. Based on standard EMPA alone, in most cases workers easily perceive the common occurrences of and the amounts of constituents that are not part of an ideal mica; e.g., Mg in Ms, Ti in Ms and especially Bt. Obviously, these “extra” elements can be a problem in terms of an equilibrium supposedly involving an ideal mica. However, to the extent they are valid, the activity models mentioned above allow a more complex natural mica composition to be related thermodynamically to its idealized mica composition. In some cases, very minor elements which usually are not included in a standard EMPA can also be present in significant amounts, e.g., Ba, V, Cr, etc. (Guidotti and Sassi 1998b). If any
428 Guidotti & Sassi
of these sorts of elements are present at levels that might be significant thermodynamically, departure of the anhydrous analytical sum should alert a worker to such a problem so that the missing elements can be sought out by EDS followed by WDS EMPA.
Much more problematic are those elements that are undetectable by EMPA; e.g., Fe3+ vs. Fe2+, and especially in Bt, Li+, and NH4
+ (Guidotti and Sassi 1998b). In the case of Li+ and NH4
+ even a few tenths of a wt % may be significant because their very small atomic/molecular weights can translate into significant amounts of VI and interlayer sites seeming to be vacant. In low-T, Gr-bearing rocks, if the ΣAlkali cations seems unduly low for no obvious reason, the possibility of significant NH4
+ should be considered and checked if important for some petrologic arguments. As suggested for Gr-bearing rocks by Guidotti and Sassi (1998b), this possibility is especially worth checking for Bt and Cd-rich Ms because both have enlarged alkali sites due to a smaller α rotation angle, thereby being a more favorable site for the large NH4
+ ion. (As an aside, a useful indicator for the possible occurrence of NH4
+ is a significant increase of the basal spacing; see review by Guidotti and Sassi (1998b).).
Notwithstanding the above discussion, failing to take into account the presence of significant amounts of Fe3+ in many micas is by far the most common difficulty for addressing mineralogic equilibria involving micas, a failing that continues to persist to the present time (e.g., Carswell et al., 2000; Currie and Van Staal, 2000). In cases involving micas, this is a most unfortunate failing because there is no reason for it. A series of papers exist, some from years ago using wet chemical data, e.g., Chinner (1960), Butler (1967), and Hounslow and Moore (1967), and more recently some via Mössbauer or XANES techniques, e.g., Dyar (1989), Guidotti and Dyar (1991), Guidotti et al. (1994c), and Dyar et al. (1997) on the amounts of and controls on Fe3+ in the Ms and Bt of typical metapelites such that it is now readily feasible to make at least semi-quantitative adjusts as to what fraction of the Fe in the micas might be assumed as Fe3+. Fortunately, there is encouraging evidence that petrologists are now beginning to address directly the effects of Fe3+ in micas (and the coexisting minerals), (e.g., Holdaway et al. 1997; White et al. in press). Mineralogic studies
Here we will consider two types of studies each having a different goal but ultimately still being strongly interrelated. One type includes those aimed at gaining insights on crystalline solutions that have a bearing on their thermodynamic solution properties and hence, how the phase relates to petrologic considerations. The other type of study is conducted independently of any petrologic implications. Our focus is mainly on the crystallochemical aspects of the mineral, but also includes consideration of physical aspects of special concern, e.g., the elastic constants, structural states, and polytypes—especially as influenced by mine ral composition. Our emphasis is again is on difficulties that arise for attaining more effectively the goals of the studies discussed above, due to lack of forethought in the selection of the samples to be studied (again using micas as our primary vehicle). Necessarily, the most effective ways to discuss this matter is to cite and describe works in which the lack of the above mentioned forethought significantly weakened their impact.
In the context of this discussion, there are cases which deserve to be excluded from any critical comment, although they were conducted without particular care in selection of the sample(s). They involve studies which were not meant to shed light on any particular aspect of the mineral itself, but to show that some new approach was a viable means for gaining some desired insights. A fine example of this would be the pioneering study by Hazen and Finger (1978) which showed that the elastic constants of layer

Constraints on Studies of Metamorphic K,Na White Micas 429
silicates could be experimentally measured at extreme P conditions. Analogously, the study of Vaughn and Guggenheim (1986) was a very important, pioneering study for illustrating the usefulness of Brillion scattering for obtaining quantitative values of various elastic properties of Ms. Unfortunately, due to the physical constraints of the experiment, it was necessary to use a Ms sample having properties such that the elasticity results cannot be extrapolated to common rock-forming Ms, e.g., for use in things like interpretation of seismic energy transmittal through metapelites. First, their sample is anomalous in the sense that its cell dimensions are highly unusual relative to other Ms with similar composition (cf. data in Guidotti et al. 1992). Second, that Ms is highly atypical in terms of a very high F-content: as discussed below, strong arguments can be made that a high F-content in a mica might seriously impact its physical properties.
Another example involving constraints on selection of sample (which is quite analogous to the case of the study by Vaughn and Guggenheim 1986) is represented by early calorimetry studies (e.g., Robie et al. 1976; Krupka et al. 1979). Large amounts of sample were required for the measurements (e.g., almost 23 g of Ms in the calorimetry study by Robie et al.). Hence, it was necessary to use whatever sample was available regardless of its deviation from end-member Ms, and then to try various approaches at correcting for the deviation. Only with the advent of micro-calorimetry and its application to geologic materials (Navrotsky 1977, 1997; Topor and Navrotsky 1992), was it possible avoid this difficulty.
After these sorts of pioneering studies, the follow-up studies should exercise extreme care in the selection of samples in order to maximize the validity and usefulness of the stated results (i.e., for understanding their mineralogic significance and controls thereon), and also their valid application to other questions, e.g., petrologic ones.
Putting aside the above described studies deserving exclusion from any critical comments (even though conducted without extreme case in selection of the samples), let us now discuss studies for which the selection of samples is extremely crucial in the context of the present paper. It is important here to recall the analogy made earlier on trying to draw conclusions in mineralogic studies and the impossibility of solving a system of equations if the number of unknowns exceeds the number of equations. Clearly, this is the essence of most of the difficulties encountered in the examples described below. The manner in which careful sample selection bears on better attainment of the goals of the two types of mineralogic studies discussed above is illustrated below in five interrelated example categories:
(1) measurements of thermodynamic properties; (2) effects of compositional substitutions on various physical parameters of
crystalline solutions; e.g., cell dimensions, bond lengths, bond angles, elastic constants, mechanical strength, etc.;
(3) ascertaining the nature and implications of any ordering of cations on specific structural sites;
(4) the effects of P, T, and compositional variation on the polytype that occurs; (5) effects of a given substitution on other compositional aspects of a mineral. Measurements of thermodynamic properties. Studies included in this category
would include things like calorimetry for enthalpies of solution or mixing HMix and volumes of mixing VMix. The essential goal of such work is an assessment of how a particular thermodynamic variable behaves in response to a given compositional change. Hence, it is essential to consider samples involving only the compositional change of
430 Guidotti & Sassi
specific interest. As an example, for the white micas Ms and Pg, and their solvus relationship, data on the relationship between the thermodynamic properties and the Na/(Na+K) ratio is of great importance. Hence, one would want to consider samples for which only the Na/(Na+K) ratio varies. To avoid problems due to other, extraneous compositional variation, many studies have been done on carefully constrained synthesized materials, e.g., Roux and Hovis (1996), Chatterjee and Flux (1986), and Flux and Chatterjee (1986) for the above example and Circone and Navrotsky (1992) for the Mg end-members of the Bt solution field.
Because synthesized materials may have formed under conditions not representing a close approach to equilibrium, questions can arise as to whether they contain defects or cation ordering that might impact their thermodynamic properties. Hence, it is desirable, if at all feasible, to conduct studies on carefully chosen natural materials that attempt to duplicate the results obtained from synthetic materials. As an example, Guidotti et al. (1992) determined the cell dimensions of a series of natural Ms and Pg having a wide range of Na/(Na+K) ratio and in which there was very little Cd or Al-Cd present. Although lacking the precision of the results obtained from synthetic materials, their curve for the VMix as a function of Na/(Na+K) ratio essentially duplicates that of the other studies, thereby lending support for their meaningfulness in terms of relevance for natural parageneses. On the other hand, the study of Guidotti et al. (1992) also showed that, with the inception of Cd or Al-Cd substitution, there occurred a significant effect on VMix of the Ms-Pg crystalline solution thereby making data from such samples irrelevant or misleading with respect to VMix as a function of Na/(Na+K) ratio.
In contrast, Haselton et al. (1995) assert that comparison of previous and new results from precise heat capacity and heat contents measurements with previous experimental work and new experimental work by them, supports the suggestion of low configurational entropy in Ms, and hence, significant ordering in the IV sites—in direct contradiction with the results of crystal structure refinement work (and the IR work on IV ordering cited below). However, the Ms used in their experiments is quite impure (having 3.08 wt % Fe and about 10 mol % of the Pg end-member). Moreover, for the precise heat capacity and heat content studies they cite, (Pankratz 1964; Krupka et al. 1979; Robie et al. 1976) and the Ms used in those studies is even further removed from being ideal, end-member Ms. [See discussion above in the beginning of “Mineralogic studies” subsection of such so-called precise heat capacity and heat content studies.] Paradoxically, Haselton et al. (1995) argue that the thermodynamic data for Pg supports the notion of no Al/Si ordering therein. Conceivably this reflects the fact that, excluding cases in which Pg contains significant Ca, most natural Pg has a composition very close to the ideal end-member composition (see discussion in Guidotti and Sassi 1998). Indeed, the Pg used for precise heat capacity and heat content measurements by Robie and Hemingway (1984) is quite close to being end-member Pg (only 5 mol % Ms, virtually no Ca, Mg, Fe, almost ideal 3Si:1Al ratio for the tetrahedral sites, no interlayer vacancies). Hence, one is left wondering if much of the thermodynamic data cited by Haselton et al. (1995) to support their suggestion of significant IV cation ordering in Ms is not relevant to the question they have addressed, these data having been accumulated at a time when experimental difficulties were more significant.
In conclusion, the above discussion serves to illustrate how attempts at making measurements of the thermodynamic properties of layer silicates must use extreme care regarding the mineral composition when selecting the samples on which the measurements are to be made.
Effects of compositional substitutions on various physical parameters of crystalline solutions. A vast number of studies on these topics have been described in the literature, ranging over a spectrum from those mainly having a petrologic goal to those

Constraints on Studies of Metamorphic K,Na White Micas 431
having a purely mineralogic goal. The prime goal is to accurately measure how compositional variable “X,” e.g., the Na/(Na+K ) ratio, is related to physical parameter “Y,” e.g., the cell dimensions. These types of studies are conceptually very similar to those described in the immediately preceding subsection, and are a very important facet of modern mineralogy and petrology. Unfortunately, it is not uncommon that a given study is flawed to varying degrees due to lack of sufficient awareness in selection of the materials to be studied. Once again, the cause of the flaw in what might otherwise be a very high quality study, is analogous to the problem of trying to solve a system of equations having more variables than equations relating the variables.
To establish the manner in which “X” is re lated to “Y,” it is essential that the samples considered be compositionally highly comparable in all ways except the “X” being investigated, which should be the only variable, at least to a close approximation. A simple, albeit now passé example due to the present, routine usage of EMPA for chemical data, is a curve showing the d(002) spacing of 2M 1 Ms vs. the Na/(Na+K) ratio. Early on attempts were made at establishing a calibration of this curve to be used as an indirect way of estimating the Na/(Na+K) ratio of Ms (and Pg) in rocks, e.g., Zen and Albee (1964). However, until it became recognized that the Fm substitution in Ms had a strong impact on both the d(002) spacing and the Na/(Na+K) ratio of Ms (e.g., Cipriani et al. 1968), a good calibration was not achievable. A good calibration was proposed by Guidotti (1974) based on considering Ms only from samples that were Al, Si, and Ti saturated. Later, it became evident that this calibration applied only to Ms from rocks crystallized at pressures less than about 8 kbar because at higher pressures, even if the Ms was Al-saturated, it still contained significant amounts of Al-Cd and Cd, thereby affecting in an uncalibrated way both the d(002) spacing and the Na/(Na+K) ratio of the Ms, (Guidotti et al. 1989, 1992, 1994a; Guidotti and Sassi 1998a).
Guidotti et al. (1992) went on to formulate, with at least some success, multivariate calibrations of Ms cell dimensions and volume as a function of two compositional variables, the Na/(Na+K) ratio and the Fm content, the latter being a lumping of the ∑(Mg + Fe2+ + Fe3+) because all three act in a fairly similar fashion in terms of their effects on cell dimensions. These equations have been used with some success in calculating the b cell dimension from ATEM data by Merriman et al. (1995) and Merriman and Peacor (1999).
Another feature illustrated by the above discussed Ms studies is the need to avoid casual, uncritical application of calibrations based on synthetic materials to natural materials. It was discerned by Guidotti et al. (1992) that even the very small compositional differences between synthetic K-Na Ms samples and natural Al-, Si-, and Ti-saturated Ms samples from low P parageneses were enough to systematically offset the curves for d(002) vs. Na/(Na+K) based on each group of samples.
The recent study by Russell and Guggenheim (1999) serves as an example of the complexity and potential pitfalls that could arise if one merges data sets so that the simple “X” vs. “Y” situation no longer prevailed. They made a number of inferences about the influence of the O, OH, and F site on aspects of the crystal structure (primarily the shapes of VI and interlayer sites) based on comparisons among in situ heating experiments (to 600°C) of a crystal from White Well, Australia vs. a synthetic fluorophlogopite (K2Mg6(Al2Si6O20)(F)4) studied in a similar fashion by Takeda and Morosin (1975). In addition, they examined an Fe-rich phlogopite from Silver Crater near Bancroft, Ontario both at room temperature and heated (to 904°C for 24 h). There is a relatively small compositional range among the crystals considered, specifically, the synthetic fluorophlogopite and the two new crystals studied by Russell and Guggenheim:

432 Guidotti & Sassi
(a) Near end-member phologopite-1M; from White Well, Australia (from an Al-saturated pelitic rock):
(K1.64Na0.23)∑=1.87(Mg4.56Al0.99Fe0.24)∑=5.79(Al2.43Si5.57)O20[(OH)3.864F0.138]∑=4 (b) Unheated Fe-rich phlogopite-1M; from Silver Crater near Bancroft, Ontario (in
calcite veins within a nepheline syenite): (K1.85Na0.16)(Mg3.14Fe2+
2.13Fe3+0.21Ti0.21Mn0.12 0.19)(Al2.01Si5.94Ti0.05)O20[(OH)2.10F1.88Cl0.02]
(c) “Oxy” Fe-rich phlogopite 1M; due to loss of H on heating to904°C, the Fe-rich phlogopite appears to have changed compositionally to an “oxy” phlogopite:
(K1.85Na0.16)(Mg3.14Fe2+0.37Fe3+
1.97Ti0.21Mn0.12 0.19)(Al2.01Si5.94Ti0.05)O21.76[(OH)0.34F1.88Cl0.02] Because of the relatively small compositional range among these biotites, one might
assume that their structures would respond in a nearly identical fashion to the heat treatment. However, the structures of the two that are closer to pure-Mg phlogopites behave in a systematically differently and measurable way from each other as well as from the Fe-rich phlogopite. Considering that these measurable differences in structural behavior occur in biotite samples with such a small compositional range, one must consider the possibility that even the difference in VI and IV Al-contents between the two more nearly pure-Mg phlogopites might have an impact on the results otherwise attributed solely to an OH vs. F difference between the crystals. The point is that even seemingly small deviations from the simple “X” vs. “Y” situation probably require at least some testing before merely assuming that they can be ignored (e.g., see above comparison involving calibration of Ms d(002) vs. Na/(Na+K) curves based on synthetic and natural materials; it involved only a very trivial difference in composition). Of course it is not always feasible to find samples for study that lend themselves to a simple “X” vs. “Y” comp arison, as in the above case of the nearly pure-Mg phlogopites (Guggenheim, pers. comm.). In that not uncommon situation, it is important for workers to overtly make note of this fact.
A number of studies have been conducted on Bt (and Chl) some years ago (e.g., Gower 1957; Hood 1968) trying to establish relationships between compositional variable “X” and physical parameter “Y.” Very few of those i nvolving the use of or application to natural samples have met with significant success. Very likely this is a result of the too many independent compositional variables operating in the natural samples. Subsequently, studies of synthetic materials met with more success because the compositional variation allowed was uniquely set during the synthesis (e.g., Hewitt and Wones 1975; Redhammer et al. 1995).
Examples dealing with elastic and mechanical properties can also be cited to illustrate to great importance of sample selection if the full and correct value of a given study is to be realized. For example, one can consider the compressibility and crystal structure refinements performed by Comodi and Zanazzi (1995, 1997) on only three 2M 1 Ms-Pg samples having a wide range of Na/(Na+K) ratio, but virtually no compositional variation off the Ms-Pg pseudobinary join. Hence, their assertions regarding the marked variation of the compressibility with Na/(Na+K) ratio seem to have a high degree of certainty, although based on only three samples. Their compressibility and crystal structure refinements were then highly useful in developing arguments as to how high P would favor Al-Cd and Cd substitution into Ms (Guidotti et al. 2000).
An example of how mica composition might influence the strength of micas in terms of slip along the (001) plane is evident from the paper by Dahl and Dorais (1996). This paper deviates markedly from the simple “X ” vs. “Y” case we have been considering, but still illustrates the great need for careful consideration of the compositions of the samples.

Constraints on Studies of Metamorphic K,Na White Micas 433
Specifically, Dahl and Dorais (1996) discuss the work of Wilson and Bell (1979) on the relative strength of Ms vs. Bt with respect to ease of slip on the (001) plane, and the experimental work of Mares and Kronenberg (1993) on this same relative strength question. Mares and Kronenberg used Ms and an F-rich phlogopite in their experiments. The resulting relative mechanical strengths determined experimentally for the two minerals, when compared to the results by Wilson and Bell (1979) on Ms and Bt, were generalized to conclusions regarding Bt vs. Ms (i.e., Bt stronger than Ms). However, Dahl and Dorais (1996) argued quite persuasively that, because the phlogopite used in the experiments of Mares and Kronenberg (1993) was fluoro-phlogopite, its strength would be markedly increased compared to a phlogopite (or Bt) containing mostly OH instead of F. Hence, very likely it was not valid for Mares and Kronenberg (1993) to compare and contrast their results with those of Wilson and Bell (1979) regarding the relative ease of (001) slip in Ms vs. Bt.
In summary, we have discussed above, as examples, papers displaying extremely high quality work but affected by an unfortunate flaw due to inappropriate choice of study samples. As a consequence of this flaw, the goal of assessing the manner in which compositional variable “X” is related to physi cal parameter “Y” has been compromised to varying degrees, commonly without any awareness on the part of the author. Moreover, in these types of mineralogic studies we see that, even in cases in which it is not simply how “X” is related to physical parameter “Y,” it is still extremely important to consider the composition and its crystallochemical implications for the mineral being studied.
Ascertaining the nature and implications of any ordering of cations on specific structural sites. In addition to extensive work on relatively uncommon micas, an enormous amount of effort has been expended by mineralogists trying to assess the presence, types and amounts of cation ordering in the IV and VI sites of the common rock-forming white micas and biotite. This effort reflects the fact that the question has not only intrinsic mineralogic interest, but also an enormous petrologic interest because the nature of ordering on sites impacts the formulation of the activity models used in thermodynamic calculations. Bailey (1984 a, b) has provided a comprehensive review of ordering in micas based on crystal structure refinements work. According to Bailey, there is clear evidence for cation ordering on IV and/or VI sites of some micas, but not in others. In contrast, there is little evidence for ordering in the interlayer sites, possibly due to most attention being directed at the IV and VI sites.
Some of the factors mentioned in the literature (see reviews by Bailey 1984 a,b and also Velde 1980) as potentially exerting controls on cation ordering in layer silicates includes: (1) inherent structural differences of some sites, (2) composition via ion size and charge-balance considerations, and (3) P and T conditions of formation (including duration of time subjected to the given conditions). All of these, but especially (2) and (3), also have a relevance with regard to which layer silicate polytype forms. Indeed, questions of ionic ordering and polytypism in layer silicates are commonly interrelated to a considerable degree.
A considerable arsenal of techniques have been used to assess the presence, types and amounts of cation ordering in micas, all of them requiring a very high degree of specialized expertise. These include various crystal structure refinement techniques (measuring the sizes of the coordination polyhedra), spectroscopy techniques (e.g., IR, NMR, Mössbauer, Raman, etc.), and indi rect techniques based on thermodynamic calculation of configurational entropies (see above). A wide range of agreement, ambiguity and disagreement exists within and between the results from these different techniques. Below, we will briefly review the results of these three categories of techniques with respect to only the common rock-forming micas, commenting on some

434 Guidotti & Sassi
of the problems inherently encountered by a given technique, and how more careful selection of samples to be studied might help at least somewhat at reducing the present ambiguities and disagreements in the results of different workers.
Temperature, and less so P, is well known to affect the ordering state of ions in minerals. Mineralogists and petrologists are interested mainly in how a given ordering state relates to a crystal achieving energetically its most stable structure. Hence, it is important to consider whether a natural or synthetic mica formed under conditions for which at least homogeneous equilibrium was closely approached. If this is not the case for a given sample, then obviously any insights regarding ordering in that sample may not be germane to the main interest mineralogists and petrologists have regarding ordering.
The indirect approach involving calculation of configurational entropies, including potential problems and ways to ameliorate them, has been discussed above and requires no further comment.
Bailey (1984b) has discussed some of the problems that introduce difficulties in applying crystal structure refinement techniques to questions of ordering in layer silicates. These include matters involving the interplay between particular stacking sequences and the choice of space group symmetry in which a refinement is performed, and problems of distinguishing long-range vs. short range ordering of ions. These problems arise because crystal structure refinement techniques are statistical in nature and their results involve an averaging-out of effects.
Based upon crystal structure refinement techniques of the truly rock-forming dioctahedral and trioctahedral micas, the extent of ordering is actually rather restricted, albeit still very interesting and important. Only Ms-3T, some phengite-2M1 (and Mrg-2M1 and Pg-3T) were listed by Bailey as having strong evidence for tetrahedral ordering. Subsequent crystallography papers, Pavese et al. (1999, 2000) have also suggested IV ordering in a phengite-3T and also a phengite 2M1. According to Bailey (1984a), VI ordering is more common among micas in general, and to be expected if there is sufficient substitution of cations having different size and charge. However, this is apparently not so among those we have designated as the truly rock forming micas. Bailey (1984a) listed only Ms-3T, oxy-Bt-1M (and Mrg-2M1 and Pg-3T). Based upon Bailey’s reviews, it appears that as of 1984 there was little evidence from crystal structure refinement work suggesting IV or VI ordering in common Bt-1M, the only truly rock-forming trioctahedral mica.
Even if considering only the crystal structure approaches to detecting ordering in truly rock-forming micas, there is significant divergence of opinion regarding the extent of IV and/or VI ordering. For example, Bailey (1984a) lists IV ordering only for Ms-3T and phengites-2M1, -2M2, and -1M, and VI ordering only for Ms-3T, phengite-1M, oxyBt-1M, and an oxyBt-2M1. Other micas listed that “might” be considered as rock-forming and which have some cation ordering are Mrg-2M1 and a Pg-3T. Results on relevant K-white micas listed by Bailey (1984a) and new results from subsequent studies of what can be termed rock-forming K-white micas, are given in Table 1. Clearly there are differences with regard to whether or not ordering was detected in IV and/or VI sites in a given study. All but one of the samples listed in Table 1 are phengites, but a number of studies on 3T or 2M1 phengites exist in which neither IV nor VI ordering were detected (3T: Amisano-Canesi et al. 1994; 2M1: Brigatti et al. 1998; Rule and Bailey 1985; 2M1 Smyth et al. 2000). The reasons for these different results solely among crystal structure approaches is not readily apparent and are discussed in some of the papers.
Possible explanations for the different ordering results detected for a given type of K-white mica include: (1) differences in the P/T ratio at which the samples formed, (2) sample compositions that are not truly comparable, considering especially the amount of

Constraints on Studies of Metamorphic K,Na White Micas 435
vvTable 1. Examples of proposed ordering in rock-forming, K-white mica determined by means of X-ray structure refinements.
(A) Samples and references cited in Bailey (1984a): Reference Species IV ordering VI ordering
Güven and Burnham (1967) muscovite-3T
(Sultan Basin, Wash.) Yes Yes
Güven (1971a) phengite-2M 1
(Tiburon Penin., Calif.) Yes
Zhoukhlistov et al. (1975) phengite-2M2
(N. Armenia) Yes
Sidorenko et al. (1975) phengite-1M
(Transbaikal, USSR)Yes Yes
(B) Samples from subsequent studies:
Reference Species IV ordering VI ordering
Pavese et al. (1999) phengite-2M1
(Valle Passiria, Italy) Yes on heating to 873° K
Pavese et al. (2000) phengite-3T
(Dora-Maira, Italy) Yes Yes
Smyth et al. (2000) phengite-3T
(synthetic) Possibly
cations like Ti and Fe3+, and (3) formation under non-equilibrium conditions. With regard to the third explanation, the Ms-3T studied by Güven and Burnham (1967) merits special comment. As described in their paper, this Ms is from late, cross-cutting veinlets formed during alteration of a granodiorite body. Almost certainly it did not form under conditions approximating either heterogeneous or homogeneous equilibrium. Unfortunately, however, this sample has been used more or less as the starting point for subsequent discussions of IV and VI ordering in rock-forming white micas. Possibly it would be better suited to serve as an illustration of a poor choice for a sample on which to conduct detailed crystallographic work?
Work involving spectroscopy approaches has not yet resolved many of the discrepancies and ambiguities in results discussed above for ordering in the rock-forming white micas and biotites. To a considerable degree, this is certainly because such techniques have been applied only in the past twenty years, and mainly only in the past 15 years. Moreover, many of these approaches are still in the development and refinement stages. Nonetheless, they appear to hold great promise for testing, refining, and extending the insights based on the crystal structure refinement approach (see Hawthorne 1988), and especially for providing insights regarding the nature of any short-range cation ordering in minerals—something not easily detected by crystal structure refinement work. Although the nature of any long-range ordering is of fundamental

436 Guidotti & Sassi
importance for understanding thermodynamic energy aspects of a mineral, including formulation of the activity models used in thermodynamic calculations, insights regarding the nature of any short-range cation ordering is also highly important for energy considerations.
However, spectroscopy approaches will not be the “final panacea” with regard to detecting and quantifying questions involving cation ordering within a given type of site or different types of sites (e.g., IV vs. VI sites for Fe3+) and other aspects of the internal makeup of micas, e.g., the amount Fe3+ of out of total Fe. In part this is because they involve very complex procedures for making measurements, complex calculations to develop fits to the measurements, and then for interpreting the results. It is already apparent that different workers favor different approaches to fitting the data. Two examples should serve to illustrate how differences in interpretation that can arise (1) with respect to ordering within a given site and (2) with respect to assignment of a cation to different types of sites. In the first case, Velde (1980) interpreted IR spectra obtained from synthetic Ms to suggest that IV ordering of Al and Si was facilitated by high-P conditions of synthesis; in contrast Langer et al. (1981), working in conjunction with Flux et al. (1984), interpreted their IR spectra on synthetic Ms, including some synthesized at high-P, as indicating no IV ordering of Al and Si. In the second case, Mössbauer spectra on Bt from western Main e (Dyar 1989; Guidotti and Dyar 1991) were interpreted to be indicating significant Fe3+ in IV sites as well as VI sites; in contrast, Rancourt et al. (1992) argued that use of the spectral fitting procedure preferred by him would largely eliminate any Fe3+ being assigned to IV sites.
Finally, and especially important for our message, it is evident that poor choices in the selection of samples for spectroscopy work are already starting to occur. Early examples can be mentioned to illustrate this tendency right in the infancy stages of using spectroscopy (NMR) to study micas. In trying to gain insights on the nature of any IV cation ordering in Ms, Sanz and Serratosa (1984) and then Herrero (1985) chose a sample consisting of microcrystalline Ms which was a mixture of 2M1 and 1M polytypes and containing 0.52 wt % of Fe oxide. However, examples can also be cited for which the spectroscopy work (NMR) was conducted on compositionally well constrained samples, e.g., Circone et al. (1991), so that the results are not inherently ambiguous.
Clearly, if data obtained via spectroscopy methods are to be valid and have maximum value for either mineralogic/petrologic purposes or technique development, great care will be needed in selection of study samples. Basically, it will be essential to have detailed information on: (1) the P,T at which a sample formed, (2) if it formed under equilibrium conditions, and (3) it has the composition most relevant to the question(s) being asked.
The effects of P, T, and compositional variation on the polytype. The controls on which mica polytypes occur in rocks are not well understood, in part because it is likely that kinetic factors are important in many instances (see below). Nonetheless, the occurrence of different mica polytypes in metamorphic rocks is another example of a question having intrinsic interest for mineralogists as well as petrologists interested in the genesis of the rocks. Bailey (1984a, p. 10) mentions that, because composition is a controlling factor, rock-forming micas might be better described as polytypoids of different composition rather than truly polytypic or polymorphic. Although we won’t adopt this terminology, it does emphasize the compositional control aspect.
Of the various polytypes possible in micas, 1M and 1Md mainly occur among the trioctahedral rock-forming micas (for our purposes, Bt in the broad sense), and less so 3T, 2M1, and 2M2 (Bailey 1984a). According to Bailey (1984a), the preponderance of the 1M polytype for all trioctahedral micas is probably related to the compositional aspect of the octahedral sheet. Beyond such a possible control, the nature of any other control on polytypism of the trioctahedral micas seems nebulous at best. For example, in a study of

Constraints on Studies of Metamorphic K,Na White Micas 437
Bt from sillimanite zone metapelites and binary granites in western Maine, Benincasa et al. (2000) detected ordered 1M polytype in addition to 1M disordered sequences as the most common packing, but 2M1 and 3T polytypes were also found: no particular petrologic or compositional features seems to be controlling which polytype occurs in these rocks.
In the case of the truly rock-forming dioctahedral micas, there is clearly a concentration of 2M1 and less so 3T. 1M and 1Md polytypes also occur, but are almost wholly restricted to very low temperature parageneses (Frey 1987), i.e., in rocks for which it is likely that neither heterogeneous nor homogeneous equilibria were achieved. Hence, each 1M and 1Md occurrence is probably unique in some respects, such that generalizations as to what facilitated their occurrence may be indeterminate. Inasmuch as the dioctahedral rock-forming 2M1 and 3T white micas formed at higher temperatures and pressures and involve more thorough re-crystallization, the likelihood of making meaningful generalization about the controls on them is much greater. Hence, we restrict our discussion of the petrologic and/or compositional controls of polytypes to these Na-K micas, and the common compositional variation of Ms toward Cd and Al-Cd.
In the vast majority of Pg occurrences, the polytype is 2M1. Possibly, this lack of variety of polytypes reflects the fact that, excluding quite modest solution toward Ms and the few cases involving solution toward Mrg, rock-forming Pg has very little compositional variation from the ideal end-member composition (Guidotti and Sassi 1998a). Moreover, as shown by Comodi and Zanazzi (1995, 1997), it is markedly less compressible than Ms. One might suggest that it is less susceptible to factors that would favor its crystallization in other than in the 2M1 polytype. In contrast, although 2M1 is the most abundant polytype for Ms, the 3T form is also common in important rock-forming environments. As discussed above, Ms does exhibit considerable compositional variation, and as shown by Comodi and Zanazzi (op. cit.), it is measurably more compressible than Pg.
At least since the review of Frey et al. (1983, and references cited therein), it has been recognized that 3T is typical of Phe-rich Ms that has formed in high P,T metamorphic terrains. Subsequently the most complete overview and evaluation of occurrences of 3T vs. 2M1 polytypes of Ms (in the context of virtually all common bulk compositions) has been done by Sassi et al. (1994). Then Guidotti and Sassi (1998a), based on that paper and some subsequent crystal structure work, noted that the three statements in Sassi et al. (1994) seem to cover our present understanding of 3T vs. 2M1 Ms occurrences:
1. the potassic white micas stable in high P/T metamorphism have both phengitic composition and 3T stacking arrangement (occurrence type I phengites);
2. phengites also occur in low P/T metamorphic rocks of particular bulk composition (low Al content), but they are 2M1 (occurrence type II phengites);
3. hypothetically, during evolving HP events, the 3T phengites (type I) might change to 2M1 phengite or muscovite when the physical conditions evolve towards lower P/T values.
Subsequent crystal structure work and arguments discussed in Guidotti and Sassi (1998a) support the notion that the 3T polytype would be stabilized by the in tandem combination of Fm enrichment and high-P. However, the necessary condition seems to be high P/T.
Sassi et al. (1994) also discussed in some detail the possible significance of IV and VI ordering with respect to crystallization of Ms-3T. The only Ms-3T for which a crystal structure refinement existed at that time (the Güven and Burnham sample) did show IV and VI cation ordering and Sassi et al. (op. cit.)speculated that such ordering might be more expectable in Ms-3T than in Ms-2M1 because of the P/T conditions at which they most typically form and the attendant compositional response to these P/T conditions. Guidotti and Sassi (1998a) did not discuss the matter of ordering in Ms-3T vs. Ms-2M1

438 Guidotti & Sassi
because the crystal structure work by Amisano-Canesi et al. (1994) did not detect clear evidence of IV cation ordering in two Phe-3T crystals (one from the Dora-Maira massif in Italy) and, at best, only indirect evidence of VI ordering. In subsequent relevant work on a Phe-3T sample from the Dora-Maira massif, Pavese et al. (2000) found via neutron powder diffraction good evidence for both IV and VI ordering. Pavese et al. (1999) also described a Phe-2M1 for which IV ordering developed upon heating of the sample, but in contrast, Mookherjee et al (2000) detected no change in IV ordering in response to heating of a Phe-2M1 sample from Greece. Still more recently, Smyth et al. (2000) have reported crystal structure work and compressibility measurements on Al-Cd-rich muscovite [K(Al1.21Mg0.75Fe0.04)(Al0.19Si3.81)O22(OH1.2F0.8)] synthesized at very high pressures (11 GPa) by Domanik and Holloway (1996). This work has shown these micas are a mixture of 3T and 2M1 polytypes with no IV ordering in either case, but a fairly good possibility for VI ordering in the3T samples.
At this point in time, it appears that the relationship of IV and/or VI ordering to the polytype of dioctahedral white micas remains ambiguous. Even though the high-P, Al-Cd-rich Ms discussed in Smyth et al. (2000) was not uniformly 3T as expected from the discussion in Sassi et al. (1994), it still seems likely that the emphasis given by the latter authors on the importance of high P/T ratio for 3T formation may still have merit. It is conceivable, indeed, that the synthesized, ultra high pressure micas did not achieve full equilibrium (e.g., reflecting instead kinetic factors due to relatively short run-times); moreover, the very high F-contents of those micas could have an impact on the ease with which Ms-3T forms vs. Ms-2M1. Indeed , the inference by Smyth et al. (2000) that “there is likely to be little if any pressure effect on polytype distribution” is such that it might divert attention from any P implication and focus it solely on the phengitic composition as the unique control on the 3T stacking. Although the results of Smyth et al. (2000) are of considerable interest and importance, if taken at face value, they could compromise future efforts aimed at a better understanding of these mica polytype questions, because they seems to disregard or undervalue the occurrences of type II phengites. Such occurrences are a key point, which perhaps still deserve a better assessment.
Undoubtedly, more observations on natural occurrences of 3T vs. 2M1 and experimental synthesis work will certainly be interesting and useful with respect to the detailed controls on the occurrence of 3T vs. 2M1. However, it would seem that greatest improvements in understanding the controls might result from very careful studies of the following types: (a) additional work on natural rocks aimed at better documenting the occurrences of both type I and type II phengites; (b) application of appropriate spectroscopy techniques to Phe in general, but especially the type I Phe-3T, in order to assess the extent of any short range IV and/or VI ordering; (c) additional detailed , high-pressure full crystal structure refinements on natural Phe like those done by Comodi and Zanazzi (1995) on natural, Phe-poor Ms. This would allow comparison with the Phe-poor Ms and also consideration of any influence resulting from the presence of the significant Fe2+, and especially the Fe3+ in typical natural Phe.
Effects of a given substitution on othe r compositional aspects of a mineral. Although some mica studies on these effects have been done (e.g., Guidotti et al. 1994b; Guidotti et al. 1986; Cheney and Guidotti 1989), the mineralogic and petrologic literature does not seem to contain many studies aimed specifically at investigating the crystallochemical interactions implied by this topic. This is unfortunate, because discernment of such crystallochemical interactions and the controls thereon can be useful in how activity terms are defined for thermodynamic treatment of equilibria involving crystalline solution phases. Moreover, it can have important implications on the manner in which geothermobarometers are applied to natural parageneses.
These crystallochemical interactions and controls are most clearly shown by

Constraints on Studies of Metamorphic K,Na White Micas 439
considering well constrained mineral equilibria, i.e., low variance assemblages that involve compositional saturation with regard to a number of chemical constituents. The literature with which we are most familiar, those on micas, contains some good examples that illustrate such crystallochemical interactions and the controls thereon of a specific substitutions. We will describe several examples (one involving dioctahedral white micas and the other biotites), and discuss their potential petrologic implications.
In the case of Ms and Pg, there are two substitutions, one in Pg (Ca2+) and the other in Ms (Fm) that impact the Na/(Na+K) ratio of Ms, in essence, changing the degree of non-ideality of the simple substitution Na ↔ K in Ms. The effect of Ca2+ substituting into Pg on the Na/(Na+K) ratio of Ms is most easily seen graphically by viewing the white mica plane, Figure 1a, in the system Al2O3-KAlSi3O8-NaAlSi3O8-CaAl2Si8O8 (at a given activity of H2O). Obviously, increase of Ca in Pg causes the Ms-Pg solvus to open wider, Figure 1b, left, which is tantamount to saying that the Na ↔ K substitution in Ms and Pg has become more non-ideal. This effect is essentially identical with that of Ca in Pl on the Kfs-Ab solvus (Fig. 1b, right). Figure 3a (left) also shows the system Al2O3-KAlSi3O8-NaAlSi3O8-CaAl2Si8O8 (at a given activity of H2O), but at higher grade so that the assemblage Sil + Ms + Pl occurs. Inspection of the three representative three-phase tie planes shows that substitution of Ca into the Pl has an analogous impact on the Na/(Na+K) ratio of the co-existing Ms. Obviously, attempts at geothermometry using equilibria involving the Na ↔ K substitution in Ms coexisting with Pg must consider overtly the effect of any Ca in the Pg (Zen and Albee 1964), or for Ms coexisting with Sil and Pl, the effect of Ca in the Pl (Cheney and Guidotti 1989).
Although the Fm components are extraneous to the system Al2O3-KAlSi3O8-NaAlSi3O8-CaAl2Si8O8, their substitution into Ms at even modest levels has a very marked effect on the Na ↔ K substitution in Ms coexisting with Pg, causing it to be much more non-ideal. As discussed in Guidotti et al. (1994b), the Ms limb of the solvus moves to a K-richer position while the Pg limb remains nearly stationary. These authors also presented crystallochemical arguments as to why the increase in Fm made the alkali site less favorable for containing Na+ ions. Although Guidotti et al. (1994b) discussed the effect in only qualitative terms, they noted that theoretically it might be feasible to calibrate quantitatively for Ms-Pg pairs the effect of Fm in Ms on its Na/(Na+K) ratio, thereby making the solvus into both a geobarometer and geothermometer. Such a calibration being still not available to date, the above mentioned qualitative results show, at the very least, the manner in which the Fm substitution will impact the activity model for the Na ↔ K exchange in Ms.
Several examples from the literature on biotite also illustrate the effect being considered in this subsection. One involves the effect of the Mg/(Mg+Fe2+) ratio of Bt on its Ti-content, and hence the KD of Ti between Bt and co-existing Ms. Basically, as described in Guidotti et al. (1986), for rocks that are saturated with TiO2, Al2O3, and SiO2, and crystallized at a given T, as the Mg/(Mg+Fe2+) ratio of Bt increases, its Ti-content decreases. Clearly, the degree of ideality of Ti solubility into Bt crystalline solution is being affected by the Mg/(Mg+Fe2+ ratio of Bt. It seems likely that the inverse of this effect would also hold, so that increase of Ti in Bt would affect its Mg/(Mg+Fe2+) ratio. Because the Ti-content of the coexisting Ms remains unaffected, the KD of Ti between Bt and co-existing Ms changes markedly. Guidotti et al. (1986), and more recently, Henry and Guidotti (2000) have suggested fairly simple crystallochemical arguments involving the dimensions of the IV and VI sheets of the structure and charge balance to explain the inverse relationship in Bt of Mg/(Mg+Fe2+ ratio and Ti-content.
There are two key things to be drawn from the above examples. First, they provide an atomistic understanding for changes in the degree of ideality of some substitution into a given crystalline solution. Thus, a more rigorous quantification of the energy terms and the type of solution involved, including a more realistic activity model, should be

440 Guidotti & Sassi
possible. The resulting applications might enable some geothermobarometers to be applied more effectively. For example, in the literature on Grt-Bt geothermometry there has been some discussion about the impact of Ti in Bt on the Grt-Bt geothermometer, especially in high-grade rocks (e.g., Indares and Martignole 1985). Inasmuch as the KD in Grt-Bt geothermometer involves the partitioning of Mg and Fe2+ between the two phases, the above discussed relationship between the Ti-content of Bt and its Mg/(Mg+Fe2+) ratio may provide an avenue to understand atomistically the effect of Ti in Bt on the Grt-Bt geothermometer. This might allow the effect to be adjusted for in a more quantitative fashion than merely “best fit” approaches (s ee Holdaway et al. 1997). At the very least, it seems evident from the above that intermingling Grt-Bt geothermometry done on Al- and Ti-saturated and non Al- and-Ti-saturated rocks would be an unwise course of action. Most desirable would be geothermometry involving comparison of rocks that have also crystallized at nearly the same fO2 conditions as implied by the opaque assemblages, e.g., such as done in the studies by Holdaway et al. (1997) and Holdaway (2000).
Finally, it should be noticed that much of the discussion in this section is couched in the context of petrologically constrained systems and assemblages so that the variables free to change are quite limited. To a considerable degree, the discussion is still in the context of variable “X” vs. variable “Y.”
DISCUSSION We have seen in the previous sections that when samples are not chosen with
considerable care and foresight, many of the above discussed types of petrologic and mineralogic studies will have outcomes ranging from being seriously compromised to meaningless, or even worse, misleading. In trying to illustrate these problems, we have also cited and discussed several papers seemingly affected by these pitfalls. We hope that the authors of these papers will forgive us for calling attention to this aspect of their work which otherwise may well be of the highest quality. In no case has our intent been one of malice toward any individual.
In reviewing our treatment of various types of petrologic and mineralogic studies, it is useful to list what we perceive as some overriding problems typically encountered in each of these two types of studies. Of course many petrologic and mineralogic studies overtly and consciously attempt to avoid the various pitfalls discussed above, but unfortunately all too commonly one encounters papers in major journals for which it appears that the author, reviewers, and editors overlooked these potential problems. In concert with the above discussion, we will address below only matters related to sample selection and treatment involving rock-forming micas. For example, we assume that in petrologic studies fundamental matters such as ascertaining the degree to which equilibrium has been approached have been given appropriate attention. Common failings in petrology studies
(1) Failing to take into account un-analyzed constituents; Fe3+ especially. Fortunately, there is a growing awareness of the Fe3+ problem and efforts to address it are becoming more common both theoretically (White et al., in press), and analytically (Dyar et al. 1997, 2000).
(2) Failing to fully define the system in which an equilibrium occurs, including especially whether it involves saturation with key elements so that two rocks can be legitimately compared in terms of the effects of intensive parameters.
(3) Failing to take into account more fully the results obtained by the numerous types of mineralogic studies that bear on what sort of solution models might best enable pursuit of the petrologic questions.
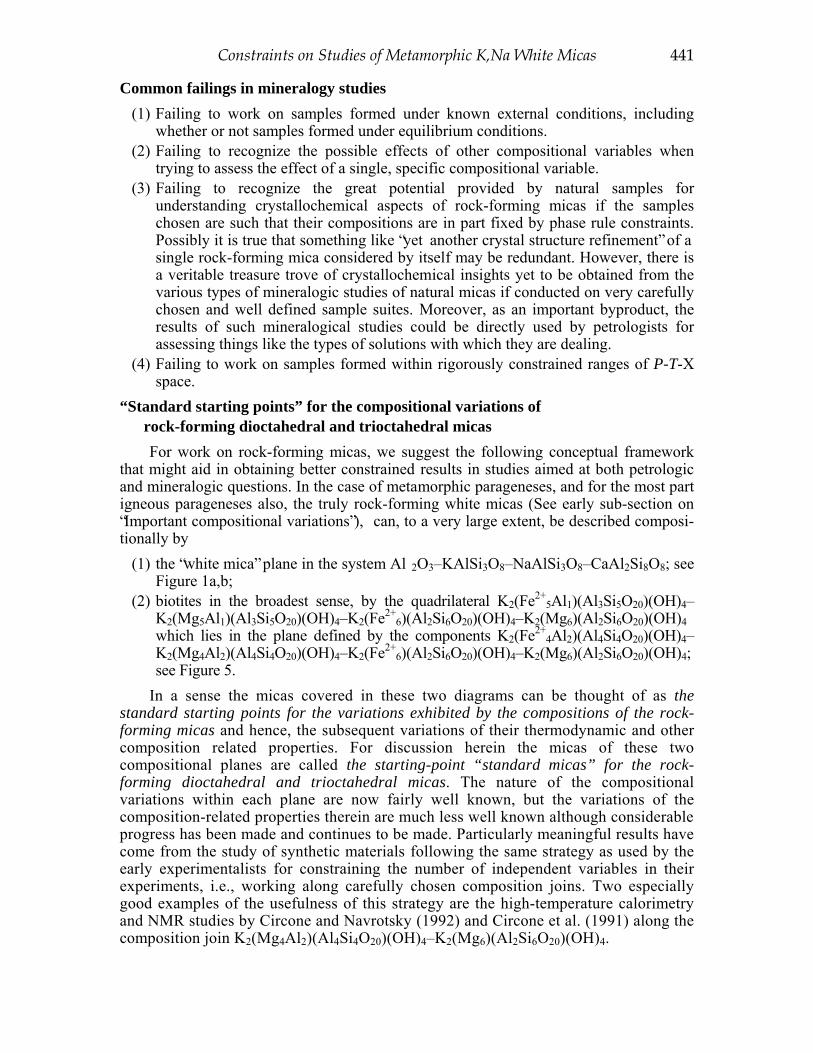
Constraints on Studies of Metamorphic K,Na White Micas 441
Common failings in mineralogy studies (1) Failing to work on samples formed under known external conditions, including
whether or not samples formed under equilibrium conditions. (2) Failing to recognize the possible effects of other compositional variables when
trying to assess the effect of a single, specific compositional variable. (3) Failing to recognize the great potential provided by natural samples for
understanding crystallochemical aspects of rock-forming micas if the samples chosen are such that their compositions are in part fixed by phase rule constraints. Possibly it is true that something like “yet another crystal structure refinement” of a single rock-forming mica considered by itself may be redundant. However, there is a veritable treasure trove of crystallochemical insights yet to be obtained from the various types of mineralogic studies of natural micas if conducted on very carefully chosen and well defined sample suites. Moreover, as an important byproduct, the results of such mineralogical studies could be directly used by petrologists for assessing things like the types of solutions with which they are dealing.
(4) Failing to work on samples formed within rigorously constrained ranges of P-T-X space.
“Standard starting points” for the compositional variations of rock-forming dioctahedral and trioctahedral micas For work on rock-forming micas, we suggest the following conceptual framework
that might aid in obtaining better constrained results in studies aimed at both petrologic and mineralogic questions. In the case of metamorphic parageneses, and for the most part igneous parageneses also, the truly rock-forming white micas (See early sub-section on “Important compositional variations”), can, to a very large extent, be described composi-tionally by
(1) the “white mica” plane in the system Al 2O3–KAlSi3O8–NaAlSi3O8–CaAl2Si8O8; see Figure 1a,b;
(2) biotites in the broadest sense, by the quadrilateral K2(Fe2+5Al1)(Al3Si5O20)(OH)4–
K2(Mg5Al1)(Al3Si5O20)(OH)4–K2(Fe2+6)(Al2Si6O20)(OH)4–K2(Mg6)(Al2Si6O20)(OH)4
which lies in the plane defined by the components K2(Fe2+4Al2)(Al4Si4O20)(OH)4–
K2(Mg4Al2)(Al4Si4O20)(OH)4–K2(Fe2+6)(Al2Si6O20)(OH)4–K2(Mg6)(Al2Si6O20)(OH)4;
see Figure 5. In a sense the micas covered in these two diagrams can be thought of as the
standard starting points for the variations exhibited by the compositions of the rock-forming micas and hence, the subsequent variations of their thermodynamic and other composition related properties. For discussion herein the micas of these two compositional planes are called the starting-point “standard micas” for the rock-forming dioctahedral and trioctahedral micas. The nature of the compositional variations within each plane are now fairly well known, but the variations of the composition-related properties therein are much less well known although considerable progress has been made and continues to be made. Particularly meaningful results have come from the study of synthetic materials following the same strategy as used by the early experimentalists for constraining the number of independent variables in their experiments, i.e., working along carefully chosen composition joins. Two especially good examples of the usefulness of this strategy are the high-temperature calorimetry and NMR studies by Circone and Navrotsky (1992) and Circone et al. (1991) along the composition join K2(Mg4Al2)(Al4Si4O20)(OH)4–K2(Mg6)(Al2Si6O20)(OH)4.

442 Guidotti & Sassi
Figure 5. Rock-forming biotite quadrilateral. Based on Figure 34 of Guidotti (1984). The compositions shown are interrelated via the FeMg-1 and Al2Mg-1 Si-1 exchanges defined by Thompson (this volume).
From the starting-point “standard micas” represented on Figures 1b and 5, a number of compositional departures can occur to varying degrees, in some cases involving only one constituent, and in some cases multiple components. Early in this work, the major compositional variations from the white mica plane were reviewed and Guidotti (1984) has reviewed them for the Bt quadrilateral shown in Figure 5. A few studies exist for the effects on composition-related properties resulting from major deviations from the “standard micas” by a single component, e.g., (Ti) Robert, (1976), (Mg-Al, Cd) Domanik and Holloway (1996), and (Mg-Al, Cd) Schmidt (1996). It is encouraging that more, new progress of this sort continues in mica studies, e.g., (Mg-Al, Cd) (Schmidt et al. 2001), and (Mg-Al, Cd) (Smyth et al. 2000), the latter study involving significant F replacing OH as well as substitution of Mg-Al, Cd.
For studies addressing simultaneously the effects of two or more “ non-standard mica” constituents or the interaction of a “s tandard and non-standard mica” constituent, there is very little quantitative information. In many cases this results in largely only “educated” guesses as to how these multi-constituent deviations effect the properties in question. Nonetheless, even in such cases progress has been made as illustrated for example by the white mica study of Guidotti et al. (1992). Other examples involving natural Bt from metapelites are the work by Cruciani et al. (1994) investigating the effects of Ti on Bt cell dimensions and the work by Benincasa et al. (2000a,b) also addressing the effects of Ti substitution as well as Mg/Fe2+ ratio on cell dimensions and other structural details. In these studies the work has been conducted on carefully chosen suites of biotites having compositions that are constrained by phase rule considerations.
It is important to note that although the results of Smyth et al. (2000) and Schmidt et al. (2001) are of extreme importance, it must be realized that direct extrapolation of them to rock-forming micas merits considerable caution because natural Phe will typically have in it significant amounts of both Fe-Al Cd and Cd. In contrast, the results from the above described work on Bt from metapelites can probably be extrapolated directly to natural parageneses, because they were selected so that they are constrained to be exactly the same type of Bt that one routinely encounters in Alsil-bearing amphibolite-grade rocks.

Constraints on Studies of Metamorphic K,Na White Micas 443
It is self-evident that it would be extremely useful to develop more complete data sets based on observations involving both natural and synthetic materials on all aspects of the compositional variation within the “sta ndard micas,” and then “work outward” along the vectors of the main compositional variations that occur in rock-forming parageneses. Working in this conceptual framework would aid greatly in lessening, albeit not eliminating, the repeatedly mentioned dilemma of “too many variables for the number of equations.” Moreover, when merged with th e notion of working with suites of natural micas from petrologically constrained parageneses, the dilemma of too many variables can in some cases be “neutralized,” but only as long as workers realize that data sets obtained in this fashion can be compared rigorously with other data sets only if both sets involve micas from the same petrogenesis.
Indeed, with the appropriate care in sample selection or synthesis, it should be feasible to conduct studies similar to those by Circone and Navrotsky (1992), Circone et al. (1991), Benisek et al. (1996) and Benisek et al. (1999), but on natural or synthetic rock-forming micas such that the results obtained could be used almost directly in some petrologic modeling. For example, natural Bt with a range of Mg/(Mg+Fe2+) from metapelitic rocks that are saturated with Si, Ti, Al and having Fe3+ fixed in relatively narrow ranges reflecting the coexisting opaque minerals, might be amenable to some of the types of studies illustrated by above cited experimental work. Alternatively, possibly Bt could be synthesized under conditions so that they would closely mimic the above described natural Bt. If successful, studies of such Bt samples would provide experimentally constrained information on the mixing properties of the Bt that is typically present in many cases involving the reactions and geothermometry for typical metapelitic rocks.
Finally, this conceptual framework of “standard micas” can provide especially important insights on the various, composition-related, properties of micas by investigating rock-forming micas containing high concentrations of the usually minor compositional variations, e.g., Ba, V, Cr, NH4, etc. Examples illustrating the value of using the “standard micas” as reference frames are already well known and understood. An example would be the substitution of Ca+2 into the interlayer site with concomitant substitution of Al for Si in IV sites of “biotite” to produce the brittle mica clintonite with its long recognized associated changes in properties such as hardness, ease of cleaving along (001) planes. A number of similar examples exist (e.g., Ba in Ms; Harlow 1995) and are particularly interesting and revealing when juxtaposed with the “standard micas.” Finally, consideration in the conceptual framework of “standard micas” should help workers to address more clearly whether some suggested limit for a particular compositional variation in micas arises from crystallochemical constraints, or due to petrologic or geologic factors (e.g., bulk composition).
ACKNOWLEDGMENTS We are very grateful to Professors James B. Thompson, Jr. and Werner Schreyer for
their comments and suggestions for changes in this paper. In addition to pointing out numerous points needing attention, each of them picked up a major “sin of commission or omission” which would have been emba rrassing if left unattended. Many people aided us during preparation of this paper by providing reprints, preprints, information, etc. on a very prompt basis when asked. The number who helped is too long to list, but many will recognize their input by the citations to their papers. Of this large group, Chuck Geiger deserves special mention because he kindly agreed to read sections of the paper about which we felt a degree of uncertainty, in particular, the sections dealing with activity models and spectroscopy. The authors are also grateful to Drs. Luca Peruzzo and Raffaele Sassi for their help in the preparation of the figures.

444 Guidotti & Sassi
CVG is very grateful to Accademia dei Lincei for providing the invitation and support enabling his participation in the Mica 2000 conference held in Rome in November 2000. Support to CVG has also been provided via NSF Grant EAR 9902857.
FPS also acknowledges Accademia dei Lincei for having given the necessary support to the organization of the Mica 2000 conference (Rome, November 2-3, 2000) and financial support by Italian CNR and MURST.
REFERENCES Amisano-Canesi A, Chiari G, Ferraris G, Ivaldi G, Soboleva SV (1994) Muscovite- and phengite-3T:
Crystal structure and conditions of formation. Eur J Mineral 6:489-496 Bailey SW (1984a) Crystal chemistry of the true micas. Rev Mineral 13:13-60 Bailey SW (1984b) Review of cation ordering in micas. Clays Clay Minerals 32:81-92 Baldelli C, Franceschelli M, Leoni L, Memmi I, (1989) Ferrimuscovite and celadonite substitutions in
muscovite from Fe3+-rich low-grade psammitic rocks (Northern Apennines, Italy). Lithos 23:201-208 Barth TFW (1951) The feldspar geologic thermometer. N Jahrb Mineral Abh 82:143-154 Barth TFW (1962) The feldspar geologic thermometer. Norsk Geol Tidsskr 42:330-339 Benincasa, E. Brigatti, MF, Guidotti, CV, Poppi, L (2000) Crystal chemistry of magnesian annite and
ferroan phlogopite crystals from metapelites. Soc Ital Mineral Petrol Plinius 24:26-27 Benincasa, E, Brigatti, MF, Guidotti, CV, Poppi, L (2001) Magnesian annite and ferroan phlogopite
crystals from metapelites of western Maine: A crystal chemical study. Abstr in: Advances On Micas, Acc Naz Lincei Mtg, Rome, Nov. 2-3, 2000, p 189-190
Benisek A, Dachs E, Redhammer G, Tippelt G, Amthauer G (1996) Activity-composition relationship in Tschermak’s substituted Fe biotites at 700°C, 2 kbar. Contrib Mineral Petrol 125:85-99
Benisek A, Dachs E, Cemic L (1999) Heat capacities of Tschermak substituted Fe-biotite. Contrib Mineral Petrol 135:53-61
Berman RG (1988) Internally consistent thermodynamic data for minerals in the system Na2O-K2O-CaO-MgO-FeO-Fe2O3-Al2O3-SiO2-TiO2-H2O-CO2. J Petrol 29:445-522
Blencoe JG, Guidotti CV, Sassi FP (1994) The paragonite-muscovite solvus. II: Numerical geothermometers for natural, quasibinary paragonite-muscovite pairs. Geochim Cosmochim Acta 58:2277-2288
Brigatti MF, Frigieri P, Ghezzo C, Poppi L (2000) Crystal chemistry of Al-rich biotites coexisting with muscovites in peraluminous granites. Am Mineral 85:436-448
Brigatti MF, Frigieri P, Poppi L (1998) Crystal chemistry of Mg-,Fe-bearing muscovites-2M1. Am Mineral 83:775-785
Brown WL, Parsons I (1985) Calorimetric and phase diagram approaches to two-feldspar geothermometry: A critique. Am Mineral 70:356-361
Butler BCM (1967) Chemical study of minerals from the Moine schists of the Ardnamurchan area, Argyllshire, Scotland. J Petrol 8:233-267
Carswell DA, Wilson RN, Zhai M (2000) Metamorphic evolution, mineral chemistry and thermobarometry of schists and orthogneisses hosting ultra-high pressure eclogites in the Dabieshan of central China. Lithos 52:121-155
Catti M, Ferraris G, Hull S, Pavese A (1994) Powder neutron diffraction study of 2M1 muscovite at room pressure and at 2 GPa. Eur J Mineral 6:171-178
Chatterjee ND, Flux S (1986) Thermodynamic mixing properties of muscovite-paragonite crystalline solutions at high temperatures and pressures, and their geological application. J Petrol 27:677-693
Cheney, JT, Guidotti, CV (1979) Muscovite-plagioclase equilibria in sillimanite + quartz-bearing meta- pelites, Puzzle Mountain area, Northwest Maine. Am J Sci 279:411-434
Chinner G A, (1960) Pelitic gneisses with varying ferrous/ferric ratios from Glen Clova, Angus, Scotland. J Petrol 1:178-217
Cipriani C, Sassi FP, Viterbo-Bassani C (1968) La composizione delle miche chiare in rapporto con le costanti reticolari e col grado metamorfico. Rend Soc Ital Mineral Petr 24:153-187
Circone S, Navrotsky A, Kirkpatrick RJ, Graham CM (1991) Substitution of (VI,IV)Al in phlogopite: Mica characterization, unit-cell variation, 27Al and 29Si MAS-NMR spectroscopy, and Al-Si distribution in the tetrahedral sheet. Am Mineral 76:1485-1501
Circone S, Navrotsky A (1992) Substitution of (6,4)Al in phlogopite: high-temperature solution calorimetry, heat capacities, and thermodynamic properties of the phlogopite-eastonite join. Am Mineral 77:1199-1205
Comodi P, Zanazzi PF (1995) High-pressure structural study of muscovite. Phys Chem Minerals 22: 170-177
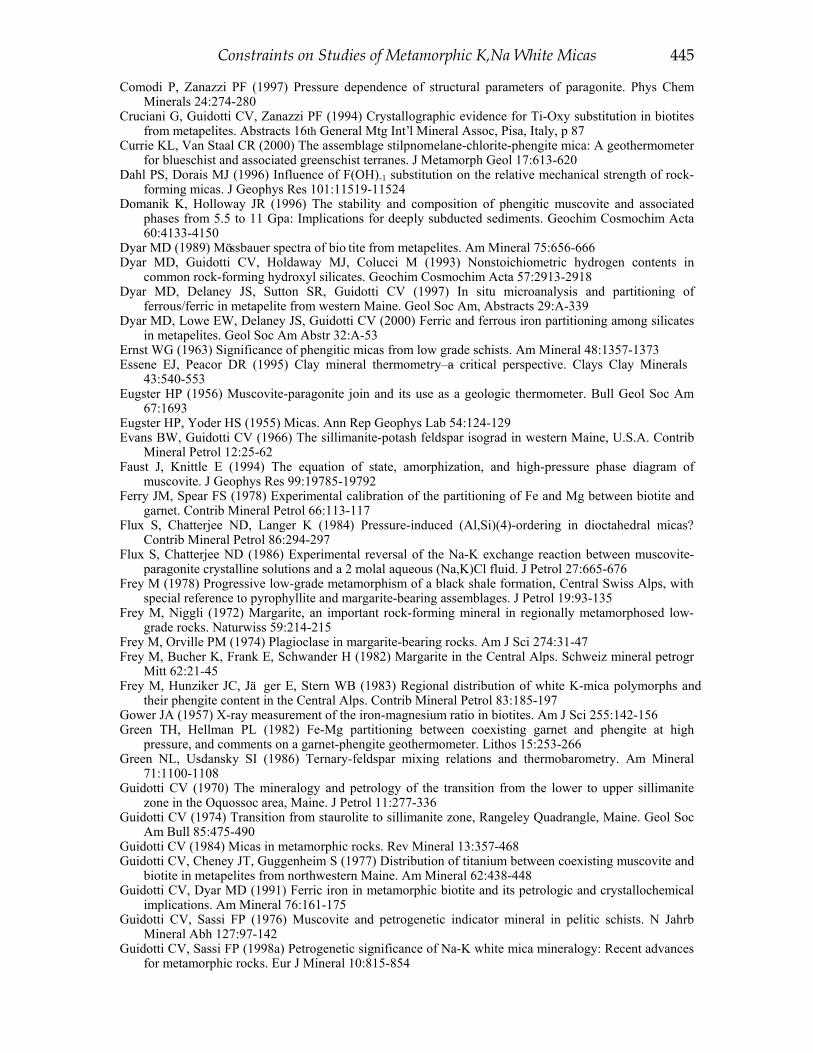
Constraints on Studies of Metamorphic K,Na White Micas 445
Comodi P, Zanazzi PF (1997) Pressure dependence of structural parameters of paragonite. Phys Chem Minerals 24:274-280
Cruciani G, Guidotti CV, Zanazzi PF (1994) Crystallographic evidence for Ti-Oxy substitution in biotites from metapelites. Abstracts 16th General Mtg Int’l Mineral Assoc, Pisa, Italy, p 87
Currie KL, Van Staal CR (2000) The assemblage stilpnomelane-chlorite-phengite mica: A geothermometer for blueschist and associated greenschist terranes. J Metamorph Geol 17:613-620
Dahl PS, Dorais MJ (1996) Influence of F(OH)-1 substitution on the relative mechanical strength of rock-forming micas. J Geophys Res 101:11519-11524
Domanik K, Holloway JR (1996) The stability and composition of phengitic muscovite and associated phases from 5.5 to 11 Gpa: Implications for deeply subducted sediments. Geochim Cosmochim Acta 60:4133-4150
Dyar MD (1989) Mössbauer spectra of bio tite from metapelites. Am Mineral 75:656-666 Dyar MD, Guidotti CV, Holdaway MJ, Colucci M (1993) Nonstoichiometric hydrogen contents in
common rock-forming hydroxyl silicates. Geochim Cosmochim Acta 57:2913-2918 Dyar MD, Delaney JS, Sutton SR, Guidotti CV (1997) In situ microanalysis and partitioning of
ferrous/ferric in metapelite from western Maine. Geol Soc Am, Abstracts 29:A-339 Dyar MD, Lowe EW, Delaney JS, Guidotti CV (2000) Ferric and ferrous iron partitioning among silicates
in metapelites. Geol Soc Am Abstr 32:A-53 Ernst WG (1963) Significance of phengitic micas from low grade schists. Am Mineral 48:1357-1373 Essene EJ, Peacor DR (1995) Clay mineral thermometry—a critical perspective. Clays Clay Minerals
43:540-553 Eugster HP (1956) Muscovite-paragonite join and its use as a geologic thermometer. Bull Geol Soc Am
67:1693 Eugster HP, Yoder HS (1955) Micas. Ann Rep Geophys Lab 54:124-129 Evans BW, Guidotti CV (1966) The sillimanite-potash feldspar isograd in western Maine, U.S.A. Contrib
Mineral Petrol 12:25-62 Faust J, Knittle E (1994) The equation of state, amorphization, and high-pressure phase diagram of
muscovite. J Geophys Res 99:19785-19792 Ferry JM, Spear FS (1978) Experimental calibration of the partitioning of Fe and Mg between biotite and
garnet. Contrib Mineral Petrol 66:113-117 Flux S, Chatterjee ND, Langer K (1984) Pressure-induced (Al,Si)(4)-ordering in dioctahedral micas?
Contrib Mineral Petrol 86:294-297 Flux S, Chatterjee ND (1986) Experimental reversal of the Na-K exchange reaction between muscovite-
paragonite crystalline solutions and a 2 molal aqueous (Na,K)Cl fluid. J Petrol 27:665-676 Frey M (1978) Progressive low-grade metamorphism of a black shale formation, Central Swiss Alps, with
special reference to pyrophyllite and margarite-bearing assemblages. J Petrol 19:93-135 Frey M, Niggli (1972) Margarite, an important rock-forming mineral in regionally metamorphosed low-
grade rocks. Naturwiss 59:214-215 Frey M, Orville PM (1974) Plagioclase in margarite-bearing rocks. Am J Sci 274:31-47 Frey M, Bucher K, Frank E, Schwander H (1982) Margarite in the Central Alps. Schweiz mineral petrogr
Mitt 62:21-45 Frey M, Hunziker JC, Jäger E, Stern WB (1983) Regional distribution of white K-mica polymorphs and
their phengite content in the Central Alps. Contrib Mineral Petrol 83:185-197 Gower JA (1957) X-ray measurement of the iron-magnesium ratio in biotites. Am J Sci 255:142-156 Green TH, Hellman PL (1982) Fe-Mg partitioning between coexisting garnet and phengite at high
pressure, and comments on a garnet-phengite geothermometer. Lithos 15:253-266 Green NL, Usdansky SI (1986) Ternary-feldspar mixing relations and thermobarometry. Am Mineral
71:1100-1108 Guidotti CV (1970) The mineralogy and petrology of the transition from the lower to upper sillimanite
zone in the Oquossoc area, Maine. J Petrol 11:277-336 Guidotti CV (1974) Transition from staurolite to sillimanite zone, Rangeley Quadrangle, Maine. Geol Soc
Am Bull 85:475-490 Guidotti CV (1984) Micas in metamorphic rocks. Rev Mineral 13:357-468 Guidotti CV, Cheney JT, Guggenheim S (1977) Distribution of titanium between coexisting muscovite and
biotite in metapelites from northwestern Maine. Am Mineral 62:438-448 Guidotti CV, Dyar MD (1991) Ferric iron in metamorphic biotite and its petrologic and crystallochemical
implications. Am Mineral 76:161-175 Guidotti CV, Sassi FP (1976) Muscovite and petrogenetic indicator mineral in pelitic schists. N Jahrb
Mineral Abh 127:97-142 Guidotti CV, Sassi FP (1998a) Petrogenetic significance of Na-K white mica mineralogy: Recent advances
for metamorphic rocks. Eur J Mineral 10:815-854
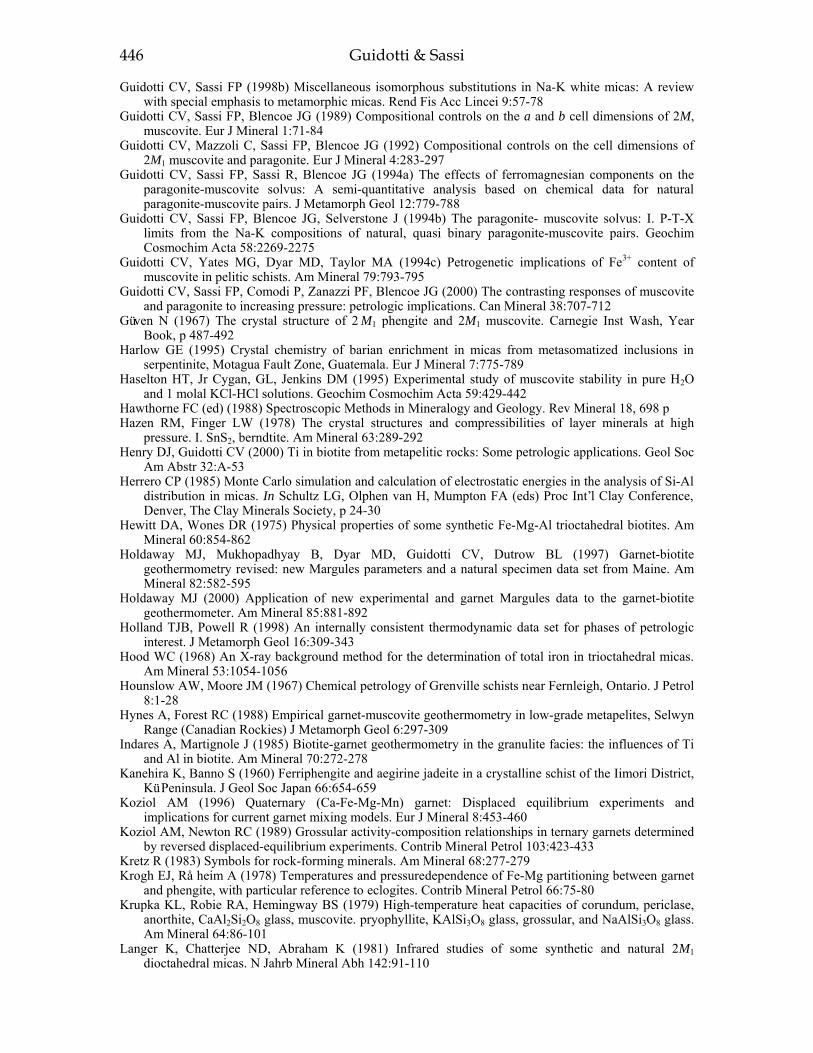
446 Guidotti & Sassi
Guidotti CV, Sassi FP (1998b) Miscellaneous isomorphous substitutions in Na-K white micas: A review with special emphasis to metamorphic micas. Rend Fis Acc Lincei 9:57-78
Guidotti CV, Sassi FP, Blencoe JG (1989) Compositional controls on the a and b cell dimensions of 2M, muscovite. Eur J Mineral 1:71-84
Guidotti CV, Mazzoli C, Sassi FP, Blencoe JG (1992) Compositional controls on the cell dimensions of 2M1 muscovite and paragonite. Eur J Mineral 4:283-297
Guidotti CV, Sassi FP, Sassi R, Blencoe JG (1994a) The effects of ferromagnesian components on the paragonite-muscovite solvus: A semi-quantitative analysis based on chemical data for natural paragonite-muscovite pairs. J Metamorph Geol 12:779-788
Guidotti CV, Sassi FP, Blencoe JG, Selverstone J (1994b) The paragonite- muscovite solvus: I. P-T-X limits from the Na-K compositions of natural, quasi binary paragonite-muscovite pairs. Geochim Cosmochim Acta 58:2269-2275
Guidotti CV, Yates MG, Dyar MD, Taylor MA (1994c) Petrogenetic implications of Fe3+ content of muscovite in pelitic schists. Am Mineral 79:793-795
Guidotti CV, Sassi FP, Comodi P, Zanazzi PF, Blencoe JG (2000) The contrasting responses of muscovite and paragonite to increasing pressure: petrologic implications. Can Mineral 38:707-712
Güven N (1967) The crystal structure of 2 M1 phengite and 2M1 muscovite. Carnegie Inst Wash, Year Book, p 487-492
Harlow GE (1995) Crystal chemistry of barian enrichment in micas from metasomatized inclusions in serpentinite, Motagua Fault Zone, Guatemala. Eur J Mineral 7:775-789
Haselton HT, Jr Cygan, GL, Jenkins DM (1995) Experimental study of muscovite stability in pure H2O and 1 molal KCl-HCl solutions. Geochim Cosmochim Acta 59:429-442
Hawthorne FC (ed) (1988) Spectroscopic Methods in Mineralogy and Geology. Rev Mineral 18, 698 p Hazen RM, Finger LW (1978) The crystal structures and compressibilities of layer minerals at high
pressure. I. SnS2, berndtite. Am Mineral 63:289-292 Henry DJ, Guidotti CV (2000) Ti in biotite from metapelitic rocks: Some petrologic applications. Geol Soc
Am Abstr 32:A-53 Herrero CP (1985) Monte Carlo simulation and calculation of electrostatic energies in the analysis of Si-Al
distribution in micas. In Schultz LG, Olphen van H, Mumpton FA (eds) Proc Int’l Clay Conference, Denver, The Clay Minerals Society, p 24-30
Hewitt DA, Wones DR (1975) Physical properties of some synthetic Fe-Mg-Al trioctahedral biotites. Am Mineral 60:854-862
Holdaway MJ, Mukhopadhyay B, Dyar MD, Guidotti CV, Dutrow BL (1997) Garnet-biotite geothermometry revised: new Margules parameters and a natural specimen data set from Maine. Am Mineral 82:582-595
Holdaway MJ (2000) Application of new experimental and garnet Margules data to the garnet-biotite geothermometer. Am Mineral 85:881-892
Holland TJB, Powell R (1998) An internally consistent thermodynamic data set for phases of petrologic interest. J Metamorph Geol 16:309-343
Hood WC (1968) An X-ray background method for the determination of total iron in trioctahedral micas. Am Mineral 53:1054-1056
Hounslow AW, Moore JM (1967) Chemical petrology of Grenville schists near Fernleigh, Ontario. J Petrol 8:1-28
Hynes A, Forest RC (1988) Empirical garnet-muscovite geothermometry in low-grade metapelites, Selwyn Range (Canadian Rockies) J Metamorph Geol 6:297-309
Indares A, Martignole J (1985) Biotite-garnet geothermometry in the granulite facies: the influences of Ti and Al in biotite. Am Mineral 70:272-278
Kanehira K, Banno S (1960) Ferriphengite and aegirine jadeite in a crystalline schist of the Iimori District, Kü Peninsula. J Geol Soc Japan 66:654-659
Koziol AM (1996) Quaternary (Ca-Fe-Mg-Mn) garnet: Displaced equilibrium experiments and implications for current garnet mixing models. Eur J Mineral 8:453-460
Koziol AM, Newton RC (1989) Grossular activity-composition relationships in ternary garnets determined by reversed displaced-equilibrium experiments. Contrib Mineral Petrol 103:423-433
Kretz R (1983) Symbols for rock-forming minerals. Am Mineral 68:277-279 Krogh EJ, Råheim A (1978) Temperatures and pressure dependence of Fe-Mg partitioning between garnet
and phengite, with particular reference to eclogites. Contrib Mineral Petrol 66:75-80 Krupka KL, Robie RA, Hemingway BS (1979) High-temperature heat capacities of corundum, periclase,
anorthite, CaAl2Si2O8 glass, muscovite. pryophyllite, KAlSi3O8 glass, grossular, and NaAlSi3O8 glass. Am Mineral 64:86-101
Langer K, Chatterjee ND, Abraham K (1981) Infrared studies of some synthetic and natural 2M1 dioctahedral micas. N Jahrb Mineral Abh 142:91-110

Constraints on Studies of Metamorphic K,Na White Micas 447
Mares VM, Kronenberg AK (1993) Experimental deformation of muscovite. J Structural Geol 15: 1061-1075
Massonne, HJ Schreyer, W (1986) High-pressure syntheses and X-ray properties of white micas in the system K2O–MgO–Al2O3–SiO2–H2O. N Jahrb Mineral Abh 153:177-215
Massonne, HJ Schreyer, W (1987) Phengite geobarometry based on the limiting assemblage with K-feldspar, phlogopite, and quartz. Contrib Mineral Petrol 96:212-224
Massonne, HJ Schreyer, W (1989) Stability field of the high-pressure assemblage talc + phengite and two new phengite barometers. Eur J Mineral 1:391-410
Massonne, HJ Szpurka, Z (1997) Thermodynamic properties of white micas on the basis of high-pressure experiments in the systems K2O-MgO-Al2O3-SiO2-H2O and K2O-FeO-Al2O3-SiO2-H2O. Lithos 41: 229-250
Merriman, RJ, Roberts, B, Peacor, DR, Hirons, SR (1995) Strain-related differences in the crystal growth of white micas and chlorite: A TEM and XRD study of the development of metapelite microfabrics in the Southern Uplands thrust terrane, Scotland. J Metamorph Geol 13:559-576
Merriman RJ, Peacor DR (1999) Very low-grade metapelites: mineralogy, microfabrics and measuring reaction progress. In Frey M, Robinson D (eds) Low-Grade Metamorphism. Blackwell Science
Ltd, Malden, MA, p 10-60 Mookherjee M, Redfern SAT, Hewat A (2000) Structural response of phengite 2M1 to temperature: An in
situ neutron diffraction study. EMPG VIII, Bergamo, April 16-19, Abstracts, p 75 Munoz JL, Ludington S (1977) Fluorine-hydroxyl exchange in synthetic muscovite and its application to
muscovite-biotite assemblages. Am Mineral 62:304-308 Navrotsky A (1977) Progress and New Directions in High Temperature Calorimetry. Phys Chem Minerals
2:89-104 Navrotsky A (1997) Progress and New Directions in High Temperature Calorimetry Revisited. Phys Chem
Minerals 24:222-241 Pankratz LB (1964) High-temperature heat contents and entropies of muscovite and dehydrated muscovite.
U.S Bur Mines Rep Investigations 6371:1-6 Pavese A, Ferraris G, Pischedda V, Ibberson R (1999) Tetrahedral order in phengite 2M1 upon heating,
from powder neutron diffraction, thermodynamic consequences. Eur J Mineral 11:309-320 Pavese A, Ferraris G, Pischedda V, Radelli P (2000) Further study of the cation ordering in phengite 3T by
neutron powder diffraction. Mineral Mag 64:11-18 Rancourt DG, Dang MZ, Lalonde AE (1992) Mössbauer spectroscopy of tetrahedral Fe 3+ in trioctahedral
micas. Am Mineral 77:34-43 Redhammer GJ, Dachs E, Amthauer G (1995) Mössbauer spectroscopic and X-ray powder diffraction
studies of synthetic micas on the join Annite KFe3AlSi3O10(OH)2-Phlogopite KMg3AlSi3O10 (OH) 2. Phys Chem Minerals 22:282-294
Rieder M, Cavazzini G, D’Yakonov Y, Frank-Kamenetskii VA, Gottardi G, Guggenheim S, Pavel PV, Müller G, Neiva AMR, Radoslovich EW, Robert JL, Sassi F P, Takeda H, Weiss Z, Wones DR (1998) Nomenclature of the micas. Can Mineral, 36:41-48
Robert JL, (1976) Phlogopite solid solutions in the system K2O-MgO-Al2O3-SiO2-H2O. Chem Geol 17:195-212
Robert JL, (1976) Titanium solubility in synthetic phlogopite solid solutions. Chem Geol 17:213-227 Robert JL, Beny JM, Della Ventura G, Hardy M (1993) Fluorine in micas: crystal-chemical control of the
OH-F distribution between trioctahedral and dioctahedral sites. Eur J Mineral 5:7-18 Robie, RA, Hemingway, BS (1984) Heat capacities and entropies of phlogopite (KMg3[AlSi3O10](OH)2)
and paragonite (NaAl2 [AlSi3O10](OH)2) between 5 and 900K and estimates of the enthalpies and Gibbs free energies of formation. Am Mineral 69:858-868
Robie RA, Hemingway BS, Wilson WH (1976) The heat capacities of calorimetry conference copper and of muscovite KAl2(AlSi3)O10(OH)2, pyrophyllite Al2Si4O10(OH) 2, and illite K3(Al7Mg)(Si14Al2)O40(OH)8 between 15 and 375 K and their standard entropies at 298.15 K. J Res U S Geol Surv 4:631-644
Rosenfeld JL, Thompson JB, Zen E-an (1958) Data on coexistent muscovite and paragonite. Bull Geol Soc Am 69:1637
Roux J, Hovis GL (1996) Thermodynamic mixing models for muscovite-paragonite solutions based on solution calorimetry and phase equilibrium data. J Petrol 37:1241-1254
Rule AC, Bailey SW (1985) Refinement of the crystal structure of phengite-2M1. Clays Clay Minerals 33:403-409
Russell RL, Guggenheim S (1999) Crystal structures of near-end-member phlogopite at high temperatures and heat-treated Fe-rich phlogopite: The influence of the O,OH,F site. Can Mineral 37:711-720
Sanz J, Serratosa JM (1984) 29Si and 27Al high-resolution MAS-NMR spectra of phyllosilicates. J Am Chem Soc 106:4790-4793

448 Guidotti & Sassi
Sassi FP, Guidotti CV, Rieder M, De Pieri R (1994) On the occurrence of metamorphic 2M1 phengites: some thoughts on polytypism and crystallization conditions of 3T phengites. Eur J Mineral 6:151-160
Schmidt MW (1996) Experimental constraints on recycling of potassium from subducted oceanic crust. Science 272:1927-1930
Schmidt MW, Dugnani M, Artioli G (2001) Synthesis and characterization of white micas along the join muscovite-aluminoceladonite. Am Mineral 86:555-565
Smyth JR, Jacobson SD, Swope RJ, Angel RJ, Arlt T, Domanik K, Holloway JR (2000) Crystal structures and compressibilities of synthetic 2M1 and 3T phengite micas. Eur J Mineral 12:955-963
Spear F S (1993) Metamorphic Phase Equilibria and Pressure-Temperature-Time Paths. Washington, DC: Mineralogical Society of America Monograph, 799 p
Stöckhert B (1985) Compositional control on the polymorphism (2M1-3T) of phengitic white mica from high pressure parageneses of the Sesia Zone (lower Aosta Valley, Western Alps; Italy). Contrib Mineral Petrol 89:52-58
Symmes GH (1986) The thermal expansion of natural muscovite, paragonite, margarite, pyrophyllite, phlogopite, and two chlorites: The significance of high T/P volume studies on calculated phase equilibria. B.A. thesis, Amherst College, Amherst, Massachusetts.
Takeda H, Morosin B (1975) Comparison of observed and predicted structural parameters of mica at high temperature. Acta Crystallogr B31:2444-2452
Thompson JB Jr (1957) The graphical analysis of mineral assemblages in pelitic schists. Am Mineral 42:842-858
Thompson JB Jr (1961) Mineral facies in pelitic schists (in Russian with English summary) In Sokolov GA (ed) Physico-chemical Problems of the Formation of Rocks and Ores. Akad Nauk SSSR, Moscow, p 313-325
Thompson JB Jr, Thompson AB (1976) A model system for mineral facies in pelitic schists. Contrib Mineral Petrol 58:243-277
Topor L, Navrotsky A (1992) Advances in Calorimetric Techniques for High Pressure Phases. In Syono Y, Manghnani M (eds) High Pressure Research: Application to Earth and Planetary Sciences. Tena Publishing Co, Tokyo, Japan, and Am Geophys Union, Washington, DC, p 71-76
Valley JW, Peterson EV, Essene EJ, Bowman JR (1982) Fluorphlogopite and fluortremolote in Adirondack marbles and calculated C-O-H-F fluid composition. Am Mineral 67:545-557
Vaughn M T, Guggenheim S (1986) Elasticity of muscovite and its relationship to crystal structure. J Geophys Res 91:4657-4664
Velde B (1965) Phengitic micas: Synthesis, stability, and natural occurrences. Am J Sci 263:886-913 Velde B (1965b) Experiment determination of muscovite polymorph stabilities. Am Mineral 50:436-449 Velde B (1967) Si+4 content of natural phengites. Contrib Mineral Petrol 14:250-258 Velde B (1967) Quelques observations sur la teneur en Aluminum des biotites, phengite, et chlorites dans
les schistes cristallins. Bull Soc fr Minéral Cristallogr 40:356-363 Velde B (1980) Cell dimensions, polymorph type and infrared spectra of synthetic white micas: the
importance of ordering. Am Mineral 65:1277-1282 White RW, Powell R, Holland T, Worley BA (2000) The effects of TiO2 and Fe2O3 on metapelitic
assemblages at greenschist and amphibolite facies conditions: mineral equilibria calculations in the system K2O-FeO-Al2O3-SiO2-H2O-Fe2O3. J Metamorph Geol 18:497-511
Wilson CJL, Bell IA (1979) Deformation of biotite and muscovite: optical microstructure. Tectonophys 58:179-200
Zen E-An, Albee AL (1964) Coexistent muscovite and paragonite in pelitic schists. Am Mineral 49: 904-925

1529-6466/02/0046-0010$05.00 DOI:10.2138/rmg.2002.46.10
10 Modal Spaces for Pelitic Schists James B. Thompson, Jr.
Department of Earth and Planetary Sciences Harvard University
Cambridge, Massachusetts 02138 [email protected]
INTRODUCTION
Modal space is unconventional and still unfamiliar to most readers. Some historical remarks with reference to earlier papers are therefore necessary. Modal spaces, then called “net-transfer reaction spaces” were firs t introduced by myself, with Jo Laird and Alan Thompson (Thompson et al. 1982; see also Thompson 1981, 1982a,b), as an aid in understanding the metamorphism of mafic rocks over a wide range of pressures and temperatures. As viewed in retrospect, that paper was overly concerned with the accessible limits of such a space as determined by the bulk composition of a given assemblage, and was too little concerned with the fact that these spaces also contain an array of isopleths. The isopleths provide useful information on variations in modal abundance of the mineral phases involved. The orientations of such isopleths depend only on the stoichiometry of the reactions selected as basis vectors, and are thus independent of the bulk composition of a given assemblage. As a consequence of our early emphasis, the spaces we presented have been regarded as useful primarily in the study of mafic rocks lying within a highly limited range of bulk composition.
In some of my later papers, including this one, I have introduced some simplifications in methodology and tried to emphasize the wider utility of the concept. The name “modal space” was introduced in a vol ume dedicated to the memory of Paul Niggli (Thompson 1988), and the idea was extended further, but still with emphasis on mafic rocks, in a volume dedicated to Hugh Greenwood (Thompson 1991). An extension to (mainly peraluminous) quartzo-feldspathic rocks was presented at the Korzhinskii symposium in Moscow in 1999, and has recently been published (Thompson 2000). The method presented is applicable to a wide range of metamorphosed quartzo-feldspathic rocks that may be of either igneous or sedimentary origin. Because many of these have mineral assemblages that have much in common with those of mica schists it is readily possible, herein, to extend the treatment so as to include pelitic schists.
To construct a modal space the composition of each mineral must be expressed in terms of a single additive component as suggested by W.L. Bragg (1937, p. 37-40), and illustrated below. All possible variations therefrom can be shown by means of exchange components (sometimes called exchange vectors). It is then the amount of the additive component that monitors the modal abundance of each mineral as the net-transfer reactions in which it is involved proceed. It is highly advantageous to select the additive components so that they lie, collectively, in as simple a composition space as possible. Certain of the exchange components of the minerals in the assemblage may also be found to lie in the simple space selected. These and the additive components may then be used to obtain an independent set of net-transfer reactions that can produce all possible variations in modal abundance that are consistent with known variations in mineral stoichiometry. Algebraic procedures, such as a Gauss-Jordan reduction, that will provide such a set have been given elsewhere (see especially Thompson 1982b, p. 34-35, and references therein, also Thompson 1991, p. 618-619). Two examples are given in the Appendix to this paper. It is of interest that for each pair of AFM phases, coexisting with quartz and muscovite, there is but one net-transfer equation, giving a one-dimensional modal space. For each set of three AFM minerals there are two independent net-transfers,

450 Thompson
giving a two-dimensional modal space, and for each set of four (often taken as isograd assemblages) there are three, giving a three-dimensional modal space.
Micas play a major role in the metamorphism of both quartzo-feldspathic rocks and mica schists. They can provide the substance for other minerals, and for a variety of mineral assemblages, as can be seen in the preceding paper (Thompson 2000, Eqns. 1a, 1b, and 2a, also Fig.6), showing that a selected dioctahedral mica can yield assemblages with quartz, alkali feldspar, trioctahedral mica, chlorite and garnet. Micas may also, through their exchange capacity (especially when they are abundant), facilitate modal changes among other minerals that leave the total amount of mica unchanged.
NOTATIONS AND CONVENTIONS Modal spaces for some common pelitic schist assemblages characteristic of the
lower grades of metamorphism will be presented below. The minerals involved will be quartz, dioctahedral mica, trioctahedral mica, chlorite (14-Å), garnet, and chloritoid. The formulas of the additive components for these will, to save space, be written in the equations as: Qtz, Dim, Bio, Chl, Gar, and Ctd, respectively. The additive components may then all be chosen so as to lie in the space defined by: K2O-MgO-Al2O3-SiO2-H2O, as follows:
Qtz = SiO2 Dim = KMgAl(Si4O10)(OH)2 Bio = KMg3(AlSi3O10)(OH)2 ` Chl = Mg5Al(AlSi3O10)(OH)8 Gar = Mg3Al2Si3O12 Ctd = MgAl2SiO5(OH)2
Dioctahedral mica, biotite and chlorite all show the Tschermak substitution, tk: Al2Mg-1Si-1 or its inverse. For each the known or probable low-tk (or tk-) limit has been taken as the additive component. The probable high-tk (or tk+) limits are taken as follows:
Dim + tk = KAl2(AlSi3O10)(OH)2 Bio + tk = KMg2Al(Al2Si2O10)(OH)2 Chl + tk = Mg4Al2(Al2Si2O10)(OH)8
The abbreviations for the additive components are similar in many ways to the mineral abbreviations proposed by Kretz (1983), but here perform a different role in that each stands for a specific chemical formula, that for the additive component selected, rather than for the mineral as a whole. The mineral may differ greatly in composition from that of the additive component. The Kretz abbreviation, Ms, for dioctahedral mica, for example, brings to mind the composition (Dim + tk), rather than Dim which can cause confusion in the following discussions.
The formula Dim is that of an idealized Al-celadonite, Bio is that of an idealized phlogopite, and Chl is that of an idealized clinochlore. (Dim + tk) is, of course, the idealized muscovite formula; (Bio + tk) is that of an idealized “eastonite,” and (Chl + tk) is that of an idealized corundophyllite. The last two are taken as the extreme tk+ limits on the basis of the aluminum avoidance rule. The choice of the clinochlore formula as the tk- limit makes good crystallo-chemical sense for 14-Ångström chlorites, the ones found in pelitic schists. The original chlorite structure described by Pauling (1930) was, in fact, that of a clinochlore found in a blackwall skarn in close proximity to a lizardite-bearing serpentinite near Chester, Vermont, U.S.A. The idealized lizardite formula may be taken

Modal Spaces for Pelitic Schists 451
as Mg3Si2O5(OH)4 or Liz. Chl (equivalent to 2 Liz + tk) is thus quite probably the tk- limit for the 14- Ångström chlorites found in metapelites.
In ordinary crustal metapelites garnets do not show a Tschermak-type of substitution, but at ultra-high pressures, where silicon may enter octahedral sites, “majoritic” garnets are found. Taking Mg 4Si4O12 as Maj we would then have (Maj + tk) as chemically equivalent to Gar, then at the tk+ limit. We shall confine our attention here, however, to rocks with non-majoritic garnets.
THE ASSEMBLAGE QUARTZ-MUSCOVITE-BIOTITE-CHLORITE-GARNET
This is the most widely distributed assemblage in garnet-zone pelitic schists (see Fig. 6a for an AFM representation). Using the methods shown in the Appendix, the following net-transfer equations may be obtained:
[Gar] 3 Dim + Chl = 3 Bio + tk + 7 Qtz + 4 H2O (1) [Bio, Dim] 2 Chl + 4 Qtz + tk = 3 Gar + 8 H2O (2) [Chl, H2O] 2 Dim + Gar = 2 Bio + tk + 6 Qtz (3)
Equation (1) leaves Gar unaltered as indicated by the bracketed symbol to the left. It is therefore the vector for the Gar or garnet isopleths in modal space. Equation (2) leaves both Dim and Bio unaltered and is therefore the vector for the isopleths for both dioctahedral and trioctahedral micas. Equation (3) may be obtained by eliminating either H2O or Chl using the first two, and is therefore not independent of them. For the quartz isopleths we may eliminate Qtz, using any two of the above equations, obtaining:
[Qtz] 4 Dim + 6 Chl + tk = 4 Bio + 7 Gar + 24 H2O (4)
We may obtain the equation for the tk- limit by eliminating tk by adding Equations (2) and (3),and dividing by two, obtaining (where all layer silicates are at their tk- limits):
[tk-] Dim + Chl = Bio + Gar + Qtz + 4 H2O (5) We may obtain the equations for the tk+ limit by subtracting equation (3) from
Equation (2), and dividing by two, obtaining: [tk+] Bio + Chl + tk + 5 Qtz = Dim + 2 Gar + 4 H2O (6)
Note that equation 6 is unaffected by adding one tk to both sides, thereby making it apparent that all three of the layer silicates can be at their tk+ limits. Equation (6) also corrects a typo in my earlier paper (Thompson 2000, Eqn. 5c, which should have had only one tk on the left-hand-side).
No more than two of the above six equations may be taken as independent. The modal space is therefore two-dimensional. Any two may be selected as basis vectors. The two selected may be chosen as seems most convenient for the matter at hand. The unit advancements on the basis vectors may also be chosen as convenient. In Thompson et al. 1982 the unit advancement was based on the number of oxyequivalents transferred, left-to-right, in the equations. In my later papers the unit advancement has been taken as simply the equation as written. In some instances, however, an illustration may be improved by multiplying or dividing the coefficients of an equation by integers that may be regarded as weighting factors that change the unit advancement on that vector equation.
The triangle of Figure 1 has been constructed using Equations (4) and (3) as basis vectors, set orthogonally. Isopleths on chlorite and H2O-content are then parallel to the vector of Equation (3), and the quartz isopleths are parallel to the vector of Equation (4). If the equations, as written above, are take taken as unit advancements it will then be

452 Thompson
found that the unit advancement on (4) is much too great as compared with that on (3), producing a diagram that is highly elongate on (3) and highly compressed on (4). This may be fixed by either dividing (4) by a weighting factor of six or by multiplying (3) by six. Either weighting has the same effect. With this weighting the slopes of the Gar and of the Bio (and Dim) isopleths are 7/6 and -1/3, respectively, as shown in Figure 1, whereas, unweighted, these would be 7 and -2, respectively.
A bulk composition was selected for vertex A so as to allow Reactions (1) and (2) to
eliminate all chlorite. The chlorite-free vertices B and C are then linked by Equation (3), and their content is determined by the action of Equations (1) and (2), respectively, starting from the composition at A. This displays the accessible part of the modal space as a triangle bounded by the zero isopleths for chlorite, biotite and garnet. The zero isopleth for Bio is also the maximum isopleth for Dim, the zero isopleth for which passes through vertex B. The triangle of Figure 1 is essentially identical to one of the potassic feldspar isopleths (here a zero isopleth) shown in my earlier paper (Thompson 2000, Fig. 9). The vectors parallel to the edges of the potassic feldspar isopleths are the same as those parallel to the edges of the triangle in Figure 1.
The first three of the above equations deserve some special comment. Equation (1) is the principal one active in the biotite zone, and accounts for the large amounts of secondary quartz produced as pods and veinlets in these low-grade rocks. Equation (2), left-to-right, replaces 36 oxyequivalents of chlorite with 36 oxyequivalents of garnet, at the same time converting 8 oxyequivalents of quartz by 8 oxyequivalents of H2O, which is then lost. Proceeding right-to-left Equation (2), acting alone, can form partial or full pseudomorphs of chlorite after garnet, as the rock rehydrates, the extra quartz produced probably added to that in the strain shadows. The role of the micas in this reaction is in providing more tk exchange-capacity than would be available from chlorite alone.
Figure 1. Modal space for the AFM assemblage: chlorite-biotite-garnet. Basis vectors are Equations (4), weighted one-sixth, and (3), unweighted. The assemblage at vertex A is 6 Dim, 2 Chl, 1 tk, 4 Qtz; that at vertex B is 6 Bio, 3 tk, 18 Qtz, 8 H2O lost; and that at vertex C is 6 Dim, 3 Gar, 8 H2O lost. Qtz isopleths are horizontal, parallel to the vector of Equation (4). Isopleths for Chl and H2O are vertical, parallel to the vector of Equation (3) and edge BC. Gar isopleths are parallel to the vector of Equation (1) and edge AB. Dim and Bio isopleths are parallel to the vector of Equation (2) and edge AC.

Modal Spaces for Pelitic Schists 453
Because the micas are so abundant in most pelites they, and the chlorite, would show only minor shifts in composition as the reaction proceeds.
Equation (3) is also of special interest in that no H2O is involved, and hence the activity of H2O is not a factor in achieving equilibrium on this vector. Total mica remains constant with very little change in volume in converting di- to trioctahedral and vice versa. 12 oxyequivalents of garnet on the left, however, are replaced by 12 oxyequivalents of quartz on the right with a considerable increase in volume. Adding one tk to both sides would make the dioctahedral mica a typical phengite, and the trioctahedral mica on the right an “eastonite.” High pressure would clearly favor the left side. Di-tri substitution in either mica could change the modal ratios of the two micas, but would leave their total and the other isopleths unaffected.
Varying the bulk composition can change the numerical values of the isopleths but not their relative orientations. These are controlled by stoichiometry, and by the choice, and weighting, of the basis vectors. Adding silica to the bulk composition would simply increase the labels on the quartz isopleths. Decreasing silica, however, would mean that the zero isopleth for quartz would truncate the triangle on a line just north of vertex C which lies upon the zero isopleth for quartz in the initial bulk composition. Truncation of the physically accessible portions of a modal space must obviously occur at any zero isopleths that are encountered.
Truncation may also occur if all mineral phases are at an extreme exchange limit. For the bulk composition chosen for Figure 1, the assemblage at vertex C is at its tk- exchange limit. Less tk would therefore cause truncation by vectors parallel to that of Equation (5). Adding three tk ,to each vertex, would convert the Bio at vertex B to “eastonite,” the tk+ limit. More tk than that would cause truncation by vectors parallel to that of Equation (6). The triangle of Figure 2 is that of Figure 1, but showing possible truncations by exchange limits rather than showing isopleths. The bulk composition for Figure 1 has a minimal content of Dim, just enough to show the entire triangle, but one that places the layer silicates at the vertices at or near their tk exchange limits. By adding 12 Dim + 9 tk to the bulk composition of Figure 1, for example, the appearance of the triangle is unchanged, but none of the layer silicates at the vertices is then close to a tk exchange limit. Vertex B is then no longer on the zero isopleth for Dim, and the micas there could have the classical muscovite and biotite formulas. Those at vertices A and C would be typical phengites.
In a modal space of two or more dimensions the assemblage should not in general be expected to follow a straight-line path described by a single simple equation. Much more likely is a curved path to the right (in Fig.1), during prograde metamorphism, and a curved path to the left, during retrograde metamorphism. The actual path followed, or part of it, may be revealed by textural features. Conversely, examination of the modal space may suggest textural features to be sought in the thin section. Polymetamorphic paths involving more than one cycle should be of special interest.
Retrograde paths record some of the latest history of an assemblage, and are often revealed by textural features that have not had to survive prolonged recrystallization and textural re-equilibration. Consider, for example, a path parallel to edge AC, implied by an assemblage where biotite is unaltered but garnet is rimmed by chlorite, as contrasted with a path parallel to edge AB implied by an assemblage in which the garnets are unaltered but the biotites are partially chloritized. Consider, further, the intermediate paths implied by chloritization of both garnet and biotite in varying proportions.
At least three points need emphasis. The first is that exchange components such as FeMg-1, FeAl-1, KNa-1, and others involving less abundant elements, and the effects of the exchange reactions related to them, are totally invisible in modal space. A aaaaaaaaaaa

454 Thompson
consequence of this is that rocks that are quite distinct, chemically, may have identical modal spaces. An assemblage containing pure ferrous end-members, for example, would be geometrically identical to Figure 1, as would be anything between. The second point is that nothing in the construction of a modal space requires consideration of thermodynamic equilibrium, something touched upon only briefly in the above discussion of volume changes. The third point is that because all parts of modal spaces may be crystallochemically plausible does not mean that they may ever be occupied by real assemblages, even disequilibrium ones. Ordinary pelites, for example, may rarely, if ever, approach the tk+ limits selected here. One of the principal uses of modal space is probably in petrographic interpretation and the light it casts upon reaction history. Another use is in simplifying the thermodynamic formulation of equilibrium conditions, but that must be the subject of another paper, more extensive than this one.
THE ASSEMBLAGE QUARTZ-MUSCOVITE-CHLORITE-GARNET-CHLORITOID
This is the principal assemblage (see Fig. 6a below) in chloritoid-bearing schists or phyllites. Equation (2), above, is also applicable to this assemblage inasmuch as biotite is not involved. Others of interest (see Appendix) are:
[Dim, Chl, Qtz] 2 Ctd = Gar + tk + 2 H2O (7)
[Dim, Gar] Chl + 2 tk + 2 Qtz = 3 Ctd + H2O (8) [Dim, H2O] 8 Ctd = 2 Chl + 5 tk + Gar + 4 Qtz (9) [Dim, tk-] Chl + Ctd + 2 Qtz = 2 Gar + 5 H2O (10) [Dim, tk+] Chl + tk + 2 Qtz = Gar + Ctd + 3 H2O (11)
Figure 2. The modal space of Figure 1 showing H2O isopleths (vertical), and possible truncations at the exchange limits tk- (gentle positive slopes), and tk+ (steeper negative slopes). Assemblages at vertices are as in Figure 1.

Modal Spaces for Pelitic Schists 455
The left side of Equation (9), analogous to Equation (3), is probably the low-volume side favored by high pressure. Dioctahedral mica here plays a passive role in that its modal abundance (in oxyequivalents) does not change, but it does provide tk exchange-capacity. Both it and the chlorite are high-tk varieties relative to those in the biotite-bearing assemblages. Figures 3a and 3b correspond, for this assemblage, to Figures 1 and 2 for the preceding one. Figure 3 has been constructed using Equations (7), unweighted, and Equation (9), weighted three-fourths, as basis vectors.
ASSEMBLAGES CONTAINING CHLORITOID AND BIOTITE AFM assemblages containing chloritoid apparently coexisting with biotite are rare
but by no means unknown. They clearly deserve further study. The associated assemblages with three AFM phases are those with chloritoid-biotite-garnet and chloritoid-biotite-chlorite. The relationship, however, of these last to the more common assemblages discussed above may be displayed by considering, briefly, the three-dimensional modal space for quartz-muscovite-biotite-garnet-chlorite. To explore this space fully it is convenient to consider an array of 22 equations, 11 of which have already been presented. The full array is shown in Table 1. No more than three of these equations may be taken as independent. The tetrahedron of Figure 4 has been constructed using Equation (7), weighted two, and Equation (3), unweighted, and Equation (18) as basis vectors. The weighting of Equation (18) is irrelevant inasmuch as the view of the tetrahedron is projected along it. In Figure 4 the quartz isopleths are then east-west, vertical, and those of the other mineral phases are parallel to the tetrahedral faces. Isopleths on H2O-content are north-south vertical. Possible truncations of the tetrahedron at the exchange limits tk- and tk+ are shown in Figures 5a and 5b, respectively.
The face BCD, the base of the tetrahedron of Figure 4, contains the two-dimensional modal space for the chlorite-free sub-assemblage containing chloritoid, biotite and garnet. The relevant equations for drawing isopleths and exchange limits are Equations (3) and (7) and the following two:
[Chl, Gar] Dim + Ctd = Bio + tk + 3 Qtz + H2O (12) [Chl, tk-, tk+] Bio + Ctd = 3 Qtz + Dim + Gar + H2O (13)
The space may be constructed as above using Equation (7), weighted two, and Equation (3), unweighted, as basis vectors. A curious feature of this space is that
Figure 3. The modal space for the AFM assemblage chlorite-chloritoid-garnet. Basis vectors are Equations (7), unweighted, and (9), weighted three-fourths. The vertex assemblage at A is 4 Dim, 2 Chl, 4 tk, 4 Qtz; at C it is 4 Dim, 3 tk, 3 gar, 8 H2O lost; and at D it is 4 Dim, 6 Ctd, 2 H2O lost. Mineral isopleths are shown in Figure 3a, and exchange limits in Figure 3b.

456 Thompson
truncations by the exchange limits, tk- and tk+, are both oriented parallel to the vector of Equation (13).
Table 1. The equations are for the three-dimensional model space described in the text and its two-dimensional sub-assemblages. The bracketed symbols in the last column indicate the variables that are not involved in the equation to the left. The next-to-left column shows that all other equations may be regarded as linear combinations of any three independent ones, such as Equations (2), (3) and (7)
(1) 3 Dim + Chl = Bio +tk + 7 Qtz + 4 H20 (a+3b) [Gar, Ctd]
(2) 2 Chl + 4 Qtz +tk = 3 Gar + 8 H20 (a) [Dim, Bio, Ctd]
(3) 2 Dim + Gar = 2 Bio + tk + 6 Qtz (b) [Chl, Ctd, H20]
(4) 4 Dim + 6 Chl + tk = 4 Bio + 7 Gar + 24 H20 (3a+2b) [Ctd, Qtz]
(5) Dim + Chl = Bio + Gar + Qtz + 4 H20 (a+b) [Ctd, tk-]
(6) Bio + Chl + tk + 5Qtk = Dim + 2 Gar +4 H20 (a-b) [Ctd, tk+
(7) 2 Ctd = Gar + tk + 2 H20 (c) [Dim, Bio, Chl, Qtz]
(8) Chl + 2 tk + 2 Qtz = 3 Ctd + H20 (a-3c) [Dim, Bio, Gar]
(9) 8 Ctd = 2 Chl+ 5 tk + Gar + 4 Qtz (4c-a) [Dim, Bio, H20]
(10) Chl + Ctd + 2 Qtz = 2 Gar +5 H20 (a+c) [Dim, Bio, tk-]
(11) Chl +tk + 2 Qtz = Gat + Ctd + 3 H20 (a-c) [Dim, Bio, tk+}
(12) Dim + Ctd = Bio +tk +3 Qtz + H20 (c+b) [Chl, Gar]
(13) Bio + Ctd +3 Qtz = Dim +Gar + H20 (c-b) [Chl, tk-, tk+]
(14) 2 Dim + 3 Chl + 4 tk = 2 Bio + 7 td + 5 H20 (3a+2b-7c) [Gar Qtz]
(15) Dim + 4 Ctd = Bio + Chl + 3 tk + 5 Qtz (a-b-4c) [Gar, H20]
(16) 2 Dim + Chl = 2 Bio + Ctd + 4 Qtz + 3 H20 (a+2b-c) [Gar, tk-]
(17) Dim + Chl + tk + Bio + 2 Ctd + Qtz + 2 H20 (a+b-2c) [Gar, tk+]
(18) 4 Dim + 6 Chl + 13tk + 5 Gar = 4 Bio +24 Ctd (3a+2b-21c) [Qtz, H20]
(19) 2 Dim + 3 Chl + Ctd = 2 Bio + 4 Gar + 13 H20 (3a+2b+c) [Qtz, tk-]
(20) 2 Dim + 3Chl + 3 tk =2 Bio + Gar + 5 Ctd+7 H20 (3a=2b-5c) [Qtz, tk+]
(21) 5 Dim + Chl + 3 Gar = 5 Bio + 4 Ctd + 13 Qtz (a+ 5b-4c) [H20, tk-]
(22) 3 Dim + Chl + tk + 2 Gar = 3 Bio + 4 Ctd + 7 Qtz (a+3b-4c) [H20, tk+]
The face ABD of the tetrahedron of Figure 4 contains the two-dimensional modal
space for the garnet-free sub-assemblage. Equations: (1), (8), and (12) are all relevant to this sub-assemblage. This space may be constructed, as seen in the projection of Figure 4, by using the following equations as basis vectors:
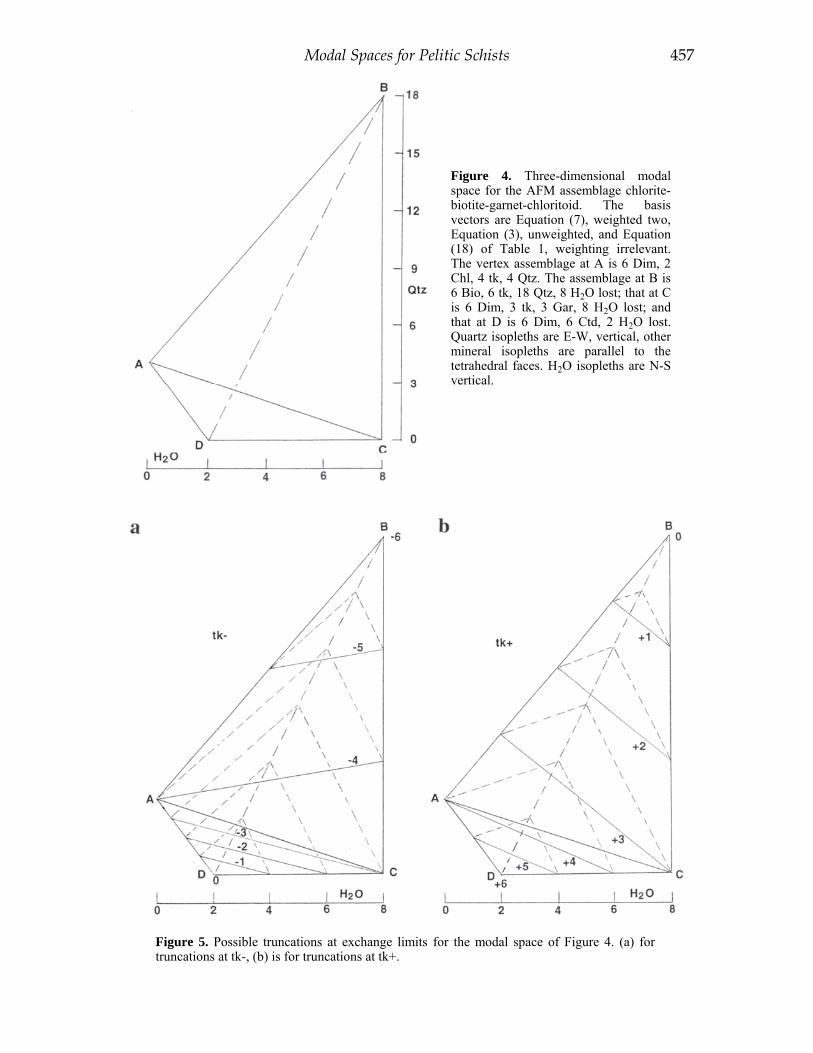
Modal Spaces for Pelitic Schists 457
Figure 4. Three-dimensional modal space for the AFM assemblage chlorite-biotite-garnet-chloritoid. The basis vectors are Equation (7), weighted two, Equation (3), unweighted, and Equation (18) of Table 1, weighting irrelevant. The vertex assemblage at A is 6 Dim, 2 Chl, 4 tk, 4 Qtz. The assemblage at B is 6 Bio, 6 tk, 18 Qtz, 8 H2O lost; that at C is 6 Dim, 3 tk, 3 Gar, 8 H2O lost; and that at D is 6 Dim, 6 Ctd, 2 H2O lost. Quartz isopleths are E-W, vertical, other mineral isopleths are parallel to the tetrahedral faces. H2O isopleths are N-S vertical.
Figure 5. Possible truncations at exchange limits for the modal space of Figure 4. (a) for truncations at tk-, (b) is for truncations at tk+.

458 Thompson
[Gar Qtz] 2 Dim + 3 Chl + 4 tk = 2 Bio + 7 Ctd + 5 H2O (14) [Gar, H2O] Dim + 4 Ctd = Bio + Chl + 3 tk + 5 Qtz (15)
In the construction of face ABD Equation (14) is weighted two-thirds, and Equation (15) is unweighted. The equations for the exchange limits in this sub-assemblage are Equations (16) and (17) in Table 1.
The four two-dimensional spaces considered so far thus correspond directly to the faces of the tetrahedron of Figure 4. They also appear in a more familiar AFM representation in Figures 6, the first two in Figure 6a and the latter two in Figure 6b. The AFM diagrams, however, have some claim to being equilibrium diagrams. The major exchange component, FeMg-1 is taken into account directly, and others such as NaK-1 are implicitly taken into account in that a buffering phase such as, for example, paragonite is often present. The full assemblage of Figure 4 would then be, approximately, an isograd assemblage, divariant in terms of pressure, temperature, and activity of H2O. Figure 6b would then be the higher-grade assemblage owing to the more restricted range of compositions showing chlorite, the most hydrous of the minerals involved. This appears to be so in that at least one occurrence of the Figure 6b configuration occurs near a staurolite isograd marked by the appearance of staurolite with biotite, further restricting the presence of chlorite. What the AFM representation does not show is that the possible net-transfer reactions in the isograd assemblage are in a three-dimensional modal space!
OTHER MODAL SPACES Some of the first possible appearances of chloritoid in prograde metamorphism may
be found in the presence of quartz, chlorite, and pyrophyllite, often with muscovite and paragonite. Such ultra high-alumina assemblages, however, are rare. Known and likely terranes include pelites associated with quartzites and quartz conglomerates resulting from prolonged weathering (Witwatersrand Conglomerate of South Africa, Clough Formation of New Hampshire, U.S.A.). or pelites probably derived from ocean floor clays associated with mafic volcanism (Taconic and Green Mountains of Vermont, mapped in less aluminous rocks on the basis of the appearance of staurolite-biotite. Staurolite-garnet pairs, further, isolate chloritoid which then survive mainly as inclusions in garnet. A widespread sillimanite zone assemblage is quartz-muscovite-biotite-garnet-sillimanite. The modal space for it is easily treated by the methods outlined above and in the Appendix, but has some surprises.
Other minerals in mica schists include ferromagnesian carpholites, found in very high-pressure occurrences, and sudoite, which may be more abundant than so far recognized. Sudoite, interestingly, is related to cordierite much as chlorite is related to garnet, and may appear in pinite alterations of cordierite. The water in many cordierites, incidentally, should be treated as an exchange component rather than as part of the additive component. It arises by means of an H2O-vacancy substitution that does not alter the number of formula units of cordierite. There are also other minerals, structurally related to cordierite, that occur in some assemblages. Much remains to be done!
ACKNOWLEDGMENTS I am grateful to Jo Laird, Alan B. Thompson, Stefano Poli, C. Page Chamberlain,
John T. Cheney, and John L. Rosenfeld for extensive discussions on this and related topics over the past two decades. I am especially grateful to reviewers Charles V. Guidotti and Stefano Poli for urging that my explanations for novel and unconventional concepts be made less cryptic, and that these explanantions should be less dependent on the treatments in earlier papers that may not be readily accessible to many readers.

Modal Spaces for Pelitic Schists 459
Figure 6. Schematic AFM projections of assemblages discussed in text. Figure 6a shows those appearing on the top of the tetrahedron of Figure 4, and Figure 6b shows those appearing on the under side. The full assemblage of Figure 4 would occur at the isogradic (?) crossover from Figure 6a to Figure 6b, the latter almost certainly representing the higher grade.
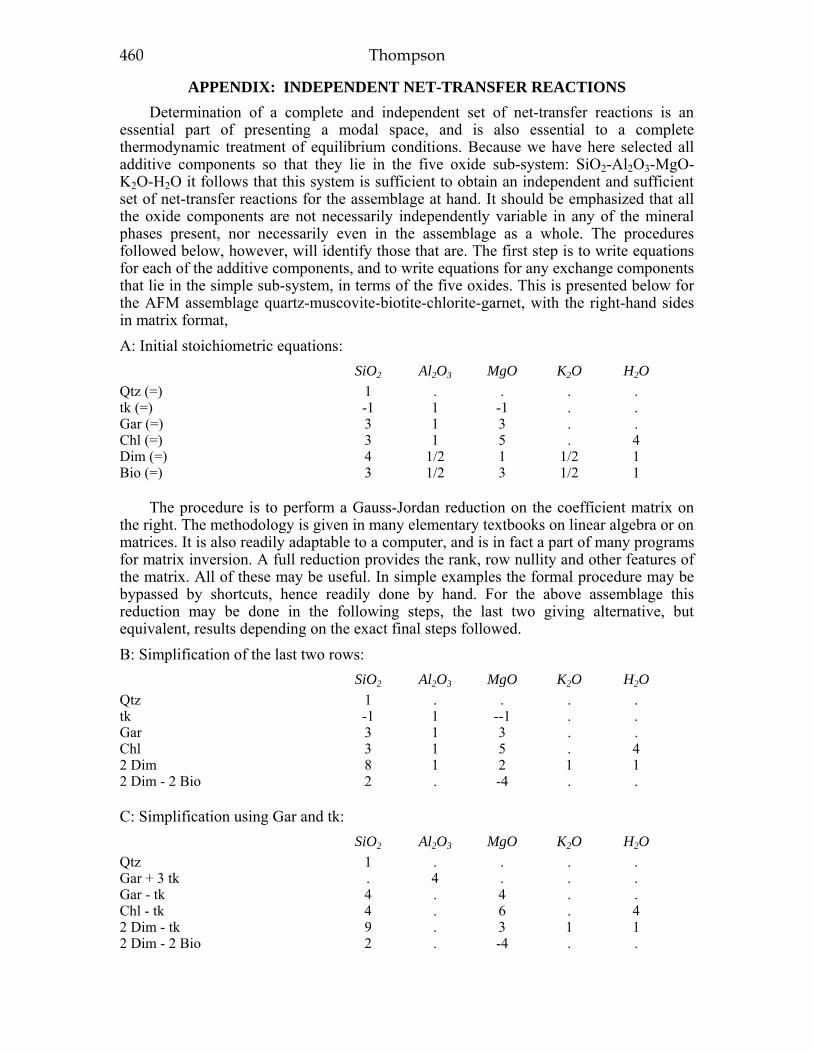
460 Thompson
APPENDIX: INDEPENDENT NET-TRANSFER REACTIONS Determination of a complete and independent set of net-transfer reactions is an
essential part of presenting a modal space, and is also essential to a complete thermodynamic treatment of equilibrium conditions. Because we have here selected all additive components so that they lie in the five oxide sub-system: SiO2-Al2O3-MgO-K2O-H2O it follows that this system is sufficient to obtain an independent and sufficient set of net-transfer reactions for the assemblage at hand. It should be emphasized that all the oxide components are not necessarily independently variable in any of the mineral phases present, nor necessarily even in the assemblage as a whole. The procedures followed below, however, will identify those that are. The first step is to write equations for each of the additive components, and to write equations for any exchange components that lie in the simple sub-system, in terms of the five oxides. This is presented below for the AFM assemblage quartz-muscovite-biotite-chlorite-garnet, with the right-hand sides in matrix format, A: Initial stoichiometric equations: SiO2 Al2O3 MgO K2O H2O Qtz (=) 1 . . . . tk (=) -1 1 -1 . . Gar (=) 3 1 3 . . Chl (=) 3 1 5 . 4 Dim (=) 4 1/2 1 1/2 1 Bio (=) 3 1/2 3 1/2 1
The procedure is to perform a Gauss-Jordan reduction on the coefficient matrix on the right. The methodology is given in many elementary textbooks on linear algebra or on matrices. It is also readily adaptable to a computer, and is in fact a part of many programs for matrix inversion. A full reduction provides the rank, row nullity and other features of the matrix. All of these may be useful. In simple examples the formal procedure may be bypassed by shortcuts, hence readily done by hand. For the above assemblage this reduction may be done in the following steps, the last two giving alternative, but equivalent, results depending on the exact final steps followed. B: Simplification of the last two rows: SiO2 Al2O3 MgO K2O H2O Qtz 1 . . . . tk -1 1 --1 . . Gar 3 1 3 . . Chl 3 1 5 . 4 2 Dim 8 1 2 1 1 2 Dim - 2 Bio 2 . -4 . . C: Simplification using Gar and tk: SiO2 Al2O3 MgO K2O H2O Qtz 1 . . . . Gar + 3 tk . 4 . . . Gar - tk 4 . 4 . . Chl - tk 4 . 6 . 4 2 Dim - tk 9 . 3 1 1 2 Dim - 2 Bio 2 . -4 . .

Modal Spaces for Pelitic Schists 461
D: Simplification using Qtz (also rows 4 and 5 interchanged): SiO2 Al2O3 MgO K2O H2O Qtz 1 . . . . Gar + 3 tk . 4 . . . Gar - tk - 4 Qtz . . 4 . . 2 Dim - tk - 9 Qtz . . 3 1 2 Chl - tk- 4 Qtz . . 6 . 4 2 Dim -2 Bio - 2 Qtz . . -4 . . E1: Final result using method (1): SiO2 Al2O3 MgO K2O H2O Qtz 1 . . . . Gar + 3 tk . 4 . . . Gar - tk - 4 Qtz . . 4 . . 4 Dim - Chl - tk - 14 Qtz . . . 4 . 3 Dim + Chl - 3 Bio - tk - 7 Qtz . . . . 4 2 Dim + Gar - 2 Bio - tk - 6 Qtz . . . . . E2: Final result using method (2): SiO2 Al2O3 MgO K2O H2O Qtz 1 . . . . Gar + 3 tk . 4 . . . Gar - tk - 4 Qtz . . 4 . . 4 Dim - Chl - tk - 14 Qtz . . . 4 . 2 Chl + tk + 4 Qtz - 3 Gar . . . . 8 2 Dim + Gar - 2 Bio - tk - 6 Qtz . . . . .
Each of the first five equations in the final reductions shows that an oxide component can be expressed in terms of components that are independently variable in the assemblage. This means that each of these oxide components is itself independently variable in the assemblage. For the last equation, in both reductions, the right-hand-side is zero. It thus shows a linear dependence among the terms on the left, telling us that in this case, there is but one, unique, closed-system net-transfer reaction. For systems open to one of the oxide components such as H2O, there are also possible open-system net-transfer reactions such as those in the next-to-the-last line of both reductions. These are Equations: (1) and (2) in the text, and the closed system Equation is (3). Of these three equations any two may be taken as independent, and many others such as Equations (4), (5) and (6) may be obtained from any two of them by linear combination.
For the AFM assemblage quartz-muscovite-chlorite-garnet-chloritoid, we may omit Dim from the list inasmuch as here there is here no Bio to balance it (Dim is the only additive component involving K2O). Because many components are also shared with the first assemblage the reduction may be speeded up as shown below: A. Initial stoichiometric equations: SiO2 Al2O3 MgO H2O Qtz (=) 1 . . . tk (=) -1 1 -1 . Gar (=) 3 1 3 . Chl (=) 3 1 5 4 Ctd (=) 1 1 1 1

462 Thompson
B. Reduction using tk and Qtz: SiO2 Al2O3 MgO H2O Qtz 1 . . . Gar + 3 tk . 4 . . Gar - tk - 4 Qtz . . 4 . Chl - tk - 4 Qtz . . 6 4 Ctd - tk - 2 Qtz . . 2 1 C1: Final result using method (1): SiO2 Al2O3 MgO H2O Qtz 1 . . . Gar + 3 tk . 4 . . Gar - tk - 4 Qtz . . 4 . 2 Chl + tk + 4 Qtz - 3 Gar . . . 8 8 Ctd - Gar -2 Chl - 5 tk - 4 Qtz . . . . C2: Final result using method (2): SiO2 Al2O3 MgO H2O Qtz 1 . . . Gar + 3 tk . 4 . . Gar - tk - 4 Qtz . . 4 . 2 Ctd - Gar - tk . . . 2 8 Ctd - Gar -2 Chl - 5 tk - 4 Qtz . . . .
Here the rank is four, and the row nullity one, so that there is again but one, unique, closed-system reaction. The two open system reactions obtained are Equations (2) and (7) in the text, and the closed system reaction is Equation (9). Equations: (8), (10) and (11) may be obtained as linear combinations of any two of the others.
It is possible that the rank of the matrix may be less than the number of columns in the initial array, indicating a non-zero column nullity, and that the row-nullity may be zero (no possible closed system reaction), or greater than one. If the row nullity is greater than one there are closed system reactions equal in number to the row-nullity. These are, however not unique and may be altered by linear combination even though their number is fixed. The matrix for the assemblage quartz-muscovite-biotite-garnet-sillimanite is easily reduced, using the above examples as guides, but has some surprises!
REFERENCES Bragg WL (1937): Atomic Structure of Minerals, 1st Edn. Cornell University Press, 292 p Kretz R (1983): Symbols for rock-forming minerals. Am Mineral 68:277-279 Pauling L (1930): The structure of the chlorites. Proc Nat’l Acad Sci 16:578-582 Thompson JB Jr, Laird Jo, Thompson AB (1982) Reactions in amphibolite, greenschist and blueschist. J
Petrol 23:1-27 Thompson JB Jr (1981) An introduction to the mineralogy and petrology of the biopyriboles. Rev Mineral
9A:141-188 Thompson JB Jr (1982a) Composition space: An algebraic and geometric approach. Rev Mineral 10:1-31 Thompson JB Jr (1982b) Reaction space: An algebraic and geometric approach. Rev Mineral 10:33-52 Thompson JB Jr (1988): Paul Niggli and petrology: Order out of chaos. Schweiz mineral petrogr Mitt
68:243-256 Thompson JB Jr (1991) Modal space: Applications to ultramafic and mafic rocks. Can Mineral 29:615-632 Thompson JB Jr (2000): Modal spaces for some peraluminous quartzo-feldspathic rocks and mica schists.
Petrology 8:303-310 (English edn). Also printed in Petrologiya 8:339-346 (Russian edn, but this paper is in English). (Note Fig. 1 on p 305 of the Petrology version is incorrect. The corrected Fig. 1 is on p 341 of the Petrologiya version.)

1529-6466/02/0046-0011$05.00 DOI:10.2138/rmg.2002.46.11
11 Phyllosilicates in Very Low-Grade Metamorphism: Transformation to Micas
Péter Árkai Laboratory for Geochemical Research
Hungarian Academy of Sciences H-1112 Budapest, Budaoersi ut 45, Hungary
INTRODUCTION Phyllosilicates produced mostly by weathering of magmatic, metamorphic and
sedimentary rocks are widespread in the surficial and near-surface zones of the Earth's crust. These phyllosilicates display very fine grain sizes, disordered crystal structures, and greatly varying chemical compositions, and they represent structurally and chemically metasable phases. They are subjected to heat during diagenesis and concomitant metamorphism, which provides a long-life source of energy for transforming the metastable phases into thermodynamically more stable phases through a long series of partly continuous, partly discontinuous reactions. The present review summarizes some major mineralogical aspects of these processes, with special reference to petrogenetic applications.
Forty years have passed since the first petrogenetic application of the illite structural changes for characterizing diagenetic processes in sedimentary basins (Weaver 1960). Weaver’s “sharpness ratio” as well as Kübler’s (1964, 1968) empirical illite “crystal-linity” index, have been easy-to-use X-ra y powder diffraction (XRD) measures of the manifold, inter-related changes that the hydrous, mica-like phyllosilicates experience during increasing burial.
In the first two decades after the introduction of the illite “cryst allinity” concept, it was applied to metamorphic petrogenetic studies in certain areas of Europe (especially to the external fold and thrust belts of the European Alps, Variscides, etc.). These studies were the starting point of important further developments which include: awareness of the phyllosilicate transformations during deep burial in sedimentary basins (Hower et al. 1976; Inoue et al. 1990; Amouric and Olives 1991; Lanson and Champion 1991; Lindgreen and Hansen 1991; Eberl 1993; Huang et al. 1993;Whitney and Velde 1993; Huggett 1995; Elliott and Matisoff 1996; Nieto et al. 1996; Dong et al. 1997), and recognition of the nature of interstratified clay minerals (see Reynolds and Hower 1970). Moreover, using the theory of powder X-ray powder diffraction (e.g., Klug and Alexander 1974), it became evident that the mysterious increase in “cr ystallinity” (i.e., the supposed increase of periodic order of the crystal structure of illite) with increasing depth is actually caused, first of all, by the increase in mean crystallite size [i.e., the mean size of crystal domains that scatter X-rays coherently (Weber et al. 1976; Dunoyer de Segonzac and Bernoulli 1976; Árkai and Tóth 1983; Merriman et al. 1990; Nieto and Sanchez-Navas 1994; Drits et al. 1997)]. Crystallite size, especially at lower (diagenetic) grades, seems to be strongly controlled by the numbers of swelling interstratified layers.
In the 1980s, reviews and textbooks by Kisch (1983) and Frey (1987) summarized the illite “crystallinity” concept mostly from a petrogenetic point of view. Subsequently, the illite “crystallinity” method has been incr easingly and extensively applied all over the world as an empirical metamorphic petrological tool (for outstanding examples, see Merriman and Frey 1999). Simultaneously, studies to understand the mineral structural,
464 Árkai
chemical and rock-textural changes have been published in increasing number. The vast amount of new data that has accumulated in the last two decades on low-temperature metamorphism and late diagenesis inspired a recent review: “Low-Grade Metamorphism,” edited by Martin Frey and Doug Robinson (1999). Substantial parts in it, especially the chapter written by Merriman and Peacor (1999), deal with mineralogical aspects.
The summaries cited above are mainly petrologic. The present review focuses on mineralogical aspects and problems relating to phyllosilicate-transformation processes in the low-temperature realm, mainly on the basis of results achieved during the last 10-15 years. Special attention is also paid to emphasize the unresolved problems, controversies, future studies, and new approaches.
In the present paper, some terms are used with reference to the different diagenetic and metamorphic realms or stages. To avoid ambiguity, these terms, and the meaning with which they are used in the present paper, are listed below. The explanations of these terms are in agreement with the definitions of the Study Group, “Very Low-Grade Metamorphic Rocks” of the IUGS Subc ommission on Systematics of Metamorphic Rocks (SCMR):
Diagenesis (sensu lato): all the chemical, mineralogical, physical and biological changes undergone by the sediment after its initial deposition and during and after its lithification, exclusive of surficial alteration (weathering) and metamorphism. These processes occur under conditions of pressure and temperature that are usual at the Earth’s surfaces and in the outer part of the Earth’s crust.
Very low-grade metamorphism: alterations producing mineral assemblages in the fields of the zeolite, prehnite-pumpellyite, prehnite-actinolite and pumpellyite-actinolite facies. In other words, it is metamorphism of lower grade than greenschist (and blueschist) facies. Recently, this realm has been called also subgreenschist facies.
Diagenetic zone (or more precisely, diagenetic illite “crystallinity” zone): after Kübler (1964, 1968), the diagenetic zone is a pre-metamorphic stage defined by illite “crystallinity” (IC) valu es greater than 0.42 Δ°2θ as measured on the <2 μm fraction of clay-rich, normal clastic rocks under conditions that correspond to the recommendations on sample preparation, X-ray diffraction settings and interlaboratory standardization as summarized by Kisch (1991).
Anchizone: after Kübler (1964, 1968), a transitional zone between the diagenetic zone and the epizone as defined by IC mean values between 0.42 and 0.25 Δ°2θ. [Kaolinite and/or dioctahedral illite/smectite interstratified clay mineral with more than about 10% expandable layers are absent in normal clastic rocks, but they may persist in carbonate rocks, and in organic matter-rich, Na-rich and K-poor shales.]
Epizone: after Kübler (1964, 1968), an advanced stage of metamorphism determined by IC mean values of less than 0.25 Δ°2θ. [Note that this definition is totally different from that originally given by Grubenmann for low-grade rocks.]
MAIN METHODS OF STUDYING LOW-TEMPERATURE TRANSFORMATIONS OF PHYLLOSILICATES
Diagenetic and very low-grade metamorphic rocks are commonly polyphase, fine-grained aggregates for which, usually, there are no means for perfect grain separation of a given phase. Consequently, significant progress in the study of these aggregates was obtained mostly by using those methods which do not need a physical separation of mineral species: first of all, XRD and transmission electron microscopy (TEM).

Phyllosilicates in Very Low-Grade Metamorphism: Transformation to Micas 465
XRD techniques The main aspects are outlined below. Standardization aspects. They include: (1) sample preparation [separation of the
required <2-μm SED (spherical-equivalent diameter) grain-size fraction], (2) measuring conditions and (3) international calibration of the illite “crystallinity” measurements (Kisch 1990, 1991; Krumm and Buggisch 1991; Krumm et al. 1994; Warr and Rice 1994). Although significant results were achieved, correlation with Kübler’s original boundaries requires further consideration, especially because of the originally rather poorly-defined nature of the diagenetic, anchi- and epizones as based on illite “crystallinity.” In other words, the technica l (methodological) aspects are rather clear, whereas the metamorphic petrological interpretations must be handled with great care and caution.
Improvement of the “crystallinity” con cept and measurements by deconvolution of the XRD line-profiles, to separate partly or totally overlapping peaks (Stern et al. 1991; Lanson and Besson 1992; Velde and Lanson 1993; Robinson and Bevins 1994; Hillier 1995; Wang et al. 1995; Schmidt and Robinson 1997). With the help of these rather sophisticated deconvolution approaches, the diffraction effects of intimately intergrown phases or certain components of a given phase can be separated. However, the results of these approaches strongly depend on the assumptions required for the method’s use. In addition, correlation between the full width at half maximum (FWHM) values obtained in this way and Kübler’s original IC scale (on which the petrogenetic applications are still based), may lead to conflicting conclusions.
Introduction of chlorite “crystallinity” (ChC ) measurements, and correlation of ChC scales with that of IC, metabasite mineral facies, coal rank, etc. (Árkai 1991). The applicability of ChC for indicating grades in metaclastic rocks were statistically shown by Árkai et al. (1995b). The use of ChC was extended to meta-igneous rocks by Árkai and Sadek Ghabrial (1997) and Árkai et al. (2000).
Calculation of mean crystallite size, lattice strain and frequency distributions of crystallite sizes from the same XRD line-profiles used for “crystallinity” determinations. In addition to the application of the Scherrer equation, two single-line methods were used: the variance method of Wilson (1963) (Árkai and Tó th 1983; Nieto and Sánchez-Navas 1994), and the Voigt method of Langford (1978) in combination with single-line Fourier analysis (Árkai et al. 1996, 1997, 2000; Warr 1996; Jiang et al. 1997; Li et al. 1998). Simultaneously, numerous efforts were made to apply the multi-line size/strain analysis of Warren and Averbach (1950) (called Bertaut-Warren-Averbach analysis) (Eberl et al. 1987, 1990, 1996, 1998; Eberl and Srodon 1988; Lanson and Kübler 1994; Warr and Rice 1994). In the 1990s, some PC programs were written especially for phyllosilicate studies using single- and multi-line analyses [e.g.; the Krumm (1994) WINFIT® program and its updated versions and the Mudmaster® program of Eberl et al. (1996)]. These programs also estimate crystallite-size frequency distributions, which, in turn, have been used to interpret the processes of crystallization and recrystallization (Eberl and Srodon 1988; Eberl et al. 1990). Despite the great efforts made, these calculations rely on various mathematical assumptions and approximations. They also need “ideal” crystals for instrumental corrections and provide only apparent or (at best) semiquantitative estimates of crystallite sizes. This was shown by Árkai et al. (1996), who compared the applicability of most of these XRD-based methods on a natural sample series ranging from deep diagenesis to the epizone (for further details, see Árkai et al. 1997).
The relatively simple, quick, cheap and easy-to-use XRD-based “crystallinity”

466 Árkai
methods have been, and surely will continue to be, basic tools for regional studies for a long time—especially when inve stigations of large sample-sets are required owing to the natural variability of the geological rock formations.
It is commonly assumed in XRD “crystallinity” studies that the <2-μm SED grain-size fraction is composed predominantly of authigenic (newly-formed, metamorphic) crystallites of the phyllosilicate mineral species. “Crystallinity” indices may then be considered representative of the diagenetic-metamorphic process the rock has experienced. Note, however, that the amount of the <2-μm fraction decreases with increasing grade—at epizonal (greenschist facies) conditions the amount of the <2-μm fraction is usually subordinate and is not representative of the rock as a whole. Actually, “crystallinity” values represent rough, weight ed-average information on the structural state of the investigated phyllosilicate as found in the given grain-size fraction. Comprehensive studies show that, even for pelitic-silty-marly rocks (for which the method was originally developed), various proportions of newly-formed and inherited (detrital) varieties of white K-rich micas and chlorite commonly occur in “clay” separates. In addition, more than one authigenic generation may be present as a result of polymetamorphism and lack of homogenization. TEM techniques
In contrast to XRD methods that may introduce sample preparation artifacts (see Jiang et al. 1997; Li et al. 1998), TEM integrated with selected-area electron diffraction (SAED) and energy dispersive spectrometry (analytical electron microscopy, AEM) measurements, provides direct, in situ observations on rock microtextures, crystallite size distributions, lattice imperfections of crystallites and interstratification (see the extensive reviews by Peacor 1992 and Merriman and Peacor 1999). TEM observations on selected portions of thinned (ion-milled) whole rock samples contradict the “fundamental particle” theory of Nadeau et al. (1984a,b,c; summarized recently by Nadeau 1998). The observations show that phyllosilicate domains with interstratified structures form coherent boundaries, and therefore, “MacEwan-type crysta llites” do exist in quasi-undisturbed rocks (Peacor 1998). In addition, AEM studies may provide reliable mineral-chemical data on the phases devoid of any external or internal impurities.
However, TEM and related methods are comparatively expensive and extremely time-consuming. They require the careful selection of adequate sample parts [mainly by scanning electron microscopy (SEM) and electron microprobe (EMP)], and therefore—despite the great advantages li sted above—they are (and presumably will remain) inadequate for studying the large number of samples that is required for regional petrological studies. The XRD-based calculations are less time-consuming and less expensive than the TEM measurements. In addition, XRD gives a more representative weighted average of the whole rock or its selected fraction, as compared to the TEM observations because X-rays provide information about a considerable larger number of crystals. (For illustrative purposes, consider that X-rays irradiate a sample surface of ca. 3 cm2 in the interval of 6-13°2θ. The surface is covered with crystals of 1 μm average grain-size, 1:10 to 1:20 elongation ratio and 200-Å average crystallite thickness amounting to ca. 109 to 1010 particles. The number of the direct TEM thickness measurements is on the order of 102 to 103. Therefore, the crystallite population analysed by XRD is approximately 107 times larger than that of TEM observations.)
Obviously, the joint application of XRD and TEM methods is highly recommended: it may provide mineralogically well established petrogenetic information on low-grade changes in phyllosilicates. Examples of such comprehensive studies were available in the literature in the late 1980s, with many more appearing more recently (Eberl et al. 1987,

Phyllosilicates in Very Low-Grade Metamorphism: Transformation to Micas 467
1990; Merriman et al. 1990, 1995; Srodon et al. 1992; Árkai et al. 1996, 2000; Jiang et al. 1997; Li et al. 1998; Warr and Nieto 1998). The main results of these studies are given briefly below.
MAIN TRENDS OF PHYLLOSILICATE EVOLUTION AT LOW TEMPERATURE
As a result of detailed XRD and TEM studies carried out on sedimentary basins and on the outer thrust and fold zones of orogenic belts, the framework and main aspects of the structural changes and interrelated chemical changes of phyllosilicate aggradational processes are now fairly well understood (see the review of Merriman and Peacor 1999). These changes are usually described with reference to two main trends. For both trends the starting materials are, in sedimentary and early diagenetic conditions, low layer-charge smectites [either (or both) of detrital origin or/(and) crystallized from aqueous solution]. It is commonly accepted that the occupancy of the octahedral sites and the types of hydrated cations in the interlayer are controlled mainly by the chemistries of the enclosing fluids and reacting solid phases.
The two progressive trends, ranging from early (shallow) diagenesis to the so called epizone (i.e., the low-grade or greenschist facies metamorphism) are:
(1) dioctahedral smectite → illite/smectite interstratified clay mineral → illite → dioctahedral white K-rich mica (muscovite);
(2) trioctahedral smectite (or vermiculite) → chlorite/smectite or chlorite/vermiculite irregular and regular interstratifications → chlorite.
Note that biotite does not form as an end product of this prograde evolution of trioctahedral phyllosilicates. In normal pelites, biotite usually crystallizes by mineral reactions of muscovite plus chlorite at higher temperatures, between ca. 400 and 450°C; in greywacke-type clastic rocks biotite appears at the expense of K-rich feldspar and chlorite at considerably lower temperatures (ca. 300-350°C) (Winkler 1979; Bucher and Frey 1994; Árkai et al. 1995a).
The above mentioned prograde series are characterized by the following mineral or crystal structural changes:
– decrease in the proportions of swelling interstratified layers (smectitic and vermiculitic);
– increase of ordering of interstratification in the di- and trioctahedral series (with Reichweite values of R = 0 → R = 1 → R > 1 in illite/smectite and randomly interstratified chlorite/smectite → corrensite → corrensite/chlorite);
– increase in the illite and chlorite crystallite mean size, i.e., the mean size of domains that scatter X-rays coherently (Fig. 1a);
– decrease of various lattice imperfections of illite and chlorite that cause lattice strain, e.g., layer terminations, etc. (Fig. 1b);
– rather regular prograde changes of polytypes Ad (or 1Md) → (1M) → 2M1 of illite-muscovite (Velde and Hower 1963; Maxwell and Hower 1967; Hoffman and Hower 1979; Walker 1993; Dalla Torre et al. 1994; Dalla Torre and Frey 1997), although the existence of the 1M polytype in sedimentary and under incipient metamorphic conditions has been questioned recently by Grubb et al. (1991) and Dong and Peacor (1996);
– in chlorites, polytype I (mostly Ib) is restricted to lower temperatures, whereas at higher grades (i.e., at anchi- and epizonal metamorphic conditions) polytype IIb predominates (Bailey and Brown 1962; for critical reviews see also Walker 1993; Schmidt and Livi 1999).

468 Árkai
Figure 1. Relations between illite crystallinity (IC) and mean crystallite size (a) and lattice strain (b) as calculated from XRD line-profiles by the modified Voigt method. Data from Árkai et al. (1 996, 2000), Jiang et al. (1997) and Li et al. (1998).
The above structural changes are primarily related to mineral-chemical changes, and the main trends are as follows: (1) an increase of net negative layer charge and consequently, an increase of positive interlayer charge caused mainly by the increasing substitution of Al for Si in tetrahedral sites and increasing order of occupancy in the octahedral sites, including the take up of cations from the interlayer or from outside the crystallite; and (2) stabilization of the interlayer by predominantly K+, subordinately NH4
+ and Na+ substitutions, in 2:1 layer silicates or by increasingly ordered brucite-like layers in chlorite.
In the last few years, contrasting results (and opinions) concerning the mineral-chemical features of illite and chlorite and their precursor phases have been published.
Phyllosilicates in Very Low-Grade Metamorphism: Transformation to Micas 469
These results often led to conflicting mineralogic and petrogenetic interpretations. Some features of this “hot t opic” are discussed below.
CURRENT PROBLEMS IN STUDYING PHYLLOSILICATE EVOLUTION AT THE LOWER CRYSTALLITE-SIZE LIMITS OF MINERALS
Although the main trends of phyllosilicate evolution are fairly well known, there are numerous less well understood aspects that may significantly influence the petrogenetic interpretation of the mineral-structural and mineral-chemical features. The common sources of these problems are related mainly to the fact that, especially in near-surface and diagenetic conditions, the size of coherent crystallites (in the basal-normal direction) is very close or equal to the size of the unit cell. These particles exhibit extremely high specific surface areas and surface free energies. Thus, the determination of their original (in situ) properties is rather difficult, often impossible, taking into account the resolution of the AEM. Because of the extreme instability of these finely dispersed particles, most XRD results characterize the interaction between the object and the researcher (sample preparation problems) rather than the original characteristics of the particles. The perfect separation of pure monomineralic fractions from these very fine-grained mineral aggregates is practically impossible. Consequently, our knowledge of the mineral chemistry of these phyllosilicates is based mainly on the interpretation of data obtained from mixtures of mineral phases or from “f ortunate,” more or less monomineralic, occurrences of a given mineral. However, the genetic relations of these latter occurrences generally strongly differ from those of common sedimentary rocks and their incipient metamorphic equivalents. Some of the open questions related to these specific features are discussed below.
It is generally accepted that dioctahedral and trioctahedral smectites form two distinct groups during sedimentation. This initial distinction is decisive during the whole range of phyllosilicate evolution, disregarding the mechanisms of aggradation. Although considerable deviations from ideal di- or trioctahedral compositions are common, there are no continuous transitions between the two basic structural groups. By contrast, there are only sporadic direct observations on the nature of (hydrated) interlayer cations of smectites from pelitic sediments and sedimentary rocks. Recently, in addition to the predominating hydrated Ca2+ and Na+, the presence of K+ has also been postulated (Buatier et al. 1992; Freed and Peacor 1992; Masuda et al. 1996; Merriman and Peacor 1999). In addition, NH4
+ content is generally disregarded in analysing the chemistry of smectites, and also of other phyllosilicates. However, NH4
+, made available by early alteration of organic matter finely dispersed in sediments, may be fixed in the interlayer, causing special problems when interpreting illite “crystallinity” and cell dimensions of dioctahedral white micas in evolved rocks.
Mineral-chemical estimates drawn indirectly from bulk clay-mineral analyses often differ significantly from direct AEM observations. As a consequence, controversial views were published on net negative charge and interlayer occupancy of illite layers in illite/smectite (I/S) interstratified clay minerals. Originally, Hower and Mowatt (1966) extrapolated 0.75 K p.f.u. (i.e., per O10(OH)2) for end member illite, using bulk chemical and XRD data on interstratified I/S. Srodon and Eberl (1984), using a similar estimation technique, postulated that an early type of illite layer with ca. 0.55 K p.f.u. formed in smectite-dominant random interstratified I/S and a late 1 K p.f.u.-type illite was found in the ordered IISI type I/S. They supposed that both types of layers were preserved also in the evolved I/S and illites, similarly to the preservation of octahedral layers throughout the entire interstratified series. Thus, according to Srodon and Eberl (1984), solid phase transformation rather than dissolution and crystallization is the ruling mechanism in

470 Árkai
phyllosilicate evolution. Nadeau and Bain (1986) concluded that illite layers in I/S do not have a unique value but a range of 0.5-0.9 p.f.u. layer charge with a mean of 0.76. By contrast, Eberl and Srodon (1988) and Srodon et al. (1992) determined a unique layer charge of 0.9-0.89 p.f.u. for illite of I/S of various origin. These latter conclusions were based on the fundamental particle theory of Nadeau et al. (1984a,b,c), using XRD and TEM data for calculating the I/S proportions. Considering XRD, TEM, AEM and other analytical data, Ransom and Helgeson (1993) concluded that the layer charge of illite or illitic layers may vary between 0.5 and 0.9 p.f.u. Dioctahedral aluminous illite and smectite form two separate solid solutions. Thus, there is no mutual solid solution corresponding to interstratified I/S. Cautiously selected data have shown that limited dioctahedral-trioctahedral and dioctahedral-vacancy compositional variations may occur in both minerals. Thus, in contrast to the wide overlaps plotted by gross (bulk) analyses of clay minerals (i.e., impure samples), smectite and illite occupy more restricted and differing compositional planes.
It is evident that, in addition to smectitic interstratifications (the effect of which on illite “crystallinity” have been frequently el iminated by glycolation and/or deconvolution of the basal reflections), the various contents of interlayer K may considerably affect illite “crystallinity.” Recent issues prove that mo st probably, the amount of K should increase with increasing grade (temperature) (Hunziker et al. 1986; Livi et al. 1997).
The values of FWHM of illite basal reflections may be significantly modified not only by the quantity of interlayer K, but also by the kind, mixtures and proportions of the interlayer cations. This feature may eventually lead to erroneous petrogenetic interpre-tations. Therefore, rock samples that contain paragonite and/or margarite either forming discrete, sometimes intimately intergrown phases or interstratifications, should be excluded from the “crystallinity” studies (F rey 1987). However, the detection of these phases/components depends on the amounts of illite, paragonite and margarite. Routine, serial XRD studies may easily overlook very small portions of Na- or Ca-rich mica, which, in turn, may cause considerable peak-broadening and shift in IC. At higher anchizonal and epizonal grades, paragonite (and also margarite) usually forms separate phases, the identification of which is much easier than that of the interstratified K/Na-rich micas. At these grades, equilibrium solid solution of Na in muscovite and K in paragonite is extremely limited (for extensive reviews see Guidotti et al. 1994a,b). By contrast, at diagenetic and lower anchizonal grades metastable K/Na-rich micas were described by Li et al. (1994) and Livi et al. (1990, 1997). On the basis of poorly developed, intermediate basal reflections, Frey (1969) originally determined that these micas were ordered paragonite/phengite interstratifications, which according to recent, integrated TEM/AEM and XRD studies, actually correspond to cation-disordered homogenous mica of intermediate composition (Li et al. 1994). Livi et al. (1997) dispute the proof of these homogenous mixed micas of intermediate composition. These nanometre-scale Na/K-rich micas together with eventual brammalite evolve to discrete muscovite, paragonite and margarite through the anchizone to the epizone (Livi et al. 1997).
According to recent studies (see Drits et al. 1999), NH4-rich illite (tobelite) may be frequently found in metapelites, especially in metaclastic, marly rocks rich in fine-dispersed organic matter. The spacing of the first basal reflection of tobelite (10.3 Å) is nearly the same as that of illite-muscovite (~10 Å). Thus, considering nonequi-proportional quantities of these minerals, their discrimination by XRD alone is unrealistic. The relation of tobelite to illite is unknown at present: they may form a solid solution, although no data exist on their mixing properties. One may speculate that metastable mixing could occur similarly as the Na/K micas characterized above. Consequently, homogenous, metastable K-NH4-rich illite or mica, or random or ordered

Phyllosilicates in Very Low-Grade Metamorphism: Transformation to Micas 471
illite/tobelite may form as well. The contribution of an NH4-bearing phase or component to illite or muscovite should significantly influence the shape of the basal reflections, and may cause a small but systematic increase in FWHM that, in turn, may lead to petrogenetic misinterpretations. Although the identification of NH4
+ being present in subordinate quantities in illite and muscovite is practically impossible by conventional XRD analytical methods, infrared adsorption (IR) and Fourier transform infrared (FTIR) spectroscopy may help to identify and locate NH4
+ for simple modal compositions. The evaluation of NH4-rich illite and its significance in diagenesis and incipient metamorphism is perhaps one of the greatest challenges that researchers will face in the near future. For this, electron energy loss spectroscopy (EELS) is the obvious method of choice (Livi and Abad 2000).
Thus the classical evolution scheme of (Ca-, Na-rich) smectite-illite/smectite–(K-rich) illite–(K-rich) muscovite should be replaced by a more complex multiphase/ multicomponent model, in which K-rich smectite, Na-, NH4- and Ca-rich illite and white mica also play significant roles.
Trends somewhat similar to those discussed above for dioctahedral hydrous phyllosilicates can be assumed also for the chemical and structural evolution of trioctahedral hydrous phyllosilicates, namely from trioctahedral smectite (commonly, saponite and iron saponite) through various (random or ordered) interstratified chlorite/smectite (C/S) and chlorite/vermiculite (C/V) to chlorite. Thus, for example, EMP analyses showed a continuous increase of ivAl in the chlorite structure with increasing grade (temperature). This feature has been used as a geothermometer [Cathelineau and Nieva 1985; Cathelineau 1988; and many others (for a comprehensive review of chlorite geothermometers see De Caritat et al. 1993)]. By contrast, TEM/AEM studies showed that the chemistries of true chlorite stacks do not change systematically with grade (Jiang et al. 1994). Instead, the proportion of impurities providing swelling (smectitic) interstratifications decreases with increasing temperature, which, considering the chlorite + chlorite/smectite mixture as a whole (as EMP study does), may result in an increase of ivAl content, simply on the basis of chemical differences between chlorite and smectite (see also Árkai and Sadek Ghabrial 1997; Schmidt and Livi 1999; Árkai et al. 2000).
In addition to the common, well-known evolution trend of trioctahedral phyllosilicates to chlorite, the appearance of berthierine in certain metasediments increases the complexity of the process (Mata et al. 2001). Berthierine, which (at least in moderate quantities) is easily overlooked by XRD when chlorite is dominant, has been observed by TEM/AEM. Further research is needed to establish bulk chemical constraints as well as the stability/metastability relations of chlorite and berthierine.
Mostly the effects of sample preparation techniques, i.e., the modifying effects caused by the interaction between researchers and objects, are real and involves debate between the theory of conventional “MacEwan crystallites” ve rsus that of “fundamental particles” of interstratified clay minerals. Th e theory of fundamental particles elaborated by Nadeau and his co-workers (Nadeau et al. 1984a,b,c; Nadeau 1985; Nadeau and Bain 1986; Nadeau 1998) explains the XRD signatures of interstratified layers by interparticle diffraction. During sample preparation of clay fractions for XRD or TEM, particles of interstratified layers split along the weakest coherency, along which single-crystal-like illitic fundamental particles were attached to each other incoherently, in a turbostratic way, corresponding to a smectitic interlayer. These fundamental particles measured by TEM on separates prepared from dilute clay fractions of rocks were used to obtain conclusions on the chemistry of illite/smectite (Srodon et al. 1992) and has been preferentially applied in clay mineralogy during the last 15 years.

472 Árkai
Veblen et al. (1990), Dong and Peacor (1996), and Peacor (1998) questioned the validity of the fundamental particles theory of Nadeau, on the basis of TEM data obtained from quasi-undisturbed whole-rock samples prepared by ion-milling. Their data proved coherency across smectite and illite interlayers and showed also incoherency within larger illitic stacks. As to their interpretation, sample preparation methods conventionally used to XRD and Pt-shadowing TEM techniques may create artifacts (i.e., fundamental particles as coherent crystallites). The relation of these fundamental particles to the crystallites (coherent domains) in the undisturbed rock matrix can and should be questioned and may at least be indirect.
Other aspects of mechanical sample preparation and separation on properties of clay-size phyllosilicates were presented by Jiang et al. (1997) and Li et al. (1998). They demonstrated that, in metapelitic whole-rock samples prepared by ion-milling, mean crystallite size of illite-muscovite measured by TEM on selected (authigenic) matrix portions may be 6 times larger than those obtained from the <2-μm SED grain-size fractions directly by TEM, or indirectly, using the Scherrer equation or the modified Voigt method for XRD line-profile analysis. Not ruling out the possible contributions of other factors to this effect, it seems obvious that sample preparation may produce artifacts which could seriously modify the original features (in this case, crystallite size distributions) of phyllosilicates. Further clarification is needed.
REACTION PROGRESS OF PHYLLOSILICATES THROUGH SERIES OF METASTABLE STAGES?
Based on recent reviews (see e.g., Peacor 1992; Merriman and Peacor 1999), thermodynamic equilibrium can be attained in phyllosilicate-bearing rocks at around the onset of the epizone (≈ greenschist facies), i.e., at 300-350°C, according to rough estimates. These equilibrium states are documented by mineral-chemical, mineral-structural and rock textural features. In general, the ranges of isomorphic substitutions in coexisting minerals decrease, i.e., miscibility gaps increase with decreasing temperature (for micas, see Guidotti 1994a,b).
At grades lower than the epizone, i.e., in the anchizone and diagenetic zone, increasing chemical heterogeneity can be observed, jointly with structural features also compatible with increasing disorder (decreasing crystallite size, increasing lattice strain and imperfections). All these features imply that phyllosilicates in diagenetic and very low-grade metamorphic conditions do not reflect thermodynamic equilibria. Instead, phyllosilicates in these rocks occur as metastable phases. Their crystallization is controlled not only by temperature, but also by kinetic factors, following the Ostwald Step Rule (Essene and Peacor 1995). An important statement has been made by these latter authors, using the pioneering conclusions of Lippmann (1981, 1982) on the thermodynamic status of clay minerals and a vast amount of TEM, AEM and microtextural features of diagenetic and low-temperature metamorphic phyllosilicates. Essene and Peacor (1995) have stated that these materials represent indeed high surface-energy and high free-energy (also high entropy) metastable phases between the equilibrium state end members, namely pyrophyllite and muscovite (or talc and chlorite). By mostly dissolution of metastable smectites other metastable phases crystallize (e.g., I/S, C/S or illite), instead of stable muscovite and chlorite. Thus, sequences of metastable phases may form and persist with increasing temperature. The related series of reactions that act during diagenesis and very low-grade metamorphism is strongly controlled by kinetic factors, in addition to temperature and pressure. Consequently, the structural and chemical characteristics of these metastable phases can not serve as a basis for geothermometers or geobarometers (that would require equilibrium states and

Phyllosilicates in Very Low-Grade Metamorphism: Transformation to Micas 473
equilibrated minerals assemblages). These metastable phases are only qualitative indicators of the stages the investigated rock system has reached through a series of metastable mineral reactions.
CONCLUDING REMARKS All of the parameters used for characterizing the phyllosilicates in the very low-
grade metamorphism (illite and chlorite “crys tallinity” indices, mean crystallite size and lattice strain, proportion of swelling interstratifications, proportion of metastable and stable polytypes, and also the so called chlorite geothermometers elaborated on the basis of polytypes, chemistry of chlorite, etc.) are suitable tools for monitoring the reaction progress, but not for quantitatively estimating the temperature. However, surprisingly good and consistent correlations have been found between phyllosilicate characteristics, metabasite mineral facies and organic maturity parameters (for reviews see Kisch 1983, 1987; Árkai 1991; Merriman and Frey 1999). These rather strong correlations suggest that the kinetic factors that have acted in the various geological systems might be similar.
Evaluation of the advantages and disadvantages of XRD and TEM techniques shows that integrated application of these methods may provide mineralogically well established petrogenetic information on low-grade metamorphic changes of phyllosilicates. The often conflicting results, best exemplified by the long-lasting debates between the theories of “MacEwan crystallites” and “fundamental particle s” reflect mainly the effects of sample preparation techniques applied, i.e., the modifying effects caused by the interaction between researchers and the materials in those cases, when the size of the investigated mineral particles is near or at the lower size limits of minerals.
Critically reviewing the recent mineralogical and petrological data on diagenetic and incipient metamorphic evolution paths of hydrous phyllosilicates, in the present paper we have focused the attention on the two, rather distinct evolutional trends:
dioctahedral smecitite → random and/or ordered interstratified I/S clay mineral → illite → white K-rich mica (muscovite), and
trioctahedral smectite → C/S (random and/or ordered: corrensite) → chlorite/corrensite → chlorite.
Because of the lack of relevant chemical and structural data on smectites from pelitic sediments and early diagenetic rocks, further research is needed to determine if the path toward and along one of these two series is pre-determined by the previously available (detrital or authigenic) smectites. In other words: do transitional dioctahedral-trioctahedral smectites exist in common sediments? Moreover or alternatively, are the fates of the two divergent prograde series controlled by local changes of the fluid and rock chemistries?
Phyllosilicate evolution in both prograde series is characterized by the decrease of swelling interstratifications, increase of ordering of interstratification, increase of mean crystallite size and decrease of lattice strain, and by formation of stable polytypes with increasing grade. These structural changes are accompanied by systematic changes in mineral chemistry, the main features are discussed in detail. Evolved mica and chlorite form through metastable phases produced by disequilibrium processes also controlled by kinetic factors. Therefore, all the methods, which are based on certain varying structural or chemical properties of these metastable phases, express only the stage the evolution process has reached during the reaction progress involving phyllosilicates. They are therefore inadequate for quantitative geothermometric and geobarometric purposes in the strict thermodynamic sense.
Contrary to the early, oversimplified views on phyllosilicate assemblages of very

474 Árkai
low-grade metapelites, recent studies unequivocally show that metastable polytypes and phases including interstratified clay minerals are present also in anchizonal conditions, and diminish only approximately near to the onset of epizone (greenschist facies). Instead of the rather “clear” schemes of (Ca,Na)-bearing dioctahedral smectite → I/S → K-bearing illite → muscovite, and trioctahedral smectite → C/S → chlorite, the effects of various interlayer cations like K+, Na+ and NH4
+ and the presence of berthierine should also be taken into consideration when illite and chlorite “crystallin ity” indices are used.
All the aspects discussed in this review suggest that instead of using only a given specific method for a certain lithotype, the integrated use of all possible parameters from various lithotypes better monitor the metamorphic grade and may lead to more realistic petrogenetic interpretations. Such a complex, integrated approach may allow for the necessary screening of the applicability of various methods.
ACKNOWLEDGMENTS
The author is indebted to Prof. Francesco Paolo Sassi (Padova, Italy) for inviting him to submit this paper to the Conference “M icas-2000” organized by Accademia Nazionale dei Lincei, Roma. Valuable comments, suggestions and useful, detailed corrections given and made by Prof. Sassi, Prof. Stephen Guggenheim (University of Illinois, Chicago) and Dr. Kenneth T.J. Livi (The Johns Hopkins University, Baltimore, Maryland) are highly appreciated. Special thanks are due to Prof. James Thompson for careful language editing and for helpful scientific advice, and last but not least to Prof. Paul H. Ribbe (Virginia Tech, Blacksburg) for thorough scientific review and editorial care. This work also forms a part of the metamorphic research programme of P.Á. supported by the Hungarian National Research Fund (OTKA, Budapest), Projects T-022773 and T-035050.
REFERENCES Amouric M, Olives J (1991) Illitization of smectite as seen by high-resolution transmission electron
microscopy. Eur J Mineral 3:831-835 Árkai P (1991) Chlorite crystallinity: An empirical a pproach and correlation with illite crystallinity, coal
rank and mineral facies as exemplified by Palaeozoic and Mesozoic rocks of northeast Hungary. J Metamor Geol 9:723-734
Árkai P, Balogh K, Frey M (1997) The effects of tect onic strain on crystallinity, apparent mean crystallite size and lattice strain of phyllosilicates in low-temperature metamorphic rocks. A case study from the Glarus overthrust, Switzerland. Schweiz mineral petrogr Mitt 77:27-40
Árkai P, Lelkes-Felvári Gy, Lantai Cs, Nagy G (1995a) Biotite in a Paleozoic metagreywacke complex, Mecsek Mountains, Hungary: conditions of low-T metamorphism deduced from illite and chlorite crystallinity, coal rank, white mica geobarometric and microstructural data. Acta Geol Hungary 38: 293-318
Árkai P, Mata MP, Giorgetti G, Peacor DR, Tóth M (2000) Comparison of diagenetic and low-grade metamorphic evolution of chlorite in associated metapelites and metabasites: An integrated TEM and XRD study. J Metamor Geol 18:531-550
Árkai P, Merriman RJ, Roberts B, Peacor DR, Tóth M (1996) Crystallinity, crystallite size and lattice strain of illite-muscovite and chlorite: Comparison of XRD and TEM data for diagenetic to epizonal pelites. Eur J Mineral 8:1119-1137
Árkai P, Sadek Ghabrial D (1997) Chlorite crystallinity as an indicator of metamorphic grade of low-temperature meta-igneous rocks: A case study from the Bükk Mountains, northeast Hungary. Clay Minerals 32:205-222
Árkai P, Sassi FP, Sassi R (1995b) Simultaneous measurements of chlorite and illite crystallinity: A more reliable geothermometric tool for monitoring low- to very low-grade metamorphisms in metapelites. A case study from the Southern Alps (NE Italy). Eur J Mineral 7:1115-1128
Árkai P, Tóth NM (1983) Illite crystallinity: Combined effects of domain size and lattice distortion. Acta Geol Hung 26:341-358

Phyllosilicates in Very Low-Grade Metamorphism: Transformation to Micas 475
Bailey SW, Brown BE (1962) Chlorite polytypism: I. Regular and semi-random one-layer structures. Am Mineral 47:819-850
Buatier MD, Peacor DR, O’Neil JR (1992) Smectite-illite transition in Barbados accretionary wedge sediments: TEM and AEM evidence for dissolution/crystallization at low temperature. Clays Clay Minerals 40:65-80
Bucher K, Frey M (1994) Petrogenesis of Metamorphic Rocks, 6th Edn. Springer-Verlag, Berlin, Heidelberg
Cathelineau M (1988) Cation site occupancy in chlorites and illites as a function of temperature. Clay Minerals 23:471-485
Cathelineau M, Nieva D (1985) A chlorite solid solution geothermometer. The Los Azufres (Mexico) geothermal system. Contrib Mineral Petrol 91:235-244
Dalla Torre M, Frey M (1997) The evolution from disordered Ad to ordered 2M1 white K-mica polytype in low-temperature metamorphosed sedimentary rocks. Schweiz mineral petrogr Mitt 77:149-159
Dalla Torre M, Stern WB, Frey M (1994) Determination of white K-mica polytype ratios: Comparison of different XRD methods. Clay Minerals 29:717-726
De Caritat P, Hutcheon I, Walshe JL (1993) Chlorite geothermometry: A review. Clays Clay Minerals 41:219-239
Dong H, Peacor DR (1996) TEM observations of coherent stacking relations in smectite, I/S and illite of shales: Evidence for MacEwan crystallites and dominance of 2M1 polytypism. Clays Clay Minerals 44:257-275
Dong H, Peacor DR, Freed RL (1997) Phase relations among smectite, R1 illite-smectite and illite. Am Mineral 82:379-391
Drits VA, Lindgreen H, Sakharov BA, Salyn AL (1999) Structural mechanism of I-S transformation in the oil source rocks from Upper Jurassic shales. Progr Abstr, p 79, EUROCLAY 1999, Krakow. (European Clay Groups Assoc)
Drits VA, Srodon J, Eberl DD (1997) XRD measurements of mean crystallite thickness of illite and illite/smectite: Reappraisal of the Kübler index and the Scherrer equation. Clays Clay Minerals 45: 461-475
Dunoyer de Segonzac G, Bernoulli D. (1976) Diagenese et métamorphisme des argiles dans le Rhétien Sud-alpin et Austro-alpin (Lombardie et Grisons). Bull Soc Géol France 18:1283-1293
Eberl DD (1993) Three zones for illite formation during burial diagenesis and metamorphism. Clays Clay Minerals 41:26-37
Eberl DD, Drits V, Srodon J, Nuesch R (1996) Mudmaster: A program for calculating crystallite size distributions and strain from the shapes of X-ray diffraction peaks. U S Geol Surv Open File Rep 96-171, 44 p
Eberl DD, Nuesch R, Sucha V, Tsipursky S (1998) Measurement of fundamental illite particle thicknesses by X-ray diffraction using PVP-10 intercalation. Clays Clay Minerals 46:89-97
Eberl DD, Srodon J (1988) Ostwald ripening and interparticle-diffraction effects from illite crystals. Am Mineral 73:1335-1345
Eberl DD, Srodon J, Kralik M, Taylor BE, Peterman ZE (1990) Ostwald ripening of clays and metamorphic minerals. Science 248:474-477
Eberl DD, Srodon J, Lee M, Nadeau PH, Northrop HR (1987) Sericite from the Silverton caldera, Colorado: Correlation among structure, composition, origin, and particle thickness. Am Mineral 72:914-934
Elliott WC, Matisoff G (1996) Evoluation of kinetic models for the smectite to illite transformation. Clays Clay Minerals 44:77-87
Essene EJ, Peacor DR (1995) Clay mineral thermometry—A critical perspective. Clays Clay Minerals 43:540-553
Freed RL, Peacor DR (1992) Diagenesis and the formation of authigenic illite-rich I/S crystals in Gulf Coast shales: TEM study of clay separates. J Sed Petrol 62:220-234
Frey M (1969) A mixed-layer paragonite/phengite of low-grade metamorphic origin. Contrib Mineral Petrol 14:63-65
Frey M (1987) Very low-grade metamorphism of clastic sedimentary rocks. In Low Temperature Metamorphism. M Frey (ed) Blackie and Son Ltd, Glasgow
Frey M, Robinson D (1999) Low-Grade Metamorphism. Blackwell Science, Oxford Grubb SMB, Peacor DR, Jiang W-T (1991) Transmission electron microscope observations of illite
polytypism. Clays Clay Minerals 39:540-550 Guidotti CV, Sassi FP, Blencoe JG, Selverstone J (1994a) The paragonite-muscovite solvus. I. P-T-X limits
derived from the Na-K compositions of natural, quasibinary paragonite-muscovite pairs. Geochim Cosmochim Acta 58:2269-2275

476 Árkai
Guidotti CV, Sassi FP, Sassi R, Blencoe JG (1994b) The effects of ferromagnesian components on the paragonite-muscovite solvus: A semiquantitative analysis based on chemical data for natural paragonite-muscovite pairs. J Metamor Geol 12:779-788
Hillier S (1995) Mafic phyllosilicates in low-grade metabasites: Characterization using deconvolution analysis—discussion. Clay Minerals 30:67-73
Hoffman J, Hower J (1979) Clay mineral assemblages as low grade metamorphic geothermometers: Application to the thrust faulted Disturbed Belt of Montana, U.S.A. Soc Econ Paleontol Mineral Spec Publ 26:55-79
Hower J, Eslinger EV, Hower ME, Perry EA (1976) Mechanism of burial metamorphism of argillaceous sediment: 1. Mineralogical and chemical evidence. Geol Soc Am Bull 87:725-737
Hower J, Mowatt TC (1966) The mineralogy of illites and mixed-layer illite/montmorillonites. Am Mineral 51:825-854
Huang W-L, Longo JM, Pevear DR (1993) An experimentally derived kinetic model for smectite-to-illite conversion and its use as a geothermometer. Clays Clay Minerals 41:162-177
Huggett JM (1995) Formation of authigenic illite in Palaeocene mudrocks from the central North Sea: A study by high resolution electron microscopy. Clays Clay Minerals 43:682-692
Hunziker JC, Frey M, Clauer N, Dallmeyer RD, Friedrichsen H, Flehmig W, Hochstrasser K, Rogwiller P, Schwander H (1986) The evolution from illite to muscovite: Mineralogical and isotopic data from the Glarus Alps, Switzerland. Contrib Mineral Petrol 92:157-180
Inoue A, Watanabe T, Kohyama N, Brusewitz AM (1990) Characterization of illitization of smectite in bentonite beds at Kinnekulle, Sweden. Clays Clay Minerals 38:241-249
Jiang W-T, Peacor DR, Essene EJ (1994) Analytical and transmission electron microscopic study of clay minerals in sandstone of Kettleman North Dome, California: Implications for the metastability of illite. Clays Clay Minerals 42:35-45
Jiang W-T, Peacor DR, Árkai P, Tóth M, Kim J-W (1 997) TEM and XRD determination of crystallite size and lattice strain as a function of illite crystallinity in pelitic rocks. J Metamor Geol 15:267-281
Kisch HJ (1983) Mineralogy and petrology of burial diagenesis (burial metamorphism) and incipient metamorphism in clastic rocks. In Diagenesis of Sediments and Sedimentary Rocks, 2. G Larsen, GV Chilingar (eds) p 289-493. Elsevier, Amsterdam (Appendix B: Literature published since 1976)
Kisch HJ (1987) Correlation between indicators of very low-grade metamorphism. In Low Temperature Metamorphism. M Frey (ed) Blackie and Son, Glasgow, p 227-300
Kisch HJ (1990) Calibration of the anchizone: A critical comparison of illite ‘crystallinity’ scales used for definition. J Metamor Geol 8:31-46
Kisch HJ (1991) Illite crystallinity: Recommendations on sample preparation, X-ray diffraction settings and interlaboratory standards. J Metamor Geol 9:665-670
Klug HP, Alexander LE (1974) X-ray Diffraction Procedures, 2nd Edn. Wiley, New York Krumm S (1994) WINFIT1.0—A public domain program for interactive profile analysis under
WINDOWS. XIIIth Conf Clay Mineralogy and Petrology, Prague 1994. Acta Univ Carolinae Geol 38:253-261
Krumm S, Buggisch W (1991) Sample preparation effects on illite crystallinity measurement: Grain-size gradation and particle orientation. J Metamor Geol 9:671-677
Krumm S, Kisch HJ, Warr LN (1994) Inter-laboratory study of the effects of sample preparation on illite ‘crystallinity’: A progress report. XIIIth Conf Clay Mineralogy and Petrology. Acta Univ Carolinae Geol 38:263-270
Kübler B (1964) Les argiles, indicateurs de métamorphisme. Rev Inst Français de Pétrole 19:1093-1112 Kübler B (1968) Evaluation quantitative du métamorphism par la cristallinité de l’illite. Bull Centre
Recherche Pau-SNPA 2:385-397 Langford JI (1978) A rapid method for analysing the breadths of diffraction and spectral lines using the
Voigt function. J Appl Crystallogr 11:10-14 Lanson B, Besson G(1992) Characterization of the end of smectite-to-illite transformation: Decomposition
of X-ray patterns. Clays Clay Minerals 40:40-52 Lanson B, Champion D (1991) The I/S-to-illite reaction in the late stage diagenesis. Am J Sci 291:473-596 Lanson B, Kübler B (1994) Experimental determinations of the coherent scattering domain size distribution
of natural mica-like phases with the Warren-Averbach technique. Clays Clay Minerals 42:489-494 Li G, Peacor DR, Merriman RJ, Roberts B (1994) The diagenetic to low grade metamorphic evolution of
matrix white micas in the system muscovite-paragonite in a mudrock from Central Wales, U.K. Clays Clay Minerals 42:369-381
Li G, Peacor DR, Buseck PR, Árkai P (1998) Modification of illite-muscovite crystallite size distributions by sample preparation for powder XRD analysis. Can Mineral 36:1435-1451
Lindgreen H, Hansen PL (1991) Ordering of illite-smectite in upper Jurassic claystones from the North Sea. Clay Minerals 26:105-125

Phyllosilicates in Very Low-Grade Metamorphism: Transformation to Micas 477
Lippmann F (1981) Stability diagrams involving clay minerals. In 8th Conf Clay Mineralogy and Petrology, Teplice 1979. J Konta (ed) Charles University, Prague, Czechoslovakia, p 153-171
Lippmann F (1982) The thermodynamic status of clay minerals. In Proc 7th Int’l Clay Conf, Bologna–Pavia, 1981. H van Olphen, F Veniale (eds) Elsevier, New York, p 475-485
Livi KJT, Abad I (2000) Reaction pathways of micas in low-grade metaclastics. Advances on Micas (Problems, methods, applications in geodynamics). Accad Nazionale Lincei, Rome, 2-3 Nov 2000. Pre-prints, p 173-176
Livi KJT, Veblen DR, Ferry JM (1990) Segregation of K- and Na-rich micas in low-grade metamorphosed shale from the Liassic Black Shale, Switzerland. IGCP Conf Low-Temperature Metamorphism, Manchester, UK
Livi KJT, Veblen DR, Ferry JM, Frey M (1997) Evolution of 2:1 layered silicates in low-grade metamorphosed Liassic shales of Central Switzerland. J Metamor Geol 15:323-344
Masuda H, O’Neil JR, Jiang W-T, Peacor DR (1996) Relation between interlayer composition of authigenic smectite, mineral assemblages, I/S reaction rate and fluid composition in silicic ash of the Nankai Trough. Clays Clay Minerals 44:460-469
Mata MP, Giorgetti G, Árkai P, Peacor DR (20 01) Comparison of evolution of trioctahedral chlorite/berthierine/smectite in coeval metabasites and metapelites from diagenetic to epizonal grades. Clays Clay Minerals 49:318-332
Maxwell DT, Hower J (1967) High grade diagenesis and low-grade metamorphism of illite in the Precambrian Belt series. Am Mineral 52:843-857
Merriman RJ, Frey M, (1999) Patterns of very low-grade metamorphism in metapelitic rocks. In Low-Grade Metamorphism. Frey M, Robinson D (eds) p 61-107. Blackwell Science, Oxford
Merriman RJ Peacor DR (1999) Very low-grade metapelites: Mineralogy, microfabrics and measuring reaction progress. In Low-Grade Metamorphism. Frey M, Robinson D (eds) p 10-60. Blackwell Science, Oxford
Merriman RJ, Roberts B, Peacor DR (1990) A transmission electron mocroscope study of white mica crystallite size distribution in a mudstone to slate transitional sequence, North Wales, U.K. Contrib Mineral Petrol 106:27-40
Merriman RJ, Roberts B, Peacor DR, Hirons SR (1995) Strain-related differences in the crystal growth of white mica and chlorite: A TEM and XRD study of the development of metapelite microfabrics in the Southern Uplands thrust terrane, Scotland. J Metamor Geol 13:559-576
Nadeau PH (1985) The physical dimensions of fundamental clay particles. Clay Minerals 20:499-514 Nadeau PH (1998) Fundamental particles and the advancement of geoscience: Response to “Implications of
TEM data for the concept of fundamental particles.” Can Mineral 36:1409-1414 Nadeau PH, Bain DC (1986) Composition of some smectites and diagenetic illitic clays and implications
for their origin. Clays Clay Minerals 34:455-464 Nadeau PH, Tait JM, McHardy WJ, Wilson MJ (1984a) Interstratified XRD characteristics of physical
mixtures of elementary clay particles. Clay Minerals 19:67-76 Nadeau PH, Wilson MJ, McHardy WJ, Tait JM (1984b) Interstratified clays as fundamental particles.
Science 225:923-925 Nadeau PH, Wilson MJ, McHardy WJ, Tait JM (1984c) Interparticle diffraction: A new concept for
interstratified clays. Clay Minerals 19:757-769 Nieto F, Ortega-Huertas M, Peacor DR, Arostegui J (1996) Evolution of illite/smectite from early
diagenesis through incipient metamorphism in sediments of the Basque-Cantabrian Basin. Clays Clay Minerals 46:304-323
Nieto F, Sánchez-Navas A (1994) A comparative XRD and TEM study of the physical meaning of the white mica ‘crystallinity’ index. Eur J Mineral 6:611-621
Peacor DR (1992) Diagenesis and low-grade metamorphism of shales and slates. Rev Mineral 27:335-380 Peacor DR (1998) Implications of TEM data for the concept of fundamental particles. Can Mineral
36:1397-1408 Ransom B, Helgeson HC (1993) Compositional end members and thermodynamic components of illite and
dioctahedral aluminous smectite solid solutions. Clays Clay Minerals 41:537-550 Reynolds RC, Hower J (1970) The nature of interlayering in mixed-layer illite-montmorillonites. Clays
Clay Minerals 18:25-36 Robinson D, Bevins RE (1994) Mafic phyllosilicates in low-grade metabasites—characterization using
deconvolution analysis. Clay Minerals 29: 223-237 Schmidt D, Livi KT (1999) HRTEM and SAED investigations of polytypism, stacking disorder, crystal
growth, and vacancies in chlorites from subgreenschist facies outcrops. Am Mineral 84:160-170 Schmidt ST, Robinson D (1997) Metamorphic grade and porosity and permeability controls on mafic
phyllosilicate distributions in a regional zeolite to greenschist facies transition of the North Shore Volcanic Group, Minnesota. Geol Soc Am Bull 109:683-697

478 Árkai
Srodon J, Elsass F, McHardy WJ, Morgan DJ (1992) Chemistry of illite-smectite inferred from TEM measurements of fundamental particles. Clay Minerals 27:137-158
Srodon J, Eberl DD (1984) Illite. Rev Mineral 13:495-544 Stern WB, Mullis J, Rahn M, Frey M. (1991) Deconvolution of the first “illite” basal reflection. Schweiz
mineral petrogr Mitt 71:453-462 Veblen DR, Guthrie GD, Livi KJT, Reynolds RC (1990) High-resolution transmission electron microscopy
and electron diffraction of mixed-layer illite/smectite: experimental results. Clays Clay Minerals 38: 1-13
Velde B, Hower J (1963) Petrological significance of illite polytypism in Paleocene sedimentary rocks. Am Mineral 48:1239-1254
Velde B, Lanson B (1993) Comparison of I/S Transformations and maturity of organic matter at elevated temperatures. Clays Clay Minerals 41:178-183
Walker JR (1993) Chlorite polytype geothermometry. Clays Clay Minerals 41:260-267 Wang H, Stern WB, Frey M (1995) Deconvolution of the X-ray “Illite” 10-Å complex: A case study of
Helvetic sediments from eastern Switzerland. Schweiz mineral petrogr Mitt 75:187-199 Warr LN (1996) Standardized clay mineral crystallinity data from the very low-grade metamorphic facies
rocks of southern New Zealand. Eur J Mineral 8:115-127 Warr LN, Rice AHN (1994) Interlaboratory standardization and calibration of clay mineral crystallinity and
crystallite size data. J Metamor Geol 12:141-152 Warr LN, Nieto F (1998) Crystallite thickness and defect density of phyllosilicates in low-temperature
metamorphic pelites: A TEM and XRD study of clay mineral crystallinity-index standards. Can Mineral 36:1453-1474
Warren BE, Averbach BL (1950) The effects of cold-work distortion on X-ray patterns. J Appl Phys 21: 595-599
Weaver CE (1960) Possible uses of clay minerals in search for oil. Am Assoc Petrol Geol Bull 44: 1505-1518
Weber F, Dunoyer de Segonzac G, Economou C (1976) Une nouvelle expression de la ’crystallinité’de l’illite et des micas. Notion d’epaisseur des cristalli tes. C R Sommaire de Seances de la Soc Géol France 5:225-227
Whitney G, Velde B (1993) Changes in particle morphology during illitization: An experimental study. Clays Clay Minerals 41:209-218
Wilson AJC (1963) Mathematical Theory of X-ray Powder Diffractometry. Philips Technical Library, Eindhoven, The Netherlands
Winkler HGF (1979) Petrogenesis of Metamorphic Rocks, 5th Edn. Springer-Verlag, New York

1529-6466/02/0046-0012$05.00 DOI:10.2138/rmg.2002.46.12
12 Micas: Historical Perspective
Curzio Cipriani Museo di Storia Naturale, sez. Mineralogia
Università di Firenze, Via La Pira 4 50121 Firenze, Italia
musminfi@ unifi.it
INTRODUCTION This chapter deals with the micas, an important group of rock-forming minerals
(they comprise about 4% of the Earth's crust) and the similarities among them recognized long ago because of their obviously unusual physical characteristics. Historically, micas presented difficulties both in the assessment of their chemistry and the determination of their crystallographic characteristics.
After the first reports by Plinius (A.D. 79) and Suetonius (1st-2nd century A.D.) and after Agricola (1530), important developments in knowledge of micas occurred with research in 18th century (always sporadic and generally qualitative), the systematic and by now quantitative studies of the 19th century. Indeed the current state of knowledge is the result of an entire century of precise and rigorous investigations. These major developments resulted from the evolution of basic ideas in the chemical and crystallographic fields, but also, most importantly, from the availability of suitable techniques for collecting relevant analytical, chemical, crystallographic, optical and structural data.
The enormous body of scientific work over the last two centuries cannot be given in a short presentation. Consequently, to accomplish the purpose of this review I considered only the major general and specialized treatise on mineralogy. Although somewhat schematic, these treatises have faithfully recorded the evolution of mineralogical knowledge. This is particularly evident in comparing different editions by the same author (e.g., Tschermak), but also when the beliefs of the different schools in the same periods are compared (see References).
PRE-SCIENTIFIC ERA The first reports on mica minerals were by Plinius and Suetonius, even though these
Latin authors may not have had a real knowledge that they were describing a mica. Plinius (79 A.D.) speaks of “micas” “specula ris” and of “phengites” (from the Greek “pheggos” = shining), heavy and transparent like alabaster. Although these terms may refer to gypsum crystals, he was probably referring to the micas when he was speaking of “hammoschrysos” (golden sand). The relevant passages in his Natural History are:
XXXI, 77: “The salt is also dug from the ear th, clearly on account of condensation of water, in Cappadocia. Here it is cut like specular stones; the blocks are very heavy and commonly called “micas.” XXXVI, 45: “These stones can be sawed, but the specular type has the natural characteristic of dividing easily into sheets as thin as one wants.” XXXVI, 46: “…in Cappadocia, one finds a st one with the hardness of marble and white and transparent ... which on the basis of these characteristics has been called phengite: the temple of Fortune was built with this stone. ... Thanks to the stone, even with the doors closed, there was light inside as if during the day, but the effect was different from that with specular stone; it seemed as if the light was not transmitted from the outside but was enclosed within.”

480 Cipriani
XXXVII, 73: “A similarity with inanimate objects is possessed by hammoschrysos which is like gold mixed with sand.” The “phengites” of Suetonius, shiny like a mirror which reflects and which does not
transmit light, could be many things, even a marble. Only in Agricola's era did two names appear which remain in the scientific literature to the present time; with reference to the evident characteristic of shining, mica derives from the Latin “micare” (= to sparkle) and glimmer comes from the German “glimmern.” Both terms refer to the evident characteristic of light reflectance. These names initially coexisted with the classical name of “hammoschrysos” and with the popular terms Katzensilber, Katzengold, i.e. “cat's silver” and “cat's gold.”
Agricola dedicated a brief dialogue to this mineral in his “Bermannus.” To Ancone, the pedantic physician who said that the Arabs used a white sparkling mineral, (which they called “Splendor”) as a remedy for carie s and dental pain, Bermannus, a man of the mines behind whom Agricola himself hides, replies: “We miners call it “cat's silver” (felium argentum), “silver” because it is so shiny it deceives children and non-experts, “cat” because it both resembles their eyes shining at night and their futility and uselessness: it is of no use, it evaporates completely in the fire turning into smoke.” We do not know its uses by the Arabs, but even if the behavior in fire is certainly not that of a mica, there is no doubt that Bermannus was speaking about mica.
One has to wait for Woodward in 1728 to again find the Latin name “mica” used, since both Boetius de Boot in 1647 and Capeller in 1723 spoke only of lapis specularis and mentioned the hexagonal contours. The name remains unchanged in French, as attested by Romé de l'Isle (1784) who writes of “mica lamelleux hexagone” (note that the gender is masculine “le mica,” whereas in Latin it is feminine “mica, micae”) and is described among clayey stones. It was adopted in the German form “Glimmer” by Werner in 1789.
A mere curiosity is the term reported by the German erudite König in 1687— Glacies Mariae—on account of the habit of sprinkling pict ures and statues of the Virgin Mary with shiny flakes of this material.
THE EIGHTEENTH CENTURY From the middle of the 18th century, more precise information began to appear.
Woltersdorff (1755) considered the micas as a type of lapides argillosi, describing it as “amorphous in shiny membranes, light to the touch” and distinguishing, on the basis of color, five mica species golden, silvery and common (these are Katzengold, etc.), compact and “squamous.” Russian glass (also called ladies ' glass) is cited as fissile in diaphanous membranes. The latter should not be confused with “Teutonic glass” which is chalk. Unlike mica, it burns rapidly to powder. There is nothing novel in the treatise by Lehmann (1759), who defined mica as a group of leaflets or small flakes bound by a clayey soil.
While Bucquet (1771) confused mica with talc, the Swede, Wiedman (1771), made a simple but still valid distinction between colorless and colored micas: among the former, one reads perhaps for the first time of glass of Moscovia for the large Russian slabs. Another Swede, Wallerius (1778), in his Latin treatise “Systema mineralogicum” considered the lapides apyri and discussed in detail with the genus lapides micacei which includes mica and talc. Wallerius considered seven species of mica from vitrum muscoviticum (also called v. rutenicum or glacies Mariae) to the various types— membranacea, squamosa, fissilis, etc.—each being distinguished by its color. In addition to a the description, a numerical datum (specific gravity: density with respect to water), appears for the first time. The observation that some micas float (evidently on account of surface tension) whereas others weigh up to three times more than water is noted also.

Micas: Historical Perspective 481
The first text relating to mica in Italian, a translation from the original text in Latin, was written in 1778 by Giovanni Antonio Scopoli, professor at Pavia and physician in the service of the Austrian empire. Micas were said to be a genus belonging to the order “very pure soils” and were defined as being small scales or very thin and shining lamellae. The species are five: fellina (this is Katzengold), ferrea, rutenica, talco and molibdena. Talc is often confused with mica, but molibdena is surprising in that it referred to molybdenite. Obviously, in the absence of chemical determinations, external similarities prevailed, such as the very easy basal cleavage, giving thin hexagonal lamellae which are flexible, even if not elastic.
Another Swede, Cronstedt (read in the Italian translation of 1779), reported a Latin list with division (see Wiedman) into alba sive pura (white that is pure) and mica colorata martialis (colored martial), which were further divided into varieties, including vitrum muscoviticum and talcum officinale. In a general description of the genus “micaceous soils,” in addition to the usual desc riptions of lamellae that are flexible and divisible into meshes, the behavior in fire was examined and said to cause loss of elasticity. It is also said that fusion with borax and alkaline salts creates a transparent glass, which is more easily obtainable with the martial types.
The first chemical analysis of mica, although very approximate, was made by the Irishman Kirwan (1784) who reported the following result: 1 part clay (i.e., alumina) + 1.36 flint (i.e., silica) + 0.7 magnesia + 0.5 dephlogistified iron (i.e. ferrous oxide), cor-responding in percent to 28, 38, 20, 14, respectively. Other data included the specific gravity from 2.535 to 3.000 (if containing much iron) and fusion which was obtained by mixing the mineral with 4 parts of fixed alkali. The description, however, is decidedly less thorough which was obtained, mentioning talc of Moscovia as wide, elastic, flexible, transparent sheets that differ from mica only in being softer and more soapy to the touch. However, a few years earlier, the Frenchman Sage (1777) had grouped the micas (“membranous rocks that divide into shiny fl akes distinct only in color”) into three species: aluminous, non-aluminous and large-sheet forms (the latter ones being also called glass of Moscovia). Sage did not report analyses, but it is evident that he had performed some qualitative assays.
An English translation of Cronstedt's book (1788) contained the same list of species and varieties cited previously, but also reported the chemical analysis of Kirwan as well as an observation by Fabroni, deputy-director of the Museum of Physics and Natural History of Florence. Fabroni observed that colored mica was dissolved by acqua regia or muriatic acid to produce a liquid that is yellow on account of iron.
Another Swede, Bergman (1783), published a Latin text with the title “ Sciagraphia regni minerali” in Florence (where he had visite d for some time). Mica was described only as argilla silicea copiosa, magnesiae autem parcae, sed intima unita. Bergman provided qualitative observations before reporting a second chemical analysis of a mica in following year as reported in the Italian text “ Elementi di Mineralogia” (Napione 1797). Napione, followed the classification of Werner and sets micas in class I “Soils and stones,” genus II “Fossils of clayey nature.” He described micas as variable in color and rarely in flat hexagonal crystals or in short hexagonal prisms, infusible with borax, not very heavy (specific gravity 2.934). Two analyses were re-reported, one by Kirwan and another by Bergman: flint 40%, clay 46%, magnesia 5%, iron calx 9%.
Around the some time the large treatise by Buffon (1790) appeared posthumously. His “Histoire Naturelle des Mineraux” in six vol umes is a work of vast size and of much higher quality than preceding ones. It not only provides a classification with relative descriptions of the species but it also considers genetic problems, alternating acute observations with inexplicable contradictions, such as interchanging mica and talc. There

482 Cipriani
are two types of mica, one produced by a primitive fire, another derived from the decomposition of the first type and similar to talc, which is also a product of mica alteration. Mica was said not to have acquired the solidity of quartz and feldspar, the other constituents of granite, only because it was formed near the Earth's surfa-ce.Therefore, mica is a primitive laminar “glass” partly deposited in granites and partly mixed with clays. Talc in large masses, such as glass of Moscovia, is formed by small laminae of mica united by the action of water, just as sand turns into sandstone. As for glass of Moscovia, Buffon reported a passage from the book “Voyage in Siberia” by the Gmelin according to whom, in 1705, near the Wilim River, the first discovery of a superior quality talc occurred. This talc was as transparent as water up to two “aune” thick (ancient measure corresponding to the length of two forearms). Its use spread quickly as glass for windows and lanterns, particularly in the vessels of the Russian navy because the transparent flakes, being elastic, well withstood the shock waves from the cannon blasts. This “talc of great size” was f ound also in Madagascar and in many other countries, like Arabia. Buffon, however, wondered whether this one could not be instead transparent or translucent chalk, like the alabaster that had been used for some time in churches. In the middle of the 1700s, these large sheets of mica from Russia came to be known in the West and aroused great curiosity. The “Mineralogische Belustigungen” (1770) (“mineralogical amusements”) contain a translation from Latin of an academic communication by I. Stang (1767) on Russian glass (Vitrum Ruthenicum), later called Muscoviticum by Wallerius (1778).
Buffon (1790) concluded his treatise with a fierce attack against crystallographers: “The shapes of the crystals indicate neither the density nor the hardness nor the fusibility nor the homogeneity, and thus not any essential property of the substances of the bodies, since these forms belong equally to different substances which have nothing in common. Thus it is gratuitous and thoughtless that one wishes to consider the form of the crystallization as a specific and distinctive character of each substance when this character is common to different substances and when for each substance this form is not constant. All the work of crystallographers demonstrates only that there is nothing but variety where they suppose uniformity, their multiple observations should have convinced them and reminded them of that simple metaphysics that shows us that in Nature nothing is absolute, nothing is perfectly regular. It is for abstraction that we have formed the geometric and regular figures, and therefore we must not apply them as real properties to the products of Nature which can be present in a thousand different forms” (VI, 286).
As a matter of fact, by the time that Buffon’s treatise had been published, sufficient understanding had been achieved that better descriptions of minerals could be presented by providing chemical analysis and crystallographic properties. Nevertheless, treatises based only on external characteristics were still published, perhaps because it was addressed to beginners and amateurs. An example is the five volume treatise by Estner (1797), well documented with a very detailed description of the minerals and collection sites. Because of the intended readership, this book abandoned Latin and gave the species name in French (mica), Italian (mica) and English (glimmer, daze or glint). Among the various localities cited, Rozena in Moravia was typical for the variety, previously described by Von Born in 1791 as violet zeolite occurring “in big blocks constituted by shining lamellae which at first sight seem to be mica, but upon closer examination turn out to be zeolite with a mother-of-pearl sheen.” This mineral was given the name lilalite, from its color, by the abbot Poda. Obviously this was lepidolite, a name created by Klaproth in 1792 (from the Greek “lepis” and “lithos,” i.e., scale-like stone), who also reported its chemical analysis.
Thus ended the 1700s, the “Age of Enlighten ment.” Actually, there were times for enlightenment also for mineralogy, in general, and the micas in particular. The future

Micas: Historical Perspective 483
pillars of mineralogical knowledge started coming to the forefront: chemical composition and crystal form. This began in the last quarter, perhaps the last fifth, of the 18th century: the first numerical datum was that on specific gravity by Wallerius (1778), the first chemical analysis that by Kirwan (1784), although it was by qualitative assays of the presence of iron, aluminum and magnesium conducted by Sage, Fabroni and Cronstedt. Indeed, it was the Swedish school of chemistry, with Bergman, Cronstedt and Klaproth, which led the way to systematic chemical analysis; this school would also produce, a few decades later, the genius Berzelius.
If the Swedish school deserved credit for establishing the importance of analysis of chemical composition, it was France which developed crystallography. After the pioneering attempts in Italy by Steno (1669) and Guglielmini in 1704, crystallography was elevated to the status of a science by Romé de l'Isle and Haüy. Romé de l'Isle first discussed hexagonal mica and it was Haüy who made the first goniometric measurements. However, it was also in France that the fiercest polemics against crystallographers started, their work being defined as “gratuitous and thoughtless” by Buffon (1790).
The first three quarters of the 18th century were in the pre-scientific era of mineralogy, while the last quarter saw the beginning of scientific sophistication leading to our present knowledge. Not surprisingly, the simple descriptions of the external appearance of minerals (as imposed by the school of Werner) coexisted with references to their chemical nature.
THE NINETEENTH CENTURY The prestige of Werner, a strong supporter of purely naturalistic descriptions, was
such that, even after the first chemical analyses and the first crystallographic determinations, many treatises in the early 19th century—among them Brochant (1800) and Jameson (1804) (which were transcriptions of the scientific teaching of Werner) described minerals only on the basis of their “äussere Kennzeichen,” i.e., their external characteristics, color and appearance.
By the end of the18th century mineralogy had gradually passed into a “proto-scientific” stage. Its fundamental features we re appropriately developed, and this led, in the 19th century, to the accumulation of great amounts of data and to the formulation of many theories about the composition of minerals in general and micas in particular. These are discussed separately in the following sections. Physical properties—
Although not decisive with regard to classification, obvious physical properties, such as appearance and cleavage, immediately caught the attention of researchers who combined the micas into a homogeneous group. The two-dimensional cleavage of micas has always been the most important and most obvious characteristic of this group; it produces extremely thin lamellae with the typical mother-of-pearl sheen and elastic behavior.
The distinction between light and dark micas became almost synonymous with "potassium micas" and "ferro-magnesium micas".
Because of their perfect lamellae, micas were among the first minerals to be observed in polarized light. Biot in 1816 and Brewster in 1818 performed the first observations, which led to distinctions on the basis of the value of the angle between the optic axes. This angle was nearly zero for almost all the dark micas (hence nearly uniaxial), although some may present values of a few degrees (<5°). For white micas, much greater values, < 75°, were reported (note that what was given was always the value determined in air, i.e., 2E, and not the true angle, 2V). The acute bisectrix appeared
484 Cipriani
to be normal to the laminae and only later was the imperfect perpendicularity ascertained. By examining the uniaxial crystals, Biot recognized that some were optically negative, others positive (in reality, these were chlorites).
Beudant (1824) emphasized the recently discovered optical properties. A first group (micas with one axis) show a black cross between crossed tourmalines, with a double "attractive or repulsive" refraction with different "intensities of double refraction." A second group, always repulsive (micas with two axes), exhibit two systems of colored rings between the tourmalines and a strong "difference in the axes of double refraction." The concepts of "intensity" (birefraction) and "difference" (2V or 2E) are clear. Stranger, though, is Beudant "attractive and repulsive" refraction (positive or negative optic sign) concept that refers to the greater or lesser approach of the extraordinary ray to the direction perpendicular to the plane of incidence. This nomenclature remained for a long time: Dufrenoy still used it in 1856, even though he reported that "some physicists speak about positive and negative."
Subsequently, another distinction was made for the "biaxial" micas, once it was clarified (see below) that they belong to the monoclinic system with the plane of symmetry normal to the cleavage lamina as started by Rensch in 1869. The plane of the optic axes could be normal or parallel to the plane of symmetry observed in crystals having the lateral pinacoid {010} well developed. These micas were called, respectively, type I and type II. Actually, this different behavior had been observed by Silliman in as early 1850. He wrote of a short and long diagonal of the basal face.
Tschermak (1878) first observed that in the species of the first type (corresponding to the so-called "light" or "white" micas), the dispersion of the angle was ρ > ν, whereas for the second type (dark or black micas) the dispersion was ρ < ν, except for zinnwaldite.
In crystals without crystal shape, distinction was made by means of "percussion figures" (produced with the point of a somewhat dull needle), a method introduced by Rensch in 1868, which prompted the formation of cracks having the form of a six-pointed star parallel to the faces {010} and {130}. A few years later in 1873, Rensch also produced "pressure figures" (with a pencil point rounded into a hemisphere), obtaining another system of six lines bisecting the preceding ones, or, in other words, normal to the faces. In 1874, Bauer suggested that percussion lines were signs of a subordinate cleavage and pressure lines were lines of sliding.
The optical properties of biotite and phlogopite were soon determined. The pseudohexagonal character is well demonstrated by both the refractive indices α= 1.562, ß= γ =1.606 with birefrangence γ-α= 0.044 and the pleochroism α= light ß=γ = dark. All these characteristics, however, varying with composition. The pseudohexagonal character was also shown by the optic angle (determined as 2E), very often reported as 0° but sometimes ≤ 5°, only rarely ≤ 22° and, in the single case of specimens of andesite of Schemnitz (Slovakia), as much as 72°, i.e., like muscovite. The key point for the symmetry, i.e. the position of the indicator, shows minimal deviations of orthogonality. In crystals from Vesuvius (Italy), Tschermak reported a mean of 0°25' for the αc angle, but the mean value for various other localities was a little less than 4°. These are very small values, however, they were measurable with extremely accurate methods used at the end of the 19th century.
By contrast the measurements on muscovite revealed its clear biaxial nature, with values of 2E variable from 55° to 76° but with a maximal incidence around 70°. There was also a similar large variation of 2V, although this is practically impossible to assess on account of the lack of data concerning the refraction indices but estimated to be

Micas: Historical Perspective 485
∼ 44°. The deviation of orthogonality of the bisectrix was always minimal, with the angle αc varying from 0°30' to almost 3°.
Few data were available for zinnwaldite (2E varying between 50° and 65°, αc= 1°-4°) and lepidolite (2E= 57°-83°, αc= 2°).
As for other physical properties, mica appeared as term 3 on a 12-term scale of hardness proposed by Breithaupt (1836). This scale was not very different from the preceding one of Mohs. Indeed, there were only two differences, namely mica between gypsum and calcite and sodalite between apatite and adularia. Crystallography
After the observations of Boetius de Boot "sexangula figura" and Romé de l'Isle "mica lamellaux hexagone," Haüy (1801), on the basis of m easurements on a crystal from Vesuvius, described mica as orthorhombic with a prism angle of 60°. He concluded this even after Bournon in 1817 correctly assigned mica to the monoclinic system. Later measurements by Phillips (1837), again on Vesuvian specimens, confirmed the monoclinic symmetry.
The discussion on mica symmetry should have ended at that, but it was renewed by Biot, who alleged that optically uniaxal mica existed. Kobell in 1838 gave a rhombohedral crystallographic constant and Breithaupt in 1841, accepting this attribution, divided the micas into uniaxial rhombohedral (called astrites, from the Greek for "star") and biaxial ortho-rhombic (phengites, from the Greek for "shininess").
The question remained open for most of the century and the discussion around 1850 was particularly acrimoniuos. In addition to the crystallization habit with angles of 60° (within the errors of measurement), support for mica belonging to the hexagonal system came from its uniaxial character, at least for the dark micas, as verified by Marignac 1847, Miller 1852, Dana 1854, vom Rath 1873, Kokscharov 1875, (in Hintze 1897). Orthorombic symmetry was suggested by the values of the angle of the optic axes, generally high in the white micas but sometimes appreciably different from zero even in dark micas (thus defined as optically anomalous). Also the fact that the interference figures appeared to be centered on the perpendicular to the cleavage flake corresponding to the acute negative bisectrix favored the orthoromic symmetry. Finally, for the angles of the plate of 60°, one could talk of a pseudohexagonal habit as observed by Senarmont, Grailich, Dana, Leydolt, Hessenberg, Des Cloizeaux (in Hintze 1897).
The assignment to the monoclinic system was based not so much on the uncertain measures on the inclined facets of the laminae but on the accurate corrosion-figures (Baumhauer, 1874, 1875) measured on both light and dark micas and, above all, on the final ascertainment by Hintze in 1875 of minimal deviation of the perpendicularity of the acute bisectrix with respect to the lamina, that had been suspected previously (Rose 1844, Marignac 1847, Kenngott 1848, Miller 1852). After the studies of Baumhauer and of Hintze, the last word was written by Bauer in 1877 and by Tschermak in 1875-1877 who performed a series of measures on numerous specimens from various locations.
At the end of the century, agreement had finally been reached (Hintze 1897). For biotite, the most thoroughly studied species, 41 certain forms and two doubtful ones had been observed by various authors, with the following crystallographic data a:b:c=0.577:1:1,645 ß=90°0' (Kokscharov). Thus biotite is monoclinic, but pseudo-orthorhombic given the β angle = 90° and pseudohexagonal given the axial ratio b/a=√3. These data demonstrate the correctness of the goniometric measures by all the above authors. Relatively frequent (110) twins with different modalities of growth were also observed.

486 Cipriani
Most of the measurements were carried out on crystals of many forms from Vesuvius, both in blocks of limestone and in druse in association with sanidine and pyroxenes. Hintze (1897) reported measurements also on crystals from the island of Langesundfjord in Norway, Langban in Sweden and Lake Baikal in Siberia, and from the famous locality of Greenwood Furnace (New York, U.S.A.).
Data for the other micas were much fewer. Instead of reporting their crystallographic parameters, various texts rather referred to those of biotite. For muscovite, eleven forms were reported, which had been determined on crystals from Soboth (Stiria) and Abühl (Salzburg, Austria), Binnenthal in Switzerland and the Ilmen Mountains in Russia; the last was important for having a strange pointed morphology. For zinnwaldite, the crystals from Zinnwald in Bohemia exhibited seven forms. No measurement was reported for lepidolite, (because it was always found in fringed laminae) or for the always massive paragonite.
As a complement to this section on crystallography, some remarks on the old notations are given. In the nineteenth-century treatises, the crystallographic notations are varied and difficult to understand. However C. Friedel (1893) recorded all notations used from Haüy onward. For all the simple forms, he compared five different modes (Levy, Weiss, Naumann, Dana, Miller) which could be reduced substantially to two different schemes. Some crystallographers assigned a symbol to a simple form (e.g., p is cube in Levy, O is octahedron in Naumann), whereas others referred to the intercepts of the faces on axes and assigned some numbers to each face in comparison with a reference face, with direct (Weiss) or inverse (Miller) proportionality. The following table, which reports the various symbols for some simple forms of the cubic system, clarifies these differences.
Notations for crystal faces
Levy Weiss Naumann Dana Miller cube p a: ∞a: ∞a ∞ O ∞ 0 100 octahedron a1 a: a : a O 1 111 rhombododecahedron b1 a: a : ∞a ∞ O i 110 tetrakishexahedron b3/2 a: 2/3a: ∞a ∞ O 3/2 i 3/2 320 b2 a: 1/2a: ∞a ∞ O 2 i 2 210 triakisoctahedron a1/2 a: a: 2a 2 O 2 221
The superiority of Miller's notation was widely admitted (“simple, rational and easy for calculations” (Friedel 1893)). Nevert heless, for the entire century, French crystallographers used the notation of Levy and Germans and Italians used notation by Weiss or Naumann, although occasionally mentioning the notation of Miller.
For the micas, the most frequent simple forms in the orientation of Kokscharov are, according to the Naumann's notation, the basal pinacoid c is oP, the lateral pinacoid b is yPy, the prism M is 2P and the prism o is P. Chemical composition
Crystalline form (today: crystal structure) and chemical composition have for some time been the two pillars on which the denotation of a mineralogical species is based. This has been so ever since Mitscherlich (1816) recognized the possibility of diverse “crystalline forms” of the same substance (NaH 2PO4, and later also sulfur), thus clarifying relationship between calcite and aragonite. Today this phenomenon is known as polymorphism, (also dimorphism) previously called heteromorphism or pleomorphism. Mitscherlich by using polymorphism, struck great blows to the theory advanced by Haüy that each substance must have its own crystalline form produced by the “integrating molecule.”

Micas: Historical Perspective 487
As mentioned above, the first true chemical analysis was conducted by Klaproth (1792) on a violet mica to which was given the name lepidolite. Klaproth recognized the presence of potassium in leucite and subsequently (in 1810) reported the same element in a mica from Zinnwald and in a black mica from Siberia. The year 1820 saw, on the one hand, the recognition of lithium in lepidolite (Wenz) and in the mica from Zinnwald (Gmelin) and, on the other hand, the systematic studies of Rose. Rose recognized two large groups of mica: a potassic and a magnesian group (“Kali-” and “Magnesiaglimmer”). In addition he identif ied fluorine and water in micas through high-temperature studies. His two-fold classification persisted for more than a century, even though it was a source of confusion (because it made one think that potassium was absent in the latter group). The simple division by Wallerant (1891) into white and black micas failed to find followers, perhaps because of its excessive simplicity.
Chemical analyses became more common and led, among other things, to the identification of Ca by Mohs in 1820 with regard to pearl like mica, later called margarite (Greek for “pearl”), of Na by Schafhäutl in 1843 in paragonite (Greek for “to mislead,” the mica appearing similar to talc ), of Ba by Oellacher in 1860 in mica called (in his honor) oellacherite, of Cr (Schafhäutl 1843) in so-called fuchsite, and of V by Blake (1876) in the mica called roscoelite in honor of Roscoe, the discoverer of vanadium. There were also quite a few incorrect analyses, like the one by Peschier from Geneva, reported by Brard (1824), which indicated a content of 27% “titanium peroxide.”
Among the most important researchers in this field were Rammelsberg and, above all, Tschermak. To interpret of the chemical nature of the micas, both followed the classical scheme of the derivation from silicic acids, as Rose had earlier done, when he considered the “potassic” micas to be a mixture of orthosilicate Al4(SiO4)3 with trisilicate K4Si3O8.
Rammelsberg, in his treatises of 1875 and 1895, reported observations of his own made in 1866 together with data taken from Rose. For the muscovites, where the ratio Al:Si (really Al2O3:SiO2) is always about 1:2 and greater SiO2 content can be attributed to minute impurities of quartz, the highly variable K:Al ratios (from 1:1 to 1:2) were explained by admitting that some potassium is replaced by hydrogen. In this hypothesis, instead of being a complex mixture, muscovite can be considered a simple “halbsilicate” (K,H)2Al2Si2O8, similar to nepheline. In fact, Rammelsberg indicated a different ideal formula, R2AlSi2O8.
At this point, a digression is needed to present, even as a brief outline, the chemical notations used throughout the 19th century and which make reading of the old formulae difficult.A trivial difference from the present notation is that in 19th century the values of the number of atoms were written as superscripts rather than subscripts. This practice continued for almost all the century [e.g., it was not used by Tschermak (1878)] until Wallerant (1891). But a major difference (until 1870-80) was the use of equivalents rather than the atomic weights to compute the formulae. Thus water is indicated as HO, deriving from the union of one hydrogen with an equivalent quantity (in weight) of oxygen, i.e., 8 (which is the equivalent of O with respect to H). This notation, around the year 1840, had replaced the original one of Berzelius (1819), who had set O = 100 and that of Breithaupt (1836), who had set O = 1. As a result, equivalents corresponding to one-half of the true atomic weights were given for many other elements (e.g., K = 19, Si = 14). It was only after the general acceptance of Avogadro's Law (proposed in 1811, but reintroduced by Cannizzaro in 1860) that the concept of atomic weight was widely accepted. For the latter the reference was H = 1.
Another difficulty involved the abbreviated notation proposed by Berzelius (1819). Given the importance of the oxygenated compounds, he suggested placing a dot above

488 Cipriani
the element bound to oxygen for each atom (rather, each equivalent) of the element. Hence cuprous oxide is Cu, while cupric oxide is Cü, potassium oxide is K (meaning KO), carbon dioxide is C = CO, calcium oxide is Ca = CaO, calcium sulfate is CaS = CaO.SO. By analogy in sulfides, an accent indicated the content in sulfur: Ag′ = AgS, silver sulfide. Another abbreviation concerned the elements with odd valences for which the oxides involved two atoms of the element: rather than Al2O3, one wrote Al . The dot should not be confused with the superscript ' or '' or ''' which indicated the valence of the generic element R. Chemistry (and mineralogy) owes much to Berzelius, but certainly these annotations of his were not helpful and have been forgotten long since.
The great Swedish chemist Berzelius, to whom we owe the name “silicate,” never dealt directly with micas. In his treatise, on the basis of the old analyses by Klaproth (“the best analyst of the mineral kingdom,” he wrote) he considered the micas to be a combination of four different silicates (KS3, AS, FS, MS where K is potassium, S silicon, A aluminum, M magnesium). Berzelius denied that the micas belonged to the same species because the only thing that was common to them was the lamellar structure, which is present also in other minerals such as talc, uranite and magnesium hydrate. In agreement with Haüy, he considered that a mineral species includes phases having “the same chemical composition and the same primitive form.”
Rammelsberg (1875) thought that the basis of formula calculation is the relationship Si/R (in parentheses below) and not either ortho- or metasilicates. Thus normal silicates (by analogy with carbonates) of the type R2SiO3 or RSiO3 or RSi3O9, of basic silicates of varied character:
Halbsilikate (1/2) R4SiO4 ...... Drittelsilikate (1/3) R6SiO5 ...... Viertelsilikate (1/4) R8SiO6 etc., or acidic silicates:
Zweifachsilikate (2) R2Si2O5
As for the other micas, Rammelsberg (1895) confirmed the “half-silicate” nature also of paragonite, “(H,Na) 2AlSi2O3” (O 3 is an obvious misprint of O8) that has Na:H = 1:2. For some muscovites, he reported a R:Si ratio to 3:1, and hence a mixture of normal and half silicate (these are the present phengites). Other micas, e.g., the iron-magnesium micas, have compositions which arise from a mixture of several half silicates: x R4SiO4 + y R2SiO4 + z R2Si3O12 [x, y, z being three variable coefficients].
We turn directely to Tschermak, undoubtedly the greatest mica scholar of his time. Of his three notes from 1878-79, the first one was dedicated to the physical characters, the second one to chemical properties, the third one to the so-called fragile micas. On the basis of numerous chemical analyses by him as well as preceding authors, Tschermak considered the micas to be comprised of mixtures of three main molecules: Si6Al6H6O24; Si6Al4H6O21 and Si6Mg12O24. The first and the second molecules form the muscovite-lepidolite series, the first and the third molecules produce biotite, the second and third molecules comprise phlogopite. Each of these micas include various additional substitutions (K and Li for H, Fe for Mg, F2 for O). Margarite Si4Al8Ca2H4O24 was considered separately.
Even before Tschermak, many authors sketched the structural formulae to help visualize the relationships among the various atomic species. Tschermak (1879) was against these attempts unless they could be backed by genetic considerations such as the possible derivation of muscovite, together with kaolin, from orthoclase by alteration. By

Micas: Historical Perspective 489
comparing the compositions of these three minerals he made the observation that a Si2O4Al2O2H2 group, was always present.
This group is accompanied in a similar manner by K or by the Si2O2 group or simply by H2 in, muscovite, orthoclase and kaolin respectively as follows.
Orthoclase Kaolinite Muscovite . Si6Al2K2O16= Si4Al4H8O18= Si6Al6H4K2O24= O H2 O Si2O4Al2O2K2 O2 Si2O4Al2O2H2 O2 Si2O4Al2O2H2 O2 Si2O2 O2 Si2O4Al2O2H2 O2 Si2O4Al2O2H2 O2 Si2O2 O2 Si2O2Al2O2K2 O H2 O
Note that, in these structural formulae, Al is given valence of 4 without any explanation. Tschermak theory was opposed by Clarke (1889), who was well known as a
geochemist for having made the first sound evaluation of the mean composition of the Earth's crust.
His criticisms began with the previously noted quadrivalence of Al. Therefore, the formula proposed for muscovite must be halved: from R6Al6Si6O24 to R3Al3Si3O12. However, this result is nothing but a normal orthosilicate, in part substituted and which may be written as R3Al3(SiO4)3. Another fundamental objection by Clark concerned Tschermak's reference to hypothetical constituents. Indeed one of them, Mg12Si6O24, is olivine, but all others are unknown and chemically improbable substances. Reference to such molecules would mean that the various micas represent types that are chemically very different, whereas it would be more logical to find a general form that could account for all the close analogies present in this group of minerals. Finally Clarke criticized the approach used by Tschermak regarding water to explain an oxygen/silicon ratio greater than 4. Clarke's hypothesis was simple: most micas could be referred to “orthosilicates” of aluminum, with this element being variably replaced by alkaline metals, hydrogen or magnesium-iron according to formulae showing a range of variation as follows where the left part fits muscovite and the right one phlogopite.
SiO4 ≡ R3 SiO4 ≡ MgR Al SiO4 ≡ Al to Al SiO4 ≡ MgR SiO4 ≡ Al SiO4 ≡ Mg R
Clarke explained the O/Si ratios of <4 by the possible substitution of a SiO4 group by Si3O8, similar to what occurs in the plagioclases between albite (polysilicate) and anorthite (orthosilicate).

490 Cipriani
Without discussing details of the composition of the various micas, I note these observations by Clarke: (1) that the Al content cannot decrease below 1 Al per 3 Si (this is what occurs with the common substitution in the tetrahedral sheet), and (2) the uncertainty of the role of water, which is difficult to determine analytically but has a strong impact on the molecular ratios, given its low molecular weight.
The last years of the 19th century witnessed lively discussions about the nature of solid solutions, as summarized by Brauns (1896). The idea of “Mischkristalle,” introduced by Van't Hoff in 1890, was immediately compared with the nearly contemporaneous hypothesis of Sohnke on the nature of the crystalline state. Reviving Bravais's theory, Sohnke stated that “a crysta l is composed of an infinite number of lattices arranged parallel to one another.” The supporters of this hypothesis explained solid solution as a substitution of one molecule by another in their barycenters. They disagreed with those who instead viewed “mix ed crystals” as a mixture of numerous very small iso-oriented crystallites, thus anticipating what today we call “domains.” With regard to micas, although maintaining that it was not very useful to construct structural formulae, Brauns presented examples for the various micas and some chlorites, with an interesting observation: the “lattices” of micas and chlorites are in a ratio about 3:4, a ratio very close to what it was later measured: 10:14 Å for c sinß.
In the early years of the 20th century, various authors dedicated themselves to proposing new structural formulae, new molecular ratios among the oxide contents, and new molecules as end members. The large treatise by Doelter (1917) faithfully reported such proposals, which in reality contained nothing new. Niggli (1924) followed a similar approach. In his treatise, he used a strange classification for the minerals: after a first simple division on chemical bases into 12 classes (in reality, classes for chromates or arsenites seem to be useless), the determination of the minerals is made according to their morphology. Thus the micas are in the “hex agonal-plane type”! There is nothing new from the chemical point of view; in fact the micas are interpreted as complex mixtures of molecules similar to nepheline and olivine, represented as:
[Al(SiO4)3]Al2R3 [Mg(SiO4)3]Mg5 nepheline olivine
In muscovite, the nepheline molecule is largely predominant, where the ratio R(= K):H = 1:2, whereas in biotite both molecules are present, with a ratio that is usually 1:1 but which could also assume values of 2:1, 1:2, 3:2, etc., with F replacing O and OH.
A substantial improvement occurred in Niggli's treatise in that the importance of X-rays for the determination of crystalline structures was discussed extensively. Thus, the “strictly chemical” era ended. Only a few y ears later, crystal-structural studies would resolve the problems of the composition of the micas and all the silicates in general.
What were the reasons for the “failure” of chemistry? Even after the generalized application of the true atomic weights (the first treatise that dealt with them was that of Naumann 1874) for more than 50 years, the efforts of a pure chemical interpretation continuously failed because of the assumptions (which both proved wrong): (1) The existence of supposed simple ratios between the chemical components, or at least
between groups made up of these, based on chemical analogies. Thus the substitutions for K must have been Na, Li, H, and the substitutions for Mg must have been Ca, Ba.
(2) The silicates were viewed as salts of silicic acids, mainly H4SiO4 (orthosilicates). Consequently for micas, these were acidic salts, with H viewed as a cation rather than as a part of a hydroxyl OH group.
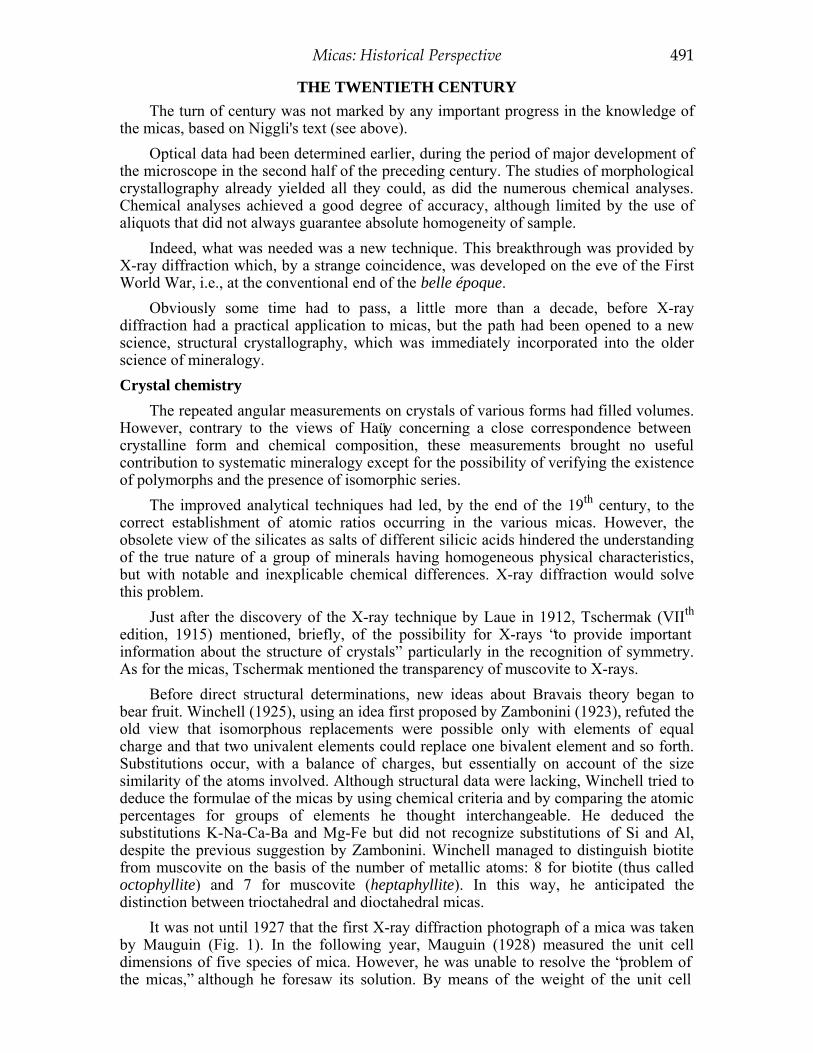
Micas: Historical Perspective 491
THE TWENTIETH CENTURY The turn of century was not marked by any important progress in the knowledge of
the micas, based on Niggli's text (see above). Optical data had been determined earlier, during the period of major development of
the microscope in the second half of the preceding century. The studies of morphological crystallography already yielded all they could, as did the numerous chemical analyses. Chemical analyses achieved a good degree of accuracy, although limited by the use of aliquots that did not always guarantee absolute homogeneity of sample.
Indeed, what was needed was a new technique. This breakthrough was provided by X-ray diffraction which, by a strange coincidence, was developed on the eve of the First World War, i.e., at the conventional end of the belle époque.
Obviously some time had to pass, a little more than a decade, before X-ray diffraction had a practical application to micas, but the path had been opened to a new science, structural crystallography, which was immediately incorporated into the older science of mineralogy. Crystal chemistry
The repeated angular measurements on crystals of various forms had filled volumes. However, contrary to the views of Haüy concerning a close correspondence between crystalline form and chemical composition, these measurements brought no useful contribution to systematic mineralogy except for the possibility of verifying the existence of polymorphs and the presence of isomorphic series.
The improved analytical techniques had led, by the end of the 19th century, to the correct establishment of atomic ratios occurring in the various micas. However, the obsolete view of the silicates as salts of different silicic acids hindered the understanding of the true nature of a group of minerals having homogeneous physical characteristics, but with notable and inexplicable chemical differences. X-ray diffraction would solve this problem.
Just after the discovery of the X-ray technique by Laue in 1912, Tschermak (VIIth edition, 1915) mentioned, briefly, of the possibility for X-rays “to provide important information about the structure of crystals” particularly in the recognition of symmetry. As for the micas, Tschermak mentioned the transparency of muscovite to X-rays.
Before direct structural determinations, new ideas about Bravais theory began to bear fruit. Winchell (1925), using an idea first proposed by Zambonini (1923), refuted the old view that isomorphous replacements were possible only with elements of equal charge and that two univalent elements could replace one bivalent element and so forth. Substitutions occur, with a balance of charges, but essentially on account of the size similarity of the atoms involved. Although structural data were lacking, Winchell tried to deduce the formulae of the micas by using chemical criteria and by comparing the atomic percentages for groups of elements he thought interchangeable. He deduced the substitutions K-Na-Ca-Ba and Mg-Fe but did not recognize substitutions of Si and Al, despite the previous suggestion by Zambonini. Winchell managed to distinguish biotite from muscovite on the basis of the number of metallic atoms: 8 for biotite (thus called octophyllite) and 7 for muscovite (heptaphyllite). In this way, he anticipated the distinction between trioctahedral and dioctahedral micas.
It was not until 1927 that the first X-ray diffraction photograph of a mica was taken by Mauguin (Fig. 1). In the following year, Mauguin (1928) measured the unit cell dimensions of five species of mica. However, he was unable to resolve the “problem of the micas,” although he foresaw its solution. By means of the weight of the unit cell
492 Cipriani
fffffff
Figure 1. An early example of an X-ray diffraction photograph of a mica: Laue pattern of phlogopite by Mauguin (1928).
obtained by multiplying its volume by the density, Mauguin was able to calculate the number of atoms present in the cell. Within experimental error, he ascertained that the number of oxygen + fluorine atoms was always equal to 12. However, because he obtained non-integer numbers for all the other atoms (e.g., Si from 2.12 to 3.69, Al from 1.10 to 3.80, etc.) he suggested that the “motif cristallin,” i.e., the elementary unit, was not repeated in the same manner and that the X rays provided only an average value for the different units of repetition. The structural framework, provided by the oxygen atoms, is always the same, but the electropositive atoms, being substituted one by one with the other, would produce a great variety of arrangements. Finally, after examining various types of isomorphous replacements always with a balance of charges and a parity of atoms (such as 2 Al = SiMg or AlK = 2 Mg), Mauguin arrived at the hypothesis for the substitution 2 Al for 3 Mg (or other substitutions that would leave the charges constant). Thus he obtained the solution of the “probl em of the micas.” The work ends with a statement about the potential of the new crystallography: “ Bien que l'abord de ces énigmes paraisse redoutable, la méthode d'analyse par les rayons X nous a fourni en si peu d'années tant de résultats dont nous n'aurions jamais osé seulement concevoir l'espoir, que nous pouvons une fois encore mettre notre confiance an elle. Elle ne trompera pas nos efforts.” [Although tackling these enigmas seemed tremendous, the X-ray analysis method has given us a lot of results in few years, that we hardly attempt to figure out; thus once more we can trust in it. Our efforts will not be deceived.]

Micas: Historical Perspective 493
The crucial year for the micas was 1930, which began with the publication of the fundamental work of W.L. Bragg (1930) on the structure of the silicates. Based on the structures of pyroxenes and amphiboles, Bragg predicted that micas have sheets of tetrahedra sharing all their basal oxygen atoms. These sheets involved the joining together of endless chains, producing a network of rings of 6 tetrahedra (see structural drawings in the chapter by Brigatti and Guggenheim, this volume). This arrangement would explain their basal cleavage and their hexagonal pseudosymmetry, in agreement with the previous unit-cell parameters determined by Mauguin (1928). In the same year Pauling, in Bragg (1930) sketched the entire structure, suggesting the sequence of tetrahedral and octahedral sheets, by using by the unit-cell parameters of Al(OH)3 and Mg(OH)2. The fundamental concept was that the tetrahedral sheets involved a constant Si-Al substitution with Si3Al composition in the common micas and a Si2Al2 composition in the brittle micas, which produced respectively one negative charge (balanced by K and/or Na) or two (balanced by Ca).
A paper by Jackson and West (1930) reported the structure of muscovite, complete with atomic coordinates. The resolution of the structure was based on the study of a crystal from Hundholmen, Norway. After a Laue image, which allowed them to verify the pseudohexagonal symmetry, they used a series of rotating and oscillating crystal patterns by Rh and Mo X-ray radiations which led them to the establish of the coordinates by obtaining projections separately from 00l, 0k0 and h00 rows to high orders, e.g., from 002 to 00.38. The possible space groups were identified by Mauguin, C4
s (Cc) or C62h (C2/c) but the latter was preferred because it is centrosymmetric, and this
appeared to be correct. Jackson and West (1930) mentioned the impossibility of a base-centered cell with a (3 Si +1 Al) tetrahedral occupation. However, they did not consider a disordered distribution but they stated the impossibility of distinguishing between the two atomic species because the similarity of their scattering factors. In conclusion, this was a structure, resolved essentially on the basis of considerations of symmetry and packing, which could be confirmed by the good agreement between the observed and calculated intensities. Later, Jackson and West (1933) simply clarified the proposed structure.
Thus Bragg's and Pauling's ideas had been verified experimentally, and the “problem of the micas” could be considered substantially resolved after more than a century
Within the context of a general proposal for all the silicates, Berman (1937) suggested a general formula for the mica group which is still valid today. It was Berman who introduced the crystal-chemical symbols W, X, Y, Z for the different lattice sites, thus changing symbols previously suggested by Bragg (1930).
Thirty years passed before another structural determination of a mica was made by Radoslovich (1960), a refinement of the structure of muscovite, in particular 2M1 polytype. The purpose was to clarify some points left open by Jackson and West (1933):
a - the presence of reflections forbidden the space group C2/c, b - a monoclinic angle different from the ideal of ß = cos-1(-a/3c), c - the non-correspondence between the dimensions of the tetrahedral sheet and the
octahedral sheet, d - the too-large K–O distance, e - the order or disorder in the tetrahedral sites, f - an explanation of the frequency of the polymorphs of the micas. Radoslovich tried to answer these problems using a crystal structure refinement
technique involving X-ray diffraction intensity data collected by the multiple-film Weissenberg method. His refinement involved a modest use of an electronic computer with two-dimensional Fourier syntheses using intensity data transferred to perforated tape

494 Cipriani
to be read by the computer. Although the R factor from more than 500 measured reflections was not especially low (0.17), Radoslovich was able to suggest some substantial differences with respect to the “ideal” coordinates determined by Jackson and West. An important discovery was the ditrigonal distortion of the ideal hexagonal ring in the tetrahedral sheet, which, however, had already been noted in other phyllosilicates. In muscovite this distortion is obtained by a rotation of the tetrahedra by ∼13°. This distortion involves also a 6+6 coordination for potassium, with very different mean distances of about 2.81 and 3.39 Å, rather than the ideal one of 12 for a hexagonal prism. The tetrahedral distances indicated a partial order, similar under certain aspects to that of orthoclase: two tetrahedra appear to be occupied only by silicon and the remaining two half by silicon and half by aluminum. Finally, Radoslovich attributed the lack of preference by muscovite for 1M, 2M2 and 3T polytypes to the ditrigonal, rather than hexagonal, symmetry (at 120°) [he also considered the possibility of the importance of the potassium ions, which tend to move in opposite directions].
Deer, Howie and Zussmann (Volume 3, 1962) reviewed the “mica group” of minerals through the 1950s. See Bailey (1984) and especially Brigatti and Guggenheim (this volume) for details of up-to-date mica crystal chemistry. Synthesis
The first reports of the synthesis of micas was by Mitscherlich (1822). He claimed to have found small homogeneous masses formed by transparent hexagonal lamellae in the slags of a Swedish foundry. This news was subsequently confirmed by Vogt in the years of 1884-1887 for other foundries, although it was bitterly denied by Rammelsberg in 1886.
The first laboratory results for synthesis from fused masses were obtained by Krushov (1887), who used a basaltic glass added to K2SiF6, AlF3, MgF2 and amorphous silica as starting materials. Doelter (1888) melted different natural silicates with NaF and MgF2. Confirmation came from Hautefeuille (1897), who worked with biotitic glasses added to K2SiF6
. In all these syntheses, fluorine-micas were obtained, because it was impossible to fix the hydroxyl in a melt at atmospheric pressure.
The first syntheses of true hydroxyl micas were achieved in the 1930s by starting with a gel of suitable composition and operating at 225-300°C and 26-90 atm (Noll 1932) or with Al(OH)3 and pure “silicic acid” with KCl at 400°C and 350 atm (Gruner 1939).
While fluor-phlogopites were obtained on an industrial scale during the Second World War, it was only in the 1950s that data of scientific importance were obtained, such as those of Yoder and Eugster for phlogopite (1954) and muscovite (1955). Using various starting materials of suitable composition, (mostly glasses both synthetic and obtained by fusion of minerals), the pressure-temperature fields of stability were determined. They turned out to be greater for the trioctahedral micas than for the dioctahedral micas.
Syntheses were then continued with a double purpose: (1) a mineral-petrogenic goal to verify the P-T conditions of formation in order to
propose eventual geothermometers and geobarometers; (2) a crystallochemical goal to investigate the mica compositional variabilities, including
that phases with elements usually less frequent in nature such as a Ge-phlogopite or a Rb-muscovite.
POLYTYPES In a conversation that took place around 1934, Pauling mentioned to Hendricks his
suspicion that polymorphs existed among the micas. Indeed, this was dutifully reported by Hendricks and Jefferson (1939) when dealing with the polymorphism of the micas.
Micas: Historical Perspective 495
Their note is the result (stated to be accidental) of the examination of X-ray diffraction patterns of about a hundred of micas, some of which appeared to be very complicated. Remembering the suspicion of Pauling, the 19th century discussions about the symmetry of the micas, and the diversity of the cell parameters measured by Jackson and West (1930) for muscovite (co = 20.04 Å) and by Mauguin (1927) for biotite ( co = 10.16 Å), Hendricks and Jefferson checked whether this was related to polymorphism.
The work, completed by optical observations, demonstrated the existence of seven different crystal modifications. After confirmation that most of the dark micas were single-layer monoclinic (~10 Å) and most of the light micas double-layer monoclinic (~20 Å), Hendricks and Jefferson found among the dark micas monoclinic forms having two and six layers, trigonal forms with three layers, and triclinic forms having six and twenty-four layers: seven different terms, therefore, along with complex mixtures of the various structures.
After these first observations, recognition of the various polymorphs multiplied. The situation was clarified by Smith and Yoder (1956) who, in addition to furnishing a key for the recognition of the various forms, provided a simple explanation in relation to the presence of the pseudohexagonal unit mesh of the T and O layers with rotations and their superposition. They also ascertained that natural trioctahedral micas prefer the 1M structure, whereas the 2M1 structure prevails in the dioctahedral forms. The 6H type has never been observed, whereas the 2O was later found only in the rare species, anandite. In addition, polytypes (this is the most correct term) not initially envisaged have been reported
When not totally occupied, the octahedra become appreciably distorted and form meshes with a ditrigonal rather than hexagonal symmetry, thus favoring the polytypes with 120° rotation (like 2M1). Consequently the tetrahedra rotate to decrease the lateral dimensions of the sheet to the smaller dimensions required by the octahedral sheet; the rotation obviously being greatest for the dioctahedral micas.
SYSTEMATICS In the “Micas” volume of Reviews in Mineralogy by Bailey (editor, 1984) 30 was the
number of accepted species, of which 25 were “true” micas (15 trioctahedral, 9 dioctahedral, plus one of 2,5 occupance) and the remaining 5 to the “brittle” micas (4 trioctahedral and 1 dioctahedral). The distinction between these two groups is based on the negative charge (~1 or ~2) presented by the formula unit of the 2:1 layer which requires neutralization with a large interlayer cation of corresponding charge.
Note the disappearance of lepidolite, the trioctahedral lithium micas being divided into polylithionite and taeniolite.
In the general crystal chemical formula, WY2-3Z4O10(OH)2, the various positions are occupied as follows:
W = K, Na, Ca, Ba, NH4, H2O Y = Mg, Al, Fe'', Fe''', Li, Mn'', Zn, V''' Z = Si, Al, Fe''', Be OH = OH, F, Cl, S, O
Unusual species are hendricksite (with Zn), roscoelite (with V), bityite (with Be), anandite (with Ba and S), and chernykhite (with Ba, NH4 and V). Altought the OH-F substitution is common in dark micas and in some cases F prevails (see Appendix I), with substitution by Cl is rare, although a biotite very rich in this element was reported (almost 5% with 1.4 positions out of 2).

496 Cipriani
There is disagreement between the mica species given in Bailey and that of Fleischer and Mandarino (1995), which at that time was considered the official one. Obvious additions are three species identified after Bailey's treatise appeared: boromuscovite with B instead of Al in the tetrahedra, norrishite an anhydrous trioctahedral form with Mn''' and Li, and nanpingite, a Cs-analogue of muscovite. It is significant that the species name lepidolite appeared again and replaced trilithionite. Furthermore, phengite was made a variety of muscovite, illite was a general name including all K-bearing micaceous clay minerals, and brammallite was used for Na-bearing micas.
Some of the names were no longer recognized. The phengite of Plinius and Suetonius was perhaps alabaster, and that of Breithaupt (1836) a generic biaxial mica. Tschermak (1878) was in error when he revived that name for a white mica which differs from muscovite because of its high Si content and its not-negligible Mg and Fe contents. This mica exihibited a rather low optic axial angle. Sericite also disappeared but it is still widely used by petrographers. Sericite (from the Greek “sericos” = silk) was proposed by List (1850) for the very fine material similar to the talc of micaschists. Later that name was used for the micaceous products of feldspars alteration, i.e., sericitization.
For more than one century, lepidomelane (“black scale,” Hausmann, in 1840) had been the name of biotite very rich in iron. Today annite is preferred, a name that was assigned by Dana (1868) to the black Mg-free mica from Cape Ann, Massachusetts, USA, which once had been identified as lepidomelane.
By contrast, various names that were once variety names have been recognized as species: siderophillite (“iron leaf”), proposed by Lewis (1878) and considered to be a biotite rich in iron; and ephesite (from Ephesus in Asia Minor), described by Smith (1853) as a product of alteration of emery deposits. Ephesite was listed as a doubtful species by Dana (1892) and not even mentioned by Hintze (1897).
On the other hand species names proliferated in the 19th century! Consider that Hintze (1897) listed 28 synonyms (or varieties) for biotite, 17 for muscovite, 7 for clintonite, 5 for margarite, 3 for zinnwaldite, 2 for paragonite and 2 for lepidolite.
In recent years a Mica Committee was appointed by the Commission on New Minerals and Mineral Names of the International Mineralogical Association. Its report (Rieder et. al. 1998) represents the standard reference for mica nomenclature. A synoptic table of the present species, with the derivation of their names, the localities of first occurrence, and references are in Appendix I.
As mentioned above, one of the approved species (lepidolite) dates back to the 18th century, about half of the spcies were identified in the 19th century (14), only one in the early years of the 20th century. All others date to the last few decades. Nine names have Greek derivation, almost all referring to the appearance. Seven names refer to where these species were first found, 3 refer to the composition and the remaining 11 to scholars working on micas. As for the locality, 7 are in Europe, 7 in Asia, 11 in America, and 2 in Africa. For 3 early species names, the first localities are unknown or not given.
CONCLUSIONS For two centuries, from the attribution of the name lepidolite and, more generally,
from the time of the first analytical data, the micas have been subjected to continuous investigation and interpretation by many scientists. From simple observation, mixed with wonder, of the small shiny scales, one progressed to precise chemical and structural determinations. In turn these have formed the basis of genetic interpretations of these minerals and of the rocks of which they are fundamental constituents. Two centuries of

Micas: Historical Perspective 497
mere descriptions, followed by another two centuries of scientific research, have brought us to our present knowledge of micas. The future is in good hands—those of our pupils.
REFERENCES The following reference list includes the works cited in the text. Many citations of the
authors are indirect, in that they have been taken from other treatises consulted. In the text, the distinction is made in following manner: for example, “Beudant (1824)” is a work that has been consulted, while “Woodward in 1728” is based on reports in other treatises, in particular Hintze (1897) if not otherwise cited. [In Appendix II all works consulted for the preparation of this historical review are reported.] Agricola G (1530) Bermannus. [French translation from Latin by Halleux R and Yans A. (1990)] Les
Belles Lettres, Paris Bailey SW (ed) (1984) Micas. Reviews in Mineralogy, Vol 13 Baumhauer H (1900) Über die Krystallformen des Muscovit. Z Kristallogr 32:164-176 Bergman T (1783) Sciagraphia regni mineralis. Signum Roboris, Florentia Berman H (1937) Constitution and classification of the natural silicates. Am Mineral 22:342-408 Berzelius J (1819) Nouveau Système de Minéralogie. Méquignon, Paris Beudant FS (1824) Traité élémentaire de Minéralogie. Verdière, Paris Bragg WL (1930) The structure of silicates. Z Kristallogr 74:237-305 Brard C (1824) Nouveaux éléments de Minéralogie. Méquignon, Paris Brauns R (1896) Chemische Mineralogie. Tauchnitz, Leipzig Breithaupt A (1836) Vollständiges Handbuch der Mineralogie. Arnold, Dresden Brochant A.J (1800) Traité élémentaire de Minéralogie. Villier, Paris Bucquet M (1771) Introduction à l'étude des corps naturels. Herissant, Paris Buffon G (1790) Histoire naturelle des minéraux. Sanson, Deux Ponts Clarke F (1889) A theory of the mica group. Am J Sci 38:384-393 Cronstedt A (1779) Saggio per formare un sistema di Mineralogia (translation from Swedish). Savioni,
Venezia Cronstedt A (1788) An Essay Toward a System of Mineralogy (translation from Swedish). Dilly, London Dana J (1868) A System of Mineralogy (V edition). Trübner, London Dana E (1892) The System of Mineralogy (VI edition). Wiley, New York Deer W, Howie R, Zussmann J (1962) Rock-forming Minerals, Vol. 3. Longmans, London Doelter C (1917) Handbuch der Mineralchemie (Bd. 2). Steinkopf, Dresden Estner A (1797) Versuch einer Mineralogie. Oehler, Wien Fleischer M, Mandarino J (1995) Glossary of Mineral Species. Mineralogical Record, Tucson, Arizona Friedel C (1893) Cours de Minéralogie. Masson, Paris Haüy RJ (1801) Traité de Minéralogie (Vols. 2 & 3). Louis, Paris Hendricks S, Jefferson M (1939) Polymorphism of the micas. Am Mineral 24:729-779 Hintze C (1897) Handbuch der Mineralogie (Bd. 2). Veit, Leipzig Jackson W, West J (1930) The crystal structure of muscovite KAl2(AlSi3)O10(OH)2. Z Kristallogr 76:
211-227 Jackson W, West J (1933) The crystal structure of muscovite. Z Kristallogr 85:160 Jameson R (1804) System of Mineralogy. Stewart, Edinburgh Kirwan R (1784) Elements of Mineralogy. London Lehmann JG (1759) Traité de Minéralogie et Métallurgie (translation from German). Herissant, Paris Mauguin C (1928) Étude des micas au moyen des rayons X. Bull Soc fr Minéral 51:285-332 Napione CA (1797) Elementi di Mineralogia. Reale Stamperia, Torino Naumann CF (1874) Elemente dei Mineralogie (IX Auflage). Engelmann, Leipzig Niggli P (1924/26) Lehrbuch der Mineralogie (II Auflage). Borntreagen, Berlin Phillips W (1837) An Elementary Introduction to Mineralogy. Longman, London Plinius GS (79 A.D.) Naturalis Historia. [Italian translation from Latin by Barchiesi A, Centi R, Corsaro M,
Marcone A, Ranucci G (1988).] Einaudi, Torino Radoslovich EW (1960) The structure of muscovite. Acta Crystallogr 13:919-932 Rammelsberg CF (1875) Handbuch der Mineralchemie (II Auflage). Engelmann, Leipzig Rammelsberg CF (1895) Handbuch der Mineralchemie (II Ergänzungsheft, II Auflage). Engelmann,
Leipzig Rieder M, Cavazzini G, D'Yakonov Yu, Frank-Kamenetskii VA, Gottardi G, Guggenheim S, Koval PV,
Müller G, Neiva AMR, Radoslovich EW, Robert JL, Sassi PF, Takeda H, Weiss Z, Wones DR (1999) Nomenclature of the micas. Mineral Mag 63:267-279
Romè de l'Isle JB (1784) Des caractères exterieurs des minéraux. Didot, Paris

498 Cipriani
Sage B (1777) Eléments de Minéralogie docimastique. Imprimerie Royale, Paris Scopoli GA (1778) Principi di Mineralogia sistematica e pratica. Novelli, Venezia Smith JV, Yoder HS Jr (1956) Experimental and theoretical studies of the mica polymorphs. Mineral Mag
31: 209-235 Stang I (1767) In “Mineralogische Belustigungen” (1770). Heineck, Leipzig Steno N (1669) De solido intra solidum naturaliter contento dissertationis prodromus. [Italian translation
from Latin by L Casella (1986)] Cassa di Risparmi e Depositi, Prato Tschermak G (1878) Die Glimmergruppe. Z Kristallogr 2:14-60 Tschermak G (1879) Die Glimmergruppe. Z Kristallogr 3:122-167 Tschermak G (1915) Lehrbuch der Mineralogie (VII Auflage). Hölder, Wien Wallerant F (1891) Traitè de Minéralogie. Baudry, Paris Wallerius J (1778) Systema mineralogicum. Officina Krausiana, Vindobona Wiedman M (1771) Essai d'une nouvelle Minéralogie (translation from Swedish). Didot, Paris Winchell A (1925) Studies in the mica group. Am J Sci 9(209):309-327 Woltersdorff J (1755) Systema Minerale. Real Schüle, Berlin Yoder HS Jr, Eugster H (1954) Phlogopite synthesis and stability range. Geochim Cosmochim Acta 6:
157-185 Yoder HS Jr, Eugster H (1955) Synthetic and natural muscovites. Geochim Cosmochim Acta 8:225-280 Zambonini F (1923) The isomorphism of albite and anorthite. Am Mineral 8:81-85
APPENDIX I Present-day nomenclature of the mica group and its derivation Species Derivation of name Locality Author Phlogopite “eye of the flame” Antwerp (N ew York, USA) Breithaupt 1841 Biotite J.B. Biot (France) ? Hausmann 1847 Annite Cape Ann (Massachusetts, USA) Cape Ann (Massachusetts, USA) Dana 1868 Ferri-annite composition Wittenrom (Austria) Miyano 1982 Polylithionite “much litium” Kangerlsluk (Greenland) Lorenzen 1884 Lepidolite “squamous stone” Rozena (Bohemia) Klaproth 1792 Tainiolite “band stone” Narsarsuk (Greenland) Flink 1897 Zinnwaldite Zinnwald (Bohemia) Zinnwald (Bohemia) Haidinger 1845 Masutomilite K. Masutomi (Japan) Tanakanijama (Japan) Harada 1977 Hendricksite S. Hendricks (USA) Franklin (New Jersey, USA) Frondel 1966 Na-phlogopite composition Perrag (Algeria) Schreyer 1980 Wonesite D. Wones (USA) Post Pound (Vermont, USA) Spear 1981 Siderophillite “iron leaf” Pije's Paek (Colorado, USA) Carwill Lewis 1878 Ephesite Ephesus (Turkey) Ephesus (Turkey) Smith 1853 Preiswerkite H. Preiswerk (CH) Geisspfad (Switzerland) Kensen 1980 Norrishite K. Norrish (Austria) Hoskins (New Jersey, USA) Eggleton 1989 Muscovite “Moscovia” ? Dana 1850 Paragonite “to mislead” M. Campione (Switzerland) Schafhäutl 1843 Chernykhite V. Chernykh (Russia) Karatan (Kazakhstan) Ankinovic 1972 Roscoelite Roscoe (USA) Colonna (California, USA) Blake 1876 Celadonite “sea-green” M.Baldo (Verona, Italy) Glock 1847 Glauconite “blue-green” ? Kaferstein 1828 Tobelite Tobe, Epime (Japan) Tobe, Epime (Japan) Higashi 1982 Boromuscovite composition Little Three (California, USA) Foord 1991 Nanpingite Nanping, Fujian (China) Nanping, Fujian (China) Yang 1988 Clintonite D. Clinton (USA) Amity (New York, USA) Fitch 1828 Kinoshitalite K. Kinoshita (Japan) Noda Tomajawa (Japan) Yoshii 1973 Anandite Ananda Coom. (India) Wilagedna (Sri Lanka) Pattiaratchi 1967 Bityite M. Bity (Madagascar) Madagascar Lacroix 1908 Margarite “pearl” Vipiteno (Bolzano, Italy) Mohs 1820
Micas: Historical Perspective 499
APPENDIX II Other works consulted in preparation of this historical review Aikin A, Aikin CR (1807) Dictionary of Chemistry and Mineralogy (Volume 2). Arch, London Bauer M (1904) Lehrbuch der Mineralogie (II Auflage). Schweizerbart, Stuttgart Benvenuti G (1790) Istituzioni di Mineralogia. Stamperia Reale, Parma Blum R (1832) Lehrbuch der Oryktognosie. Schweizerbart, Stuttgart Bomarè V (1774) Minéralogie. Vincent, Paris Bragg WL (1928) An Introduction to Crystal Analysis. Bell, London Breithaupt A (1823) Vollständige Charakteristik des Mineral Systems. Arnold, Dresden Brogniart A (1807) Traité élémentaire de Minéralogie. Deterville, Paris Carucci P (1880 ?) Elementi di mineralogia (parte II). Pasquale, Napoli Catullo A (1833) Elementi di mineralogia. Minerva, Padova Dana J (1855) A System of Mineralogy (IV edition). Trübner, London Dana E (1882) Manual of Mineralogy and Lithology (VI edition). Trübner, London De Lapparent A (1884) Cours de Minéralogie. Savy, Paris Dufrenoy A (1856) Traité de Minéralogie.Dalmont, Paris Groth P (1874) Tabellarische Übersicht der einfachen Mineralien.Vieweg, Braunschweig Groth P (1882) Tabellarische Übersicht der Mi neralien (II Auflage).Vieweg, Braunschweig Groth P (1898) Tabellarische Übersicht der Mi neralien (IV Auflage). Vieweg, Braunschweig Haidinger W (1845) Handbuch der bestimmendes Mineralogie. Braumüller, Wien Haüy RJ (1822-23) Traité de Minéralogie (Volume 4). Bachelier, Paris Heinrich E (1946) Studies in the mica group. Am. J. Sci. 244:836-848 Klockmann F (1892) Lehrbuch der Mineralogie. Enke, Stuttgart Kobell F (1864) Geschichte der Mineralogie. Gottarchen, München Lucas JA (1806) Tableau méthodique des espèces minérales. Levrault, Paris Naumann CF, Zirkel F (1901) Elemente der Mineralogie (XIV Auflage). Engelmann, Leipzig Phillips W (1852) An Elementary Introduction to Mineralogy (III edition). Longman, London Pilla L (1841) Conoscenze di Mineralogia. Manuzio, Napoli Pisani M (1883) Traité élémentaire de Minéralogie (II edition). Masson, Paris Quenstedt F.A (1877) Handbuch der Mineralogie (III Auflage). Laupp, Tübingen Ramdhor P (1942) Klockmann's Lehrbuch der Mineralogie (XII Auflage). Enke, Stuttgart Reuss F.A (1801) Lehrbuch der Mineralogie. Jacobaer, Leipzig Rossi L (1857) Nuovi principi mineralogici. Antonelli, Venezia Schaller WT, Carron NK, Fleischer M (1967) Ephesite, a trioctahedral member of margarite group. Am.
Mineral. 52:1689-1696 Strunz H (1941) Mineralogische Tabellen. Becker, Leipzig Tschermak G (1884) Lehrbuch der Mineralogie. Hölder, Wien Tschermak G (1885) Lehrbuch der Mineralogie (II Auflage). Hölder, Wien Tschermak G (1885) Trattato di Mineralogia, parte speciale (Italian translation). Le Monnier, Firenze Tschermak G (1888) Lehrbuch der Mineralogie (III Auflage). Hölder, Wien Tschermak G (1894) Lehrbuch der Mineralogie (IV Auflage). Hölder, Wien Tschermak G (1897) Lehrbuch der Mineralogie (V Auflage). Hölder, Wien Tschermak G, Sipocz L (1879) Die Clintonitgruppe. Z Kristallogr 3: 496-515 Vanberchem-Berthout J, Struve H (1796) Principes de Minéralogie. Reynier, Paris Wyckoff R (1924) The Structure of Crystals. Chemical Catalog, New York Wyckoff R (1931) The Structure of Crystals (II edition). Chemical Catalog, New York