Miami Valley Land Development Suitability Assessment
22
Miami Valley Land Development Suitability Assessment Board of Directors January 8, 2009 Martin Kim, Director of Regional Planning
Transcript of Miami Valley Land Development Suitability Assessment

Miami Valley Land Development Suitability Assessment
Board of DirectorsJanuary 8, 2009
Martin Kim, Director of Regional Planning

“Going Places” Planning Process
3 Phase process with an estimated timeline of 4 years Phase I – Existing Condition Assessment: Physical and
Non-Physical Condition Evaluation (Est. 1.5 Yrs: July 2007 – December 2008)
Phase II – Future Landscape Exploration: Future Land Use Scenario Development and Assessment (Est. 2 Yrs: January 2009 – December 2010)
Phase III – Building a Clear and Shared Regional Growth Framework (Est. 6 months: January 2011 – June 2011)

Study Overview
To provide a comprehensive overview of Region’s landscape as a final portion of the physical condition evaluation of “Going Places: An Integrated Land Use Vision for the Miami Valley Region” Evaluate suitability of regional land for potential future
land development Examine existing use of land Identify developable land for potential future development
Study Area Greene, Miami and Montgomery counties and cities of
Carlisle, Franklin, and Springboro in Warren County

Regional Land Evaluation
Regional Land Evaluation was conducted by examining: Historical Land Development Pattern Land Suitability Land Development Condition Land Development Intensity
to identify the location and amount of developable land in the Region

Land Suitability
A comprehensive regional land suitability measure was developed by combining suitability measures from: Land Suitability Assessment – Natural Environment Factors Land Suitability Assessment – Built Environment Factors

Land Development Condition
Using 2007 Land Use/Land Cover data obtained from Greene, Miami, Montgomery, and Warren counties, land use information was reclassified into:
Undeveloped Fully Developed Partially Developed Protected

Land Development Intensity
Land Development Intensity was examined by using the Transect concept
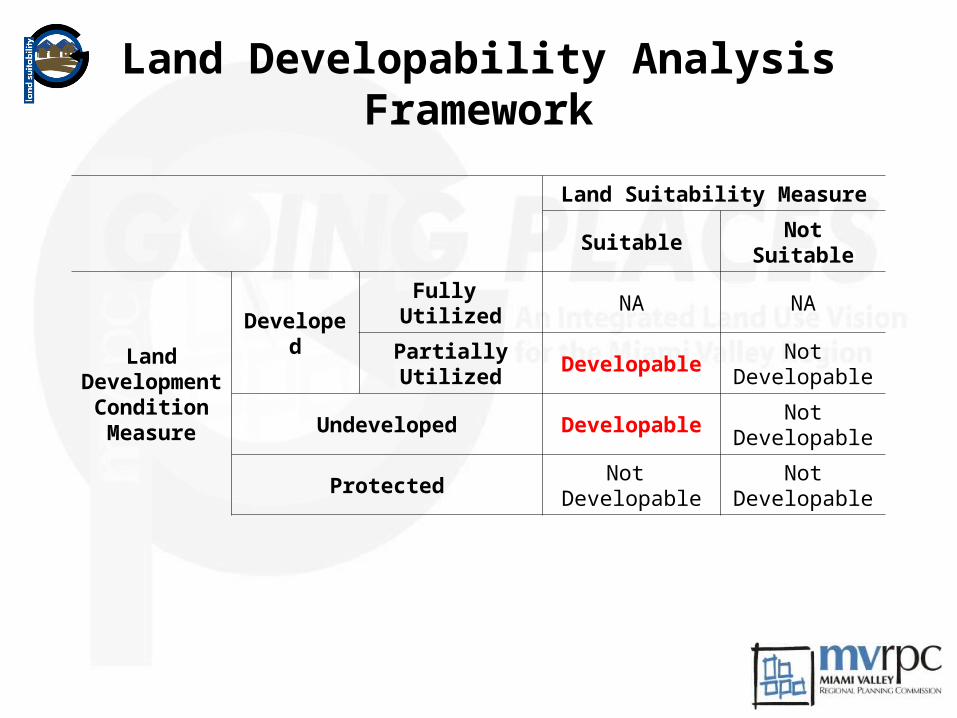
Land Developability Analysis Framework
Land Suitability Measure
Suitable Not Suitable
Land Development
Condition Measure
Developed
Fully Utilized
NA NA
Partially Utilized DevelopableNot
Developable
Undeveloped DevelopableNot
Developable
ProtectedNot
DevelopableNot
Developable

Urbanization Trends
Population:
346,864 Urbanized Area:
66.2 sq miles Population Density:
5,236 pop/sq mi

Urbanization Trends
Population:
501,694 Urbanized Area:
149.0 sq miles Population Density:
3,366 pop/sq mi
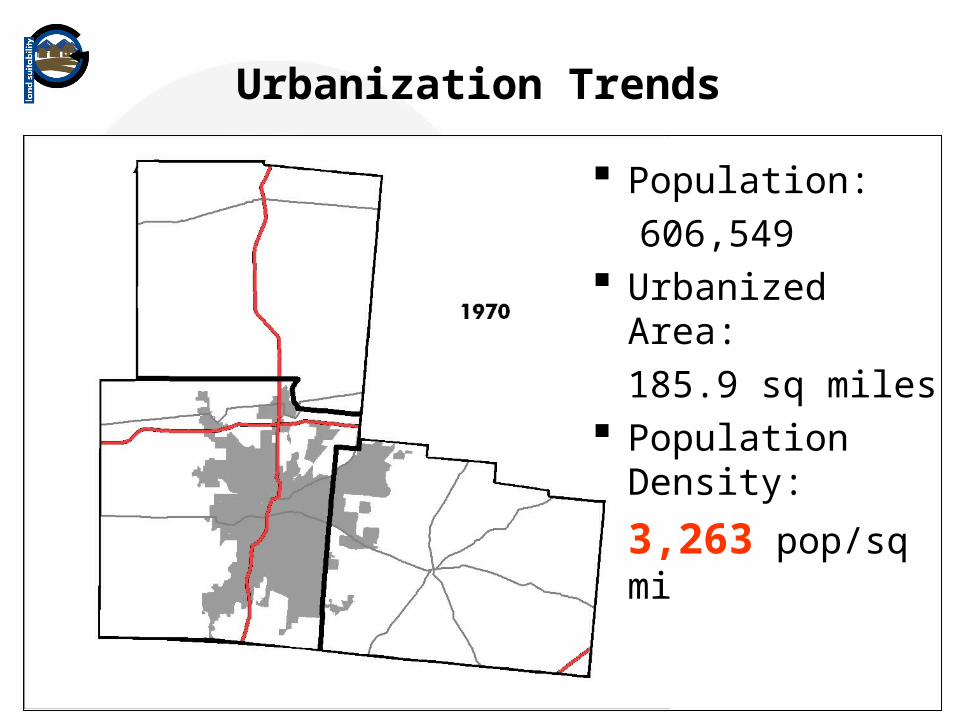
Urbanization Trends
Population:
606,549 Urbanized Area:
185.9 sq miles Population Density:
3,263 pop/sq mi

Urbanization Trends
Population:
596,134 Urbanized Area:
253.7 sq miles Population Density:
2,350 pop/sq mi

Urbanization Trends
Population:
613,147 Urbanized Area:
274.1 sq miles Population Density:
2,237 pop/sq mi

Urbanization Trends
Population:
723,955 Urbanized Area:
327.6 sq miles Population Density:
2,210 pop/sq mi

Miami Valley Region

18.4%
15.3%
13.9%
52.3%
Highly Suitable
Moderately Suitable
Suitable
Not Suitable
Land Suitability

Land Development Condition
28.8%
0.3%
66.0%
4.9%
Fully Developed Partially DevelopedUndeveloped Protected

Developable Land
26.9%
39.4%28.8%
4.9%
Developable Not Developable
Fully Developed Protected

Application
Illustrates how the land developability analysis can be used as a tool to assist local planning efforts
Zoning Vs. Land Development Condition Future Land Use Vs. Land Development Condition

Application – Zoning Zoned for Development
Vs. Land Developability Measure
Not Zoned for Development Vs.
Land Developability Measure
Conclusion
Not all of our land is equal in terms of development potential – some areas are better suited for physical development than others
The study provides a comprehensive overview of the existing regional landscape and the quantity of developable land
However, a determination of how much land is really needed for future development will be only appropriate when the future land use demand is considered
The entire Region will benefit if development is planned and executed in a manner that takes full advantage of our existing infrastructure and not threatening the quality of our natural resources

For More Information
Martin Kim, Director of Regional Planning at [email protected]
Grant Garstka, GIS Specialist/Planner at [email protected]