Miami-Miami Beach-Kendall, Florida - huduser.gov · Miami-Miami Beach-Kendal HMA ATLANTIC OCEAN...
21
COMPREHENSIVE HOUSING MARKET ANALYSIS Miami-Miami Beach-Kendall, Florida U.S. Department of Housing and Urban Development, Office of Policy Development and Research As of March 1, 2019
Transcript of Miami-Miami Beach-Kendall, Florida - huduser.gov · Miami-Miami Beach-Kendal HMA ATLANTIC OCEAN...
COMPREHENSIVE HOUSING MARKET ANALYSIS
Miami-Miami Beach-Kendall, Florida
U.S. Department of Housing and Urban Development, Office of Policy Development and Research
As of March 1, 2019
!
!
!!
!
EVERGLADESNATIONAL PARK
Miami
Doral
Kendall
Homestead
Miami Beach
Monroe
Broward
Collier
Miami-Dade
k
GULF OF MEXICO
! Places of InterestUrbanized AreasEverglades National ParkMiami-Miami Beach-Kendal HMA
ATLANTICOCEAN
Executive Summary 2Miami-Miami Beach-Kendall, Florida Comprehensive Housing Market Analysis as of March 1, 2019
Comprehensive Housing Market Analysis Miami-Miami Beach-Kendall, FloridaU.S. Department of Housing and Urban Development, Office of Policy Development and Research
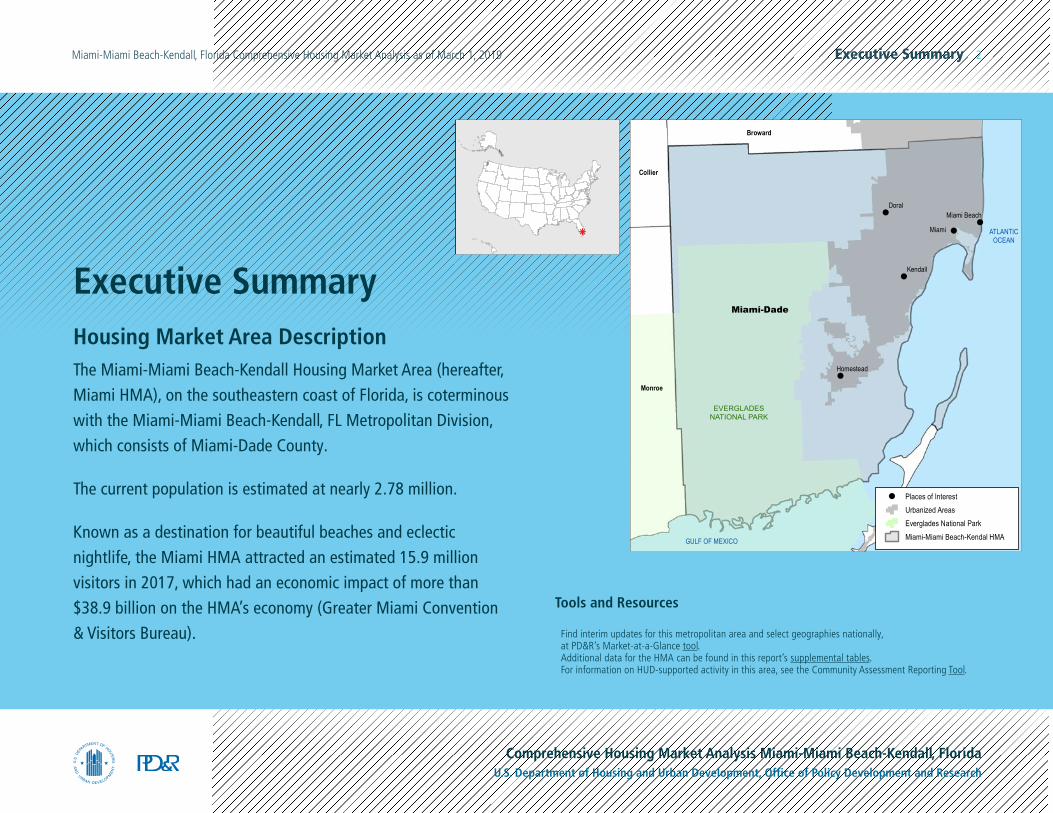
Executive SummaryHousing Market Area DescriptionThe Miami-Miami Beach-Kendall Housing Market Area (hereafter, Miami HMA), on the southeastern coast of Florida, is coterminous with the Miami-Miami Beach-Kendall, FL Metropolitan Division, which consists of Miami-Dade County.
The current population is estimated at nearly 2.78 million.
Known as a destination for beautiful beaches and eclectic nightlife, the Miami HMA attracted an estimated 15.9 million visitors in 2017, which had an economic impact of more than $38.9 billion on the HMA’s economy (Greater Miami Convention & Visitors Bureau).
Tools and Resources
Find interim updates for this metropolitan area and select geographies nationally, at PD&R’s Market-at-a-Glance tool.Additional data for the HMA can be found in this report’s supplemental tables.For information on HUD-supported activity in this area, see the Community Assessment Reporting Tool.
Executive Summary 3Miami-Miami Beach-Kendall, Florida Comprehensive Housing Market Analysis as of March 1, 2019
Comprehensive Housing Market Analysis Miami-Miami Beach-Kendall, FloridaU.S. Department of Housing and Urban Development, Office of Policy Development and Research
Market Qualifiers
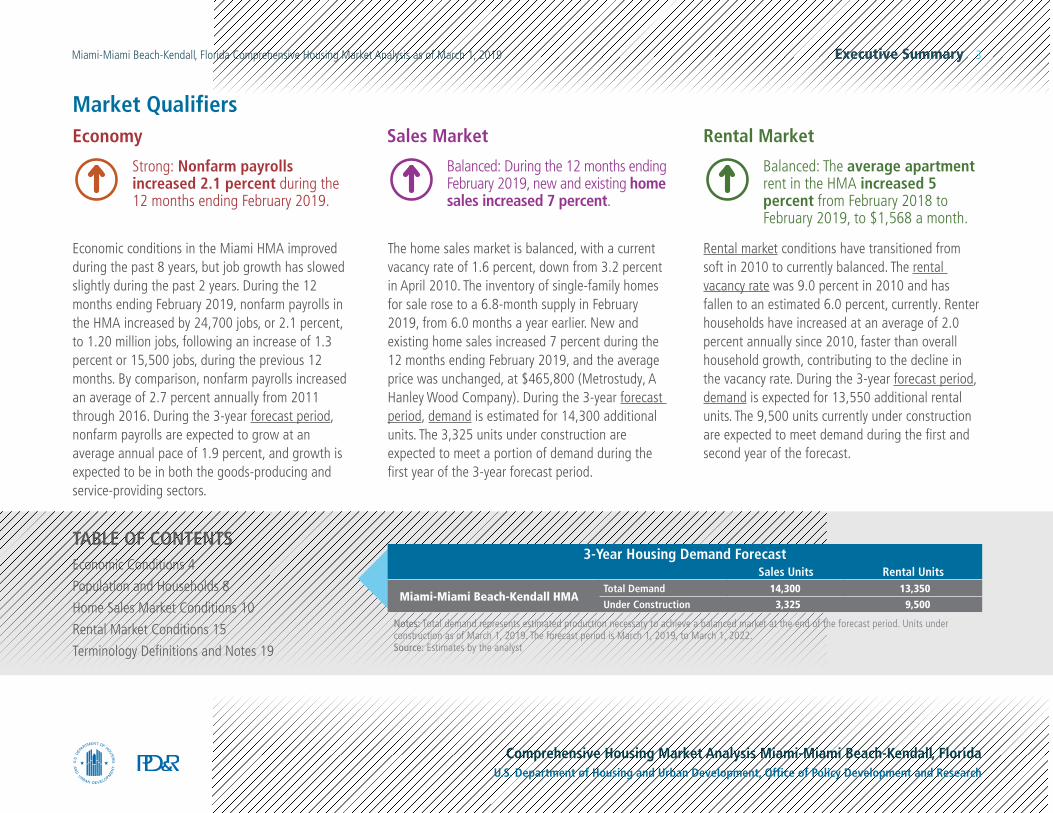
Economic conditions in the Miami HMA improved during the past 8 years, but job growth has slowed slightly during the past 2 years. During the 12 months ending February 2019, nonfarm payrolls in the HMA increased by 24,700 jobs, or 2.1 percent, to 1.20 million jobs, following an increase of 1.3 percent or 15,500 jobs, during the previous 12 months. By comparison, nonfarm payrolls increased an average of 2.7 percent annually from 2011 through 2016. During the 3-year forecast period, nonfarm payrolls are expected to grow at an average annual pace of 1.9 percent, and growth is expected to be in both the goods-producing and service-providing sectors.
The home sales market is balanced, with a current vacancy rate of 1.6 percent, down from 3.2 percent in April 2010. The inventory of single-family homes for sale rose to a 6.8-month supply in February 2019, from 6.0 months a year earlier. New and existing home sales increased 7 percent during the 12 months ending February 2019, and the average price was unchanged, at $465,800 (Metrostudy, A Hanley Wood Company). During the 3-year forecast period, demand is estimated for 14,300 additional units. The 3,325 units under construction are expected to meet a portion of demand during the first year of the 3-year forecast period.
Rental market conditions have transitioned from soft in 2010 to currently balanced. The rental vacancy rate was 9.0 percent in 2010 and has fallen to an estimated 6.0 percent, currently. Renter households have increased at an average of 2.0 percent annually since 2010, faster than overall household growth, contributing to the decline in the vacancy rate. During the 3-year forecast period, demand is expected for 13,550 additional rental units. The 9,500 units currently under construction are expected to meet demand during the first and second year of the forecast.
Economy
Strong: Nonfarm payrolls increased 2.1 percent during the 12 months ending February 2019.
Rental Market
Balanced: The average apartment rent in the HMA increased 5 percent from February 2018 to February 2019, to $1,568 a month.
Sales Market
Balanced: During the 12 months ending February 2019, new and existing home sales increased 7 percent.
TABLE OF CONTENTSEconomic Conditions 4
Population and Households 8
Home Sales Market Conditions 10
Rental Market Conditions 15
Terminology Definitions and Notes 19
Notes: Total demand represents estimated production necessary to achieve a balanced market at the end of the forecast period. Units under construction as of March 1, 2019. The forecast period is March 1, 2019, to March 1, 2022.Source: Estimates by the analyst
3-Year Housing Demand Forecast Sales Units Rental Units
Miami-Miami Beach-Kendall HMATotal Demand 14,300 13,350
Under Construction 3,325 9,500
Economic Conditions 4Miami-Miami Beach-Kendall, Florida Comprehensive Housing Market Analysis as of March 1, 2019
Comprehensive Housing Market Analysis Miami-Miami Beach-Kendall, FloridaU.S. Department of Housing and Urban Development, Office of Policy Development and Research
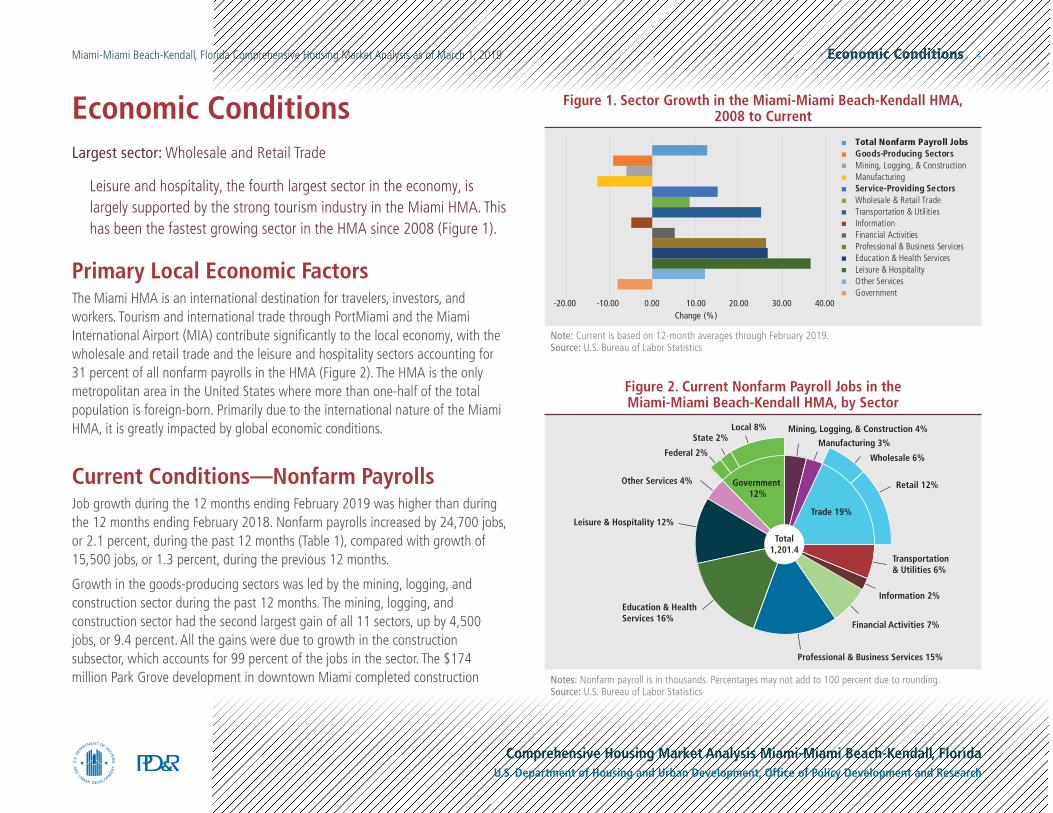
Economic ConditionsLargest sector: Wholesale and Retail Trade
Leisure and hospitality, the fourth largest sector in the economy, is largely supported by the strong tourism industry in the Miami HMA. This has been the fastest growing sector in the HMA since 2008 (Figure 1).
Primary Local Economic FactorsThe Miami HMA is an international destination for travelers, investors, and workers. Tourism and international trade through PortMiami and the Miami International Airport (MIA) contribute significantly to the local economy, with the wholesale and retail trade and the leisure and hospitality sectors accounting for 31 percent of all nonfarm payrolls in the HMA (Figure 2). The HMA is the only metropolitan area in the United States where more than one-half of the total population is foreign-born. Primarily due to the international nature of the Miami HMA, it is greatly impacted by global economic conditions.
Current Conditions—Nonfarm PayrollsJob growth during the 12 months ending February 2019 was higher than during the 12 months ending February 2018. Nonfarm payrolls increased by 24,700 jobs, or 2.1 percent, during the past 12 months (Table 1), compared with growth of 15,500 jobs, or 1.3 percent, during the previous 12 months.
Growth in the goods-producing sectors was led by the mining, logging, and construction sector during the past 12 months. The mining, logging, and construction sector had the second largest gain of all 11 sectors, up by 4,500 jobs, or 9.4 percent. All the gains were due to growth in the construction subsector, which accounts for 99 percent of the jobs in the sector. The $174 million Park Grove development in downtown Miami completed construction
-20.00 -10.00 0.00 10.00 20.00 30.00 40.00Change (%)
Total Nonfarm Payroll JobsGoods-Producing SectorsMining, Logging, & ConstructionManufacturingService-Providing SectorsWholesale & Retail TradeTransportation & UtilitiesInformationFinancial ActivitiesProfessional & Business ServicesEducation & Health ServicesLeisure & HospitalityOther ServicesGovernment
Figure 1. Sector Growth in the Miami-Miami Beach-Kendall HMA, 2008 to Current
Note: Current is based on 12-month averages through February 2019.Source: U.S. Bureau of Labor Statistics
Mining, Logging, & Construction 4%
Manufacturing 3%
Wholesale 6%
Retail 12%
Transportation& Utilities 6%
Information 2%
Financial Activities 7%
Professional & Business Services 15%
Education & HealthServices 16%
Leisure & Hospitality 12%
Other Services 4%
Federal 2%
State 2%Local 8%
Government 12%
Trade 19%
Total1,201.4
Figure 2. Current Nonfarm Payroll Jobs in the Miami-Miami Beach-Kendall HMA, by Sector
Notes: Nonfarm payroll is in thousands. Percentages may not add to 100 percent due to rounding.Source: U.S. Bureau of Labor Statistics
Economic Conditions 5Miami-Miami Beach-Kendall, Florida Comprehensive Housing Market Analysis as of March 1, 2019
Comprehensive Housing Market Analysis Miami-Miami Beach-Kendall, FloridaU.S. Department of Housing and Urban Development, Office of Policy Development and Research
on two of three towers in 2018, contributing to the increase. The final tower, a 21-story condominium building, is expected to be complete in late 2019. The manufacturing sector increased by 400 jobs, or 1.0 percent, from the previous 12 months. Job gains were partly due to the expansion of the StandardAero Component Services manufacturing facility, which resulted in the addition of approximately 50 manufacturing jobs in the HMA.
All service-providing sectors added jobs during the past 12 months. The professional and business services sector led the growth, with a gain of 6,300 jobs, or 3.6 percent. The transportation and utilities sector had the third largest gain, up by 4,300 jobs, or 5.8 percent, continuing a year-over-year expansion
12 Months Ending
February 2018
12 Months Ending
February 2019
Absolute Change
Percentage Change
Total Nonfarm Payroll Jobs 1,176.7 1,201.4 24.7 2.1
Goods-Producing Sectors 89.5 94.4 4.9 5.5
Mining, Logging, & Construction 48.4 52.9 4.5 9.4
Manufacturing 41.1 41.5 0.4 1.0
Service-Providing Sectors 1,087.3 1,107.0 19.8 1.8
Wholesale & Retail Trade 222.2 222.6 0.4 0.2
Transportation & Utilities 72.9 77.2 4.3 5.8
Information 19.4 20.0 0.6 2.9
Financial Activities 80.7 81.0 0.3 0.3
Professional & Business Services 173.8 180.1 6.3 3.6
Education & Health Services 184.2 188.2 4.0 2.2
Leisure & Hospitality 141.7 143.9 2.2 1.6
Other Services 51.3 52.2 0.9 1.7
Government 141.0 141.9 0.9 0.6
Notes: Based on 12-month averages February 2018 through February 2019. Numbers are in thousands and may not add to totals due to rounding.Source: U.S. Bureau of Labor Statistics
Table 1. 12-Month Average Nonfarm Payroll Jobs in the Miami-Miami Beach-Kendall HMA, by Sector
that began in 2010. The education and health services sector, which has posted job gains each year since 2000, added 4,000 jobs, or 2.2 percent. The leisure and hospitality sector had gains of 2,200 jobs, or 1.6 percent, as the number of cruise passengers out of PortMiami hit record highs, with 5.3 million passengers sailing during 2017, up nearly 5 percent from 2016 (Greater Miami Convention & Visitors Bureau). Royal Caribbean Cruises invested $250 million on a new terminal at PortMiami to house the world’s largest cruise ship, The Symphony of the Seas, which began service in November 2018.
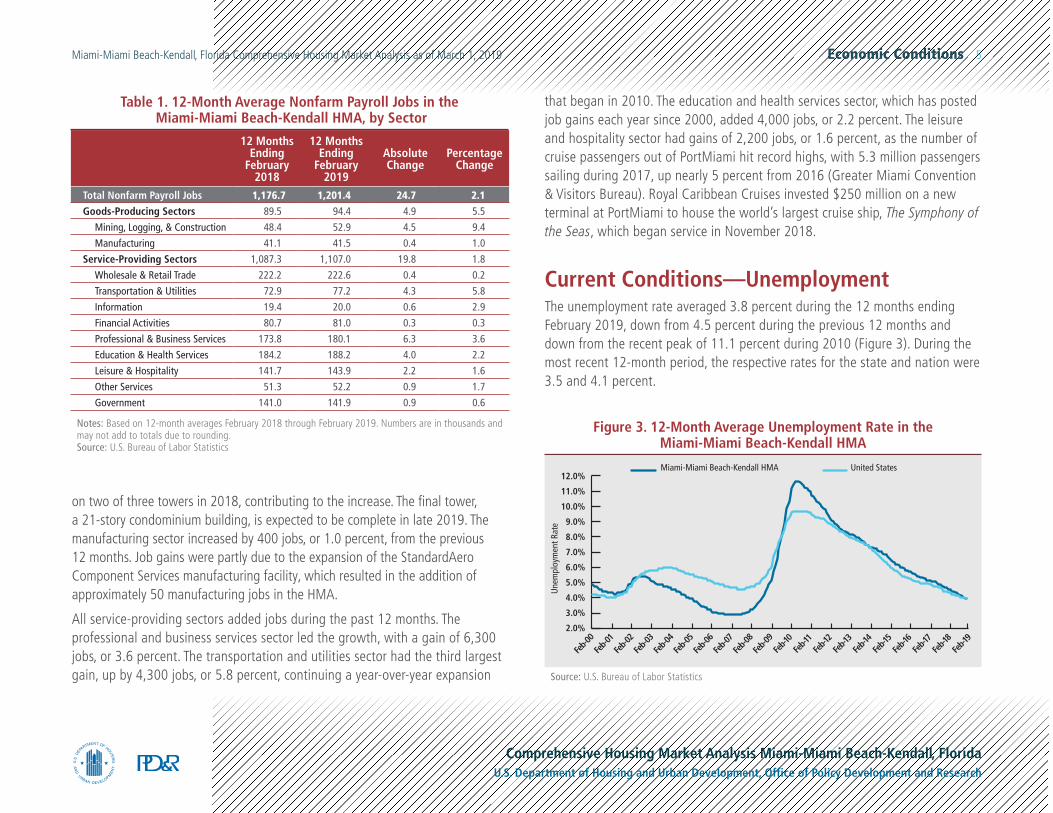
Current Conditions—UnemploymentThe unemployment rate averaged 3.8 percent during the 12 months ending February 2019, down from 4.5 percent during the previous 12 months and down from the recent peak of 11.1 percent during 2010 (Figure 3). During the most recent 12-month period, the respective rates for the state and nation were 3.5 and 4.1 percent.
12.0%
11.0%
10.0%
9.0%
8.0%
7.0%
6.0%
5.0%
4.0%
3.0%
2.0%
United StatesMiami-Miami Beach-Kendall HMA
Feb-0
0Fe
b-01
Feb-0
2Fe
b-03
Feb-0
4Fe
b-05
Feb-0
6Fe
b-07
Feb-0
8Fe
b-09
Feb-1
0Fe
b-11
Feb-1
2Fe
b-13
Feb-1
4Fe
b-15
Feb-1
6Fe
b-17
Feb-1
8Fe
b-19
Une
mpl
oym
ent R
ate
Source: U.S. Bureau of Labor Statistics
Figure 3. 12-Month Average Unemployment Rate in the Miami-Miami Beach-Kendall HMA
Economic Conditions 6Miami-Miami Beach-Kendall, Florida Comprehensive Housing Market Analysis as of March 1, 2019
Comprehensive Housing Market Analysis Miami-Miami Beach-Kendall, FloridaU.S. Department of Housing and Urban Development, Office of Policy Development and Research
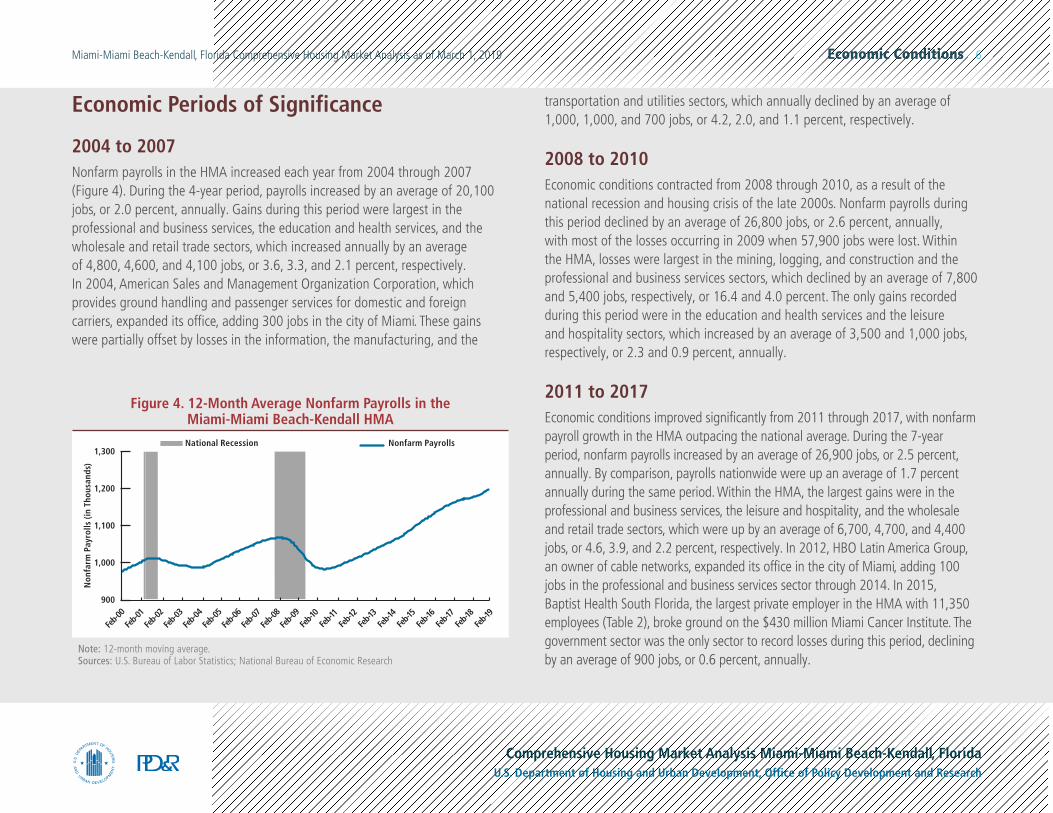
Economic Periods of Significance
2004 to 2007Nonfarm payrolls in the HMA increased each year from 2004 through 2007 (Figure 4). During the 4-year period, payrolls increased by an average of 20,100 jobs, or 2.0 percent, annually. Gains during this period were largest in the professional and business services, the education and health services, and the wholesale and retail trade sectors, which increased annually by an average of 4,800, 4,600, and 4,100 jobs, or 3.6, 3.3, and 2.1 percent, respectively. In 2004, American Sales and Management Organization Corporation, which provides ground handling and passenger services for domestic and foreign carriers, expanded its office, adding 300 jobs in the city of Miami. These gains were partially offset by losses in the information, the manufacturing, and the
transportation and utilities sectors, which annually declined by an average of 1,000, 1,000, and 700 jobs, or 4.2, 2.0, and 1.1 percent, respectively.
2008 to 2010Economic conditions contracted from 2008 through 2010, as a result of the national recession and housing crisis of the late 2000s. Nonfarm payrolls during this period declined by an average of 26,800 jobs, or 2.6 percent, annually, with most of the losses occurring in 2009 when 57,900 jobs were lost. Within the HMA, losses were largest in the mining, logging, and construction and the professional and business services sectors, which declined by an average of 7,800 and 5,400 jobs, respectively, or 16.4 and 4.0 percent. The only gains recorded during this period were in the education and health services and the leisure and hospitality sectors, which increased by an average of 3,500 and 1,000 jobs, respectively, or 2.3 and 0.9 percent, annually.
2011 to 2017Economic conditions improved significantly from 2011 through 2017, with nonfarm payroll growth in the HMA outpacing the national average. During the 7-year period, nonfarm payrolls increased by an average of 26,900 jobs, or 2.5 percent, annually. By comparison, payrolls nationwide were up an average of 1.7 percent annually during the same period. Within the HMA, the largest gains were in the professional and business services, the leisure and hospitality, and the wholesale and retail trade sectors, which were up by an average of 6,700, 4,700, and 4,400 jobs, or 4.6, 3.9, and 2.2 percent, respectively. In 2012, HBO Latin America Group, an owner of cable networks, expanded its office in the city of Miami, adding 100 jobs in the professional and business services sector through 2014. In 2015, Baptist Health South Florida, the largest private employer in the HMA with 11,350 employees (Table 2), broke ground on the $430 million Miami Cancer Institute. The government sector was the only sector to record losses during this period, declining by an average of 900 jobs, or 0.6 percent, annually.
1,300
1,200
1,100
1,000
900
National Recession Nonfarm Payrolls
Non
farm
Pay
rolls
(in
Thou
sand
s)
Feb-0
0Fe
b-01
Feb-0
2Fe
b-03
Feb-0
4Fe
b-05
Feb-0
6Fe
b-07
Feb-0
8Fe
b-09
Feb-1
0Fe
b-11
Feb-1
2Fe
b-13
Feb-1
4Fe
b-15
Feb-1
6Fe
b-17
Feb-1
8Fe
b-19
Figure 4. 12-Month Average Nonfarm Payrolls in the Miami-Miami Beach-Kendall HMA
Note: 12-month moving average.Sources: U.S. Bureau of Labor Statistics; National Bureau of Economic Research
Economic Conditions 7Miami-Miami Beach-Kendall, Florida Comprehensive Housing Market Analysis as of March 1, 2019
Comprehensive Housing Market Analysis Miami-Miami Beach-Kendall, FloridaU.S. Department of Housing and Urban Development, Office of Policy Development and Research
Employment ForecastDuring the next 3 years, payrolls are expected to increase an average of 1.9 percent annually. Job growth is expected to continue, but at a slower pace compared with the rate of growth since 2010. Tight labor market conditions during the 3-year forecast period are expected to result in a relatively low unemployment rate.
The goods-producing and the service-providing sectors are both expected to contribute to payroll growth during the next 3 years. Miami Worldcenter began construction in early 2018 on a $5 billion mixed-use development. The 444-unit Caoba apartment building, which opened in January 2019, was the first tower completed of at least five planned at buildout. Construction is expected to continue through 2023 and consist of more than 300,000 square-feet of restaurant, retail, and entertainment venues, 500,000 square-feet of office space, and 500,000 square-feet of expo space. Construction is also planned for 1,875 residential units, including the 500-unit Paramount Miami condominium development, and nearly 2,050 hotel rooms, including the 348-room CitizenM hotel and the 1,700-room Marriott Marquis.
Table 2. Major Employers in the Miami-Miami Beach-Kendall HMA
Name of Employer Nonfarm Payroll Sector Number of Employees
Miami-Dade County Government 25,502
Federal Government Government 19,200
Florida State Government Government 17,100
Baptist Health South Florida Education & Health Services 11,353
University of Miami Education & Health Services 12,818
American Airlines Transportation & Utilities 11,031
Jackson Health System Government 9,797
City of Miami Government 3,997
Nicklaus Children’s Hospital Education & Health Services 3,500
Carnival Cruise Lines Transportation & Utilities 3,500
Note: Excludes local school districts.Source: The Beacon Council
Population and Households 8Miami-Miami Beach-Kendall, Florida Comprehensive Housing Market Analysis as of March 1, 2019
Comprehensive Housing Market Analysis Miami-Miami Beach-Kendall, FloridaU.S. Department of Housing and Urban Development, Office of Policy Development and Research
Population and HouseholdsCurrent population: : 2,775,000
Net in-migration has accounted for approximately 62 percent of population growth in the Miami HMA since 2010, with net international in-migration exceeding net domestic out-migration.
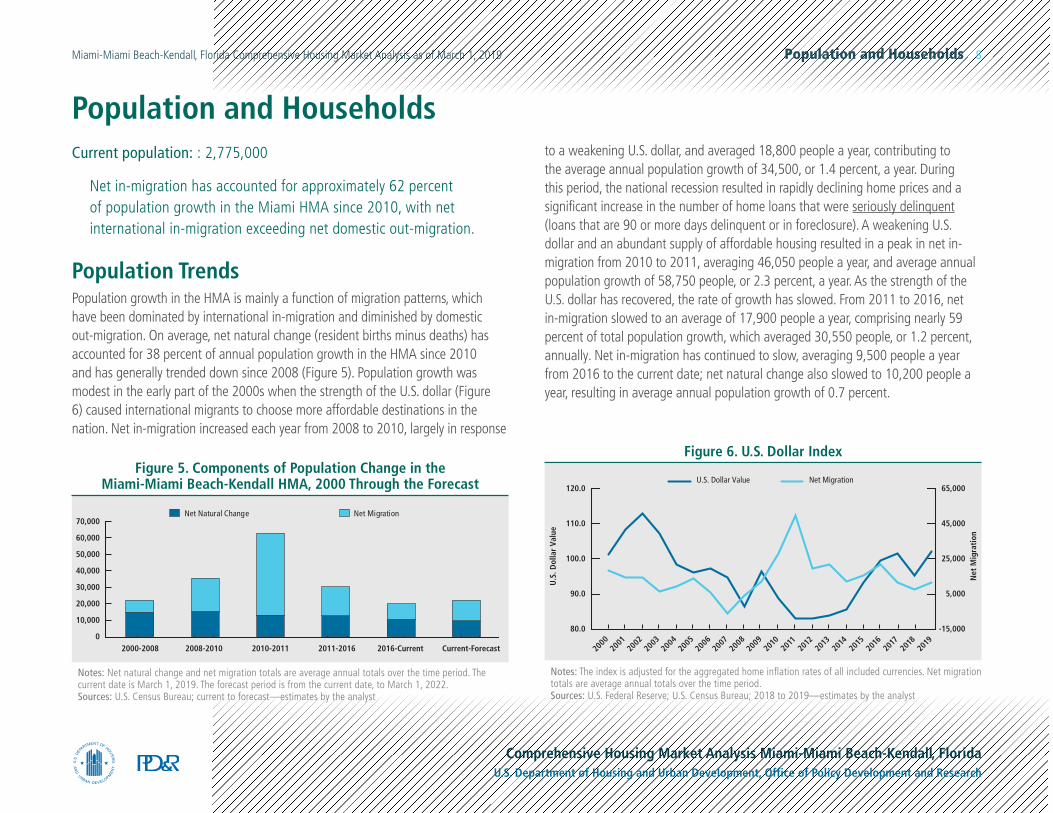
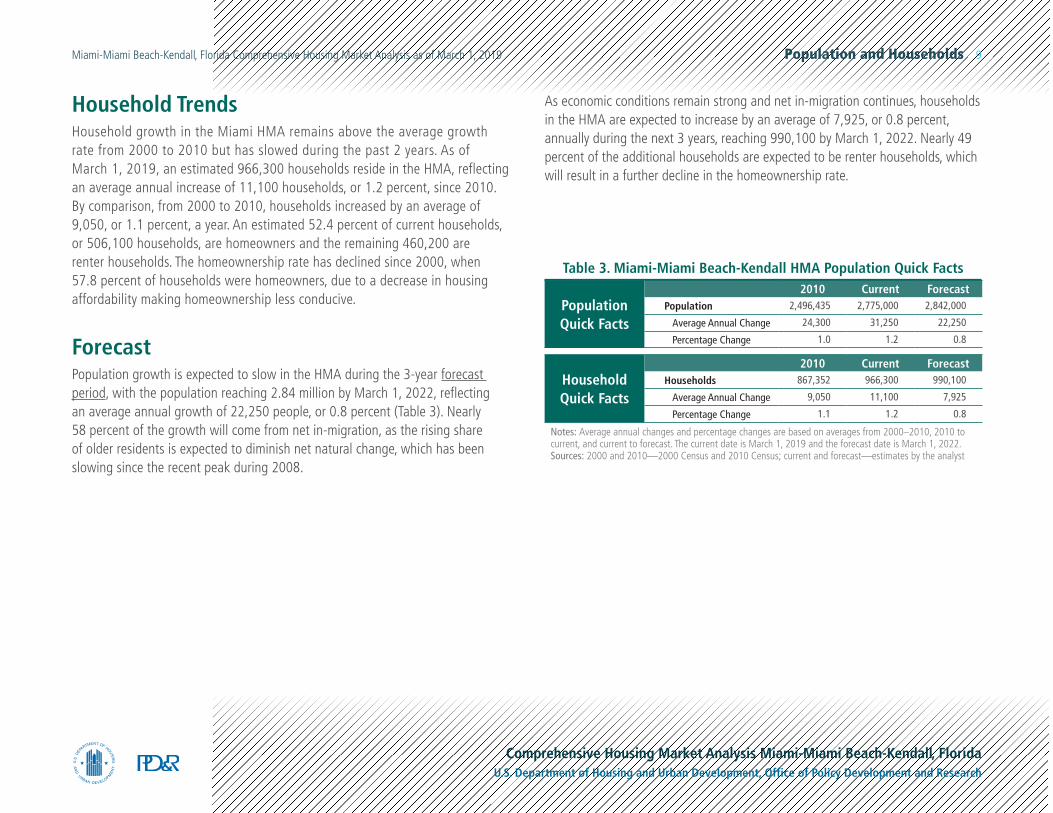
Population TrendsPopulation growth in the HMA is mainly a function of migration patterns, which have been dominated by international in-migration and diminished by domestic out-migration. On average, net natural change (resident births minus deaths) has accounted for 38 percent of annual population growth in the HMA since 2010 and has generally trended down since 2008 (Figure 5). Population growth was modest in the early part of the 2000s when the strength of the U.S. dollar (Figure 6) caused international migrants to choose more affordable destinations in the nation. Net in-migration increased each year from 2008 to 2010, largely in response
to a weakening U.S. dollar, and averaged 18,800 people a year, contributing to the average annual population growth of 34,500, or 1.4 percent, a year. During this period, the national recession resulted in rapidly declining home prices and a significant increase in the number of home loans that were seriously delinquent (loans that are 90 or more days delinquent or in foreclosure). A weakening U.S. dollar and an abundant supply of affordable housing resulted in a peak in net in-migration from 2010 to 2011, averaging 46,050 people a year, and average annual population growth of 58,750 people, or 2.3 percent, a year. As the strength of the U.S. dollar has recovered, the rate of growth has slowed. From 2011 to 2016, net in-migration slowed to an average of 17,900 people a year, comprising nearly 59 percent of total population growth, which averaged 30,550 people, or 1.2 percent, annually. Net in-migration has continued to slow, averaging 9,500 people a year from 2016 to the current date; net natural change also slowed to 10,200 people a year, resulting in average annual population growth of 0.7 percent.
70,000
60,000
50,000
40,000
30,000
20,000
10,000
0
Net MigrationNet Natural Change
2000-2008 2008-2010 2010-2011 2011-2016 2016-Current Current-Forecast
Figure 5. Components of Population Change in the Miami-Miami Beach-Kendall HMA, 2000 Through the Forecast
Notes: Net natural change and net migration totals are average annual totals over the time period. The current date is March 1, 2019. The forecast period is from the current date, to March 1, 2022.Sources: U.S. Census Bureau; current to forecast—estimates by the analyst
120.0
110.0
100.0
90.0
80.0
U.S
. Dol
lar
Valu
e
Net
Mig
rati
on
65,000
45,000
25,000
5,000
-15,000
Net MigrationU.S. Dollar Value
2000
2001
2002
2003
2004
2005
2006
2007
2008
2009
2010
2011
2012
2013
2014
2015
2016
2017
2018
2019
Figure 6. U.S. Dollar Index
Notes: The index is adjusted for the aggregated home inflation rates of all included currencies. Net migration totals are average annual totals over the time period.Sources: U.S. Federal Reserve; U.S. Census Bureau; 2018 to 2019—estimates by the analyst
Population and Households 9Miami-Miami Beach-Kendall, Florida Comprehensive Housing Market Analysis as of March 1, 2019
Comprehensive Housing Market Analysis Miami-Miami Beach-Kendall, FloridaU.S. Department of Housing and Urban Development, Office of Policy Development and Research
Household TrendsHousehold growth in the Miami HMA remains above the average growth rate from 2000 to 2010 but has slowed during the past 2 years. As of March 1, 2019, an estimated 966,300 households reside in the HMA, reflecting an average annual increase of 11,100 households, or 1.2 percent, since 2010. By comparison, from 2000 to 2010, households increased by an average of 9,050, or 1.1 percent, a year. An estimated 52.4 percent of current households, or 506,100 households, are homeowners and the remaining 460,200 are renter households. The homeownership rate has declined since 2000, when 57.8 percent of households were homeowners, due to a decrease in housing affordability making homeownership less conducive.
ForecastPopulation growth is expected to slow in the HMA during the 3-year forecast period, with the population reaching 2.84 million by March 1, 2022, reflecting an average annual growth of 22,250 people, or 0.8 percent (Table 3). Nearly 58 percent of the growth will come from net in-migration, as the rising share of older residents is expected to diminish net natural change, which has been slowing since the recent peak during 2008.
As economic conditions remain strong and net in-migration continues, households in the HMA are expected to increase by an average of 7,925, or 0.8 percent, annually during the next 3 years, reaching 990,100 by March 1, 2022. Nearly 49 percent of the additional households are expected to be renter households, which will result in a further decline in the homeownership rate.
Population Quick Facts
2010 Current ForecastPopulation 2,496,435 2,775,000 2,842,000
Average Annual Change 24,300 31,250 22,250
Percentage Change 1.0 1.2 0.8
Household Quick Facts
2010 Current ForecastHouseholds 867,352 966,300 990,100
Average Annual Change 9,050 11,100 7,925
Percentage Change 1.1 1.2 0.8
Notes: Average annual changes and percentage changes are based on averages from 2000–2010, 2010 to current, and current to forecast. The current date is March 1, 2019 and the forecast date is March 1, 2022.Sources: 2000 and 2010—2000 Census and 2010 Census; current and forecast—estimates by the analyst
Table 3. Miami-Miami Beach-Kendall HMA Population Quick Facts
Home Sales Market Conditions 10Miami-Miami Beach-Kendall, Florida Comprehensive Housing Market Analysis as of March 1, 2019
Comprehensive Housing Market Analysis Miami-Miami Beach-Kendall, FloridaU.S. Department of Housing and Urban Development, Office of Policy Development and Research
Home Sales Market ConditionsMarket Conditions: Balanced
Total home sales in the Miami HMA, during the 12 months ending February 2019, are up from the previous 12 months but remain below the recent peak during 2015.
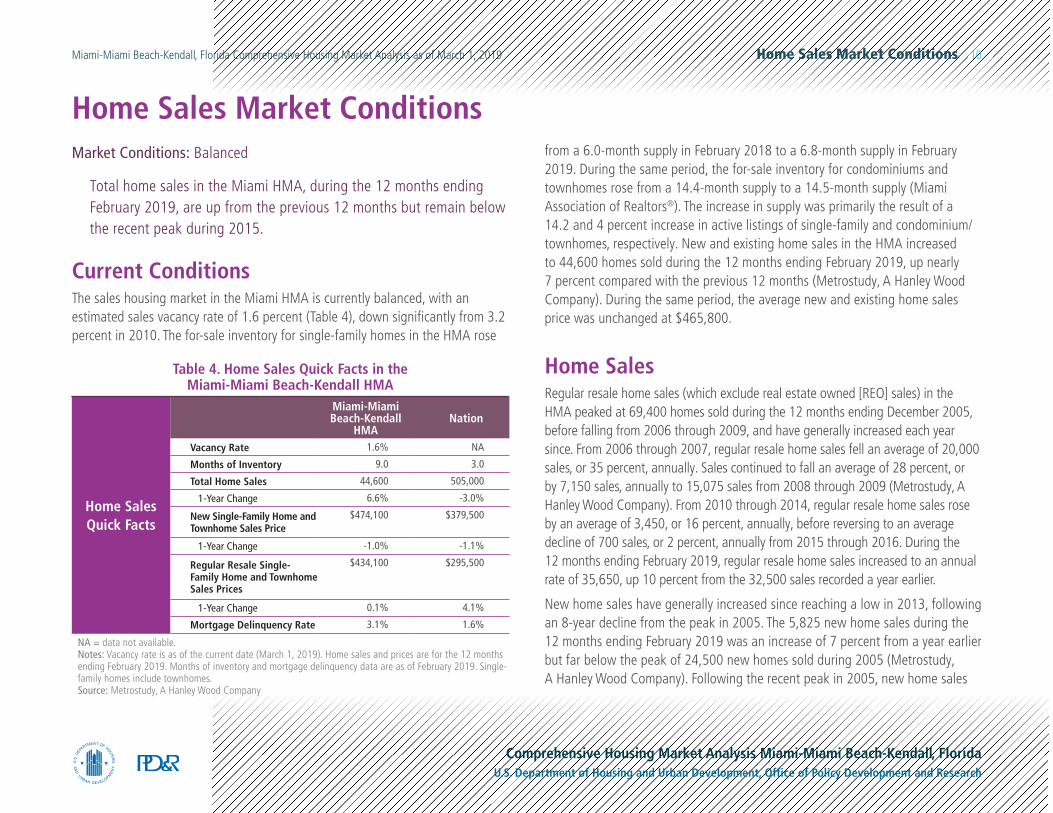
Current ConditionsThe sales housing market in the Miami HMA is currently balanced, with an estimated sales vacancy rate of 1.6 percent (Table 4), down significantly from 3.2 percent in 2010. The for-sale inventory for single-family homes in the HMA rose
from a 6.0-month supply in February 2018 to a 6.8-month supply in February 2019. During the same period, the for-sale inventory for condominiums and townhomes rose from a 14.4-month supply to a 14.5-month supply (Miami Association of Realtors®). The increase in supply was primarily the result of a 14.2 and 4 percent increase in active listings of single-family and condominium/townhomes, respectively. New and existing home sales in the HMA increased to 44,600 homes sold during the 12 months ending February 2019, up nearly 7 percent compared with the previous 12 months (Metrostudy, A Hanley Wood Company). During the same period, the average new and existing home sales price was unchanged at $465,800.
Home SalesRegular resale home sales (which exclude real estate owned [REO] sales) in the HMA peaked at 69,400 homes sold during the 12 months ending December 2005, before falling from 2006 through 2009, and have generally increased each year since. From 2006 through 2007, regular resale home sales fell an average of 20,000 sales, or 35 percent, annually. Sales continued to fall an average of 28 percent, or by 7,150 sales, annually to 15,075 sales from 2008 through 2009 (Metrostudy, A Hanley Wood Company). From 2010 through 2014, regular resale home sales rose by an average of 3,450, or 16 percent, annually, before reversing to an average decline of 700 sales, or 2 percent, annually from 2015 through 2016. During the 12 months ending February 2019, regular resale home sales increased to an annual rate of 35,650, up 10 percent from the 32,500 sales recorded a year earlier.
New home sales have generally increased since reaching a low in 2013, following an 8-year decline from the peak in 2005. The 5,825 new home sales during the 12 months ending February 2019 was an increase of 7 percent from a year earlier but far below the peak of 24,500 new homes sold during 2005 (Metrostudy, A Hanley Wood Company). Following the recent peak in 2005, new home sales
Home Sales Quick Facts
Miami-Miami Beach-Kendall
HMANation
Vacancy Rate 1.6% NA
Months of Inventory 9.0 3.0
Total Home Sales 44,600 505,000
1-Year Change 6.6% -3.0%
New Single-Family Home and Townhome Sales Price
$474,100 $379,500
1-Year Change -1.0% -1.1%
Regular Resale Single-Family Home and Townhome Sales Prices
$434,100 $295,500
1-Year Change 0.1% 4.1%
Mortgage Delinquency Rate 3.1% 1.6%
NA = data not available. Notes: Vacancy rate is as of the current date (March 1, 2019). Home sales and prices are for the 12 months ending February 2019. Months of inventory and mortgage delinquency data are as of February 2019. Single-family homes include townhomes.Source: Metrostudy, A Hanley Wood Company
Table 4. Home Sales Quick Facts in the Miami-Miami Beach-Kendall HMA
Home Sales Market Conditions 11Miami-Miami Beach-Kendall, Florida Comprehensive Housing Market Analysis as of March 1, 2019
Comprehensive Housing Market Analysis Miami-Miami Beach-Kendall, FloridaU.S. Department of Housing and Urban Development, Office of Policy Development and Research
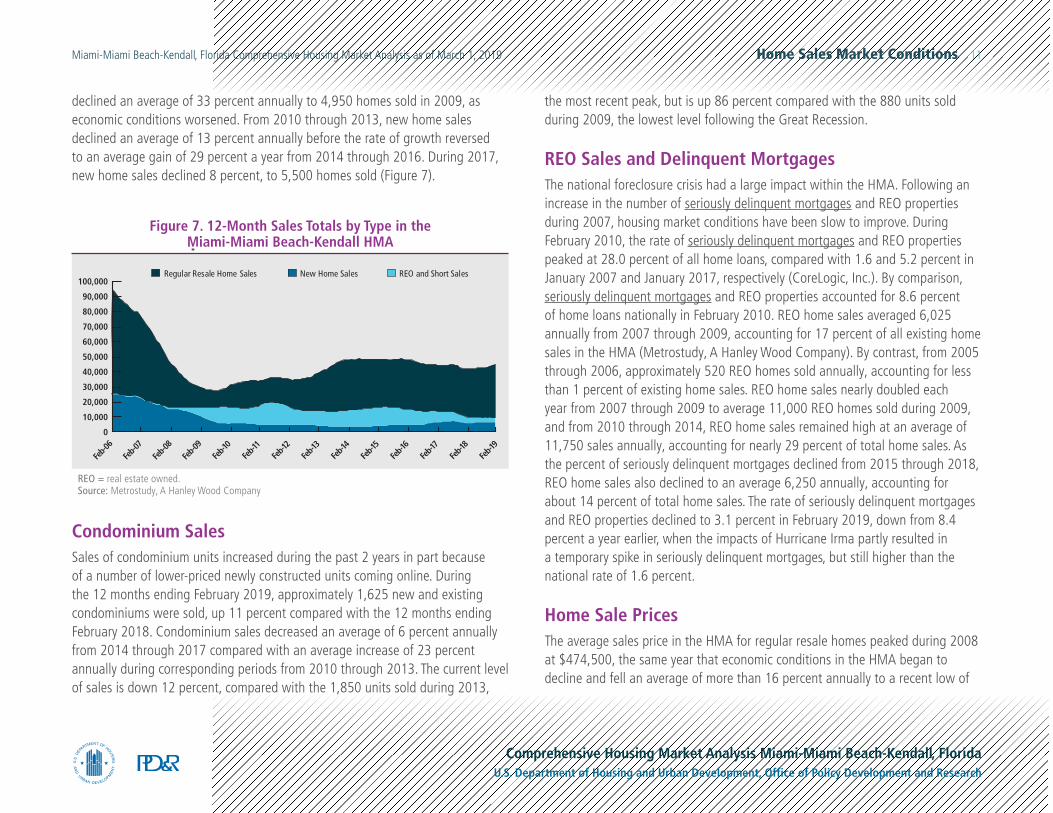
declined an average of 33 percent annually to 4,950 homes sold in 2009, as economic conditions worsened. From 2010 through 2013, new home sales declined an average of 13 percent annually before the rate of growth reversed to an average gain of 29 percent a year from 2014 through 2016. During 2017, new home sales declined 8 percent, to 5,500 homes sold (Figure 7).
Condominium SalesSales of condominium units increased during the past 2 years in part because of a number of lower-priced newly constructed units coming online. During the 12 months ending February 2019, approximately 1,625 new and existing condominiums were sold, up 11 percent compared with the 12 months ending February 2018. Condominium sales decreased an average of 6 percent annually from 2014 through 2017 compared with an average increase of 23 percent annually during corresponding periods from 2010 through 2013. The current level of sales is down 12 percent, compared with the 1,850 units sold during 2013,
the most recent peak, but is up 86 percent compared with the 880 units sold during 2009, the lowest level following the Great Recession.
REO Sales and Delinquent MortgagesThe national foreclosure crisis had a large impact within the HMA. Following an increase in the number of seriously delinquent mortgages and REO properties during 2007, housing market conditions have been slow to improve. During February 2010, the rate of seriously delinquent mortgages and REO properties peaked at 28.0 percent of all home loans, compared with 1.6 and 5.2 percent in January 2007 and January 2017, respectively (CoreLogic, Inc.). By comparison, seriously delinquent mortgages and REO properties accounted for 8.6 percent of home loans nationally in February 2010. REO home sales averaged 6,025 annually from 2007 through 2009, accounting for 17 percent of all existing home sales in the HMA (Metrostudy, A Hanley Wood Company). By contrast, from 2005 through 2006, approximately 520 REO homes sold annually, accounting for less than 1 percent of existing home sales. REO home sales nearly doubled each year from 2007 through 2009 to average 11,000 REO homes sold during 2009, and from 2010 through 2014, REO home sales remained high at an average of 11,750 sales annually, accounting for nearly 29 percent of total home sales. As the percent of seriously delinquent mortgages declined from 2015 through 2018, REO home sales also declined to an average 6,250 annually, accounting for about 14 percent of total home sales. The rate of seriously delinquent mortgages and REO properties declined to 3.1 percent in February 2019, down from 8.4 percent a year earlier, when the impacts of Hurricane Irma partly resulted in a temporary spike in seriously delinquent mortgages, but still higher than the national rate of 1.6 percent.
Home Sale PricesThe average sales price in the HMA for regular resale homes peaked during 2008 at $474,500, the same year that economic conditions in the HMA began to decline and fell an average of more than 16 percent annually to a recent low of
-
100,000
90,000
80,000
70,000
60,000
50,000
40,000
30,000
20,000
10,000
0
REO and Short SalesNew Home SalesRegular Resale Home Sales
Feb-0
6Fe
b-07
Feb-0
8Fe
b-09
Feb-1
0Fe
b-11
Feb-1
2Fe
b-13
Feb-1
4Fe
b-15
Feb-1
6Fe
b-17
Feb-1
8Fe
b-19
Figure 7. 12-Month Sales Totals by Type in the Miami-Miami Beach-Kendall HMA
REO = real estate owned.Source: Metrostudy, A Hanley Wood Company
Home Sales Market Conditions 12Miami-Miami Beach-Kendall, Florida Comprehensive Housing Market Analysis as of March 1, 2019
Comprehensive Housing Market Analysis Miami-Miami Beach-Kendall, FloridaU.S. Department of Housing and Urban Development, Office of Policy Development and Research
$333,300 during 2010. The prevalence of REO sales, which grew to an average of 29 percent of all sales from 2010 through 2014, impacted home prices, particularly in the period of rapidly declining prices from 2008 through 2010. During 2009, the average REO sales price was only 40 percent of the average sales price for regular resale homes, placing strong downward pressure on home prices. From 2010 through 2015, when the HMA worked through a large number of foreclosures, the average regular resale home sales price increased 4 percent annually to $435,800. During 2016, as the value of the U.S. dollar increased, restricting the buying power of international buyers, average regular resale home prices declined 4 percent, to $416,800. During the 12 months ending February 2019, the average sales price for regular resale homes was $434,100, virtually unchanged from a year ago.
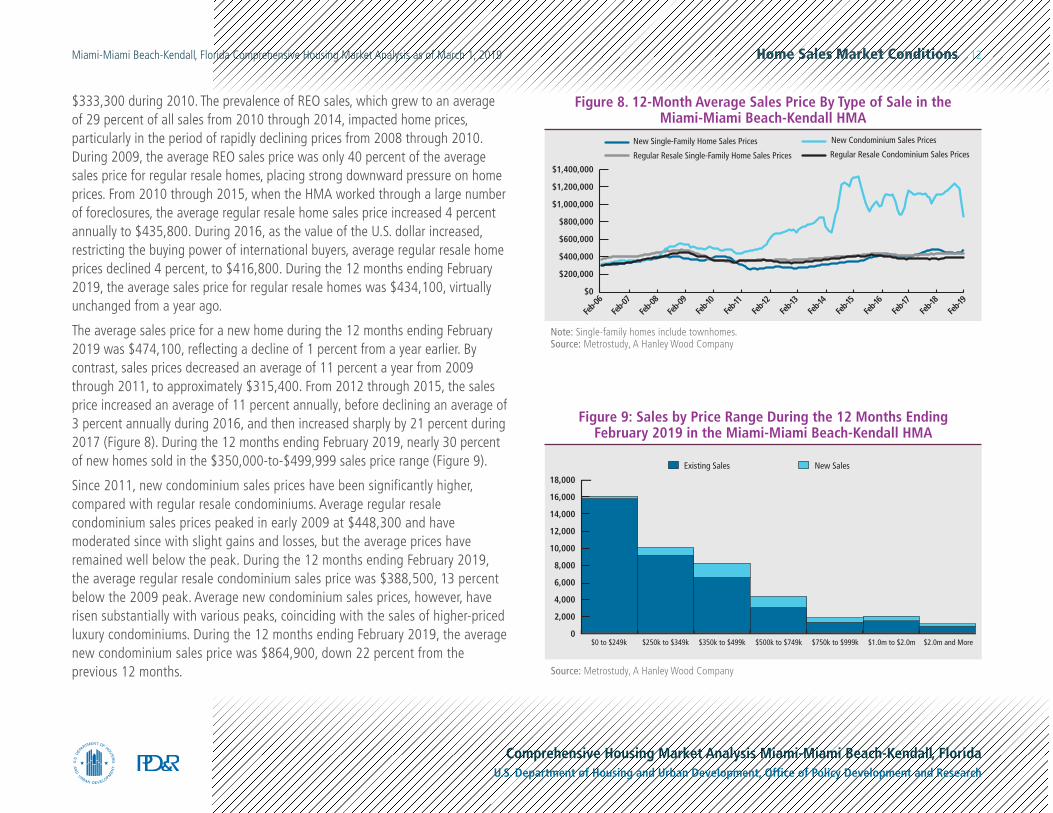
The average sales price for a new home during the 12 months ending February 2019 was $474,100, reflecting a decline of 1 percent from a year earlier. By contrast, sales prices decreased an average of 11 percent a year from 2009 through 2011, to approximately $315,400. From 2012 through 2015, the sales price increased an average of 11 percent annually, before declining an average of 3 percent annually during 2016, and then increased sharply by 21 percent during 2017 (Figure 8). During the 12 months ending February 2019, nearly 30 percent of new homes sold in the $350,000-to-$499,999 sales price range (Figure 9).
Since 2011, new condominium sales prices have been significantly higher, compared with regular resale condominiums. Average regular resale condominium sales prices peaked in early 2009 at $448,300 and have moderated since with slight gains and losses, but the average prices have remained well below the peak. During the 12 months ending February 2019, the average regular resale condominium sales price was $388,500, 13 percent below the 2009 peak. Average new condominium sales prices, however, have risen substantially with various peaks, coinciding with the sales of higher-priced luxury condominiums. During the 12 months ending February 2019, the average new condominium sales price was $864,900, down 22 percent from the previous 12 months.
18,000
16,000
14,000
12,000
10,000
8,000
6,000
4,000
2,000
0
New SalesExisting Sales
$350k to $499k$250k to $349k $500k to $749k $750k to $999k $1.0m to $2.0m $2.0m and More$0 to $249k
Figure 9: Sales by Price Range During the 12 Months Ending February 2019 in the Miami-Miami Beach-Kendall HMA
Source: Metrostudy, A Hanley Wood Company
$1,400,000
$1,200,000
$1,000,000
$800,000
$600,000
$400,000
$200,000
$0
New Condominium Sales PricesNew Single-Family Home Sales Prices
Feb-0
6Fe
b-07
Feb-0
8Fe
b-09
Feb-1
0Fe
b-11
Feb-1
2Fe
b-13
Feb-1
4Fe
b-15
Feb-1
6Fe
b-17
Feb-1
8Fe
b-19
Regular Resale Single-Family Home Sales Prices Regular Resale Condominium Sales Prices
Figure 8. 12-Month Average Sales Price By Type of Sale in the Miami-Miami Beach-Kendall HMA
Note: Single-family homes include townhomes.Source: Metrostudy, A Hanley Wood Company
Home Sales Market Conditions 13Miami-Miami Beach-Kendall, Florida Comprehensive Housing Market Analysis as of March 1, 2019
Comprehensive Housing Market Analysis Miami-Miami Beach-Kendall, FloridaU.S. Department of Housing and Urban Development, Office of Policy Development and Research
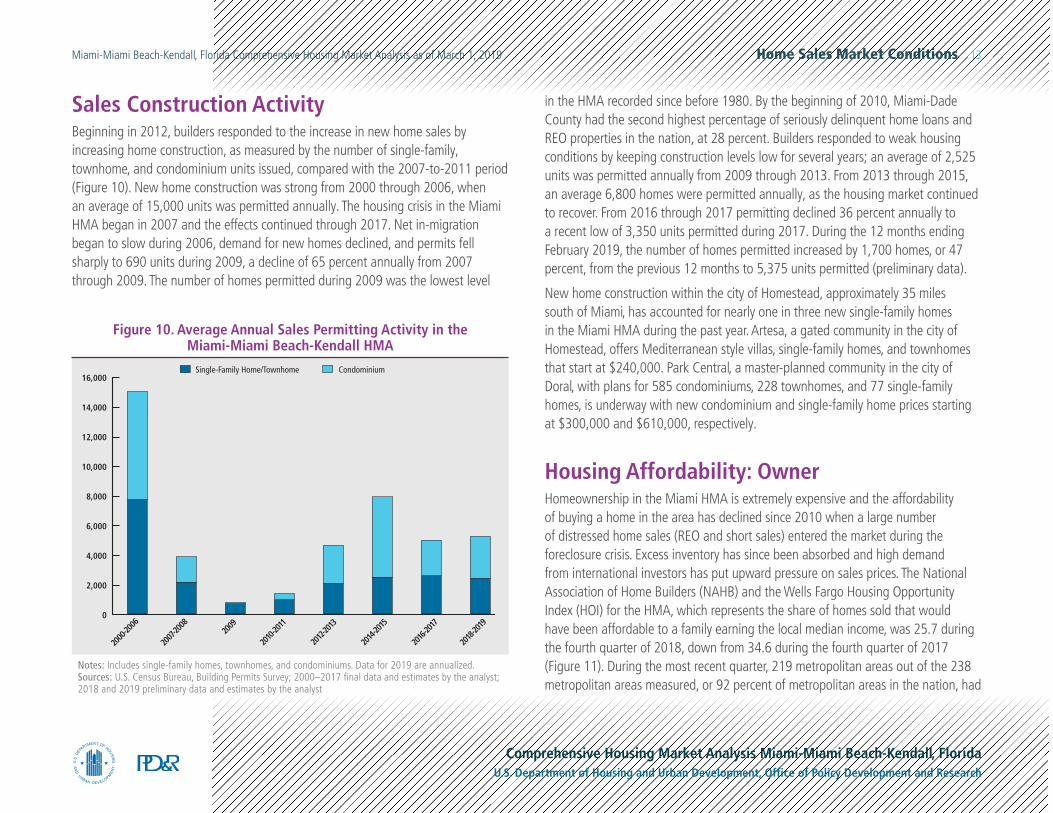
Sales Construction ActivityBeginning in 2012, builders responded to the increase in new home sales by increasing home construction, as measured by the number of single-family, townhome, and condominium units issued, compared with the 2007-to-2011 period (Figure 10). New home construction was strong from 2000 through 2006, when an average of 15,000 units was permitted annually. The housing crisis in the Miami HMA began in 2007 and the effects continued through 2017. Net in-migration began to slow during 2006, demand for new homes declined, and permits fell sharply to 690 units during 2009, a decline of 65 percent annually from 2007 through 2009. The number of homes permitted during 2009 was the lowest level
Notes: Includes single-family homes, townhomes, and condominiums. Data for 2019 are annualized.Sources: U.S. Census Bureau, Building Permits Survey; 2000–2017 final data and estimates by the analyst; 2018 and 2019 preliminary data and estimates by the analyst
16,000
14,000
12,000
10,000
8,000
6,000
4,000
2,000
0
2000
-2006
2007
-2008
2009
2010
-2011
2012-
2013
2014
-2015
2016
-2017
2018
-2019
CondominiumSingle-Family Home/Townhome
Figure 10. Average Annual Sales Permitting Activity in the Miami-Miami Beach-Kendall HMA
in the HMA recorded since before 1980. By the beginning of 2010, Miami-Dade County had the second highest percentage of seriously delinquent home loans and REO properties in the nation, at 28 percent. Builders responded to weak housing conditions by keeping construction levels low for several years; an average of 2,525 units was permitted annually from 2009 through 2013. From 2013 through 2015, an average 6,800 homes were permitted annually, as the housing market continued to recover. From 2016 through 2017 permitting declined 36 percent annually to a recent low of 3,350 units permitted during 2017. During the 12 months ending February 2019, the number of homes permitted increased by 1,700 homes, or 47 percent, from the previous 12 months to 5,375 units permitted (preliminary data).
New home construction within the city of Homestead, approximately 35 miles south of Miami, has accounted for nearly one in three new single-family homes in the Miami HMA during the past year. Artesa, a gated community in the city of Homestead, offers Mediterranean style villas, single-family homes, and townhomes that start at $240,000. Park Central, a master-planned community in the city of Doral, with plans for 585 condominiums, 228 townhomes, and 77 single-family homes, is underway with new condominium and single-family home prices starting at $300,000 and $610,000, respectively.
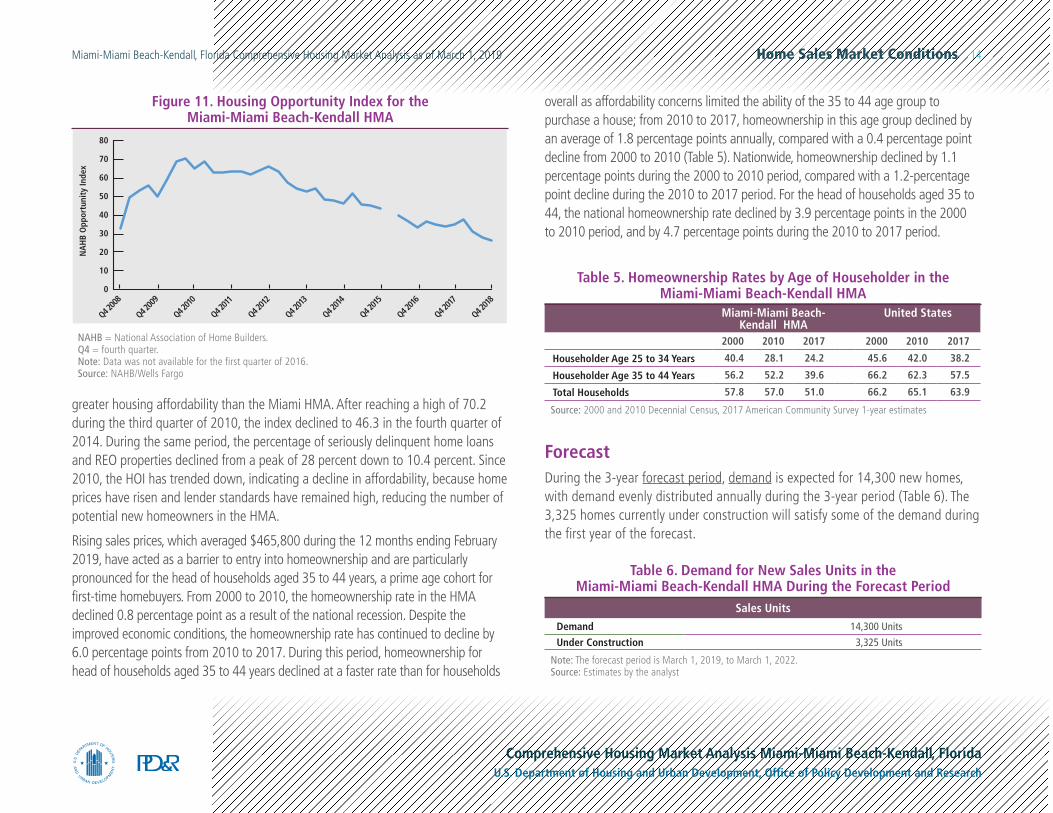
Housing Affordability: OwnerHomeownership in the Miami HMA is extremely expensive and the affordability of buying a home in the area has declined since 2010 when a large number of distressed home sales (REO and short sales) entered the market during the foreclosure crisis. Excess inventory has since been absorbed and high demand from international investors has put upward pressure on sales prices. The National Association of Home Builders (NAHB) and the Wells Fargo Housing Opportunity Index (HOI) for the HMA, which represents the share of homes sold that would have been affordable to a family earning the local median income, was 25.7 during the fourth quarter of 2018, down from 34.6 during the fourth quarter of 2017 (Figure 11). During the most recent quarter, 219 metropolitan areas out of the 238 metropolitan areas measured, or 92 percent of metropolitan areas in the nation, had
Home Sales Market Conditions 14Miami-Miami Beach-Kendall, Florida Comprehensive Housing Market Analysis as of March 1, 2019
Comprehensive Housing Market Analysis Miami-Miami Beach-Kendall, FloridaU.S. Department of Housing and Urban Development, Office of Policy Development and Research
greater housing affordability than the Miami HMA. After reaching a high of 70.2 during the third quarter of 2010, the index declined to 46.3 in the fourth quarter of 2014. During the same period, the percentage of seriously delinquent home loans and REO properties declined from a peak of 28 percent down to 10.4 percent. Since 2010, the HOI has trended down, indicating a decline in affordability, because home prices have risen and lender standards have remained high, reducing the number of potential new homeowners in the HMA.
Rising sales prices, which averaged $465,800 during the 12 months ending February 2019, have acted as a barrier to entry into homeownership and are particularly pronounced for the head of households aged 35 to 44 years, a prime age cohort for first-time homebuyers. From 2000 to 2010, the homeownership rate in the HMA declined 0.8 percentage point as a result of the national recession. Despite the improved economic conditions, the homeownership rate has continued to decline by 6.0 percentage points from 2010 to 2017. During this period, homeownership for head of households aged 35 to 44 years declined at a faster rate than for households
80
70
60
50
40
30
20
10
0
NA
HB
Opp
ortu
nity
Inde
x
Q4 200
8
Q4 200
9
Q4 201
0
Q4 2011
Q4 201
2
Q4 201
3
Q4 201
4
Q4 201
5
Q4 201
6
Q4 2017
Q4 201
8
Figure 11. Housing Opportunity Index for the Miami-Miami Beach-Kendall HMA
NAHB = National Association of Home Builders. Q4 = fourth quarter.Note: Data was not available for the first quarter of 2016.Source: NAHB/Wells Fargo
overall as affordability concerns limited the ability of the 35 to 44 age group to purchase a house; from 2010 to 2017, homeownership in this age group declined by an average of 1.8 percentage points annually, compared with a 0.4 percentage point decline from 2000 to 2010 (Table 5). Nationwide, homeownership declined by 1.1 percentage points during the 2000 to 2010 period, compared with a 1.2-percentage point decline during the 2010 to 2017 period. For the head of households aged 35 to 44, the national homeownership rate declined by 3.9 percentage points in the 2000 to 2010 period, and by 4.7 percentage points during the 2010 to 2017 period.
ForecastDuring the 3-year forecast period, demand is expected for 14,300 new homes, with demand evenly distributed annually during the 3-year period (Table 6). The 3,325 homes currently under construction will satisfy some of the demand during the first year of the forecast.
Miami-Miami Beach-Kendall HMA
United States
2000 2010 2017 2000 2010 2017
Householder Age 25 to 34 Years 40.4 28.1 24.2 45.6 42.0 38.2
Householder Age 35 to 44 Years 56.2 52.2 39.6 66.2 62.3 57.5
Total Households 57.8 57.0 51.0 66.2 65.1 63.9
Source: 2000 and 2010 Decennial Census, 2017 American Community Survey 1-year estimates
Table 5. Homeownership Rates by Age of Householder in the Miami-Miami Beach-Kendall HMA
Table 6. Demand for New Sales Units in the Miami-Miami Beach-Kendall HMA During the Forecast Period
Sales Units
Demand 14,300 Units
Under Construction 3,325 Units
Note: The forecast period is March 1, 2019, to March 1, 2022.Source: Estimates by the analyst
Rental Market Conditions 15Miami-Miami Beach-Kendall, Florida Comprehensive Housing Market Analysis as of March 1, 2019
Comprehensive Housing Market Analysis Miami-Miami Beach-Kendall, FloridaU.S. Department of Housing and Urban Development, Office of Policy Development and Research
Rental Market ConditionsMarket Conditions: Balanced
Rental unit construction in the Miami HMA has been elevated since 2014, with nearly 70 percent of the new units built in the city of Miami.
Current Conditions and Recent TrendsOverall rental housing market conditions (which includes single-family rentals, townhomes, and mobile homes) in the HMA are currently balanced, with an overall estimated rental vacancy rate of 6.0 percent, down from 9.0 percent in 2010 (Table 7). Relatively slow multifamily construction from 2007 through 2012 and increased rental household growth spurred by the housing crisis contributed to declining vacancy rates and rising rents since 2010. Recently, increased multifamily construction since 2014 has helped to bring the market into balance, following slightly tight conditions that prevailed during the past 2 years.
Approximately 31 percent of renter households in the HMA live in single-family homes, townhomes, and mobile homes (American Community Survey, 2017 1-year data). Approximately 9 percent live in buildings with two to four units, and 60 percent live in larger buildings with five or more units. For professionally managed units, the single-family rental vacancy rate was 2.5 percent in February 2019, unchanged from February 2018, and the average rent for a single-family home increased 7 percent to $1.88 per square foot (CoreLogic, Inc.). Rents for professionally managed units averaged $1,706, $2,136, $2,330, and $2,903 for one-, two-, three-, and four-bedroom units, respectively. The vacancy rate among single-family rentals that were professionally managed declined from 3.5 to 2.4 percent from 2013 through 2016 (data only available since 2013), with average annual rent growth of 5 percent. Rent growth and vacancy rates have remained unchanged since 2017.
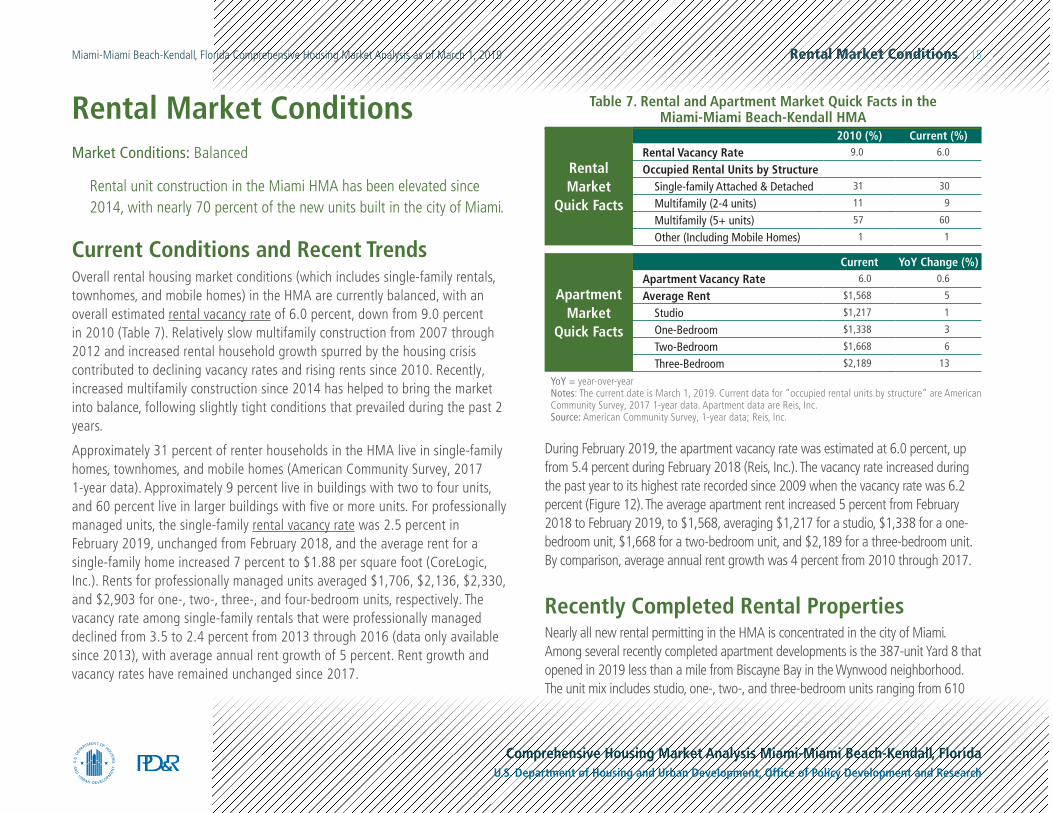
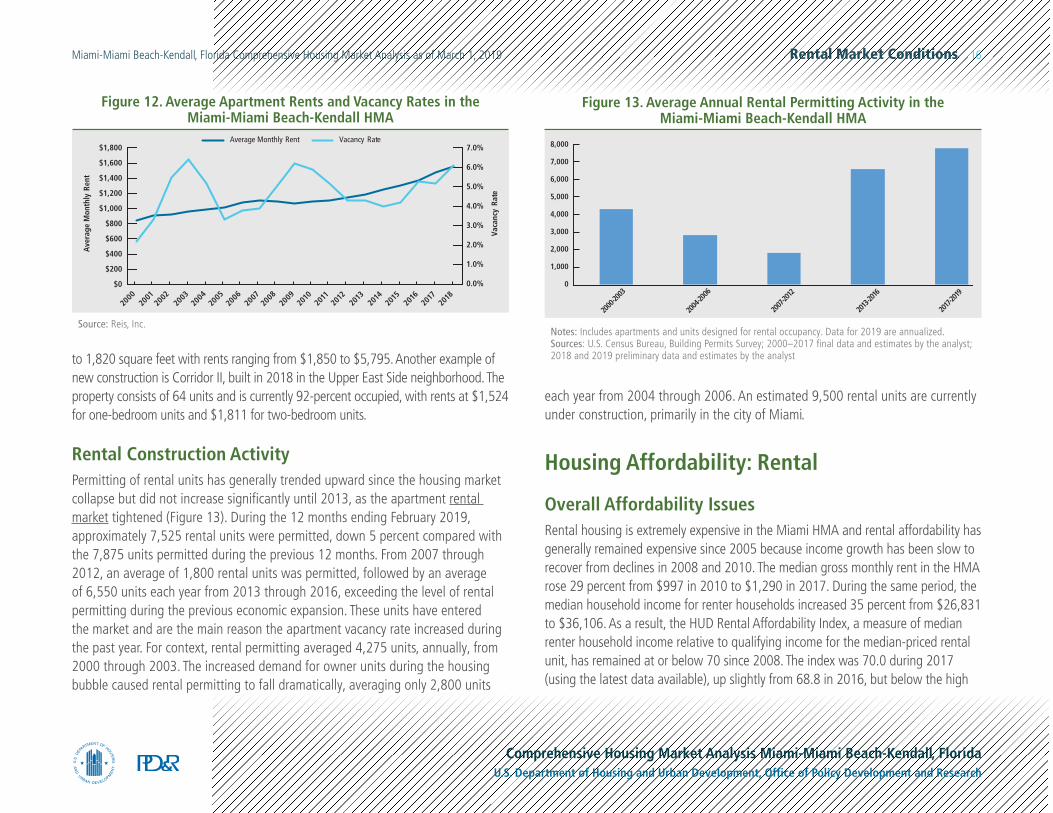
During February 2019, the apartment vacancy rate was estimated at 6.0 percent, up from 5.4 percent during February 2018 (Reis, Inc.). The vacancy rate increased during the past year to its highest rate recorded since 2009 when the vacancy rate was 6.2 percent (Figure 12). The average apartment rent increased 5 percent from February 2018 to February 2019, to $1,568, averaging $1,217 for a studio, $1,338 for a one-bedroom unit, $1,668 for a two-bedroom unit, and $2,189 for a three-bedroom unit. By comparison, average annual rent growth was 4 percent from 2010 through 2017.
Recently Completed Rental PropertiesNearly all new rental permitting in the HMA is concentrated in the city of Miami. Among several recently completed apartment developments is the 387-unit Yard 8 that opened in 2019 less than a mile from Biscayne Bay in the Wynwood neighborhood. The unit mix includes studio, one-, two-, and three-bedroom units ranging from 610
Rental Market
Quick Facts
2010 (%) Current (%)Rental Vacancy Rate 9.0 6.0
Occupied Rental Units by StructureSingle-family Attached & Detached 31 30
Multifamily (2-4 units) 11 9
Multifamily (5+ units) 57 60
Other (Including Mobile Homes) 1 1
Apartment Market
Quick Facts
Current YoY Change (%)Apartment Vacancy Rate 6.0 0.6
Average Rent $1,568 5
Studio $1,217 1
One-Bedroom $1,338 3
Two-Bedroom $1,668 6
Three-Bedroom $2,189 13
YoY = year-over-yearNotes: The current date is March 1, 2019. Current data for “occupied rental units by structure” are American Community Survey, 2017 1-year data. Apartment data are Reis, Inc.Source: American Community Survey, 1-year data; Reis, Inc.
Table 7. Rental and Apartment Market Quick Facts in the Miami-Miami Beach-Kendall HMA
Rental Market Conditions 16Miami-Miami Beach-Kendall, Florida Comprehensive Housing Market Analysis as of March 1, 2019
Comprehensive Housing Market Analysis Miami-Miami Beach-Kendall, FloridaU.S. Department of Housing and Urban Development, Office of Policy Development and Research
to 1,820 square feet with rents ranging from $1,850 to $5,795. Another example of new construction is Corridor II, built in 2018 in the Upper East Side neighborhood. The property consists of 64 units and is currently 92-percent occupied, with rents at $1,524 for one-bedroom units and $1,811 for two-bedroom units.
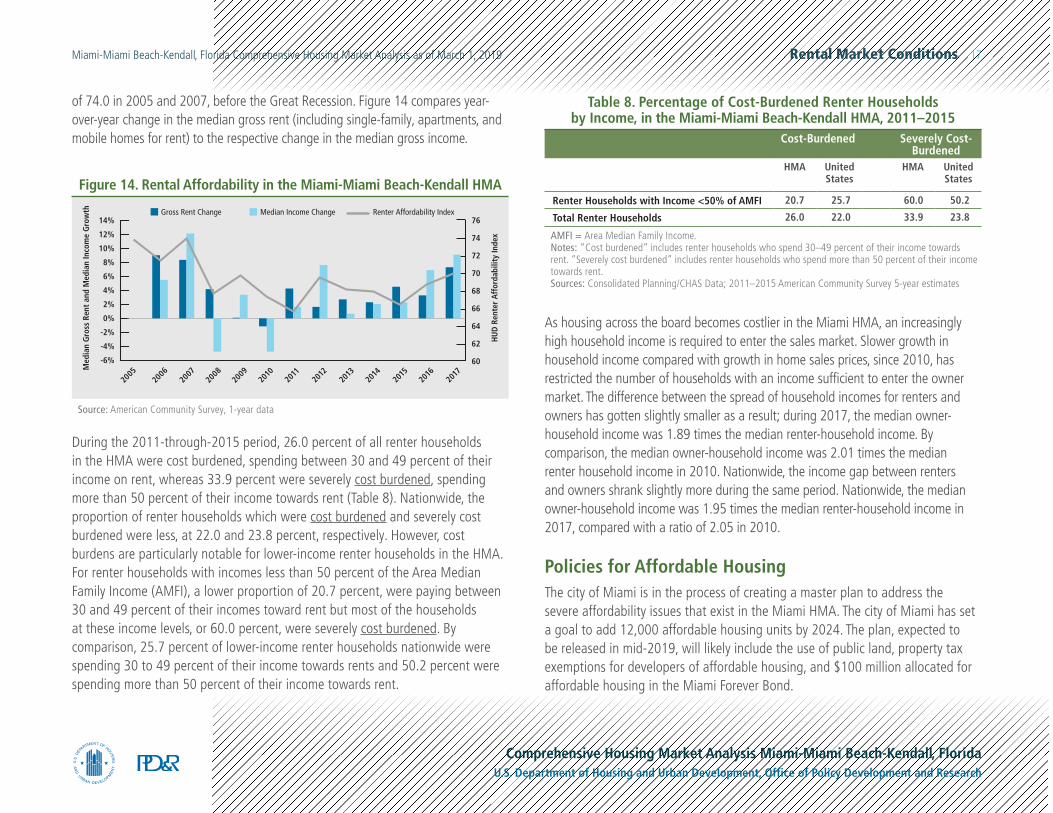
Rental Construction ActivityPermitting of rental units has generally trended upward since the housing market collapse but did not increase significantly until 2013, as the apartment rental market tightened (Figure 13). During the 12 months ending February 2019, approximately 7,525 rental units were permitted, down 5 percent compared with the 7,875 units permitted during the previous 12 months. From 2007 through 2012, an average of 1,800 rental units was permitted, followed by an average of 6,550 units each year from 2013 through 2016, exceeding the level of rental permitting during the previous economic expansion. These units have entered the market and are the main reason the apartment vacancy rate increased during the past year. For context, rental permitting averaged 4,275 units, annually, from 2000 through 2003. The increased demand for owner units during the housing bubble caused rental permitting to fall dramatically, averaging only 2,800 units
each year from 2004 through 2006. An estimated 9,500 rental units are currently under construction, primarily in the city of Miami.
Housing Affordability: Rental
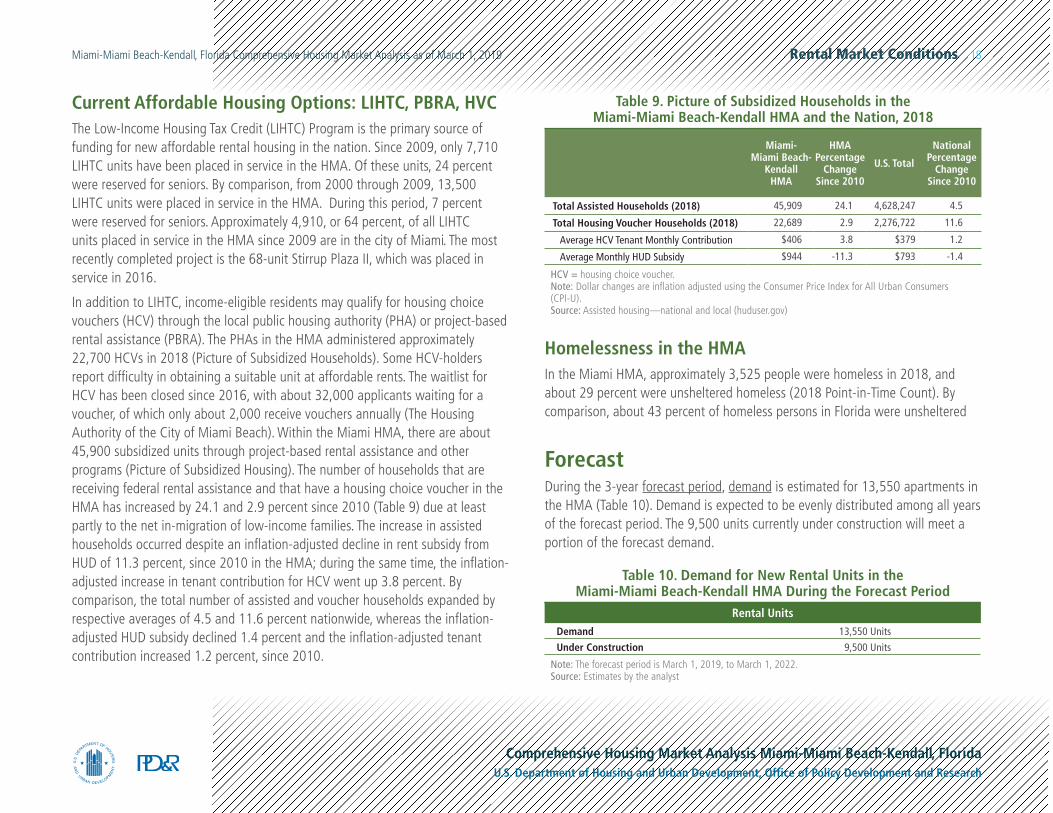
Overall Affordability IssuesRental housing is extremely expensive in the Miami HMA and rental affordability has generally remained expensive since 2005 because income growth has been slow to recover from declines in 2008 and 2010. The median gross monthly rent in the HMA rose 29 percent from $997 in 2010 to $1,290 in 2017. During the same period, the median household income for renter households increased 35 percent from $26,831 to $36,106. As a result, the HUD Rental Affordability Index, a measure of median renter household income relative to qualifying income for the median-priced rental unit, has remained at or below 70 since 2008. The index was 70.0 during 2017 (using the latest data available), up slightly from 68.8 in 2016, but below the high
8,000
7,000
6,000
5,000
4,000
3,000
2,000
1,000
0
2000
-2003
2004
-2006
2007
-2012
2013
-2016
2017-
2019
Figure 13. Average Annual Rental Permitting Activity in the Miami-Miami Beach-Kendall HMA
Notes: Includes apartments and units designed for rental occupancy. Data for 2019 are annualized.Sources: U.S. Census Bureau, Building Permits Survey; 2000–2017 final data and estimates by the analyst; 2018 and 2019 preliminary data and estimates by the analyst
$1,800
$1,600
$1,400
$1,200
$1,000
$800
$600
$400
$200
$0
Ave
rage
Mon
thly
Ren
t
Vaca
ncy
Rate
7.0%
6.0%
5.0%
4.0%
3.0%
2.0%
1.0%
0.0%
Vacancy RateAverage Monthly Rent
2000
2001
2002
2003
2004
2005
2006
2007
2008
2009
2010
2011
2012
2013
2014
2015
2016
2017
2018
Figure 12. Average Apartment Rents and Vacancy Rates in the Miami-Miami Beach-Kendall HMA
Source: Reis, Inc.
Rental Market Conditions 17Miami-Miami Beach-Kendall, Florida Comprehensive Housing Market Analysis as of March 1, 2019
Comprehensive Housing Market Analysis Miami-Miami Beach-Kendall, FloridaU.S. Department of Housing and Urban Development, Office of Policy Development and Research
of 74.0 in 2005 and 2007, before the Great Recession. Figure 14 compares year-over-year change in the median gross rent (including single-family, apartments, and mobile homes for rent) to the respective change in the median gross income.
During the 2011-through-2015 period, 26.0 percent of all renter households in the HMA were cost burdened, spending between 30 and 49 percent of their income on rent, whereas 33.9 percent were severely cost burdened, spending more than 50 percent of their income towards rent (Table 8). Nationwide, the proportion of renter households which were cost burdened and severely cost burdened were less, at 22.0 and 23.8 percent, respectively. However, cost burdens are particularly notable for lower-income renter households in the HMA. For renter households with incomes less than 50 percent of the Area Median Family Income (AMFI), a lower proportion of 20.7 percent, were paying between 30 and 49 percent of their incomes toward rent but most of the households at these income levels, or 60.0 percent, were severely cost burdened. By comparison, 25.7 percent of lower-income renter households nationwide were spending 30 to 49 percent of their income towards rents and 50.2 percent were spending more than 50 percent of their income towards rent.
14%
12%
10%
8%
6%
4%
2%
0%
-2%
-4%
-6%
Med
ian
Gro
ss R
ent
and
Med
ian
Inco
me
Gro
wth
HU
D R
ente
r A
ffor
dabi
lity
Inde
x
76
74
72
70
68
66
64
62
60
Median Income Change Renter Affordability IndexGross Rent Change
2005
2006
2007
2008
2009
2010
2011
2012
2013
2014
2015
2016
2017
Figure 14. Rental Affordability in the Miami-Miami Beach-Kendall HMA
Source: American Community Survey, 1-year data
As housing across the board becomes costlier in the Miami HMA, an increasingly high household income is required to enter the sales market. Slower growth in household income compared with growth in home sales prices, since 2010, has restricted the number of households with an income sufficient to enter the owner market. The difference between the spread of household incomes for renters and owners has gotten slightly smaller as a result; during 2017, the median owner-household income was 1.89 times the median renter-household income. By comparison, the median owner-household income was 2.01 times the median renter household income in 2010. Nationwide, the income gap between renters and owners shrank slightly more during the same period. Nationwide, the median owner-household income was 1.95 times the median renter-household income in 2017, compared with a ratio of 2.05 in 2010.
Policies for Affordable HousingThe city of Miami is in the process of creating a master plan to address the severe affordability issues that exist in the Miami HMA. The city of Miami has set a goal to add 12,000 affordable housing units by 2024. The plan, expected to be released in mid-2019, will likely include the use of public land, property tax exemptions for developers of affordable housing, and $100 million allocated for affordable housing in the Miami Forever Bond.
Cost-Burdened Severely Cost-Burdened
HMA United States
HMA United States
Renter Households with Income <50% of AMFI 20.7 25.7 60.0 50.2
Total Renter Households 26.0 22.0 33.9 23.8
AMFI = Area Median Family Income.Notes: “Cost burdened” includes renter households who spend 30–49 percent of their income towards rent. “Severely cost burdened” includes renter households who spend more than 50 percent of their income towards rent.Sources: Consolidated Planning/CHAS Data; 2011–2015 American Community Survey 5-year estimates
Table 8. Percentage of Cost-Burdened Renter Households by Income, in the Miami-Miami Beach-Kendall HMA, 2011–2015
Rental Market Conditions 18Miami-Miami Beach-Kendall, Florida Comprehensive Housing Market Analysis as of March 1, 2019
Comprehensive Housing Market Analysis Miami-Miami Beach-Kendall, FloridaU.S. Department of Housing and Urban Development, Office of Policy Development and Research
Current Affordable Housing Options: LIHTC, PBRA, HVCThe Low-Income Housing Tax Credit (LIHTC) Program is the primary source of funding for new affordable rental housing in the nation. Since 2009, only 7,710 LIHTC units have been placed in service in the HMA. Of these units, 24 percent were reserved for seniors. By comparison, from 2000 through 2009, 13,500 LIHTC units were placed in service in the HMA. During this period, 7 percent were reserved for seniors. Approximately 4,910, or 64 percent, of all LIHTC units placed in service in the HMA since 2009 are in the city of Miami. The most recently completed project is the 68-unit Stirrup Plaza II, which was placed in service in 2016.
In addition to LIHTC, income-eligible residents may qualify for housing choice vouchers (HCV) through the local public housing authority (PHA) or project-based rental assistance (PBRA). The PHAs in the HMA administered approximately 22,700 HCVs in 2018 (Picture of Subsidized Households). Some HCV-holders report difficulty in obtaining a suitable unit at affordable rents. The waitlist for HCV has been closed since 2016, with about 32,000 applicants waiting for a voucher, of which only about 2,000 receive vouchers annually (The Housing Authority of the City of Miami Beach). Within the Miami HMA, there are about 45,900 subsidized units through project-based rental assistance and other programs (Picture of Subsidized Housing). The number of households that are receiving federal rental assistance and that have a housing choice voucher in the HMA has increased by 24.1 and 2.9 percent since 2010 (Table 9) due at least partly to the net in-migration of low-income families. The increase in assisted households occurred despite an inflation-adjusted decline in rent subsidy from HUD of 11.3 percent, since 2010 in the HMA; during the same time, the inflation-adjusted increase in tenant contribution for HCV went up 3.8 percent. By comparison, the total number of assisted and voucher households expanded by respective averages of 4.5 and 11.6 percent nationwide, whereas the inflation-adjusted HUD subsidy declined 1.4 percent and the inflation-adjusted tenant contribution increased 1.2 percent, since 2010.
Homelessness in the HMAIn the Miami HMA, approximately 3,525 people were homeless in 2018, and about 29 percent were unsheltered homeless (2018 Point-in-Time Count). By comparison, about 43 percent of homeless persons in Florida were unsheltered
ForecastDuring the 3-year forecast period, demand is estimated for 13,550 apartments in the HMA (Table 10). Demand is expected to be evenly distributed among all years of the forecast period. The 9,500 units currently under construction will meet a portion of the forecast demand.
Table 10. Demand for New Rental Units in the Miami-Miami Beach-Kendall HMA During the Forecast Period
Rental Units
Demand 13,550 Units
Under Construction 9,500 Units
Note: The forecast period is March 1, 2019, to March 1, 2022.Source: Estimates by the analyst
Miami- Miami Beach-
Kendall HMA
HMA Percentage
Change Since 2010
U.S. Total
National Percentage
Change Since 2010
Total Assisted Households (2018) 45,909 24.1 4,628,247 4.5
Total Housing Voucher Households (2018) 22,689 2.9 2,276,722 11.6
Average HCV Tenant Monthly Contribution $406 3.8 $379 1.2
Average Monthly HUD Subsidy $944 -11.3 $793 -1.4
HCV = housing choice voucher.Note: Dollar changes are inflation adjusted using the Consumer Price Index for All Urban Consumers (CPI-U).Source: Assisted housing—national and local (huduser.gov)
Table 9. Picture of Subsidized Households in the Miami-Miami Beach-Kendall HMA and the Nation, 2018
Terminology Definitions and Notes 19Miami-Miami Beach-Kendall, Florida Comprehensive Housing Market Analysis as of March 1, 2019
Comprehensive Housing Market Analysis Miami-Miami Beach-Kendall, FloridaU.S. Department of Housing and Urban Development, Office of Policy Development and Research
Terminology Definitions and Notes
A. Definitions
Demand The demand estimates in the analysis are not a forecast of building activity. They are the estimates of the total housing production needed to achieve a balanced market at the end of the 3-year forecast period given conditions on the as-of date of the analysis, growth, losses, and excess vacancies. The estimates do not account for units currently under construction or units in the development pipeline.
Other Vacant Units
In this analysis conducted by the U.S. Department of Housing and Urban Development (HUD), other vacant units include all vacant units that are not available for sale or for rent. The term, therefore, includes units rented or sold but not occupied; held for seasonal, recreational, or occasional use; used by migrant workers; and the category specified as “other” vacant by the U.S. Census Bureau.
Building Permits
Building permits do not necessarily reflect all residential building activity that occurs in an HMA. Some units are constructed or created without a building permit or are issued a different type of building permit. For example, some units classified as commercial structures are not reflected in the residential building permits. As a result, the analyst, through diligent fieldwork, makes an estimate of this additional construction activity. Some of these estimates are included in the discussions of single-family and multifamily building permits.
Distressed Sales
Short sales and real estate owned (REO) sales.
Seriously Delinquent Mortgages
Mortgages 90+ days delinquent or in foreclosure.
Terminology Definitions and Notes 20Miami-Miami Beach-Kendall, Florida Comprehensive Housing Market Analysis as of March 1, 2019
Comprehensive Housing Market Analysis Miami-Miami Beach-Kendall, FloridaU.S. Department of Housing and Urban Development, Office of Policy Development and Research
Home Sales/Home Sales Prices
Includes single-family home, townhome, and condominium sales.
Rental Market/Rental Vacancy Rate
Includes apartments and other rental units such as single-family homes, multifamily homes, and mobile homes.
Forecast Period 3/1/2019–3/1/2022—Estimates by the analyst
Cost Burdened Spending more than 30 percent of household income on housing costs.
B. Notes on Geography
1.The metropolitan division definition noted in this report is based on the delineations established by the Office of Management and Budget (OMB) in the OMB Bulletin dated February 28, 2013.
C. Additional Notes
1.The National Association of Home Builders (NAHB) Housing Opportunity Index represents the share of homes sold in the HMA that would have been affordable to a family earning the local median income, based on standard mortgage underwriting criteria.
Terminology Definitions and Notes 21Miami-Miami Beach-Kendall, Florida Comprehensive Housing Market Analysis as of March 1, 2019
Comprehensive Housing Market Analysis Miami-Miami Beach-Kendall, FloridaU.S. Department of Housing and Urban Development, Office of Policy Development and Research
2.This analysis has been prepared for the assistance and guidance of HUD in its operations. The factual information, findings, and conclusions may also be useful to builders, mortgagees, and others concerned with local housing market conditions and trends. The analysis does not purport to make determinations regarding the acceptability of any mortgage insurance proposals that may be under consideration by the Department.
3.
The factual framework for this analysis follows the guidelines and methods developed by the Economic and Market Analysis Division within HUD. The analysis and findings are as thorough and current as possible based on information available on the as-of date from local and national sources. As such, findings or conclusions may be modified by subsequent developments. HUD expresses its appreciation to those industry sources and state and local government officials who provided data and information on local economic and housing market conditions.
Cover Photo iStock
Contact InformationT. Michael Miller, Economist Fort Worth HUD Regional Office 817-978-9418 [email protected]