MIA Central Terminal Redevelopment Program presentation, November 19, 2014
45
1 DRAFT – FOR PRELIMINARY AND PLANNING PURPOSES ONLY 1 MIA CENTRAL TERMINAL REDEVELOPMENT PROGRAM Executive Briefing for Citizens’ Transportation Advisory Committee (CTAC) November 19, 2014
-
Upload
miami-dade-metropolitan-planning-organization -
Category
Government & Nonprofit
-
view
228 -
download
3
Transcript of MIA Central Terminal Redevelopment Program presentation, November 19, 2014

1
DRAFT – FOR PRELIMINARY AND PLANNING PURPOSES ONLY
1
MIA CENTRAL TERMINAL REDEVELOPMENT PROGRAM
Executive Briefing for
Citizens’ Transportation Advisory Committee (CTAC)
November 19, 2014

2
DRAFT – FOR PRELIMINARY AND PLANNING PURPOSES ONLY
2
Discussion Agenda
• MIA 2015 Terminal Area Configuration
• MIA 2035 Terminal Area Configuration
• Activity Summary
• Gate and Hardstand Requirements
• Terminal Space Requirements
• Other Terminal Capital Projects
• Terminal Concept
• Terminal Space Layout
• Terminal Construction Sequencing and Milestones
• Program Cost Estimates

3
DRAFT – FOR PRELIMINARY AND PLANNING PURPOSES ONLY
3
MIA Existing Terminal Area Configuration
Aircraft Gates
Aircraft Hardstands
North Terminal 59 9
Central Terminal 47 3
South Terminal 26 4
TOTAL 132 16

4
DRAFT – FOR PRELIMINARY AND PLANNING PURPOSES ONLY
4
MIA 2035 Terminal Area Configuration
Gates and Aircraft Hardstand Inventory
Aircraft Gates
Aircraft Hardstands
North Terminal 70 9
Central Terminal 39 0
South Terminal 24 4
TOTAL 133 13
D-West
D-East
New Landside Terminal South
New Landside Terminal North
Super G
Super E-Head
Super E-Connector

5 5
ACTIVITY SUMMARY

6
DRAFT – FOR PRELIMINARY AND PLANNING PURPOSES ONLY
6
Future Design Day Flight Activity Summary
• Total operations (arrivals and departures) for a peak month-average day
Sources: MIA Airside Operations Division, Baseline Schedule; Central Terminal PDD Forecasts, May 2013; MIA Carriers Input, July 2013.
Carrier Group 2012 (Baseline) 2020 2025 2030 2035
AMR Carriers 1/ 665 841 899 959 1027
Other Domestic Carriers 82 119 130 144 158
oneworld 2/ 43 55 61 67 73
Foreign Flag Carriers 3/ 112 186 209 231 261
Nonscheduled 16 18 20 22 24
TOTAL 918 1,219 1,319 1,423 1,543 Notes: 1. AMR Carriers include American Eagle and US Airways. 2. Growth rates incorporates changes in oneworld Alliance members (e.g. Mexicana, TAM, airberlin) between 2009 and 2012. 3. Assumes air service by new international entrant carriers based on discussions with MDAD Marketing Division. 4. Average annual growth rates for carriers currently operating at MIA are:
i. AMR carriers and oneworld Partners: 3.0% to 2020 and 1.3% thereafter ii. All other carriers: 5.5% between 2012 and 2020 as a result of new entrant activity
anticipated by MDAD’s Marketing Division; 2.0% from 2020 through 2035;

7
DRAFT – FOR PRELIMINARY AND PLANNING PURPOSES ONLY
7
MIA New Routes
• New Routes Opened in 2013 and 2014:
– Guadeloupe, French Antilles
– Martinique, French Antilles
– Calgary, Canada
– San Diego
– Curitiba, Brazil
– Porto Alegre, Brazil
– San Antonio
– Cozumel, Mexico
– Milan, Italy
– Frankfurt, Germany
– Viracopos, Brazil
– Austin
– Kansas City
– Salt Lake City

8
DRAFT – FOR PRELIMINARY AND PLANNING PURPOSES ONLY
8
MIA New Entrants
• New Entrants in 2013 and 2014:
– XL Airways
– WestJet
– Jetairfly (Brussels)
– Qatar Airways (Doha)
– Air Europa (Madrid/Punta Cana)
• New Entrants Announced for 2014 and 2015:
– Frontier
– Finnair
– Thomas Cook Airlines
• New A380 flights by British Airways and Air France
• Additional new service/entrants expected for 2016 Olympics

9
DRAFT – FOR PRELIMINARY AND PLANNING PURPOSES ONLY
9
Air Carrier Historical and Projected Statistics
Sources: MIA Airside Operations Division, Baseline Schedule; SMP Forecasts (approved by FAA on July 21, 2011); Central Terminal PDD Forecasts, May 2013; MIA Carriers Input, July 2013.
0
100,000
200,000
300,000
400,000
500,000
600,000
Air
Carr
ier
An
nu
al A
ircra
ft O
pera
tio
ns
Fiscal Year
Historical Air Carrier Operations
New Actual Data since Forecast Approval
SMP Operations Baseline Forecast - Low - AAGR*: 1.3%
SMP Operations Baseline Forecast - High - AAGR*: 2.3%
MIA PDD - Airline Derived Forecast - AAGR 2.3%
2010 A
ctu
al
2011 A
ctu
al
2012 A
ctu
al
2013 A
ctu
al
Notes: 1. AAGR* stands for Average Annual Growth Rate. 2. FAA FY2012 Terminal Area Forecast is not presented as it does not provide operations forecast for passenger aircraft specifically. 3. MIA Central Terminal Program Definition Document forecast was prepared in consultation with all airlines currently operating at MIA.

10 10
GATE AND HARDSTAND REQUIREMENTS

11
DRAFT – FOR PRELIMINARY AND PLANNING PURPOSES ONLY
11
• Gate requirements by airline groups (144 total)
11
Gate Gauge RJ-S RJ-L NB WB JB NLA Total
American Airlines (AA) and oneworld Partners (OW) 0 0 44 1 23 1 69
AA + OW Spare Gates 0 0 4 0 3 0 7
Total Contact Gate Requirements AA + OW + Spares 0 0 48 1 26 1 76
American Eagle E175 Contact Gate Requirements 0 17 0 0 0 0 17
American Eagle E145 Ground Loaded Gate Requirements 2 0 0 0 0 0 2
Total Gate Requirements American Eagle 2 17 0 0 0 0 19
Other Airlines (OAL) 0 0 29 0 15 2 46
MDAD Controlled Gates / Spares 0 0 1 0 2 0 3
Total Contact Gate Requirements OAL + MDAD-Controlled Gates 0 0 30 0 17 2 49
Note: The gate requirements presented above assume a preferential use of the gates.
Gate Requirements - Year 2035 Gate Demand Summary
Source: MIA Central Terminal Program Definition Document Forecast, Ricondo & Associates, Inc., August 2013.

12
DRAFT – FOR PRELIMINARY AND PLANNING PURPOSES ONLY
12
Gate Requirements - Year 2035 Hardstand Positions Demand Summary
• Hardstand positions by airline groups
Gate Gauge RJ-S RJ-L NB WB JB NLA Total
American Airlines and oneworld Partners 0 0 8 0 10 0 18
American Eagle 3 6 0 0 0 0 9
Total Hardstand Requirements AMR Carriers and oneworld 3 6 8 0 10 0 27
Other Airlines (OAL) 0 0 8 0 5 0 13
Source: MIA Central Terminal Program Definition Document Forecast, Ricondo & Associates, Inc., August 2013. 12

13 13
OTHER TERMINAL CAPITAL PROJECTS

14
DRAFT – FOR PRELIMINARY AND PLANNING PURPOSES ONLY
14
Other MIA Terminal Capital Projects
14
Source: MIA Central Terminal Program Definition Document Analysis (Refined with Air Carriers 11/01/2013), Ricondo & Associates, November 2013.

15 15
TERMINAL CONCEPT

16
DRAFT – FOR PRELIMINARY AND PLANNING PURPOSES ONLY
16
Central Terminal – Airside Refinements
16
Source: Pier Configuration Terminal Concept, Ricondo & Associates Inc., with MDAD Input, October 2013.

17 17
TERMINAL SPACE LAYOUT

18
DRAFT – FOR PRELIMINARY AND PLANNING PURPOSES ONLY
18 18
Terminal Space Plan – Level One
Sources: Rodriguez & Quiroga Architect Chartered, May 2012; Bag Handling System Configuration, URS Corp., October 2013; Terminal Space Program, Ricondo & Associates, October 2013.

19
DRAFT – FOR PRELIMINARY AND PLANNING PURPOSES ONLY
19 19
Terminal Space Plan – Level Two
Sources: Rodriguez & Quiroga Architect Chartered, May 2012; Terminal Space Program, Ricondo & Associates, October 2013.

20
DRAFT – FOR PRELIMINARY AND PLANNING PURPOSES ONLY
20
Terminal Space Plan – Level Three
20
Sources: Rodriguez & Quiroga Architect Chartered, May 2012; Terminal Space Program, Ricondo & Associates, October 2013.

21
DRAFT – FOR PRELIMINARY AND PLANNING PURPOSES ONLY
21
Terminal Space Plan – Level Four (Potential APM)
Sources: Rodriguez & Quiroga Architect Chartered, May 2012; Terminal Space Program, Ricondo & Associates, October 2013.

22
DRAFT – FOR PRELIMINARY AND PLANNING PURPOSES ONLY
22
Terminal Support Functions
• Items requiring further coordination to be conducted as separate studies or during design include: – Hotel Replacement (including site study)
– Cruise ship passengers landside accommodation / processing
– MDAD and Federal agencies’ needs inside the terminal building
– Finalization of concession program
– Decision on, and programming of previously discussed commercial program (i.e. initially proposed for Levels 4, 5, and 6 of new Central Terminal)
– Decision on, and integration with North Terminal of Automated People Mover
22

23 23
TERMINAL CONSTRUCTION SEQUENCING AND MILESTONES
SOUTH TO NORTH SEQUENCING

24
DRAFT – FOR PRELIMINARY AND PLANNING PURPOSES ONLY
24
Construction Sequencing
Pre-construction Conditions Year: 2019
Sources: Terminal Construction Sequencing, Ricondo & Associates Inc., September 2013; Cost and Duration Estimates Adjusted for Refined Phases by Ricondo & Associates Inc. (approximated), URS Corp., December 2013 and U.S. Cost, April 2013.c
Note: revised from 2018 as shown in PDD by MDAD on June 2014.

25
DRAFT – FOR PRELIMINARY AND PLANNING PURPOSES ONLY
25
Construction Sequencing (Cont’d)
Phase 1a (13 mo) Start Year: 2020
Concourse H Gate Upgrades and Internationalization
Sources: Terminal Construction Sequencing, Ricondo & Associates Inc., September 2013; Cost and Duration Estimates Adjusted for Refined Phases by Ricondo & Associates Inc. (approximated), URS Corp., December 2013 and U.S. Cost, April 2013.
Note: revised from 2018 as shown in PDD by MDAD on June 2014.

26
DRAFT – FOR PRELIMINARY AND PLANNING PURPOSES ONLY
26
Note: D-West is built within the total duration of Phase 1b.
Sources: Terminal Construction Sequencing, Ricondo & Associates Inc., September 2013; Cost and Duration Estimates Adjusted for Refined Phases by Ricondo & Associates Inc. (approximated), URS Corp., December 2013 and U.S. Cost, April 2013.
Construction Sequencing (Cont’d)
Phase 1b (33 mo) Start Year: 2021
Note: revised from 2018 as shown in PDD by MDAD on June 2014.
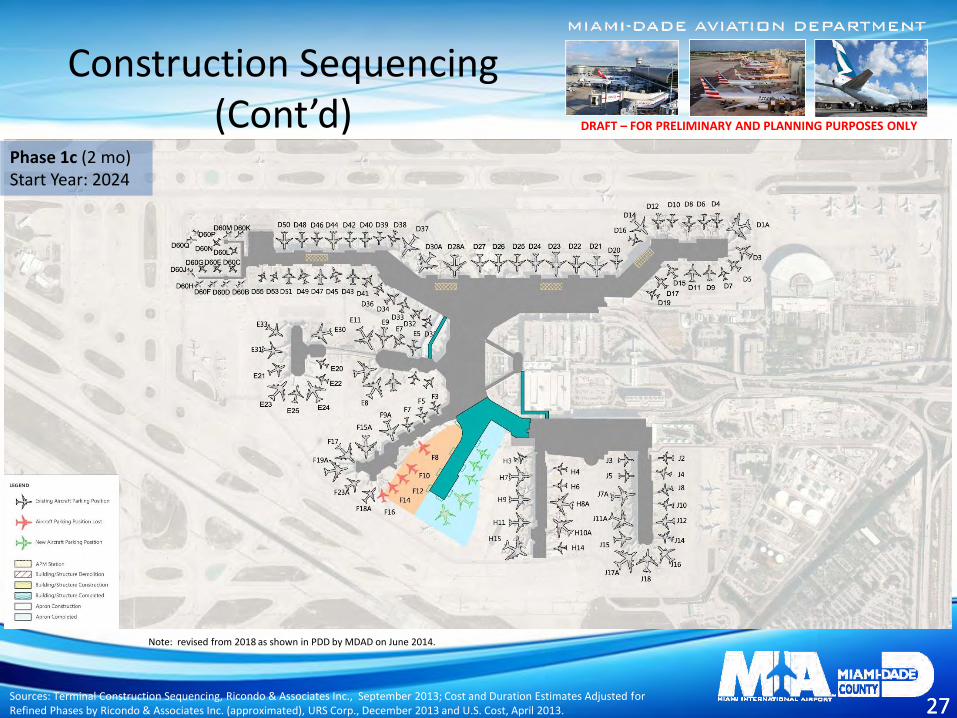
27
DRAFT – FOR PRELIMINARY AND PLANNING PURPOSES ONLY
27
Phase 1c (2 mo) Start Year: 2024
Sources: Terminal Construction Sequencing, Ricondo & Associates Inc., September 2013; Cost and Duration Estimates Adjusted for Refined Phases by Ricondo & Associates Inc. (approximated), URS Corp., December 2013 and U.S. Cost, April 2013.
Construction Sequencing (Cont’d)
Note: revised from 2018 as shown in PDD by MDAD on June 2014.

28
DRAFT – FOR PRELIMINARY AND PLANNING PURPOSES ONLY
28
Phase 2a (18 mo) Start Year: 2024
Sources: Terminal Construction Sequencing, Ricondo & Associates Inc., September 2013; Cost and Duration Estimates Adjusted for Refined Phases by Ricondo & Associates Inc. (approximated), URS Corp., December 2013 and U.S. Cost, April 2013.
Construction Sequencing (Cont’d)
Note: revised from 2018 as shown in PDD by MDAD on June 2014.

29
DRAFT – FOR PRELIMINARY AND PLANNING PURPOSES ONLY
29
Phase 2b (29 mo) Start Year: 2026
Temporary connection to Super E using
Existing APM
Sources: Terminal Construction Sequencing, Ricondo & Associates Inc., September 2013; Cost and Duration Estimates Adjusted for Refined Phases by Ricondo & Associates Inc. (approximated), URS Corp., December 2013 and U.S. Cost, April 2013.
Construction Sequencing (Cont’d)
Note: revised from 2018 as shown in PDD by MDAD on June 2014.

30
DRAFT – FOR PRELIMINARY AND PLANNING PURPOSES ONLY
30
Phase 2c (12 mo) Start Year: 2028
Sources: Terminal Construction Sequencing, Ricondo & Associates Inc., September 2013; Cost and Duration Estimates Adjusted for Refined Phases by Ricondo & Associates Inc. (approximated), URS Corp., December 2013 and U.S. Cost, April 2013.
Construction Sequencing (Cont’d)
Note: revised from 2018 as shown in PDD by MDAD on June 2014.
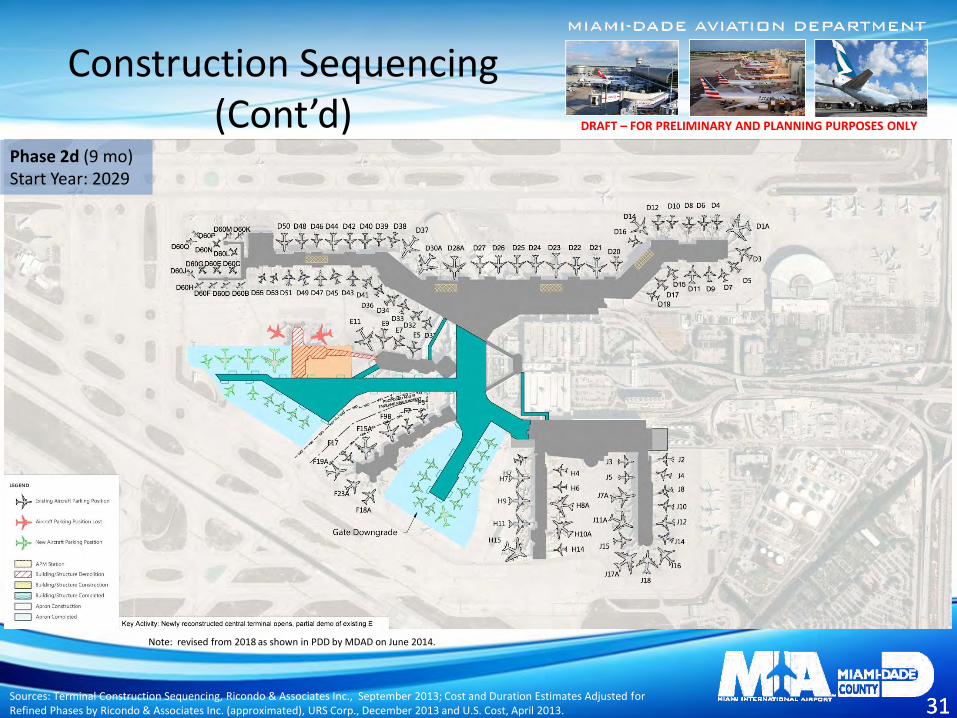
31
DRAFT – FOR PRELIMINARY AND PLANNING PURPOSES ONLY
31
Phase 2d (9 mo) Start Year: 2029
Sources: Terminal Construction Sequencing, Ricondo & Associates Inc., September 2013; Cost and Duration Estimates Adjusted for Refined Phases by Ricondo & Associates Inc. (approximated), URS Corp., December 2013 and U.S. Cost, April 2013.
Construction Sequencing (Cont’d)
Note: revised from 2018 as shown in PDD by MDAD on June 2014.

32
DRAFT – FOR PRELIMINARY AND PLANNING PURPOSES ONLY
32
Phase 2e (6 mo) Start Year: 2030
Sources: Terminal Construction Sequencing, Ricondo & Associates Inc., September 2013; Cost and Duration Estimates Adjusted for Refined Phases by Ricondo & Associates Inc. (approximated), URS Corp., December 2013 and U.S. Cost, April 2013.
Construction Sequencing (Cont’d)
Note: revised from 2018 as shown in PDD by MDAD on June 2014.

33
DRAFT – FOR PRELIMINARY AND PLANNING PURPOSES ONLY
33
Phase 2f (10 mo) Start Year: 2030
Sources: Terminal Construction Sequencing, Ricondo & Associates Inc., September 2013; Cost and Duration Estimates Adjusted for Refined Phases by Ricondo & Associates Inc. (approximated), URS Corp., December 2013 and U.S. Cost, April 2013.
Construction Sequencing (Cont’d)
Note: revised from 2018 as shown in PDD by MDAD on June 2014.

34
DRAFT – FOR PRELIMINARY AND PLANNING PURPOSES ONLY
34 34
Phase 3a (6 mo) Start Year: 2031
Sources: Terminal Construction Sequencing, Ricondo & Associates Inc., September 2013; Cost and Duration Estimates Adjusted for Refined Phases by Ricondo & Associates Inc. (approximated), URS Corp., December 2013 and U.S. Cost, April 2013.
Construction Sequencing (Cont’d)
Note: revised from 2018 as shown in PDD by MDAD on June 2014.

35
DRAFT – FOR PRELIMINARY AND PLANNING PURPOSES ONLY
35 35
Phase 3b (5 mo) Start Year: 2032
Sources: Terminal Construction Sequencing, Ricondo & Associates Inc., September 2013; Cost and Duration Estimates Adjusted for Refined Phases by Ricondo & Associates Inc. (approximated), URS Corp., December 2013 and U.S. Cost, April 2013.
Construction Sequencing (Cont’d)
Note: revised from 2018 as shown in PDD by MDAD on June 2014.

36
DRAFT – FOR PRELIMINARY AND PLANNING PURPOSES ONLY
36 36
FINAL Year: 2032
Sources: Terminal Construction Sequencing, Ricondo & Associates Inc., September 2013; Cost and Duration Estimates Adjusted for Refined Phases by Ricondo & Associates Inc. (approximated), URS Corp., December 2013 and U.S. Cost, April 2013.
Construction Sequencing (Cont’d)
Note: revised from 2018 as shown in PDD by MDAD on June 2014.

37 37
All years represent the start/commencement of the listed program elements except for the program completion milestone). All durations provided in years (yrs.).
Landside Terminal (North) Demolition (1.5 yr.)
New Landside Terminal (North) and Super E-Head Construction (4 yrs.)
New Super E Connector Construction (1 yr.)
Central Terminal Redevelopment Program Completion
Concourse G and Landside (South) Terminal Demolition (1 yr.)
Super G and New Landside Terminal (South) Construction (3 yrs.)
2020 2021 2024 2026 2028 2031
Lower E Demolition (0.5 yr.)
2032
Concourse F Demolition (0.5 yr.)
2030
Milestone Schedule
Sources: Terminal Construction Sequencing, Ricondo & Associates Inc., September 2013; Cost Duration Estimates Adjusted for Refined Phases by Ricondo & Associates Inc. (approximated), URS Corp., December 2013 and U.S. Cost, April 2013.
Note: revised from 2018 as shown in PDD by MDAD on June 2014.
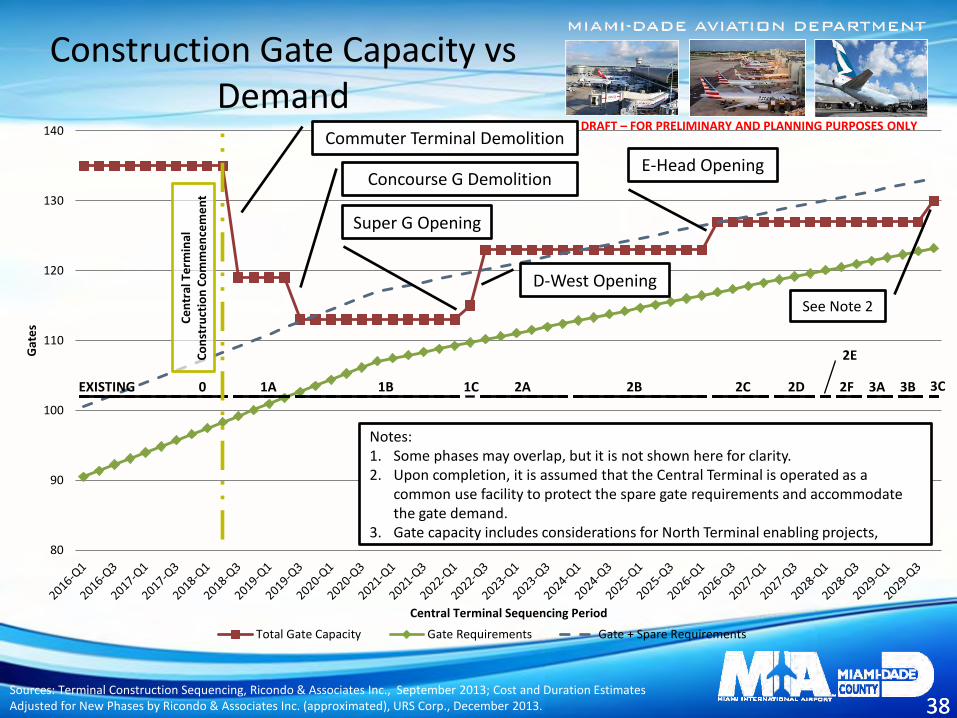
38
DRAFT – FOR PRELIMINARY AND PLANNING PURPOSES ONLY
38
80
90
100
110
120
130
140
Gat
es
Central Terminal Sequencing Period
Total Gate Capacity Gate Requirements Gate + Spare Requirements
Construction Gate Capacity vs Demand
Sources: Terminal Construction Sequencing, Ricondo & Associates Inc., September 2013; Cost and Duration Estimates Adjusted for New Phases by Ricondo & Associates Inc. (approximated), URS Corp., December 2013.
Ce
ntr
al T
erm
inal
C
on
stru
ctio
n C
om
me
nce
me
nt
2E
EXISTING 0 1A 1B 2A 2B 2C 2F 3A 3B 3C 1C 2D
Commuter Terminal Demolition
Concourse G Demolition
Super G Opening
D-West Opening
E-Head Opening
Notes: 1. Some phases may overlap, but it is not shown here for clarity. 2. Upon completion, it is assumed that the Central Terminal is operated as a
common use facility to protect the spare gate requirements and accommodate the gate demand.
3. Gate capacity includes considerations for North Terminal enabling projects,
See Note 2

39 39
PROGRAM COST ESTIMATES

40
DRAFT – FOR PRELIMINARY AND PLANNING PURPOSES ONLY
40
Central Terminal Construction Cost Estimates
Phase Item Estimated Construction
Costs (2012 Dollars) Duration (Months)
Projected Start Year
Estimated Loaded Costs (2012 Dollars)
Escalated and Loaded Costs
0 Build Passenger Connector $52,333,815 24 2016 $71,958,995 $83,420,197
1A Demo Concourse G/ Terminal South $59,767,606 13 2018 $82,180,458 $101,071,598
1B Build Super G/ Terminal South $571,642,669 33 2019 $786,008,670 $995,692,267
1C Apron $5,063,924 2 2022 $6,962,896 $9,357,550
2A Demo Central Terminal North $128,538,929 18 2022 $176,741,027 $244,650,916
2B Build New Central (N) and Super E $1,104,406,734 29 2024 $1,518,559,259 $2,230,055,467
2C Build Super E Connector Building $240,222,745 12 2026 $330,306,275 $499,617,878
2D Demo Concourse E Lower $24,908,421 6 2027 $34,249,079 $53,358,949
2E Apron $16,026,570 10 2027 $22,036,533 $35,362,167
3A Demo Concourse F $22,766,757 6 2028 $31,304,291 $50,234,197
3B Apron $17,497,901 5 2029 $24,059,613 $38,608,616
TOTAL $2,243,176,070 $3,084,367,096 $4,341,429,802
Notes: 1. Total soft costs before escalation assumed to be 37.50%. 2. Escalation is calculated to the mid-point of each phase using a 3% rate, as recommended by U.S. Cost. 3. Excludes costs for proposed triturator, gas station, bus station, NTD and Concourse H gate upgrades and enabling projects, and potential Automated People Mover.
Sources: Terminal Construction Sequencing, Ricondo & Associates Inc., September 2013; Cost and Duration Estimates Adjusted for Refined Phases by Ricondo & Associates Inc. (approximated), URS Corp., December 2012 and U.S. Cost, April 2013.

41 41
RENDERINGS

42
DRAFT – FOR PRELIMINARY AND PLANNING PURPOSES ONLY
42
View from North

43
DRAFT – FOR PRELIMINARY AND PLANNING PURPOSES ONLY
43
View from South

44
DRAFT – FOR PRELIMINARY AND PLANNING PURPOSES ONLY
44
Next Steps
• MDAD to undertake financial planning for incremental implementation of the Central Terminal Program and other terminal capital projects.

45 45
QUESTIONS