MHE Q2-2018 Investor Deck · McGraw-Hill Education Q2-2018 Investor Update August 10, 2018 Final...
30
McGraw-Hill Education Q2-2018 Investor Update August 10, 2018 Final This presentation has been prepared for investors in the currently outstanding debt of McGraw-Hill Global Education Holdings, LLC and MHGE Parent, LLC.
Transcript of MHE Q2-2018 Investor Deck · McGraw-Hill Education Q2-2018 Investor Update August 10, 2018 Final...

McGraw-Hill
Education
Q2-2018 Investor Update
August 10, 2018
Final
This presentation has been prepared for investors in the currently outstanding debt of McGraw-Hill Global Education Holdings, LLC and MHGE Parent, LLC.

McGraw-Hill Education |
Important Notice
Forward-Looking Statements This presentation includes statements that are, or may be deemed to be, “forward-looking statements.” These forward-looking statements can be identified by the
use of forward-looking terminology, including the terms “believes,” “estimates,” “anticipates,” “expects,” “intends,” “plans,” “may,” “will” or “should” or, in each case,
their negative or other variations or comparable terminology. These forward-looking statements include all matters that are not historical facts. They appear in a
number of places throughout this presentation and include statements regarding our intentions, beliefs or current expectations concerning, among other things, our
results of operations, financial condition, liquidity, prospects, growth, strategies and the industry in which we operate.
By their nature, forward-looking statements involve risks and uncertainties because they relate to events and depend on circumstances that may or may not occur
in the future. We caution you that forward-looking statements are not guarantees of future performance and that our actual results of operations, financial condition
and liquidity, and the development of the industry in which we operate, may differ materially from those made in or suggested by the forward-looking statements
contained in this presentation. In addition, even if our results of operations, financial condition and liquidity, and the development of the industry in which we
operate are consistent with the forward-looking statements contained in this presentation, those results of operations, financial condition and liquidity or
developments may not be indicative of results or developments in subsequent periods.
Any forward-looking statements we make in this presentation speak only as of the date of such statement, and we undertake no obligation to update such
statements. Comparisons of results for current and any prior periods are not intended to express any future trends or indications of future performance, unless
expressed as such, and should only be viewed as historical data.
Non-GAAP Financial Measures Certain financial information included herein, including Billings, EBITDA and Adjusted EBITDA, are not presentations made in accordance with U.S. GAAP, and
use of such terms varies from others in our industry. Billings, EBITDA and Adjusted EBITDA should not be considered as alternatives to revenue, net income from
continuing operations, operating cash flows or any other performance measures derived in accordance with U.S. GAAP as measures of operating performance,
debt covenant compliance or cash flows as measures of liquidity. Billings, EBITDA and Adjusted EBITDA have important limitations as analytical tools, and you
should not consider them in isolation or as substitutes for analysis of our results as reported under U.S. GAAP. This presentation includes a reconciliation of
certain non-GAAP financial measures to the most directly comparable financial measures calculated in accordance with U.S. GAAP.
Adjusted EBITDA, which is defined in accordance with our debt agreements, is provided herein on a segment basis and on a consolidated basis. Adjusted EBITDA
by segment, as determined in accordance with Accounting Standards Codification Topic 280, Segment Reporting, is a measure used by Management to assess
the performance of our segments. Adjusted EBITDA on a consolidated basis is presented as a debt covenant compliance measure. Management believes that the
presentation of Adjusted EBITDA is appropriate to provide additional information to investors about certain material non-cash items and about unusual items that
we do not expect to continue at the same level in the future as well as other items to assess our debt covenant compliance, ability to service our indebtedness and
make capital allocation decisions in accordance with our debt agreements.
2

McGraw-Hill Education |
Business Review
3
McGraw-Hill Education, Inc.
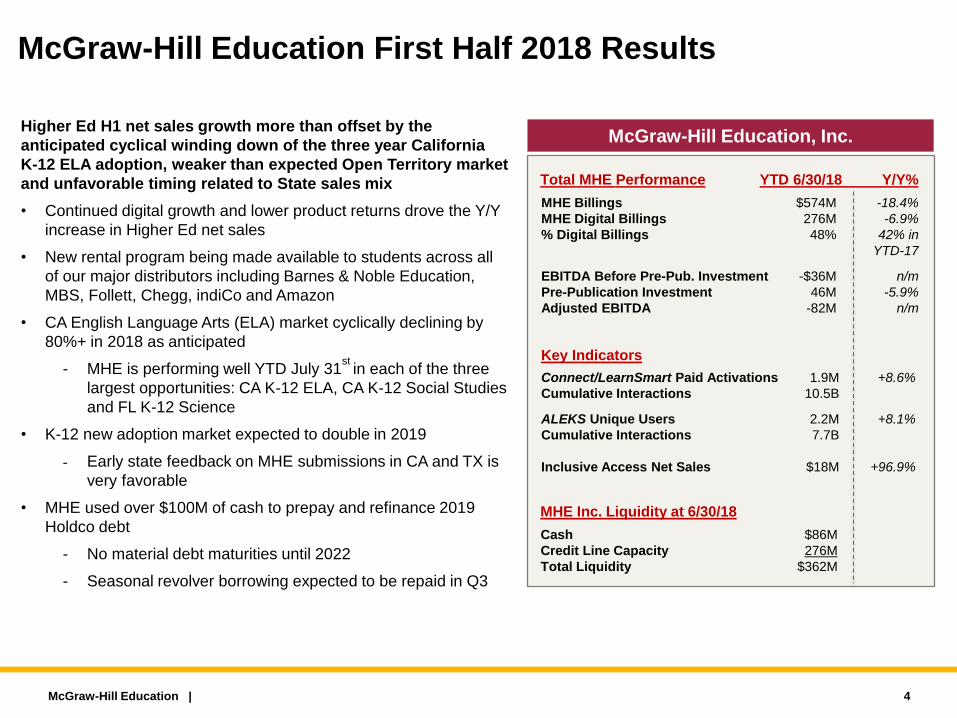
McGraw-Hill Education First Half 2018 Results
Higher Ed H1 net sales growth more than offset by the
anticipated cyclical winding down of the three year California
K-12 ELA adoption, weaker than expected Open Territory market
and unfavorable timing related to State sales mix
• Continued digital growth and lower product returns drove the Y/Y
increase in Higher Ed net sales
• New rental program being made available to students across all
of our major distributors including Barnes & Noble Education,
MBS, Follett, Chegg, indiCo and Amazon
• CA English Language Arts (ELA) market cyclically declining by
80%+ in 2018 as anticipated
- MHE is performing well YTD July 31st
in each of the three
largest opportunities: CA K-12 ELA, CA K-12 Social Studies
and FL K-12 Science
• K-12 new adoption market expected to double in 2019
- Early state feedback on MHE submissions in CA and TX is
very favorable
• MHE used over $100M of cash to prepay and refinance 2019
Holdco debt
- No material debt maturities until 2022
- Seasonal revolver borrowing expected to be repaid in Q3
McGraw-Hill Education |
MHE Billings
MHE Digital Billings
% Digital Billings
$574M
276M
48%
-18.4%
-6.9%
42% in
YTD-17
EBITDA Before Pre-Pub. Investment
Pre-Publication Investment
Adjusted EBITDA
-$36M
46M
-82M
n/m
-5.9%
n/m
Key Indicators
Connect/LearnSmart Paid Activations
Cumulative Interactions
1.9M
10.5B
+8.6%
ALEKS Unique Users
Cumulative Interactions
Inclusive Access Net Sales
2.2M
7.7B
$18M
+8.1%
+96.9%
Cash
Credit Line Capacity
Total Liquidity
$86M
276M
$362M
Total MHE Performance YTD 6/30/18 Y/Y%
MHE Inc. Liquidity at 6/30/18
4

MHE Higher Education
Stable performance in Higher Ed ahead of new rental program
launch
• Net sales grew mid-single-digits in H1 with Billings flat vs. PY
excluding rental impact
- Front-list and back-list performed well
- Returns continued to decline
- Digital Billings would have grown 12% in the YTD period
excluding a non-recurring prior period sale
- Drivers of digital growth: Inclusive Access +97% Y/Y and
direct-to-student e-commerce +6% Y/Y
- Rental ‘divot’ forms as 2019© are consigned vs. sold
• Rental program launched through a number of partnerships
- Consigned inventory has already begun to ship
- Timing of Billings will shift in rental model (next page)
- Continue to expect a rental ‘divot’ of 1-2% of total MHE
Billings and ~5% of total MHE Adjusted EBITDA in 2018
• Continued to gain market share on both a YTD and LTM basis
- No material financial impact YTD as a result of competitor
go-to-market strategy
McGraw-Hill Education |
Key Indicators
Connect/LearnSmart Paid Activations
Assignments Submitted
1.9M
56M
+8.6%
+8.4%
ALEKS Unique Users 1.0M +10.3%
Higher Ed Performance YTD 6/30/18 Y/Y%
Billings (net of accrued returns)1 $222M -2.5%
Net Sales (net of actual returns)2
Front-List Sales (net of actual returns)
Back-List Sales (net of actual returns)
$198M
52M
146M
+4.5%
+8.0%
+3.3%
Digital Billings
% Digital Billings
$169M
76%
+7.4%
69% in
YTD-17
Direct-to-Student e-commerce Sales
Inclusive Access Net Sales
Actual Product Returns Change
$104M
18M
-16M
+5.7%
+96.9%
-15.2%
EBITDA Before Pre-Pub. Investment
Adjusted EBITDA
$18M
0.5M
-9.6%
n/m
MHE vs. Industry Performance per MPI2,3
5
MHE Market Share Change (LTM 6/30/18)
Industry Net Sales (net of actual returns)
YTD 6/30/18
+~75 bps
-1.5%
1Billings is gross sales net of accrued returns and is the measure of company performance; Billings metric lags net sales as a result of the timing of the returns accrual. 2Net sales is gross sales net of actual returns not adjusted for the impact of accruals and reversals and is the industry market share measure.
3Per Management Practice, Inc.
Higher Education First Half 2018 Results

Timing of Higher Ed Billings Continues to Shift Significantly
Business transitioning to digital and print rental
McGraw-Hill Education | 6
Q1 Q2 Q3 Q4
Billings
• Direct-to-student
e-commerce continues to
grow
• Print rental revenue will
move from Q4 to Q1
• Print sales previously
booked in late June are
transitioning to digital
(inclusive access and e-
commerce) and print
rental in Q3 and Q4
• Q3 and early Q4
become more
significant as a result of
e-commerce (August/
September); rental
revenue and inclusive
access booked in
arrears at the very end
of Q3 and early Q4
• Early Q4 becomes more
important from rental
revenue and inclusive
access
• Late December print
sales shift to Q1 rental
and digital revenue
Actual Returns
• No changes in timing of returns but quantity of actual returns should decline over time as business transitions to digital
and print rental
• March/April and October/November remain largest actual returns seasons
Accounts Receivable and
Inventory
• Limited impact on working capital anticipated except perhaps timing
• Inventory conversion to a sale/accounts receivable will shift from in advance of consumer transaction (bookstore
stocking) to in arrears (after consumer rental)
• At year-end, anticipate lower accounts receivable balance as sales transition to Q1
• Inventory levels may be marginally higher as a result of consigned inventory, particularly in launch years

H1 impacted by expected significantly smaller CA ELA market in
2018, delayed purchasing in first year of CA K-5 Social Studies
adoption and weaker than expected Open Territory market
• Third and final year of CA ELA market declined $320-340M, as
anticipated, accounting for $80M of $109M Y/Y decline in H1 MHE
Billings despite continued strong market share
• 2018 Billings decline concentrated in Q2
- CA K-12 Social Studies market smaller than anticipated in
first of three years; MHE is a market leader – purchasing
mainly in Q3, but some K-5 purchasing decisions postponed
- FL K-12 Science market size is in line with expectations,
MHE is a market leader – also purchasing mainly in Q3
- Anticipate Open Territory full-year market to perform at low
end of the -3% to +3% long-range guidance as districts await
new programs to be sold in the larger 2019 and 2020
adoptions - purchases typically concentrated in Q3
• Estimating K-12 Billings in FY 2018 to be -10 to -15% Y/Y, largely
driven by anticipated 80%+ CA ELA market decline
• 2019 and 2020 K-12 new adoption market expected to be double
the size of 2018
- Early state feedback on MHE submissions in CA and TX is
very favorable
• New partnership with Sesame Street Workshop integrates award
winning content and brand into MHE’s literacy content
- Launched for 2019 TX ELA adoption
McGraw-Hill Education |
Billings (net of accrued returns)
Digital Billings
% Digital Billings
$211M
67M
32%
-34.1%
-31.2%
30% in
YTD-17
MHE Total Adoption Billings
MHE Open Territory/Other Billings
$109M
102M
-43.4%
-19.7%
EBITDA Before Pre-Pub. Investment
Adjusted EBITDA
-$42M
-64M
n/m
n/m
Key Indicators
ConnectED Unique Users 4.8M +19.7%
ALEKS Unique Users 1.2M +6.3%
7
K-12 Performance YTD 6/30/18 Y/Y%
New Adoption Market Size1
2017 New Adoption Market
CA Market (ELA)
2018 New Adoption Market
CA Market (ELA & SS)
2019 New Adoption Market
2020 New Adoption Market
~$700M
~$400M
$420-520M
$110-145M
$900-1,100M
$900-1,000M
-26 to -40%
-64 to -72%
~+100%
~ Flat
1MHE estimate without adjustment for participation or share.
ELA = English Language Arts
MHE K-12
K-12 First Half 2018 Results

K-12 First Half 2018 Results Driven largely by 80%+ anticipated cyclical market decline in CA ELA
McGraw-Hill Education | 8
H1 2018 decline largely driven by the anticipated, smaller CA ELA market in which
MHE had captured outsized market share in 2016 and 2017
$187 $181 $156
$126 $129
$49
$313 $310
$204
YTD Jun-16 YTD Jun-17 YTD Jun-18
Total Net Sales1
(Includes Adoption, Open Territory & Residual)
Y/Y $ / % ($3) (1%) ($106) (34%)
1 MHE K-12 total net sales excludes the impact of shipping, handling and accounting adjustments which is included in Billings. Totals may not sum due to rounding. 2 Total CA net sales includes both K-8 and 9-12.
Total CA2 Total Non-CA & Other
($ in Millions)
CA
All
Other

California K-8
CA 9-12 classified
within Open Territory
2017 2018E 2019E 2020E
Reading (yr 2)
~$400M
Reading (yr 3)
~$60-80M
+30% vs. 2016 -80 to -85% vs. 2017 for K-8 ELA
Social Studies (yr 1)
NEW: ~$50-65M
Previous: ~$60-80M
Social Studies (yr 2)
NEW: ~$70-100M
Previous: ~$85-115M
Science (yr 1)
~$100-125M
Social Studies
(yr 3)
Science
(yr 2) +30% vs. 2016 -64 to -72% vs. 2017 for Total CA
Florida Social Studies
>$100M
Science
~$125-150M
Math
~$150-200M
Reading
Texas Reading (K-8)
~$300-350M Reading (9-12)
Big-3 State New Adoption
Estimated Total Market >$500M
NEW: ~$235-295M
Previous: ~$245-310M
NEW: ~$625-765M
Previous: ~$635-790M
Total New Adoption Estimate
~$700M
(vs. anticipated range of
~$600-650M)
NEW: ~$420-520M
Previous: ~$500-600M -26 to -40%
~$900-1,100M ~+100%
~$900-1,000M
K-12 New Adoption Market Update Significant opportunity in 2019-2020; 2018 CA ELA market drops by 80%+ vs. 2017
McGraw-Hill Education | 9
Open Territory (new and residual) total market estimated to fluctuate -3% to +3% per annum over the next several years. For 2018, we
now expect the market to be at the low end of the range as large New Adoptions historically stimulate Open Territory growth.
Source: MHE estimate of total market without adjustment for participation or market share. Adoption market data above is new adoption only and does not include
off-list / residual sales that fluctuate but can be as large as new adoption sales in a given year. Market size ranges driven by several factors including 1) applicable
enrollment, 2) potential use of core instructional funds for off-list purchases (e.g. supplemental), and 3) other factors that may influence or defer purchase decisions.

International and Professional First Half 2018 Results Repositioning the businesses for growth in 2019 and beyond
International
• New president of international business named and new regional
managing directors put in place in H1
• Refocusing the business toward regional decision making closer
to the customer, increasing front-list publishing to maximize print
sales and increasing digital penetration
• YTD Billings declined vs. prior year on a constant FX basis
primarily due to weaker print Billings
- Billings declined 9% excluding the Canadian K-12 business
which was sold in May 2017
- Billings adversely impacted by stronger controls on sales to
distributors to prevent international student editions from
returning to the U.S. to be sold in the secondary market
Professional
• YTD Billings declined vs. prior year but subscription renewal rate
remained strong at 93%
- Digital Billings affected by a large number of multi-year
renewals (paid upfront) in 2017
• Focused on maximizing global sales of the new edition of
Harrison’s Principals of Internal Medicine, along with growth in
Access platform sales
McGraw-Hill Education |
Billings (as reported)
Billings (on constant FX)
Digital Billings
% Digital Billings
$94M
$92M
14M
15%
-11.0%
-12.9%
-6.1%
14% in
YTD-17
EBITDA Before Pre-Pub. Investment
Adjusted EBITDA
-$18M
-22M
n/m
-40.1%
MHE Professional
Billings
Digital Billings
% Digital Billings
$47M
25M
54%
-6.7%
-4.6%
53% in
YTD-17
EBITDA Before Pre-Pub. Investment
Adjusted EBITDA
$9M
5M
-26.1%
-41.0%
10
Key Indicators
Key Indicators
Access Platform Renewal Rate1 93%
International Performance YTD 6/30/18 Y/Y%
Professional Performance YTD 6/30/18 Y/Y%
1As of December 2017 and updated on an annual basis.
MHE International
Connect/LearnSmart Paid Activations >205K
ALEKS Unique Users >89K
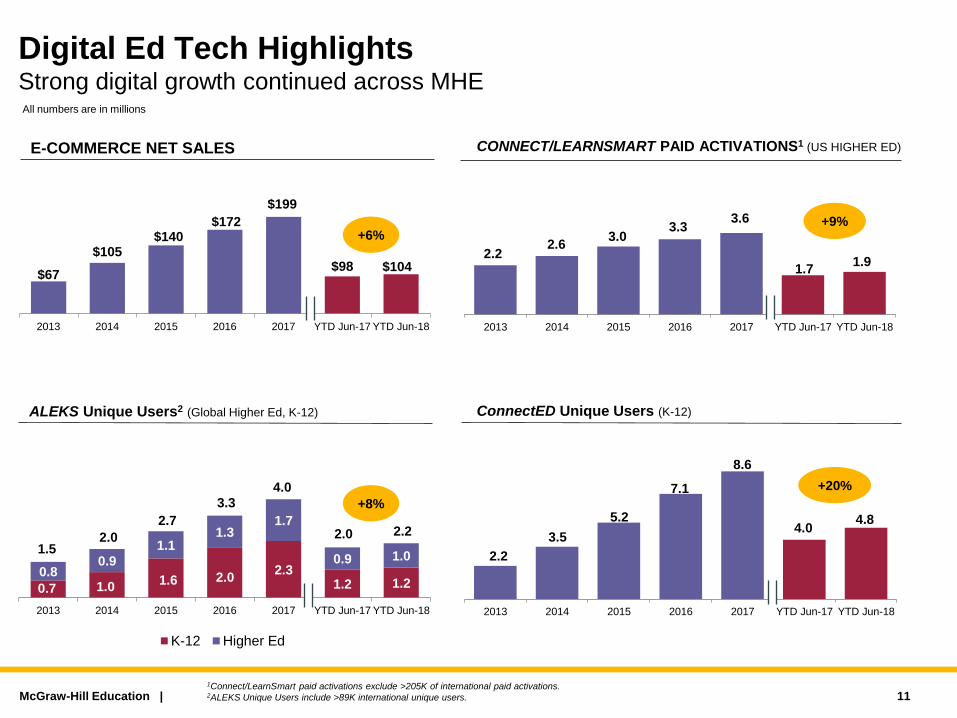
0.7 1.0 1.6 2.0
2.3 1.2 1.2
0.8 0.9
1.1 1.3
1.7
0.9 1.0 1.5
2.0
2.7
3.3
2.0 2.2
2013 2014 2015 2016 2017 YTD Jun-17 YTD Jun-18
K-12 Higher Ed
4.0
2.2 2.6
3.0 3.3
3.6
1.7 1.9
2013 2014 2015 2016 2017 YTD Jun-17 YTD Jun-18
$67
$105 $140
$172
$199
$98 $104
2013 2014 2015 2016 2017 YTD Jun-17 YTD Jun-18
Digital Ed Tech Highlights Strong digital growth continued across MHE
CONNECT/LEARNSMART PAID ACTIVATIONS1 (US HIGHER ED)
ALEKS Unique Users2 (Global Higher Ed, K-12)
+6% +9%
McGraw-Hill Education |
ConnectED Unique Users (K-12)
2.2
3.5
5.2
7.1
8.6
4.0 4.8
2013 2014 2015 2016 2017 YTD Jun-17 YTD Jun-18
+20%
1Connect/LearnSmart paid activations exclude >205K of international paid activations. 2ALEKS Unique Users include >89K international unique users.
+8%
All numbers are in millions
11
E-COMMERCE NET SALES

McGraw-Hill Education |
Financial Review
12
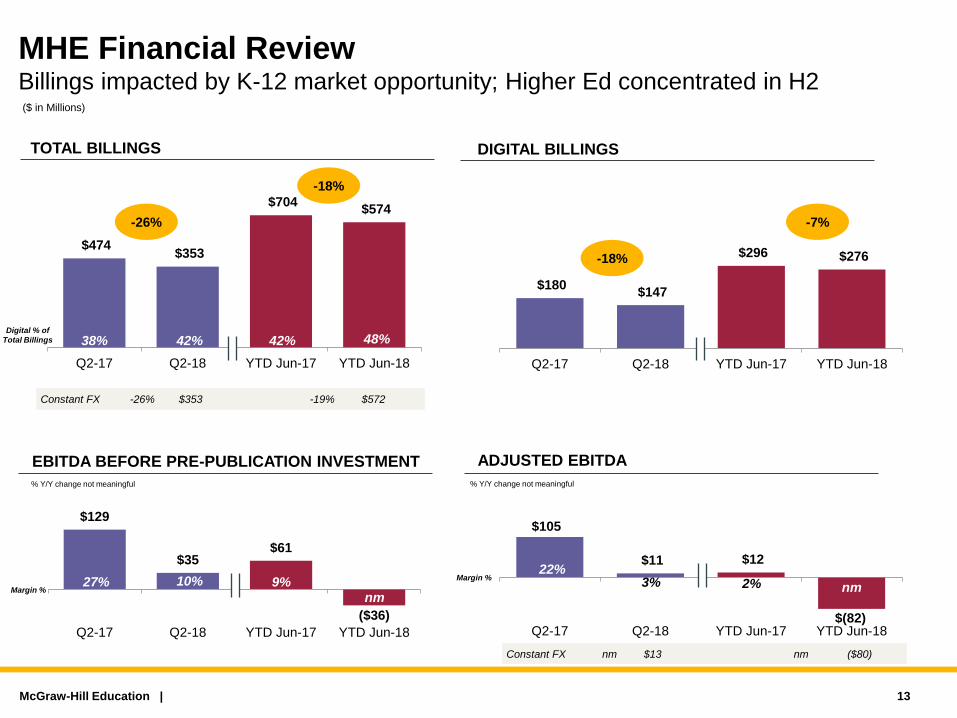
$180 $147
$296 $276
Q2-17 Q2-18 YTD Jun-17 YTD Jun-18
$105
$11 $12
$(82) Q2-17 Q2-18 YTD Jun-17 YTD Jun-18
$474 $353
$704 $574
Q2-17 Q2-18 YTD Jun-17 YTD Jun-18
McGraw-Hill Education |
MHE Financial Review Billings impacted by K-12 market opportunity; Higher Ed concentrated in H2
TOTAL BILLINGS
($ in Millions)
Digital % of
Total Billings
-18%
38% 42%
Constant FX -26% $353 -19% $572
42% 48%
-26%
EBITDA BEFORE PRE-PUBLICATION INVESTMENT
Constant FX nm $13 nm ($80)
ADJUSTED EBITDA
Margin %
27% 27% Margin %
6% 9%
% Y/Y change not meaningful
DIGITAL BILLINGS
-7%
-18%
$129
$35 $61
($36)
Q2-17 Q2-18 YTD Jun-17 YTD Jun-18
% Y/Y change not meaningful
27% 10% 9% nm
22% 3% 2% nm
13

$67 $65
$157 $169
Q2-17 Q2-18 YTD Jun-17 YTD Jun-18
$(7)
$(16)
$5 $1
Q2-17 Q2-18 YTD Jun-17 YTD Jun-18
$97 $86
$227 $222
Q2-17 Q2-18 YTD Jun-17 YTD Jun-18
McGraw-Hill Education |
Higher Education Financial Review Digital Billings +12% YTD excluding non-recurring sale in prior period
-2%
-11%
+7%
-3%
$0
($7)
$19 $18
Q2-17 Q2-18 YTD Jun-17 YTD Jun-18
69% 75% 69% 76%
nm nm
9% 8% nm nm
2% nm
-10%
TOTAL BILLINGS
% Y/Y change not meaningful % Y/Y change not meaningful
Margin %
Margin %
($ in Millions)
Digital % of
Total Billings
14
DIGITAL BILLINGS
EBITDA BEFORE PRE-PUBLICATION INVESTMENT ADJUSTED EBITDA

$87 $58
$97
$67
Q2-17 Q2-18 YTD Jun-17 YTD Jun-18
$99
$21 $13
$(64)
Q2-17 Q2-18 YTD Jun-17 YTD Jun-18
$284
$181
$320
$211
Q2-17 Q2-18 YTD Jun-17 YTD Jun-18
McGraw-Hill Education |
K-12 Financial Review Performance impacted by anticipated decline in CA ELA market and sales timing
-34% -36%
27% 27% 6% 9%
-31% -33%
$112
$31 $37
($42)
Q2-17 Q2-18 YTD Jun-17 YTD Jun-18
31% 32% 30% 32%
40% 17% 12%
nm
35% 11% 4% nm
TOTAL BILLINGS
ADJUSTED EBITDA
Margin %
% Y/Y change not meaningful
DIGITAL BILLINGS
% Y/Y change not meaningful
Margin %
($ in Millions)
Digital % of
Total Billings
15
EBITDA BEFORE PRE-PUBLICATION INVESTMENT
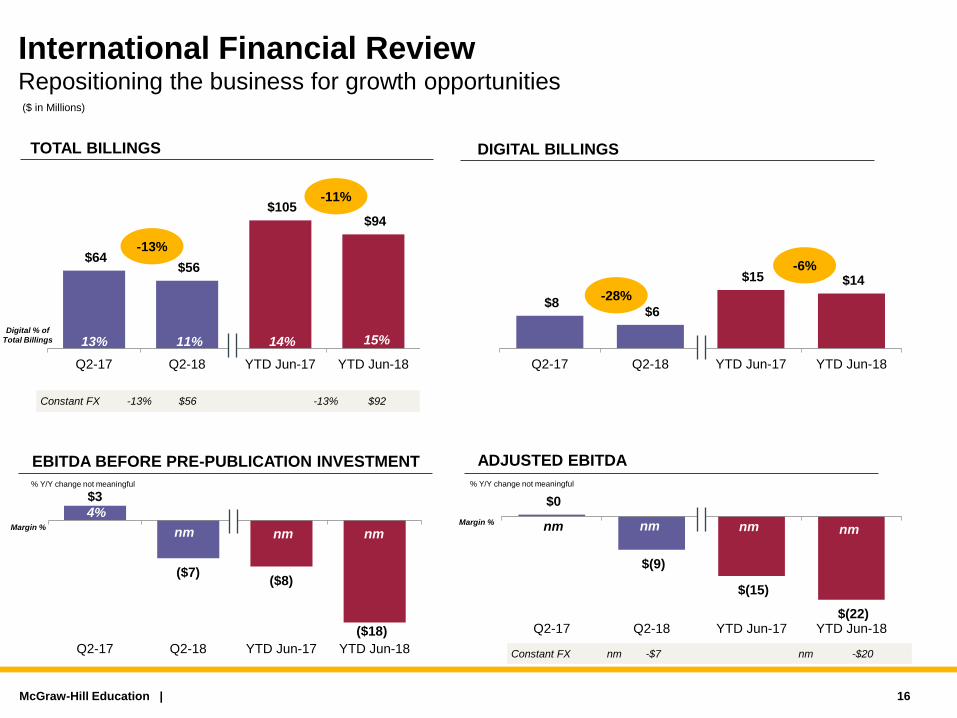
$8 $6
$15 $14
Q2-17 Q2-18 YTD Jun-17 YTD Jun-18
$0
$(9)
$(15)
$(22) Q2-17 Q2-18 YTD Jun-17 YTD Jun-18
$64 $56
$105 $94
Q2-17 Q2-18 YTD Jun-17 YTD Jun-18
McGraw-Hill Education |
International Financial Review Repositioning the business for growth opportunities
Constant FX -13% $56 -13% $92
Constant FX nm -$7 nm -$20
27% 27% 6% 9%
-11%
-13%
-6%
-28%
$3
($7) ($8)
($18)
Q2-17 Q2-18 YTD Jun-17 YTD Jun-18
13% 11% 14% 15%
4%
nm nm nm nm nm nm nm
TOTAL BILLINGS
Margin %
% Y/Y change not meaningful % Y/Y change not meaningful
Margin %
($ in Millions)
16
DIGITAL BILLINGS
EBITDA BEFORE PRE-PUBLICATION INVESTMENT ADJUSTED EBITDA
Digital % of
Total Billings

$18 $17
$27 $25
Q2-17 Q2-18 YTD Jun-17 YTD Jun-18
$9 $8
$9
$5
Q2-17 Q2-18 YTD Jun-17 YTD Jun-18
$30 $29
$51 $47
Q2-17 Q2-18 YTD Jun-17 YTD Jun-18
McGraw-Hill Education |
Professional Financial Review Business impacted by timing of multi-year renewals
-7%
-2%
27% 27% 6% 9%
-5%
-1%
$11 $10
$12
$9
Q2-17 Q2-18 YTD Jun-17 YTD Jun-18
-26%
-18%
59% 60% 53% 54%
37% 34% 25% 19% 31% 26% 18% 11%
-12%
-41%
TOTAL BILLINGS
Margin % Margin %
($ in Millions)
Digital % of
Total Billings
17
DIGITAL BILLINGS
EBITDA BEFORE PRE-PUBLICATION INVESTMENT ADJUSTED EBITDA

Capital Structure and Liquidity Continued to de-lever while addressing near-term HoldCo maturity in H1
• MHE efficiently managed cash through the seasonal trough
in H1 and will start building cash during the third quarter
• Used $103M of cash to partially reduce Holdco debt due in
2019 and refinanced the remainder into $180M of new
Holdco debt due in 2022
• June 30th
revolver balance of $70M* expected to be fully
repaid in Q3
- Revolver would not have been utilized at quarter-end
if not for the refinancing transaction
• Term Loan Restricted Payment capacity was fully utilized
as part of the refinancing and will begin to rebuild in H2
• EBITDA impacted by K-12 timing shift and Higher Ed rental
divot; LTM expected to grow in H2
McGraw-Hill Education |
Cash and Cash Equivalents
McGraw-Hill Global Education Holdings $86
Available under Credit Facilities at June 30, 2018 276
Total Liquidity $362
MCGRAW-HILL EDUCATION LIQUIDITY: 6/30/18
MCGRAW-HILL EDUCATION DEBT PROFILE: 6/30/18
Senior Secured Term Loan due 2022 $1,692
Revolving Credit Facility due 2021 ($350M)* 70
Total First Lien Indebtedness $1,762
Less: Cash and Cash Equivalents (86)
Net First Lien Indebtedness $1,676
Last Twelve Months Adjusted EBITDA $306
(seasonally low due to sales mix and initiative changes)
Net First Lien Indebtedness / Adjusted EBITDA1 5.5x
(covenant not required to be tested – seasonal high)
Senior Unsecured Notes Due 2024 400
Net Total Indebtedness-MHE Global Education $2,076
MHGE Parent Notes Due 2022 180
Net Total Indebtedness – MHE Inc. $2,256
18
1Net First Lien Leverage covenant in respect of our revolving credit facility is tested if 30% of the revolving credit facility was drawn at quarter-end. Usage was less than 30%
at June 30, so covenant did not apply. The Net First Lien Leverage covenant levels, if required to be tested, would be 5.25x in Q2 and 4.8x in Q1,Q3 and Q4 EBITDA
used to calculate the Net First Lien Leverage covenant ratio would be Adjusted EBITDA plus pro-forma adjustments that are permitted under the credit agreement
and indenture.
($ in Millions)
($ in Millions)
*$70M revolver borrowings at June 30th does not include $4M of long-term letters of credit issued.

Summary
• Higher Ed continued to experience strong digital growth (net sales and paid activations) and continued
declines in actual returns
- MHE rental program launched across all major distributors and made available to students
- Continue to expect a small rental ‘divot’ of 1-2% of total MHE Billings and ~5% of total MHE Adjusted
EBITDA in 2018
• K-12 performing well in the available, but significantly smaller California market in 2018 and is very well
positioned to compete and grow sales in the significantly larger 2019-2020 adoption markets
- K-12 performance will be down Y/Y given the significantly smaller California market size vs. 2017
- Estimating K-12 Billings in FY 2018 will be -10 to -15% Y/Y, largely driven by the anticipated 80%+ CA
ELA market decline, but also due to the continued weakness in Open Territory
- Positioned well for major 2019 new State Adoptions and rebound of Open Territory as new products
are introduced – MHE programs submitted to States, early positive feedback received
• International is better positioned to capitalize on print and digital sales opportunities beginning in 2019
through more robust front-list publishing and more focused execution under new leadership
• Capital structure is well positioned as we successfully refinanced last of the near-term debt maturities and
navigated through annual working capital cash trough
McGraw-Hill Education | 19
McGraw-Hill Education |
Appendix: Supplemental Disclosure and Financial Tables
20

Financial Terms and Acronyms
McGraw-Hill Education |
Financial Terms Description
Adjusted EBITDA
Non-GAAP financial measure that includes adjustments required or permitted in calculating covenant compliance under our debt agreements. Adjusted EBITDA is a non-
GAAP financial measure defined as net income from continuing operations plus net interest, income taxes, depreciation and amortization (including amortization of pre-
publication investment cash costs) and adjusted to exclude unusual items and other adjustments required or permitted in calculating covenant compliance under our debt
agreements less cash spent for pre-publication investment in addition to the change in deferred revenue and deferred royalties.
Billings (formerly
referred to as
Adjusted
Revenue)
Non-GAAP financial measure that we define as U.S. GAAP revenue plus the net change in deferred revenue excluding the impact of purchase accounting. Billings, a measure
used by management to assess sales performance, is defined as the total amount of revenue that would have been recognized in a period if all revenue were recognized
immediately at the time of sale.
Change in
Deferred Revenue
The Company receives cash up-front for most product sales but recognizes revenue (primarily related to digital sales) over time recording a liability for deferred revenue at the
time of sale. This adjustment represents the net effect of converting deferred revenues to a cash basis assuming the collection of all receivable balances.
Change in
Deferred Royalty
Royalty obligations are generally payable in the period incurred with limited recourse. This represents royalties primarily associated with digital sales which are deferred and
amortized over the subscription period. It is the net effect of converting deferred royalties to a cash basis assuming the payment of all amounts owed in the period incurred.
Deferred
Commissions
Commissions are generally payable in the period incurred. This represents sales commissions that are incremental direct costs to obtaining a contract which are deferred and
amortized over the period of contract performance. It is the net effect of converting deferred commissions to a cash basis assuming the payment of all amounts owed in the
period incurred.
Digital Billings
(formerly referred
to as Digital
Adjusted Revenue)
Represents standalone digital sales and, where digital product is sold in a bundled arrangement, only the value attributed to the digital component(s) is included. The
attribution of value in bundled arrangement is based on relative selling prices (inclusive of discounts).
EBITDA Earnings before interest (net), income tax, depreciation and amortization.
Front-list and
Back-list
Front-list represents brand new titles and new revisions of existing titles previously published. For example, the 2017 front-list represents 2018 and 2017 copyrights sold in
2017. Back-list represents copyrights from 2016 and prior sold in 2017.
Net Sales Gross sales less actual returns; net sales are not adjusted for the impact of accruals / net change in deferred revenue.
Pre-publication
Investment
Pre-publication costs reflect the costs incurred in the development of instructional solutions, principally design and content creation. These costs are capitalized when the title
is expected to generate future economic benefits and are amortized upon publication of the title over its estimated useful life of up to six years.
Sell-through Represents the percentage of students in a class purchasing MHE materials – new or through the MHE rental program.
KPI Terms Description
Paid Activation A user who accesses a purchased digital product for the first time. Access can be through a physical access card purchased from a bookstore or directly over MHE’s
e-commerce channel.
Unique User on a
platform An individual who authenticates a product at least once during a given period of time.
21

Billings and Adjusted EBITDA
McGraw-Hill Education |
Billings is a non-GAAP sales performance measure that provides useful information in evaluating our period-to-period performance because it
reflects the total amount of revenue that would have been recognized in a period if we recognized all print and digital revenue at the time of sale.
We use Billings as a sales performance measure given that we typically collect full payment for our digital and print solutions at the time of sale or
shortly thereafter, but recognize revenue from digital solutions and multi-year deliverables ratably over the term of our customer contracts. As
sales of our digital learning solutions have increased, so has the amount of revenue that is deferred in accordance with U.S. GAAP. Billings is a
key metric we use to manage our business as it reflects the sales activity in a given period, provides comparability from period-to-period during
this time of digital transition and is the basis for all sales incentive compensation. In the K-12 market where customers typically pay for five to
eight year contracts upfront and the ongoing costs to service any contractual obligation are limited, the impact of the change in deferred revenue
is most significant. Billings is U.S. GAAP revenue plus the net change in deferred revenue.
EBITDA, a measure used by management to assess operating performance, is defined as net income from continuing operations plus net
interest, income taxes, depreciation and amortization (including amortization of pre-publication investment). Adjusted EBITDA is a non-GAAP debt
covenant compliance measure that is defined in accordance with our debt agreements. Adjusted EBITDA is a material term in our debt
agreements and provides an understanding of our debt covenant compliance, ability to service our indebtedness and make capital allocation
decisions in accordance with our debt agreements.
Each of the above described measures is not a recognized term under U.S. GAAP and does not purport to be an alternative to revenue, income
from continuing operations, or any other measure derived in accordance with U.S. GAAP as a measure of operating performance, debt covenant
compliance or to cash flows from operations as a measure of liquidity. Additionally, each such measure is not intended to be a measure of free
cash flows available for management’s discretionary use, as it does not consider certain cash requirements such as interest payments, tax
payments and debt service requirements. Such measures have limitations as analytical tools, and you should not consider any of such measures
in isolation or as substitutes for our results as reported under U.S. GAAP. Management compensates for the limitations of using non-GAAP
financial measures by using them to supplement U.S. GAAP results to provide a more complete understanding of the factors and trends affecting
the business than U.S. GAAP results alone. Because not all companies use identical calculations, our measures may not be comparable to other
similarly titled measures of other companies.
Management believes Adjusted EBITDA is helpful in highlighting trends because Adjusted EBITDA excludes the results of decisions that are
outside the control of operating management and can differ significantly from company to company depending on long-term strategic decisions
regarding capital structure, the tax rules in the jurisdictions in which companies operate, and capital investments. In addition, Billings and Adjusted
EBITDA provides more comparability between the historical operating results and operating results that reflect purchase accounting and the new
capital structure post the Founding Acquisition as well as the digital transformation that we are undertaking which requires different accounting
treatment for digital and print solutions in accordance with U.S. GAAP.
Management believes that the presentation of Adjusted EBITDA is appropriate to provide additional information to investors about certain material
non-cash items and about unusual items that we do not expect to continue at the same level in the future as well as other items to assess our
debt covenant compliance, ability to service our indebtedness and make capital allocation decisions in accordance with our debt agreements.
Note: In compliance with SEC interpretative guidance, we now refer to ‘Adjusted Revenue’ as ‘Billings’ throughout the presentation.
22

Higher Ed Front-List / Back-List Net Sales1
McGraw-Hill Education |
12018 front-list represents 2019 and 2018 copyrights sold in 2018; they do not begin to impact current year until very late Q2.
2Gross sales less actual returns; net sales are not adjusted for the impact of accruals / net change in deferred revenue.
3Reflects the impact of accounting related to accruals / deferrals.
($ in Millions)
23
Twelve Months Ended December 31
2012 2013 2014 2015 2016 2017 June 2017 June 2018
Digital Net Sales
Front-list $100 $126 $132 $156 $149 $166 $31 $42
Back-list 137 153 194 220 263 281 126 127
Total Digital Net Sales $237 $278 $326 $376 $411 $447 $157 $169
Y/Y %
Front-list (6.0%) 25.1% 5.2% 18.2% (4.7%) 11.9% (10.9%) 36.6%
Back-list 53.7% 11.8% 27.1% 13.4% 19.2% 7.0% 24.1% 0.5%
Total Digital Net Sales 21.1% 17.4% 17.2% 15.3% 9.3% 8.8% 15.2% 7.4%
Print Net Sales
Front-list $317 $323 $291 $233 $149 $145 $17 $10
Back-list 205 215 233 178 152 125 15 19
Total Print Net Sales $523 $538 $524 $411 $302 $270 $32 $29
Y/Y %
Front-list (23.9%) 1.9% (9.9%) (20.0%) (35.9%) (2.7%) (25.3%) (42.7%)
Back-list 0.6% 4.7% 8.5% (23.6%) (14.6%) (17.8%) 27.0% 28.9%
Total Print Net Sales (15.9%) 3.0% (2.6%) (21.6%) (26.7%) (10.6%) (7.9%) (9.9%)
Total Net Sales
Front-list $418 $449 $423 $389 $298 $311 $48 $52
Back-list 342 368 427 398 415 406 141 146
Total Net Sales 2 $760 $817 $851 $787 $713 $717 $189 $198
Y/Y %
Front-list (20.3%) 7.5% (5.7%) (8.1%) (23.4%) 4.5% (16.7%) 8.0%
Back-list 16.7% 7.5% 16.2% (6.8%) 4.1% (2.2%) 24.4% 3.3%
Total Net Sales (7.0%) 7.5% 4.2% (7.4%) (9.5%) 0.6% 10.5% 4.5%
Other (Accounting Accruals/Reversals) 2 (1) 4 5 (2) 1 1 (2)
Total Net Sales3
$762 $816 $855 $793 $711 $718 $190 $196
Y/Y % (7.5%) 7.1% 4.8% (7.3%) (10.3%) 1.0% 11.1% 3.3%
Six Months Ended

Higher Ed Industry and MHE Higher Ed Sales Trend
McGraw-Hill Education | 24
1MPI data reflects gross and net sales on an actual returns basis and includes other adjustments, eg. Advanced Placement products, which are reported in the K-12
business. Annual MPI data is on an unrestated basis; prior period YTD data has been restated as per the 6/30/18 MPI report. Amounts may not sum due to rounding.
($ in Millions)
2011 2012 2013 2014 2015 2016 2017 June 2017 June 2018
Higher Ed Market
Gross Sales $5,726 $5,420 $5,453 $5,465 $5,302 $4,695 $4,390 $1,442 $1,332
Returns 1,323 1,311 1,262 1,214 1,377 1,250 982 519 425
Net Sales $4,403 $4,110 $4,191 $4,251 $3,925 $3,446 $3,408 $923 $908
Y/Y %
Gross Sales n/a (5.3%) 0.6% 0.2% (3.0%) (11.4%) (6.5%) (5.5%) (7.5%)
Returns n/a (0.9%) (3.7%) (3.8%) 13.5% (9.2%) (21.4%) (25.2%) (18.1%)
Net Sales n/a (6.7%) 2.0% 1.4% (7.7%) (12.2%) (1.1%) 11.0% (1.5%)
McGraw-Hill Education Return Detail
Actual Returns $263 $276 $257 $252 $277 $237 $208 $108 $91
Reserve for Returns Adjustment (3) (13) 9 16 (31) (23) 2 (37) (25)
Reported Returns $260 $263 $266 $268 $246 $215 $210 $71 $66
Return Accrual % 24.4% 25.8% 25.1% 24.4% 23.4% 22.7% 22.8% 20.9% 19.7%
Twelve Months Ended December 31 Six Months Ended
Higher Ed Industry per Management Practice, Inc.1

K-12 New Adoption Market Overview
McGraw-Hill Education |
1Excludes new state adoptions in non-core disciplines such as career & technical education, music, art, world languages, health, etc. Purchases from AR & IN classified as open territory effective 2015.
2Mississippi swapped Science (now 2018) with Social Studies (now 2019); Math to be purchased in 2019 instead of 2020.
3North Carolina adopted new K-8 Math standards and is purchasing Math instead of ELA in 2019.
4Virginia updated their adoption schedule for Reading in 2019; Science is on track for 2020.
*Disciplines reflect 2nd
and 3rd
year of major purchasing.
25
2012 2013 2014 2015 2016 2017 2018E 2019E 2020E
Largest Adoption States
Reading Reading* Science Science*
Math Social Studies Social Studies* Social Studies*
Reading (K-5) Reading (6-12)
Math (K-5) Math (6-12)
Math (K-8) Math (9-12)
Social StudiesScience*
All Other Adoption States
Alabama Math Reading Social Studies Science Math
Arkansas Math
Math*
Reading
Idaho Science Reading Math Social Studies Reading Science
Indiana Reading Reading*
Math (K-8) Social Studies2
Social Studies Math2
North Carolina Math Science Social Studies Math K-83
New Mexico Science Math Reading Social Studies Science Math
Math
Social Studies (6-12)
MathSocial Studies*
Social Studies
Math
California (K-8) Math Math* Reading Reading*
Social Studies Science Math Reading (K-12)
New State Adoptions by Purchase Year1
Georgia Math Reading*
Florida Social Studies
Texas Science Reading (K-8) Reading (9-12)Science
Louisiana Reading Math
Mississippi Reading Math (9-12) Reading Science 2
Oklahoma Social Studies Science Reading Math Social Studies
Social Studies
South Carolina Reading Social Studies (K-5) Science
Oregon Social Studies Reading Reading* Math Science
Reading
Social Studies Reading
Virginia Science Social Studies Reading4 Science4
Tennessee Reading (9-12) Reading (K-6) Social Studies Math Science
West Virginia Reading Science Math Social Studies
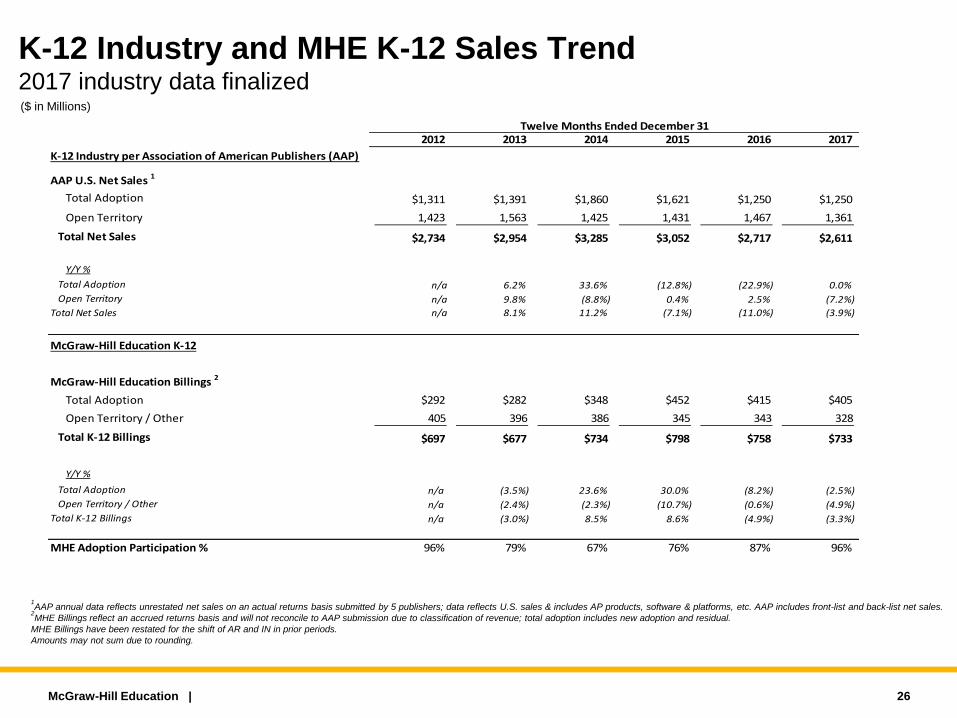
K-12 Industry and MHE K-12 Sales Trend 2017 industry data finalized
McGraw-Hill Education |
1AAP annual data reflects unrestated net sales on an actual returns basis submitted by 5 publishers; data reflects U.S. sales & includes AP products, software & platforms, etc. AAP includes front-list and back-list net sales.
2MHE Billings reflect an accrued returns basis and will not reconcile to AAP submission due to classification of revenue; total adoption includes new adoption and residual.
MHE Billings have been restated for the shift of AR and IN in prior periods.
Amounts may not sum due to rounding.
26
($ in Millions)
2012 2013 2014 2015 2016 2017
K-12 Industry per Association of American Publishers (AAP)
AAP U.S. Net Sales 1
Total Adoption $1,311 $1,391 $1,860 $1,621 $1,250 $1,250
Open Territory 1,423 1,563 1,425 1,431 1,467 1,361
Total Net Sales $2,734 $2,954 $3,285 $3,052 $2,717 $2,611
Y/Y %
Total Adoption n/a 6.2% 33.6% (12.8%) (22.9%) 0.0%
Open Territory n/a 9.8% (8.8%) 0.4% 2.5% (7.2%)
Total Net Sales n/a 8.1% 11.2% (7.1%) (11.0%) (3.9%)
McGraw-Hill Education K-12
McGraw-Hill Education Billings 2
Total Adoption $292 $282 $348 $452 $415 $405
Open Territory / Other 405 396 386 345 343 328
Total K-12 Billings $697 $677 $734 $798 $758 $733
Y/Y %
Total Adoption n/a (3.5%) 23.6% 30.0% (8.2%) (2.5%)
Open Territory / Other n/a (2.4%) (2.3%) (10.7%) (0.6%) (4.9%)
Total K-12 Billings n/a (3.0%) 8.5% 8.6% (4.9%) (3.3%)
MHE Adoption Participation % 96% 79% 67% 76% 87% 96%
Twelve Months Ended December 31

Digital vs. Print Billings Detail
McGraw-Hill Education |
($ in Millions)
Q2-2018 Billings Detail by Component
27
YTD June 2018 Billings Detail by Component
Check
% vs % vs % vs
2016 2017 2018 2017 2016 2017 2018 2017 2016 2017 2018 2017
Higher Ed $150 $157 $169 7.4% $86 $70 $53 -24.4% $236 $227 $222 -2.5%
K-12 92 97 67 -31.2% 229 223 144 -39.8% 321 320 211 -34.1%
International 14 15 14 -6.1% 93 90 80 -11.8% 108 105 94 -11.0%
Professional 26 27 25 -4.6% 27 24 22 -9.0% 53 51 47 -6.7%
Other - 1 1 35.4% 1 0 - n/m 1 1 1 35.2%
Total MHE $283 $296 $276 -6.9% $436 $408 $299 -26.7% $719 $704 $574 -18.4%
% of Total
Higher Ed 63% 69% 76% 37% 31% 24% 100% 100% 100%
K-12 29% 30% 32% 71% 70% 68% 100% 100% 100%
International 13% 14% 15% 87% 86% 85% 100% 100% 100%
Professional 49% 53% 54% 51% 47% 46% 100% 100% 100%
Total MHE 39% 42% 48% 61% 58% 52% 100% 100% 100%
June YTD Digital Billings June YTD Print Billings June YTD Total Billings
Check
% vs % vs % vs
2016 2017 2018 2017 2016 2017 2018 2017 2016 2017 2018 2017
Higher Ed $69 $67 $65 -3.0% $40 $30 $21 -28.5% $109 $97 $86 -10.8%
K-12 79 87 58 -33.2% 196 197 123 -37.4% 275 284 181 -36.1%
International 7 8 6 -27.8% 58 56 50 -10.7% 65 64 56 -12.9%
Professional 17 18 17 -1.2% 15 12 12 -3.0% 31 30 29 -1.9%
Other - 1 1 38.6% 0 0 - n/m 0 1 1 38.6%
Total MHE $172 $180 $147 -18.4% $309 $294 $206 -30.0% $481 $474 $353 -25.6%
% of Total
Higher Ed 63% 69% 75% 37% 31% 25% 100% 100% 100%
K-12 29% 31% 32% 71% 69% 68% 100% 100% 100%
International 11% 13% 11% 89% 87% 89% 100% 100% 100%
Professional 53% 59% 60% 47% 41% 40% 100% 100% 100%
Total MHE 36% 38% 42% 64% 62% 58% 100% 100% 100%
Q2 Digital Billings Q2 Print Billings Q2 Total Billings
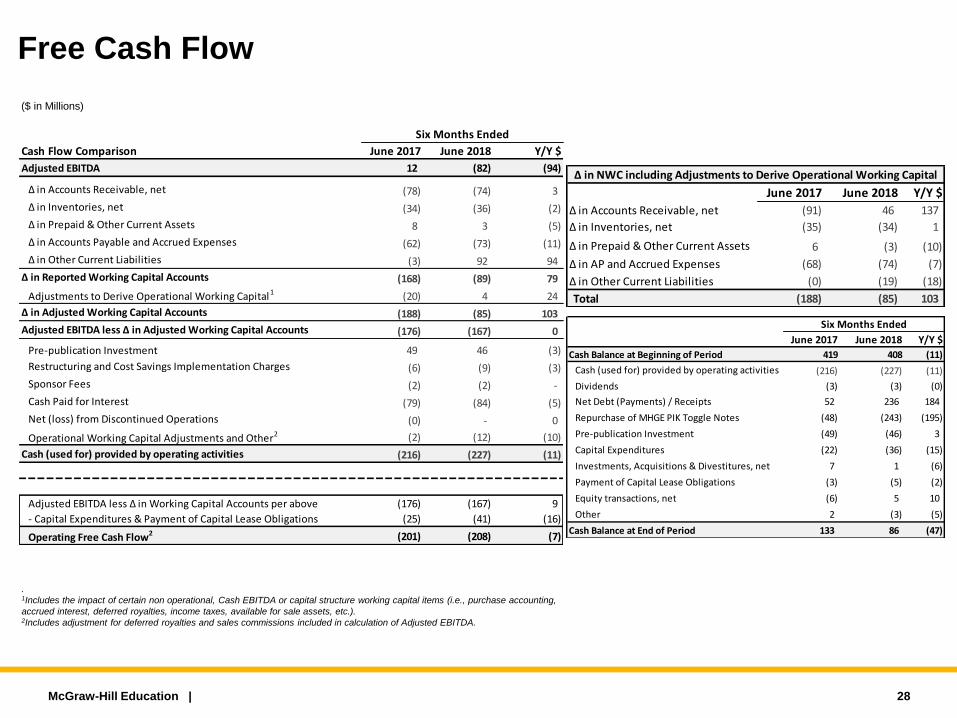
Free Cash Flow
McGraw-Hill Education | 28
($ in Millions)
. 1Includes the impact of certain non operational, Cash EBITDA or capital structure working capital items (i.e., purchase accounting,
accrued interest, deferred royalties, income taxes, available for sale assets, etc.). 2Includes adjustment for deferred royalties and sales commissions included in calculation of Adjusted EBITDA.
Cash Flow Comparison June 2017 June 2018 Y/Y $
Adjusted EBITDA 12 (82) (94)
∆ in Accounts Receivable, net (78) (74) 3
∆ in Inventories, net (34) (36) (2)
∆ in Prepaid & Other Current Assets 8 3 (5)
∆ in Accounts Payable and Accrued Expenses (62) (73) (11)
∆ in Other Current Liabilities (3) 92 94
∆ in Reported Working Capital Accounts (168) (89) 79
Adjustments to Derive Operational Working Capital1 (20) 4 24
∆ in Adjusted Working Capital Accounts (188) (85) 103
Adjusted EBITDA less ∆ in Adjusted Working Capital Accounts (176) (167) 0
Pre-publication Investment 49 46 (3)
Restructuring and Cost Savings Implementation Charges (6) (9) (3)
Sponsor Fees (2) (2) -
Cash Paid for Interest (79) (84) (5)
Net (loss) from Discontinued Operations (0) - 0
Operational Working Capital Adjustments and Other2 (2) (12) (10)
Cash (used for) provided by operating activities (216) (227) (11)
∆ in NWC including Adjustments to Derive Operational Working Capital
Adjusted EBITDA less ∆ in Working Capital Accounts per above (176) (167) 9
- Capital Expenditures & Payment of Capital Lease Obligations (25) (41) (16)
Operating Free Cash Flow2 (201) (208) (7)
Six Months Ended
∆ in NWC including Adjustments to Derive Operational Working Capital
June 2017 June 2018 Y/Y $
∆ in Accounts Receivable, net (91) 46 137
∆ in Inventories, net (35) (34) 1
∆ in Prepaid & Other Current Assets 6 (3) (10)
∆ in AP and Accrued Expenses (68) (74) (7)
∆ in Other Current Liabilities (0) (19) (18)
Total (188) (85) 103
June 2017 June 2018 Y/Y $
Cash Balance at Beginning of Period 419 408 (11)
Cash (used for) provided by operating activities (216) (227) (11)
Dividends (3) (3) (0)
Net Debt (Payments) / Receipts 52 236 184
Repurchase of MHGE PIK Toggle Notes (48) (243) (195)
Pre-publication Investment (49) (46) 3
Capital Expenditures (22) (36) (15)
Investments, Acquisitions & Divestitures, net 7 1 (6)
Payment of Capital Lease Obligations (3) (5) (2)
Equity transactions, net (6) 5 10
Other 2 (3) (5)
Cash Balance at End of Period 133 86 (47)
Six Months Ended

Adjusted EBITDA Reconciliation & Operating Expense Bridge
McGraw-Hill Education |
Adjusted EBITDA Reconciliation
Adjusted Operating Expense Bridge
29
Year Ended LTM
June 2017 June 2018 June 2017 June 2018 December 2017 June 2018
Net Income ($37) ($50) ($161) ($171) ($66) ($76)
Interest (income) expense, net 44 48 87 90 179 182
Provision for (benefit from) taxes on income 6 1 6 1 (7) (13)
Depreciation, amortization and pre-pub. amortization 57 50 107 95 232 221
EBITDA $70 $48 $40 $15 $338 $313
Change in deferred revenue (a) 69 (31) 18 (88) 147 41
Change in deferred royalties (b) (12) 6 (6) 12 (22) (4)
Change in deferred commissions (c) - (1) - 0 - 0
Restructuring and cost saving implementation changes (d) 4 5 6 9 14 17
Sponsor fees (e) 1 1 2 2 4 4
Other (f) (3) 7 2 15 18 31
Pre-pub. investment (g) (24) (24) (49) (46) (99) (96)
Adjusted EBITDA $105 $11 $12 ($82) $400 $306
Three Months Ended Six Months Ended
($ in Millions)
Year Ended LTM
June 2017 June 2018 June 2017 June 2018 December 2017 June 2018
Total Reported Operating Expenses $300 $283 $594 $578 $1,199 $1,184
Less: Depreciation & amortization of intangibles (33) (32) (67) (64) (133) (131)
Less: Amortization of pre-pub. investment (24) (18) (40) (31) (99) (90)
Less: Restructuring and cost savings implementation charges (4) (5) (6) (9) (14) (17)
Less: Other adjustments (11) (8) (17) (16) (35) (34)
Adjusted Operating Expenses $228 $220 $465 $458 $918 $912
Three Months Ended Six Months Ended
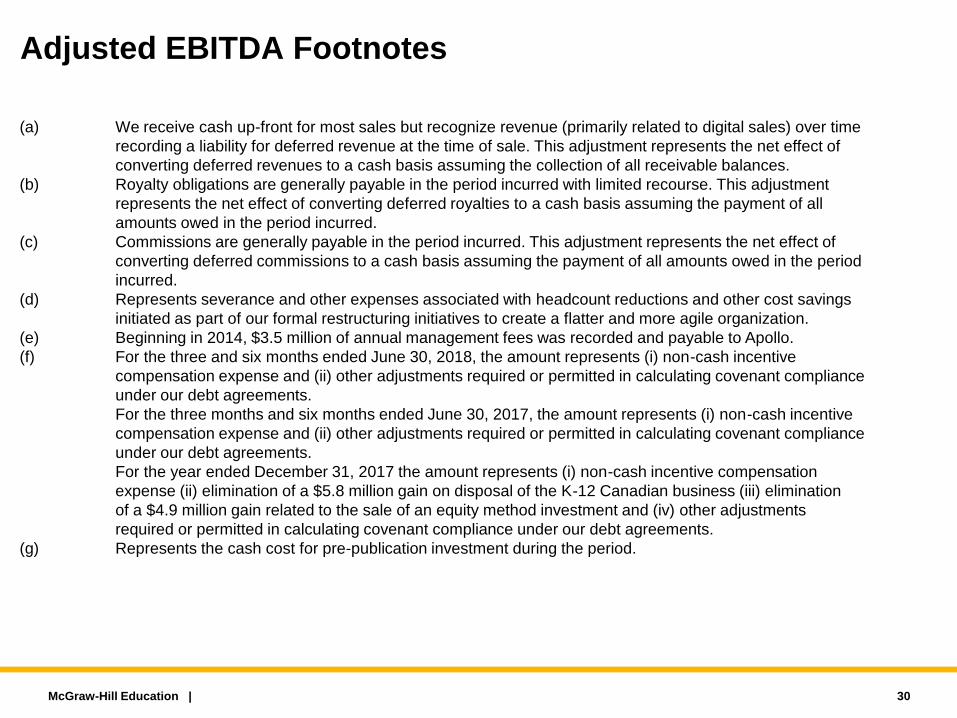
Adjusted EBITDA Footnotes
McGraw-Hill Education |
(a) We receive cash up-front for most sales but recognize revenue (primarily related to digital sales) over time
recording a liability for deferred revenue at the time of sale. This adjustment represents the net effect of
converting deferred revenues to a cash basis assuming the collection of all receivable balances.
(b) Royalty obligations are generally payable in the period incurred with limited recourse. This adjustment
represents the net effect of converting deferred royalties to a cash basis assuming the payment of all
amounts owed in the period incurred.
(c) Commissions are generally payable in the period incurred. This adjustment represents the net effect of
converting deferred commissions to a cash basis assuming the payment of all amounts owed in the period
incurred.
(d) Represents severance and other expenses associated with headcount reductions and other cost savings
initiated as part of our formal restructuring initiatives to create a flatter and more agile organization.
(e) Beginning in 2014, $3.5 million of annual management fees was recorded and payable to Apollo.
(f) For the three and six months ended June 30, 2018, the amount represents (i) non-cash incentive
compensation expense and (ii) other adjustments required or permitted in calculating covenant compliance
under our debt agreements.
For the three months and six months ended June 30, 2017, the amount represents (i) non-cash incentive
compensation expense and (ii) other adjustments required or permitted in calculating covenant compliance
under our debt agreements.
For the year ended December 31, 2017 the amount represents (i) non-cash incentive compensation
expense (ii) elimination of a $5.8 million gain on disposal of the K-12 Canadian business (iii) elimination
of a $4.9 million gain related to the sale of an equity method investment and (iv) other adjustments
required or permitted in calculating covenant compliance under our debt agreements.
(g) Represents the cash cost for pre-publication investment during the period.
30