MH/DD/SAS Community Systems Progress Report...Community Systems Progress Report: Second Quarter SFY...
71
Prepared by: Quality Management Team Community Policy Management Section Division of Mental Health, Developmental Disabilities, and Substance Abuse Services Revised July 19, 2012 MH/DD/SAS MH/DD/SAS Community Systems Community Systems Progress Report Progress Report Second Quarter SFY 2011-2012 October 1 – December 31, 2011 NC DEPARTMENT OF HEALTH AND HUMAN SERVICES
Transcript of MH/DD/SAS Community Systems Progress Report...Community Systems Progress Report: Second Quarter SFY...

Prepared by:
Quality Management Team
Community Policy Management Section
Division of Mental Health, Developmental Disabilities, and Substance Abuse Services
Revised July 19, 2012
MH/DD/SASMH/DD/SAS
Community Systems Community Systems
Progress ReportProgress Report
Second Quarter SFY 2011-2012October 1 – December 31, 2011
NC DEPARTMENT OF HEALTH AND HUMAN SERVICES

“Quality is not an act, it is a habit.” Aristotle

ii
Highlights of Second Quarter SFY 2011-20121
Substance Abuse Prevention and Early Intervention
� Four percent (4%) of youth (ages 6-17) who are “at risk” of developing a substance abuse
disorder completed an evidence-based “selective” or “indicated” substance abuse
prevention program in the past year. This is a new performance measure this quarter. A
performance standard for this measure was not set for SFY 2012. Instead, this year will
be used as a reference period to set a performance benchmark for next fiscal year.
Timely Access to Care
� LMEs reported that 84% of individuals determined to need urgent care were provided a
face-to-face service within 48 hours from the time of the request (an increase from the
prior quarter). This exceeded the SFY 2012 performance standard of 82%.
� Almost three-fourths (72%) of individuals determined to need routine care were provided
a face-to-face service within 14 calendar days of the request (an increase from the prior
quarter). This exceeded the SFY 2012 performance standard of 71%. An additional
4% were scheduled for an appointment but information about whether it was kept was not
available.
Services to Persons in Need (Treated Prevalence)
� The percentages of persons in need of mental health services that were provided publicly-
funded services in their communities exceeded the SFY 2012 performance standard
both for adults (50% served compared to the performance standard of 48%) and for
children (55% served compared to the performance standard of 52%). The percentages
increased for both adults and children compared to the prior quarter.
� The percentages of persons in need of developmental disability services that were
provided publicly-funded services in their communities exceeded the SFY 2012
performance standard for adults (38% served compared to the performance standard of
37%) and fell short for children (19% served compared to the performance standard of
20%). The percentages increased for adults and remained the same for children
compared to the prior quarter.
� The percentages of persons in need of substance abuse services that were provided
publicly-funded services in their communities exceeded the SFY 2012 performance
standard for both adults (12% served compared to the performance standard of 11%)
and for adolescents (10% served compared to the performance standard of 9%). The
percentages increased for adults and remained the same for children compared to the
prior quarter.
1 The Performance Contract between DHHS and the LMEs for SFY2011-2012 became effective on October 1, 2011
at the beginning of the Second Quarter of the state fiscal year. This contract retired three performance indicators
(Timely Emergent Care, Timely Initiation and Engagement in Care for Persons With DD, and Child Services in
Non-Family Settings) and added six performance indicators (SA Prevention and Early Intervention, Timely Support
for Persons with I/DD, Community Hospital Readmissions within 30 Days, Follow-up After Discharge from a
Community Psychiatric Hospital Bed, Follow-up After Discharge from a Community Crisis Service, and Medical
Care Coordination).

iii
Timely Initiation and Engagement in Service
� The percentages for consumers’ initiation and engagement into mental health care
exceeded the SFY 2012 performance standard for both initiation and engagement.
For initiation, 45% of consumers received a 2nd visit within 14 days of the first visit
compared to the performance standard of 42%. For engagement, 29% of consumers
received 2 additional visits within 30 days after meeting the initiation measure compared
to the performance standard of 27%. The percentages for both initiation and engagement
increased from the prior quarter.
� The measures for consumers’ initiation and engagement into substance abuse services
exceeded the SFY 2012 performance standard for both initiation and engagement.
For initiation, two-thirds (65%) of consumers of substance abuse services received 2
visits within the first 14 days of care compared to the performance standard of 63%. For
engagement, almost half (47%) of consumers of substance abuse services received 4
visits within 44 days, compared to the performance standard of 45%. The percentages for
both measures increased from the prior quarter.
Timely Support For Persons With Intellectual/Developmental Disabilities
� The percentage of consumers with I/DD who received a billable service within 30 days of
an initial screening for a new episode of routine care fell short of meeting the SFY2012
performance standard this quarter. Statewide, 36% of consumers received a billable
service within 30 days of screening compared to the performance standard of 40%. This
is a new performance measure this quarter.
Short-Term Care In State Psychiatric Hospitals
� Reduction in use of state psychiatric hospitals for short term care (7 days or less)
exceeded the SFY 2012 performance standard this quarter – 20% of consumers in state
hospitals had stays of 7 days or less compared to the SFY 2012 performance standard of
no more than 30% of consumers. The percentage remained the same as last quarter.
Psychiatric Hospital Readmissions
� The 1 to 30 day readmission rate for State Hospitals this quarter decreased from the prior
quarter. Across the state, 6% of consumers discharged from a state psychiatric hospital
were readmitted within 30 days. This exceeded the SFY 2012 performance standard
of 7% or less.
� The 1 to 180 day readmission rate for State Hospitals this quarter remained the same as
the prior quarter. Across the state, 16% of consumers were readmitted within 180 days,
which exceeded the SFY 2012 performance standard of 17% or less.
� The 1 to 30 day readmission rate for Community Hospitals is a new performance measure
this quarter that applies to Medicaid consumers. Across the state, 12% of Medicaid
consumers discharged from a psychiatric unit of a community hospital were readmitted
within 30 days. A performance standard for this measure was not set for SFY 2012.
Instead this year will be used as a reference period to set a performance benchmark for
next fiscal year.

iv
Timely Follow-Up After Inpatient and Crisis Services
� The percent of consumers discharged from ADATCs seen within 7 days fell short of the
SFY 2012 performance standard this quarter. Statewide, 36% of consumers discharged
from an ADATC were seen within 7 days compared to the performance standard of 40%
or more. This was a decrease from the prior quarter.
� The percent of consumers discharged from a state psychiatric hospital seen within 7 days
exceeded the SFY 2012 performance standard this quarter. Statewide, 53% of
consumers discharged from a state psychiatric hospital were seen within 7 days compared
to the performance standard of 51% or more. This was an increase from the prior quarter.
� The percent of consumers discharged from a psychiatric unit of a community hospital
seen within 7 days met the SFY 2012 performance standard this quarter. Statewide,
40% of consumers discharged from a community hospital were seen within 7 days
compared to the performance standard of 40% or more. This is a new performance
measure this quarter.
� The percent of consumers discharged from a crisis service seen within 5 days fell short of
the SFY 2012 performance standard this quarter. Statewide, 39% of consumers
discharged from facility based crisis or a non-hospital medical detoxification facility
were seen within 7 days compared to the performance standard of 43% or more. This is a
new performance measure this quarter.
Medical Care Coordination
� Statewide, 91% of Medicaid consumers who received a behavioral health service over the
past year also received a primary care or preventive health visit within the past year
(within the past two years for persons ages 7-19). This is a new performance measure
this quarter. A performance standard for this measure was not set for SFY 2012. Instead
this year will be used as a reference period to set a performance benchmark for next fiscal
year.

v
Table of Contents
Highlights of Second Quarter SFY 2011-2012 ............................................................................. ii
Introduction .................................................................................................................................... 1
The Indicators ................................................................................................................................ 2
Indicator 1: Substance Abuse Prevention and Early Intervention ......................................... 2
Indicator 2: Timely Access to Care........................................................................................... 2
Indicator 3: Treated Prevalence ............................................................................................... 3
Indicator 4: Timely Initiation and Engagement in Service ..................................................... 3
Indicator 5: Timely Support for Persons with Intellectual/Developmental Disabilities ........ 4
Indicator 6: Short-Term Care in State Psychiatric Hospitals ................................................. 4
Indicator 7: Psychiatric Hospital Readmissions ...................................................................... 5
Indicator 8: Timely Follow-Up After Inpatient and Crisis Care ............................................. 5
Indicator 9: Medical Care Coordination .................................................................................. 6
How to Read This Report ............................................................................................................... 7
Performance By Geographic Area ............................................................................................... 8
Statewide ....................................................................................................................................8
Alamance-Caswell ....................................................................................................................10
Beacon Center ......................................................................................................................... 12
CenterPoint Human Services ................................................................................................ 14
Crossroads Behavioral Healthcare ........................................................................................ 16
Cumberland ............................................................................................................................. 18
Durham Center ........................................................................................................................ 20
East Carolina Behavioral Health ........................................................................................... 22
Eastpointe ................................................................................................................................ 28
Five County ............................................................................................................................. 30
Guilford Center ....................................................................................................................... 32
Johnston .................................................................................................................................. 34
Mecklenburg ............................................................................................................................ 36
Mental Health Partners .......................................................................................................... 38
Onslow-Carteret Behavioral Healthcare Services ................................................................ 40
Orange-Person-Chatham ........................................................................................................ 42
Pathways .................................................................................................................................. 44
PBH ........................................................................................................................................ 46
Sandhills Center ...................................................................................................................... 48
Smoky Mountain Center ......................................................................................................... 52
Southeastern Center ................................................................................................................ 56
Southeastern Regional ........................................................................................................... 58
Wake County Human Services .............................................................................................. 60
Western Highlands Network ................................................................................................... 62

Community Systems Progress Report: Second Quarter SFY 2011-2012
1
Introduction The NC Division of Mental Health, Developmental Disabilities, and Substance Abuse Services
(DMH/DD/SAS) has been tracking the effectiveness of community systems through statewide
performance indicators since 2006.2 These indicators provide a means for the NC public and
General Assembly to monitor how the public service system is performing its responsibilities.
Regular reporting of community progress also assists local and state managers in identifying
areas of success and areas in need of attention. Problems caught early can be addressed more
effectively. Success in a particular component of the service system by one community can be
used as a model to guide development in other communities.
These performance indicators describe an observed level of activity (percent of persons that
complete an evidence-based prevention program or that receive a timely follow-up service), but
not why the level is as it is. Results do not reveal the substantial “behind-the-scene” activities,
processes and interactions involving service providers, LME and state staff, consumers, and
family members, and cannot reveal which factors account for differences in measured levels of
quality. Identifying and understanding these factors require additional investigation and may
serve as the starting point for program management initiatives or quality improvement efforts.
The indicators in this report were chosen to reflect:
• accepted standards of care,
• fair and reliable measures, and
• readily available data sources.
The following pages provide an overview of the indicators, a guide to reading the report, and a
summary of performance for each LME and the state as a whole for the most recent period for
which data is available.
Appendices for MH/DD/SAS Community Systems Progress Report, a separate document,
contains details on the indicators for the most recent period by LME and for some of the
indicators by county, where appropriate. The Appendices provide information on data sources
and time periods for each indicator, population data for each county, an explanation of how the
indicators are calculated, and if applicable a summary of revisions that were made to this report.
Critical Measures at a Glance, also a separate document, is a one-page reference table showing
each LME’s performance for the current quarter against statewide averages and contractual
requirements (“standards”).
This report, the appendices, and the critical measures document, are available on the Division
website:
http://www.ncdhhs.gov/mhddsas/statspublications/Reports/DivisionInitiativeReports/communitys
ystems/index.htm
2 This report fulfills the requirements of S.L. 2006-142 (HB 2077) that directs the Department of Health and Human Services to
develop critical indicators of LME performance. Measures reflect the goals of the Division’s Strategic Plan 2010-2013, the
President’s New Freedom Initiative, CMS’ Quality Framework for Home and Community Based Services, and SAMHSA’s
Federal Action Agenda and National Outcome Measures.

Community Systems Progress Report: Second Quarter SFY 2011-2012
2
The Indicators The performance indicators are divided into nine categories that cover processes, outputs and
outcomes of providing community services. They are intended to show how well people are
getting into care and continuing care in their chosen communities. The descriptions below
provide the reasoning behind selection of these indicators and the Division’s statewide
performance standard for each indicator. Unless otherwise stated, a standard for expected
performance is assigned to each measure based on the statewide average for the second quarter
of the prior fiscal year.
Indicator 1: Substance Abuse Prevention and Early Intervention
Rationale: Persons at risk for substance abuse disorders who receive early education and
intervention services are more likely to avoid debilitating impairments from these problems.
This indicator, based on data submitted by service providers, measures the percentage of youth
(ages 6-17) that are “at risk” for developing a substance abuse disorder who completed an
approved evidence-based “selective” or “indicated” substance abuse prevention program during
the year.
Selective prevention programs target individuals whose risk of developing a substance abuse
disorder is significantly higher than average (based on biological, psychological, or social risk
factors). Indicated prevention programs target high-risk individuals who are identified as
having minimal but detectable signs or symptoms foreshadowing a substance abuse disorder.
1.1 Selective and Indicated Substance Abuse Prevention Services: Performance Standard: A
performance standard has not been established for this state fiscal year. Results for this
measure this year will be used to establish a performance standard the following year.
Indicator 2: Timely Access to Care
Rationale: Timely access to appropriate care is critical to protect consumer health and safety,
minimize adverse consumer outcomes and promote consumer engagement in services. The
timely access measures are based on Healthcare Enterprise Data Information System (HEDIS ©)
measures, supported by the federal Centers for Medicare and Medicaid Services (CMS).
This indicator, based on reports submitted by LMEs, has two components that look at timely
access to care for persons requesting services through the LMEs’ Screening, Triage, and Referral
(STR) system, based on urgency of need:
2.1 Timely Urgent Care - Appointments Kept: Performance Standard: 82% or more of
persons in need of urgent care receive services through our community service system
within 48 hours of the request.
2.2 Timely Routine Care - Appointments Kept: Performance Standard: 71% or more of
persons in need of routine care receive services through our community service system
within 14 calendar days of the request.

Community Systems Progress Report: Second Quarter SFY 2011-2012
3
Indicator 3: Treated Prevalence
Rationale: NC has designed its public system to serve those persons who have the highest need
for specialized mh/dd/sa services and limited access to privately-funded services (commensurate
with available resources). Increasing delivery of services to these persons is a nationally
accepted measure of system performance.
This indicator is measured by comparing the number of persons who received treatment for a
particular condition (age-disability group) during a year with prevalence, the number of persons
estimated to have that condition in a given year, to get treated prevalence, or percent of the
population in need who receive services through our community service system for that
condition within a year. This indicator looks at treated prevalence for six age-disability groups.
The percentages represent the percent of all persons estimated to be in need of services that were
provided publicly funded services that were paid for by Medicaid or state-funds through the
Integrated Payment Reporting System (IPRS).
3.1 Adult Mental Health (AMH) Services: Performance Standard = 48% or more
3.2 Child/Adolescent Mental Health (CMH) Services: Performance Standard = 52% or more
3.3 Adult Developmental Disability (ADD) Services: Performance Standard = 37% or more
3.4 Child/Adolescent Developmental Disability (CDD) Services: Performance Standard =
20% or more
3.5 Adult Substance Abuse (ASA) Services: Performance Standard = 11% or more
3.6 Adolescent Substance Abuse (CSA) Services: Performance Standard = 9% or more
Indicator 4: Timely Initiation and Engagement in Service
Rationale: For persons with mental illness and addictive diseases to recover control over their
lives and maintain stability, they need to fully initiate and become engaged in treatment services
and supports. Initiation and engagement are nationally accepted measures of access. The
initiation and engagement measures were originally developed by the Washington Circle, an
organization supported by the federal Center for Substance Abuse Treatment, and then adapted
for use as Healthcare Enterprise Data Information System (HEDIS ©) measures.
Initiation is measured as the percent of persons starting a new episode of care (defined as having
no prior Medicaid or state-funded mh/dd/sa service for at least 60 days) who receive a 2nd
service
within 14 days of their first service. Engagement is measured as the percent of persons who
after meeting the initiation criteria receive an additional 2 visits within the next 30 days (a total
of 4 visits within the first 44 days of service). This indicator looks at initiation and engagement
for four disability groups.
4.1 Initiation of Mental Health Consumers: Performance Standard = 42% or more
4.2 Engagement of Mental Health Consumers: Performance Standard = 27% or more
4.3 Initiation of Substance Abuse Consumers: Performance Standard = 63% or more
4.4 Engagement of Substance Abuse Consumers: Performance Standard = 45% or more
4.5 Initiation of Consumers with Co-Occurring Mental Health/ Developmental Disabilities: No performance standard has been established.

Community Systems Progress Report: Second Quarter SFY 2011-2012
4
4.6 Engagement of Consumers with Co-Occurring Mental Health/Developmental Disabilities: No performance standard has been established.
4.7 Initiation of Consumers with a Co-Occurring Mental Health/Substance Abuse Disorder: No performance standard has been established.
4.8 Engagement of Consumers with a Co-Occurring Mental Health/Substance Abuse Disorder: No performance standard has been established.
Indicator 5: Timely Support for Persons with Intellectual or Developmental Disabilities
Rationale: Timely assessment of need and connection to adequate supports is critical to protect
consumer health and safety, minimize adverse consumer events, and promote positive consumer
outcomes.
This indicator is measured as the percent of new consumers with intellectual or developmental
disabilities (defined as having no prior Medicaid or state-funded service for at least 60 days),
who were triaged as having “routine” care needs, who receive a billable service within 30 days
of the initial screening.
5.1 Timely Support for Persons with I/DD: Performance Standard = 40% or more
Indicator 6: Short-Term Care in State Psychiatric Hospitals
Rationale: Serving individuals in crisis in the least restrictive setting as appropriate and as close
to home as possible helps families stay in touch and participate in the individual’s recovery.
State psychiatric hospitals provide a safety net for the community service system. An adequate
community system should provide short-term inpatient care in a local hospital in the community.
This reserves high-cost state facility beds for consumers with more intensive, long-term care
needs.
Reducing the short-term use of state psychiatric hospitals allows persons to receive acute
services closer to home and provides more effective and efficient use of funds for community
services. This is a Mental Health Block Grant measure required by the Center for Mental Health
Services (CMHS).
This indicator is measured as the percent of persons discharged from state psychiatric hospitals
each quarter, that fall within the responsibility of an LME to coordinate services3, who have a
length of stay of 7 days or less.
6.1 Short Term Care in State Psychiatric Hospitals: Performance Standard = 30% or less
3 Discharge data has been modified to include only discharges coded as "direct" discharges or “program completion” to sources
that fall within the responsibility of an LME to coordinate services (e.g. to other outpatient and residential non state facility,
self/no referral, unknown, community agency, private physician, other health care, family friends, nonresidential treatment/
habilitation program, other). Discharges for other reasons (e.g. transfers to other facilities, deaths, discharges to medical visits,
etc.); to other referral sources (e.g. court, correctional facilities, nursing homes, state facilities, VA); and out-of-state are not
included in the numerator and denominator.
Community Systems Progress Report: Second Quarter SFY 2011-2012
5
Indicator 7: Psychiatric Hospital Readmissions
Rationale: Successful community living following hospitalization, without repeated admissions
to inpatient care, requires effective treatment planning, coordination, and ongoing appropriate
levels of community care. A low psychiatric hospital readmission rate is a nationally accepted
standard of care that indicates how well a community is assisting individuals at risk for repeated
hospitalizations. This is a Mental Health Block Grant measure required by the Center for Mental
Health Services (CMHS).
The first two indicators measure the percent of persons discharged from a state psychiatric
hospital each quarter, that fall within the responsibility of an LME to coordinate services3, who
are readmitted to any state psychiatric hospital within 30 and 180 days following discharge.
7.1 State Psychiatric Hospital Readmissions within 30 Days: Performance Standard = 7% or
less
7.2 State Psychiatric Hospital Readmissions within 180 Days: Performance Standard = 17%
or less
The third indicator measures the percent of persons, whose inpatient care was paid by Medicaid,
discharged each quarter from a community hospital psychiatric bed, who are readmitted to any
community hospital psychiatric bed within 30 days following discharge.
7.3 Community Hospital Readmissions within 30 Days: A performance standard has not been
established for this state fiscal year. Results for this measure this year will be used to
establish a performance standard the following year.
Indicator 8: Timely Follow-Up After Inpatient and Crisis Care
Rationale: Timely follow-up care after discharge from an inpatient facility or a crisis service is
critical to promoting recovery and successful living in one’s community, minimizing adverse
outcomes, and preventing unnecessary re-hospitalization and reuse of crisis services. Receiving
a community-based service within 7 days of discharge is a nationally accepted standard of care
that also indicates the local system’s community service capacity and extent of coordination
across levels of care.
The first two indicators measure the percent of persons discharged from state-operated alcohol
and drug abuse treatment centers (ADATCs) and state psychiatric hospitals each quarter, that fall
within the responsibility of an LME to coordinate services3, who receive follow-up care in the
community, paid by Medicaid or state-funds through the Integrated Payment Reporting System
(IPRS), within 7 days of discharge.
8.1 Follow-up After Discharge from a State ADATC: Performance Standard = 40% or more
8.2 Follow-up After Discharge from a State Psychiatric Hospital: Performance Standard =
51% or more
The third indicator measures the percent of persons discharged from a community hospital
psychiatric bed each quarter who receive follow-up care in the community, paid by Medicaid or
state-funds through the Integrated Payment Reporting System (IPRS), within 7 days of
discharge.

Community Systems Progress Report: Second Quarter SFY 2011-2012
6
8.3 Follow-up After Discharge from a Community Hospital Psychiatric Bed: Performance
Standard = 40% or more
The fourth indicator measures the percent of persons discharged from a community crisis service
(facility based crisis or non-hospital medical detoxification) each quarter who receive follow-up
care in the community, paid by Medicaid or state-funds through the Integrated Payment
Reporting System (IPRS), within 5 days of discharge.
8.4 Follow-up After Discharge from a Community Crisis Service: Performance Standard =
43% or more
Indicator 9: Medical Care Coordination
Rationale: Designing programs to integrate the delivery and management of behavioral health
and physical health services provides a critical opportunity to achieve better health outcomes as
well as control spending. This measure was adapted from two Healthcare Enterprise Data
Information System (HEDIS ©) measures -- Adults’ Access to Preventive/Ambulatory Health
Services and Children and Adolescents’ Access to Primary Care Practitioners.
This indicator measures the percentage of continuously enrolled Medicaid recipients who
received a behavioral health service during a rolling one-year period that also had at least one
primary care or preventive health visit during that period. For persons ages 7-19, the measure
looks for a primary care or preventive health service over the last two years.
9.1 Integration with Primary Care/Preventive Health Services (all ages): A performance
standard has not been established for this state fiscal year. Results for this measure this
year will be used to establish a performance standard the following year.

Community Systems Progress Report: Second Quarter SFY 2011-2012
7
How to Read This Report This report is organized to provide information by geographic area (statewide and LME
catchment area), showing all indicators for each geographic area in one place to create a snapshot
of the geographic area. The benefits of organizing the indicators using this approach include:
� The performance indicators in this report are inter-related. State and local efforts to
improve performance in one domain can affect performance in others. For example, an
increase in the number of persons that receive services (Indicator 3) can impact how
quickly consumers can get appointments for initial service (Indicator 2), continued
service (Indicator 4), or follow-up services after discharge from inpatient and crisis care
(Indicator 8). Looking at performance across indicators encourages holistic thinking
about these interrelationships and it facilitates the identification of both strengths and
areas that are in need of improvement.
� The geographic sections of this report facilitate analysis and sharing of the
information. Organizing all performance indicators for each geographic area into a
separate section of the report makes it easier for stakeholder groups to stay informed
about how their geographic area is doing and to share information. Whether it be Area
Boards, local Consumer and Family Advisory Committees, state legislators, service
providers, or the general public, informed stakeholders are more likely to understand the
strengths and challenges of the service system and to support improvement efforts. It
also makes it easier for stakeholders to identify other similar geographic areas to compare
data, to seek help, and to collaborate to improve the service system.
� The geographic sections of this report facilitate the inclusion of trend data. Seeing
performance across time enables comparison to past performance and supports evaluation
of improvement efforts.
The geographic section of the report includes:
� A short description and a map of the state highlighting the geographic area.
� Pie charts showing the number and percent of persons who received a federal- or state-
funded service by age and disability group for the most recent 12 month period for which
data is available.
� Line graphs showing trends in performance over the past two years for selected
indicators. Each graph shows the geographic area’s performance (solid line) along with
the state average (dashed lines) and the performance range across LMEs (dotted lines).
o Reports for the 1st and 3
rd quarters feature the initiation of services for persons
with MH, DD, and SA (Indicator 4 and 5).
o Reports for the 2nd
and 4th
quarters feature the use of state psychiatric hospitals for
short-term care (Indicator 6) and timely follow-up care after discharge from a
state facility (Indicator 8).
� A table showing performance levels for each indicator along with the statewide average
and range of performance for all LMEs. LME tables include results (for relevant
indicators) for each county in the LME’s catchment area.

NC Division of Mental Health, Developmental Disabilities, and Substance Abuse ServicesAppendices for Community Systems Progress Report: Second Quarter SFY 2011 - 2012
STATEWIDE
Persons Served By Age and Disability During October 2010 - September 2011(Based On Medicaid and State-Funded IPRS Claims Paid Through January 2012)
The above pie charts show the number and percentage of persons served during the most recent 12 month period for which claims data is available. It only includes persons whose services were paid by Medicaid and State-Funds through the Integrated Payment Reporting System.
Reduction of Short-Term State Psychiatric Hospital Use
SFY2012 Performance Standard = 30% or less
Timely Follow-Up After Discharge From A State Facility
SFY2012 Performance Standard = 51% or more SFY2012 Performance Standard = 40% or more
MH103,149
86%
SA959 1%
DD4,520 4%
Dual MH/SA3,358 3%
Dual MH/DD7,350 6%
Dual DD/SA11 0%
MH/DD/SA76 0%
Youth (Under Age 18): 119,423
MH145,400
62%
SA25,577 11%
DD9,055 4%
Dual MH/SA42,312 18% Dual MH/DD
12,820 5%
Dual DD/SA83 0%
MH/DD/SA775 0%
Adults (Age 18 and Over): 236,022
Rationale: An adequate community service system should provide short-term inpatientcare in a local hospital in the community. This helps families stay involved and reserveshigh-cost state facility beds for consumers with long-term care needs. Reducing the useof state psychiatric hospitals for short-term care allows more effective and efficient useof funds for community services. The goal is to decrease the percentage.
38% 35% 34% 32% 30% 25% 22% 20% 20%
0%
20%
40%
60%
80%
100%
Q2 Q3 Q4 Q1 Q2 Q3 Q4 Q1 Q2
SFY10 SFY11 SFY12
Pct of Discharges: Length of Stay 7 Days or Less
Highest LME State Average Lowest LME
49% 45%53% 52% 51% 53% 50% 52% 53%
0%
20%
40%
60%
80%
100%
Q2 Q3 Q4 Q1 Q2 Q3 Q4 Q1 Q2
SFY10 SFY11 SFY12
Pct
of
Per
son
s S
een
W
ith
in 7
Day
s
Timely Follow-Up: Psych Hospitals
Highest LME State Average Lowest LME
34% 34%44% 40% 40% 41% 41% 39% 36%
0%
20%
40%
60%
80%
100%
Q2 Q3 Q4 Q1 Q2 Q3 Q4 Q1 Q2
SFY10 SFY11 SFY12
Pct
of
Per
son
s S
een
Wit
hin
7 D
ays
Timely Follow-Up: ADATCs
Highest LME State Average Lowest LME
Rationale: Living successfully in one's community after discharge from a state-operated facility depends on smooth and timely transition to community services and supports.Receiving a community-based service within 7 days of discharge is a nationally accepted standard of care that also indicates the local system's community service capacity andcoordination across levels of care. The goal is to increase the percentage. The percentages only include follow-up services paid by Medicaid and state-funds (IPRS).
North Carolina has 100 counties and approximately 9.7 million residents. Three-fourths (73) ofthose counties are rural, with fewer than 200 persons per square mile. One-sixth (16.6%) of thestate's population (38% of youth and 10% of adults) is enrolled in Medicaid. The state's mentalhealth, developmental disabilities, and substance abuse (MH/DD/SA) service system is organizedinto 23 Local Management Entities (LMEs) across three regions.
Reduction of Short-Term State Psychiatric Hospital Use:
The percentage of persons discharged from state hospitals with stays of7 days or less has steadily decreased over the past 9 quarters. This is apositive trend that indicates a reduced use of state psychiatric hospitals forshort-term care.
Timely Follow-Up After Discharge From A State Facility:
Overall, the percentage of persons discharged from state hospitals thathave received follow-up care within 7 days of discharge has increased(improved) over the past 9 quarters.
The percentage of persons discharged from ADATCs that have receivedfollow-up care within 7 days of discharge has decreased over the past 7quarters.
A higher percentage of persons have received timely follow-up carefollowing discharge from state hospitals than from the ADATCs.
Anson
Ashe
Avery
Beaufort
Bertie
Bladen
Brunswick
Burke
Cabarrus
Caldwell
Carteret
CatawbaChatham
Cherokee
Clay
Cleveland
Columbus
Craven
Currituck
Forsyth
Gates
Graham
Granville
Guilford
Halifax
HarnettHenderson
Hertford
Hoke
Jackson
Jones
LeeLincoln
Macon
Madison
Montgomery
Moore
Nash
Northampton
Onslow
Pamlico
Pender
Pitt
Polk
Randolph
Robeson
Rockingham
Rowan
Rutherford
StokesSurry
Swain
Union
Vance
Wake
Warren
Watauga Wilkes
Wilson
Yadkin
Yancey
Mecklenburg
Orange
Transylvania
Person
Western Region Central Region Eastern Region
Cumberland
Scotland
Haywood
NewHanover
Durham
Alleghany
Alamance
Iredell
Johnston
Duplin
Sampson
Wayne Lenoir
Dare
Hyde
Martin TyrrellWashington
Camden
Perquimans
Pasquotank
Greene
Alexander
Mitchell
McDowell
Davie
Gaston
Buncombe
Caswell
Davidson
Stanly
Richmond
FranklinChowan
Edgecombe
8

NC Division of Mental Health, Developmental Disabilities, and Substance Abuse ServicesAppendices for Community Systems Progress Report: Second Quarter SFY 2011 - 2012
STATEWIDESo… How Did We Do This Quarter?
Range Among LMEs
Performance Standard
LowestLME
StateAverage
HighestLME
1. SA Prevention and Early Intervention
Persons in Need Completing Selective and Indicated Programs ↑ NA 0% 4% 21%
2. Timely Access to Care
Urgent ↑ 82% 48% 84% 100%
Routine ↑ 71% 37% 72% 98%
3. Services to Persons in Need
Adult Mental Health ↑ 48% 31% 50% 74%
Child/Adolescent Mental Health ↑ 52% 34% 55% 80%
Adult Developmental Disabilities ↑ 37% 26% 38% 56%
Child/Adolescent Developmental Disabilities ↑ 20% 12% 19% 33%
Adult Substance Abuse ↑ 11% 6% 12% 16%
Adolescent Substance Abuse ↑ 9% 5% 10% 17%
4. Timely Initiation & Engagement in Service
Mental Health: 2 Visits within 14 Days ↑ 42% 33% 45% 72%
Mental Health: 2 Add'l Visits within Next 30 Days ↑ 27% 17% 29% 41%
Substance Abuse: 2 Visits within 14 Days ↑ 63% 44% 65% 88%
Substance Abuse: 2 Add'l Visits within Next 30 Days ↑ 45% 32% 47% 61%
Mental Health/Developmental Disabilities: 2 Visits within 14 Days ↑ NA 28% 48% 71%
Mental Health/Developmental Disabilities: 2 Add'l Visits within Next 30 Days ↑ NA 8% 36% 54%
Mental Health/Substance Abuse: 2 Visits within 14 Days ↑ NA 42% 63% 91%
Mental Health/Substance Abuse: 2 Add'l Visits within Next 30 Days ↑ NA 29% 47% 62%
5. Timely Support For Persons With I/DD
First Service within 30 Days of Screening/Triage/Referral ↑ 40% 0% 36% 100%
6. Short-Term Care In State Psychiatric Hospitals
1-7 Days of Care ↓ 30% 0% 20% 38%
7. Psychiatric Hospital Readmissions
State Hospitals: Readmitted within 30 Days ↓ 7% 0% 6% 19%
State Hospitals: Readmitted within 180 Days ↓ 17% 3% 16% 31%
Community Hospitals: Readmitted within 30 Days ↓ NA 6% 12% 19%
8. Timely Follow-up After Psychiatric Inpatient and Crisis Care
ADATCs: Seen in 1-7 Days ↑ 40% 15% 36% 83%
State Hospitals: Seen in 1-7 Days ↑ 51% 17% 53% 90%
Community Hospitals: Seen in 1-7 Days ↑ 40% 31% 40% 51%
Crisis Services: Seen in 0-5 Days ↑ 43% 12% 39% 62%
9. Medical Care Coordination
Received a Primary Care/Preventive Health Visit ↑ NA 87% 91% 94%
* ↑ Goal is to increase the percentage ↓ Goal is to decrease the percentage
Progress Indicator
Goa
l*
Meets or exceeds the Standard Standard not established
9

NC Division of Mental Health, Developmental Disabilities, and Substance Abuse ServicesAppendices for Community Systems Progress Report: Second Quarter SFY 2011 - 2012
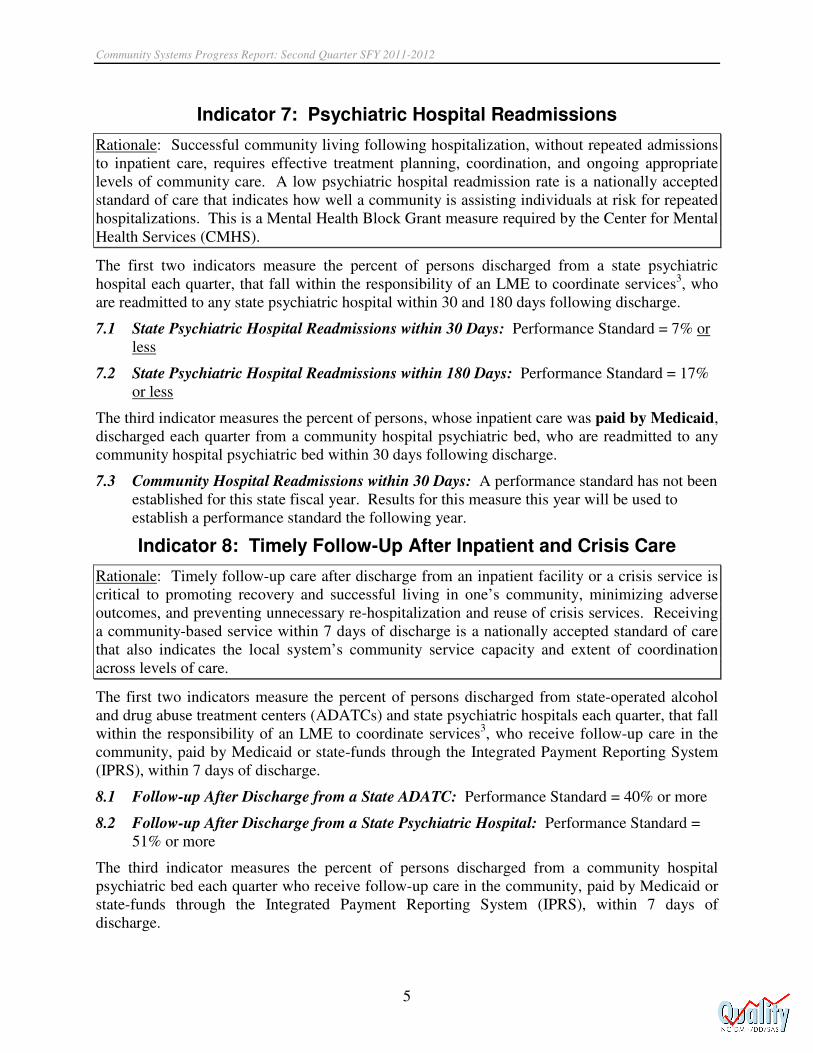
ALAMANCE-CASWELL
Persons Served By Age and Disability During October 2010 - September 2011(Based On Medicaid and State-Funded IPRS Claims Paid Through January 2012)
The above pie charts show the number and percentage of persons served during the most recent 12 month period for which claims data is available. It only includes persons whose services were paid by Medicaid and State-Funds through the Integrated Payment Reporting System.
Reduction of Short-Term State Psychiatric Hospital Use
Timely Follow-Up After Discharge From A State Facility
MH1,733 89%
SA13 1%
DD67 3%
Dual MH/SA49 2%
Dual MH/DD96 5%
MH/DD/SA0
0%
Youth (Under Age 18): 1,958
MH3,118 64%
SA374 8%
DD183 4%
Dual MH/SA929 19%
Dual MH/DD239 5%
Dual DD/SA1
0%
MH/DD/SA16 0%
Adults (Age 18 and Over): 4,860
Rationale: An adequate community service system should provide short-term inpatientcare in a local hospital in the community. This helps families stay involved and reserveshigh-cost state facility beds for consumers with long-term care needs. Reducing the useof state psychiatric hospitals for short-term care allows more effective and efficient useof funds for community services. The goal is to decrease the percentage.
36% 36% 34%29% 24% 26%
13%0% 5%
0%
20%
40%
60%
80%
100%
Q2 Q3 Q4 Q1 Q2 Q3 Q4 Q1 Q2
SFY10 SFY11 SFY12
Pct of Discharges: Length of Stay 7 Days or Less
LME Highest LME State Average Lowest LME
57% 52%43%
73% 78%69%
62%56%
38%
0%
20%
40%
60%
80%
100%
Q2 Q3 Q4 Q1 Q2 Q3 Q4 Q1 Q2
SFY10 SFY11 SFY12
Pct
of
Per
son
s S
een
W
ith
in 7
Day
s
Timely Follow-Up: Psych Hospitals
LME Highest LME State Average Lowest LME
45%
68% 71% 75%
40% 45%
65%57%
45%
0%
20%
40%
60%
80%
100%
Q2 Q3 Q4 Q1 Q2 Q3 Q4 Q1 Q2
SFY10 SFY11 SFY12
Pct
of
Per
son
s S
een
Wit
hin
7 D
ays
Timely Follow-Up: ADATCs
LME Highest LME State Average Lowest LME
Rationale: Living successfully in one's community after discharge from a state-operated facility depends on smooth and timely transition to community services and supports.Receiving a community-based service within 7 days of discharge is a nationally accepted standard of care that also indicates the local system's community service capacity andcoordination across levels of care. The goal is to increase the percentage. The percentages only include follow-up services paid by Medicaid and state-funds (IPRS).
Alamance-Caswell LME serves two counties in central North Carolina. Only Alamance isconsidered urban. Of the 178,000 residents living in this area, 17% are enrolled in Medicaid.
Western Region Central Region Eastern Region
Reduction of Short-Term State Psychiatric Hospital Use:
The percentage of persons discharged from state hospitals with stays of7 days or less has steadily decreased over the last 9 quarters from thestate average to below the state average (a lower percentage is better forthis indicator).
Timely Follow-Up After Discharge From A State Facility:
The percentage of persons discharged from state hospitals that havereceived follow-up care within 7 days of discharge has cycled up and downover the last 9 quarters. Overall it has shown a continuous decrease overthe past 4 quarters and is currently below the state avereage (a higherpercentage is better for this measure).
Overall, the percentage of persons discharged from state ADATCs thathave received follow-up care within 7 days of discharge has cycled up anddown over the past 9 quarters. It is currently above the state average (ahigher percentage is better for this measure).
10
NC Division of Mental Health, Developmental Disabilities, and Substance Abuse ServicesAppendices for Community Systems Progress Report: Second Quarter SFY 2011 - 2012
ALAMANCE-CASWELLSo… How Did We Do This Quarter?
Range Among LMEs County
LowestLME
State Average
HighestLME
Alamance Caswell
1. SA Prevention and Early Intervention
Persons in Need Completing Selective and Indicated Programs ↑ 0% 4% 21% 0% <-Data for this indicator is not available at the county level->
2. Timely Access to Care
Urgent ↑ 48% 84% 100% 59% <-Data for this indicator is not available at the county level->
Routine ↑ 37% 72% 98% 68% <-Data for this indicator is not available at the county level->
3. Services to Persons in Need
Adult Mental Health ↑ 31% 50% 74% 58% 59% 53%
Child/Adolescent Mental Health ↑ 34% 55% 80% 51% 51% 48%
Adult Developmental Disabilities ↑ 26% 38% 56% 39% 38% 43%
Child/Adolescent Developmental Disabilities ↑ 12% 19% 33% 15% 15% 15%
Adult Substance Abuse ↑ 6% 12% 16% 12% 12% 9%
Adolescent Substance Abuse ↑ 5% 10% 17% 8% 7% 10%
4. Timely Initiation & Engagement in Service
Mental Health: 2 Visits within 14 Days ↑ 33% 45% 72% 34% 35% 23%
Mental Health: 2 Add'l Visits within Next 30 Days ↑ 17% 29% 41% 17% 18% 11%
Substance Abuse: 2 Visits within 14 Days ↑ 44% 65% 88% 80% 80% 80%
Substance Abuse: 2 Add'l Visits within Next 30 Days ↑ 32% 47% 61% 45% 44% 60%
Mental Health/Developmental Disabilities: 2 Visits within 14 Days ↑ 28% 48% 71% 37% 33% 50%
Mental Health/Developmental Disabilities: 2 Add'l Visits within Next 30 Days ↑ 8% 36% 54% 19% 19% 17%
Mental Health/Substance Abuse: 2 Visits within 14 Days ↑ 42% 63% 91% 64% 61% 100%
Mental Health/Substance Abuse: 2 Add'l Visits within Next 30 Days ↑ 29% 47% 62% 46% 42% 82%
5. Timely Support For Persons With I/DD
First Service within 30 Days of Screening/Triage/Referral ↑ 0% 36% 100% 0% 0% 0%
6. Short-Term Care in State Psychiatric Hospitals
1-7 Days of Care ↓ 0% 20% 38% 5% <-Data for this indicator is not available at the county level->
7. Psychiatric Hospital Readmissions
State Hospitals: Readmitted within 30 Days ↓ 0% 6% 19% 15% <-Data for this indicator is not available at the county level->
State Hospitals: Readmitted within 180 Days ↓ 3% 16% 31% 23% <-Data for this indicator is not available at the county level->
Community Hospitals: Readmitted within 30 Days ↓ 6% 12% 19% 8% 8% 0%
8. Timely Follow-up After Psychiatric Inpatient and Crisis Care
ADATCs: Seen in 1-7 Days ↑ 15% 36% 83% 45% <-Data for this indicator is not available at the county level->
State Hospitals: Seen in 1-7 Days ↑ 17% 53% 90% 38% <-Data for this indicator is not available at the county level->
Community Hospitals: Seen in 1-7 Days ↑ 31% 40% 51% 33% 35% 9%
Crisis Services: Seen in 0-5 Days ↑ 12% 39% 62% 24% 23% 29%
9. Medical Care Coordination
Received a Primary Care/Preventive Health Visit ↑ 87% 91% 94% 92% 92% 90%
* ↑ Goal is to increase the percentage ↓ Goal is to decrease the percentage
Progress Indicator LME
Goa
l*
11

NC Division of Mental Health, Developmental Disabilities, and Substance Abuse ServicesAppendices for Community Systems Progress Report: Second Quarter SFY 2011 - 2012
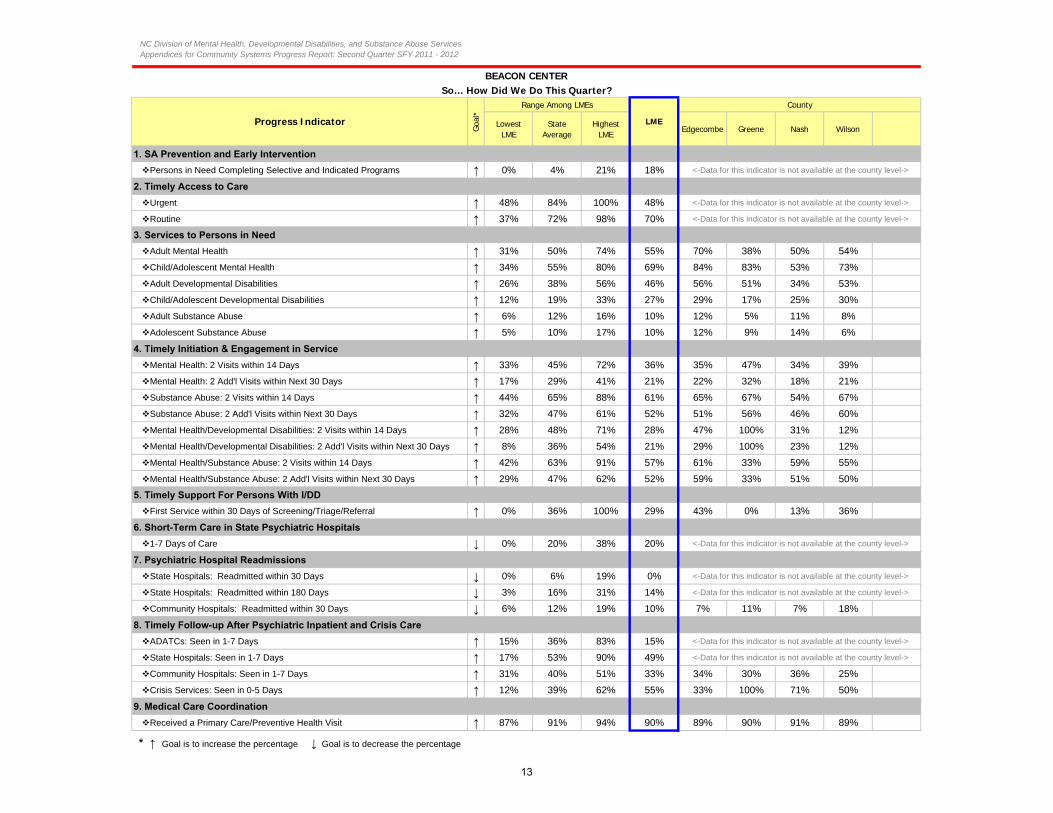
BEACON CENTER
Persons Served By Age and Disability During October 2010 - September 2011(Based On Medicaid and State-Funded IPRS Claims Paid Through January 2012)
The above pie charts show the number and percentage of persons served during the most recent 12 month period for which claims data is available. It only includes persons whose services were paid by Medicaid and State-Funds through the Integrated Payment Reporting System.
Reduction of Short-Term State Psychiatric Hospital Use
Timely Follow-Up After Discharge From A State Facility
Western Region Central Region Eastern Region
The Beacon Center serves the eastern North Carolina counties of Edgecombe, Greene, Nash andWilson. Only Wilson is considered urban. Of the 258,000 residents living in this area, 23% areenrolled in Medicaid.
MH3,538 86%
SA26 1%
DD161 4%
Dual MH/SA103 2%
Dual MH/DD298 7%
Dual DD/SA0
0%
MH/DD/SA3
0%
Youth (Under Age 18): 4,129
MH4,421 66%
SA642 10%
DD271 4%
Dual MH/SA878 13%
Dual MH/DD452 7%
Dual DD/SA1
0%
MH/DD/SA22 0%
Adults (Age 18 and Over): 6,687
Rationale: An adequate community service system should provide short-term inpatientcare in a local hospital in the community. This helps families stay involved and reserveshigh-cost state facility beds for consumers with long-term care needs. Reducing the useof state psychiatric hospitals for short-term care allows more effective and efficient useof funds for community services. The goal is to decrease the percentage.
Rationale: Living successfully in one's community after discharge from a state-operated facility depends on smooth and timely transition to community services and supports.Receiving a community-based service within 7 days of discharge is a nationally accepted standard of care that also indicates the local system's community service capacity andcoordination across levels of care. The goal is to increase the percentage. The percentages only include follow-up services paid by Medicaid and state-funds (IPRS).
Reduction of Short-Term State Psychiatric Hospital Use:
Overall, the percentage of persons discharged from state hospitals withstays of 7 days or less has decreased (improved) over the past 9 quarters(a lower percentage is better for this indicator).
The percentage is currently at the state average.
Timely Follow-Up After Discharge From A State Facility:
The percentage of persons discharged from state hospitals that havereceived follow-up care within 7 days of discharge has improved over thepast 9 quarters but remains below the state average (a higher percentageis better for this indicator).
The percentage of persons discharged from ADATCs that have receivedfollow-up care within 7 days of discharge has cycled up and down over thepast 9 quarters remaining well below the state average (a higherpercentage is better for this indicator).
50%
35%43%
36%29%
23%17%
29%20%
0%
20%
40%
60%
80%
100%
Q2 Q3 Q4 Q1 Q2 Q3 Q4 Q1 Q2
SFY10 SFY11 SFY12
Pct of Discharges: Length of Stay 7 Days or Less
LME Highest LME State Average Lowest LME
32% 37%46% 45%
38%50%
38% 34%
49%
0%
20%
40%
60%
80%
100%
Q2 Q3 Q4 Q1 Q2 Q3 Q4 Q1 Q2
SFY10 SFY11 SFY12
Pct
of
Per
son
s S
een
W
ith
in 7
Day
s
Timely Follow-Up: Psych Hospitals
LME Highest LME State Average Lowest LME
9% 10%
23% 29%20%
11%17%
31%
15%
0%
20%
40%
60%
80%
100%
Q2 Q3 Q4 Q1 Q2 Q3 Q4 Q1 Q2
SFY10 SFY11 SFY12
Pct
of
Per
son
s S
een
Wit
hin
7 D
ays
Timely Follow-Up: ADATCs
LME Highest LME State Average Lowest LME
12
NC Division of Mental Health, Developmental Disabilities, and Substance Abuse ServicesAppendices for Community Systems Progress Report: Second Quarter SFY 2011 - 2012
BEACON CENTERSo… How Did We Do This Quarter?
Range Among LMEs County
LowestLME
State Average
HighestLME
Edgecombe Greene Nash Wilson
1. SA Prevention and Early Intervention
Persons in Need Completing Selective and Indicated Programs ↑ 0% 4% 21% 18% <-Data for this indicator is not available at the county level->
2. Timely Access to Care
Urgent ↑ 48% 84% 100% 48% <-Data for this indicator is not available at the county level->
Routine ↑ 37% 72% 98% 70% <-Data for this indicator is not available at the county level->
3. Services to Persons in Need
Adult Mental Health ↑ 31% 50% 74% 55% 70% 38% 50% 54%
Child/Adolescent Mental Health ↑ 34% 55% 80% 69% 84% 83% 53% 73%
Adult Developmental Disabilities ↑ 26% 38% 56% 46% 56% 51% 34% 53%
Child/Adolescent Developmental Disabilities ↑ 12% 19% 33% 27% 29% 17% 25% 30%
Adult Substance Abuse ↑ 6% 12% 16% 10% 12% 5% 11% 8%
Adolescent Substance Abuse ↑ 5% 10% 17% 10% 12% 9% 14% 6%
4. Timely Initiation & Engagement in Service
Mental Health: 2 Visits within 14 Days ↑ 33% 45% 72% 36% 35% 47% 34% 39%
Mental Health: 2 Add'l Visits within Next 30 Days ↑ 17% 29% 41% 21% 22% 32% 18% 21%
Substance Abuse: 2 Visits within 14 Days ↑ 44% 65% 88% 61% 65% 67% 54% 67%
Substance Abuse: 2 Add'l Visits within Next 30 Days ↑ 32% 47% 61% 52% 51% 56% 46% 60%
Mental Health/Developmental Disabilities: 2 Visits within 14 Days ↑ 28% 48% 71% 28% 47% 100% 31% 12%
Mental Health/Developmental Disabilities: 2 Add'l Visits within Next 30 Days ↑ 8% 36% 54% 21% 29% 100% 23% 12%
Mental Health/Substance Abuse: 2 Visits within 14 Days ↑ 42% 63% 91% 57% 61% 33% 59% 55%
Mental Health/Substance Abuse: 2 Add'l Visits within Next 30 Days ↑ 29% 47% 62% 52% 59% 33% 51% 50%
5. Timely Support For Persons With I/DD
First Service within 30 Days of Screening/Triage/Referral ↑ 0% 36% 100% 29% 43% 0% 13% 36%
6. Short-Term Care in State Psychiatric Hospitals
1-7 Days of Care ↓ 0% 20% 38% 20% <-Data for this indicator is not available at the county level->
7. Psychiatric Hospital Readmissions
State Hospitals: Readmitted within 30 Days ↓ 0% 6% 19% 0% <-Data for this indicator is not available at the county level->
State Hospitals: Readmitted within 180 Days ↓ 3% 16% 31% 14% <-Data for this indicator is not available at the county level->
Community Hospitals: Readmitted within 30 Days ↓ 6% 12% 19% 10% 7% 11% 7% 18%
8. Timely Follow-up After Psychiatric Inpatient and Crisis Care
ADATCs: Seen in 1-7 Days ↑ 15% 36% 83% 15% <-Data for this indicator is not available at the county level->
State Hospitals: Seen in 1-7 Days ↑ 17% 53% 90% 49% <-Data for this indicator is not available at the county level->
Community Hospitals: Seen in 1-7 Days ↑ 31% 40% 51% 33% 34% 30% 36% 25%
Crisis Services: Seen in 0-5 Days ↑ 12% 39% 62% 55% 33% 100% 71% 50%
9. Medical Care Coordination
Received a Primary Care/Preventive Health Visit ↑ 87% 91% 94% 90% 89% 90% 91% 89%
* ↑ Goal is to increase the percentage ↓ Goal is to decrease the percentage
Progress Indicator LME
Goa
l*
13

NC Division of Mental Health, Developmental Disabilities, and Substance Abuse ServicesAppendices for Community Systems Progress Report: Second Quarter SFY 2011 - 2012
CENTERPOINT HUMAN SERVICES
Persons Served By Age and Disability During October 2010 - September 2011(Based On Medicaid and State-Funded IPRS Claims Paid Through January 2012)
The above pie charts show the number and percentage of persons served during the most recent 12 month period for which claims data is available. It only includes persons whose services were paid by Medicaid and State-Funds through the Integrated Payment Reporting System.
Reduction of Short-Term State Psychiatric Hospital Use
Timely Follow-Up After Discharge From A State Facility
MH4,063 83%
SA91 2%
DD197 4%
Dual MH/SA261 5%
Dual MH/DD310 6%
Dual DD/SA0
0%
MH/DD/SA0
0%
Youth (Under Age 18): 4,922
MH7,663 62%
SA1,481 12%
DD570 5%
Dual MH/SA2,036 16% Dual MH/DD
650 5%
Dual DD/SA2
0%
MH/DD/SA34 0%
Adults (Age 18 and Over): 12,436
Rationale: An adequate community service system should provide short-term inpatientcare in a local hospital in the community. This helps families stay involved and reserveshigh-cost state facility beds for consumers with long-term care needs. Reducing the useof state psychiatric hospitals for short-term care allows more effective and efficient useof funds for community services. The goal is to decrease the percentage.
Rationale: Living successfully in one's community after discharge from a state-operated facility depends on smooth and timely transition to community services and supports.Receiving a community-based service within 7 days of discharge is a nationally accepted standard of care that also indicates the local system's community service capacity andcoordination across levels of care. The goal is to increase the percentage. The percentages only include follow-up services paid by Medicaid and state-funds (IPRS).
Western Region Central Region Eastern Region
Centerpoint Human Services LME serves the central North Carolina counties of Davie, Forsyth,Rockingham, and Stokes. Forsyth is part of the Triad metropolitan area; the other counties arerural. Of the 540,000 residents living in this area, 17% are enrolled in Medicaid.
Reduction of Short-Term State Psychiatric Hospital Use:
Overall, the percentage of persons discharged from state hospitals withstays of 7 days or less has improved over the past 9 quarters. It iscurrently slightly below the state average (a lower percentage is better forthis indicator).
Timely Follow-Up After Discharge From A State Facility:
Overall, the percentage of persons discharged from state hospitals thathave received follow-up care within 7 days of discharge has increased overthe past 9 quarters. The percentage is currently slightly above the stateaverage (a higher percentage is better for this indicator).
Overall, the percentage of persons discharged from ADATCs that havereceived follow-up care within 7 days of discharge has increased over thepast 9 quarters. The percentage is currently well above the state average(a higher percentage is better for this indicator).
33%41%
30% 30% 29%22% 21%
9%17%
0%
20%
40%
60%
80%
100%
Q2 Q3 Q4 Q1 Q2 Q3 Q4 Q1 Q2
SFY10 SFY11 SFY12
Pct of Discharges: Length of Stay 7 Days or Less
LME Highest LME State Average Lowest LME
57%52% 57%
49% 47%58%
48% 51%61%
0%
20%
40%
60%
80%
100%
Q2 Q3 Q4 Q1 Q2 Q3 Q4 Q1 Q2
SFY10 SFY11 SFY12
Pct
of
Per
son
s S
een
W
ith
in 7
Day
s
Timely Follow-Up: Psych Hospitals
LME Highest LME State Average Lowest LME
50% 55% 58%64%
50%
36%46%
55%
70%
0%
20%
40%
60%
80%
100%
Q2 Q3 Q4 Q1 Q2 Q3 Q4 Q1 Q2
SFY10 SFY11 SFY12
Pct
of
Per
son
s S
een
Wit
hin
7 D
ays
Timely Follow-Up: ADATCs
LME Highest LME State Average Lowest LME
14

NC Division of Mental Health, Developmental Disabilities, and Substance Abuse ServicesAppendices for Community Systems Progress Report: Second Quarter SFY 2011 - 2012
CENTERPOINTSo… How Did We Do This Quarter?
Range Among LMEs County
LowestLME
State Average
HighestLME
Davie Forsyth Rockingham Stokes
1. SA Prevention and Early Intervention
Persons in Need Completing Selective and Indicated Programs ↑ 0% 4% 21% 8% <-Data for this indicator is not available at the county level->
2. Timely Access to Care
Urgent ↑ 48% 84% 100% 85% <-Data for this indicator is not available at the county level->
Routine ↑ 37% 72% 98% 74% <-Data for this indicator is not available at the county level->
3. Services to Persons in Need
Adult Mental Health ↑ 31% 50% 74% 46% 37% 44% 61% 44%
Child/Adolescent Mental Health ↑ 34% 55% 80% 41% 37% 41% 43% 35%
Adult Developmental Disabilities ↑ 26% 38% 56% 37% 33% 38% 37% 37%
Child/Adolescent Developmental Disabilities ↑ 12% 19% 33% 15% 12% 17% 8% 15%
Adult Substance Abuse ↑ 6% 12% 16% 11% 6% 11% 15% 8%
Adolescent Substance Abuse ↑ 5% 10% 17% 14% 7% 17% 10% 9%
4. Timely Initiation & Engagement in Service
Mental Health: 2 Visits within 14 Days ↑ 33% 45% 72% 45% 41% 47% 38% 44%
Mental Health: 2 Add'l Visits within Next 30 Days ↑ 17% 29% 41% 29% 24% 31% 26% 21%
Substance Abuse: 2 Visits within 14 Days ↑ 44% 65% 88% 63% 91% 62% 60% 82%
Substance Abuse: 2 Add'l Visits within Next 30 Days ↑ 32% 47% 61% 51% 73% 51% 49% 59%
Mental Health/Developmental Disabilities: 2 Visits within 14 Days ↑ 28% 48% 71% 63% 0% 67% 57% 50%
Mental Health/Developmental Disabilities: 2 Add'l Visits within Next 30 Days ↑ 8% 36% 54% 54% 0% 56% 57% 50%
Mental Health/Substance Abuse: 2 Visits within 14 Days ↑ 42% 63% 91% 68% 70% 66% 66% 91%
Mental Health/Substance Abuse: 2 Add'l Visits within Next 30 Days ↑ 29% 47% 62% 55% 48% 53% 56% 67%
5. Timely Support For Persons With I/DD
First Service within 30 Days of Screening/Triage/Referral ↑ 0% 36% 100% 25% 0% 27% 33% 0%
6. Short-Term Care in State Psychiatric Hospitals
1-7 Days of Care ↓ 0% 20% 38% 17% <-Data for this indicator is not available at the county level->
7. Psychiatric Hospital Readmissions
State Hospitals: Readmitted within 30 Days ↓ 0% 6% 19% 2% <-Data for this indicator is not available at the county level->
State Hospitals: Readmitted within 180 Days ↓ 3% 16% 31% 17% <-Data for this indicator is not available at the county level->
Community Hospitals: Readmitted within 30 Days ↓ 6% 12% 19% 11% 31% 11% 8% 4%
8. Timely Follow-up After Psychiatric Inpatient and Crisis Care
ADATCs: Seen in 1-7 Days ↑ 15% 36% 83% 70% <-Data for this indicator is not available at the county level->
State Hospitals: Seen in 1-7 Days ↑ 17% 53% 90% 61% <-Data for this indicator is not available at the county level->
Community Hospitals: Seen in 1-7 Days ↑ 31% 40% 51% 43% 39% 45% 38% 41%
Crisis Services: Seen in 0-5 Days ↑ 12% 39% 62% 49% 50% 58% 42% 20%
9. Medical Care Coordination
Received a Primary Care/Preventive Health Visit ↑ 87% 91% 94% 90% 94% 89% 91% 93%
* ↑ Goal is to increase the percentage ↓ Goal is to decrease the percentage
Progress Indicator LME
Goa
l*
15

NC Division of Mental Health, Developmental Disabilities, and Substance Abuse ServicesAppendices for Community Systems Progress Report: Second Quarter SFY 2011 - 2012
CROSSROADS BEHAVIORAL HEALTHCARE
Persons Served By Age and Disability During October 2010 - September 2011(Based On Medicaid and State-Funded IPRS Claims Paid Through January 2012)
The above pie charts show the number and percentage of persons served during the most recent 12 month period for which claims data is available. It only includes persons whose services were paid by Medicaid and State-Funds through the Integrated Payment Reporting System.
Reduction of Short-Term State Psychiatric Hospital Use
Timely Follow-Up After Discharge From A State Facility
MH2,229 85%
SA22 1%
DD114 5%
Dual MH/SA87 3%
Dual MH/DD162 6%
Dual DD/SA0
0%
MH/DD/SA0
0%
Youth (Under Age 18): 2,614
MH3,298 58%
SA543 10%
DD229 4%
Dual MH/SA1,280 22%
Dual MH/DD320 6%
Dual DD/SA1
0%
MH/DD/SA15 0%
Adults (Age 18 and Over): 5,686
Rationale: An adequate community service system should provide short-term inpatientcare in a local hospital in the community. This helps families stay involved and reserveshigh-cost state facility beds for consumers with long-term care needs. Reducing the useof state psychiatric hospitals for short-term care allows more effective and efficient useof funds for community services. The goal is to decrease the percentage.
Rationale: Living successfully in one's community after discharge from a state-operated facility depends on smooth and timely transition to community services and supports.Receiving a community-based service within 7 days of discharge is a nationally accepted standard of care that also indicates the local system's community service capacity andcoordination across levels of care. The goal is to increase the percentage. The percentages only include follow-up services paid by Medicaid and state-funds (IPRS).
Western Region Central Region Eastern Region
Crossroads Behavioral Healthcare LME serves the western North Carolina counties of Iredell,Surry and Yadkin. Only Iredell is considered urban. Of the 276,000 residents living in this area,16% are enrolled in Medicaid.
Reduction of Short-Term State Psychiatric Hospital Use:
Overall, the percentage of persons discharged from state hospitals withstays of 7 days or less has decreased over the last 9 quarters and hasremained below the state average during this period (a lower percentage isbetter for this indicator).
Timely Follow-Up After Discharge From A State Facility:
The percentage of persons discharged from state hospitals that havereceived follow-up care within 7 days of discharge has fluctuated up anddown over the past 9 quarters. The percentage is currently below the stateaverage (a higher percentage is better for this measure).
Overall, the percentage of persons discharged from ADATCs that havereceived follow-up care within 7 days of discharge has cycled up and downover the past 9 quarters. It is currently above the state average (a higherpercentage is better for this indicator).
22%10%
28% 30%21% 17%
10%17%
0%0%
20%
40%
60%
80%
100%
Q2 Q3 Q4 Q1 Q2 Q3 Q4 Q1 Q2
SFY10 SFY11 SFY12
Pct of Discharges: Length of Stay 7 Days or Less
LME Highest LME State Average Lowest LME
50%
36%
55%47% 43%
58%
36%
58%
44%
0%
20%
40%
60%
80%
100%
Q2 Q3 Q4 Q1 Q2 Q3 Q4 Q1 Q2
SFY10 SFY11 SFY12
Pct
of
Per
son
s S
een
W
ith
in 7
Day
s
Timely Follow-Up: Psych Hospitals
LME Highest LME State Average Lowest LME
50%
23%
50%42% 40%
22% 25% 27%
50%
0%
20%
40%
60%
80%
100%
Q2 Q3 Q4 Q1 Q2 Q3 Q4 Q1 Q2
SFY10 SFY11 SFY12
Pct
of
Per
son
s S
een
Wit
hin
7 D
ays
Timely Follow-Up: ADATCs
LME Highest LME State Average Lowest LME
16

NC Division of Mental Health, Developmental Disabilities, and Substance Abuse ServicesAppendices for Community Systems Progress Report: Second Quarter SFY 2011 - 2012
CROSSROADSSo… How Did We Do This Quarter?
Range Among LMEs County
LowestLME
State Average
HighestLME
Iredell Surry Yadkin
1. SA Prevention and Early Intervention
Persons in Need Completing Selective and Indicated Programs ↑ 0% 4% 21% 6% <-Data for this indicator is not available at the county level->
2. Timely Access to Care
Urgent ↑ 48% 84% 100% 91% <-Data for this indicator is not available at the county level->
Routine ↑ 37% 72% 98% 80% <-Data for this indicator is not available at the county level->
3. Services to Persons in Need
Adult Mental Health ↑ 31% 50% 74% 43% 34% 63% 43%
Child/Adolescent Mental Health ↑ 34% 55% 80% 41% 41% 44% 38%
Adult Developmental Disabilities ↑ 26% 38% 56% 33% 29% 41% 33%
Child/Adolescent Developmental Disabilities ↑ 12% 19% 33% 15% 15% 17% 14%
Adult Substance Abuse ↑ 6% 12% 16% 11% 10% 14% 11%
Adolescent Substance Abuse ↑ 5% 10% 17% 8% 7% 10% 7%
4. Timely Initiation & Engagement in Service
Mental Health: 2 Visits within 14 Days ↑ 33% 45% 72% 45% 44% 46% 43%
Mental Health: 2 Add'l Visits within Next 30 Days ↑ 17% 29% 41% 23% 28% 19% 20%
Substance Abuse: 2 Visits within 14 Days ↑ 44% 65% 88% 54% 52% 53% 63%
Substance Abuse: 2 Add'l Visits within Next 30 Days ↑ 32% 47% 61% 36% 39% 25% 47%
Mental Health/Developmental Disabilities: 2 Visits within 14 Days ↑ 28% 48% 71% 49% 56% 40% 50%
Mental Health/Developmental Disabilities: 2 Add'l Visits within Next 30 Days ↑ 8% 36% 54% 31% 44% 13% 50%
Mental Health/Substance Abuse: 2 Visits within 14 Days ↑ 42% 63% 91% 61% 67% 54% 63%
Mental Health/Substance Abuse: 2 Add'l Visits within Next 30 Days ↑ 29% 47% 62% 42% 51% 32% 42%
5. Timely Support For Persons With I/DD
First Service within 30 Days of Screening/Triage/Referral ↑ 0% 36% 100% 19% 18% 21% 14%
6. Short-Term Care in State Psychiatric Hospitals
1-7 Days of Care ↓ 0% 20% 38% 0% <-Data for this indicator is not available at the county level->
7. Psychiatric Hospital Readmissions
State Hospitals: Readmitted within 30 Days ↓ 0% 6% 19% 11% <-Data for this indicator is not available at the county level->
State Hospitals: Readmitted within 180 Days ↓ 3% 16% 31% 21% <-Data for this indicator is not available at the county level->
Community Hospitals: Readmitted within 30 Days ↓ 6% 12% 19% 12% 15% 13% 0%
8. Timely Follow-up After Psychiatric Inpatient and Crisis Care
ADATCs: Seen in 1-7 Days ↑ 15% 36% 83% 50% <-Data for this indicator is not available at the county level->
State Hospitals: Seen in 1-7 Days ↑ 17% 53% 90% 44% <-Data for this indicator is not available at the county level->
Community Hospitals: Seen in 1-7 Days ↑ 31% 40% 51% 40% 38% 44% 35%
Crisis Services: Seen in 0-5 Days ↑ 12% 39% 62% 24% 19% 47% 17%
9. Medical Care Coordination
Received a Primary Care/Preventive Health Visit ↑ 87% 91% 94% 94% 92% 95% 95%
* ↑ Goal is to increase the percentage ↓ Goal is to decrease the percentage
Progress Indicator LME
Goa
l*
17

NC Division of Mental Health, Developmental Disabilities, and Substance Abuse ServicesAppendices for Community Systems Progress Report: Second Quarter SFY 2011 - 2012
CUMBERLAND
Persons Served By Age and Disability During October 2010 - September 2011(Based On Medicaid and State-Funded IPRS Claims Paid Through January 2012)
The above pie charts show the number and percentage of persons served during the most recent 12 month period for which claims data is available. It only includes persons whose services were paid by Medicaid and State-Funds through the Integrated Payment Reporting System.
Reduction of Short-Term State Psychiatric Hospital Use
Timely Follow-Up After Discharge From A State Facility
MH4,199 87%
SA105 2%
DD115 2%
Dual MH/SA143 3%
Dual MH/DD294 6%
Dual DD/SA0
0%
MH/DD/SA4
0%
Youth (Under Age 18): 4,680
MH5,298 67%
SA827 10%
DD239 3%
Dual MH/SA1,085 14%
Dual MH/DD444 6%
Dual DD/SA1
0%
MH/DD/SA22 0%
Adults (Age 18 and Over): 7,916
Rationale: An adequate community service system should provide short-term inpatientcare in a local hospital in the community. This helps families stay involved and reserveshigh-cost state facility beds for consumers with long-term care needs. Reducing the useof state psychiatric hospitals for short-term care allows more effective and efficient useof funds for community services. The goal is to decrease the percentage.
Rationale: Living successfully in one's community after discharge from a state-operated facility depends on smooth and timely transition to community services and supports.Receiving a community-based service within 7 days of discharge is a nationally accepted standard of care that also indicates the local system's community service capacity andcoordination across levels of care. The goal is to increase the percentage. The percentages only include follow-up services paid by Medicaid and state-funds (IPRS).
Western Region Central Region Eastern Region
Cumberland County LME is a single-county program in eastern North Carolina. This urban countyhas 327,000 residents, of whom 19% are enrolled in Medicaid.
Reduction of Short-Term State Psychiatric Hospital Use:
Overall, the percentage of persons discharged from state hospitals withstays of 7 days or less has decreased over the last 9 quarters and hasremained below the state average for most of this time (a lower percentageis better for this indicator).
Timely Follow-Up After Discharge From A State Facility:
Overall, the percentage of persons discharged from state hospitals thathave received follow-up care within 7 days of discharge droppedsignificantly 8 quarters ago and has slowly increased over the past 8quarters to return to its former level. It is currently slightly above the stateaverage (a higher percentage is better for this indicator).
Overall, the percentage of persons discharged from ADATCs that havereceived follow-up care within 7 days of discharge has increased over thepast 9 quarters and is currently slightly above the state average (a higherpercentage is better for this indicator).
44%
18%
36%
19% 22%14%
32%
15% 14%
0%
20%
40%
60%
80%
100%
Q2 Q3 Q4 Q1 Q2 Q3 Q4 Q1 Q2
SFY10 SFY11 SFY12
Pct of Discharges: Length of Stay 7 Days or Less
LME Highest LME State Average Lowest LME
55%
30% 33% 32%43% 43%
36%
53% 55%
0%
20%
40%
60%
80%
100%
Q2 Q3 Q4 Q1 Q2 Q3 Q4 Q1 Q2
SFY10 SFY11 SFY12
Pct
of
Per
son
s S
een
W
ith
in 7
Day
s
Timely Follow-Up: Psych Hospitals
LME Highest LME State Average Lowest LME
17% 14%
56%
33% 36%
100%80%
50%42%
0%
20%
40%
60%
80%
100%
Q2 Q3 Q4 Q1 Q2 Q3 Q4 Q1 Q2
SFY10 SFY11 SFY12
Pct
of
Per
son
s S
een
Wit
hin
7 D
ays
Timely Follow-Up: ADATCs
LME Highest LME State Average Lowest LME
18

NC Division of Mental Health, Developmental Disabilities, and Substance Abuse ServicesAppendices for Community Systems Progress Report: Second Quarter SFY 2011 - 2012
CUMBERLANDSo… How Did We Do This Quarter?
Range Among LMEs County
LowestLME
State Average
HighestLME
Cumberland
1. SA Prevention and Early Intervention
Persons in Need Completing Selective and Indicated Programs ↑ 0% 4% 21% 0% <-Data for this indicator is not available at the county level->
2. Timely Access to Care
Urgent ↑ 48% 84% 100% 100% <-Data for this indicator is not available at the county level->
Routine ↑ 37% 72% 98% 67% <-Data for this indicator is not available at the county level->
3. Services to Persons in Need
Adult Mental Health ↑ 31% 50% 74% 53% 53%
Child/Adolescent Mental Health ↑ 34% 55% 80% 60% 60%
Adult Developmental Disabilities ↑ 26% 38% 56% 36% 36%
Child/Adolescent Developmental Disabilities ↑ 12% 19% 33% 18% 18%
Adult Substance Abuse ↑ 6% 12% 16% 9% 9%
Adolescent Substance Abuse ↑ 5% 10% 17% 17% 17%
4. Timely Initiation & Engagement in Service
Mental Health: 2 Visits within 14 Days ↑ 33% 45% 72% 33% 33%
Mental Health: 2 Add'l Visits within Next 30 Days ↑ 17% 29% 41% 20% 20%
Substance Abuse: 2 Visits within 14 Days ↑ 44% 65% 88% 69% 69%
Substance Abuse: 2 Add'l Visits within Next 30 Days ↑ 32% 47% 61% 56% 56%
Mental Health/Developmental Disabilities: 2 Visits within 14 Days ↑ 28% 48% 71% 44% 44%
Mental Health/Developmental Disabilities: 2 Add'l Visits within Next 30 Days ↑ 8% 36% 54% 26% 26%
Mental Health/Substance Abuse: 2 Visits within 14 Days ↑ 42% 63% 91% 42% 42%
Mental Health/Substance Abuse: 2 Add'l Visits within Next 30 Days ↑ 29% 47% 62% 29% 29%
5. Timely Support For Persons With I/DD
First Service within 30 Days of Screening/Triage/Referral ↑ 0% 36% 100% 22% 22%
6. Short-Term Care in State Psychiatric Hospitals
1-7 Days of Care ↓ 0% 20% 38% 14% <-Data for this indicator is not available at the county level->
7. Psychiatric Hospital Readmissions
State Hospitals: Readmitted within 30 Days ↓ 0% 6% 19% 0% <-Data for this indicator is not available at the county level->
State Hospitals: Readmitted within 180 Days ↓ 3% 16% 31% 15% <-Data for this indicator is not available at the county level->
Community Hospitals: Readmitted within 30 Days ↓ 6% 12% 19% 18% 18%
8. Timely Follow-up After Psychiatric Inpatient and Crisis Care
ADATCs: Seen in 1-7 Days ↑ 15% 36% 83% 42% <-Data for this indicator is not available at the county level->
State Hospitals: Seen in 1-7 Days ↑ 17% 53% 90% 55% <-Data for this indicator is not available at the county level->
Community Hospitals: Seen in 1-7 Days ↑ 31% 40% 51% 32% 32%
Crisis Services: Seen in 0-5 Days ↑ 12% 39% 62% 59% 59%
9. Medical Care Coordination
Received a Primary Care/Preventive Health Visit ↑ 87% 91% 94% 90% 90%
* ↑ Goal is to increase the percentage ↓ Goal is to decrease the percentage
Progress Indicator LME
Goa
l*
19

NC Division of Mental Health, Developmental Disabilities, and Substance Abuse ServicesAppendices for Community Systems Progress Report: Second Quarter SFY 2011 - 2012
DURHAM CENTER
Persons Served By Age and Disability During October 2010 - September 2011(Based On Medicaid and State-Funded IPRS Claims Paid Through January 2012)
The above pie charts show the number and percentage of persons served during the most recent 12 month period for which claims data is available. It only includes persons whose services were paid by Medicaid and State-Funds through the Integrated Payment Reporting System.
Reduction of Short-Term State Psychiatric Hospital Use
Timely Follow-Up After Discharge From A State Facility
MH4,331 88%
SA33 1%
DD157 3%
Dual MH/SA113 2%
Dual MH/DD316 6%
Dual DD/SA0
0%
MH/DD/SA4
0%
Youth (Under Age 18): 4,954
MH4,680 61%
SA633 8%
DD222 3%
Dual MH/SA1,688 22%
Dual MH/DD442 6%
Dual DD/SA1
0%
MH/DD/SA30 0%
Adults (Age 18 and Over): 7,696
Rationale: An adequate community service system should provide short-term inpatientcare in a local hospital in the community. This helps families stay involved and reserveshigh-cost state facility beds for consumers with long-term care needs. Reducing the useof state psychiatric hospitals for short-term care allows more effective and efficient useof funds for community services. The goal is to decrease the percentage.
Rationale: Living successfully in one's community after discharge from a state-operated facility depends on smooth and timely transition to community services and supports.Receiving a community-based service within 7 days of discharge is a nationally accepted standard of care that also indicates the local system's community service capacity andcoordination across levels of care. The goal is to increase the percentage. The percentages only include follow-up services paid by Medicaid and state-funds (IPRS).
Western Region Central Region Eastern Region
The Durham Center LME is a single-county program in central North Carolina. This urban countyis part of the Triangle metropolitan area. Of the 274,000 residents living in the county, 16% areenrolled in Medicaid.
Reduction of Short-Term State Psychiatric Hospital Use:
The percentage of persons discharged from state hospitals with stays of7 days or less has decreased over the last 9 quarters. It is currently slightlybelow the state average (a lower percentage is better for this indicator).
Timely Follow-Up After Discharge From A State Facility:
Overall, the percentage of persons discharged from state hospitals thathave received follow-up care within 7 days of discharge has decreasedover the past 9 quarters from above to slightly below the state average (ahigher percentage is better for this indicator).
The percentage of persons discharged from ADATCs that have receivedfollow-up care within 7 days of discharge has cycled up and down over thepast 9 quarters. The percentage has remained above the state averageduring this period (a higher percentage is better for this indicator).
36% 41%
23% 27% 25% 20%26% 21%
13%
0%
20%
40%
60%
80%
100%
Q2 Q3 Q4 Q1 Q2 Q3 Q4 Q1 Q2
SFY10 SFY11 SFY12
Pct of Discharges: Length of Stay 7 Days or Less
LME Highest LME State Average Lowest LME
58% 59% 59% 65% 60%51%
58%49% 51%
0%
20%
40%
60%
80%
100%
Q2 Q3 Q4 Q1 Q2 Q3 Q4 Q1 Q2
SFY10 SFY11 SFY12
Pct
of
Per
son
s S
een
W
ith
in 7
Day
s
Timely Follow-Up: Psych Hospitals
LME Highest LME State Average Lowest LME
56%44% 44%
78%
59%50%
64%55%
43%
0%
20%
40%
60%
80%
100%
Q2 Q3 Q4 Q1 Q2 Q3 Q4 Q1 Q2
SFY10 SFY11 SFY12
Pct
of
Per
son
s S
een
Wit
hin
7 D
ays
Timely Follow-Up: ADATCs
LME Highest LME State Average Lowest LME
20

NC Division of Mental Health, Developmental Disabilities, and Substance Abuse ServicesAppendices for Community Systems Progress Report: Second Quarter SFY 2011 - 2012
DURHAM CENTERSo… How Did We Do This Quarter?
Range Among LMEs County
LowestLME
State Average
HighestLME
Durham
1. SA Prevention and Early Intervention
Persons in Need Completing Selective and Indicated Programs ↑ 0% 4% 21% 21% <-Data for this indicator is not available at the county level->
2. Timely Access to Care
Urgent ↑ 48% 84% 100% 78% <-Data for this indicator is not available at the county level->
Routine ↑ 37% 72% 98% 89% <-Data for this indicator is not available at the county level->
3. Services to Persons in Need
Adult Mental Health ↑ 31% 50% 74% 61% 61%
Child/Adolescent Mental Health ↑ 34% 55% 80% 80% 80%
Adult Developmental Disabilities ↑ 26% 38% 56% 41% 41%
Child/Adolescent Developmental Disabilities ↑ 12% 19% 33% 26% 26%
Adult Substance Abuse ↑ 6% 12% 16% 14% 14%
Adolescent Substance Abuse ↑ 5% 10% 17% 13% 13%
4. Timely Initiation & Engagement in Service
Mental Health: 2 Visits within 14 Days ↑ 33% 45% 72% 55% 55%
Mental Health: 2 Add'l Visits within Next 30 Days ↑ 17% 29% 41% 41% 41%
Substance Abuse: 2 Visits within 14 Days ↑ 44% 65% 88% 71% 71%
Substance Abuse: 2 Add'l Visits within Next 30 Days ↑ 32% 47% 61% 61% 61%
Mental Health/Developmental Disabilities: 2 Visits within 14 Days ↑ 28% 48% 71% 52% 52%
Mental Health/Developmental Disabilities: 2 Add'l Visits within Next 30 Days ↑ 8% 36% 54% 44% 44%
Mental Health/Substance Abuse: 2 Visits within 14 Days ↑ 42% 63% 91% 61% 61%
Mental Health/Substance Abuse: 2 Add'l Visits within Next 30 Days ↑ 29% 47% 62% 45% 45%
5. Timely Support For Persons With I/DD
First Service within 30 Days of Screening/Triage/Referral ↑ 0% 36% 100% 37% 37%
6. Short-Term Care in State Psychiatric Hospitals
1-7 Days of Care ↓ 0% 20% 38% 13% <-Data for this indicator is not available at the county level->
7. Psychiatric Hospital Readmissions
State Hospitals: Readmitted within 30 Days ↓ 0% 6% 19% 12% <-Data for this indicator is not available at the county level->
State Hospitals: Readmitted within 180 Days ↓ 3% 16% 31% 19% <-Data for this indicator is not available at the county level->
Community Hospitals: Readmitted within 30 Days ↓ 6% 12% 19% 15% 15%
8. Timely Follow-up After Psychiatric Inpatient and Crisis Care
ADATCs: Seen in 1-7 Days ↑ 15% 36% 83% 43% <-Data for this indicator is not available at the county level->
State Hospitals: Seen in 1-7 Days ↑ 17% 53% 90% 51% <-Data for this indicator is not available at the county level->
Community Hospitals: Seen in 1-7 Days ↑ 31% 40% 51% 51% 51%
Crisis Services: Seen in 0-5 Days ↑ 12% 39% 62% 48% 48%
9. Medical Care Coordination
Received a Primary Care/Preventive Health Visit ↑ 87% 91% 94% 87% 87%
* ↑ Goal is to increase the percentage ↓ Goal is to decrease the percentage
Progress Indicator LME
Goa
l*
21

NC Division of Mental Health, Developmental Disabilities, and Substance Abuse ServicesAppendices for Community Systems Progress Report: Second Quarter SFY 2011 - 2012
EAST CAROLINA BEHAVIORAL HEALTH
Persons Served By Age and Disability During October 2010 - September 2011(Based On Medicaid and State-Funded IPRS Claims Paid Through January 2012)
The above pie charts show the number and percentage of persons served during the most recent 12 month period for which claims data is available. It only includes persons whose services were paid by Medicaid and State-Funds through the Integrated Payment Reporting System.
Reduction of Short-Term State Psychiatric Hospital Use
Timely Follow-Up After Discharge From A State Facility
MH7,739 88%
SA50 1%
DD261 3%
Dual MH/SA190 2%
Dual MH/DD535 6%
Dual DD/SA1
0%
MH/DD/SA6
0%
Youth (Under Age 18): 8,782
MH8,917 58%
SA1,611 11%
DD651 4%
Dual MH/SA3,143 20%
Dual MH/DD978 6%
Dual DD/SA3
0%
MH/DD/SA76 1%
Adults (Age 18 and Over): 15,379
Rationale: An adequate community service system should provide short-term inpatientcare in a local hospital in the community. This helps families stay involved and reserveshigh-cost state facility beds for consumers with long-term care needs. Reducing the useof state psychiatric hospitals for short-term care allows more effective and efficient useof funds for community services. The goal is to decrease the percentage.
Rationale: Living successfully in one's community after discharge from a state-operated facility depends on smooth and timely transition to community services and supports.Receiving a community-based service within 7 days of discharge is a nationally accepted standard of care that also indicates the local system's community service capacity andcoordination across levels of care. The goal is to increase the percentage. The percentages only include follow-up services paid by Medicaid and state-funds (IPRS).
East Carolina Behavioral Health LME serves 19 counties in eastern North Carolina, all but one ofwhich (Pitt) are rural. Of the 617,000 residents living in this area, 18% are enrolled in Medicaid.
Reduction of Short-Term State Psychiatric Hospital Use:
Overall, the percentage of persons discharged from state hospitals withstays of 7 days or less has decreased over the last 9 quarters. Thepercentage is currently slightly above the state average (a lowerpercentage is better for this indicator).
Timely Follow-Up After Discharge From A State Facility:
Overall, the percentage of persons discharged from state hospitals thathave received follow-up care within 7 days of discharge has decreasedover the past 9 quarters from slightly above to well below the state average(a higher percentage is better for this indicator).
Overall, the percentage of persons discharged from ADATCs that havereceived follow-up care within 7 days of discharge has cycled up and downover the past 9 quarters. However, it has remained below the stateaverage during this period (a higher percentage is better for this indicator).
40%32%
17%
31% 30%23%
30% 28% 24%
0%
20%
40%
60%
80%
100%
Q2 Q3 Q4 Q1 Q2 Q3 Q4 Q1 Q2
SFY10 SFY11 SFY12
Pct of Discharges: Length of Stay 7 Days or Less
LME Highest LME State Average Lowest LME
52% 52%
38% 42%51%
38% 37%45%
24%
0%
20%
40%
60%
80%
100%
Q2 Q3 Q4 Q1 Q2 Q3 Q4 Q1 Q2
SFY10 SFY11 SFY12
Pct
of
Per
son
s S
een
W
ith
in 7
Day
s
Timely Follow-Up: Psych Hospitals
LME Highest LME State Average Lowest LME
21% 24%37% 34%
28%34% 35% 32%
19%
0%
20%
40%
60%
80%
100%
Q2 Q3 Q4 Q1 Q2 Q3 Q4 Q1 Q2
SFY10 SFY11 SFY12
Pct
of
Per
son
s S
een
Wit
hin
7 D
ays
Timely Follow-Up: ADATCs
LME Highest LME State Average Lowest LME
Western Region Central Region Eastern Region
22
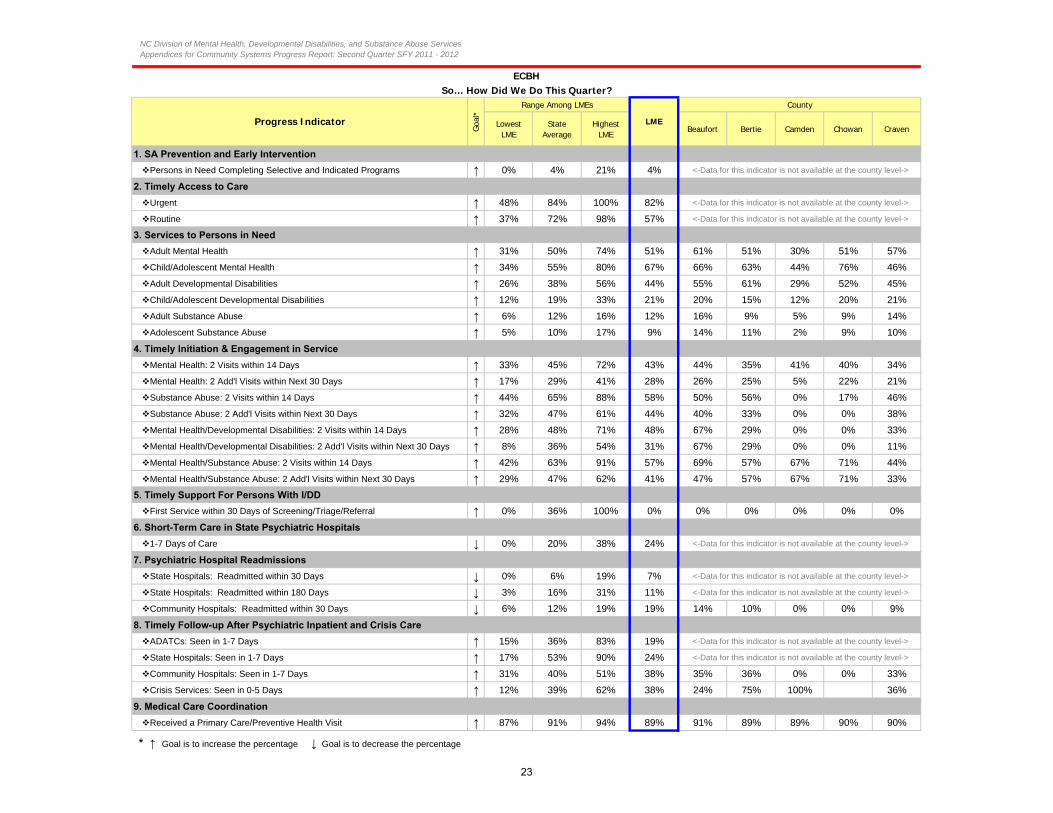
NC Division of Mental Health, Developmental Disabilities, and Substance Abuse ServicesAppendices for Community Systems Progress Report: Second Quarter SFY 2011 - 2012
ECBHSo… How Did We Do This Quarter?
Range Among LMEs County
LowestLME
State Average
HighestLME
Beaufort Bertie Camden Chowan Craven
1. SA Prevention and Early Intervention
Persons in Need Completing Selective and Indicated Programs ↑ 0% 4% 21% 4% <-Data for this indicator is not available at the county level->
2. Timely Access to Care
Urgent ↑ 48% 84% 100% 82% <-Data for this indicator is not available at the county level->
Routine ↑ 37% 72% 98% 57% <-Data for this indicator is not available at the county level->
3. Services to Persons in Need
Adult Mental Health ↑ 31% 50% 74% 51% 61% 51% 30% 51% 57%
Child/Adolescent Mental Health ↑ 34% 55% 80% 67% 66% 63% 44% 76% 46%
Adult Developmental Disabilities ↑ 26% 38% 56% 44% 55% 61% 29% 52% 45%
Child/Adolescent Developmental Disabilities ↑ 12% 19% 33% 21% 20% 15% 12% 20% 21%
Adult Substance Abuse ↑ 6% 12% 16% 12% 16% 9% 5% 9% 14%
Adolescent Substance Abuse ↑ 5% 10% 17% 9% 14% 11% 2% 9% 10%
4. Timely Initiation & Engagement in Service
Mental Health: 2 Visits within 14 Days ↑ 33% 45% 72% 43% 44% 35% 41% 40% 34%
Mental Health: 2 Add'l Visits within Next 30 Days ↑ 17% 29% 41% 28% 26% 25% 5% 22% 21%
Substance Abuse: 2 Visits within 14 Days ↑ 44% 65% 88% 58% 50% 56% 0% 17% 46%
Substance Abuse: 2 Add'l Visits within Next 30 Days ↑ 32% 47% 61% 44% 40% 33% 0% 0% 38%
Mental Health/Developmental Disabilities: 2 Visits within 14 Days ↑ 28% 48% 71% 48% 67% 29% 0% 0% 33%
Mental Health/Developmental Disabilities: 2 Add'l Visits within Next 30 Days ↑ 8% 36% 54% 31% 67% 29% 0% 0% 11%
Mental Health/Substance Abuse: 2 Visits within 14 Days ↑ 42% 63% 91% 57% 69% 57% 67% 71% 44%
Mental Health/Substance Abuse: 2 Add'l Visits within Next 30 Days ↑ 29% 47% 62% 41% 47% 57% 67% 71% 33%
5. Timely Support For Persons With I/DD
First Service within 30 Days of Screening/Triage/Referral ↑ 0% 36% 100% 0% 0% 0% 0% 0% 0%
6. Short-Term Care in State Psychiatric Hospitals
1-7 Days of Care ↓ 0% 20% 38% 24% <-Data for this indicator is not available at the county level->
7. Psychiatric Hospital Readmissions
State Hospitals: Readmitted within 30 Days ↓ 0% 6% 19% 7% <-Data for this indicator is not available at the county level->
State Hospitals: Readmitted within 180 Days ↓ 3% 16% 31% 11% <-Data for this indicator is not available at the county level->
Community Hospitals: Readmitted within 30 Days ↓ 6% 12% 19% 19% 14% 10% 0% 0% 9%
8. Timely Follow-up After Psychiatric Inpatient and Crisis Care
ADATCs: Seen in 1-7 Days ↑ 15% 36% 83% 19% <-Data for this indicator is not available at the county level->
State Hospitals: Seen in 1-7 Days ↑ 17% 53% 90% 24% <-Data for this indicator is not available at the county level->
Community Hospitals: Seen in 1-7 Days ↑ 31% 40% 51% 38% 35% 36% 0% 0% 33%
Crisis Services: Seen in 0-5 Days ↑ 12% 39% 62% 38% 24% 75% 100% 36%
9. Medical Care Coordination
Received a Primary Care/Preventive Health Visit ↑ 87% 91% 94% 89% 91% 89% 89% 90% 90%
* ↑ Goal is to increase the percentage ↓ Goal is to decrease the percentage
Progress Indicator LME
Goa
l*
23

NC Division of Mental Health, Developmental Disabilities, and Substance Abuse ServicesAppendices for Community Systems Progress Report: Second Quarter SFY 2011 - 2012
ECBHSo… How Did We Do This Quarter?
Range Among LMEs County
LowestLME
State Average
HighestLME
Currituck Dare Gates Hertford Hyde
1. SA Prevention and Early Intervention
Persons in Need Completing Selective and Indicated Programs ↑ 0% 4% 21% 4% <-Data for this indicator is not available at the county level->
2. Timely Access to Care
Urgent ↑ 48% 84% 100% 82% <-Data for this indicator is not available at the county level->
Routine ↑ 37% 72% 98% 57% <-Data for this indicator is not available at the county level->
3. Services to Persons in Need
Adult Mental Health ↑ 31% 50% 74% 51% 32% 43% 36% 49% 40%
Child/Adolescent Mental Health ↑ 34% 55% 80% 67% 36% 45% 36% 42% 28%
Adult Developmental Disabilities ↑ 26% 38% 56% 44% 20% 22% 37% 63% 60%
Child/Adolescent Developmental Disabilities ↑ 12% 19% 33% 21% 18% 9% 14% 13% 14%
Adult Substance Abuse ↑ 6% 12% 16% 12% 8% 10% 5% 9% 6%
Adolescent Substance Abuse ↑ 5% 10% 17% 9% 4% 6% 2% 4% 0%
4. Timely Initiation & Engagement in Service
Mental Health: 2 Visits within 14 Days ↑ 33% 45% 72% 43% 32% 44% 32% 33% 42%
Mental Health: 2 Add'l Visits within Next 30 Days ↑ 17% 29% 41% 28% 18% 23% 8% 15% 11%
Substance Abuse: 2 Visits within 14 Days ↑ 44% 65% 88% 58% 82% 65% 50% 69% 100%
Substance Abuse: 2 Add'l Visits within Next 30 Days ↑ 32% 47% 61% 44% 45% 57% 50% 69% 100%
Mental Health/Developmental Disabilities: 2 Visits within 14 Days ↑ 28% 48% 71% 48% 100% 0% 0% 40% 0%
Mental Health/Developmental Disabilities: 2 Add'l Visits within Next 30 Days ↑ 8% 36% 54% 31% 100% 0% 0% 20% 0%
Mental Health/Substance Abuse: 2 Visits within 14 Days ↑ 42% 63% 91% 57% 58% 51% 67% 58% 100%
Mental Health/Substance Abuse: 2 Add'l Visits within Next 30 Days ↑ 29% 47% 62% 41% 47% 36% 67% 25% 0%
5. Timely Support For Persons With I/DD
First Service within 30 Days of Screening/Triage/Referral ↑ 0% 36% 100% 0% 0% 0% 0% 0% 0%
6. Short-Term Care in State Psychiatric Hospitals
1-7 Days of Care ↓ 0% 20% 38% 24% <-Data for this indicator is not available at the county level->
7. Psychiatric Hospital Readmissions
State Hospitals: Readmitted within 30 Days ↓ 0% 6% 19% 7% <-Data for this indicator is not available at the county level->
State Hospitals: Readmitted within 180 Days ↓ 3% 16% 31% 11% <-Data for this indicator is not available at the county level->
Community Hospitals: Readmitted within 30 Days ↓ 6% 12% 19% 19% 0% 10% 15% 0%
8. Timely Follow-up After Psychiatric Inpatient and Crisis Care
ADATCs: Seen in 1-7 Days ↑ 15% 36% 83% 19% <-Data for this indicator is not available at the county level->
State Hospitals: Seen in 1-7 Days ↑ 17% 53% 90% 24% <-Data for this indicator is not available at the county level->
Community Hospitals: Seen in 1-7 Days ↑ 31% 40% 51% 38% 22% 33% 0% 47% 25%
Crisis Services: Seen in 0-5 Days ↑ 12% 39% 62% 38% 57% 35% 33% 40% 0%
9. Medical Care Coordination
Received a Primary Care/Preventive Health Visit ↑ 87% 91% 94% 89% 90% 92% 89% 91% 90%
* ↑ Goal is to increase the percentage ↓ Goal is to decrease the percentage
Progress Indicator LME
Goa
l*
24

NC Division of Mental Health, Developmental Disabilities, and Substance Abuse ServicesAppendices for Community Systems Progress Report: Second Quarter SFY 2011 - 2012
ECBHSo… How Did We Do This Quarter?
Range Among LMEs County
LowestLME
State Average
HighestLME
Jones Martin Northampton Pamlico Pasquotank
1. SA Prevention and Early Intervention
Persons in Need Completing Selective and Indicated Programs ↑ 0% 4% 21% 4% <-Data for this indicator is not available at the county level->
2. Timely Access to Care
Urgent ↑ 48% 84% 100% 82% <-Data for this indicator is not available at the county level->
Routine ↑ 37% 72% 98% 57% <-Data for this indicator is not available at the county level->
3. Services to Persons in Need
Adult Mental Health ↑ 31% 50% 74% 51% 53% 56% 66% 40% 51%
Child/Adolescent Mental Health ↑ 34% 55% 80% 67% 86% 90% 96% 103% 54%
Adult Developmental Disabilities ↑ 26% 38% 56% 44% 51% 45% 49% 41% 51%
Child/Adolescent Developmental Disabilities ↑ 12% 19% 33% 21% 32% 18% 15% 21% 15%
Adult Substance Abuse ↑ 6% 12% 16% 12% 9% 10% 11% 12% 9%
Adolescent Substance Abuse ↑ 5% 10% 17% 9% 9% 7% 9% 12% 6%
4. Timely Initiation & Engagement in Service
Mental Health: 2 Visits within 14 Days ↑ 33% 45% 72% 43% 33% 59% 35% 40% 35%
Mental Health: 2 Add'l Visits within Next 30 Days ↑ 17% 29% 41% 28% 23% 39% 23% 31% 23%
Substance Abuse: 2 Visits within 14 Days ↑ 44% 65% 88% 58% 50% 63% 50% 29% 42%
Substance Abuse: 2 Add'l Visits within Next 30 Days ↑ 32% 47% 61% 44% 33% 50% 17% 29% 33%
Mental Health/Developmental Disabilities: 2 Visits within 14 Days ↑ 28% 48% 71% 48% 100% 33% 57% 100% 44%
Mental Health/Developmental Disabilities: 2 Add'l Visits within Next 30 Days ↑ 8% 36% 54% 31% 33% 0% 43% 100% 11%
Mental Health/Substance Abuse: 2 Visits within 14 Days ↑ 42% 63% 91% 57% 45% 100% 56% 57% 45%
Mental Health/Substance Abuse: 2 Add'l Visits within Next 30 Days ↑ 29% 47% 62% 41% 36% 63% 33% 29% 33%
5. Timely Support For Persons With I/DD
First Service within 30 Days of Screening/Triage/Referral ↑ 0% 36% 100% 0% 0% 0% 0% 0% 0%
6. Short-Term Care in State Psychiatric Hospitals
1-7 Days of Care ↓ 0% 20% 38% 24% <-Data for this indicator is not available at the county level->
7. Psychiatric Hospital Readmissions
State Hospitals: Readmitted within 30 Days ↓ 0% 6% 19% 7% <-Data for this indicator is not available at the county level->
State Hospitals: Readmitted within 180 Days ↓ 3% 16% 31% 11% <-Data for this indicator is not available at the county level->
Community Hospitals: Readmitted within 30 Days ↓ 6% 12% 19% 19% 29% 14% 20% 50% 8%
8. Timely Follow-up After Psychiatric Inpatient and Crisis Care
ADATCs: Seen in 1-7 Days ↑ 15% 36% 83% 19% <-Data for this indicator is not available at the county level->
State Hospitals: Seen in 1-7 Days ↑ 17% 53% 90% 24% <-Data for this indicator is not available at the county level->
Community Hospitals: Seen in 1-7 Days ↑ 31% 40% 51% 38% 43% 33% 18% 33% 39%
Crisis Services: Seen in 0-5 Days ↑ 12% 39% 62% 38% 0% 33% 50% 50% 33%
9. Medical Care Coordination
Received a Primary Care/Preventive Health Visit ↑ 87% 91% 94% 89% 92% 89% 90% 94% 92%
* ↑ Goal is to increase the percentage ↓ Goal is to decrease the percentage
Progress Indicator LME
Goa
l*
25

NC Division of Mental Health, Developmental Disabilities, and Substance Abuse ServicesAppendices for Community Systems Progress Report: Second Quarter SFY 2011 - 2012
ECBHSo… How Did We Do This Quarter?
Range Among LMEs County
LowestLME
State Average
HighestLME
Perquimans Pitt Tyrrell Washington
1. SA Prevention and Early Intervention
Persons in Need Completing Selective and Indicated Programs ↑ 0% 4% 21% 4% <-Data for this indicator is not available at the county level->
2. Timely Access to Care
Urgent ↑ 48% 84% 100% 82% <-Data for this indicator is not available at the county level->
Routine ↑ 37% 72% 98% 57% <-Data for this indicator is not available at the county level->
3. Services to Persons in Need
Adult Mental Health ↑ 31% 50% 74% 51% 44% 48% 44% 85%
Child/Adolescent Mental Health ↑ 34% 55% 80% 67% 46% 88% 44% 115%
Adult Developmental Disabilities ↑ 26% 38% 56% 44% 41% 36% 53% 79%
Child/Adolescent Developmental Disabilities ↑ 12% 19% 33% 21% 14% 31% 9% 9%
Adult Substance Abuse ↑ 6% 12% 16% 12% 10% 14% 6% 26%
Adolescent Substance Abuse ↑ 5% 10% 17% 9% 5% 11% 0% 22%
4. Timely Initiation & Engagement in Service
Mental Health: 2 Visits within 14 Days ↑ 33% 45% 72% 43% 48% 53% 40% 58%
Mental Health: 2 Add'l Visits within Next 30 Days ↑ 17% 29% 41% 28% 35% 39% 20% 39%
Substance Abuse: 2 Visits within 14 Days ↑ 44% 65% 88% 58% 80% 64% 100% 79%
Substance Abuse: 2 Add'l Visits within Next 30 Days ↑ 32% 47% 61% 44% 40% 47% 0% 57%
Mental Health/Developmental Disabilities: 2 Visits within 14 Days ↑ 28% 48% 71% 48% 33% 59% 0% 0%
Mental Health/Developmental Disabilities: 2 Add'l Visits within Next 30 Days ↑ 8% 36% 54% 31% 33% 41% 0% 0%
Mental Health/Substance Abuse: 2 Visits within 14 Days ↑ 42% 63% 91% 57% 53% 62% 100% 88%
Mental Health/Substance Abuse: 2 Add'l Visits within Next 30 Days ↑ 29% 47% 62% 41% 35% 44% 100% 81%
5. Timely Support For Persons With I/DD
First Service within 30 Days of Screening/Triage/Referral ↑ 0% 36% 100% 0% 0% 0% 0% 0%
6. Short-Term Care in State Psychiatric Hospitals
1-7 Days of Care ↓ 0% 20% 38% 24% <-Data for this indicator is not available at the county level->
7. Psychiatric Hospital Readmissions
State Hospitals: Readmitted within 30 Days ↓ 0% 6% 19% 7% <-Data for this indicator is not available at the county level->
State Hospitals: Readmitted within 180 Days ↓ 3% 16% 31% 11% <-Data for this indicator is not available at the county level->
Community Hospitals: Readmitted within 30 Days ↓ 6% 12% 19% 19% 0% 27% 30%
8. Timely Follow-up After Psychiatric Inpatient and Crisis Care
ADATCs: Seen in 1-7 Days ↑ 15% 36% 83% 19% <-Data for this indicator is not available at the county level->
State Hospitals: Seen in 1-7 Days ↑ 17% 53% 90% 24% <-Data for this indicator is not available at the county level->
Community Hospitals: Seen in 1-7 Days ↑ 31% 40% 51% 38% 17% 49% 36%
Crisis Services: Seen in 0-5 Days ↑ 12% 39% 62% 38% 0% 40% 100% 33%
9. Medical Care Coordination
Received a Primary Care/Preventive Health Visit ↑ 87% 91% 94% 89% 90% 88% 92% 86%
* ↑ Goal is to increase the percentage ↓ Goal is to decrease the percentage
Progress Indicator LME
Goa
l*
26

NC Division of Mental Health, Developmental Disabilities, and Substance Abuse ServicesAppendices for Community Systems Progress Report: Second Quarter SFY 2011 - 2012
This Page Intentionally Left Blank
27

NC Division of Mental Health, Developmental Disabilities, and Substance Abuse ServicesAppendices for Community Systems Progress Report: Second Quarter SFY 2011 - 2012
EASTPOINTE
Persons Served By Age and Disability During October 2010 - September 2011(Based On Medicaid and State-Funded IPRS Claims Paid Through January 2012)
The above pie charts show the number and percentage of persons served during the most recent 12 month period for which claims data is available. It only includes persons whose services were paid by Medicaid and State-Funds through the Integrated Payment Reporting System.
Reduction of Short-Term State Psychiatric Hospital Use
Timely Follow-Up After Discharge From A State Facility
MH4,265 88%
SA20 0%
DD160 3%
Dual MH/SA138 3%
Dual MH/DD278 6%
Dual DD/SA0
0%
MH/DD/SA1
0%
Youth (Under Age 18): 4,862
MH5,647 63%
SA664 7%
DD358 4%
Dual MH/SA1,565 18%
Dual MH/DD614 7%
Dual DD/SA5
0%
MH/DD/SA49 1%
Adults (Age 18 and Over): 8,902
Rationale: An adequate community service system should provide short-term inpatientcare in a local hospital in the community. This helps families stay involved and reserveshigh-cost state facility beds for consumers with long-term care needs. Reducing the useof state psychiatric hospitals for short-term care allows more effective and efficient useof funds for community services. The goal is to decrease the percentage.
Rationale: Living successfully in one's community after discharge from a state-operated facility depends on smooth and timely transition to community services and supports.Receiving a community-based service within 7 days of discharge is a nationally accepted standard of care that also indicates the local system's community service capacity andcoordination across levels of care. The goal is to increase the percentage. The percentages only include follow-up services paid by Medicaid and state-funds (IPRS).
Eastpointe LME serves the eastern North Carolina counties of Duplin, Sampson, Lenoir, andWayne. Only Wayne is considered urban. Of the 307,000 residents living in this area, 22% areenrolled in Medicaid.
Western Region Central Region Eastern Region
Reduction of Short-Term State Psychiatric Hospital Use:
Overall, the percentage of persons discharged from state hospitals withstays of 7 days or less has decreased over the last 9 quarters. However,for much of this time, the percentage has been above the state average (alower percentage is better for this indicator).
Timely Follow-Up After Discharge From A State Facility:
Overall, the percentage of persons discharged from state hospitals thathave received follow-up care within 7 days of discharge has increased overthe past 9 quarters. It has been above the state average for most of thistime (a higher percentage is better for this indicator).
Overall, the percentage of persons discharged from ADATCs that havereceived follow-up care within 7 days of discharge has increased over thepast 9 quarters from slightly above to well above the state average (ahigher percentage is better for this indicator).
36%23%
38% 42% 37%28%
34% 30% 31%
0%
20%
40%
60%
80%
100%
Q2 Q3 Q4 Q1 Q2 Q3 Q4 Q1 Q2
SFY10 SFY11 SFY12
Pct of Discharges: Length of Stay 7 Days or Less
LME Highest LME State Average Lowest LME
58%48%
56%
41%
58% 62% 63% 64%70%
0%
20%
40%
60%
80%
100%
Q2 Q3 Q4 Q1 Q2 Q3 Q4 Q1 Q2
SFY10 SFY11 SFY12
Pct
of
Per
son
s S
een
W
ith
in 7
Day
s
Timely Follow-Up: Psych Hospitals
LME Highest LME State Average Lowest LME
38%26%
45%32%
45%
70%61%
73%64%
0%
20%
40%
60%
80%
100%
Q2 Q3 Q4 Q1 Q2 Q3 Q4 Q1 Q2
SFY10 SFY11 SFY12
Pct
of
Per
son
s S
een
Wit
hin
7 D
ays
Timely Follow-Up: ADATCs
LME Highest LME State Average Lowest LME
28

NC Division of Mental Health, Developmental Disabilities, and Substance Abuse ServicesAppendices for Community Systems Progress Report: Second Quarter SFY 2011 - 2012
EASTPOINTESo… How Did We Do This Quarter?
Range Among LMEs County
LowestLME
State Average
HighestLME
Duplin Lenoir Sampson Wayne
1. SA Prevention and Early Intervention
Persons in Need Completing Selective and Indicated Programs ↑ 0% 4% 21% 4% <-Data for this indicator is not available at the county level->
2. Timely Access to Care
Urgent ↑ 48% 84% 100% 67% <-Data for this indicator is not available at the county level->
Routine ↑ 37% 72% 98% 49% <-Data for this indicator is not available at the county level->
3. Services to Persons in Need
Adult Mental Health ↑ 31% 50% 74% 64% 54% 74% 51% 69%
Child/Adolescent Mental Health ↑ 34% 55% 80% 67% 50% 93% 53% 70%
Adult Developmental Disabilities ↑ 26% 38% 56% 54% 49% 76% 46% 49%
Child/Adolescent Developmental Disabilities ↑ 12% 19% 33% 21% 16% 26% 17% 23%
Adult Substance Abuse ↑ 6% 12% 16% 12% 8% 17% 9% 14%
Adolescent Substance Abuse ↑ 5% 10% 17% 11% 5% 17% 7% 12%
4. Timely Initiation & Engagement in Service
Mental Health: 2 Visits within 14 Days ↑ 33% 45% 72% 44% 38% 42% 41% 48%
Mental Health: 2 Add'l Visits within Next 30 Days ↑ 17% 29% 41% 24% 19% 16% 25% 28%
Substance Abuse: 2 Visits within 14 Days ↑ 44% 65% 88% 46% 50% 49% 65% 38%
Substance Abuse: 2 Add'l Visits within Next 30 Days ↑ 32% 47% 61% 33% 27% 36% 43% 29%
Mental Health/Developmental Disabilities: 2 Visits within 14 Days ↑ 28% 48% 71% 48% 40% 22% 47% 69%
Mental Health/Developmental Disabilities: 2 Add'l Visits within Next 30 Days ↑ 8% 36% 54% 31% 40% 0% 33% 46%
Mental Health/Substance Abuse: 2 Visits within 14 Days ↑ 42% 63% 91% 61% 71% 49% 57% 66%
Mental Health/Substance Abuse: 2 Add'l Visits within Next 30 Days ↑ 29% 47% 62% 42% 47% 37% 43% 43%
5. Timely Support For Persons With I/DD
First Service within 30 Days of Screening/Triage/Referral ↑ 0% 36% 100% 0% 0% 0% 0%
6. Short-Term Care in State Psychiatric Hospitals
1-7 Days of Care ↓ 0% 20% 38% 31% <-Data for this indicator is not available at the county level->
7. Psychiatric Hospital Readmissions
State Hospitals: Readmitted within 30 Days ↓ 0% 6% 19% 8% <-Data for this indicator is not available at the county level->
State Hospitals: Readmitted within 180 Days ↓ 3% 16% 31% 19% <-Data for this indicator is not available at the county level->
Community Hospitals: Readmitted within 30 Days ↓ 6% 12% 19% 6% 7% 10% 4% 5%
8. Timely Follow-up After Psychiatric Inpatient and Crisis Care
ADATCs: Seen in 1-7 Days ↑ 15% 36% 83% 64% <-Data for this indicator is not available at the county level->
State Hospitals: Seen in 1-7 Days ↑ 17% 53% 90% 70% <-Data for this indicator is not available at the county level->
Community Hospitals: Seen in 1-7 Days ↑ 31% 40% 51% 46% 54% 61% 31% 42%
Crisis Services: Seen in 0-5 Days ↑ 12% 39% 62% 53% 0% 33% 100% 56%
9. Medical Care Coordination
Received a Primary Care/Preventive Health Visit ↑ 87% 91% 94% 91% 93% 90% 93% 91%
* ↑ Goal is to increase the percentage ↓ Goal is to decrease the percentage
Progress Indicator LME
Goa
l*
No new persons were reported this quarter
29

NC Division of Mental Health, Developmental Disabilities, and Substance Abuse ServicesAppendices for Community Systems Progress Report: Second Quarter SFY 2011 - 2012
FIVE COUNTY
Persons Served By Age and Disability During October 2010 - September 2011(Based On Medicaid and State-Funded IPRS Claims Paid Through January 2012)
The above pie charts show the number and percentage of persons served during the most recent 12 month period for which claims data is available. It only includes persons whose services were paid by Medicaid and State-Funds through the Integrated Payment Reporting System.
Reduction of Short-Term State Psychiatric Hospital Use
Timely Follow-Up After Discharge From A State Facility
MH3,501 88%
SA39 1%
DD117 3%
Dual MH/SA100 2%
Dual MH/DD223 6%
Dual DD/SA0
0%
MH/DD/SA6
0%
Youth (Under Age 18): 3,986
MH5,513 70%
SA752 10%
DD297 4%
Dual MH/SA985 12%
Dual MH/DD338 4%
Dual DD/SA2
0%
MH/DD/SA29 0%
Adults (Age 18 and Over): 7,916
Rationale: An adequate community service system should provide short-term inpatientcare in a local hospital in the community. This helps families stay involved and reserveshigh-cost state facility beds for consumers with long-term care needs. Reducing the useof state psychiatric hospitals for short-term care allows more effective and efficient useof funds for community services. The goal is to decrease the percentage.
Rationale: Living successfully in one's community after discharge from a state-operated facility depends on smooth and timely transition to community services and supports.Receiving a community-based service within 7 days of discharge is a nationally accepted standard of care that also indicates the local system's community service capacity andcoordination across levels of care. The goal is to increase the percentage. The percentages only include follow-up services paid by Medicaid and state-funds (IPRS).
Western Region Central Region Eastern Region
Five County Mental Health Authority serves the central North Carolina counties of Franklin,Granville, Halifax, Vance and Warren counties, all of which are rural. Of the 244,000 residentsliving in this area, 23% are enrolled in Medicaid.
Reduction of Short-Term State Psychiatric Hospital Use:
The percentage of persons discharged from state hospitals with stays of7 days or less has cycled up and down over the last 9 quarters showing anoverall slight increase. The percentage is currently slightly above the stateaverage (a lower percentage is better for this indicator).
Timely Follow-Up After Discharge From A State Facility:
Overall, the percentage of persons discharged from state hospitals thathave received follow-up care within 7 days of discharge has cycled up anddown over the past 9 quarters. The percentage has shown a sharp declinein the past 2 quarters and is currently well below the state average (ahigher percentage is better for this indicator).
Overall, the percentage of persons discharged from ADATCs that havereceived follow-up care within 7 days of discharge has decreased over thepast 9 quarters from well above to just at the state average (a higherpercentage is better for this indicator).
23%35%
48%
32%
46%
32%21%
39%28%
0%
20%
40%
60%
80%
100%
Q2 Q3 Q4 Q1 Q2 Q3 Q4 Q1 Q2
SFY10 SFY11 SFY12
Pct of Discharges: Length of Stay 7 Days or Less
LME Highest LME State Average Lowest LME
67%56%
33%44%
57%70% 72%
42%
26%
0%
20%
40%
60%
80%
100%
Q2 Q3 Q4 Q1 Q2 Q3 Q4 Q1 Q2
SFY10 SFY11 SFY12
Pct
of
Per
son
s S
een
W
ith
in 7
Day
s
Timely Follow-Up: Psych Hospitals
LME Highest LME State Average Lowest LME
75% 70%
53%59% 61%
56% 51%
31%38%
0%
20%
40%
60%
80%
100%
Q2 Q3 Q4 Q1 Q2 Q3 Q4 Q1 Q2
SFY10 SFY11 SFY12
Pct
of
Per
son
s S
een
Wit
hin
7 D
ays
Timely Follow-Up: ADATCs
LME Highest LME State Average Lowest LME
30

NC Division of Mental Health, Developmental Disabilities, and Substance Abuse ServicesAppendices for Community Systems Progress Report: Second Quarter SFY 2011 - 2012
FIVE COUNTYSo… How Did We Do This Quarter?
Range Among LMEs County
LowestLME
State Average
HighestLME
Franklin Granville Halifax Vance Warren
1. SA Prevention and Early Intervention
Persons in Need Completing Selective and Indicated Programs ↑ 0% 4% 21% 0% <-Data for this indicator is not available at the county level->
2. Timely Access to Care
Urgent ↑ 48% 84% 100% 100% <-Data for this indicator is not available at the county level->
Routine ↑ 37% 72% 98% 37% <-Data for this indicator is not available at the county level->
3. Services to Persons in Need
Adult Mental Health ↑ 31% 50% 74% 67% 44% 37% 101% 103% 66%
Child/Adolescent Mental Health ↑ 34% 55% 80% 75% 53% 53% 72% 123% 88%
Adult Developmental Disabilities ↑ 26% 38% 56% 42% 23% 26% 72% 55% 43%
Child/Adolescent Developmental Disabilities ↑ 12% 19% 33% 22% 13% 15% 23% 40% 27%
Adult Substance Abuse ↑ 6% 12% 16% 12% 8% 8% 18% 19% 6%
Adolescent Substance Abuse ↑ 5% 10% 17% 13% 10% 8% 10% 26% 14%
4. Timely Initiation & Engagement in Service
Mental Health: 2 Visits within 14 Days ↑ 33% 45% 72% 43% 44% 39% 35% 50% 41%
Mental Health: 2 Add'l Visits within Next 30 Days ↑ 17% 29% 41% 32% 32% 28% 28% 38% 32%
Substance Abuse: 2 Visits within 14 Days ↑ 44% 65% 88% 67% 62% 67% 66% 73% 40%
Substance Abuse: 2 Add'l Visits within Next 30 Days ↑ 32% 47% 61% 54% 49% 50% 63% 57% 40%
Mental Health/Developmental Disabilities: 2 Visits within 14 Days ↑ 28% 48% 71% 31% 17% 21% 46% 25% 67%
Mental Health/Developmental Disabilities: 2 Add'l Visits within Next 30 Days ↑ 8% 36% 54% 23% 17% 14% 38% 8% 67%
Mental Health/Substance Abuse: 2 Visits within 14 Days ↑ 42% 63% 91% 64% 74% 75% 58% 67% 57%
Mental Health/Substance Abuse: 2 Add'l Visits within Next 30 Days ↑ 29% 47% 62% 50% 56% 40% 49% 57% 43%
5. Timely Support For Persons With I/DD
First Service within 30 Days of Screening/Triage/Referral ↑ 0% 36% 100% 0% 0% 0% 0% 0%
6. Short-Term Care in State Psychiatric Hospitals
1-7 Days of Care ↓ 0% 20% 38% 28% <-Data for this indicator is not available at the county level->
7. Psychiatric Hospital Readmissions
State Hospitals: Readmitted within 30 Days ↓ 0% 6% 19% 5% <-Data for this indicator is not available at the county level->
State Hospitals: Readmitted within 180 Days ↓ 3% 16% 31% 11% <-Data for this indicator is not available at the county level->
Community Hospitals: Readmitted within 30 Days ↓ 6% 12% 19% 19% 14% 28% 23% 6% 0%
8. Timely Follow-up After Psychiatric Inpatient and Crisis Care
ADATCs: Seen in 1-7 Days ↑ 15% 36% 83% 38% <-Data for this indicator is not available at the county level->
State Hospitals: Seen in 1-7 Days ↑ 17% 53% 90% 26% <-Data for this indicator is not available at the county level->
Community Hospitals: Seen in 1-7 Days ↑ 31% 40% 51% 35% 63% 39% 27% 30% 25%
Crisis Services: Seen in 0-5 Days ↑ 12% 39% 62% 25% 11% 28% 27% 23% 43%
9. Medical Care Coordination
Received a Primary Care/Preventive Health Visit ↑ 87% 91% 94% 90% 92% 92% 88% 90% 91%
* ↑ Goal is to increase the percentage ↓ Goal is to decrease the percentage
Progress Indicator LME
Goa
l*
31

NC Division of Mental Health, Developmental Disabilities, and Substance Abuse ServicesAppendices for Community Systems Progress Report: Second Quarter SFY 2011 - 2012
GUILFORD CENTER
Persons Served By Age and Disability During October 2010 - September 2011(Based On Medicaid and State-Funded IPRS Claims Paid Through January 2012)
The above pie charts show the number and percentage of persons served during the most recent 12 month period for which claims data is available. It only includes persons whose services were paid by Medicaid and State-Funds through the Integrated Payment Reporting System.
Reduction of Short-Term State Psychiatric Hospital Use
Timely Follow-Up After Discharge From A State Facility
MH4,939 88%
SA50 1%
DD145 2%
Dual MH/SA174 3%
Dual MH/DD320 6%
Dual DD/SA0
0%
MH/DD/SA3
0%
Youth (Under Age 18): 5,631
MH7,803 63%
SA1,222 10%
DD347 3%
Dual MH/SA2,262 18% Dual MH/DD
776 6%
Dual DD/SA2
0%
MH/DD/SA51 0%
Adults (Age 18 and Over): 12,463
Rationale: An adequate community service system should provide short-term inpatientcare in a local hospital in the community. This helps families stay involved and reserveshigh-cost state facility beds for consumers with long-term care needs. Reducing the useof state psychiatric hospitals for short-term care allows more effective and efficient useof funds for community services. The goal is to decrease the percentage.
Rationale: Living successfully in one's community after discharge from a state-operated facility depends on smooth and timely transition to community services and supports.Receiving a community-based service within 7 days of discharge is a nationally accepted standard of care that also indicates the local system's community service capacity andcoordination across levels of care. The goal is to increase the percentage. The percentages only include follow-up services paid by Medicaid and state-funds (IPRS).
Western Region Central Region Eastern Region
Guilford Center LME is a single-county program in the Triad metropolitan area of central NorthCarolina. Of the 498,000 residents living in this urban county, 15% are enrolled in Medicaid.
Reduction of Short-Term State Psychiatric Hospital Use:
Overall, the percentage of persons discharged from state hospitals withstays of 7 days or less has decreased over the last 9 quarters. Thepercentage has been below the state average during most of this period (alower percentage is better for this indicator).
Timely Follow-Up After Discharge From A State Facility:
The percentage of persons discharged from state hospitals that havereceived follow-up care within 7 days of discharge has cycled up and downabove and below the state average over the past 9 quarters. It is currentlyslightly below the state average (a higher percentage is better for thisindicator).
The percentage of persons discharged from ADATCs that have receivedfollow-up care within 7 days of discharge has improved over the past 9quarters and has remained above the state average for most of this period(a higher percentage is better for this indicator).
19% 22% 27% 31%
17%25%
9% 14% 11%
0%
20%
40%
60%
80%
100%
Q2 Q3 Q4 Q1 Q2 Q3 Q4 Q1 Q2
SFY10 SFY11 SFY12
Pct of Discharges: Length of Stay 7 Days or Less
LME Highest LME State Average Lowest LME
62%
44%
59% 59%46% 42% 44%
59%49%
0%
20%
40%
60%
80%
100%
Q2 Q3 Q4 Q1 Q2 Q3 Q4 Q1 Q2
SFY10 SFY11 SFY12
Pct
of
Per
son
s S
een
W
ith
in 7
Day
s
Timely Follow-Up: Psych Hospitals
LME Highest LME State Average Lowest LME
48% 50% 51%40%
80%
45%55%
23%
56%
0%
20%
40%
60%
80%
100%
Q2 Q3 Q4 Q1 Q2 Q3 Q4 Q1 Q2
SFY10 SFY11 SFY12
Pct
of
Per
son
s S
een
Wit
hin
7 D
ays
Timely Follow-Up: ADATCs
LME Highest LME State Average Lowest LME
32

NC Division of Mental Health, Developmental Disabilities, and Substance Abuse ServicesAppendices for Community Systems Progress Report: Second Quarter SFY 2011 - 2012
GUILFORD CENTERSo… How Did We Do This Quarter?
Range Among LMEs County
LowestLME
State Average
HighestLME
Guilford
1. SA Prevention and Early Intervention
Persons in Need Completing Selective and Indicated Programs ↑ 0% 4% 21% 2% <-Data for this indicator is not available at the county level->
2. Timely Access to Care
Urgent ↑ 48% 84% 100% 92% <-Data for this indicator is not available at the county level->
Routine ↑ 37% 72% 98% 81% <-Data for this indicator is not available at the county level->
3. Services to Persons in Need
Adult Mental Health ↑ 31% 50% 74% 53% 53%
Child/Adolescent Mental Health ↑ 34% 55% 80% 52% 52%
Adult Developmental Disabilities ↑ 26% 38% 56% 38% 38%
Child/Adolescent Developmental Disabilities ↑ 12% 19% 33% 15% 15%
Adult Substance Abuse ↑ 6% 12% 16% 11% 11%
Adolescent Substance Abuse ↑ 5% 10% 17% 10% 10%
4. Timely Initiation & Engagement in Service
Mental Health: 2 Visits within 14 Days ↑ 33% 45% 72% 49% 49%
Mental Health: 2 Add'l Visits within Next 30 Days ↑ 17% 29% 41% 33% 33%
Substance Abuse: 2 Visits within 14 Days ↑ 44% 65% 88% 77% 77%
Substance Abuse: 2 Add'l Visits within Next 30 Days ↑ 32% 47% 61% 54% 54%
Mental Health/Developmental Disabilities: 2 Visits within 14 Days ↑ 28% 48% 71% 71% 71%
Mental Health/Developmental Disabilities: 2 Add'l Visits within Next 30 Days ↑ 8% 36% 54% 54% 54%
Mental Health/Substance Abuse: 2 Visits within 14 Days ↑ 42% 63% 91% 67% 67%
Mental Health/Substance Abuse: 2 Add'l Visits within Next 30 Days ↑ 29% 47% 62% 53% 53%
5. Timely Support For Persons With I/DD
First Service within 30 Days of Screening/Triage/Referral ↑ 0% 36% 100% 43% 43%
6. Short-Term Care in State Psychiatric Hospitals
1-7 Days of Care ↓ 0% 20% 38% 11% <-Data for this indicator is not available at the county level->
7. Psychiatric Hospital Readmissions
State Hospitals: Readmitted within 30 Days ↓ 0% 6% 19% 9% <-Data for this indicator is not available at the county level->
State Hospitals: Readmitted within 180 Days ↓ 3% 16% 31% 24% <-Data for this indicator is not available at the county level->
Community Hospitals: Readmitted within 30 Days ↓ 6% 12% 19% 16% 16%
8. Timely Follow-up After Psychiatric Inpatient and Crisis Care
ADATCs: Seen in 1-7 Days ↑ 15% 36% 83% 56% <-Data for this indicator is not available at the county level->
State Hospitals: Seen in 1-7 Days ↑ 17% 53% 90% 49% <-Data for this indicator is not available at the county level->
Community Hospitals: Seen in 1-7 Days ↑ 31% 40% 51% 45% 45%
Crisis Services: Seen in 0-5 Days ↑ 12% 39% 62% 62% 62%
9. Medical Care Coordination
Received a Primary Care/Preventive Health Visit ↑ 87% 91% 94% 88% 88%
* ↑ Goal is to increase the percentage ↓ Goal is to decrease the percentage
Progress Indicator LME
Goa
l*
33

NC Division of Mental Health, Developmental Disabilities, and Substance Abuse ServicesAppendices for Community Systems Progress Report: Second Quarter SFY 2011 - 2012
JOHNSTON COUNTY AREA MENTAL HEALTH AUTHORITY
Persons Served By Age and Disability During October 2010 - September 2011(Based On Medicaid and State-Funded IPRS Claims Paid Through January 2012)
The above pie charts show the number and percentage of persons served during the most recent 12 month period for which claims data is available. It only includes persons whose services were paid by Medicaid and State-Funds through the Integrated Payment Reporting System.
Reduction of Short-Term State Psychiatric Hospital Use
Timely Follow-Up After Discharge From A State Facility
MH1,841 85%
SA6
0%
DD99 5%
Dual MH/SA62 3%
Dual MH/DD147 7%
Dual DD/SA0
0%
MH/DD/SA1
0%
Youth (Under Age 18): 2,156
MH2,805 60%
SA218 5%
DD119 2%
Dual MH/SA1,412 30%
Dual MH/DD141 3%
Dual DD/SA1
0%
MH/DD/SA13 0%
Adults (Age 18 and Over): 4,709
Rationale: An adequate community service system should provide short-term inpatientcare in a local hospital in the community. This helps families stay involved and reserveshigh-cost state facility beds for consumers with long-term care needs. Reducing the useof state psychiatric hospitals for short-term care allows more effective and efficient useof funds for community services. The goal is to decrease the percentage.
Rationale: Living successfully in one's community after discharge from a state-operated facility depends on smooth and timely transition to community services and supports.Receiving a community-based service within 7 days of discharge is a nationally accepted standard of care that also indicates the local system's community service capacity andcoordination across levels of care. The goal is to increase the percentage. The percentages only include follow-up services paid by Medicaid and state-funds (IPRS).
Western Region Central Region Eastern Region
Johnston County LME is a single-county program in eastern North Carolina. Of the 175,000residents living in this urban county, 17% are enrolled in Medicaid.
Reduction of Short-Term State Psychiatric Hospital Use:
Overall, the percentage of persons discharged from state hospitals withstays of 7 days or less has decreased over the last 9 quarters from wellabove to just at the state average (a lower percentage is better for thisindicator).
Timely Follow-Up After Discharge From A State Facility:
Overall, the percentage of persons discharged from state hospitals thathave received follow-up care within 7 days of discharge has cycled up anddown over the past 9 quarters. It is currently well above the state average(a higher percentage is better for this indicator).
The percentage of persons discharged from ADATCs that have receivedfollow-up care within 7 days of discharge has cycled up and down over thepast 9 quarters and is currently well above the state average (a higherpercentage is better for this indicator).
75%
35%29%
0%
27% 23%
0%
50%
20%
0%
20%
40%
60%
80%
100%
Q2 Q3 Q4 Q1 Q2 Q3 Q4 Q1 Q2
SFY10 SFY11 SFY12
Pct of Discharges: Length of Stay 7 Days or Less
LME Highest LME State Average Lowest LME
53%64%
77%
93%
60%53%
45%
67%
83%
0%
20%
40%
60%
80%
100%
Q2 Q3 Q4 Q1 Q2 Q3 Q4 Q1 Q2
SFY10 SFY11 SFY12
Pct
of
Per
son
s S
een
W
ith
in 7
Day
s
Timely Follow-Up: Psych Hospitals
LME Highest LME State Average Lowest LME
63%50%
100%
80%
57%44%
100% 100%
83%
0%
20%
40%
60%
80%
100%
Q2 Q3 Q4 Q1 Q2 Q3 Q4 Q1 Q2
SFY10 SFY11 SFY12
Pct
of
Per
son
s S
een
Wit
hin
7 D
ays
Timely Follow-Up: ADATCs
LME Highest LME State Average Lowest LME
34

NC Division of Mental Health, Developmental Disabilities, and Substance Abuse ServicesAppendices for Community Systems Progress Report: Second Quarter SFY 2011 - 2012
JOHNSTONSo… How Did We Do This Quarter?
Range Among LMEs County
LowestLME
State Average
HighestLME
Johnston
1. SA Prevention and Early Intervention
Persons in Need Completing Selective and Indicated Programs ↑ 0% 4% 21% 2% <-Data for this indicator is not available at the county level->
2. Timely Access to Care
Urgent ↑ 48% 84% 100% 90% <-Data for this indicator is not available at the county level->
Routine ↑ 37% 72% 98% 71% <-Data for this indicator is not available at the county level->
3. Services to Persons in Need
Adult Mental Health ↑ 31% 50% 74% 62% 62%
Child/Adolescent Mental Health ↑ 34% 55% 80% 50% 50%
Adult Developmental Disabilities ↑ 26% 38% 56% 26% 26%
Child/Adolescent Developmental Disabilities ↑ 12% 19% 33% 20% 20%
Adult Substance Abuse ↑ 6% 12% 16% 16% 16%
Adolescent Substance Abuse ↑ 5% 10% 17% 8% 8%
4. Timely Initiation & Engagement in Service
Mental Health: 2 Visits within 14 Days ↑ 33% 45% 72% 40% 40%
Mental Health: 2 Add'l Visits within Next 30 Days ↑ 17% 29% 41% 22% 22%
Substance Abuse: 2 Visits within 14 Days ↑ 44% 65% 88% 65% 65%
Substance Abuse: 2 Add'l Visits within Next 30 Days ↑ 32% 47% 61% 54% 54%
Mental Health/Developmental Disabilities: 2 Visits within 14 Days ↑ 28% 48% 71% 55% 55%
Mental Health/Developmental Disabilities: 2 Add'l Visits within Next 30 Days ↑ 8% 36% 54% 45% 45%
Mental Health/Substance Abuse: 2 Visits within 14 Days ↑ 42% 63% 91% 54% 54%
Mental Health/Substance Abuse: 2 Add'l Visits within Next 30 Days ↑ 29% 47% 62% 32% 32%
5. Timely Support For Persons With I/DD
First Service within 30 Days of Screening/Triage/Referral ↑ 0% 36% 100% 100% 100%
6. Short-Term Care in State Psychiatric Hospitals
1-7 Days of Care ↓ 0% 20% 38% 20% <-Data for this indicator is not available at the county level->
7. Psychiatric Hospital Readmissions
State Hospitals: Readmitted within 30 Days ↓ 0% 6% 19% 18% <-Data for this indicator is not available at the county level->
State Hospitals: Readmitted within 180 Days ↓ 3% 16% 31% 18% <-Data for this indicator is not available at the county level->
Community Hospitals: Readmitted within 30 Days ↓ 6% 12% 19% 10% 10%
8. Timely Follow-up After Psychiatric Inpatient and Crisis Care
ADATCs: Seen in 1-7 Days ↑ 15% 36% 83% 83% <-Data for this indicator is not available at the county level->
State Hospitals: Seen in 1-7 Days ↑ 17% 53% 90% 83% <-Data for this indicator is not available at the county level->
Community Hospitals: Seen in 1-7 Days ↑ 31% 40% 51% 46% 46%
Crisis Services: Seen in 0-5 Days ↑ 12% 39% 62% 50% 50%
9. Medical Care Coordination
Received a Primary Care/Preventive Health Visit ↑ 87% 91% 94% 90% 90%
* ↑ Goal is to increase the percentage ↓ Goal is to decrease the percentage
Progress Indicator LME
Goa
l*
35

NC Division of Mental Health, Developmental Disabilities, and Substance Abuse ServicesAppendices for Community Systems Progress Report: Second Quarter SFY 2011 - 2012
MECKLENBURG COUNTY AREA MH/DD/SA AUTHORITY
Persons Served By Age and Disability During October 2010 - September 2011(Based On Medicaid and State-Funded IPRS Claims Paid Through January 2012)
The above pie charts show the number and percentage of persons served during the most recent 12 month period for which claims data is available. It only includes persons whose services were paid by Medicaid and State-Funds through the Integrated Payment Reporting System.
Reduction of Short-Term State Psychiatric Hospital Use
Timely Follow-Up After Discharge From A State Facility
MH9,329 85%
SA77 0%
DD535 5%
Dual MH/SA310 3%
Dual MH/DD740 7%
Dual DD/SA0
0%MH/DD/SA
13 0%
Youth (Under Age 18): 11,004
MH7,854 52%
SA2,152 14%
DD685 4%
Dual MH/SA3,309 22%
Dual MH/DD1,142 7%
Dual DD/SA3
0%
MH/DD/SA92 1%
Adults (Age 18 and Over): 15,237
Rationale: An adequate community service system should provide short-term inpatientcare in a local hospital in the community. This helps families stay involved and reserveshigh-cost state facility beds for consumers with long-term care needs. Reducing the useof state psychiatric hospitals for short-term care allows more effective and efficient useof funds for community services. The goal is to decrease the percentage.
Rationale: Living successfully in one's community after discharge from a state-operated facility depends on smooth and timely transition to community services and supports.Receiving a community-based service within 7 days of discharge is a nationally accepted standard of care that also indicates the local system's community service capacity andcoordination across levels of care. The goal is to increase the percentage. The percentages only include follow-up services paid by Medicaid and state-funds (IPRS).
Western Region Central Region Eastern Region
Mecklenburg County Area MH/DD/SA Authority is a single-county program that comprises thecenter of the Charlotte metropolitan area in western North Carolina. Of the 941,000 residentsliving in this urban county, 15% are enrolled in Medicaid.
Reduction of Short-Term State Psychiatric Hospital Use:
Overall, the percentage of persons discharged from state hospitals withstays of 7 days or less has decreased over the last 9 quarters. It hasremained below the state average most of this time (a lower percentage isbetter for this indicator).
Timely Follow-Up After Discharge From A State Facility:
The percentage of persons discharged from state hospitals that havereceived follow-up care within 7 days of discharge has cycled up and downover the past 9 quarters remaining overall the same at slightly below thestate average (a higher percentage is better for this indicator).
The percentage of persons discharged from ADATCs that have receivedfollow-up care within 7 days of discharge significantly increased thensteadily decreased over the past 9 quarters to its initial level at thebeginning of this period. Except for 2 quarters, the percentage has beenbelow the state average (a higher percentage is better for this indicator).
19%8%
23% 26% 21%30%
10%
24%
6%
0%
20%
40%
60%
80%
100%
Q2 Q3 Q4 Q1 Q2 Q3 Q4 Q1 Q2
SFY10 SFY11 SFY12
Pct of Discharges: Length of Stay 7 Days or Less
LME Highest LME State Average Lowest LME
47% 51%
30%
66%
48%36% 36%
50% 48%
0%
20%
40%
60%
80%
100%
Q2 Q3 Q4 Q1 Q2 Q3 Q4 Q1 Q2
SFY10 SFY11 SFY12
Pct
of
Per
son
s S
een
W
ith
in 7
Day
s
Timely Follow-Up: Psych Hospitals
LME Highest LME State Average Lowest LME
19%10%
42% 40%27%
34%
20% 21% 19%
0%
20%
40%
60%
80%
100%
Q2 Q3 Q4 Q1 Q2 Q3 Q4 Q1 Q2
SFY10 SFY11 SFY12
Pct
of
Per
son
s S
een
Wit
hin
7 D
ays
Timely Follow-Up: ADATCs
LME Highest LME State Average Lowest LME
36
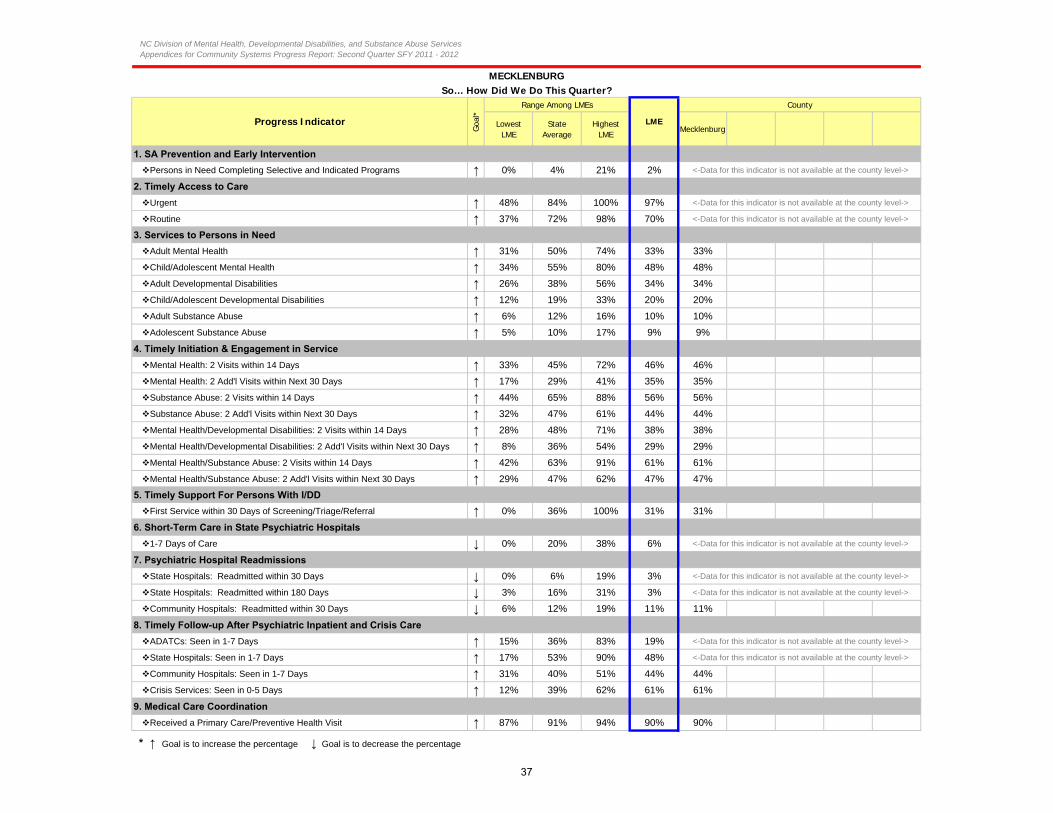
NC Division of Mental Health, Developmental Disabilities, and Substance Abuse ServicesAppendices for Community Systems Progress Report: Second Quarter SFY 2011 - 2012
MECKLENBURGSo… How Did We Do This Quarter?
Range Among LMEs County
LowestLME
State Average
HighestLME
Mecklenburg
1. SA Prevention and Early Intervention
Persons in Need Completing Selective and Indicated Programs ↑ 0% 4% 21% 2% <-Data for this indicator is not available at the county level->
2. Timely Access to Care
Urgent ↑ 48% 84% 100% 97% <-Data for this indicator is not available at the county level->
Routine ↑ 37% 72% 98% 70% <-Data for this indicator is not available at the county level->
3. Services to Persons in Need
Adult Mental Health ↑ 31% 50% 74% 33% 33%
Child/Adolescent Mental Health ↑ 34% 55% 80% 48% 48%
Adult Developmental Disabilities ↑ 26% 38% 56% 34% 34%
Child/Adolescent Developmental Disabilities ↑ 12% 19% 33% 20% 20%
Adult Substance Abuse ↑ 6% 12% 16% 10% 10%
Adolescent Substance Abuse ↑ 5% 10% 17% 9% 9%
4. Timely Initiation & Engagement in Service
Mental Health: 2 Visits within 14 Days ↑ 33% 45% 72% 46% 46%
Mental Health: 2 Add'l Visits within Next 30 Days ↑ 17% 29% 41% 35% 35%
Substance Abuse: 2 Visits within 14 Days ↑ 44% 65% 88% 56% 56%
Substance Abuse: 2 Add'l Visits within Next 30 Days ↑ 32% 47% 61% 44% 44%
Mental Health/Developmental Disabilities: 2 Visits within 14 Days ↑ 28% 48% 71% 38% 38%
Mental Health/Developmental Disabilities: 2 Add'l Visits within Next 30 Days ↑ 8% 36% 54% 29% 29%
Mental Health/Substance Abuse: 2 Visits within 14 Days ↑ 42% 63% 91% 61% 61%
Mental Health/Substance Abuse: 2 Add'l Visits within Next 30 Days ↑ 29% 47% 62% 47% 47%
5. Timely Support For Persons With I/DD
First Service within 30 Days of Screening/Triage/Referral ↑ 0% 36% 100% 31% 31%
6. Short-Term Care in State Psychiatric Hospitals
1-7 Days of Care ↓ 0% 20% 38% 6% <-Data for this indicator is not available at the county level->
7. Psychiatric Hospital Readmissions
State Hospitals: Readmitted within 30 Days ↓ 0% 6% 19% 3% <-Data for this indicator is not available at the county level->
State Hospitals: Readmitted within 180 Days ↓ 3% 16% 31% 3% <-Data for this indicator is not available at the county level->
Community Hospitals: Readmitted within 30 Days ↓ 6% 12% 19% 11% 11%
8. Timely Follow-up After Psychiatric Inpatient and Crisis Care
ADATCs: Seen in 1-7 Days ↑ 15% 36% 83% 19% <-Data for this indicator is not available at the county level->
State Hospitals: Seen in 1-7 Days ↑ 17% 53% 90% 48% <-Data for this indicator is not available at the county level->
Community Hospitals: Seen in 1-7 Days ↑ 31% 40% 51% 44% 44%
Crisis Services: Seen in 0-5 Days ↑ 12% 39% 62% 61% 61%
9. Medical Care Coordination
Received a Primary Care/Preventive Health Visit ↑ 87% 91% 94% 90% 90%
* ↑ Goal is to increase the percentage ↓ Goal is to decrease the percentage
Progress Indicator LME
Goa
l*
37

NC Division of Mental Health, Developmental Disabilities, and Substance Abuse ServicesAppendices for Community Systems Progress Report: Second Quarter SFY 2011 - 2012
MENTAL HEALTH PARTNERS
Persons Served By Age and Disability During October 2010 - September 2011(Based On Medicaid and State-Funded IPRS Claims Paid Through January 2012)
The above pie charts show the number and percentage of persons served during the most recent 12 month period for which claims data is available. It only includes persons whose services were paid by Medicaid and State-Funds through the Integrated Payment Reporting System.
Reduction of Short-Term State Psychiatric Hospital Use
Timely Follow-Up After Discharge From A State Facility
MH3,043 91%
SA14 0%
DD119 4%
Dual MH/SA47 1%
Dual MH/DD135 4%
Dual DD/SA0
0%
MH/DD/SA0
0%
Youth (Under Age 18): 3,358
MH4,606 63%
SA964 13%
DD256 4%
Dual MH/SA1,096 15%
Dual MH/DD341 5%
Dual DD/SA0
0%
MH/DD/SA13 0%
Adults (Age 18 and Over): 7,276
Rationale: An adequate community service system should provide short-term inpatientcare in a local hospital in the community. This helps families stay involved and reserveshigh-cost state facility beds for consumers with long-term care needs. Reducing the useof state psychiatric hospitals for short-term care allows more effective and efficient useof funds for community services. The goal is to decrease the percentage.
Rationale: Living successfully in one's community after discharge from a state-operated facility depends on smooth and timely transition to community services and supports.Receiving a community-based service within 7 days of discharge is a nationally accepted standard of care that also indicates the local system's community service capacity andcoordination across levels of care. The goal is to increase the percentage. The percentages only include follow-up services paid by Medicaid and state-funds (IPRS).
Western Region Central Region Eastern Region
Mental Health Partners LME serves two counties in western North Carolina. Burke is a ruralcounty and Catawba is urban. Of the 247,000 residents living in this area, 17% are enrolled inMedicaid.
Reduction of Short-Term State Psychiatric Hospital Use:
The percentage of persons discharged from state hospitals with stays of7 days or less initially increased then steadily decreased over the last 9quarters remaining at or below the state average during this period (a lowerpercentage is better for this indicator).
Timely Follow-Up After Discharge From A State Facility:
The percentage of persons discharged from state hospitals that havereceived follow-up care within 7 days of discharge cycled up and down overthe first half of the past 9 quarters then steadily decreased over the secondhalf of this period. It is currently below the state average (a higherpercentage is better for this indicator).
The percentage of persons discharged from ADATCs that have receivedfollow-up care within 7 days of discharge cycled up and down over the firsthalf of the past quarters, then steadily decreased over the second half ofthis period. It is currently at the state average (a higher percentage isbetter for this indicator).
16%26% 27% 31%
15%22% 19% 21% 19%
0%
20%
40%
60%
80%
100%
Q2 Q3 Q4 Q1 Q2 Q3 Q4 Q1 Q2
SFY10 SFY11 SFY12
Pct of Discharges: Length of Stay 7 Days or Less
LME Highest LME State Average Lowest LME
51%44%
71%
50%42%
62% 59%48%
39%
0%
20%
40%
60%
80%
100%
Q2 Q3 Q4 Q1 Q2 Q3 Q4 Q1 Q2
SFY10 SFY11 SFY12
Pct
of
Per
son
s S
een
W
ith
in 7
Day
s
Timely Follow-Up: Psych Hospitals
LME Highest LME State Average Lowest LME
35%
60%
13%
38%27%
46% 44% 41% 38%
0%
20%
40%
60%
80%
100%
Q2 Q3 Q4 Q1 Q2 Q3 Q4 Q1 Q2
SFY10 SFY11 SFY12
Pct
of
Per
son
s S
een
Wit
hin
7 D
ays
Timely Follow-Up: ADATCs
LME Highest LME State Average Lowest LME
38

NC Division of Mental Health, Developmental Disabilities, and Substance Abuse ServicesAppendices for Community Systems Progress Report: Second Quarter SFY 2011 - 2012
MENTAL HEALTH PARTNERSSo… How Did We Do This Quarter?
Range Among LMEs County
LowestLME
State Average
HighestLME
Burke Catawba
1. SA Prevention and Early Intervention
Persons in Need Completing Selective and Indicated Programs ↑ 0% 4% 21% 0% <-Data for this indicator is not available at the county level->
2. Timely Access to Care
Urgent ↑ 48% 84% 100% 86% <-Data for this indicator is not available at the county level->
Routine ↑ 37% 72% 98% 50% <-Data for this indicator is not available at the county level->
3. Services to Persons in Need
Adult Mental Health ↑ 31% 50% 74% 59% 62% 57%
Child/Adolescent Mental Health ↑ 34% 55% 80% 63% 71% 58%
Adult Developmental Disabilities ↑ 26% 38% 56% 39% 45% 35%
Child/Adolescent Developmental Disabilities ↑ 12% 19% 33% 16% 21% 14%
Adult Substance Abuse ↑ 6% 12% 16% 14% 12% 15%
Adolescent Substance Abuse ↑ 5% 10% 17% 5% 3% 7%
4. Timely Initiation & Engagement in Service
Mental Health: 2 Visits within 14 Days ↑ 33% 45% 72% 40% 46% 37%
Mental Health: 2 Add'l Visits within Next 30 Days ↑ 17% 29% 41% 22% 27% 19%
Substance Abuse: 2 Visits within 14 Days ↑ 44% 65% 88% 70% 68% 71%
Substance Abuse: 2 Add'l Visits within Next 30 Days ↑ 32% 47% 61% 59% 52% 61%
Mental Health/Developmental Disabilities: 2 Visits within 14 Days ↑ 28% 48% 71% 40% 44% 36%
Mental Health/Developmental Disabilities: 2 Add'l Visits within Next 30 Days ↑ 8% 36% 54% 30% 33% 27%
Mental Health/Substance Abuse: 2 Visits within 14 Days ↑ 42% 63% 91% 68% 72% 66%
Mental Health/Substance Abuse: 2 Add'l Visits within Next 30 Days ↑ 29% 47% 62% 57% 59% 56%
5. Timely Support For Persons With I/DD
First Service within 30 Days of Screening/Triage/Referral ↑ 0% 36% 100% 36% 60% 17%
6. Short-Term Care in State Psychiatric Hospitals
1-7 Days of Care ↓ 0% 20% 38% 19% <-Data for this indicator is not available at the county level->
7. Psychiatric Hospital Readmissions
State Hospitals: Readmitted within 30 Days ↓ 0% 6% 19% 3% <-Data for this indicator is not available at the county level->
State Hospitals: Readmitted within 180 Days ↓ 3% 16% 31% 16% <-Data for this indicator is not available at the county level->
Community Hospitals: Readmitted within 30 Days ↓ 6% 12% 19% 16% 22% 10%
8. Timely Follow-up After Psychiatric Inpatient and Crisis Care
ADATCs: Seen in 1-7 Days ↑ 15% 36% 83% 38% <-Data for this indicator is not available at the county level->
State Hospitals: Seen in 1-7 Days ↑ 17% 53% 90% 39% <-Data for this indicator is not available at the county level->
Community Hospitals: Seen in 1-7 Days ↑ 31% 40% 51% 31% 28% 33%
Crisis Services: Seen in 0-5 Days ↑ 12% 39% 62% 20% 26% 14%
9. Medical Care Coordination
Received a Primary Care/Preventive Health Visit ↑ 87% 91% 94% 92% 92% 92%
* ↑ Goal is to increase the percentage ↓ Goal is to decrease the percentage
Progress Indicator LME
Goa
l*
39

NC Division of Mental Health, Developmental Disabilities, and Substance Abuse ServicesAppendices for Community Systems Progress Report: Second Quarter SFY 2011 - 2012
ONSLOW-CARTERET BEHAVIORAL HEALTHCARE SERVICES
Persons Served By Age and Disability During October 2010 - September 2011(Based On Medicaid and State-Funded IPRS Claims Paid Through January 2012)
The above pie charts show the number and percentage of persons served during the most recent 12 month period for which claims data is available. It only includes persons whose services were paid by Medicaid and State-Funds through the Integrated Payment Reporting System.
Reduction of Short-Term State Psychiatric Hospital Use
Timely Follow-Up After Discharge From A State Facility
MH1,937 88%
SA15 1%
DD65 3%
Dual MH/SA41 2%
Dual MH/DD146 6%
Dual DD/SA0
0%
MH/DD/SA1
0%
Youth (Under Age 18): 2,205
MH4,215 74%
SA464 8%
DD138 2%
Dual MH/SA597 11%
Dual MH/DD258 5%
Dual DD/SA2
0%
MH/DD/SA10 0%
Adults (Age 18 and Over): 5,684
Rationale: An adequate community service system should provide short-term inpatientcare in a local hospital in the community. This helps families stay involved and reserveshigh-cost state facility beds for consumers with long-term care needs. Reducing the useof state psychiatric hospitals for short-term care allows more effective and efficient useof funds for community services. The goal is to decrease the percentage.
Rationale: Living successfully in one's community after discharge from a state-operated facility depends on smooth and timely transition to community services and supports.Receiving a community-based service within 7 days of discharge is a nationally accepted standard of care that also indicates the local system's community service capacity andcoordination across levels of care. The goal is to increase the percentage. The percentages only include follow-up services paid by Medicaid and state-funds (IPRS).
Western Region Central Region Eastern Region
Onslow-Carteret Behavioral Healthcare Services LME serves two counties in eastern NorthCarolina. Only Carteret is considered rural. Of the 252,000 residents living in this area, 11% areenrolled in Medicaid.
Reduction of Short-Term State Psychiatric Hospital Use:
Overall, the percentage of persons discharged from state hospitals withstays of 7 days or less has decreased over the past 9 quarters but hasremained higher than the state average during this period (a lowerpercentage is better for this indicator).
Timely Follow-Up After Discharge From A State Facility:
The percentage of persons discharged from state hospitals that havereceived follow-up care within 7 days of discharge has fluctuated up anddown over the past 9 quarters. Overall, it has decreased and is currentlywell below the state average (a higher percentage is better for thisindicator).
The percentage of persons discharged from ADATCs that have receivedfollow-up care within 7 days of discharge has cycled up and down over thepast 9 quarters. It is currently below the state average (a higherpercentage is better for this indicator).
73%
42% 46%
60%
33%40% 35% 33% 36%
0%
20%
40%
60%
80%
100%
Q2 Q3 Q4 Q1 Q2 Q3 Q4 Q1 Q2
SFY10 SFY11 SFY12
Pct of Discharges: Length of Stay 7 Days or Less
LME Highest LME State Average Lowest LME
45%
78%
40%33%
75%
56% 58%
24%17%
0%
20%
40%
60%
80%
100%
Q2 Q3 Q4 Q1 Q2 Q3 Q4 Q1 Q2
SFY10 SFY11 SFY12
Pct
of
Per
son
s S
een
W
ith
in 7
Day
s
Timely Follow-Up: Psych Hospitals
LME Highest LME State Average Lowest LME
33%46% 44%
14%20%
38% 44%50%
18%
0%
20%
40%
60%
80%
100%
Q2 Q3 Q4 Q1 Q2 Q3 Q4 Q1 Q2
SFY10 SFY11 SFY12
Pct
of
Per
son
s S
een
Wit
hin
7 D
ays
Timely Follow-Up: ADATCs
LME Highest LME State Average Lowest LME
40

NC Division of Mental Health, Developmental Disabilities, and Substance Abuse ServicesAppendices for Community Systems Progress Report: Second Quarter SFY 2011 - 2012
ONSLOW-CARTERETSo… How Did We Do This Quarter?
Range Among LMEs County
LowestLME
State Average
HighestLME
Carteret Onslow
1. SA Prevention and Early Intervention
Persons in Need Completing Selective and Indicated Programs ↑ 0% 4% 21% 3% <-Data for this indicator is not available at the county level->
2. Timely Access to Care
Urgent ↑ 48% 84% 100% 72% <-Data for this indicator is not available at the county level->
Routine ↑ 37% 72% 98% 62% <-Data for this indicator is not available at the county level->
3. Services to Persons in Need
Adult Mental Health ↑ 31% 50% 74% 50% 60% 46%
Child/Adolescent Mental Health ↑ 34% 55% 80% 38% 50% 34%
Adult Developmental Disabilities ↑ 26% 38% 56% 27% 36% 23%
Child/Adolescent Developmental Disabilities ↑ 12% 19% 33% 12% 14% 12%
Adult Substance Abuse ↑ 6% 12% 16% 6% 12% 4%
Adolescent Substance Abuse ↑ 5% 10% 17% 6% 9% 4%
4. Timely Initiation & Engagement in Service
Mental Health: 2 Visits within 14 Days ↑ 33% 45% 72% 45% 47% 44%
Mental Health: 2 Add'l Visits within Next 30 Days ↑ 17% 29% 41% 27% 27% 28%
Substance Abuse: 2 Visits within 14 Days ↑ 44% 65% 88% 70% 67% 73%
Substance Abuse: 2 Add'l Visits within Next 30 Days ↑ 32% 47% 61% 59% 54% 65%
Mental Health/Developmental Disabilities: 2 Visits within 14 Days ↑ 28% 48% 71% 52% 56% 50%
Mental Health/Developmental Disabilities: 2 Add'l Visits within Next 30 Days ↑ 8% 36% 54% 31% 33% 30%
Mental Health/Substance Abuse: 2 Visits within 14 Days ↑ 42% 63% 91% 67% 74% 61%
Mental Health/Substance Abuse: 2 Add'l Visits within Next 30 Days ↑ 29% 47% 62% 47% 53% 42%
5. Timely Support For Persons With I/DD
First Service within 30 Days of Screening/Triage/Referral ↑ 0% 36% 100% 22% 33% 11%
6. Short-Term Care in State Psychiatric Hospitals
1-7 Days of Care ↓ 0% 20% 38% 36% <-Data for this indicator is not available at the county level->
7. Psychiatric Hospital Readmissions
State Hospitals: Readmitted within 30 Days ↓ 0% 6% 19% 12% <-Data for this indicator is not available at the county level->
State Hospitals: Readmitted within 180 Days ↓ 3% 16% 31% 12% <-Data for this indicator is not available at the county level->
Community Hospitals: Readmitted within 30 Days ↓ 6% 12% 19% 10% 9% 11%
8. Timely Follow-up After Psychiatric Inpatient and Crisis Care
ADATCs: Seen in 1-7 Days ↑ 15% 36% 83% 18% <-Data for this indicator is not available at the county level->
State Hospitals: Seen in 1-7 Days ↑ 17% 53% 90% 17% <-Data for this indicator is not available at the county level->
Community Hospitals: Seen in 1-7 Days ↑ 31% 40% 51% 41% 38% 43%
Crisis Services: Seen in 0-5 Days ↑ 12% 39% 62% 24% 33% 14%
9. Medical Care Coordination
Received a Primary Care/Preventive Health Visit ↑ 87% 91% 94% 91% 92% 91%
* ↑ Goal is to increase the percentage ↓ Goal is to decrease the percentage
Progress Indicator LME
Goa
l*
41

NC Division of Mental Health, Developmental Disabilities, and Substance Abuse ServicesAppendices for Community Systems Progress Report: Second Quarter SFY 2011 - 2012
ORANGE-PERSON-CHATHAM MH/DD/SA AUTHORITY
Persons Served By Age and Disability During October 2010 - September 2011(Based On Medicaid and State-Funded IPRS Claims Paid Through January 2012)
The above pie charts show the number and percentage of persons served during the most recent 12 month period for which claims data is available. It only includes persons whose services were paid by Medicaid and State-Funds through the Integrated Payment Reporting System.
Reduction of Short-Term State Psychiatric Hospital Use
Timely Follow-Up After Discharge From A State Facility
MH1,991 84%
SA14 1%
DD146 6%
Dual MH/SA45 2%
Dual MH/DD168 7%
Dual DD/SA0
0%
MH/DD/SA2
0%
Youth (Under Age 18): 2,366
MH2,722 61%
SA774 17%
DD324 7%
Dual MH/SA409 9% Dual MH/DD
256 6%
Dual DD/SA4
0%
MH/DD/SA11 0%
Adults (Age 18 and Over): 4,500
Rationale: An adequate community service system should provide short-term inpatientcare in a local hospital in the community. This helps families stay involved and reserveshigh-cost state facility beds for consumers with long-term care needs. Reducing the useof state psychiatric hospitals for short-term care allows more effective and efficient useof funds for community services. The goal is to decrease the percentage.
Rationale: Living successfully in one's community after discharge from a state-operated facility depends on smooth and timely transition to community services and supports.Receiving a community-based service within 7 days of discharge is a nationally accepted standard of care that also indicates the local system's community service capacity andcoordination across levels of care. The goal is to increase the percentage. The percentages only include follow-up services paid by Medicaid and state-funds (IPRS).
Western Region Central Region Eastern Region
Orange-Person-Chatham MH/DD/SA Authority serves three counties in central North Carolina.Only Orange County is considered urban. Of the 242,000 residents living in this area, 11% areenrolled in Medicaid.
Reduction of Short-Term State Psychiatric Hospital Use:
The percentage of persons discharged from state hospitals with stays of7 days or less has cycled above and below the state average over the last9 quarters, decreasing overall. It is currently above the state average (alower percentage is better for this indicator).
Timely Follow-Up After Discharge From A State Facility:
The percentage of persons discharged from state hospitals that havereceived follow-up care within 7 days of discharge has cycled up and downover the past 9 quarters. It is currently on an up cycle and is above thestate average (a higher percentage is better for this indicator).
The percentage of persons discharged from ADATCs that have receivedfollow-up care within 7 days of discharge has generally decreased over thepast 9 quarters. However, except for one quarter, the percentage hasremained above the state average (a higher percentage is better for thisindicator).
36%
57%
19%29%
40%
18% 14%26% 31%
0%
20%
40%
60%
80%
100%
Q2 Q3 Q4 Q1 Q2 Q3 Q4 Q1 Q2
SFY10 SFY11 SFY12
Pct of Discharges: Length of Stay 7 Days or Less
LME Highest LME State Average Lowest LME
59% 61%
89%
73%
43%
58%
41%
57%65%
0%
20%
40%
60%
80%
100%
Q2 Q3 Q4 Q1 Q2 Q3 Q4 Q1 Q2
SFY10 SFY11 SFY12
Pct
of
Per
son
s S
een
W
ith
in 7
Day
s
Timely Follow-Up: Psych Hospitals
LME Highest LME State Average Lowest LME
58%50%
63%75%
62% 58%
27%
50% 53%
0%
20%
40%
60%
80%
100%
Q2 Q3 Q4 Q1 Q2 Q3 Q4 Q1 Q2
SFY10 SFY11 SFY12
Pct
of
Per
son
s S
een
Wit
hin
7 D
ays
Timely Follow-Up: ADATCs
LME Highest LME State Average Lowest LME
42
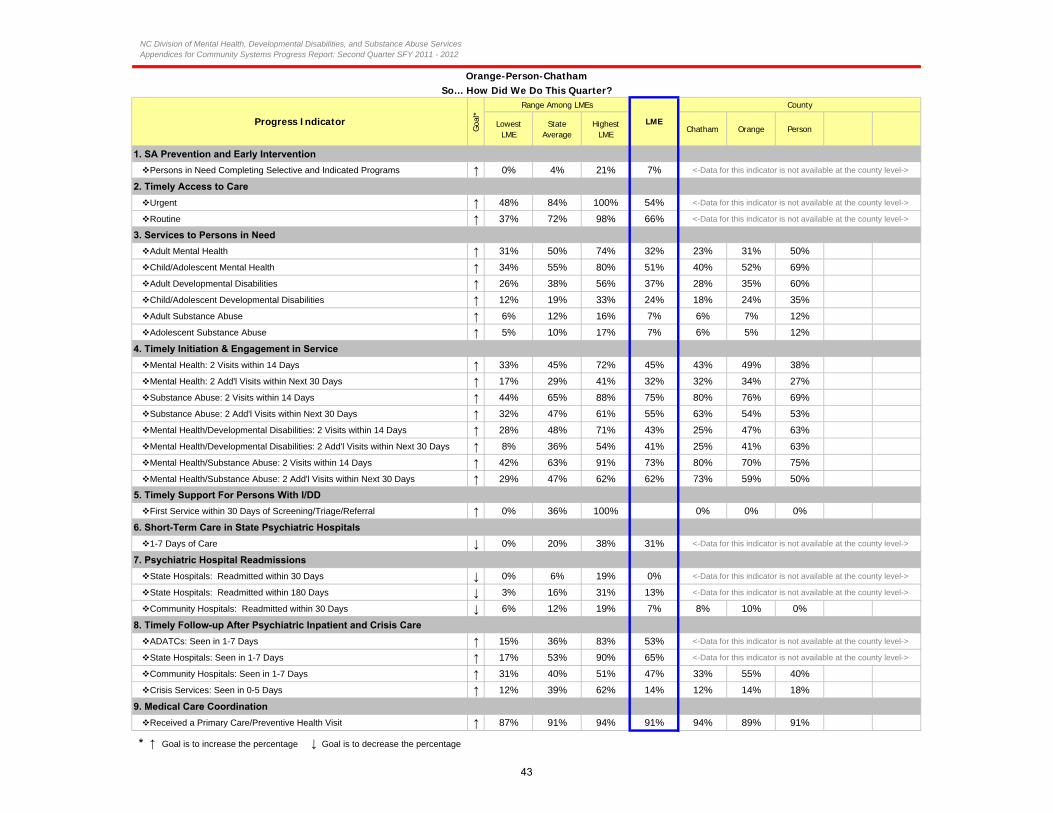
NC Division of Mental Health, Developmental Disabilities, and Substance Abuse ServicesAppendices for Community Systems Progress Report: Second Quarter SFY 2011 - 2012
Orange-Person-ChathamSo… How Did We Do This Quarter?
Range Among LMEs County
LowestLME
State Average
HighestLME
Chatham Orange Person
1. SA Prevention and Early Intervention
Persons in Need Completing Selective and Indicated Programs ↑ 0% 4% 21% 7% <-Data for this indicator is not available at the county level->
2. Timely Access to Care
Urgent ↑ 48% 84% 100% 54% <-Data for this indicator is not available at the county level->
Routine ↑ 37% 72% 98% 66% <-Data for this indicator is not available at the county level->
3. Services to Persons in Need
Adult Mental Health ↑ 31% 50% 74% 32% 23% 31% 50%
Child/Adolescent Mental Health ↑ 34% 55% 80% 51% 40% 52% 69%
Adult Developmental Disabilities ↑ 26% 38% 56% 37% 28% 35% 60%
Child/Adolescent Developmental Disabilities ↑ 12% 19% 33% 24% 18% 24% 35%
Adult Substance Abuse ↑ 6% 12% 16% 7% 6% 7% 12%
Adolescent Substance Abuse ↑ 5% 10% 17% 7% 6% 5% 12%
4. Timely Initiation & Engagement in Service
Mental Health: 2 Visits within 14 Days ↑ 33% 45% 72% 45% 43% 49% 38%
Mental Health: 2 Add'l Visits within Next 30 Days ↑ 17% 29% 41% 32% 32% 34% 27%
Substance Abuse: 2 Visits within 14 Days ↑ 44% 65% 88% 75% 80% 76% 69%
Substance Abuse: 2 Add'l Visits within Next 30 Days ↑ 32% 47% 61% 55% 63% 54% 53%
Mental Health/Developmental Disabilities: 2 Visits within 14 Days ↑ 28% 48% 71% 43% 25% 47% 63%
Mental Health/Developmental Disabilities: 2 Add'l Visits within Next 30 Days ↑ 8% 36% 54% 41% 25% 41% 63%
Mental Health/Substance Abuse: 2 Visits within 14 Days ↑ 42% 63% 91% 73% 80% 70% 75%
Mental Health/Substance Abuse: 2 Add'l Visits within Next 30 Days ↑ 29% 47% 62% 62% 73% 59% 50%
5. Timely Support For Persons With I/DD
First Service within 30 Days of Screening/Triage/Referral ↑ 0% 36% 100% 0% 0% 0%
6. Short-Term Care in State Psychiatric Hospitals
1-7 Days of Care ↓ 0% 20% 38% 31% <-Data for this indicator is not available at the county level->
7. Psychiatric Hospital Readmissions
State Hospitals: Readmitted within 30 Days ↓ 0% 6% 19% 0% <-Data for this indicator is not available at the county level->
State Hospitals: Readmitted within 180 Days ↓ 3% 16% 31% 13% <-Data for this indicator is not available at the county level->
Community Hospitals: Readmitted within 30 Days ↓ 6% 12% 19% 7% 8% 10% 0%
8. Timely Follow-up After Psychiatric Inpatient and Crisis Care
ADATCs: Seen in 1-7 Days ↑ 15% 36% 83% 53% <-Data for this indicator is not available at the county level->
State Hospitals: Seen in 1-7 Days ↑ 17% 53% 90% 65% <-Data for this indicator is not available at the county level->
Community Hospitals: Seen in 1-7 Days ↑ 31% 40% 51% 47% 33% 55% 40%
Crisis Services: Seen in 0-5 Days ↑ 12% 39% 62% 14% 12% 14% 18%
9. Medical Care Coordination
Received a Primary Care/Preventive Health Visit ↑ 87% 91% 94% 91% 94% 89% 91%
* ↑ Goal is to increase the percentage ↓ Goal is to decrease the percentage
Progress Indicator LME
Goa
l*
43

NC Division of Mental Health, Developmental Disabilities, and Substance Abuse ServicesAppendices for Community Systems Progress Report: Second Quarter SFY 2011 - 2012
PATHWAYS
Persons Served By Age and Disability During October 2010 - September 2011(Based On Medicaid and State-Funded IPRS Claims Paid Through January 2012)
The above pie charts show the number and percentage of persons served during the most recent 12 month period for which claims data is available. It only includes persons whose services were paid by Medicaid and State-Funds through the Integrated Payment Reporting System.
Reduction of Short-Term State Psychiatric Hospital Use
Timely Follow-Up After Discharge From A State Facility
MH5,656 86%
SA34 0%
DD250 4%
Dual MH/SA184 3%
Dual MH/DD458 7%
Dual DD/SA0
0%
MH/DD/SA3
0%
Youth (Under Age 18): 6,585
MH8,187 62%
SA942 7%
DD510 4%
Dual MH/SA2,792 21%
Dual MH/DD811 6%
Dual DD/SA7
0%
MH/DD/SA35 0%
Adults (Age 18 and Over): 13,284
Rationale: An adequate community service system should provide short-term inpatientcare in a local hospital in the community. This helps families stay involved and reserveshigh-cost state facility beds for consumers with long-term care needs. Reducing the useof state psychiatric hospitals for short-term care allows more effective and efficient useof funds for community services. The goal is to decrease the percentage.
Rationale: Living successfully in one's community after discharge from a state-operated facility depends on smooth and timely transition to community services and supports.Receiving a community-based service within 7 days of discharge is a nationally accepted standard of care that also indicates the local system's community service capacity andcoordination across levels of care. The goal is to increase the percentage. The percentages only include follow-up services paid by Medicaid and state-funds (IPRS).
Pathways MH/DD/SA LME serves the western North Carolina counties of Cleveland, Gaston andLincoln. Of the 386,000 residents living in these urban counties, 20% are enrolled in Medicaid.
Western Region Central Region Eastern Region
Reduction of Short-Term State Psychiatric Hospital Use:
Overall, despite a few upward fluctuations, the percentage of personsdischarged from state hospitals with stays of 7 days or less decreased overthe past 9 quarters. The percentage has remained below the state averagefor most of this time (a lower percentage is better for this indicator).
Timely Follow-Up After Discharge From A State Facility:
The percentage of persons discharged from state hospitals that receivedfollow-up care within 7 days of discharge has cycled up and down over thepast 9 quarters above and below the state average. The percentage iscurrently at the state average (a higher percentage is better for thisindicator).
Overall, the percentage of persons discharged from ADATCs that havereceived follow-up care within 7 days of discharge has cycled up and downover the past 9 quarters, mostly below the state average (a higherpercentage is better for this indicator).
29%23% 23%
33%
0%
25%
0% 0%
38%
0%
20%
40%
60%
80%
100%
Q2 Q3 Q4 Q1 Q2 Q3 Q4 Q1 Q2
SFY10 SFY11 SFY12
Pct of Discharges: Length of Stay 7 Days or Less
LME Highest LME State Average Lowest LME
43%
62% 67%75% 80%
29%38%
57%50%
0%
20%
40%
60%
80%
100%
Q2 Q3 Q4 Q1 Q2 Q3 Q4 Q1 Q2
SFY10 SFY11 SFY12
Pct
of
Per
son
s S
een
W
ith
in 7
Day
s
Timely Follow-Up: Psych Hospitals
LME Highest LME State Average Lowest LME
28% 29%
42% 41%
25%38% 37%
22%29%
0%
20%
40%
60%
80%
100%
Q2 Q3 Q4 Q1 Q2 Q3 Q4 Q1 Q2
SFY10 SFY11 SFY12
Pct
of
Per
son
s S
een
Wit
hin
7 D
ays
Timely Follow-Up: ADATCs
LME Highest LME State Average Lowest LME
44

NC Division of Mental Health, Developmental Disabilities, and Substance Abuse ServicesAppendices for Community Systems Progress Report: Second Quarter SFY 2011 - 2012
PATHWAYSSo… How Did We Do This Quarter?
Range Among LMEs County
LowestLME
State Average
HighestLME
Cleveland Gaston Lincoln
1. SA Prevention and Early Intervention
Persons in Need Completing Selective and Indicated Programs ↑ 0% 4% 21% 0% <-Data for this indicator is not available at the county level->
2. Timely Access to Care
Urgent ↑ 48% 84% 100% 93% <-Data for this indicator is not available at the county level->
Routine ↑ 37% 72% 98% 71% <-Data for this indicator is not available at the county level->
3. Services to Persons in Need
Adult Mental Health ↑ 31% 50% 74% 74% 88% 77% 49%
Child/Adolescent Mental Health ↑ 34% 55% 80% 76% 104% 72% 52%
Adult Developmental Disabilities ↑ 26% 38% 56% 56% 77% 52% 41%
Child/Adolescent Developmental Disabilities ↑ 12% 19% 33% 29% 35% 28% 22%
Adult Substance Abuse ↑ 6% 12% 16% 16% 17% 18% 12%
Adolescent Substance Abuse ↑ 5% 10% 17% 12% 18% 10% 10%
4. Timely Initiation & Engagement in Service
Mental Health: 2 Visits within 14 Days ↑ 33% 45% 72% 38% 41% 38% 34%
Mental Health: 2 Add'l Visits within Next 30 Days ↑ 17% 29% 41% 28% 31% 29% 19%
Substance Abuse: 2 Visits within 14 Days ↑ 44% 65% 88% 66% 69% 63% 71%
Substance Abuse: 2 Add'l Visits within Next 30 Days ↑ 32% 47% 61% 56% 63% 52% 60%
Mental Health/Developmental Disabilities: 2 Visits within 14 Days ↑ 28% 48% 71% 47% 22% 61% 42%
Mental Health/Developmental Disabilities: 2 Add'l Visits within Next 30 Days ↑ 8% 36% 54% 38% 11% 55% 25%
Mental Health/Substance Abuse: 2 Visits within 14 Days ↑ 42% 63% 91% 59% 55% 65% 45%
Mental Health/Substance Abuse: 2 Add'l Visits within Next 30 Days ↑ 29% 47% 62% 47% 40% 53% 35%
5. Timely Support For Persons With I/DD
First Service within 30 Days of Screening/Triage/Referral ↑ 0% 36% 100% 68% 50% 67% 78%
6. Short-Term Care in State Psychiatric Hospitals
1-7 Days of Care ↓ 0% 20% 38% 38% <-Data for this indicator is not available at the county level->
7. Psychiatric Hospital Readmissions
State Hospitals: Readmitted within 30 Days ↓ 0% 6% 19% 11% <-Data for this indicator is not available at the county level->
State Hospitals: Readmitted within 180 Days ↓ 3% 16% 31% 22% <-Data for this indicator is not available at the county level->
Community Hospitals: Readmitted within 30 Days ↓ 6% 12% 19% 10% 9% 12% 4%
8. Timely Follow-up After Psychiatric Inpatient and Crisis Care
ADATCs: Seen in 1-7 Days ↑ 15% 36% 83% 29% <-Data for this indicator is not available at the county level->
State Hospitals: Seen in 1-7 Days ↑ 17% 53% 90% 50% <-Data for this indicator is not available at the county level->
Community Hospitals: Seen in 1-7 Days ↑ 31% 40% 51% 34% 42% 34% 18%
Crisis Services: Seen in 0-5 Days ↑ 12% 39% 62% 50% 40% 59% 41%
9. Medical Care Coordination
Received a Primary Care/Preventive Health Visit ↑ 87% 91% 94% 92% 93% 92% 94%
* ↑ Goal is to increase the percentage ↓ Goal is to decrease the percentage
Progress Indicator LME
Goa
l*
45

NC Division of Mental Health, Developmental Disabilities, and Substance Abuse ServicesAppendices for Community Systems Progress Report: Second Quarter SFY 2011 - 2012
PBH
Persons Served By Age and Disability During October 2010 - September 2011(Based On Medicaid and State-Funded IPRS Claims Paid Through January 2012)
The above pie charts show the number and percentage of persons served during the most recent 12 month period for which claims data is available. It only includes persons whose services were paid by Medicaid and State-Funds through the Integrated Payment Reporting System.
Reduction of Short-Term State Psychiatric Hospital Use
Timely Follow-Up After Discharge From A State Facility
MH5,199 84%
SA125 2%
DD308 5%
Dual MH/SA214 3%
Dual MH/DD355 6%
Dual DD/SA9
0%
MH/DD/SA9
0%
Youth (Under Age 18): 6,219
MH9,365 58%
SA3,169 20%
DD729 5%
Dual MH/SA2,272 14%
Dual MH/DD450 3%
Dual DD/SA16 0%
MH/DD/SA15 0%
Adults (Age 18 and Over): 16,016
Rationale: An adequate community service system should provide short-term inpatientcare in a local hospital in the community. This helps families stay involved and reserveshigh-cost state facility beds for consumers with long-term care needs. Reducing the useof state psychiatric hospitals for short-term care allows more effective and efficient useof funds for community services. The goal is to decrease the percentage.
Rationale: Living successfully in one's community after discharge from a state-operated facility depends on smooth and timely transition to community services and supports.Receiving a community-based service within 7 days of discharge is a nationally accepted standard of care that also indicates the local system's community service capacity andcoordination across levels of care. The goal is to increase the percentage. The percentages only include follow-up services paid by Medicaid and state-funds (IPRS).
Western Region Central Region Eastern Region
PBH LME serves five counties in western North Carolina, only one of which is considered rural.Of the 757,000 residents living in this area, 15% are enrolled in Medicaid.
Reduction of Short-Term State Psychiatric Hospital Use:
Overall, the percentage of persons discharged from state hospitals withstays of 7 days or less has decreased over the past 9 quarters. Thepercentage has remained below the state average during this time (a lowerpercentage is better for this indicator).
Timely Follow-Up After Discharge From A State Facility:
Overall, the percentage of persons discharged from state hospitals thathave received follow-up care within 7 days of discharge has increased overthe past 9 quarters. The percentage has remained above the state average(a higher percentage is better for this indicator) during this period.
The percentage of persons discharged from ADATCs that have receivedfollow-up care within 7 days of discharge has fluctuated up and down overthe past 9 quarters, decreasing overall. The percentage is currently slightlybelow the state average (a higher percentage is better for this indicator).
16% 12%
33%
11%21%
8%16% 19%
0%0%
20%
40%
60%
80%
100%
Q2 Q3 Q4 Q1 Q2 Q3 Q4 Q1 Q2
SFY10 SFY11 SFY12
Pct of Discharges: Length of Stay 7 Days or Less
LME Highest LME State Average Lowest LME
76%70%
76%67% 63% 66% 61%
88% 90%
0%
20%
40%
60%
80%
100%
Q2 Q3 Q4 Q1 Q2 Q3 Q4 Q1 Q2
SFY10 SFY11 SFY12
Pct
of
Per
son
s S
een
W
ith
in 7
Day
s
Timely Follow-Up: Psych Hospitals
LME Highest LME State Average Lowest LME
50%40%
75%
50%
25%33%
0%
67%
33%
0%
20%
40%
60%
80%
100%
Q2 Q3 Q4 Q1 Q2 Q3 Q4 Q1 Q2
SFY10 SFY11 SFY12
Pct
of
Per
son
s S
een
Wit
hin
7 D
ays
Timely Follow-Up: ADATCs
LME Highest LME State Average Lowest LME
46

NC Division of Mental Health, Developmental Disabilities, and Substance Abuse ServicesAppendices for Community Systems Progress Report: Second Quarter SFY 2011 - 2012
PBHSo… How Did We Do This Quarter?
Range Among LMEs County
LowestLME
State Average
HighestLME
Cabarrus Davidson Rowan Stanly Union
1. SA Prevention and Early Intervention
Persons in Need Completing Selective and Indicated Programs ↑ 0% 4% 21% 1% <-Data for this indicator is not available at the county level->
2. Timely Access to Care
Urgent ↑ 48% 84% 100% 96% <-Data for this indicator is not available at the county level->
Routine ↑ 37% 72% 98% 85% <-Data for this indicator is not available at the county level->
3. Services to Persons in Need
Adult Mental Health ↑ 31% 50% 74% 39% 40% 41% 45% 69% 23%
Child/Adolescent Mental Health ↑ 34% 55% 80% 34% 35% 29% 49% 61% 20%
Adult Developmental Disabilities ↑ 26% 38% 56% 27% 29% 23% 29% 47% 21%
Child/Adolescent Developmental Disabilities ↑ 12% 19% 33% 13% 16% 9% 17% 20% 10%
Adult Substance Abuse ↑ 6% 12% 16% 12% 13% 12% 16% 16% 8%
Adolescent Substance Abuse ↑ 5% 10% 17% 9% 10% 8% 15% 16% 5%
4. Timely Initiation & Engagement in Service
Mental Health: 2 Visits within 14 Days ↑ 33% 45% 72% 72% 66% 81% 72% 73% 69%
Mental Health: 2 Add'l Visits within Next 30 Days ↑ 17% 29% 41% 32% 30% 31% 34% 34% 29%
Substance Abuse: 2 Visits within 14 Days ↑ 44% 65% 88% 88% 85% 91% 89% 86% 89%
Substance Abuse: 2 Add'l Visits within Next 30 Days ↑ 32% 47% 61% 40% 41% 32% 47% 43% 41%
Mental Health/Developmental Disabilities: 2 Visits within 14 Days ↑ 28% 48% 71% 46% 50% 60% 50% 40% 25%
Mental Health/Developmental Disabilities: 2 Add'l Visits within Next 30 Days ↑ 8% 36% 54% 8% 0% 0% 0% 20% 25%
Mental Health/Substance Abuse: 2 Visits within 14 Days ↑ 42% 63% 91% 91% 78% 94% 94% 91% 88%
Mental Health/Substance Abuse: 2 Add'l Visits within Next 30 Days ↑ 29% 47% 62% 40% 44% 24% 55% 48% 50%
5. Timely Support For Persons With I/DD
First Service within 30 Days of Screening/Triage/Referral ↑ 0% 36% 100% 0% 0% 0% 0% 0%
6. Short-Term Care in State Psychiatric Hospitals
1-7 Days of Care ↓ 0% 20% 38% 0% <-Data for this indicator is not available at the county level->
7. Psychiatric Hospital Readmissions
State Hospitals: Readmitted within 30 Days ↓ 0% 6% 19% 19% <-Data for this indicator is not available at the county level->
State Hospitals: Readmitted within 180 Days ↓ 3% 16% 31% 31% <-Data for this indicator is not available at the county level->
Community Hospitals: Readmitted within 30 Days ↓ 6% 12% 19% NA
8. Timely Follow-up After Psychiatric Inpatient and Crisis Care
ADATCs: Seen in 1-7 Days ↑ 15% 36% 83% 33% <-Data for this indicator is not available at the county level->
State Hospitals: Seen in 1-7 Days ↑ 17% 53% 90% 90% <-Data for this indicator is not available at the county level->
Community Hospitals: Seen in 1-7 Days ↑ 31% 40% 51% NA 0% 0% 0% 0%
Crisis Services: Seen in 0-5 Days ↑ 12% 39% 62% NA 0% 0% 0% 0% 0%
9. Medical Care Coordination
Received a Primary Care/Preventive Health Visit ↑ 87% 91% 94% 90% 90% 92% 89% 90% 90%
* ↑ Goal is to increase the percentage ↓ Goal is to decrease the percentage
Progress Indicator LME
Goa
l*
Under development. Data not yet available
Under development. Data not yet available
Under development. Data not yet available
47
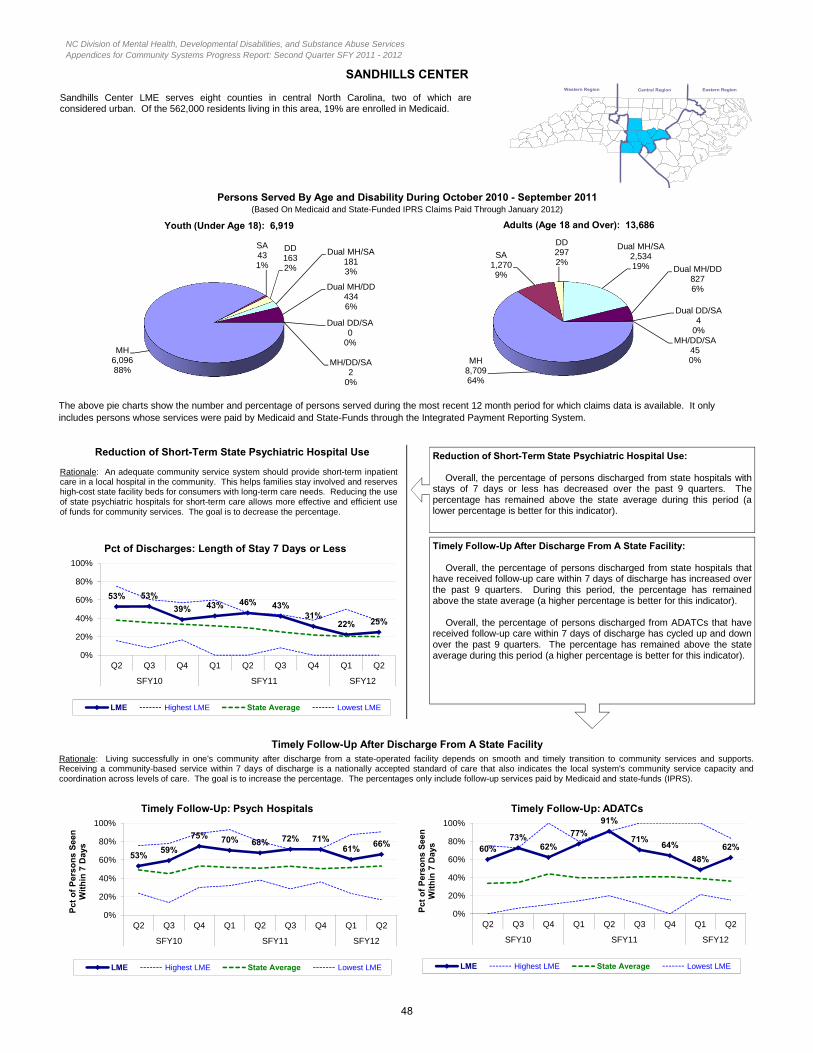
NC Division of Mental Health, Developmental Disabilities, and Substance Abuse ServicesAppendices for Community Systems Progress Report: Second Quarter SFY 2011 - 2012
SANDHILLS CENTER
Persons Served By Age and Disability During October 2010 - September 2011(Based On Medicaid and State-Funded IPRS Claims Paid Through January 2012)
The above pie charts show the number and percentage of persons served during the most recent 12 month period for which claims data is available. It only includes persons whose services were paid by Medicaid and State-Funds through the Integrated Payment Reporting System.
Reduction of Short-Term State Psychiatric Hospital Use
Timely Follow-Up After Discharge From A State Facility
MH6,096 88%
SA43 1%
DD163 2%
Dual MH/SA181 3%
Dual MH/DD434 6%
Dual DD/SA0
0%
MH/DD/SA2
0%
Youth (Under Age 18): 6,919
MH8,709 64%
SA1,270 9%
DD297 2%
Dual MH/SA2,534 19% Dual MH/DD
827 6%
Dual DD/SA4
0%MH/DD/SA
45 0%
Adults (Age 18 and Over): 13,686
Rationale: An adequate community service system should provide short-term inpatientcare in a local hospital in the community. This helps families stay involved and reserveshigh-cost state facility beds for consumers with long-term care needs. Reducing the useof state psychiatric hospitals for short-term care allows more effective and efficient useof funds for community services. The goal is to decrease the percentage.
Rationale: Living successfully in one's community after discharge from a state-operated facility depends on smooth and timely transition to community services and supports.Receiving a community-based service within 7 days of discharge is a nationally accepted standard of care that also indicates the local system's community service capacity andcoordination across levels of care. The goal is to increase the percentage. The percentages only include follow-up services paid by Medicaid and state-funds (IPRS).
Western Region Central Region Eastern Region
Sandhills Center LME serves eight counties in central North Carolina, two of which areconsidered urban. Of the 562,000 residents living in this area, 19% are enrolled in Medicaid.
Reduction of Short-Term State Psychiatric Hospital Use:
Overall, the percentage of persons discharged from state hospitals withstays of 7 days or less has decreased over the past 9 quarters. Thepercentage has remained above the state average during this period (alower percentage is better for this indicator).
Timely Follow-Up After Discharge From A State Facility:
Overall, the percentage of persons discharged from state hospitals thathave received follow-up care within 7 days of discharge has increased overthe past 9 quarters. During this period, the percentage has remainedabove the state average (a higher percentage is better for this indicator).
Overall, the percentage of persons discharged from ADATCs that havereceived follow-up care within 7 days of discharge has cycled up and downover the past 9 quarters. The percentage has remained above the stateaverage during this period (a higher percentage is better for this indicator).
53% 53%
39% 43% 46% 43%31%
22% 25%
0%
20%
40%
60%
80%
100%
Q2 Q3 Q4 Q1 Q2 Q3 Q4 Q1 Q2
SFY10 SFY11 SFY12
Pct of Discharges: Length of Stay 7 Days or Less
LME Highest LME State Average Lowest LME
53%59%
75% 70% 68% 72% 71%61%
66%
0%
20%
40%
60%
80%
100%
Q2 Q3 Q4 Q1 Q2 Q3 Q4 Q1 Q2
SFY10 SFY11 SFY12
Pct
of
Per
son
s S
een
W
ith
in 7
Day
s
Timely Follow-Up: Psych Hospitals
LME Highest LME State Average Lowest LME
60%73%
62%
77%
91%
71%64%
48%
62%
0%
20%
40%
60%
80%
100%
Q2 Q3 Q4 Q1 Q2 Q3 Q4 Q1 Q2
SFY10 SFY11 SFY12
Pct
of
Per
son
s S
een
Wit
hin
7 D
ays
Timely Follow-Up: ADATCs
LME Highest LME State Average Lowest LME
48

NC Division of Mental Health, Developmental Disabilities, and Substance Abuse ServicesAppendices for Community Systems Progress Report: Second Quarter SFY 2011 - 2012
SANDHILLS CENTERSo… How Did We Do This Quarter?
Range Among LMEs County
LowestLME
State Average
HighestLME
Anson Harnett Hoke Lee Montgomery
1. SA Prevention and Early Intervention
Persons in Need Completing Selective and Indicated Programs ↑ 0% 4% 21% 1% <-Data for this indicator is not available at the county level->
2. Timely Access to Care
Urgent ↑ 48% 84% 100% 77% <-Data for this indicator is not available at the county level->
Routine ↑ 37% 72% 98% 70% <-Data for this indicator is not available at the county level->
3. Services to Persons in Need
Adult Mental Health ↑ 31% 50% 74% 53% 69% 41% 41% 53% 57%
Child/Adolescent Mental Health ↑ 34% 55% 80% 54% 90% 43% 54% 49% 58%
Adult Developmental Disabilities ↑ 26% 38% 56% 34% 56% 29% 29% 36% 37%
Child/Adolescent Developmental Disabilities ↑ 12% 19% 33% 16% 35% 9% 20% 16% 10%
Adult Substance Abuse ↑ 6% 12% 16% 11% 15% 8% 7% 14% 11%
Adolescent Substance Abuse ↑ 5% 10% 17% 8% 10% 7% 3% 10% 6%
4. Timely Initiation & Engagement in Service
Mental Health: 2 Visits within 14 Days ↑ 33% 45% 72% 47% 56% 49% 53% 43% 35%
Mental Health: 2 Add'l Visits within Next 30 Days ↑ 17% 29% 41% 32% 48% 33% 33% 27% 24%
Substance Abuse: 2 Visits within 14 Days ↑ 44% 65% 88% 61% 52% 62% 58% 69% 56%
Substance Abuse: 2 Add'l Visits within Next 30 Days ↑ 32% 47% 61% 46% 44% 53% 42% 54% 50%
Mental Health/Developmental Disabilities: 2 Visits within 14 Days ↑ 28% 48% 71% 57% 22% 57% 80% 86% 60%
Mental Health/Developmental Disabilities: 2 Add'l Visits within Next 30 Days ↑ 8% 36% 54% 48% 22% 43% 80% 71% 40%
Mental Health/Substance Abuse: 2 Visits within 14 Days ↑ 42% 63% 91% 66% 57% 69% 55% 70% 71%
Mental Health/Substance Abuse: 2 Add'l Visits within Next 30 Days ↑ 29% 47% 62% 48% 47% 53% 40% 48% 53%
5. Timely Support For Persons With I/DD
First Service within 30 Days of Screening/Triage/Referral ↑ 0% 36% 100% 0% 0% 0% 0% 0% 0%
6. Short-Term Care in State Psychiatric Hospitals
1-7 Days of Care ↓ 0% 20% 38% 25% <-Data for this indicator is not available at the county level->
7. Psychiatric Hospital Readmissions
State Hospitals: Readmitted within 30 Days ↓ 0% 6% 19% 6% <-Data for this indicator is not available at the county level->
State Hospitals: Readmitted within 180 Days ↓ 3% 16% 31% 10% <-Data for this indicator is not available at the county level->
Community Hospitals: Readmitted within 30 Days ↓ 6% 12% 19% 10% 23% 0% 18% 7% 20%
8. Timely Follow-up After Psychiatric Inpatient and Crisis Care
ADATCs: Seen in 1-7 Days ↑ 15% 36% 83% 62% <-Data for this indicator is not available at the county level->
State Hospitals: Seen in 1-7 Days ↑ 17% 53% 90% 66% <-Data for this indicator is not available at the county level->
Community Hospitals: Seen in 1-7 Days ↑ 31% 40% 51% 46% 33% 41% 42% 42% 35%
Crisis Services: Seen in 0-5 Days ↑ 12% 39% 62% 40% 80% 28% 100% 23% 33%
9. Medical Care Coordination
Received a Primary Care/Preventive Health Visit ↑ 87% 91% 94% 92% 88% 93% 91% 91% 93%
* ↑ Goal is to increase the percentage ↓ Goal is to decrease the percentage
Progress Indicator LME
Goa
l*
49

NC Division of Mental Health, Developmental Disabilities, and Substance Abuse ServicesAppendices for Community Systems Progress Report: Second Quarter SFY 2011 - 2012
SANDHILLS CENTERSo… How Did We Do This Quarter?
Range Among LMEs County
LowestLME
State Average
HighestLME
Moore Randolph Richmond
1. SA Prevention and Early Intervention
Persons in Need Completing Selective and Indicated Programs ↑ 0% 4% 21% 1% <-Data for this indicator is not available at the county level->
2. Timely Access to Care
Urgent ↑ 48% 84% 100% 77% <-Data for this indicator is not available at the county level->
Routine ↑ 37% 72% 98% 70% <-Data for this indicator is not available at the county level->
3. Services to Persons in Need
Adult Mental Health ↑ 31% 50% 74% 53% 43% 60% 75%
Child/Adolescent Mental Health ↑ 34% 55% 80% 54% 41% 54% 90%
Adult Developmental Disabilities ↑ 26% 38% 56% 34% 36% 30% 46%
Child/Adolescent Developmental Disabilities ↑ 12% 19% 33% 16% 20% 12% 30%
Adult Substance Abuse ↑ 6% 12% 16% 11% 12% 12% 15%
Adolescent Substance Abuse ↑ 5% 10% 17% 8% 10% 8% 16%
4. Timely Initiation & Engagement in Service
Mental Health: 2 Visits within 14 Days ↑ 33% 45% 72% 47% 41% 47% 53%
Mental Health: 2 Add'l Visits within Next 30 Days ↑ 17% 29% 41% 32% 25% 30% 38%
Substance Abuse: 2 Visits within 14 Days ↑ 44% 65% 88% 61% 65% 63% 44%
Substance Abuse: 2 Add'l Visits within Next 30 Days ↑ 32% 47% 61% 46% 55% 36% 23%
Mental Health/Developmental Disabilities: 2 Visits within 14 Days ↑ 28% 48% 71% 57% 31% 63% 73%
Mental Health/Developmental Disabilities: 2 Add'l Visits within Next 30 Days ↑ 8% 36% 54% 48% 25% 63% 45%
Mental Health/Substance Abuse: 2 Visits within 14 Days ↑ 42% 63% 91% 66% 60% 69% 69%
Mental Health/Substance Abuse: 2 Add'l Visits within Next 30 Days ↑ 29% 47% 62% 48% 47% 47% 54%
5. Timely Support For Persons With I/DD
First Service within 30 Days of Screening/Triage/Referral ↑ 0% 36% 100% 0% 0% 0% 0%
6. Short-Term Care in State Psychiatric Hospitals
1-7 Days of Care ↓ 0% 20% 38% 25% <-Data for this indicator is not available at the county level->
7. Psychiatric Hospital Readmissions
State Hospitals: Readmitted within 30 Days ↓ 0% 6% 19% 6% <-Data for this indicator is not available at the county level->
State Hospitals: Readmitted within 180 Days ↓ 3% 16% 31% 10% <-Data for this indicator is not available at the county level->
Community Hospitals: Readmitted within 30 Days ↓ 6% 12% 19% 10% 3% 16% 8%
8. Timely Follow-up After Psychiatric Inpatient and Crisis Care
ADATCs: Seen in 1-7 Days ↑ 15% 36% 83% 62% <-Data for this indicator is not available at the county level->
State Hospitals: Seen in 1-7 Days ↑ 17% 53% 90% 66% <-Data for this indicator is not available at the county level->
Community Hospitals: Seen in 1-7 Days ↑ 31% 40% 51% 46% 51% 62% 30%
Crisis Services: Seen in 0-5 Days ↑ 12% 39% 62% 40% 50% 42% 50%
9. Medical Care Coordination
Received a Primary Care/Preventive Health Visit ↑ 87% 91% 94% 92% 92% 93% 92%
* ↑ Goal is to increase the percentage ↓ Goal is to decrease the percentage
Progress Indicator LME
Goa
l*
50
NC Division of Mental Health, Developmental Disabilities, and Substance Abuse ServicesAppendices for Community Systems Progress Report: Second Quarter SFY 2011 - 2012
This Page Intentionally Left Blank
51

NC Division of Mental Health, Developmental Disabilities, and Substance Abuse ServicesAppendices for Community Systems Progress Report: Second Quarter SFY 2011 - 2012
SMOKY MOUNTAIN CENTER
Persons Served By Age and Disability During October 2010 - September 2011(Based On Medicaid and State-Funded IPRS Claims Paid Through January 2012)
The above pie charts show the number and percentage of persons served during the most recent 12 month period for which claims data is available. It only includes persons whose services were paid by Medicaid and State-Funds through the Integrated Payment Reporting System.
Reduction of Short-Term State Psychiatric Hospital Use
Timely Follow-Up After Discharge From A State Facility
MH6,076 89%
SA41 1%
DD232 4%
Dual MH/SA164 2%
Dual MH/DD287 4%
Dual DD/SA0
0%
MH/DD/SA0
0%
Youth (Under Age 18): 6,800
MH10,941 62%
SA1,746 10%
DD651 4%
Dual MH/SA3,609 20%
Dual MH/DD730 4%
Dual DD/SA6
0%
MH/DD/SA33 0%
Adults (Age 18 and Over): 17,716
Rationale: An adequate community service system should provide short-term inpatientcare in a local hospital in the community. This helps families stay involved and reserveshigh-cost state facility beds for consumers with long-term care needs. Reducing the useof state psychiatric hospitals for short-term care allows more effective and efficient useof funds for community services. The goal is to decrease the percentage.
Rationale: Living successfully in one's community after discharge from a state-operated facility depends on smooth and timely transition to community services and supports.Receiving a community-based service within 7 days of discharge is a nationally accepted standard of care that also indicates the local system's community service capacity andcoordination across levels of care. The goal is to increase the percentage. The percentages only include follow-up services paid by Medicaid and state-funds (IPRS).
Smoky Mountain Center serves 15 non-contiguous rural counties in western NC. Of the 542,000residents living in this area, 18% are enrolled in Medicaid.
Western Region Central Region Eastern Region
Reduction of Short-Term State Psychiatric Hospital Use:
Overall, the percentage of persons discharged from state hospitals withstays of 7 days or less has decreased over the past 9 quarters. Except fortwo quarters, the percentage has been below the state average during thistime (a lower percentage is better for this indicator).
Timely Follow-Up After Discharge From A State Facility:
Overall, the percentage of persons discharged from state hospitals thathave received follow-up care within 7 days of discharge has decreasedslightly over the past 9 quarters. The percentage is currently slightly belowthe state average (a higher percentage is better for this indicator).
Overall, the percentage of persons discharged from ADATCs that havereceived follow-up care within 7 days of discharge has decreased over thepast 9 quarters. It is currently slightly above the state average (a higherpercentage is better for this indicator).
23% 21%
40%
21% 21%11%
38%
15% 13%
0%
20%
40%
60%
80%
100%
Q2 Q3 Q4 Q1 Q2 Q3 Q4 Q1 Q2
SFY10 SFY11 SFY12
Pct of Discharges: Length of Stay 7 Days or Less
LME Highest LME State Average Lowest LME
54% 52%60% 56%
45%
59% 57%50% 50%
0%
20%
40%
60%
80%
100%
Q2 Q3 Q4 Q1 Q2 Q3 Q4 Q1 Q2
SFY10 SFY11 SFY12
Pct
of
Per
son
s S
een
W
ith
in 7
Day
s
Timely Follow-Up: Psych Hospitals
LME Highest LME State Average Lowest LME
22%
42%49% 46%
32%41% 42% 42% 37%
0%
20%
40%
60%
80%
100%
Q2 Q3 Q4 Q1 Q2 Q3 Q4 Q1 Q2
SFY10 SFY11 SFY12
Pct
of
Per
son
s S
een
Wit
hin
7 D
ays
Timely Follow-Up: ADATCs
LME Highest LME State Average Lowest LME
52

NC Division of Mental Health, Developmental Disabilities, and Substance Abuse ServicesAppendices for Community Systems Progress Report: Second Quarter SFY 2011 - 2012
SMOKY MOUNTAIN CENTERSo… How Did We Do This Quarter?
Range Among LMEs County
LowestLME
State Average
HighestLME
Alexander Alleghany Ashe Avery Caldwell
1. SA Prevention and Early Intervention
Persons in Need Completing Selective and Indicated Programs ↑ 0% 4% 21% 2% <-Data for this indicator is not available at the county level->
2. Timely Access to Care
Urgent ↑ 48% 84% 100% 84% <-Data for this indicator is not available at the county level->
Routine ↑ 37% 72% 98% 74% <-Data for this indicator is not available at the county level->
3. Services to Persons in Need
Adult Mental Health ↑ 31% 50% 74% 65% 53% 73% 75% 55% 55%
Child/Adolescent Mental Health ↑ 34% 55% 80% 66% 47% 73% 64% 62% 66%
Adult Developmental Disabilities ↑ 26% 38% 56% 40% 29% 62% 54% 41% 36%
Child/Adolescent Developmental Disabilities ↑ 12% 19% 33% 18% 10% 35% 16% 8% 15%
Adult Substance Abuse ↑ 6% 12% 16% 16% 12% 15% 19% 15% 11%
Adolescent Substance Abuse ↑ 5% 10% 17% 9% 4% 27% 17% 26% 3%
4. Timely Initiation & Engagement in Service
Mental Health: 2 Visits within 14 Days ↑ 33% 45% 72% 45% 37% 46% 32% 44% 48%
Mental Health: 2 Add'l Visits within Next 30 Days ↑ 17% 29% 41% 25% 18% 26% 20% 25% 28%
Substance Abuse: 2 Visits within 14 Days ↑ 44% 65% 88% 64% 67% 70% 57% 58% 70%
Substance Abuse: 2 Add'l Visits within Next 30 Days ↑ 32% 47% 61% 45% 50% 50% 30% 53% 45%
Mental Health/Developmental Disabilities: 2 Visits within 14 Days ↑ 28% 48% 71% 44% 50% 13% 100% 0% 17%
Mental Health/Developmental Disabilities: 2 Add'l Visits within Next 30 Days ↑ 8% 36% 54% 37% 50% 0% 100% 0% 17%
Mental Health/Substance Abuse: 2 Visits within 14 Days ↑ 42% 63% 91% 61% 73% 58% 52% 67% 68%
Mental Health/Substance Abuse: 2 Add'l Visits within Next 30 Days ↑ 29% 47% 62% 45% 50% 50% 24% 47% 58%
5. Timely Support For Persons With I/DD
First Service within 30 Days of Screening/Triage/Referral ↑ 0% 36% 100% 22% 0% 0% 100% 0% 25%
6. Short-Term Care in State Psychiatric Hospitals
1-7 Days of Care ↓ 0% 20% 38% 13% <-Data for this indicator is not available at the county level->
7. Psychiatric Hospital Readmissions
State Hospitals: Readmitted within 30 Days ↓ 0% 6% 19% 3% <-Data for this indicator is not available at the county level->
State Hospitals: Readmitted within 180 Days ↓ 3% 16% 31% 12% <-Data for this indicator is not available at the county level->
Community Hospitals: Readmitted within 30 Days ↓ 6% 12% 19% 9% 8% 0% 0% 22% 8%
8. Timely Follow-up After Psychiatric Inpatient and Crisis Care
ADATCs: Seen in 1-7 Days ↑ 15% 36% 83% 37% <-Data for this indicator is not available at the county level->
State Hospitals: Seen in 1-7 Days ↑ 17% 53% 90% 50% <-Data for this indicator is not available at the county level->
Community Hospitals: Seen in 1-7 Days ↑ 31% 40% 51% 42% 25% 67% 54% 83% 22%
Crisis Services: Seen in 0-5 Days ↑ 12% 39% 62% 50% 50% 54% 32% 29% 4%
9. Medical Care Coordination
Received a Primary Care/Preventive Health Visit ↑ 87% 91% 94% 92% 92% 92% 91% 91% 94%
* ↑ Goal is to increase the percentage ↓ Goal is to decrease the percentage
Progress Indicator LME
Goa
l*
53

NC Division of Mental Health, Developmental Disabilities, and Substance Abuse ServicesAppendices for Community Systems Progress Report: Second Quarter SFY 2011 - 2012
SMOKY MOUNTAIN CENTERSo… How Did We Do This Quarter?
Range Among LMEs County
LowestLME
State Average
HighestLME
Cherokee Clay Graham Haywood Jackson
1. SA Prevention and Early Intervention
Persons in Need Completing Selective and Indicated Programs ↑ 0% 4% 21% 2% <-Data for this indicator is not available at the county level->
2. Timely Access to Care
Urgent ↑ 48% 84% 100% 84% <-Data for this indicator is not available at the county level->
Routine ↑ 37% 72% 98% 74% <-Data for this indicator is not available at the county level->
3. Services to Persons in Need
Adult Mental Health ↑ 31% 50% 74% 65% 80% 58% 85% 89% 58%
Child/Adolescent Mental Health ↑ 34% 55% 80% 66% 86% 78% 79% 99% 80%
Adult Developmental Disabilities ↑ 26% 38% 56% 40% 55% 45% 48% 52% 28%
Child/Adolescent Developmental Disabilities ↑ 12% 19% 33% 18% 19% 27% 18% 25% 24%
Adult Substance Abuse ↑ 6% 12% 16% 16% 20% 11% 21% 24% 12%
Adolescent Substance Abuse ↑ 5% 10% 17% 9% 8% 11% 11% 8% 9%
4. Timely Initiation & Engagement in Service
Mental Health: 2 Visits within 14 Days ↑ 33% 45% 72% 45% 46% 56% 49% 46% 49%
Mental Health: 2 Add'l Visits within Next 30 Days ↑ 17% 29% 41% 25% 27% 35% 21% 28% 32%
Substance Abuse: 2 Visits within 14 Days ↑ 44% 65% 88% 64% 72% 75% 67% 60% 61%
Substance Abuse: 2 Add'l Visits within Next 30 Days ↑ 32% 47% 61% 45% 52% 75% 33% 48% 29%
Mental Health/Developmental Disabilities: 2 Visits within 14 Days ↑ 28% 48% 71% 44% 100% 100% 0% 57% 50%
Mental Health/Developmental Disabilities: 2 Add'l Visits within Next 30 Days ↑ 8% 36% 54% 37% 100% 100% 0% 36% 50%
Mental Health/Substance Abuse: 2 Visits within 14 Days ↑ 42% 63% 91% 61% 66% 80% 37% 58% 47%
Mental Health/Substance Abuse: 2 Add'l Visits within Next 30 Days ↑ 29% 47% 62% 45% 45% 70% 21% 43% 29%
5. Timely Support For Persons With I/DD
First Service within 30 Days of Screening/Triage/Referral ↑ 0% 36% 100% 22% 0% 0% 0% 0% 0%
6. Short-Term Care in State Psychiatric Hospitals
1-7 Days of Care ↓ 0% 20% 38% 13% <-Data for this indicator is not available at the county level->
7. Psychiatric Hospital Readmissions
State Hospitals: Readmitted within 30 Days ↓ 0% 6% 19% 3% <-Data for this indicator is not available at the county level->
State Hospitals: Readmitted within 180 Days ↓ 3% 16% 31% 12% <-Data for this indicator is not available at the county level->
Community Hospitals: Readmitted within 30 Days ↓ 6% 12% 19% 9% 7% 50% 0% 16% 0%
8. Timely Follow-up After Psychiatric Inpatient and Crisis Care
ADATCs: Seen in 1-7 Days ↑ 15% 36% 83% 37% <-Data for this indicator is not available at the county level->
State Hospitals: Seen in 1-7 Days ↑ 17% 53% 90% 50% <-Data for this indicator is not available at the county level->
Community Hospitals: Seen in 1-7 Days ↑ 31% 40% 51% 42% 52% 86% 33% 46% 52%
Crisis Services: Seen in 0-5 Days ↑ 12% 39% 62% 50% 69% 100% 100% 96% 80%
9. Medical Care Coordination
Received a Primary Care/Preventive Health Visit ↑ 87% 91% 94% 92% 91% 93% 95% 92% 93%
* ↑ Goal is to increase the percentage ↓ Goal is to decrease the percentage
Progress Indicator LME
Goa
l*
54

NC Division of Mental Health, Developmental Disabilities, and Substance Abuse ServicesAppendices for Community Systems Progress Report: Second Quarter SFY 2011 - 2012
SMOKY MOUNTAIN CENTERSo… How Did We Do This Quarter?
Range Among LMEs County
LowestLME
State Average
HighestLME
Macon McDowell Swain Watauga Wilkes
1. SA Prevention and Early Intervention
Persons in Need Completing Selective and Indicated Programs ↑ 0% 4% 21% 2% <-Data for this indicator is not available at the county level->
2. Timely Access to Care
Urgent ↑ 48% 84% 100% 84% <-Data for this indicator is not available at the county level->
Routine ↑ 37% 72% 98% 74% <-Data for this indicator is not available at the county level->
3. Services to Persons in Need
Adult Mental Health ↑ 31% 50% 74% 65% 68% 72% 91% 37% 69%
Child/Adolescent Mental Health ↑ 34% 55% 80% 66% 58% 58% 86% 42% 54%
Adult Developmental Disabilities ↑ 26% 38% 56% 40% 30% 44% 37% 24% 48%
Child/Adolescent Developmental Disabilities ↑ 12% 19% 33% 18% 27% 18% 12% 10% 15%
Adult Substance Abuse ↑ 6% 12% 16% 16% 18% 19% 20% 8% 19%
Adolescent Substance Abuse ↑ 5% 10% 17% 9% 4% 18% 21% 11% 6%
4. Timely Initiation & Engagement in Service
Mental Health: 2 Visits within 14 Days ↑ 33% 45% 72% 45% 44% 39% 56% 51% 48%
Mental Health: 2 Add'l Visits within Next 30 Days ↑ 17% 29% 41% 25% 24% 18% 31% 25% 24%
Substance Abuse: 2 Visits within 14 Days ↑ 44% 65% 88% 64% 71% 51% 71% 70% 64%
Substance Abuse: 2 Add'l Visits within Next 30 Days ↑ 32% 47% 61% 45% 57% 26% 29% 48% 53%
Mental Health/Developmental Disabilities: 2 Visits within 14 Days ↑ 28% 48% 71% 44% 100% 0% 25% 50% 33%
Mental Health/Developmental Disabilities: 2 Add'l Visits within Next 30 Days ↑ 8% 36% 54% 37% 100% 0% 25% 50% 33%
Mental Health/Substance Abuse: 2 Visits within 14 Days ↑ 42% 63% 91% 61% 60% 69% 63% 69% 63%
Mental Health/Substance Abuse: 2 Add'l Visits within Next 30 Days ↑ 29% 47% 62% 45% 40% 60% 43% 42% 48%
5. Timely Support For Persons With I/DD
First Service within 30 Days of Screening/Triage/Referral ↑ 0% 36% 100% 22% 0% 0% 0% 0% 0%
6. Short-Term Care in State Psychiatric Hospitals
1-7 Days of Care ↓ 0% 20% 38% 13% <-Data for this indicator is not available at the county level->
7. Psychiatric Hospital Readmissions
State Hospitals: Readmitted within 30 Days ↓ 0% 6% 19% 3% <-Data for this indicator is not available at the county level->
State Hospitals: Readmitted within 180 Days ↓ 3% 16% 31% 12% <-Data for this indicator is not available at the county level->
Community Hospitals: Readmitted within 30 Days ↓ 6% 12% 19% 9% 13% 7% 0% 0% 13%
8. Timely Follow-up After Psychiatric Inpatient and Crisis Care
ADATCs: Seen in 1-7 Days ↑ 15% 36% 83% 37% <-Data for this indicator is not available at the county level->
State Hospitals: Seen in 1-7 Days ↑ 17% 53% 90% 50% <-Data for this indicator is not available at the county level->
Community Hospitals: Seen in 1-7 Days ↑ 31% 40% 51% 42% 44% 24% 33% 60% 51%
Crisis Services: Seen in 0-5 Days ↑ 12% 39% 62% 50% 79% 11% 89% 44% 23%
9. Medical Care Coordination
Received a Primary Care/Preventive Health Visit ↑ 87% 91% 94% 92% 94% 92% 86% 89% 93%
* ↑ Goal is to increase the percentage ↓ Goal is to decrease the percentage
Progress Indicator LME
Goa
l*
55

NC Division of Mental Health, Developmental Disabilities, and Substance Abuse ServicesAppendices for Community Systems Progress Report: Second Quarter SFY 2011 - 2012
SOUTHEASTERN CENTER
Persons Served By Age and Disability During October 2010 - September 2011(Based On Medicaid and State-Funded IPRS Claims Paid Through January 2012)
The above pie charts show the number and percentage of persons served during the most recent 12 month period for which claims data is available. It only includes persons whose services were paid by Medicaid and State-Funds through the Integrated Payment Reporting System.
Reduction of Short-Term State Psychiatric Hospital Use
Timely Follow-Up After Discharge From A State Facility
MH4,252 84%
SA34 1%
DD194 4%
Dual MH/SA119 2%
Dual MH/DD435 9%
Dual DD/SA0
0%MH/DD/SA
7 0%
Youth (Under Age 18): 5,041
MH6,309 62%
SA1,666 17%
DD339 3%
Dual MH/SA1,297 13%
Dual MH/DD534 5%
Dual DD/SA3
0%
MH/DD/SA30 0%
Adults (Age 18 and Over): 10,178
Rationale: An adequate community service system should provide short-term inpatientcare in a local hospital in the community. This helps families stay involved and reserveshigh-cost state facility beds for consumers with long-term care needs. Reducing the useof state psychiatric hospitals for short-term care allows more effective and efficient useof funds for community services. The goal is to decrease the percentage.
Rationale: Living successfully in one's community after discharge from a state-operated facility depends on smooth and timely transition to community services and supports.Receiving a community-based service within 7 days of discharge is a nationally accepted standard of care that also indicates the local system's community service capacity andcoordination across levels of care. The goal is to increase the percentage. The percentages only include follow-up services paid by Medicaid and state-funds (IPRS).
Western Region Central Region Eastern Region
Southeastern Center LME serves the eastern North Carolina counties of Brunswick, NewHanover, and Pender. Only New Hanover is considered urban. Of the 371,000 residents living inthis area, 15% are enrolled in Medicaid.
Reduction of Short-Term State Psychiatric Hospital Use:
Overall, the percentage of persons discharged from state hospitals withstays of 7 days or less has decreased over the past 9 quarters. However,the percentage remains above the state average (a lower percentage isbetter for this indicator).
Timely Follow-Up After Discharge From A State Facility:
Overall, the percentage of persons discharged from state hospitals thathave received follow-up care within 7 days of discharge has remainedabout the same over the past 9 quarters. However, the percentage hasbeen below the state average during this period (a higher percentage isbetter for this indicator).
Overall, the percentage of persons discharged from ADATCs that havereceived follow-up care within 7 days of discharge has decreased slightlyover the past 9 quarters. The percentage has remained below the stateaverage for this period (a higher percentage is better for this indicator).
69%
47% 48% 46%35%
44%
28% 31%37%
0%
20%
40%
60%
80%
100%
Q2 Q3 Q4 Q1 Q2 Q3 Q4 Q1 Q2
SFY10 SFY11 SFY12
Pct of Discharges: Length of Stay 7 Days or Less
LME Highest LME State Average Lowest LME
43% 40% 44% 38%45%
52%46%
40% 41%
0%
20%
40%
60%
80%
100%
Q2 Q3 Q4 Q1 Q2 Q3 Q4 Q1 Q2
SFY10 SFY11 SFY12
Pct
of
Per
son
s S
een
W
ith
in 7
Day
s
Timely Follow-Up: Psych Hospitals
LME Highest LME State Average Lowest LME
29% 29% 30% 29% 26%31% 34%
25% 23%
0%
20%
40%
60%
80%
100%
Q2 Q3 Q4 Q1 Q2 Q3 Q4 Q1 Q2
SFY10 SFY11 SFY12
Pct
of
Per
son
s S
een
Wit
hin
7 D
ays
Timely Follow-Up: ADATCs
LME Highest LME State Average Lowest LME
56

NC Division of Mental Health, Developmental Disabilities, and Substance Abuse ServicesAppendices for Community Systems Progress Report: Second Quarter SFY 2011 - 2012
SOUTHEASTERN CENTERSo… How Did We Do This Quarter?
Range Among LMEs County
LowestLME
State Average
HighestLME
BrunswickNew
HanoverPender
1. SA Prevention and Early Intervention
Persons in Need Completing Selective and Indicated Programs ↑ 0% 4% 21% 1% <-Data for this indicator is not available at the county level->
2. Timely Access to Care
Urgent ↑ 48% 84% 100% 74% <-Data for this indicator is not available at the county level->
Routine ↑ 37% 72% 98% 71% <-Data for this indicator is not available at the county level->
3. Services to Persons in Need
Adult Mental Health ↑ 31% 50% 74% 50% 43% 58% 39%
Child/Adolescent Mental Health ↑ 34% 55% 80% 75% 80% 73% 75%
Adult Developmental Disabilities ↑ 26% 38% 56% 37% 28% 45% 28%
Child/Adolescent Developmental Disabilities ↑ 12% 19% 33% 33% 46% 29% 24%
Adult Substance Abuse ↑ 6% 12% 16% 13% 10% 15% 9%
Adolescent Substance Abuse ↑ 5% 10% 17% 12% 10% 13% 8%
4. Timely Initiation & Engagement in Service
Mental Health: 2 Visits within 14 Days ↑ 33% 45% 72% 39% 43% 37% 37%
Mental Health: 2 Add'l Visits within Next 30 Days ↑ 17% 29% 41% 24% 26% 24% 20%
Substance Abuse: 2 Visits within 14 Days ↑ 44% 65% 88% 44% 36% 45% 52%
Substance Abuse: 2 Add'l Visits within Next 30 Days ↑ 32% 47% 61% 32% 25% 34% 31%
Mental Health/Developmental Disabilities: 2 Visits within 14 Days ↑ 28% 48% 71% 60% 64% 56% 75%
Mental Health/Developmental Disabilities: 2 Add'l Visits within Next 30 Days ↑ 8% 36% 54% 47% 57% 44% 25%
Mental Health/Substance Abuse: 2 Visits within 14 Days ↑ 42% 63% 91% 61% 62% 63% 52%
Mental Health/Substance Abuse: 2 Add'l Visits within Next 30 Days ↑ 29% 47% 62% 45% 49% 47% 28%
5. Timely Support For Persons With I/DD
First Service within 30 Days of Screening/Triage/Referral ↑ 0% 36% 100% 62% 67% 58% 75%
6. Short-Term Care in State Psychiatric Hospitals
1-7 Days of Care ↓ 0% 20% 38% 37% <-Data for this indicator is not available at the county level->
7. Psychiatric Hospital Readmissions
State Hospitals: Readmitted within 30 Days ↓ 0% 6% 19% 6% <-Data for this indicator is not available at the county level->
State Hospitals: Readmitted within 180 Days ↓ 3% 16% 31% 12% <-Data for this indicator is not available at the county level->
Community Hospitals: Readmitted within 30 Days ↓ 6% 12% 19% 6% 8% 6% 8%
8. Timely Follow-up After Psychiatric Inpatient and Crisis Care
ADATCs: Seen in 1-7 Days ↑ 15% 36% 83% 23% <-Data for this indicator is not available at the county level->
State Hospitals: Seen in 1-7 Days ↑ 17% 53% 90% 41% <-Data for this indicator is not available at the county level->
Community Hospitals: Seen in 1-7 Days ↑ 31% 40% 51% 39% 47% 35% 43%
Crisis Services: Seen in 0-5 Days ↑ 12% 39% 62% 12% 7% 11% 33%
9. Medical Care Coordination
Received a Primary Care/Preventive Health Visit ↑ 87% 91% 94% 92% 93% 92% 93%
* ↑ Goal is to increase the percentage ↓ Goal is to decrease the percentage
Progress Indicator LME
Goa
l*
57

NC Division of Mental Health, Developmental Disabilities, and Substance Abuse ServicesAppendices for Community Systems Progress Report: Second Quarter SFY 2011 - 2012
SOUTHEASTERN REGIONAL
Persons Served By Age and Disability During October 2010 - September 2011(Based On Medicaid and State-Funded IPRS Claims Paid Through January 2012)
The above pie charts show the number and percentage of persons served during the most recent 12 month period for which claims data is available. It only includes persons whose services were paid by Medicaid and State-Funds through the Integrated Payment Reporting System.
Reduction of Short-Term State Psychiatric Hospital Use
Timely Follow-Up After Discharge From A State Facility
MH4,231 90%
SA17 0%
DD88 2%
Dual MH/SA90 2%
Dual MH/DD254 6%
Dual DD/SA0
0%
MH/DD/SA2
0%
Youth (Under Age 18): 4,682
MH5,352 64%
SA772 9%
DD252 3%
Dual MH/SA1,420 17%
Dual MH/DD558 7%
Dual DD/SA8
0%
MH/DD/SA35 0%
Adults (Age 18 and Over): 8,397
Rationale: An adequate community service system should provide short-term inpatientcare in a local hospital in the community. This helps families stay involved and reserveshigh-cost state facility beds for consumers with long-term care needs. Reducing the useof state psychiatric hospitals for short-term care allows more effective and efficient useof funds for community services. The goal is to decrease the percentage.
Rationale: Living successfully in one's community after discharge from a state-operated facility depends on smooth and timely transition to community services and supports.Receiving a community-based service within 7 days of discharge is a nationally accepted standard of care that also indicates the local system's community service capacity andcoordination across levels of care. The goal is to increase the percentage. The percentages only include follow-up services paid by Medicaid and state-funds (IPRS).
Western Region Central Region Eastern Region
Southeastern Regional MH/DD/SAS LME serves the eastern North Carolina counties of Bladen,Columbus, Robeson, and Scotland. Of the 265,000 residents living in these rural counties, 30%are enrolled in Medicaid.
Reduction of Short-Term State Psychiatric Hospital Use:
Overall, the percentage of persons discharged from state hospitals withstays of 7 days or less has decreased over the past 9 quarters. Thepercentage is currently above the state average (a lower percentage isbetter for this indicator).
Timely Follow-Up After Discharge From A State Facility:
Overall, the percentage of persons discharged from state hospitals thathave received follow-up care within 7 days of discharge has cycled up anddown over the past 9 quarters. The percentage is currently slightly belowthe state average (a higher percentage is better for this indicator).
Overall, the percentage of persons discharged from ADATCs that havereceived follow-up care within 7 days of discharge has increased over thepast 9 quarters. The percentage is currently above the state average (ahigher percentage is better for this indicator).
33%
61%
30%19%
31% 33%27% 28% 25%
0%
20%
40%
60%
80%
100%
Q2 Q3 Q4 Q1 Q2 Q3 Q4 Q1 Q2
SFY10 SFY11 SFY12
Pct of Discharges: Length of Stay 7 Days or Less
LME Highest LME State Average Lowest LME
55%
31%
45%38%
47% 48%57%
39%52%
0%
20%
40%
60%
80%
100%
Q2 Q3 Q4 Q1 Q2 Q3 Q4 Q1 Q2
SFY10 SFY11 SFY12
Pct
of
Per
son
s S
een
W
ith
in 7
Day
s
Timely Follow-Up: Psych Hospitals
LME Highest LME State Average Lowest LME
30%
6% 10%
29%20%
13% 12%
41%
56%
0%
20%
40%
60%
80%
100%
Q2 Q3 Q4 Q1 Q2 Q3 Q4 Q1 Q2
SFY10 SFY11 SFY12
Pct
of
Per
son
s S
een
Wit
hin
7 D
ays
Timely Follow-Up: ADATCs
LME Highest LME State Average Lowest LME
58

NC Division of Mental Health, Developmental Disabilities, and Substance Abuse ServicesAppendices for Community Systems Progress Report: Second Quarter SFY 2011 - 2012
SOUTHEASTERN REGIONALSo… How Did We Do This Quarter?
Range Among LMEs County
LowestLME
State Average
HighestLME
Bladen Columbus Robeson Scotland
1. SA Prevention and Early Intervention
Persons in Need Completing Selective and Indicated Programs ↑ 0% 4% 21% 0% <-Data for this indicator is not available at the county level->
2. Timely Access to Care
Urgent ↑ 48% 84% 100% 94% <-Data for this indicator is not available at the county level->
Routine ↑ 37% 72% 98% 98% <-Data for this indicator is not available at the county level->
3. Services to Persons in Need
Adult Mental Health ↑ 31% 50% 74% 70% 62% 65% 73% 75%
Child/Adolescent Mental Health ↑ 34% 55% 80% 71% 53% 66% 69% 106%
Adult Developmental Disabilities ↑ 26% 38% 56% 54% 55% 68% 47% 53%
Child/Adolescent Developmental Disabilities ↑ 12% 19% 33% 18% 19% 17% 19% 13%
Adult Substance Abuse ↑ 6% 12% 16% 14% 11% 12% 16% 15%
Adolescent Substance Abuse ↑ 5% 10% 17% 8% 5% 5% 8% 13%
4. Timely Initiation & Engagement in Service
Mental Health: 2 Visits within 14 Days ↑ 33% 45% 72% 45% 42% 42% 45% 53%
Mental Health: 2 Add'l Visits within Next 30 Days ↑ 17% 29% 41% 31% 27% 25% 31% 44%
Substance Abuse: 2 Visits within 14 Days ↑ 44% 65% 88% 70% 67% 46% 77% 72%
Substance Abuse: 2 Add'l Visits within Next 30 Days ↑ 32% 47% 61% 57% 48% 40% 64% 52%
Mental Health/Developmental Disabilities: 2 Visits within 14 Days ↑ 28% 48% 71% 64% 20% 60% 68% 86%
Mental Health/Developmental Disabilities: 2 Add'l Visits within Next 30 Days ↑ 8% 36% 54% 45% 0% 40% 44% 86%
Mental Health/Substance Abuse: 2 Visits within 14 Days ↑ 42% 63% 91% 70% 59% 58% 72% 79%
Mental Health/Substance Abuse: 2 Add'l Visits within Next 30 Days ↑ 29% 47% 62% 51% 32% 42% 54% 62%
5. Timely Support For Persons With I/DD
First Service within 30 Days of Screening/Triage/Referral ↑ 0% 36% 100% 55% 100% 33% 53% 50%
6. Short-Term Care in State Psychiatric Hospitals
1-7 Days of Care ↓ 0% 20% 38% 25% <-Data for this indicator is not available at the county level->
7. Psychiatric Hospital Readmissions
State Hospitals: Readmitted within 30 Days ↓ 0% 6% 19% 0% <-Data for this indicator is not available at the county level->
State Hospitals: Readmitted within 180 Days ↓ 3% 16% 31% 9% <-Data for this indicator is not available at the county level->
Community Hospitals: Readmitted within 30 Days ↓ 6% 12% 19% 12% 12% 17% 9% 21%
8. Timely Follow-up After Psychiatric Inpatient and Crisis Care
ADATCs: Seen in 1-7 Days ↑ 15% 36% 83% 56% <-Data for this indicator is not available at the county level->
State Hospitals: Seen in 1-7 Days ↑ 17% 53% 90% 52% <-Data for this indicator is not available at the county level->
Community Hospitals: Seen in 1-7 Days ↑ 31% 40% 51% 37% 35% 71% 27% 54%
Crisis Services: Seen in 0-5 Days ↑ 12% 39% 62% 24% 0% 67% 23% 17%
9. Medical Care Coordination
Received a Primary Care/Preventive Health Visit ↑ 87% 91% 94% 92% 93% 93% 92% 92%
* ↑ Goal is to increase the percentage ↓ Goal is to decrease the percentage
Progress Indicator LME
Goa
l*
59

NC Division of Mental Health, Developmental Disabilities, and Substance Abuse ServicesAppendices for Community Systems Progress Report: Second Quarter SFY 2011 - 2012
WAKE COUNTY HUMAN SERVICES
Persons Served By Age and Disability During October 2010 - September 2011(Based On Medicaid and State-Funded IPRS Claims Paid Through January 2012)
The above pie charts show the number and percentage of persons served during the most recent 12 month period for which claims data is available. It only includes persons whose services were paid by Medicaid and State-Funds through the Integrated Payment Reporting System.
Reduction of Short-Term State Psychiatric Hospital Use
Timely Follow-Up After Discharge From A State Facility
MH7,157 83%
SA65 1%
DD474 6%
Dual MH/SA371 4%
Dual MH/DD530 6%
Dual DD/SA1
0%
MH/DD/SA4
0%
Youth (Under Age 18): 8,602
MH8,274 60%
SA1,172 9%
DD797 6%
Dual MH/SA2,727 20%
Dual MH/DD685 5%
Dual DD/SA6
0%MH/DD/SA
44 0%
Adults (Age 18 and Over): 13,705
Rationale: An adequate community service system should provide short-term inpatientcare in a local hospital in the community. This helps families stay involved and reserveshigh-cost state facility beds for consumers with long-term care needs. Reducing the useof state psychiatric hospitals for short-term care allows more effective and efficient useof funds for community services. The goal is to decrease the percentage.
Rationale: Living successfully in one's community after discharge from a state-operated facility depends on smooth and timely transition to community services and supports.Receiving a community-based service within 7 days of discharge is a nationally accepted standard of care that also indicates the local system's community service capacity andcoordination across levels of care. The goal is to increase the percentage. The percentages only include follow-up services paid by Medicaid and state-funds (IPRS).
Western Region Central Region Eastern Region
Wake County Human Services LME is a single-county program in the Triangle metropolitan areaof central North Carolina. Of the 933,000 residents living in this urban county, 10% are enrolled inMedicaid.
Reduction of Short-Term State Psychiatric Hospital Use:
Overall, the percentage of persons discharged from state hospitals withstays of 7 days or less has decreased over the past 9 quarters from aboveto slightly below the state average (a lower percentage is better for thisindicator).
Timely Follow-Up After Discharge From A State Facility:
Overall, the percentage of persons discharged from state hospitals thathave received follow-up care within 7 days of discharge has increased overthe past 9 quarters from below to slightly below the state average (a higherpercentage is better for this indicator).
The percentage of persons discharged from ADATCs that have receivedfollow-up care within 7 days of discharge has fluctuated up and down overthe past 9 quarters, increasing overall from below to just at the stateaverage (a higher percentage is better for this indicator).
49% 49%42% 42%
36%25%
16% 15% 19%
0%
20%
40%
60%
80%
100%
Q2 Q3 Q4 Q1 Q2 Q3 Q4 Q1 Q2
SFY10 SFY11 SFY12
Pct of Discharges: Length of Stay 7 Days or Less
LME Highest LME State Average Lowest LME
34% 32%38% 34%
43% 42% 38% 42%51%
0%
20%
40%
60%
80%
100%
Q2 Q3 Q4 Q1 Q2 Q3 Q4 Q1 Q2
SFY10 SFY11 SFY12
Pct
of
Per
son
s S
een
W
ith
in 7
Day
s
Timely Follow-Up: Psych Hospitals
LME Highest LME State Average Lowest LME
24%32%
26% 27%40%
28%36%
23%
36%
0%
20%
40%
60%
80%
100%
Q2 Q3 Q4 Q1 Q2 Q3 Q4 Q1 Q2
SFY10 SFY11 SFY12
Pct
of
Per
son
s S
een
Wit
hin
7 D
ays
Timely Follow-Up: ADATCs
LME Highest LME State Average Lowest LME
60

NC Division of Mental Health, Developmental Disabilities, and Substance Abuse ServicesAppendices for Community Systems Progress Report: Second Quarter SFY 2011 - 2012
WAKESo… How Did We Do This Quarter?
Range Among LMEs County
LowestLME
State Average
HighestLME
Wake
1. SA Prevention and Early Intervention
Persons in Need Completing Selective and Indicated Programs ↑ 0% 4% 21% 3% <-Data for this indicator is not available at the county level->
2. Timely Access to Care
Urgent ↑ 48% 84% 100% 87% <-Data for this indicator is not available at the county level->
Routine ↑ 37% 72% 98% 82% <-Data for this indicator is not available at the county level->
3. Services to Persons in Need
Adult Mental Health ↑ 31% 50% 74% 31% 31%
Child/Adolescent Mental Health ↑ 34% 55% 80% 39% 39%
Adult Developmental Disabilities ↑ 26% 38% 56% 27% 27%
Child/Adolescent Developmental Disabilities ↑ 12% 19% 33% 16% 16%
Adult Substance Abuse ↑ 6% 12% 16% 7% 7%
Adolescent Substance Abuse ↑ 5% 10% 17% 10% 10%
4. Timely Initiation & Engagement in Service
Mental Health: 2 Visits within 14 Days ↑ 33% 45% 72% 47% 47%
Mental Health: 2 Add'l Visits within Next 30 Days ↑ 17% 29% 41% 34% 34%
Substance Abuse: 2 Visits within 14 Days ↑ 44% 65% 88% 58% 58%
Substance Abuse: 2 Add'l Visits within Next 30 Days ↑ 32% 47% 61% 46% 46%
Mental Health/Developmental Disabilities: 2 Visits within 14 Days ↑ 28% 48% 71% 52% 52%
Mental Health/Developmental Disabilities: 2 Add'l Visits within Next 30 Days ↑ 8% 36% 54% 40% 40%
Mental Health/Substance Abuse: 2 Visits within 14 Days ↑ 42% 63% 91% 59% 59%
Mental Health/Substance Abuse: 2 Add'l Visits within Next 30 Days ↑ 29% 47% 62% 46% 46%
5. Timely Support For Persons With I/DD
First Service within 30 Days of Screening/Triage/Referral ↑ 0% 36% 100% 27% 27%
6. Short-Term Care in State Psychiatric Hospitals
1-7 Days of Care ↓ 0% 20% 38% 19% <-Data for this indicator is not available at the county level->
7. Psychiatric Hospital Readmissions
State Hospitals: Readmitted within 30 Days ↓ 0% 6% 19% 8% <-Data for this indicator is not available at the county level->
State Hospitals: Readmitted within 180 Days ↓ 3% 16% 31% 23% <-Data for this indicator is not available at the county level->
Community Hospitals: Readmitted within 30 Days ↓ 6% 12% 19% 11% 11%
8. Timely Follow-up After Psychiatric Inpatient and Crisis Care
ADATCs: Seen in 1-7 Days ↑ 15% 36% 83% 36% <-Data for this indicator is not available at the county level->
State Hospitals: Seen in 1-7 Days ↑ 17% 53% 90% 51% <-Data for this indicator is not available at the county level->
Community Hospitals: Seen in 1-7 Days ↑ 31% 40% 51% 36% 36%
Crisis Services: Seen in 0-5 Days ↑ 12% 39% 62% 14% 14%
9. Medical Care Coordination
Received a Primary Care/Preventive Health Visit ↑ 87% 91% 94% 88% 88%
* ↑ Goal is to increase the percentage ↓ Goal is to decrease the percentage
Progress Indicator LME
Goa
l*
61

NC Division of Mental Health, Developmental Disabilities, and Substance Abuse ServicesAppendices for Community Systems Progress Report: Second Quarter SFY 2011 - 2012
WESTERN HIGHLANDS NETWORK
Persons Served By Age and Disability During October 2010 - September 2011(Based On Medicaid and State-Funded IPRS Claims Paid Through January 2012)
The above pie charts show the number and percentage of persons served during the most recent 12 month period for which claims data is available. It only includes persons whose services were paid by Medicaid and State-Funds through the Integrated Payment Reporting System.
Reduction of Short-Term State Psychiatric Hospital Use
Timely Follow-Up After Discharge From A State Facility
MH5,804 86%
SA25 0%
DD353 5%
Dual MH/SA172 3%
Dual MH/DD429 6%
Dual DD/SA0
0%MH/DD/SA
5 0%
Youth (Under Age 18): 6,788
MH9,703 62%
SA1,519 10%
DD591 4%
Dual MH/SA2,987 19% Dual MH/DD
834 5%
Dual DD/SA4
0%
MH/DD/SA55 0%
Adults (Age 18 and Over): 15,693
Rationale: An adequate community service system should provide short-term inpatientcare in a local hospital in the community. This helps families stay involved and reserveshigh-cost state facility beds for consumers with long-term care needs. Reducing the useof state psychiatric hospitals for short-term care allows more effective and efficient useof funds for community services. The goal is to decrease the percentage.
Rationale: Living successfully in one's community after discharge from a state-operated facility depends on smooth and timely transition to community services and supports.Receiving a community-based service within 7 days of discharge is a nationally accepted standard of care that also indicates the local system's community service capacity andcoordination across levels of care. The goal is to increase the percentage. The percentages only include follow-up services paid by Medicaid and state-funds (IPRS).
Western Region Central Region Eastern Region
Western Highlands Network LME serves eight counties in western North Carolina, six of which arerural. Of the 529,000 residents living in this area, 16% are enrolled in Medicaid.
Reduction of Short-Term State Psychiatric Hospital Use:
Overall, the percentage of persons discharged from state hospitals withstays of 7 days or less has decreased over the past 9 quarters. During thisperiod, the percentage has remained below the state average (a lowerpercentage is better for this indicator).
Timely Follow-Up After Discharge From A State Facility:
Overall, the percentage of persons discharged from state hospitals thathave received follow-up care within 7 days of discharge has increased overthe past 9 quarters. Except for one quarter, the percentage has beenabove the state average (a higher percentage is better for this indicator).
Overall, the percentage of persons discharged from ADATCs that havereceived follow-up care within 7 days of discharge has increased slightlyover the past 9 quarters. The percentage has fluctuated around the stateaverage during this time (a higher percentage is better for this indicator).
33%
20% 22%28% 24% 21%
12% 10%17%
0%
20%
40%
60%
80%
100%
Q2 Q3 Q4 Q1 Q2 Q3 Q4 Q1 Q2
SFY10 SFY11 SFY12
Pct of Discharges: Length of Stay 7 Days or Less
LME Highest LME State Average Lowest LME
46%59%
70%64% 67% 62% 63%
70%77%
0%
20%
40%
60%
80%
100%
Q2 Q3 Q4 Q1 Q2 Q3 Q4 Q1 Q2
SFY10 SFY11 SFY12
Pct
of
Per
son
s S
een
W
ith
in 7
Day
s
Timely Follow-Up: Psych Hospitals
LME Highest LME State Average Lowest LME
36% 34%40%
33%46% 44% 40%
46%40%
0%
20%
40%
60%
80%
100%
Q2 Q3 Q4 Q1 Q2 Q3 Q4 Q1 Q2
SFY10 SFY11 SFY12
Pct
of
Per
son
s S
een
Wit
hin
7 D
ays
Timely Follow-Up: ADATCs
LME Highest LME State Average Lowest LME
62

NC Division of Mental Health, Developmental Disabilities, and Substance Abuse ServicesAppendices for Community Systems Progress Report: Second Quarter SFY 2011 - 2012
WESTERN HIGHLANDS NETWORKSo… How Did We Do This Quarter?
Range Among LMEs County
LowestLME
State Average
HighestLME
Buncombe Henderson Madison Mitchell Polk
1. SA Prevention and Early Intervention
Persons in Need Completing Selective and Indicated Programs ↑ 0% 4% 21% 10% <-Data for this indicator is not available at the county level->
2. Timely Access to Care
Urgent ↑ 48% 84% 100% 85% <-Data for this indicator is not available at the county level->
Routine ↑ 37% 72% 98% 65% <-Data for this indicator is not available at the county level->
3. Services to Persons in Need
Adult Mental Health ↑ 31% 50% 74% 60% 63% 38% 74% 58% 48%
Child/Adolescent Mental Health ↑ 34% 55% 80% 65% 71% 56% 73% 52% 67%
Adult Developmental Disabilities ↑ 26% 38% 56% 43% 42% 33% 61% 68% 44%
Child/Adolescent Developmental Disabilities ↑ 12% 19% 33% 27% 29% 23% 34% 24% 19%
Adult Substance Abuse ↑ 6% 12% 16% 14% 16% 10% 16% 16% 6%
Adolescent Substance Abuse ↑ 5% 10% 17% 9% 10% 6% 13% 8% 2%
4. Timely Initiation & Engagement in Service
Mental Health: 2 Visits within 14 Days ↑ 33% 45% 72% 46% 50% 48% 43% 42% 43%
Mental Health: 2 Add'l Visits within Next 30 Days ↑ 17% 29% 41% 31% 36% 29% 23% 26% 29%
Substance Abuse: 2 Visits within 14 Days ↑ 44% 65% 88% 57% 76% 41% 68% 38% 33%
Substance Abuse: 2 Add'l Visits within Next 30 Days ↑ 32% 47% 61% 45% 61% 34% 50% 13% 33%
Mental Health/Developmental Disabilities: 2 Visits within 14 Days ↑ 28% 48% 71% 50% 44% 80% 60% 67% 0%
Mental Health/Developmental Disabilities: 2 Add'l Visits within Next 30 Days ↑ 8% 36% 54% 43% 36% 70% 60% 67% 0%
Mental Health/Substance Abuse: 2 Visits within 14 Days ↑ 42% 63% 91% 71% 72% 81% 82% 79% 60%
Mental Health/Substance Abuse: 2 Add'l Visits within Next 30 Days ↑ 29% 47% 62% 54% 57% 55% 71% 71% 47%
5. Timely Support For Persons With I/DD
First Service within 30 Days of Screening/Triage/Referral ↑ 0% 36% 100% 52% 44% 100% 0% 100% 0%
6. Short-Term Care in State Psychiatric Hospitals
1-7 Days of Care ↓ 0% 20% 38% 17% <-Data for this indicator is not available at the county level->
7. Psychiatric Hospital Readmissions
State Hospitals: Readmitted within 30 Days ↓ 0% 6% 19% 2% <-Data for this indicator is not available at the county level->
State Hospitals: Readmitted within 180 Days ↓ 3% 16% 31% 7% <-Data for this indicator is not available at the county level->
Community Hospitals: Readmitted within 30 Days ↓ 6% 12% 19% 11% 14% 12% 23% 0% 0%
8. Timely Follow-up After Psychiatric Inpatient and Crisis Care
ADATCs: Seen in 1-7 Days ↑ 15% 36% 83% 40% <-Data for this indicator is not available at the county level->
State Hospitals: Seen in 1-7 Days ↑ 17% 53% 90% 77% <-Data for this indicator is not available at the county level->
Community Hospitals: Seen in 1-7 Days ↑ 31% 40% 51% 34% 37% 27% 44% 33% 25%
Crisis Services: Seen in 0-5 Days ↑ 12% 39% 62% 43% 42% 53% 58% 50% 0%
9. Medical Care Coordination
Received a Primary Care/Preventive Health Visit ↑ 87% 91% 94% 92% 91% 94% 94% 88% 92%
* ↑ Goal is to increase the percentage ↓ Goal is to decrease the percentage
Progress Indicator LME
Goa
l*
63

NC Division of Mental Health, Developmental Disabilities, and Substance Abuse ServicesAppendices for Community Systems Progress Report: Second Quarter SFY 2011 - 2012
WESTERN HIGHLANDS NETWORKSo… How Did We Do This Quarter?
Range Among LMEs County
LowestLME
State Average
HighestLME
Rutherford Transylvania Yancey
1. SA Prevention and Early Intervention
Persons in Need Completing Selective and Indicated Programs ↑ 0% 4% 21% 10% <-Data for this indicator is not available at the county level->
2. Timely Access to Care
Urgent ↑ 48% 84% 100% 85% <-Data for this indicator is not available at the county level->
Routine ↑ 37% 72% 98% 65% <-Data for this indicator is not available at the county level->
3. Services to Persons in Need
Adult Mental Health ↑ 31% 50% 74% 60% 88% 46% 57%
Child/Adolescent Mental Health ↑ 34% 55% 80% 65% 61% 61% 70%
Adult Developmental Disabilities ↑ 26% 38% 56% 43% 52% 36% 61%
Child/Adolescent Developmental Disabilities ↑ 12% 19% 33% 27% 21% 20% 49%
Adult Substance Abuse ↑ 6% 12% 16% 14% 16% 10% 13%
Adolescent Substance Abuse ↑ 5% 10% 17% 9% 10% 10% 17%
4. Timely Initiation & Engagement in Service
Mental Health: 2 Visits within 14 Days ↑ 33% 45% 72% 46% 34% 55% 50%
Mental Health: 2 Add'l Visits within Next 30 Days ↑ 17% 29% 41% 31% 22% 32% 31%
Substance Abuse: 2 Visits within 14 Days ↑ 44% 65% 88% 57% 40% 27% 64%
Substance Abuse: 2 Add'l Visits within Next 30 Days ↑ 32% 47% 61% 45% 36% 18% 50%
Mental Health/Developmental Disabilities: 2 Visits within 14 Days ↑ 28% 48% 71% 50% 43% 50% 0%
Mental Health/Developmental Disabilities: 2 Add'l Visits within Next 30 Days ↑ 8% 36% 54% 43% 29% 50% 0%
Mental Health/Substance Abuse: 2 Visits within 14 Days ↑ 42% 63% 91% 71% 62% 74% 50%
Mental Health/Substance Abuse: 2 Add'l Visits within Next 30 Days ↑ 29% 47% 62% 54% 46% 35% 42%
5. Timely Support For Persons With I/DD
First Service within 30 Days of Screening/Triage/Referral ↑ 0% 36% 100% 52% 50% 0% 100%
6. Short-Term Care in State Psychiatric Hospitals
1-7 Days of Care ↓ 0% 20% 38% 17% <-Data for this indicator is not available at the county level->
7. Psychiatric Hospital Readmissions
State Hospitals: Readmitted within 30 Days ↓ 0% 6% 19% 2% <-Data for this indicator is not available at the county level->
State Hospitals: Readmitted within 180 Days ↓ 3% 16% 31% 7% <-Data for this indicator is not available at the county level->
Community Hospitals: Readmitted within 30 Days ↓ 6% 12% 19% 11% 6% 8% 0%
8. Timely Follow-up After Psychiatric Inpatient and Crisis Care
ADATCs: Seen in 1-7 Days ↑ 15% 36% 83% 40% <-Data for this indicator is not available at the county level->
State Hospitals: Seen in 1-7 Days ↑ 17% 53% 90% 77% <-Data for this indicator is not available at the county level->
Community Hospitals: Seen in 1-7 Days ↑ 31% 40% 51% 34% 31% 20% 50%
Crisis Services: Seen in 0-5 Days ↑ 12% 39% 62% 43% 43% 17% 0%
9. Medical Care Coordination
Received a Primary Care/Preventive Health Visit ↑ 87% 91% 94% 92% 92% 94% 92%
* ↑ Goal is to increase the percentage ↓ Goal is to decrease the percentage
Progress Indicator LME
Goa
l*
64

Community Systems Progress Report: Second Quarter SFY 2011-2012
The MH/DD/SAS Community Systems Progress Report, Report
Appendices and Critical Measures at a Glance are published
four times a year on the Division’s website:
http://www.ncdhhs.gov/mhddsas/statspublications/Reports/DivisionIniti
ativeReports/communitysystems/index.htm
Questions and feedback should be directed to:
NC DMH/DD/SAS Quality Management Team
(919/733-0696)