
MGMM ar01
56
Leading theWay MGM MIRAGE > 2001 ANNUAL REPORT >
-
Upload
finance29 -
Category
Economy & Finance
-
view
344 -
download
10
description
Transcript of MGMM ar01
Leading theWayM G M M I R A G E > 2 0 0 1 A N N U A L R E P O RT >
At MGM MIRAGE we create unique and memorable experiences > > > > >
At MGM MIRAGE we create unique and memorable experiences > > > > >
> > The Fountains at Bellagio

> > > we treat our employees well > > > > > > > > > > which translates into greater customer satisfaction > > >
> > > we treat our employees well > > > > > > > > > > which translates into greater customer satisfaction > > >
> > New York-New York Hotel Casino
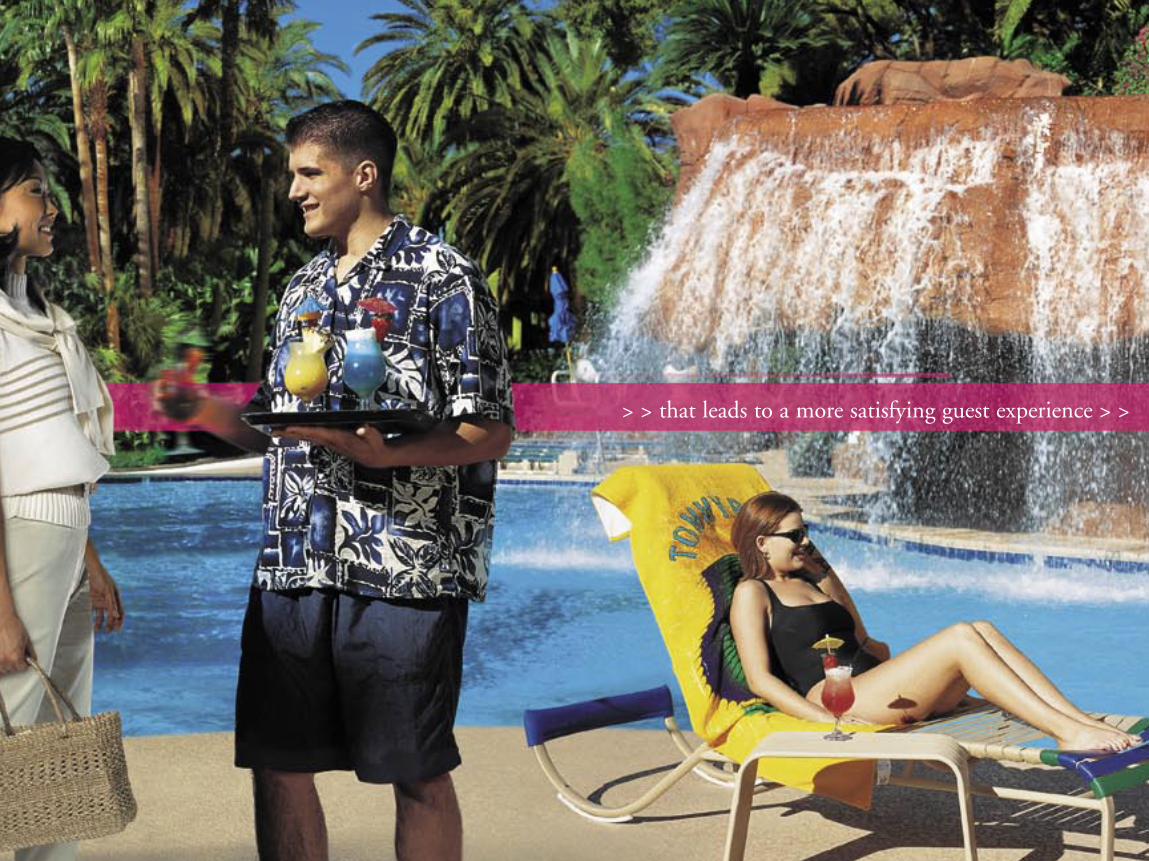
> > that leads to a more satisfying guest experience > > resulting in brand loyalty > > > >

> > that leads to a more satisfying guest experience > > resulting in brand loyalty > > > >
> > The Pool at The Mirage
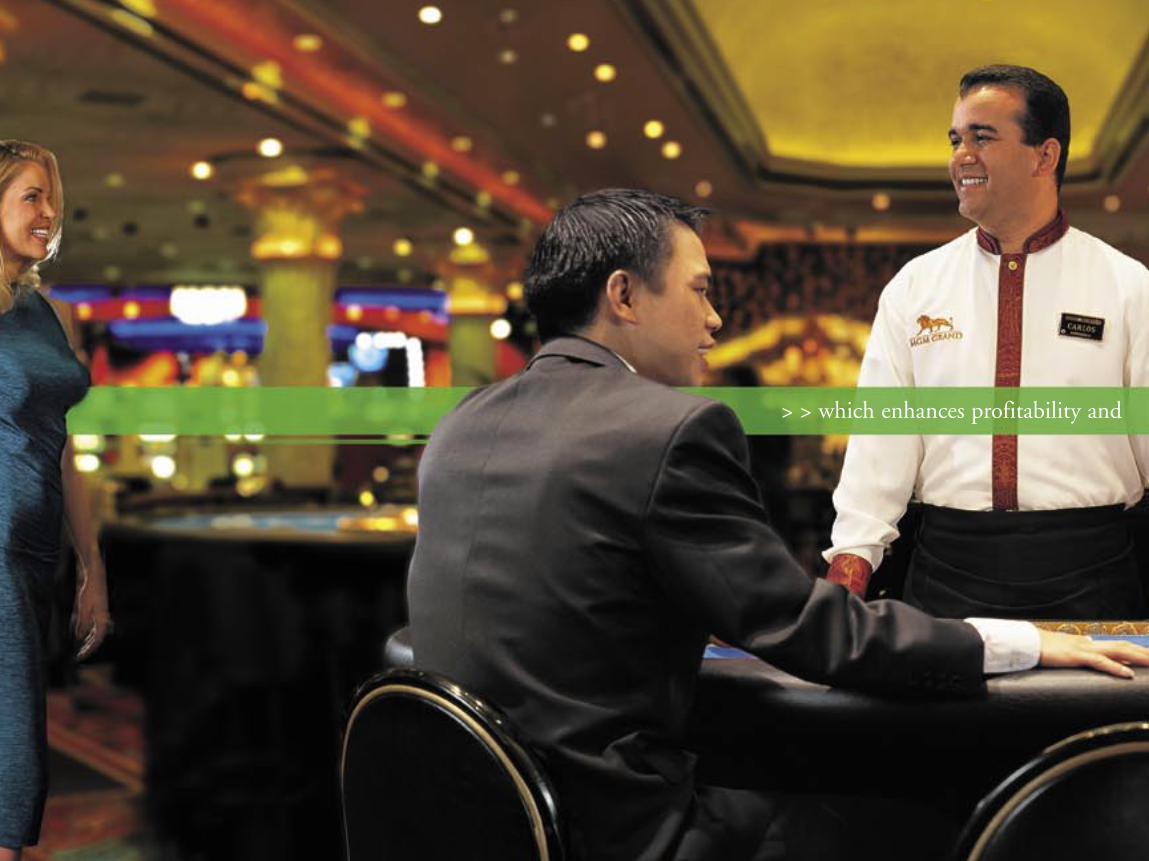
> > which enhances profitability and confidence in the eyes of shareholders > > > >
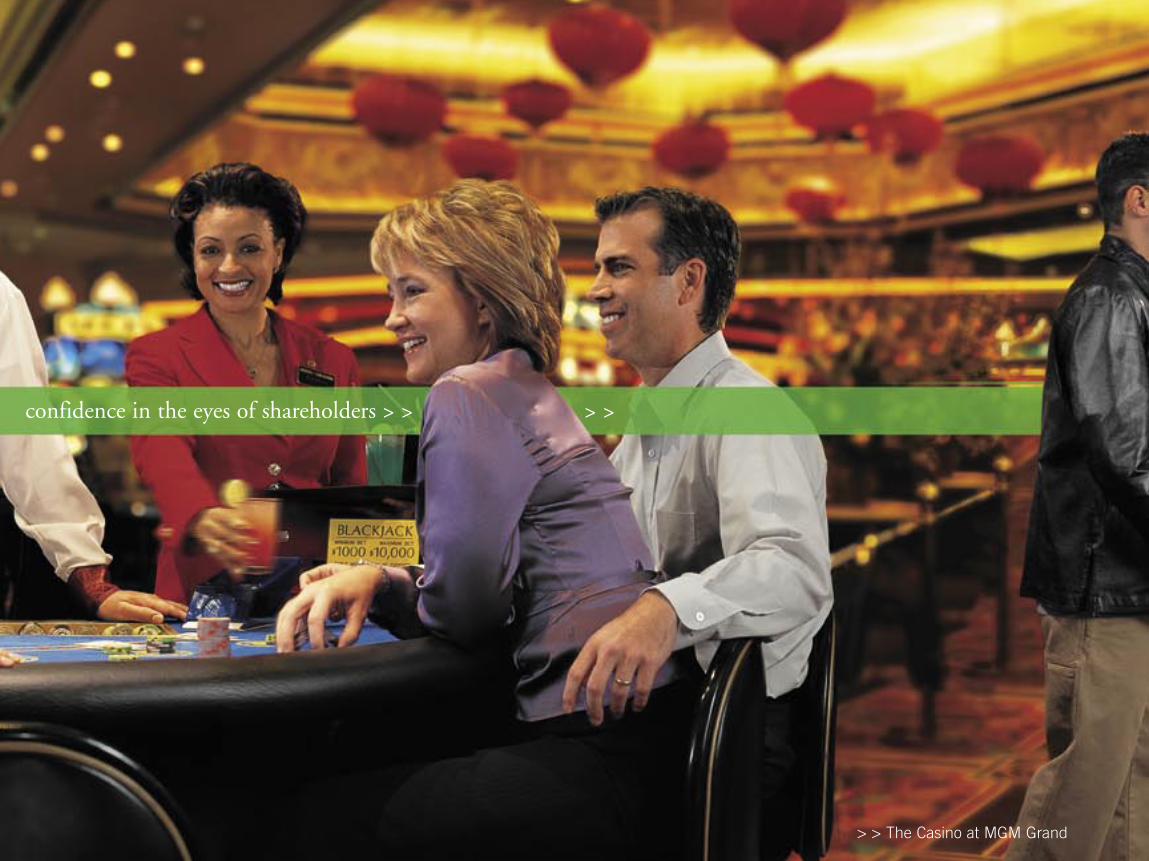
> > which enhances profitability and confidence in the eyes of shareholders > > > >
> > The Casino at MGM Grand

> > > allowing MGM MIRAGE to build even more unique experiences > > > > >
> > The Borgata, Atlantic City

> > > allowing MGM MIRAGE to build even more unique experiences > > > > >
> > making MGM MIRAGE an enduring investment and industry leader > > >
Financial Highlights
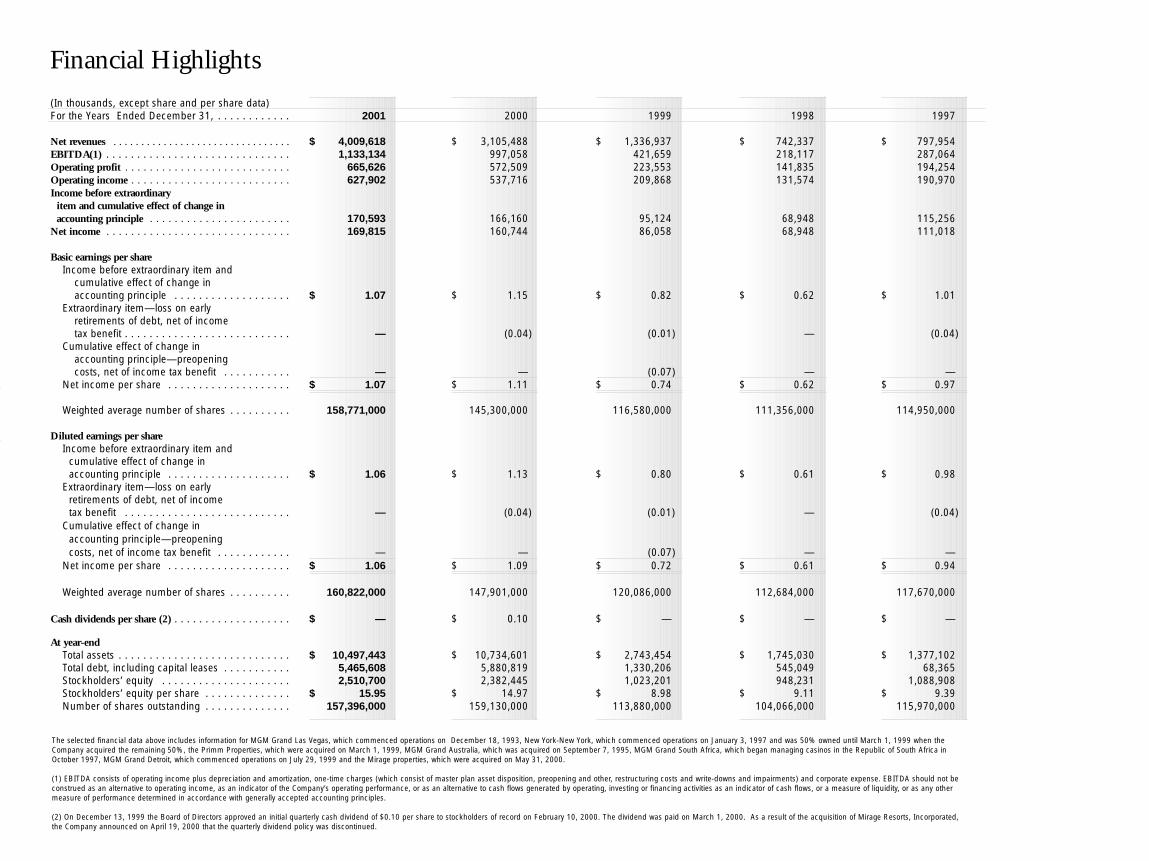
(In thousands, except share and per share data)For the Years Ended December 31, . . . . . . . . . . . . 2001 2000 1999 1998 1997
Net revenues . . . . . . . . . . . . . . . . . . . . . . . . . . . . . . . . $ 4,009,618 $ 3,105,488 $ 1,336,937 $ 742,337 $ 797,954EBITDA(1) . . . . . . . . . . . . . . . . . . . . . . . . . . . . . . 1,133,134 997,058 421,659 218,117 287,064Operating profit . . . . . . . . . . . . . . . . . . . . . . . . . . . 665,626 572,509 223,553 141,835 194,254Operating income . . . . . . . . . . . . . . . . . . . . . . . . . . 627,902 537,716 209,868 131,574 190,970Income before extraordinary
item and cumulative effect of change inaccounting principle . . . . . . . . . . . . . . . . . . . . . . . 170,593 166,160 95,124 68,948 115,256
Net income . . . . . . . . . . . . . . . . . . . . . . . . . . . . . . 169,815 160,744 86,058 68,948 111,018
Basic earnings per shareIncome before extraordinary item and
cumulative effect of change in accounting principle . . . . . . . . . . . . . . . . . . . $ 1.07 $ 1.15 $ 0.82 $ 0.62 $ 1.01
Extraordinary item—loss on earlyretirements of debt, net of incometax benefit . . . . . . . . . . . . . . . . . . . . . . . . . . . — (0.04) (0.01) — (0.04)
Cumulative effect of change in accounting principle—preopeningcosts, net of income tax benefit . . . . . . . . . . . — — (0.07) — —
Net income per share . . . . . . . . . . . . . . . . . . . . $ 1.07 $ 1.11 $ 0.74 $ 0.62 $ 0.97
Weighted average number of shares . . . . . . . . . . 158,771,000 145,300,000 116,580,000 111,356,000 114,950,000
Diluted earnings per shareIncome before extraordinary item and
cumulative effect of change inaccounting principle . . . . . . . . . . . . . . . . . . . . $ 1.06 $ 1.13 $ 0.80 $ 0.61 $ 0.98
Extraordinary item—loss on early retirements of debt, net of income tax benefit . . . . . . . . . . . . . . . . . . . . . . . . . . . — (0.04) (0.01) — (0.04)
Cumulative effect of change inaccounting principle—preopeningcosts, net of income tax benefit . . . . . . . . . . . . — — (0.07) — —
Net income per share . . . . . . . . . . . . . . . . . . . . $ 1.06 $ 1.09 $ 0.72 $ 0.61 $ 0.94
Weighted average number of shares . . . . . . . . . . 160,822,000 147,901,000 120,086,000 112,684,000 117,670,000
Cash dividends per share (2) . . . . . . . . . . . . . . . . . . . $ — $ 0.10 $ — $ — $ —
At year-endTotal assets . . . . . . . . . . . . . . . . . . . . . . . . . . . . $ 10,497,443 $ 10,734,601 $ 2,743,454 $ 1,745,030 $ 1,377,102Total debt, including capital leases . . . . . . . . . . . 5,465,608 5,880,819 1,330,206 545,049 68,365Stockholders’ equity . . . . . . . . . . . . . . . . . . . . . 2,510,700 2,382,445 1,023,201 948,231 1,088,908Stockholders’ equity per share . . . . . . . . . . . . . . $ 15.95 $ 14.97 $ 8.98 $ 9.11 $ 9.39Number of shares outstanding . . . . . . . . . . . . . . 157,396,000 159,130,000 113,880,000 104,066,000 115,970,000
The selected financial data above includes information for MGM Grand Las Vegas, which commenced operations on December 18, 1993, New York-New York, which commenced operations on January 3, 1997 and was 50% owned until March 1, 1999 when theCompany acquired the remaining 50%, the Primm Properties, which were acquired on March 1, 1999, MGM Grand Australia, which was acquired on September 7, 1995, MGM Grand South Africa, which began managing casinos in the Republic of South Africa inOctober 1997, MGM Grand Detroit, which commenced operations on July 29, 1999 and the Mirage properties, which were acquired on May 31, 2000.
(1) EBITDA consists of operating income plus depreciation and amortization, one-time charges (which consist of master plan asset disposition, preopening and other, restructuring costs and write-downs and impairments) and corporate expense. EBITDA should not beconstrued as an alternative to operating income, as an indicator of the Company’s operating performance, or as an alternative to cash flows generated by operating, investing or financing activities as an indicator of cash flows, or a measure of liquidity, or as any othermeasure of performance determined in accordance with generally accepted accounting principles.
(2) On December 13, 1999 the Board of Directors approved an initial quarterly cash dividend of $0.10 per share to stockholders of record on February 10, 2000. The dividend was paid on March 1, 2000. As a result of the acquisition of Mirage Resorts, Incorporated,the Company announced on April 19, 2000 that the quarterly dividend policy was discontinued.
> > making MGM MIRAGE an enduring investment and industry leader > > >
Financial Highlights
(In thousands, except share and per share data)For the Years Ended December 31, . . . . . . . . . . . . 2001 2000 1999 1998 1997
Net revenues . . . . . . . . . . . . . . . . . . . . . . . . . . . . . . . . $ 4,009,618 $ 3,105,488 $ 1,336,937 $ 742,337 $ 797,954EBITDA(1) . . . . . . . . . . . . . . . . . . . . . . . . . . . . . . 1,133,134 997,058 421,659 218,117 287,064Operating profit . . . . . . . . . . . . . . . . . . . . . . . . . . . 665,626 572,509 223,553 141,835 194,254Operating income . . . . . . . . . . . . . . . . . . . . . . . . . . 627,902 537,716 209,868 131,574 190,970Income before extraordinary
item and cumulative effect of change inaccounting principle . . . . . . . . . . . . . . . . . . . . . . . 170,593 166,160 95,124 68,948 115,256
Net income . . . . . . . . . . . . . . . . . . . . . . . . . . . . . . 169,815 160,744 86,058 68,948 111,018
Basic earnings per shareIncome before extraordinary item and
cumulative effect of change in accounting principle . . . . . . . . . . . . . . . . . . . $ 1.07 $ 1.15 $ 0.82 $ 0.62 $ 1.01
Extraordinary item—loss on earlyretirements of debt, net of incometax benefit . . . . . . . . . . . . . . . . . . . . . . . . . . . — (0.04) (0.01) — (0.04)
Cumulative effect of change in accounting principle—preopeningcosts, net of income tax benefit . . . . . . . . . . . — — (0.07) — —
Net income per share . . . . . . . . . . . . . . . . . . . . $ 1.07 $ 1.11 $ 0.74 $ 0.62 $ 0.97
Weighted average number of shares . . . . . . . . . . 158,771,000 145,300,000 116,580,000 111,356,000 114,950,000
Diluted earnings per shareIncome before extraordinary item and
cumulative effect of change inaccounting principle . . . . . . . . . . . . . . . . . . . . $ 1.06 $ 1.13 $ 0.80 $ 0.61 $ 0.98
Extraordinary item—loss on early retirements of debt, net of income tax benefit . . . . . . . . . . . . . . . . . . . . . . . . . . . — (0.04) (0.01) — (0.04)
Cumulative effect of change inaccounting principle—preopeningcosts, net of income tax benefit . . . . . . . . . . . . — — (0.07) — —
Net income per share . . . . . . . . . . . . . . . . . . . . $ 1.06 $ 1.09 $ 0.72 $ 0.61 $ 0.94
Weighted average number of shares . . . . . . . . . . 160,822,000 147,901,000 120,086,000 112,684,000 117,670,000
Cash dividends per share (2) . . . . . . . . . . . . . . . . . . . $ — $ 0.10 $ — $ — $ —
At year-endTotal assets . . . . . . . . . . . . . . . . . . . . . . . . . . . . $ 10,497,443 $ 10,734,601 $ 2,743,454 $ 1,745,030 $ 1,377,102Total debt, including capital leases . . . . . . . . . . . 5,465,608 5,880,819 1,330,206 545,049 68,365Stockholders’ equity . . . . . . . . . . . . . . . . . . . . . 2,510,700 2,382,445 1,023,201 948,231 1,088,908Stockholders’ equity per share . . . . . . . . . . . . . . $ 15.95 $ 14.97 $ 8.98 $ 9.11 $ 9.39Number of shares outstanding . . . . . . . . . . . . . . 157,396,000 159,130,000 113,880,000 104,066,000 115,970,000
The selected financial data above includes information for MGM Grand Las Vegas, which commenced operations on December 18, 1993, New York-New York, which commenced operations on January 3, 1997 and was 50% owned until March 1, 1999 when theCompany acquired the remaining 50%, the Primm Properties, which were acquired on March 1, 1999, MGM Grand Australia, which was acquired on September 7, 1995, MGM Grand South Africa, which began managing casinos in the Republic of South Africa inOctober 1997, MGM Grand Detroit, which commenced operations on July 29, 1999 and the Mirage properties, which were acquired on May 31, 2000.
(1) EBITDA consists of operating income plus depreciation and amortization, one-time charges (which consist of master plan asset disposition, preopening and other, restructuring costs and write-downs and impairments) and corporate expense. EBITDA should not beconstrued as an alternative to operating income, as an indicator of the Company’s operating performance, or as an alternative to cash flows generated by operating, investing or financing activities as an indicator of cash flows, or a measure of liquidity, or as any othermeasure of performance determined in accordance with generally accepted accounting principles.
(2) On December 13, 1999 the Board of Directors approved an initial quarterly cash dividend of $0.10 per share to stockholders of record on February 10, 2000. The dividend was paid on March 1, 2000. As a result of the acquisition of Mirage Resorts, Incorporated,the Company announced on April 19, 2000 that the quarterly dividend policy was discontinued.

We have always operated our company based upon a few simple beliefs:create resorts of memorable character, treat our employees well andprovide superior service for our guests.
In turn, we have enjoyed customer loyalty unmatched in our industry,which has translated into enhanced profitability and confidence in theeyes of our shareholders and lending institutions.
These relationships – with guests, employees and Wall Street – allowyour company to seek out new opportunities, support them with anappropriate level of investment and strive to raise the bar and createnew levels of service and excitement.
These beliefs have proven true in a time of intense competition andunprecedented growth. I’ve often heard the expression "tried and true,"but I’m not sure I came to a full appreciation of its significance untilthis year.
At the height of this competition billions of dollars were invested. Ourcompany, as well as our competitors, created exciting new resorts andopened new markets. As the stakes were raised and re-raised, our formulacontinued to prove true, and we were able to create enduring investmentsfor our shareholders by producing industry-leading results.
In my role as Chairman of your company, it is my responsibility in thisreport to share with you the highlights of our business. This year, thesehighlights pale in comparison to the display of united purpose by yourcompany’s employees to keep our business healthy and make our guestsfeel welcome.
No one could have imagined what happened on September 11. At atime of unprecedented slowdowns in business, your company reboundedfaster and stronger than virtually every other company in our industry.This was a direct result of our ability to react in times of uncertainty.
September 11 marked a moment in history when we learned anew of theimportance of leadership and teamwork and the meaning of heroism.We learned that heroism can come from the simple act of doing your jobwell under extraordinary circumstances. We learned that leaders come fromevery walk of life, ethnicity, gender and race. And we learned that teamworkis far more than a mechanism for getting a job done. It is an inspirationalvehicle for carrying people through difficult and challenging times.
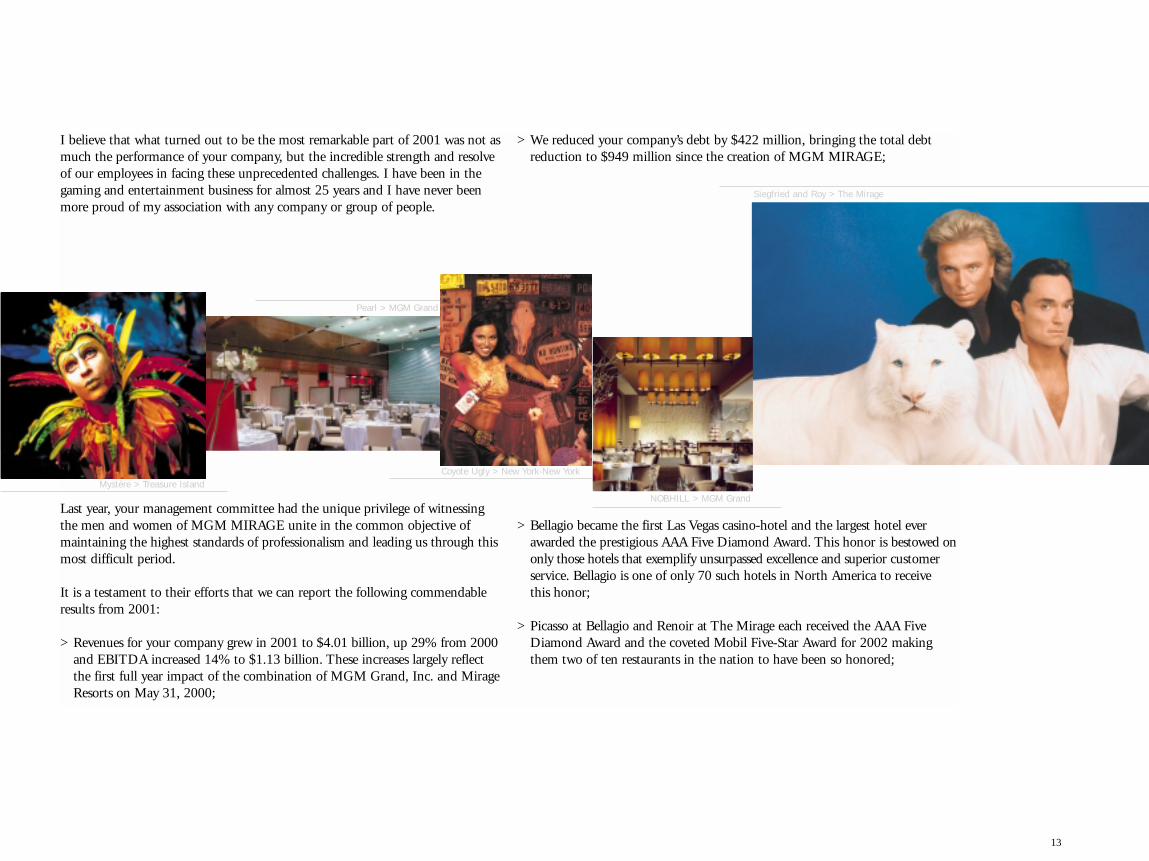
I believe that what turned out to be the most remarkable part of 2001 was not asmuch the performance of your company, but the incredible strength and resolveof our employees in facing these unprecedented challenges. I have been in thegaming and entertainment business for almost 25 years and I have never beenmore proud of my association with any company or group of people.
Last year, your management committee had the unique privilege of witnessingthe men and women of MGM MIRAGE unite in the common objective ofmaintaining the highest standards of professionalism and leading us through thismost difficult period.
It is a testament to their efforts that we can report the following commendableresults from 2001:
> Revenues for your company grew in 2001 to $4.01 billion, up 29% from 2000and EBITDA increased 14% to $1.13 billion. These increases largely reflect the first full year impact of the combination of MGM Grand, Inc. and MirageResorts on May 31, 2000;
> We reduced your company’s debt by $422 million, bringing the total debt reduction to $949 million since the creation of MGM MIRAGE;
> Bellagio became the first Las Vegas casino-hotel and the largest hotel ever awarded the prestigious AAA Five Diamond Award. This honor is bestowed ononly those hotels that exemplify unsurpassed excellence and superior customer service. Bellagio is one of only 70 such hotels in North America to receive this honor;
> Picasso at Bellagio and Renoir at The Mirage each received the AAA Five Diamond Award and the coveted Mobil Five-Star Award for 2002 making them two of ten restaurants in the nation to have been so honored;
“We have always operated our company based upon a few simple beliefs.” > > >
To Our Shareholders
13
Coyote Ugly > New York-New York
Pearl > MGM Grand
NOBHILL > MGM Grand
Siegfried and Roy > The Mirage
> J. Terrence Lanni > Chairman and Chief Executive Officer
Mystère > Treasure Island
We have always operated our company based upon a few simple beliefs:create resorts of memorable character, treat our employees well andprovide superior service for our guests.
In turn, we have enjoyed customer loyalty unmatched in our industry,which has translated into enhanced profitability and confidence in theeyes of our shareholders and lending institutions.
These relationships – with guests, employees and Wall Street – allowyour company to seek out new opportunities, support them with anappropriate level of investment and strive to raise the bar and createnew levels of service and excitement.
These beliefs have proven true in a time of intense competition andunprecedented growth. I’ve often heard the expression "tried and true,"but I’m not sure I came to a full appreciation of its significance untilthis year.
At the height of this competition billions of dollars were invested. Ourcompany, as well as our competitors, created exciting new resorts andopened new markets. As the stakes were raised and re-raised, our formulacontinued to prove true, and we were able to create enduring investmentsfor our shareholders by producing industry-leading results.
In my role as Chairman of your company, it is my responsibility in thisreport to share with you the highlights of our business. This year, thesehighlights pale in comparison to the display of united purpose by yourcompany’s employees to keep our business healthy and make our guestsfeel welcome.
No one could have imagined what happened on September 11. At atime of unprecedented slowdowns in business, your company reboundedfaster and stronger than virtually every other company in our industry.This was a direct result of our ability to react in times of uncertainty.
September 11 marked a moment in history when we learned anew of theimportance of leadership and teamwork and the meaning of heroism.We learned that heroism can come from the simple act of doing your jobwell under extraordinary circumstances. We learned that leaders come fromevery walk of life, ethnicity, gender and race. And we learned that teamworkis far more than a mechanism for getting a job done. It is an inspirationalvehicle for carrying people through difficult and challenging times.
I believe that what turned out to be the most remarkable part of 2001 was not asmuch the performance of your company, but the incredible strength and resolveof our employees in facing these unprecedented challenges. I have been in thegaming and entertainment business for almost 25 years and I have never beenmore proud of my association with any company or group of people.
Last year, your management committee had the unique privilege of witnessingthe men and women of MGM MIRAGE unite in the common objective ofmaintaining the highest standards of professionalism and leading us through thismost difficult period.
It is a testament to their efforts that we can report the following commendableresults from 2001:
> Revenues for your company grew in 2001 to $4.01 billion, up 29% from 2000and EBITDA increased 14% to $1.13 billion. These increases largely reflect the first full year impact of the combination of MGM Grand, Inc. and MirageResorts on May 31, 2000;
> We reduced your company’s debt by $422 million, bringing the total debt reduction to $949 million since the creation of MGM MIRAGE;
> Bellagio became the first Las Vegas casino-hotel and the largest hotel ever awarded the prestigious AAA Five Diamond Award. This honor is bestowed ononly those hotels that exemplify unsurpassed excellence and superior customer service. Bellagio is one of only 70 such hotels in North America to receive this honor;
> Picasso at Bellagio and Renoir at The Mirage each received the AAA Five Diamond Award and the coveted Mobil Five-Star Award for 2002 making them two of ten restaurants in the nation to have been so honored;
“We have always operated our company based upon a few simple beliefs.” > > >
To Our Shareholders
13
Coyote Ugly > New York-New York
Pearl > MGM Grand
NOBHILL > MGM Grand
Siegfried and Roy > The Mirage
> J. Terrence Lanni > Chairman and Chief Executive Officer
Mystère > Treasure Island
> Primm Valley Resorts at the California-Nevada state line opened the Primm Center offering a one-stop, 24-hour-a-day reservation kiosk for travelers en route to Las Vegas allowing them to book real-time accommodations, enter-tainment and restaurants at all Las Vegas-based MGM MIRAGE resorts.
> We made significant progress in the design and implementation of our DiversityInitiative. We have developed a top-to-bottom organizational structure to supportour diversity efforts. We have developed an extensive strategic plan with specificprograms and objectives for each department within our company, and we have
developed a reliable tracking system to provide meaningful data on these efforts.Our resolve as a company has only strengthened and our focus sharpened by all that we have learned during the past year;
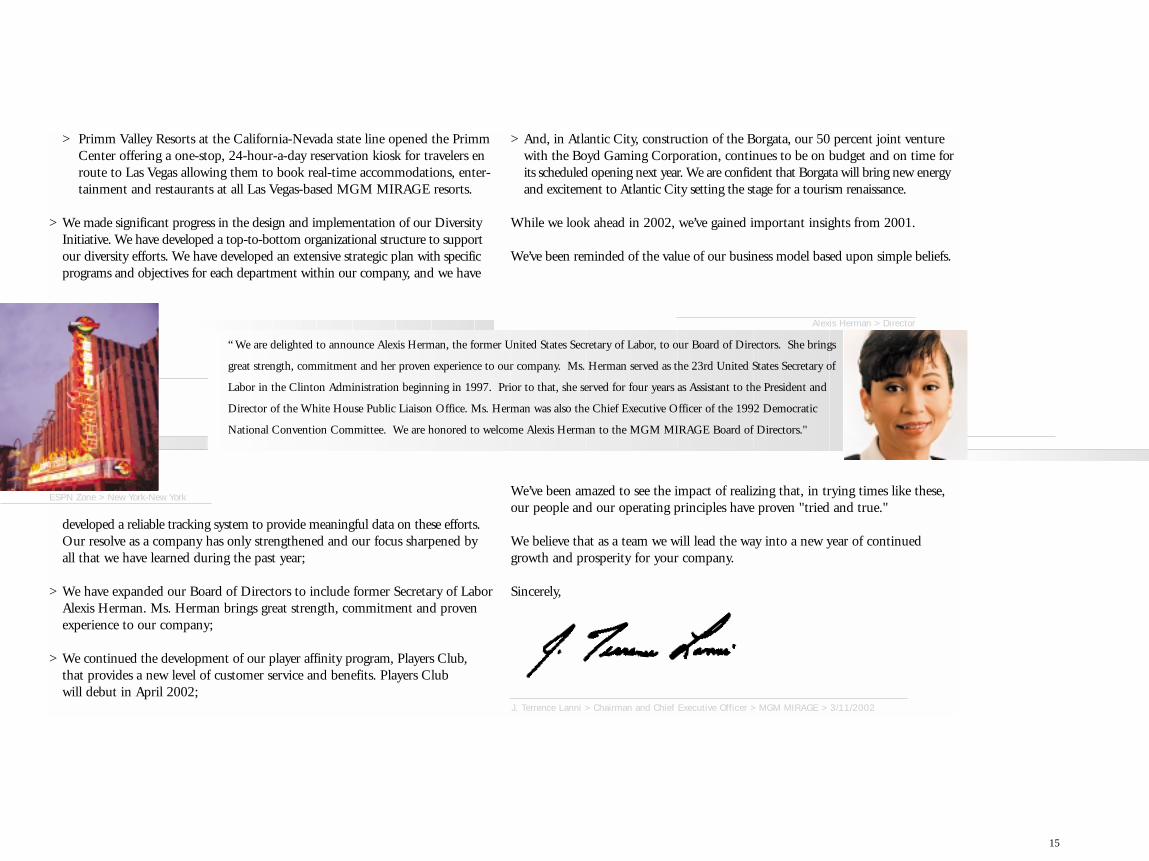
> We have expanded our Board of Directors to include former Secretary of LaborAlexis Herman. Ms. Herman brings great strength, commitment and proven experience to our company;
> We continued the development of our player affinity program, Players Club,that provides a new level of customer service and benefits. Players Club will debut in April 2002;
> And, in Atlantic City, construction of the Borgata, our 50 percent joint venturewith the Boyd Gaming Corporation, continues to be on budget and on time forits scheduled opening next year. We are confident that Borgata will bring new energyand excitement to Atlantic City setting the stage for a tourism renaissance.
While we look ahead in 2002, we’ve gained important insights from 2001.
We’ve been reminded of the value of our business model based upon simple beliefs.
We’ve been amazed to see the impact of realizing that, in trying times like these,our people and our operating principles have proven "tried and true."
We believe that as a team we will lead the way into a new year of continuedgrowth and prosperity for your company.
Sincerely,
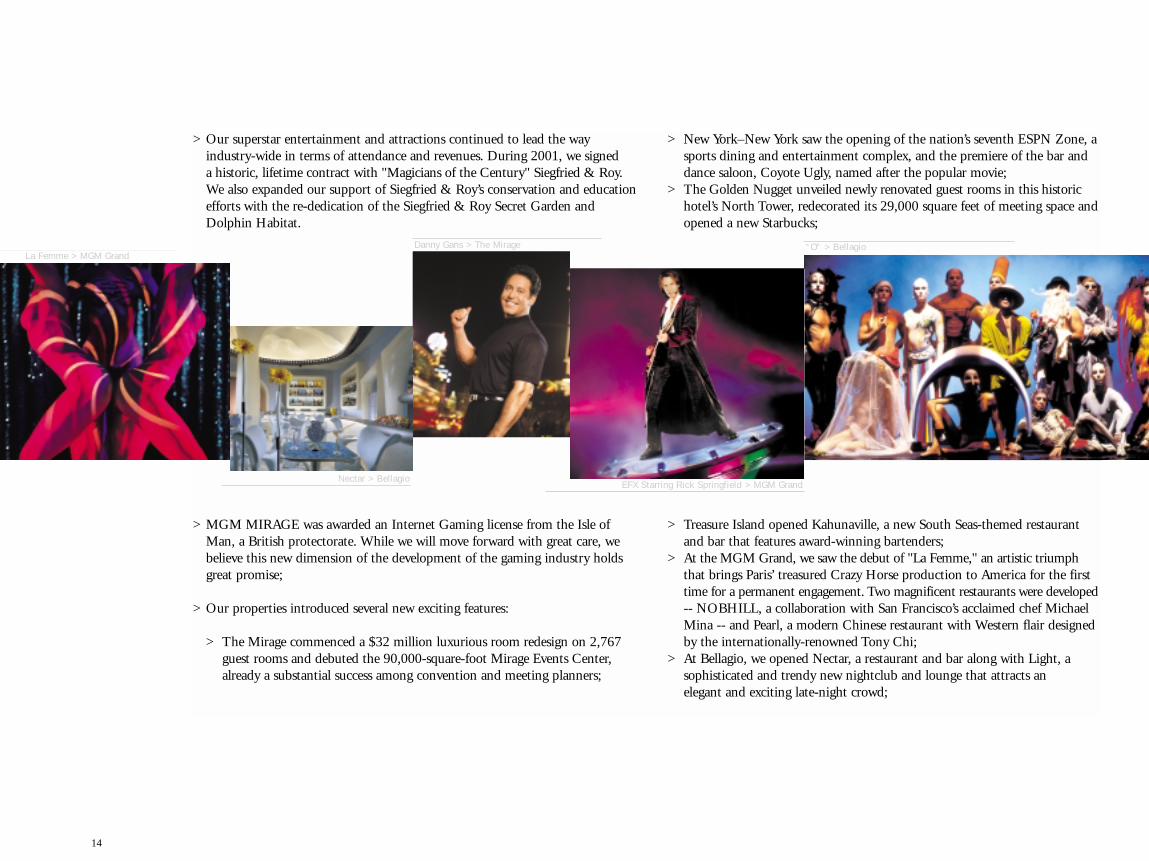
> Our superstar entertainment and attractions continued to lead the way industry-wide in terms of attendance and revenues. During 2001, we signed a historic, lifetime contract with "Magicians of the Century" Siegfried & Roy.We also expanded our support of Siegfried & Roy’s conservation and educationefforts with the re-dedication of the Siegfried & Roy Secret Garden and Dolphin Habitat.
> MGM MIRAGE was awarded an Internet Gaming license from the Isle of Man, a British protectorate. While we will move forward with great care, we believe this new dimension of the development of the gaming industry holds great promise;
> Our properties introduced several new exciting features:
> The Mirage commenced a $32 million luxurious room redesign on 2,767 guest rooms and debuted the 90,000-square-foot Mirage Events Center, already a substantial success among convention and meeting planners;
> New York–New York saw the opening of the nation’s seventh ESPN Zone, asports dining and entertainment complex, and the premiere of the bar and dance saloon, Coyote Ugly, named after the popular movie;
> The Golden Nugget unveiled newly renovated guest rooms in this historichotel’s North Tower, redecorated its 29,000 square feet of meeting space andopened a new Starbucks;
> Treasure Island opened Kahunaville, a new South Seas-themed restaurant and bar that features award-winning bartenders;
> At the MGM Grand, we saw the debut of "La Femme," an artistic triumphthat brings Paris’ treasured Crazy Horse production to America for the first time for a permanent engagement. Two magnificent restaurants were developed-- NOBHILL, a collaboration with San Francisco’s acclaimed chef Michael Mina -- and Pearl, a modern Chinese restaurant with Western flair designed by the internationally-renowned Tony Chi;
> At Bellagio, we opened Nectar, a restaurant and bar along with Light, a sophisticated and trendy new nightclub and lounge that attracts an elegant and exciting late-night crowd;
J. Terrence Lanni > Chairman and Chief Executive Officer > MGM MIRAGE > 3/11/2002
Alexis Herman > Director
1514
La Femme > MGM Grand
Nectar > Bellagio
“O” > Bellagio
ESPN Zone > New York-New YorkEFX Starring Rick Springfield > MGM Grand
Danny Gans > The Mirage
“ We are delighted to announce Alexis Herman, the former United States Secretary of Labor, to our Board of Directors. She brings
great strength, commitment and her proven experience to our company. Ms. Herman served as the 23rd United States Secretary of
Labor in the Clinton Administration beginning in 1997. Prior to that, she served for four years as Assistant to the President and
Director of the White House Public Liaison Office. Ms. Herman was also the Chief Executive Officer of the 1992 Democratic
National Convention Committee. We are honored to welcome Alexis Herman to the MGM MIRAGE Board of Directors."
> Primm Valley Resorts at the California-Nevada state line opened the Primm Center offering a one-stop, 24-hour-a-day reservation kiosk for travelers en route to Las Vegas allowing them to book real-time accommodations, enter-tainment and restaurants at all Las Vegas-based MGM MIRAGE resorts.
> We made significant progress in the design and implementation of our DiversityInitiative. We have developed a top-to-bottom organizational structure to supportour diversity efforts. We have developed an extensive strategic plan with specificprograms and objectives for each department within our company, and we have
developed a reliable tracking system to provide meaningful data on these efforts.Our resolve as a company has only strengthened and our focus sharpened by all that we have learned during the past year;
> We have expanded our Board of Directors to include former Secretary of LaborAlexis Herman. Ms. Herman brings great strength, commitment and proven experience to our company;
> We continued the development of our player affinity program, Players Club,that provides a new level of customer service and benefits. Players Club will debut in April 2002;
> And, in Atlantic City, construction of the Borgata, our 50 percent joint venturewith the Boyd Gaming Corporation, continues to be on budget and on time forits scheduled opening next year. We are confident that Borgata will bring new energyand excitement to Atlantic City setting the stage for a tourism renaissance.
While we look ahead in 2002, we’ve gained important insights from 2001.
We’ve been reminded of the value of our business model based upon simple beliefs.
We’ve been amazed to see the impact of realizing that, in trying times like these,our people and our operating principles have proven "tried and true."
We believe that as a team we will lead the way into a new year of continuedgrowth and prosperity for your company.
Sincerely,
> Our superstar entertainment and attractions continued to lead the way industry-wide in terms of attendance and revenues. During 2001, we signed a historic, lifetime contract with "Magicians of the Century" Siegfried & Roy.We also expanded our support of Siegfried & Roy’s conservation and educationefforts with the re-dedication of the Siegfried & Roy Secret Garden and Dolphin Habitat.
> MGM MIRAGE was awarded an Internet Gaming license from the Isle of Man, a British protectorate. While we will move forward with great care, we believe this new dimension of the development of the gaming industry holds great promise;
> Our properties introduced several new exciting features:
> The Mirage commenced a $32 million luxurious room redesign on 2,767 guest rooms and debuted the 90,000-square-foot Mirage Events Center, already a substantial success among convention and meeting planners;
> New York–New York saw the opening of the nation’s seventh ESPN Zone, asports dining and entertainment complex, and the premiere of the bar and dance saloon, Coyote Ugly, named after the popular movie;
> The Golden Nugget unveiled newly renovated guest rooms in this historichotel’s North Tower, redecorated its 29,000 square feet of meeting space andopened a new Starbucks;
> Treasure Island opened Kahunaville, a new South Seas-themed restaurant and bar that features award-winning bartenders;
> At the MGM Grand, we saw the debut of "La Femme," an artistic triumphthat brings Paris’ treasured Crazy Horse production to America for the first time for a permanent engagement. Two magnificent restaurants were developed-- NOBHILL, a collaboration with San Francisco’s acclaimed chef Michael Mina -- and Pearl, a modern Chinese restaurant with Western flair designed by the internationally-renowned Tony Chi;
> At Bellagio, we opened Nectar, a restaurant and bar along with Light, a sophisticated and trendy new nightclub and lounge that attracts an elegant and exciting late-night crowd;
J. Terrence Lanni > Chairman and Chief Executive Officer > MGM MIRAGE > 3/11/2002
Alexis Herman > Director
1514
La Femme > MGM Grand
Nectar > Bellagio
“O” > Bellagio
ESPN Zone > New York-New YorkEFX Starring Rick Springfield > MGM Grand
Danny Gans > The Mirage
“ We are delighted to announce Alexis Herman, the former United States Secretary of Labor, to our Board of Directors. She brings
great strength, commitment and her proven experience to our company. Ms. Herman served as the 23rd United States Secretary of
Labor in the Clinton Administration beginning in 1997. Prior to that, she served for four years as Assistant to the President and
Director of the White House Public Liaison Office. Ms. Herman was also the Chief Executive Officer of the 1992 Democratic
National Convention Committee. We are honored to welcome Alexis Herman to the MGM MIRAGE Board of Directors."
It is perhaps surprising that your company performed well for most of the year inlight of a U.S. economy officially in recession since March until you consider theunique attributes of the gaming industry. Gaming continues to exhibit the samerecession-resistant characteristics as it did in the 1990-1992 recession. This ismost likely because, although consumer confidence and therefore discretionaryspending falls during economic contraction, our business seems less affected dueto the wealth and age of our customer base. The average age of a U.S. gamingpatron is 49 years old. The 45-64 year old age category is growing three times asfast as the overall U.S. population and someone will turn 49every 8 seconds over the next 15 years! These customers as agroup are less affected by corporate layoffs, stock market volatility,
or rising unemployment because they are typically older with wealth tied to realestate or fixed income. According to the American Gaming Association, U.S.travelers devoted nearly as many trips to gaming vacations as they did to adven-ture and theme park trips in 2000; and more than trips to sporting events or golfvacations. In Las Vegas, we have learned that the best properties with the bestemployees in the best locations continue to attract the most business. Your com-pany owns most of these properties, and this is why we are leading the surprisingrebound in Las Vegas.
While we expect the U.S. economy will remain sluggish again this year, with amodest upturn beginning in the second half, the most recent economic indicatorshave been more encouraging, pointing to an earlier recovery. There is no doubtthat Las Vegas and your company would prefer to see economic prosperity,
because gaming revenue is dependent on consumer spending and GDP growthand is therefore cyclical. However, our resilience to the slowdown has been impres-sive. The reduction in consumer spending in 2001 affected most areas of theeconomy more profoundly than gaming because of our strong value proposition.Your company provides the highest quality experience in every market segment in
which it operates, and yet a night’s stay at the AAA Five Diamond resort Bellagio costs far less than comparable resorts in other cities.
Our industry also shows improving supply and demand characteristics, and thisgenerally makes for higher and more stable cash flows. After two decades of dra-matic capacity expansion, only a scant few properties will open over the next fewyears. The riverboat markets have matured, there is only one new resort in theplanning stages in Las Vegas, and new jurisdiction opportunities are remote. Theonly major property to open next year is Borgata, a luxurious new resort inAtlantic City that your company owns with Boyd Gaming.
We ushered in 2001 full of confidence and promise having just complet-ed the most rewarding year in your company’s history. As the new yearprogressed, earnings continued to grow rapidly as the combination of
MGM Grand and Mirage Resorts yielded ever-greater benefits. We con-tinued to energize your properties with added attractions and improvedmarketing, while significant cost savings further improved operatingresults. We tackled every challenge we faced – a slowing economy, thena recession; global weakness particularly in Asia; supply issues in LasVegas; integration of a large acquisition – and yet quarter after quarter,for over three years, your company fulfilled its promise to Wall Street asearnings expanded. After strong first half earnings, we were on track toreport a great third quarter, further evidence of your company’sresilience. Then came September 11, 2001. Your company tackled thisunprecedented challenge in the same manner as we have faced otherchallenges. We persevered through the unified and tireless efforts of ourthousands of employees and were guided by many important decisions
by management to enhance revenues and reduce costs. Strategies imple-mented last fall are working. Revenues are rising and earnings areimproving as the recovery of our business is firmly underway. And thatis why, as we go to print with your annual report for 2001, your man-agement is optimistic about the health of your company and its potentialfor further growth.
Entering the recession, there was common concern that the gamingindustry would be adversely affected, however, this did not happen. Themajor players, including your company, increased earnings in the firsthalf of 2001 versus a 17% earnings decline in the S&P 500.
FinancialOverview
James J. Murren > President, Chief Financial Officer and Treasurer > MGM MIRAGE
17
“We continue to deploy strategies aimed at maximizing free cash flow and shareholder value.” > > > >
$0 $200 $400 $600 $800 $1,000 $1,200
1999
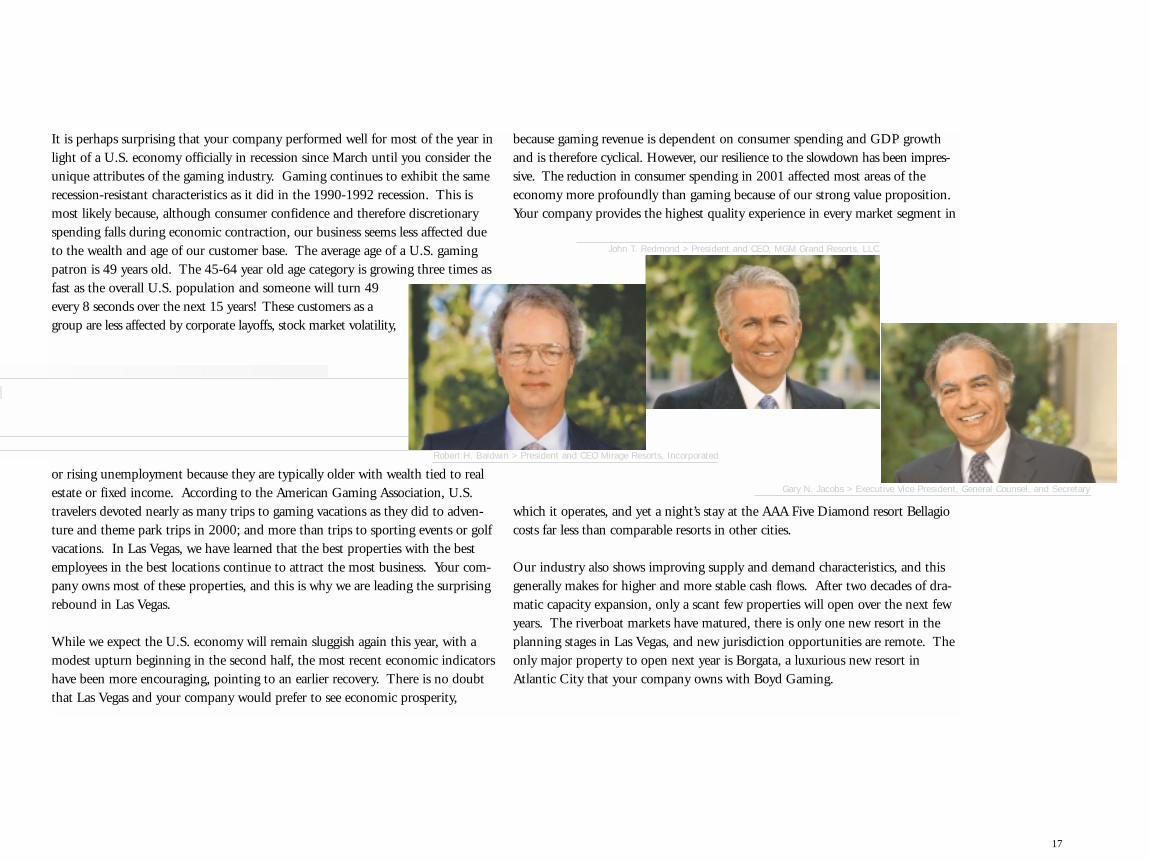
$1,1332001
2000 $997
$422
MGM MIRAGEEBITDA (1)
($ Millions)
Robert H. Baldwin > President and CEO Mirage Resorts, Incorporated
John T. Redmond > President and CEO, MGM Grand Resorts, LLC
Gary N. Jacobs > Executive Vice President, General Counsel, and Secretary
(1) EBITDA consists of operating income plus depreciation and amortization, one-time charges(which consist of preopening and other, restructuring costs and write-downs and impairments)and corporate expense. EBITDA should not be construed as an alternative to operating income,as an indicator of the Company's operating performance, or as an alternative to cash flows gen-erated by operating, investing or financing activities as an indicator of cash flows, or a measureof liquidity, or as any other measure of performance determined in accordance with generallyaccepted accounting principles.
It is perhaps surprising that your company performed well for most of the year inlight of a U.S. economy officially in recession since March until you consider theunique attributes of the gaming industry. Gaming continues to exhibit the samerecession-resistant characteristics as it did in the 1990-1992 recession. This ismost likely because, although consumer confidence and therefore discretionaryspending falls during economic contraction, our business seems less affected dueto the wealth and age of our customer base. The average age of a U.S. gamingpatron is 49 years old. The 45-64 year old age category is growing three times asfast as the overall U.S. population and someone will turn 49every 8 seconds over the next 15 years! These customers as agroup are less affected by corporate layoffs, stock market volatility,
or rising unemployment because they are typically older with wealth tied to realestate or fixed income. According to the American Gaming Association, U.S.travelers devoted nearly as many trips to gaming vacations as they did to adven-ture and theme park trips in 2000; and more than trips to sporting events or golfvacations. In Las Vegas, we have learned that the best properties with the bestemployees in the best locations continue to attract the most business. Your com-pany owns most of these properties, and this is why we are leading the surprisingrebound in Las Vegas.
While we expect the U.S. economy will remain sluggish again this year, with amodest upturn beginning in the second half, the most recent economic indicatorshave been more encouraging, pointing to an earlier recovery. There is no doubtthat Las Vegas and your company would prefer to see economic prosperity,
because gaming revenue is dependent on consumer spending and GDP growthand is therefore cyclical. However, our resilience to the slowdown has been impres-sive. The reduction in consumer spending in 2001 affected most areas of theeconomy more profoundly than gaming because of our strong value proposition.Your company provides the highest quality experience in every market segment in
which it operates, and yet a night’s stay at the AAA Five Diamond resort Bellagio costs far less than comparable resorts in other cities.
Our industry also shows improving supply and demand characteristics, and thisgenerally makes for higher and more stable cash flows. After two decades of dra-matic capacity expansion, only a scant few properties will open over the next fewyears. The riverboat markets have matured, there is only one new resort in theplanning stages in Las Vegas, and new jurisdiction opportunities are remote. Theonly major property to open next year is Borgata, a luxurious new resort inAtlantic City that your company owns with Boyd Gaming.
We ushered in 2001 full of confidence and promise having just complet-ed the most rewarding year in your company’s history. As the new yearprogressed, earnings continued to grow rapidly as the combination of
MGM Grand and Mirage Resorts yielded ever-greater benefits. We con-tinued to energize your properties with added attractions and improvedmarketing, while significant cost savings further improved operatingresults. We tackled every challenge we faced – a slowing economy, thena recession; global weakness particularly in Asia; supply issues in LasVegas; integration of a large acquisition – and yet quarter after quarter,for over three years, your company fulfilled its promise to Wall Street asearnings expanded. After strong first half earnings, we were on track toreport a great third quarter, further evidence of your company’sresilience. Then came September 11, 2001. Your company tackled thisunprecedented challenge in the same manner as we have faced otherchallenges. We persevered through the unified and tireless efforts of ourthousands of employees and were guided by many important decisions
by management to enhance revenues and reduce costs. Strategies imple-mented last fall are working. Revenues are rising and earnings areimproving as the recovery of our business is firmly underway. And thatis why, as we go to print with your annual report for 2001, your man-agement is optimistic about the health of your company and its potentialfor further growth.
Entering the recession, there was common concern that the gamingindustry would be adversely affected, however, this did not happen. Themajor players, including your company, increased earnings in the firsthalf of 2001 versus a 17% earnings decline in the S&P 500.
FinancialOverview
James J. Murren > President, Chief Financial Officer and Treasurer > MGM MIRAGE
17
“We continue to deploy strategies aimed at maximizing free cash flow and shareholder value.” > > > >
$0 $200 $400 $600 $800 $1,000 $1,200
1999
$1,1332001
2000 $997
$422
MGM MIRAGEEBITDA (1)
($ Millions)
Robert H. Baldwin > President and CEO Mirage Resorts, Incorporated
John T. Redmond > President and CEO, MGM Grand Resorts, LLC
Gary N. Jacobs > Executive Vice President, General Counsel, and Secretary
(1) EBITDA consists of operating income plus depreciation and amortization, one-time charges(which consist of preopening and other, restructuring costs and write-downs and impairments)and corporate expense. EBITDA should not be construed as an alternative to operating income,as an indicator of the Company's operating performance, or as an alternative to cash flows gen-erated by operating, investing or financing activities as an indicator of cash flows, or a measureof liquidity, or as any other measure of performance determined in accordance with generallyaccepted accounting principles.
More limited capital requirements over the next few years should lead to risingfree or excess cash flow which would be available to reduce debt, repurchaseshares or invest for growth. The gaming industry as a whole enjoyed risingreturns on investment in 2001 due to this favorable relationship between gooddemand trends and limited new supply. We expect this important trend will continue this year and next.
The ownership of casinos is by nature very asset intensive. With limited newjurisdiction opportunities, new capital will focus on more established marketssuch as Atlantic City and Las Vegas where decisions will be based on carefulreturn on capital analysis and plenty of statistical information.
MGM MIRAGE is best positioned in the Las Vegas marketplace. We are nowsetting our development sights on Atlantic City, where your company owns themost attractive real estate in this market. The company's property now calledRenaissance Pointe will be home to three new resorts. Borgata will debut nextsummer and will set a new standard for resorts on the East Coast. The first newAtlantic City property to open in 13 years, Borgata sits on a 27 acre site and willinclude 2,000 upscale guest rooms, a world-class spa, dining, retail and compre-hensive convention facilities.
Your company also plans to build its own resort on the premier center site ofRenaissance Pointe. These development plans are well underway. The third site
may be joint ventured, retained for future growth, or sold to reduce debt.Atlantic City’s strong demographics, stable regulatory and tax climate, and deepestablished gaming market makes it an ideal home for an MGM MIRAGE resort.We predict above average returns on investment in this market.
Historically in Las Vegas, when demand is high, room rates stay favorable resultingin increased revenue. When supply growth exceeds demand, such as when newproperties are introduced to the market, Las Vegas operators occasionally have toresort to discounting room rates in order to retain high occupancy levels, and thiscan negatively impact cash flow. The construction hiatus anticipated over thenext few years gives operators important time to enhance resorts through capital,training and marketing while even modest visitor growth should lead to highersame-store sales. This suggests that the operating environment for gaming issound with demand likely to outstrip supply.
Because of the cumulative effect of previously invested capital, strong marketingand surging convention demand, Las Vegas has rebounded far more rapidly thanits destination city counterparts. We expect these trends to continue in 2002.Your company will continue to improve our competitive advantages in this marketthrough smaller strategic investments that offer higher return, lower risk propositions.
We will enhance these investments with focused marketing and leverage new pro-prietary technology to increase customer loyalty through the rollout of “PlayersClub” our cutting-edge customer affinity program.
Our goal of realizing greater value for our shareholders demands that we continueto control expenses, improve revenues, and maintain a strong balance sheet whilewe allocate capital in a disciplined manner.
We knew that if integrated correctly, the merger of MGM Grand and Mirage Resortswould generate significant shareholder value. The dream combination of assets and
Financial Overview
1918
Andre Carrier > COO > Golden Nugget > Laughlin
Al Faccinto > President MGM MIRAGE International Marketing
Jeff Dahl > President > Beau Rivage
Phyllis A. James > Sr. VP and Sr. Counsel > MGM MIRAGE
William McBeath > President > The Mirage
William J. Hornbuckle >President and Chief Operating Officer > MGM MIRAGE Online
Robert V. Moon > Chairman > MGM MIRAGE Marketing
Cynthia Kiser Murphy > Sr. VP > Human Resources
Felix D. Rappaport > President > New York-New York
Alan Feldman > Sr. VP Public Affairs
$ 0.00 $200 $400 $600 $800 $1,000 $1,200
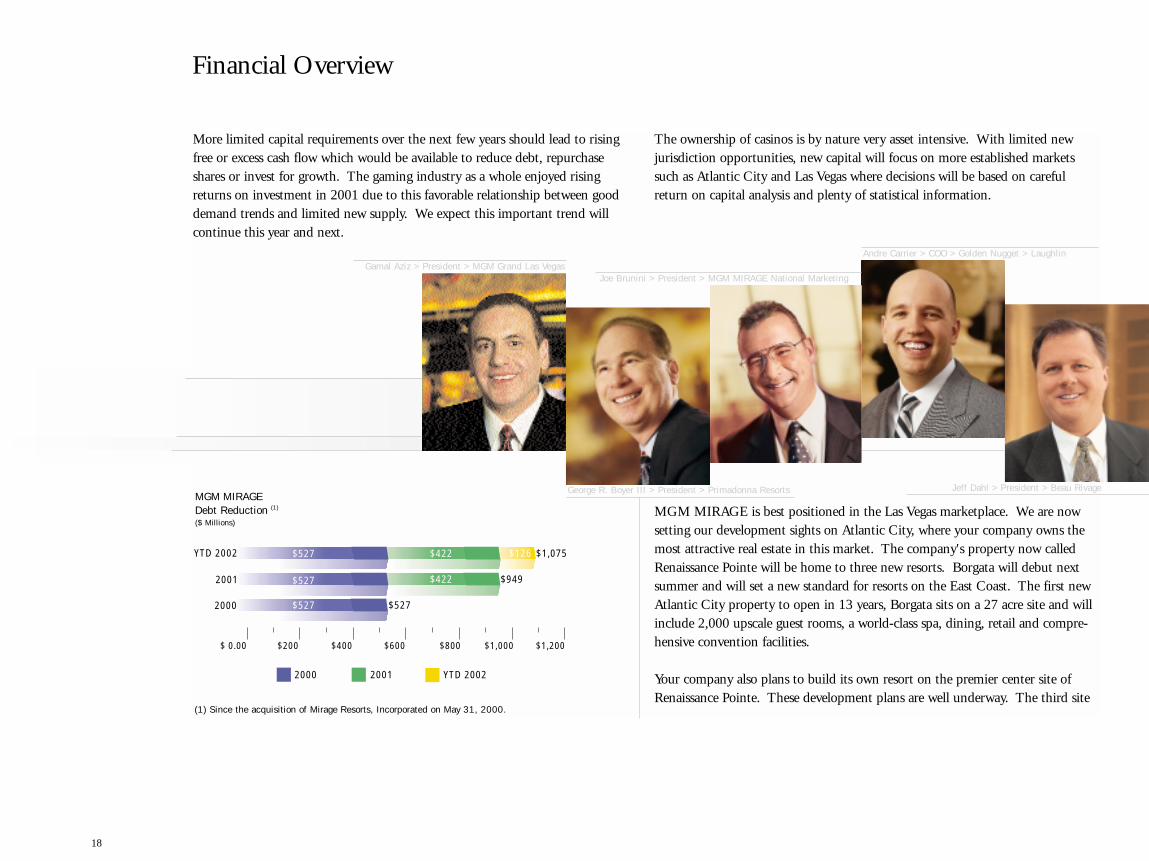
YTD 2002
YTD 2002
$527
$126 $1,075
$422
$422
$9492001
2001
2000
2000
$527
$527
$527
MGM MIRAGE Debt Reduction (1)
($ Millions)
Gamal Aziz > President > MGM Grand Las VegasJoe Brunini > President > MGM MIRAGE National Marketing
George R. Boyer III > President > Primadonna Resorts
(1) Since the acquisition of Mirage Resorts, Incorporated on May 31, 2000.

More limited capital requirements over the next few years should lead to risingfree or excess cash flow which would be available to reduce debt, repurchaseshares or invest for growth. The gaming industry as a whole enjoyed risingreturns on investment in 2001 due to this favorable relationship between gooddemand trends and limited new supply. We expect this important trend will continue this year and next.
The ownership of casinos is by nature very asset intensive. With limited newjurisdiction opportunities, new capital will focus on more established marketssuch as Atlantic City and Las Vegas where decisions will be based on carefulreturn on capital analysis and plenty of statistical information.
MGM MIRAGE is best positioned in the Las Vegas marketplace. We are nowsetting our development sights on Atlantic City, where your company owns themost attractive real estate in this market. The company's property now calledRenaissance Pointe will be home to three new resorts. Borgata will debut nextsummer and will set a new standard for resorts on the East Coast. The first newAtlantic City property to open in 13 years, Borgata sits on a 27 acre site and willinclude 2,000 upscale guest rooms, a world-class spa, dining, retail and compre-hensive convention facilities.
Your company also plans to build its own resort on the premier center site ofRenaissance Pointe. These development plans are well underway. The third site
may be joint ventured, retained for future growth, or sold to reduce debt.Atlantic City’s strong demographics, stable regulatory and tax climate, and deepestablished gaming market makes it an ideal home for an MGM MIRAGE resort.We predict above average returns on investment in this market.
Historically in Las Vegas, when demand is high, room rates stay favorable resultingin increased revenue. When supply growth exceeds demand, such as when newproperties are introduced to the market, Las Vegas operators occasionally have toresort to discounting room rates in order to retain high occupancy levels, and thiscan negatively impact cash flow. The construction hiatus anticipated over thenext few years gives operators important time to enhance resorts through capital,training and marketing while even modest visitor growth should lead to highersame-store sales. This suggests that the operating environment for gaming issound with demand likely to outstrip supply.
Because of the cumulative effect of previously invested capital, strong marketingand surging convention demand, Las Vegas has rebounded far more rapidly thanits destination city counterparts. We expect these trends to continue in 2002.Your company will continue to improve our competitive advantages in this marketthrough smaller strategic investments that offer higher return, lower risk propositions.
We will enhance these investments with focused marketing and leverage new pro-prietary technology to increase customer loyalty through the rollout of “PlayersClub” our cutting-edge customer affinity program.
Our goal of realizing greater value for our shareholders demands that we continueto control expenses, improve revenues, and maintain a strong balance sheet whilewe allocate capital in a disciplined manner.
We knew that if integrated correctly, the merger of MGM Grand and Mirage Resortswould generate significant shareholder value. The dream combination of assets and
Financial Overview
1918
Andre Carrier > COO > Golden Nugget > Laughlin
Al Faccinto > President MGM MIRAGE International Marketing
Jeff Dahl > President > Beau Rivage
Phyllis A. James > Sr. VP and Sr. Counsel > MGM MIRAGE
William McBeath > President > The Mirage
William J. Hornbuckle >President and Chief Operating Officer > MGM MIRAGE Online
Robert V. Moon > Chairman > MGM MIRAGE Marketing
Cynthia Kiser Murphy > Sr. VP > Human Resources
Felix D. Rappaport > President > New York-New York
Alan Feldman > Sr. VP Public Affairs
$ 0.00 $200 $400 $600 $800 $1,000 $1,200
YTD 2002
YTD 2002
$527
$126 $1,075
$422
$422
$9492001
2001
2000
2000
$527
$527
$527
MGM MIRAGE Debt Reduction (1)
($ Millions)
Gamal Aziz > President > MGM Grand Las VegasJoe Brunini > President > MGM MIRAGE National Marketing
George R. Boyer III > President > Primadonna Resorts
(1) Since the acquisition of Mirage Resorts, Incorporated on May 31, 2000.
duct extensive on-site audits and require comprehensive internal and externalauditor compliance testing.
Off balance sheet items, such as debt, are few, but when they do occur, they gen-erally relate to large joint-ventured casinos, the existence of which is well knownand whose debt is clearly disclosed in financial statements.
In short, the gaming industry operates on a relatively simple business model withstraightforward financial reporting. Your company’s balance sheet is anchored byhard assets, generating cash earnings that we utilize to reinvest, reduce debt, make
acquisitions or repurchase shares.
But, ultimately, when all is said and done, we have always known that the compa-ny’s greatest assets are its people, and the MGM MIRAGE family is the best inthe business.
We will continue to invest judiciously to expand our competitive advantages bykeeping our properties exciting and exploiting technology to improve operatingefficiency and customer yield.
We will remain vigilant on costs and cash flow maximization to increase ourfinancial strength.
We will look for ways to profitably invest your company’s capital to grow.
And as always our decisions will be aimed at improving the wealth of ourinvestors.
Sincerely,
people has created an unbeatable franchise capable of generating sizable free cash flow. We have used this free cash to reduce debt and repurchase shares at attractiveprices. Your company’s debt declined by $422 million in 2001, and by an impressive $126 million more already this year. The rating agency Standard and
Poors has recognized your company’s assets and potential by affirming it’s ratingof investment grade on our senior indebtedness. We know that a strong balancesheet is the best weapon to exploit opportunities. We will continue to reducedebt, while we look for capital alternatives that increase shareholder value themost. Our goal is not to be the biggest company in our industry, but the bestas measured by asset quality, profitability and growth.
Many of the decisions we made last year should have positive profit implicationsfor the future as we re-engineered certain aspects of operations to improve mar-gins. Your company’s profit margins, already the best of its peers, should further
improve as revenues are restored to pre-September 11th levels.
One challenge investors face today is the difficulty in assessing a company’s finan-cial health or future prospects because of complex business models, confusing
accounting or inadequate disclosure of financial information. This may be onereason why investors have gained a renewed appreciation for the gaming industry.Casinos are as close to a cash business as any. Over 85% of most gaming compa-nies revenues are cash based. Gaming is a heavily regulated industry. Revenuesare closely monitored by well-established gaming control boards that ensure rev-enue is accurately reported, in part so that gaming taxes are correctly calculated.In fact, regulatory oversight is meaningful in every gaming jurisdiction. Gamingrevenues are reported monthly and the gaming tax is remitted monthly, or insome cases, daily. Quarterly financial statements are submitted. All significantfinancing activity must be reviewed and approved by regulators. Regulators con-
20 21
Financial Overview
Scott Sibella > President > Treasure Island
Scott B. Snow > President > MGM Grand > Detroit
Frank Visconti > President > MGM MIRAGE > Retail
Richard A. Sturm > President > MGM MIRAGE > Sports/Entertainment
Maurice Wooden > President > Golden Nugget > Las Vegas
William Smith > President > MGM MIRAGE Design GroupAndrew Wilson > General Manager > MGM Grand > Darwin
James J. Murren > President, Chief Financial Officer and Treasurer > MGM MIRAGE > 3/11/2002
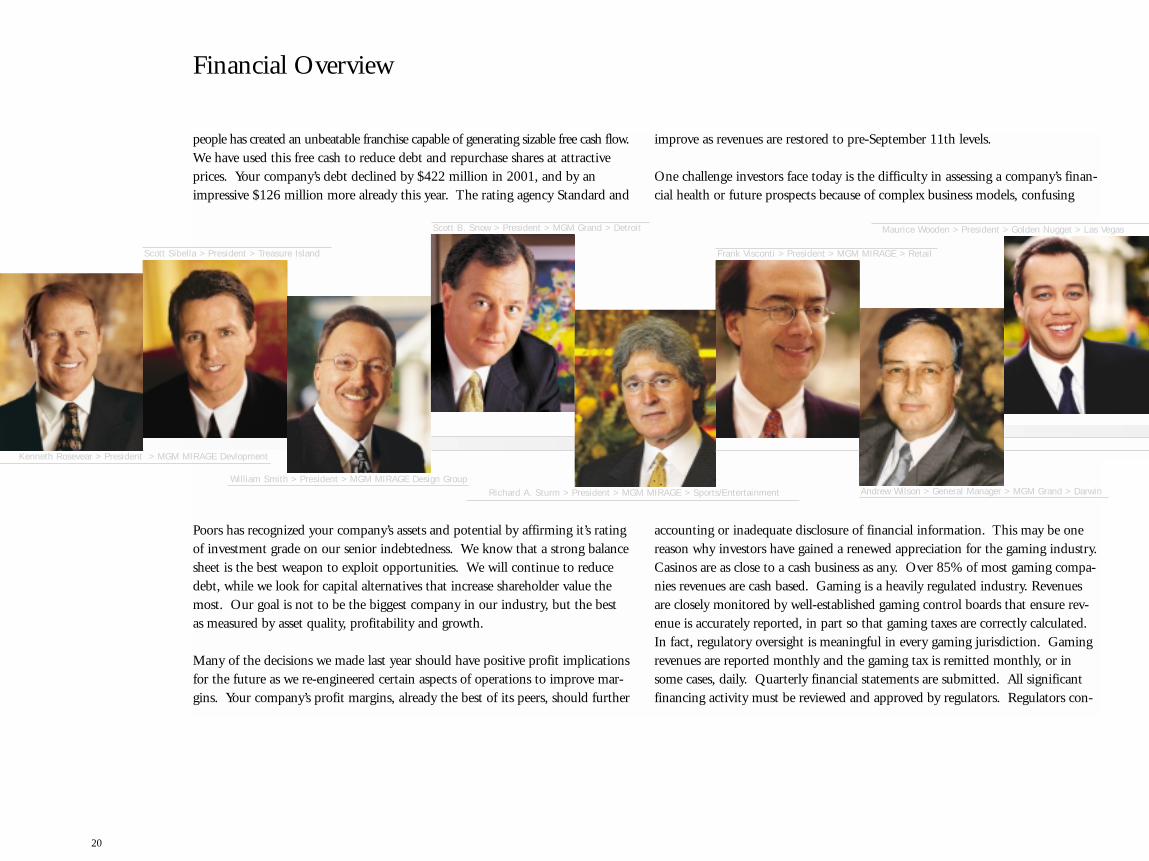
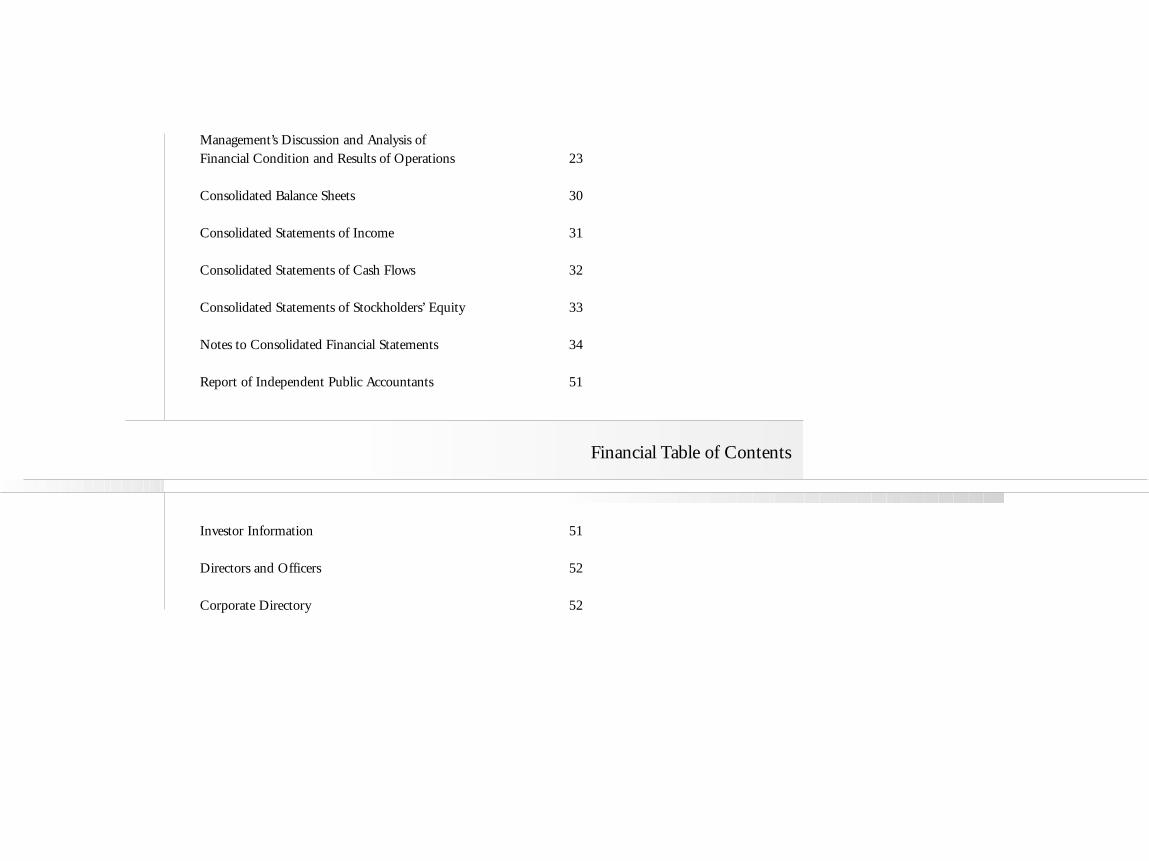
25%
25%
23%
27%
0% 10% 20% 30%
Park Place
Mandalay
MGM MIRAGE
Harrah's
MGM MIRAGE2001 EBITDA Margin (1)
Kenneth Rosevear > President > MGM MIRAGE Devlopment
Forrest Woodward > President > Boardwalk
(1) EBITDA is after Corporate Expense.
duct extensive on-site audits and require comprehensive internal and externalauditor compliance testing.
Off balance sheet items, such as debt, are few, but when they do occur, they gen-erally relate to large joint-ventured casinos, the existence of which is well knownand whose debt is clearly disclosed in financial statements.
In short, the gaming industry operates on a relatively simple business model withstraightforward financial reporting. Your company’s balance sheet is anchored byhard assets, generating cash earnings that we utilize to reinvest, reduce debt, make
acquisitions or repurchase shares.
But, ultimately, when all is said and done, we have always known that the compa-ny’s greatest assets are its people, and the MGM MIRAGE family is the best inthe business.
We will continue to invest judiciously to expand our competitive advantages bykeeping our properties exciting and exploiting technology to improve operatingefficiency and customer yield.
We will remain vigilant on costs and cash flow maximization to increase ourfinancial strength.
We will look for ways to profitably invest your company’s capital to grow.
And as always our decisions will be aimed at improving the wealth of ourinvestors.
Sincerely,
people has created an unbeatable franchise capable of generating sizable free cash flow. We have used this free cash to reduce debt and repurchase shares at attractiveprices. Your company’s debt declined by $422 million in 2001, and by an impressive $126 million more already this year. The rating agency Standard and
Poors has recognized your company’s assets and potential by affirming it’s ratingof investment grade on our senior indebtedness. We know that a strong balancesheet is the best weapon to exploit opportunities. We will continue to reducedebt, while we look for capital alternatives that increase shareholder value themost. Our goal is not to be the biggest company in our industry, but the bestas measured by asset quality, profitability and growth.
Many of the decisions we made last year should have positive profit implicationsfor the future as we re-engineered certain aspects of operations to improve mar-gins. Your company’s profit margins, already the best of its peers, should further
improve as revenues are restored to pre-September 11th levels.
One challenge investors face today is the difficulty in assessing a company’s finan-cial health or future prospects because of complex business models, confusing
accounting or inadequate disclosure of financial information. This may be onereason why investors have gained a renewed appreciation for the gaming industry.Casinos are as close to a cash business as any. Over 85% of most gaming compa-nies revenues are cash based. Gaming is a heavily regulated industry. Revenuesare closely monitored by well-established gaming control boards that ensure rev-enue is accurately reported, in part so that gaming taxes are correctly calculated.In fact, regulatory oversight is meaningful in every gaming jurisdiction. Gamingrevenues are reported monthly and the gaming tax is remitted monthly, or insome cases, daily. Quarterly financial statements are submitted. All significantfinancing activity must be reviewed and approved by regulators. Regulators con-
20 21
Financial Overview
Scott Sibella > President > Treasure Island
Scott B. Snow > President > MGM Grand > Detroit
Frank Visconti > President > MGM MIRAGE > Retail
Richard A. Sturm > President > MGM MIRAGE > Sports/Entertainment
Maurice Wooden > President > Golden Nugget > Las Vegas
William Smith > President > MGM MIRAGE Design GroupAndrew Wilson > General Manager > MGM Grand > Darwin
James J. Murren > President, Chief Financial Officer and Treasurer > MGM MIRAGE > 3/11/2002
25%
25%
23%
27%
0% 10% 20% 30%
Park Place
Mandalay
MGM MIRAGE
Harrah's
MGM MIRAGE2001 EBITDA Margin (1)
Kenneth Rosevear > President > MGM MIRAGE Devlopment
Forrest Woodward > President > Boardwalk
(1) EBITDA is after Corporate Expense.
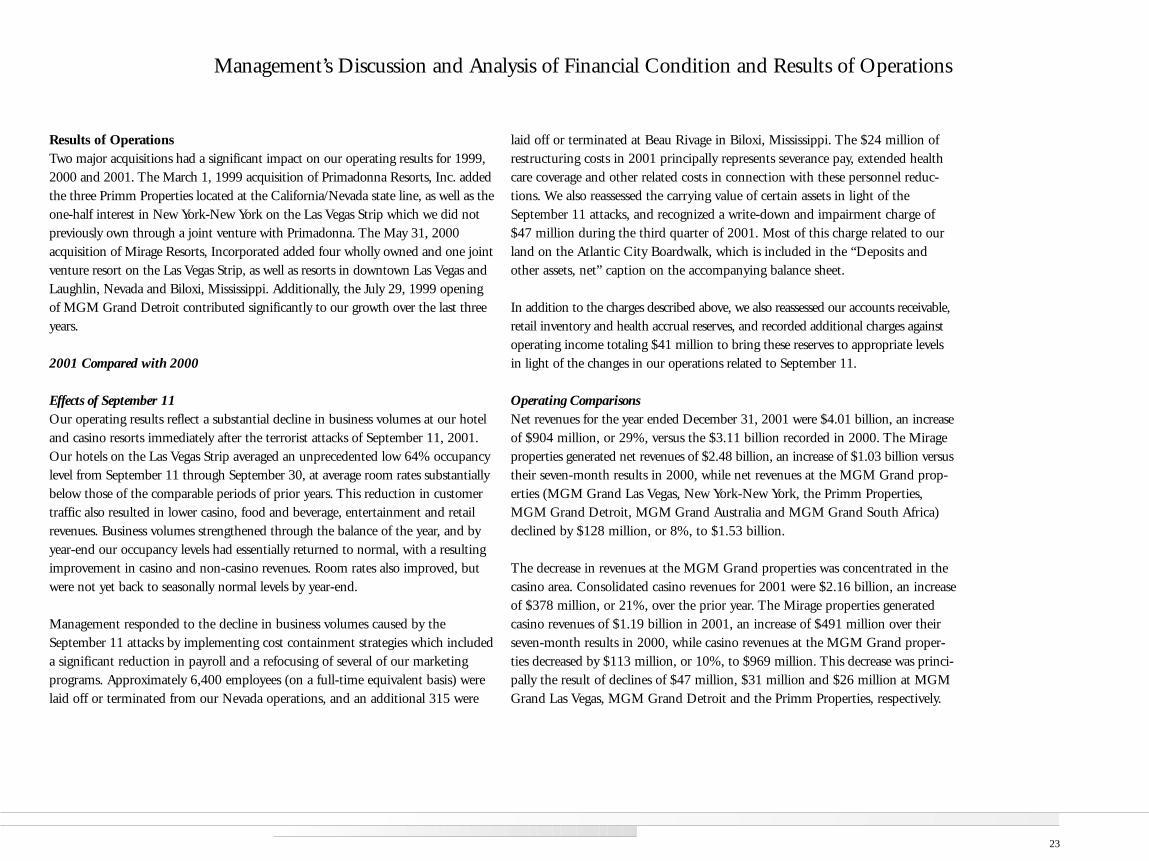
Management’s Discussion and Analysis of Financial Condition and Results of Operations 23
Consolidated Balance Sheets 30
Consolidated Statements of Income 31
Consolidated Statements of Cash Flows 32
Consolidated Statements of Stockholders’ Equity 33
Notes to Consolidated Financial Statements 34
Report of Independent Public Accountants 51
Investor Information 51
Directors and Officers 52
Corporate Directory 52
Financial Table of Contents
Results of OperationsTwo major acquisitions had a significant impact on our operating results for 1999,2000 and 2001. The March 1, 1999 acquisition of Primadonna Resorts, Inc. addedthe three Primm Properties located at the California/Nevada state line, as well as theone-half interest in New York-New York on the Las Vegas Strip which we did notpreviously own through a joint venture with Primadonna. The May 31, 2000acquisition of Mirage Resorts, Incorporated added four wholly owned and one jointventure resort on the Las Vegas Strip, as well as resorts in downtown Las Vegas andLaughlin, Nevada and Biloxi, Mississippi. Additionally, the July 29, 1999 openingof MGM Grand Detroit contributed significantly to our growth over the last threeyears.
2001 Compared with 2000
Effects of September 11 Our operating results reflect a substantial decline in business volumes at our hoteland casino resorts immediately after the terrorist attacks of September 11, 2001.Our hotels on the Las Vegas Strip averaged an unprecedented low 64% occupancylevel from September 11 through September 30, at average room rates substantiallybelow those of the comparable periods of prior years. This reduction in customertraffic also resulted in lower casino, food and beverage, entertainment and retailrevenues. Business volumes strengthened through the balance of the year, and byyear-end our occupancy levels had essentially returned to normal, with a resultingimprovement in casino and non-casino revenues. Room rates also improved, butwere not yet back to seasonally normal levels by year-end.
Management responded to the decline in business volumes caused by theSeptember 11 attacks by implementing cost containment strategies which includeda significant reduction in payroll and a refocusing of several of our marketing programs. Approximately 6,400 employees (on a full-time equivalent basis) werelaid off or terminated from our Nevada operations, and an additional 315 were
laid off or terminated at Beau Rivage in Biloxi, Mississippi. The $24 million ofrestructuring costs in 2001 principally represents severance pay, extended healthcare coverage and other related costs in connection with these personnel reduc-tions. We also reassessed the carrying value of certain assets in light of theSeptember 11 attacks, and recognized a write-down and impairment charge of$47 million during the third quarter of 2001. Most of this charge related to ourland on the Atlantic City Boardwalk, which is included in the “Deposits andother assets, net” caption on the accompanying balance sheet.
In addition to the charges described above, we also reassessed our accounts receivable,retail inventory and health accrual reserves, and recorded additional charges againstoperating income totaling $41 million to bring these reserves to appropriate levelsin light of the changes in our operations related to September 11.
Operating ComparisonsNet revenues for the year ended December 31, 2001 were $4.01 billion, an increaseof $904 million, or 29%, versus the $3.11 billion recorded in 2000. The Mirageproperties generated net revenues of $2.48 billion, an increase of $1.03 billion versustheir seven-month results in 2000, while net revenues at the MGM Grand prop-erties (MGM Grand Las Vegas, New York-New York, the Primm Properties,MGM Grand Detroit, MGM Grand Australia and MGM Grand South Africa)declined by $128 million, or 8%, to $1.53 billion.
The decrease in revenues at the MGM Grand properties was concentrated in thecasino area. Consolidated casino revenues for 2001 were $2.16 billion, an increaseof $378 million, or 21%, over the prior year. The Mirage properties generated casino revenues of $1.19 billion in 2001, an increase of $491 million over theirseven-month results in 2000, while casino revenues at the MGM Grand proper-ties decreased by $113 million, or 10%, to $969 million. This decrease was princi-pally the result of declines of $47 million, $31 million and $26 million at MGMGrand Las Vegas, MGM Grand Detroit and the Primm Properties, respectively.
Management’s Discussion and Analysis of Financial Condition and Results of Operations
23
These declines were all attributable primarily to reduced gaming volumes. The volume decreases at MGM Grand Las Vegas are attributable to the impact of the September 11 attacks. The Primm Properties were faced with increasedcompetition from Native American casinos, as well as the impact of higher gasoline and utility costs in California, while volumes at MGM Grand Detroitwere impacted by a competitor’s opening of the third and final Detroit casino inNovember 2000. The declines in Detroit were offset in part by improved volumesin the fourth quarter of 2001, as traffic delays caused by increased border securitycaused a shift in volume away from a competitor casino in Windsor, Ontario.
Consolidated room revenues for 2001 were $846 million, an increase of $232million, or 38%, over the prior year. Room revenues at the Mirage propertiestotaled $568 million, an increase of $239 million over the seven-month resultfrom 2000. Room revenues at the MGM Grand properties declined by only 3%despite the significant impact on business following the September 11 attacks,reflecting the strength of our hotel business prior to September 11. MGM GrandLas Vegas benefited from having 3% more available rooms during 2001 versus2000, as a room remodeling project had been ongoing in the prior year, and alsoachieved a small increase in average daily room rate.
Consolidated food and beverage, entertainment, retail and other revenues were$1.37 billion for 2001, an increase of $401 million, or 41%, over the results for2000. The Mirage properties contributed a $407 million increase, as revenueswere $958 million for 2001 versus $551 million for the seven-month period in2000. Food and beverage, entertainment, retail and other revenues at the MGMGrand properties declined by only 2% from the comparable 2000 levels, despitethe impact on business of the September 11 attacks.
Income from unconsolidated affiliate of $37 million represents our 50% share ofthe operating results of Monte Carlo for 2001. Our share of that entity’s resultswas $22 million for the seven months following the Mirage acquisition in 2000.
Consolidated operating expenses (before preopening expenses, restructuring costs,write-downs and impairments and corporate expense) were $3.27 billion for2001, an increase of $866 million, or 36%, over the $2.40 billion reported in theprior year. The Mirage properties generated an $885 million increase in operatingexpenses, with $2.04 billion of current-period costs versus $1.15 billion in theseven-month period in 2000, while operating costs at the MGM Grand proper-ties decreased by $19 million, or 2%. As noted above, operating revenues at theMGM Grand properties declined by 8% versus their results from 2000.Additional charges related to receivables, retail inventories and health accruals, asdescribed above, affected margins during 2001, as did increased energy costs andintensified competitive conditions, particularly with respect to the Primm Properties.
Corporate expense increased significantly in the first half of 2001 as a result of theMirage acquisition, then decreased significantly in the second half of the year,reflecting our progress in integrating corporate functions following the acquisitionand our focus on cost containment after September 11. For the year, corporateexpense was $38 million, an increase of 8% over the amount recorded in 2000.
Interest expense, net of amounts capitalized, was $349 million for 2001 versus$273 million in the prior year. Total interest cost was $428 million in 2001 versus$364 million in 2000. This increase reflected higher average debt levels attributableto the financing of the Mirage acquisition, offset in part by savings associatedwith interest rate swaps and a significant reduction in interest rates on borrowingsunder our bank credit facilities. Interest capitalized declined from $91 million in2000 to $79 million in 2001. In January 2001, we announced that our near-termdevelopment focus would be on the Atlantic City market. As a result, we suspendedthe capitalization of interest on our Las Vegas Strip project until the developmentprocess for that project is further advanced. This suspension of interest capitalizationmore than offset the impact of a full year of interest capitalization on our AtlanticCity development projects versus seven months of capitalization in the prior year.
Management’s Discussion and Analysis of Financial Condition and Results of Operations
24
2000 Compared with 1999Net revenues for the year ended December 31, 2000 were $3.11 billion, representingan increase of $1.77 billion, or 132%, over the $1.34 billion recorded in 1999.The Mirage properties generated $1.45 billion of this increase and the PrimmProperties and New York-New York provided an additional net increase of $81million. MGM Grand Detroit generated net revenues of $394 million during2000 versus $171 million for its approximately five months of operation in 1999.The increases at the Primm Properties, New York-New York and MGM GrandDetroit were generally proportionate to the increase in the length of time eachproperty was included in the consolidated results. MGM Grand Las Vegasachieved record net revenues of $764 million, representing a 3% increase over the$740 million recorded in 1999.
Consolidated casino revenues for the year ended December 31, 2000 were $1.79billion, representing an increase of $967 million, or 118%, over the $819 millionachieved in 1999. The Mirage properties accounted for $704 million of theincrease. The Primm Properties and New York-New York accounted for an additional $47 million of casino revenues, generating $273 million in 2000 versusthe $226 million recorded in the 10 months these properties were owned during1999. MGM Grand Detroit recorded casino revenues of $380 million in 2000,an increase of $215 million from the $165 million achieved in its approximatelyfive months of operation in 1999. MGM Grand Las Vegas achieved a smallincrease in casino revenues in 2000, due to an increase in table games volumethat was largely offset by increased customer discounts.
Consolidated room revenues for 2000 were $615 million, representing an increaseof $356 million, or 138%, versus 1999. The Mirage properties generated $329million of this increase, while the Primm Properties and New York-New Yorkaccounted for another $17 million. The balance of the increase related to MGM Grand Las Vegas, where room revenues increased from $187 million to$198 million, despite a 3% reduction in available room nights due to a room
remodeling project which was completed in August 2000. Average daily roomrate and revenue per available room at MGM Grand Las Vegas each increased by7% versus the 1999 period, to $110 and $106, respectively.
Consolidated food and beverage revenues nearly tripled, from $178 million in1999 to $511 million in 2000. The Mirage properties contributed $287 millionof the $333 million increase. Food and beverage revenues at MGM Grand LasVegas rose by 18%, from $123 million in 1999 to a record $145 million in 2000.This increase was attributable primarily to increased food and beverage sales atthe MGM Grand Conference Center as well as increased beverage sales at theStudio 54 nightclub. The balance of the consolidated increase was attributable toMGM Grand Detroit, the Primm Properties and New York-New York.
Consolidated entertainment, retail and other revenues for 2000 were $458 million,an increase of $270 million, or 144%, over the $188 million reported in 1999.This increase was also primarily attributable to the Mirage properties, which contributed $264 million of the increase.
Income from unconsolidated affiliate of $22 million for 2000 represented our 50%share of the operating results of Monte Carlo since the joint venture interest wasacquired as part of the Mirage acquisition. The $6 million recorded in 1999 represented our 50% share of the operating results of New York-New York for the first two months of 1999, after which New York-New York became a whollyowned subsidiary.
Consolidated operating expenses (before preopening expenses, restructuring costs,write-downs and impairments and corporate expense) were $2.40 billion in 2000,representing an increase of $1.36 billion, or 131%, over the $1.04 billion recordedin 1999. The Mirage properties generated $1.15 billion of this increase and thePrimm Properties and New York-New York had an additional net increase of $56 million. MGM Grand Detroit reported $271 million during 2000 versus
Management’s Discussion and Analysis of Financial Condition and Results of Operations
25
$125 million for its approximately five months of operation in 1999. Operatingmargins were generally consistent between the years with the exception of MGMGrand Detroit, which showed strong improvement resulting from cost containmentmeasures and improved operating efficiencies achieved following commencementof operations at this new facility.
During the year ended December 31, 2000, management implemented comprehensive restructuring plans designed to reduce costs and improve efficiencies within the Company. The implementation of these plans resulted in a charge against earnings totaling $24 million, primarily related to consolidationof certain general and administrative functions at New York-New York andMGM Grand Las Vegas, various contract terminations and staffing reductions,the buyout of various leases and other related items. Approximately 195 peoplewere affected by the reductions, primarily at our operating properties (excludingthe Mirage properties) relating to duplicative functions within marketing, entertainment, retail, information systems and human resources.
During June 2000, we recognized a charge against earnings of $102 million related to certain projects previously under development which management hasdetermined not to pursue, the divesting of certain non-strategic assets and the re-evaluation of certain other assets, all as a result of the Mirage acquisition.
Corporate expense increased to $35 million in 2000 versus $14 million in 1999.This increase was primarily attributable to the Mirage acquisition, reflecting highercorporate operating expenses related to a larger corporate structure and higher airplane costs due to the operation of two corporate airplanes compared to onlyone in the prior year.
Interest income increased from $2 million in 1999 to $13 million in 2000. This increase was largely the result of interest earned on cash temporarily invested prior to its use in the Mirage acquisition, as well as a somewhat
higher level of invested cash balances associated with the significant increase inthe size of our operations.
Interest expense, net for 2000 was $273 million, versus $60 million in the prioryear. This increase was a function of substantial increases both in interest cost andinterest capitalized, each as a result of the Mirage acquisition. Interest cost was$364 million in 2000 versus $76 million in 1999, as our total debt increased from$1.31 billion at December 31, 1999 to $5.87 billion at December 31, 2000. Thisincrease reflects the debt issued and assumed in connection with the Mirage acqui-sition. Interest capitalized increased to $91 million from the $16 million recordedin the prior year. A substantial majority of the interest capitalized in 2000 relatedto development projects on the Las Vegas Strip and in the Marina area of AtlanticCity, on development sites acquired in the Mirage acquisition.
Extraordinary loss of $5 million in 2000, net of income tax benefit, reflects thewrite-off of unamortized debt costs from our previous $1.25 billion revolvingcredit facility and from the portion of the $1.3 billion term loan extinguishedduring the year. Extraordinary loss of $1 million in 1999, net of income tax benefit, reflects the write-off of unamortized debt costs from the New York-New York bank facility, which was extinguished on March 31, 1999.
Cumulative effect of change in accounting principle of $8 million in 1999, net of income tax benefit, reflects our adoption of Statement of Position 98-5, whichrequires that costs associated with start-up activities be expensed as incurred.
Management’s Discussion and Analysis of Financial Condition and Results of Operations
26
Liquidity and Capital ResourcesAs of December 31, 2001 and December 31, 2000, we held cash and cash equivalentsof $209 million and $228 million, respectively. Cash provided by operating activitieswas $794 million for both 2001 and 2000, compared with $290 million for 1999.
On May 31, 2000, we completed the Mirage acquisition whereby Mirage shareholders received $21 per share in cash. Funds needed to complete the acquisition were approximately $6.2 billion. These funds were used for paymentsto Mirage shareholders and holders of Mirage stock options, refinancing of certain indebtedness of Mirage and MGM Grand, payment of fees and expensesin connection with the Mirage acquisition and general corporate purposes. Inorder to fund the Mirage acquisition, we borrowed $4.21 billion under our newsenior credit facilities, completed the private placement of 46.5 million shares of our common stock for a total purchase price of approximately $1.23 billion,issued $710 million of senior subordinated notes and used cash on hand to fundthe remaining balance.
During 2000, $118 million was drawn down on the $1.25 billion revolving creditfacility and $730 million was repaid, including a final balance of $700 millionthat was refinanced via borrowings under the new senior facilities. During 2000,$4.21 billion was drawn down and $1.30 billion was repaid on the new seniorfacilities and $2.91 billion remained outstanding at the end of the year. During2001, an additional $749 million was repaid on the senior facilities, including the final $461 million balance of the $1.3 billion term loan component of suchfacilities. This left $2.16 billion outstanding under the $2.8 billion facilities atDecember 31, 2001, including $207 million outstanding under an $800 millionrevolving facility which matures on April 5, 2002. An additional $127 million ofthis balance has been repaid as of March 7, 2002. We intend to refinance anyremaining balance on this facility prior to or upon maturity through its renewalor through other financing alternatives.
During 2000, $26 million was drawn down and $130 million was repaid on the Detroit credit facility and $65 million remained outstanding at the end of the year. This balance was repaid during 2001.
On May 5, 2000, our shelf registration statement, which allows us to issue up toa total of $2.75 billion of debt and equity securities from time to time in publicofferings, was declared effective by the Securities and Exchange Commission. Weissued $710 million of senior subordinated notes in May 2000 to partially fund theMirage acquisition. We also issued $850 million of senior notes in September 2000and $400 million of senior subordinated notes in January 2001, the proceeds ofwhich were used to partially repay the $1.3 billion term loan component of the newsenior facilities. After giving effect to these issuances, the shelf registration statementhas $790 million in remaining capacity at December 31, 2001 for the issuance offuture debt or equity securities. Any future public offering of securities under theshelf registration statement will only be made by means of a prospectus supplement.
During the years ended December 31, 2001, 2000 and 1999, our capital expenditureswere $328 million, $336 million and $375 million, respectively. The 2001 capitalexpenditures included general property improvements at our resorts, such as theongoing room refurbishment program at The Mirage, restaurant and entertainmentenhancements at MGM Grand Las Vegas and New York-New York, the constructionof a new convenience store/gas station/welcome center at the Primm Properties,the completion of the Mirage Events Center and the upgrading of slot equipmentat several of our properties in preparation for the 2002 introduction of our newPlayers Club. Capital expenditures for 2001 also included the acquisition of thebuilding housing MGM Grand Detroit, the acquisition of a new corporate aircraft and pre-construction activities associated with ongoing development projects, including capitalized interest. The 2000 capital expenditures related togeneral property improvements at our resorts, including the room refurbishmentprogram at MGM Grand Las Vegas, the acquisition of land by MGM GrandDetroit and other land acquisitions and pre-construction activities associated with
Management’s Discussion and Analysis of Financial Condition and Results of Operations
27
ongoing development projects, including capitalized interest. During 1999, $83million was expended on MGM Grand Las Vegas master plan improvements,which were completed in early 2000, and $162 million was expended on thedevelopment of the MGM Grand Detroit interim casino.
In November 1997, MGM Grand Detroit, LLC (in which we hold a controllinginterest) was selected to be the developer of one of three permanent hotel-casinocomplexes to be located in the City of Detroit. Development of the permanentfacility will not proceed until after acquisition by MGM Grand Detroit, LLC of a permanent development site. The design, budget and schedule for developmentof the permanent facility are at a preliminary stage, will be subject to the risksattendant to large-scale projects and may be subject to additional costs and delaysbeyond preliminary estimates. No assurance can be given that we will develop apermanent hotel-casino in Detroit, or if we do, as to its ultimate size, configura-tion or cost.
In January 1998, the City of Atlantic City deeded to Mirage approximately 180acres (120 acres of which are developable) at Renaissance Pointe in the Marina areaof Atlantic City. In exchange, Mirage agreed to develop a hotel-casino on the site andperform certain other obligations. Mirage also entered into an agreement with twoNew Jersey State agencies for the construction and joint funding of road improvementsnecessary to improve access to the Marina area. As called for by the agreement, inOctober 1997, Mirage deposited funds into escrow for its $110 million portion ofthe $330 million road improvement project. The remainder of the project fundingwas provided by the two State agencies. Groundbreaking on the road improvementstook place in November 1998, and they opened to the public on July 31, 2001.
In November 2000, a limited liability company owned 50-50 with Boyd GamingCorporation began construction of the Borgata, a 2,000-guest room hotel-casinoresort, on a 27-acre portion of the Renaissance Pointe site. Boyd is overseeing theconstruction and will operate the resort upon completion. Construction is expected
to be completed in the summer of 2003 at a total budgeted cost, including land,of approximately $1.06 billion. In December 2000, we contributed the 27 acresof land and Boyd contributed $90 million in cash to the venture, and the ventureobtained a $630 million secured bank credit facility, which is non-recourse toMGM MIRAGE, to fund the project costs. We and Boyd are each required tocontribute up to an additional $127 million in cash to the venture and Boyd isrequired to contribute any additional cash necessary to fund project costs inexcess of the agreed project budget. As of December 31, 2001, each partner hadmade $55 million of such additional cash contributions to the venture, includingcontributions made by Mirage prior to the acquisition.
As required by our agreement with Boyd, we have designed and are developingthe common roads, landscaping and other master plan improvement for theentire Renaissance Pointe site. As part of the agreement with the City, we arerequired to remediate environmental contamination at the site, which was amunicipal landfill for many years. A substantial portion of the remediation workhas been completed. We are proceeding with the design and development of anew wholly owned hotel-casino resort on the Renaissance Pointe site next to theBorgata. The project is in the preliminary design phase and no constructionbudget or schedule has been developed.
We must apply for and receive numerous governmental permits and satisfy otherconditions before construction of a new resort on the Renaissance Pointe site can begin. We cannot be certain of the ultimate construction schedule or cost ofconstruction of the Borgata or any other project on the Renaissance Pointe site.
On August 5, 1999, we announced a 12-month stock repurchase program for up to10 million shares of our common stock. We purchased a total of 3.1 million shares atan approximate cost of $66 million through February 2000. The repurchase programwas suspended as a result of the Mirage acquisition and subsequently expired.
Management’s Discussion and Analysis of Financial Condition and Results of Operations
28
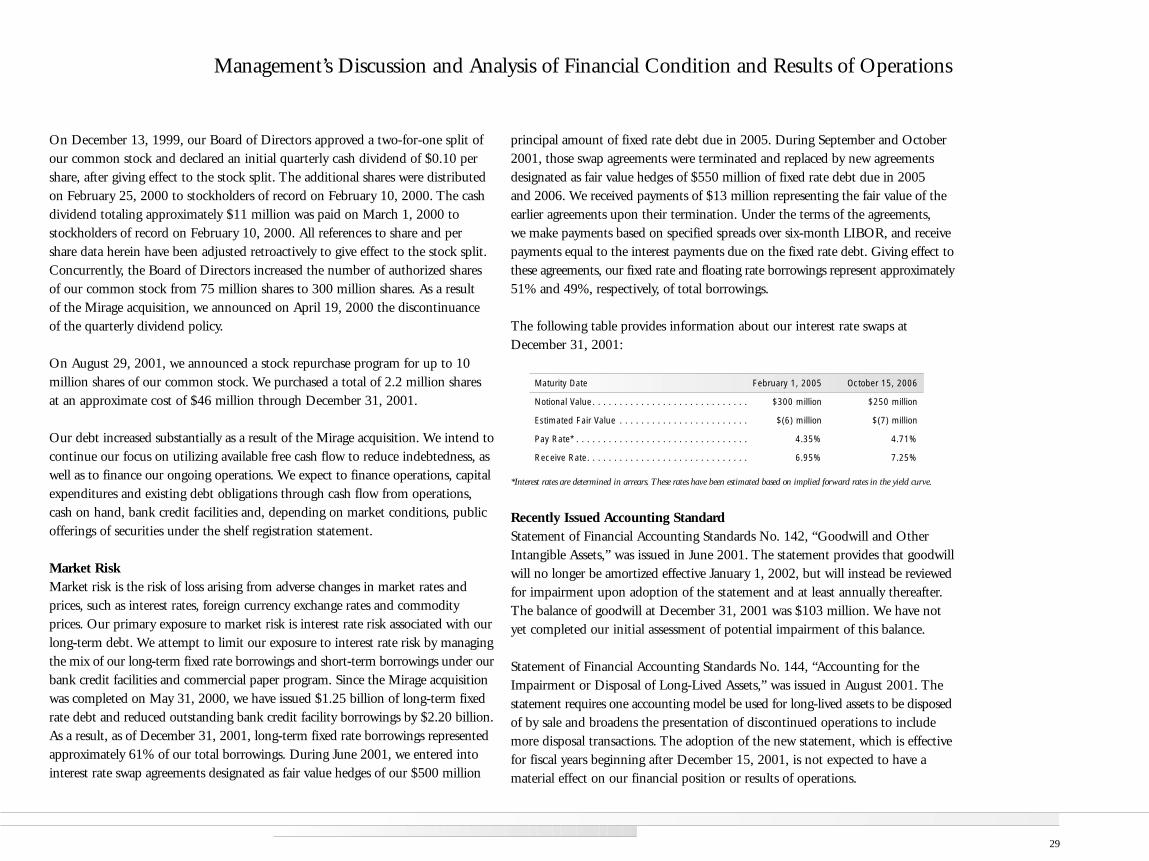
On December 13, 1999, our Board of Directors approved a two-for-one split ofour common stock and declared an initial quarterly cash dividend of $0.10 pershare, after giving effect to the stock split. The additional shares were distributedon February 25, 2000 to stockholders of record on February 10, 2000. The cashdividend totaling approximately $11 million was paid on March 1, 2000 tostockholders of record on February 10, 2000. All references to share and per share data herein have been adjusted retroactively to give effect to the stock split.Concurrently, the Board of Directors increased the number of authorized sharesof our common stock from 75 million shares to 300 million shares. As a result of the Mirage acquisition, we announced on April 19, 2000 the discontinuanceof the quarterly dividend policy.
On August 29, 2001, we announced a stock repurchase program for up to 10million shares of our common stock. We purchased a total of 2.2 million shares at an approximate cost of $46 million through December 31, 2001.
Our debt increased substantially as a result of the Mirage acquisition. We intend tocontinue our focus on utilizing available free cash flow to reduce indebtedness, aswell as to finance our ongoing operations. We expect to finance operations, capitalexpenditures and existing debt obligations through cash flow from operations,cash on hand, bank credit facilities and, depending on market conditions, publicofferings of securities under the shelf registration statement.
Market RiskMarket risk is the risk of loss arising from adverse changes in market rates andprices, such as interest rates, foreign currency exchange rates and commodityprices. Our primary exposure to market risk is interest rate risk associated with ourlong-term debt. We attempt to limit our exposure to interest rate risk by managingthe mix of our long-term fixed rate borrowings and short-term borrowings under ourbank credit facilities and commercial paper program. Since the Mirage acquisitionwas completed on May 31, 2000, we have issued $1.25 billion of long-term fixedrate debt and reduced outstanding bank credit facility borrowings by $2.20 billion.As a result, as of December 31, 2001, long-term fixed rate borrowings representedapproximately 61% of our total borrowings. During June 2001, we entered intointerest rate swap agreements designated as fair value hedges of our $500 million
principal amount of fixed rate debt due in 2005. During September and October2001, those swap agreements were terminated and replaced by new agreementsdesignated as fair value hedges of $550 million of fixed rate debt due in 2005 and 2006. We received payments of $13 million representing the fair value of theearlier agreements upon their termination. Under the terms of the agreements, we make payments based on specified spreads over six-month LIBOR, and receivepayments equal to the interest payments due on the fixed rate debt. Giving effect tothese agreements, our fixed rate and floating rate borrowings represent approximately51% and 49%, respectively, of total borrowings.
The following table provides information about our interest rate swaps atDecember 31, 2001:
Maturity Date February 1, 2005 October 15, 2006
Notional Value. . . . . . . . . . . . . . . . . . . . . . . . . . . . . $300 million $250 million
Estimated Fair Value . . . . . . . . . . . . . . . . . . . . . . . . $(6) million $(7) million
Pay Rate* . . . . . . . . . . . . . . . . . . . . . . . . . . . . . . . . 4.35% 4.71%
Receive Rate. . . . . . . . . . . . . . . . . . . . . . . . . . . . . . 6.95% 7.25%
*Interest rates are determined in arrears. These rates have been estimated based on implied forward rates in the yield curve.
Recently Issued Accounting StandardStatement of Financial Accounting Standards No. 142, “Goodwill and OtherIntangible Assets,” was issued in June 2001. The statement provides that goodwillwill no longer be amortized effective January 1, 2002, but will instead be reviewedfor impairment upon adoption of the statement and at least annually thereafter.The balance of goodwill at December 31, 2001 was $103 million. We have notyet completed our initial assessment of potential impairment of this balance.
Statement of Financial Accounting Standards No. 144, “Accounting for theImpairment or Disposal of Long-Lived Assets,” was issued in August 2001. Thestatement requires one accounting model be used for long-lived assets to be disposedof by sale and broadens the presentation of discontinued operations to includemore disposal transactions. The adoption of the new statement, which is effectivefor fiscal years beginning after December 15, 2001, is not expected to have amaterial effect on our financial position or results of operations.
Management’s Discussion and Analysis of Financial Condition and Results of Operations
29
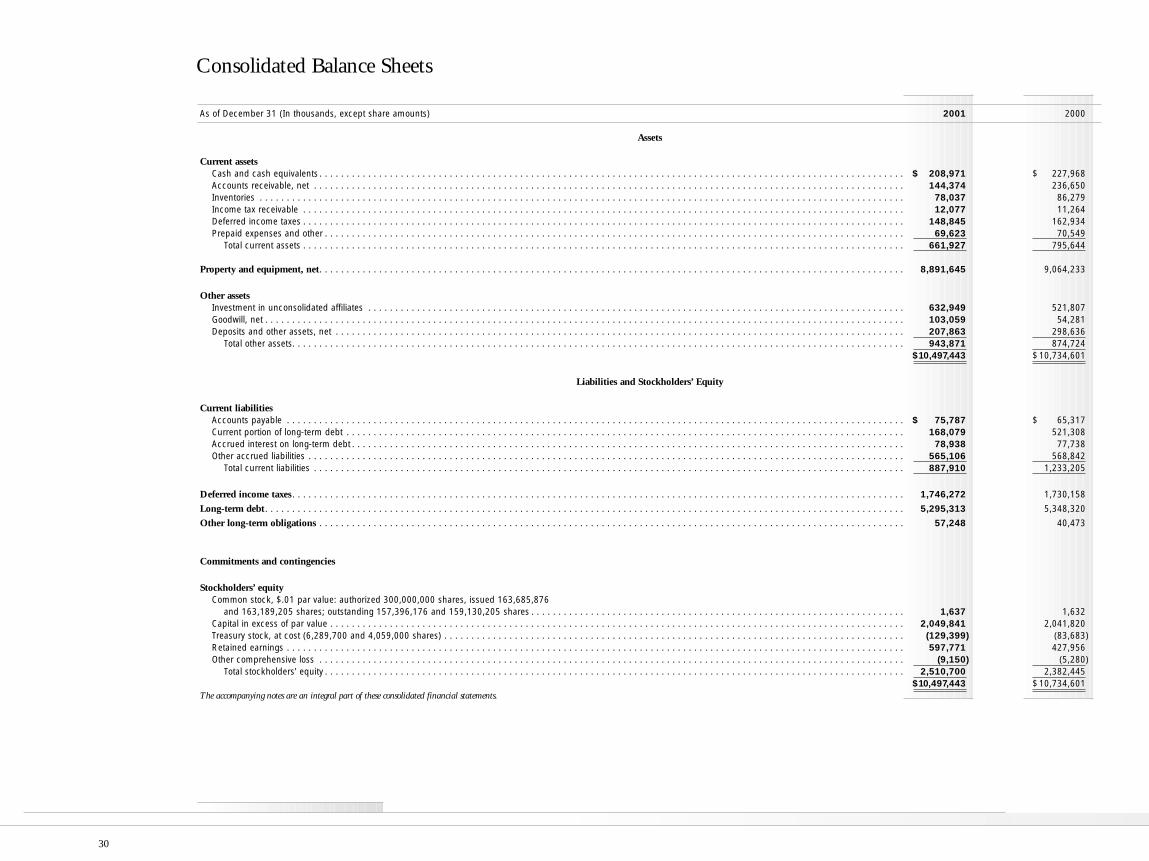
As of December 31 (In thousands, except share amounts) 2001 2000
Assets
Current assetsCash and cash equivalents . . . . . . . . . . . . . . . . . . . . . . . . . . . . . . . . . . . . . . . . . . . . . . . . . . . . . . . . . . . . . . . . . . . . . . . . . . . . . . . . . . . . . . . . . . . . . . . . . . . . . . . . . . . . $ 208,971 $ 227,968Accounts receivable, net . . . . . . . . . . . . . . . . . . . . . . . . . . . . . . . . . . . . . . . . . . . . . . . . . . . . . . . . . . . . . . . . . . . . . . . . . . . . . . . . . . . . . . . . . . . . . . . . . . . . . . . . . . . . . 144,374 236,650Inventories . . . . . . . . . . . . . . . . . . . . . . . . . . . . . . . . . . . . . . . . . . . . . . . . . . . . . . . . . . . . . . . . . . . . . . . . . . . . . . . . . . . . . . . . . . . . . . . . . . . . . . . . . . . . . . . . . . . . . . . 78,037 86,279Income tax receivable . . . . . . . . . . . . . . . . . . . . . . . . . . . . . . . . . . . . . . . . . . . . . . . . . . . . . . . . . . . . . . . . . . . . . . . . . . . . . . . . . . . . . . . . . . . . . . . . . . . . . . . . . . . . . . . 12,077 11,264Deferred income taxes . . . . . . . . . . . . . . . . . . . . . . . . . . . . . . . . . . . . . . . . . . . . . . . . . . . . . . . . . . . . . . . . . . . . . . . . . . . . . . . . . . . . . . . . . . . . . . . . . . . . . . . . . . . . . . . 148,845 162,934Prepaid expenses and other . . . . . . . . . . . . . . . . . . . . . . . . . . . . . . . . . . . . . . . . . . . . . . . . . . . . . . . . . . . . . . . . . . . . . . . . . . . . . . . . . . . . . . . . . . . . . . . . . . . . . . . . . . . 69,623 70,549
Total current assets . . . . . . . . . . . . . . . . . . . . . . . . . . . . . . . . . . . . . . . . . . . . . . . . . . . . . . . . . . . . . . . . . . . . . . . . . . . . . . . . . . . . . . . . . . . . . . . . . . . . . . . . . . . . . . . 661,927 795,644
Property and equipment, net. . . . . . . . . . . . . . . . . . . . . . . . . . . . . . . . . . . . . . . . . . . . . . . . . . . . . . . . . . . . . . . . . . . . . . . . . . . . . . . . . . . . . . . . . . . . . . . . . . . . . . . . . . . . 8,891,645 9,064,233
Other assetsInvestment in unconsolidated affiliates . . . . . . . . . . . . . . . . . . . . . . . . . . . . . . . . . . . . . . . . . . . . . . . . . . . . . . . . . . . . . . . . . . . . . . . . . . . . . . . . . . . . . . . . . . . . . . . . . . . 632,949 521,807Goodwill, net . . . . . . . . . . . . . . . . . . . . . . . . . . . . . . . . . . . . . . . . . . . . . . . . . . . . . . . . . . . . . . . . . . . . . . . . . . . . . . . . . . . . . . . . . . . . . . . . . . . . . . . . . . . . . . . . . . . . . . 103,059 54,281Deposits and other assets, net . . . . . . . . . . . . . . . . . . . . . . . . . . . . . . . . . . . . . . . . . . . . . . . . . . . . . . . . . . . . . . . . . . . . . . . . . . . . . . . . . . . . . . . . . . . . . . . . . . . . . . . . . 207,863 298,636
Total other assets. . . . . . . . . . . . . . . . . . . . . . . . . . . . . . . . . . . . . . . . . . . . . . . . . . . . . . . . . . . . . . . . . . . . . . . . . . . . . . . . . . . . . . . . . . . . . . . . . . . . . . . . . . . . . . . . . 943,871 874,724$10,497,443 $ 10,734,601
Liabilities and Stockholders’ Equity
Current liabilitiesAccounts payable . . . . . . . . . . . . . . . . . . . . . . . . . . . . . . . . . . . . . . . . . . . . . . . . . . . . . . . . . . . . . . . . . . . . . . . . . . . . . . . . . . . . . . . . . . . . . . . . . . . . . . . . . . . . . . . . . . $ 75,787 $ 65,317Current portion of long-term debt . . . . . . . . . . . . . . . . . . . . . . . . . . . . . . . . . . . . . . . . . . . . . . . . . . . . . . . . . . . . . . . . . . . . . . . . . . . . . . . . . . . . . . . . . . . . . . . . . . . . . . . 168,079 521,308Accrued interest on long-term debt . . . . . . . . . . . . . . . . . . . . . . . . . . . . . . . . . . . . . . . . . . . . . . . . . . . . . . . . . . . . . . . . . . . . . . . . . . . . . . . . . . . . . . . . . . . . . . . . . . . . . . 78,938 77,738Other accrued liabilities . . . . . . . . . . . . . . . . . . . . . . . . . . . . . . . . . . . . . . . . . . . . . . . . . . . . . . . . . . . . . . . . . . . . . . . . . . . . . . . . . . . . . . . . . . . . . . . . . . . . . . . . . . . . . . 565,106 568,842
Total current liabilities . . . . . . . . . . . . . . . . . . . . . . . . . . . . . . . . . . . . . . . . . . . . . . . . . . . . . . . . . . . . . . . . . . . . . . . . . . . . . . . . . . . . . . . . . . . . . . . . . . . . . . . . . . . . . 887,910 1,233,205
Deferred income taxes . . . . . . . . . . . . . . . . . . . . . . . . . . . . . . . . . . . . . . . . . . . . . . . . . . . . . . . . . . . . . . . . . . . . . . . . . . . . . . . . . . . . . . . . . . . . . . . . . . . . . . . . . . . . . . . . . 1,746,272 1,730,158
Long-term debt . . . . . . . . . . . . . . . . . . . . . . . . . . . . . . . . . . . . . . . . . . . . . . . . . . . . . . . . . . . . . . . . . . . . . . . . . . . . . . . . . . . . . . . . . . . . . . . . . . . . . . . . . . . . . . . . . . . . . . 5,295,313 5,348,320
Other long-term obligations . . . . . . . . . . . . . . . . . . . . . . . . . . . . . . . . . . . . . . . . . . . . . . . . . . . . . . . . . . . . . . . . . . . . . . . . . . . . . . . . . . . . . . . . . . . . . . . . . . . . . . . . . . . . 57,248 40,473
Commitments and contingencies
Stockholders’ equityCommon stock, $.01 par value: authorized 300,000,000 shares, issued 163,685,876
and 163,189,205 shares; outstanding 157,396,176 and 159,130,205 shares . . . . . . . . . . . . . . . . . . . . . . . . . . . . . . . . . . . . . . . . . . . . . . . . . . . . . . . . . . . . . . . . . . . . . 1,637 1,632Capital in excess of par value . . . . . . . . . . . . . . . . . . . . . . . . . . . . . . . . . . . . . . . . . . . . . . . . . . . . . . . . . . . . . . . . . . . . . . . . . . . . . . . . . . . . . . . . . . . . . . . . . . . . . . . . . . 2,049,841 2,041,820Treasury stock, at cost (6,289,700 and 4,059,000 shares) . . . . . . . . . . . . . . . . . . . . . . . . . . . . . . . . . . . . . . . . . . . . . . . . . . . . . . . . . . . . . . . . . . . . . . . . . . . . . . . . . . . . . (129,399) (83,683)Retained earnings . . . . . . . . . . . . . . . . . . . . . . . . . . . . . . . . . . . . . . . . . . . . . . . . . . . . . . . . . . . . . . . . . . . . . . . . . . . . . . . . . . . . . . . . . . . . . . . . . . . . . . . . . . . . . . . . . . 597,771 427,956Other comprehensive loss . . . . . . . . . . . . . . . . . . . . . . . . . . . . . . . . . . . . . . . . . . . . . . . . . . . . . . . . . . . . . . . . . . . . . . . . . . . . . . . . . . . . . . . . . . . . . . . . . . . . . . . . . . . . (9,150) (5,280)
Total stockholders’ equity . . . . . . . . . . . . . . . . . . . . . . . . . . . . . . . . . . . . . . . . . . . . . . . . . . . . . . . . . . . . . . . . . . . . . . . . . . . . . . . . . . . . . . . . . . . . . . . . . . . . . . . . . . . 2,510,700 2,382,445$10,497,443 $ 10,734,601
The accompanying notes are an integral part of these consolidated financial statements.
Consolidated Balance Sheets
30
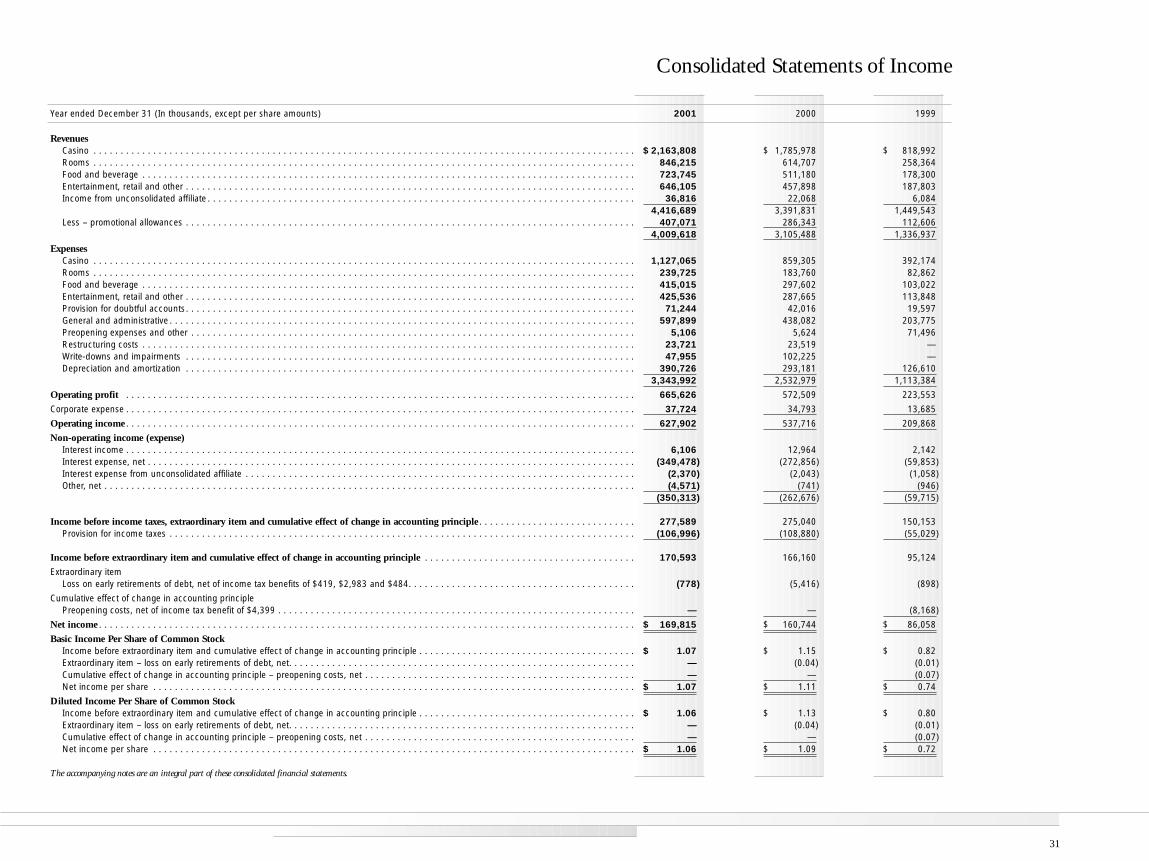
Consolidated Statements of Income
31
RevenuesCasino . . . . . . . . . . . . . . . . . . . . . . . . . . . . . . . . . . . . . . . . . . . . . . . . . . . . . . . . . . . . . . . . . . . . . . . . . . . . . . . . . . . . . . . . . . . . . . . . . . . . $ 2,163,808 $ 1,785,978 $ 818,992Rooms . . . . . . . . . . . . . . . . . . . . . . . . . . . . . . . . . . . . . . . . . . . . . . . . . . . . . . . . . . . . . . . . . . . . . . . . . . . . . . . . . . . . . . . . . . . . . . . . . . . . 846,215 614,707 258,364Food and beverage . . . . . . . . . . . . . . . . . . . . . . . . . . . . . . . . . . . . . . . . . . . . . . . . . . . . . . . . . . . . . . . . . . . . . . . . . . . . . . . . . . . . . . . . . . . 723,745 511,180 178,300Entertainment, retail and other . . . . . . . . . . . . . . . . . . . . . . . . . . . . . . . . . . . . . . . . . . . . . . . . . . . . . . . . . . . . . . . . . . . . . . . . . . . . . . . . . . . 646,105 457,898 187,803Income from unconsolidated affiliate . . . . . . . . . . . . . . . . . . . . . . . . . . . . . . . . . . . . . . . . . . . . . . . . . . . . . . . . . . . . . . . . . . . . . . . . . . . . . . . 36,816 22,068 6,084
4,416,689 3,391,831 1,449,543Less – promotional allowances . . . . . . . . . . . . . . . . . . . . . . . . . . . . . . . . . . . . . . . . . . . . . . . . . . . . . . . . . . . . . . . . . . . . . . . . . . . . . . . . . . . 407,071 286,343 112,606
4,009,618 3,105,488 1,336,937
ExpensesCasino . . . . . . . . . . . . . . . . . . . . . . . . . . . . . . . . . . . . . . . . . . . . . . . . . . . . . . . . . . . . . . . . . . . . . . . . . . . . . . . . . . . . . . . . . . . . . . . . . . . . 1,127,065 859,305 392,174Rooms . . . . . . . . . . . . . . . . . . . . . . . . . . . . . . . . . . . . . . . . . . . . . . . . . . . . . . . . . . . . . . . . . . . . . . . . . . . . . . . . . . . . . . . . . . . . . . . . . . . . 239,725 183,760 82,862Food and beverage . . . . . . . . . . . . . . . . . . . . . . . . . . . . . . . . . . . . . . . . . . . . . . . . . . . . . . . . . . . . . . . . . . . . . . . . . . . . . . . . . . . . . . . . . . . 415,015 297,602 103,022Entertainment, retail and other . . . . . . . . . . . . . . . . . . . . . . . . . . . . . . . . . . . . . . . . . . . . . . . . . . . . . . . . . . . . . . . . . . . . . . . . . . . . . . . . . . . 425,536 287,665 113,848Provision for doubtful accounts. . . . . . . . . . . . . . . . . . . . . . . . . . . . . . . . . . . . . . . . . . . . . . . . . . . . . . . . . . . . . . . . . . . . . . . . . . . . . . . . . . . 71,244 42,016 19,597General and administrative . . . . . . . . . . . . . . . . . . . . . . . . . . . . . . . . . . . . . . . . . . . . . . . . . . . . . . . . . . . . . . . . . . . . . . . . . . . . . . . . . . . . . . 597,899 438,082 203,775Preopening expenses and other . . . . . . . . . . . . . . . . . . . . . . . . . . . . . . . . . . . . . . . . . . . . . . . . . . . . . . . . . . . . . . . . . . . . . . . . . . . . . . . . . . 5,106 5,624 71,496Restructuring costs . . . . . . . . . . . . . . . . . . . . . . . . . . . . . . . . . . . . . . . . . . . . . . . . . . . . . . . . . . . . . . . . . . . . . . . . . . . . . . . . . . . . . . . . . . . 23,721 23,519 —Write-downs and impairments . . . . . . . . . . . . . . . . . . . . . . . . . . . . . . . . . . . . . . . . . . . . . . . . . . . . . . . . . . . . . . . . . . . . . . . . . . . . . . . . . . . 47,955 102,225 —Depreciation and amortization . . . . . . . . . . . . . . . . . . . . . . . . . . . . . . . . . . . . . . . . . . . . . . . . . . . . . . . . . . . . . . . . . . . . . . . . . . . . . . . . . . . 390,726 293,181 126,610
3,343,992 2,532,979 1,113,384
Operating profit . . . . . . . . . . . . . . . . . . . . . . . . . . . . . . . . . . . . . . . . . . . . . . . . . . . . . . . . . . . . . . . . . . . . . . . . . . . . . . . . . . . . . . . . . . . . . . 665,626 572,509 223,553
Corporate expense . . . . . . . . . . . . . . . . . . . . . . . . . . . . . . . . . . . . . . . . . . . . . . . . . . . . . . . . . . . . . . . . . . . . . . . . . . . . . . . . . . . . . . . . . . . . . . 37,724 34,793 13,685
Operating income . . . . . . . . . . . . . . . . . . . . . . . . . . . . . . . . . . . . . . . . . . . . . . . . . . . . . . . . . . . . . . . . . . . . . . . . . . . . . . . . . . . . . . . . . . . . . . 627,902 537,716 209,868
Non-operating income (expense)Interest income . . . . . . . . . . . . . . . . . . . . . . . . . . . . . . . . . . . . . . . . . . . . . . . . . . . . . . . . . . . . . . . . . . . . . . . . . . . . . . . . . . . . . . . . . . . . . . 6,106 12,964 2,142Interest expense, net . . . . . . . . . . . . . . . . . . . . . . . . . . . . . . . . . . . . . . . . . . . . . . . . . . . . . . . . . . . . . . . . . . . . . . . . . . . . . . . . . . . . . . . . . . (349,478) (272,856) (59,853)Interest expense from unconsolidated affiliate . . . . . . . . . . . . . . . . . . . . . . . . . . . . . . . . . . . . . . . . . . . . . . . . . . . . . . . . . . . . . . . . . . . . . . . . (2,370) (2,043) (1,058)Other, net . . . . . . . . . . . . . . . . . . . . . . . . . . . . . . . . . . . . . . . . . . . . . . . . . . . . . . . . . . . . . . . . . . . . . . . . . . . . . . . . . . . . . . . . . . . . . . . . . . (4,571) (741) (946)
(350,313) (262,676) (59,715)
Income before income taxes, extraordinary item and cumulative effect of change in accounting principle . . . . . . . . . . . . . . . . . . . . . . . . . . . . . 277,589 275,040 150,153Provision for income taxes . . . . . . . . . . . . . . . . . . . . . . . . . . . . . . . . . . . . . . . . . . . . . . . . . . . . . . . . . . . . . . . . . . . . . . . . . . . . . . . . . . . . . . (106,996) (108,880) (55,029)
Income before extraordinary item and cumulative effect of change in accounting principle . . . . . . . . . . . . . . . . . . . . . . . . . . . . . . . . . . . . . . . 170,593 166,160 95,124
Extraordinary itemLoss on early retirements of debt, net of income tax benefits of $419, $2,983 and $484. . . . . . . . . . . . . . . . . . . . . . . . . . . . . . . . . . . . . . . . . . (778) (5,416) (898)
Cumulative effect of change in accounting principlePreopening costs, net of income tax benefit of $4,399 . . . . . . . . . . . . . . . . . . . . . . . . . . . . . . . . . . . . . . . . . . . . . . . . . . . . . . . . . . . . . . . . . . — — (8,168)
Net income . . . . . . . . . . . . . . . . . . . . . . . . . . . . . . . . . . . . . . . . . . . . . . . . . . . . . . . . . . . . . . . . . . . . . . . . . . . . . . . . . . . . . . . . . . . . . . . . . . . $ 169,815 $ 160,744 $ 86,058
Basic Income Per Share of Common StockIncome before extraordinary item and cumulative effect of change in accounting principle . . . . . . . . . . . . . . . . . . . . . . . . . . . . . . . . . . . . . . . . $ 1.07 $ 1.15 $ 0.82Extraordinary item – loss on early retirements of debt, net. . . . . . . . . . . . . . . . . . . . . . . . . . . . . . . . . . . . . . . . . . . . . . . . . . . . . . . . . . . . . . . . — (0.04) (0.01)Cumulative effect of change in accounting principle – preopening costs, net . . . . . . . . . . . . . . . . . . . . . . . . . . . . . . . . . . . . . . . . . . . . . . . . . . — — (0.07)Net income per share . . . . . . . . . . . . . . . . . . . . . . . . . . . . . . . . . . . . . . . . . . . . . . . . . . . . . . . . . . . . . . . . . . . . . . . . . . . . . . . . . . . . . . . . . $ 1.07 $ 1.11 $ 0.74
Diluted Income Per Share of Common StockIncome before extraordinary item and cumulative effect of change in accounting principle . . . . . . . . . . . . . . . . . . . . . . . . . . . . . . . . . . . . . . . . $ 1.06 $ 1.13 $ 0.80Extraordinary item – loss on early retirements of debt, net. . . . . . . . . . . . . . . . . . . . . . . . . . . . . . . . . . . . . . . . . . . . . . . . . . . . . . . . . . . . . . . . — (0.04) (0.01)Cumulative effect of change in accounting principle – preopening costs, net . . . . . . . . . . . . . . . . . . . . . . . . . . . . . . . . . . . . . . . . . . . . . . . . . . — — (0.07)Net income per share . . . . . . . . . . . . . . . . . . . . . . . . . . . . . . . . . . . . . . . . . . . . . . . . . . . . . . . . . . . . . . . . . . . . . . . . . . . . . . . . . . . . . . . . . $ 1.06 $ 1.09 $ 0.72
The accompanying notes are an integral part of these consolidated financial statements.
Year ended December 31 (In thousands, except per share amounts) 2001 2000 1999
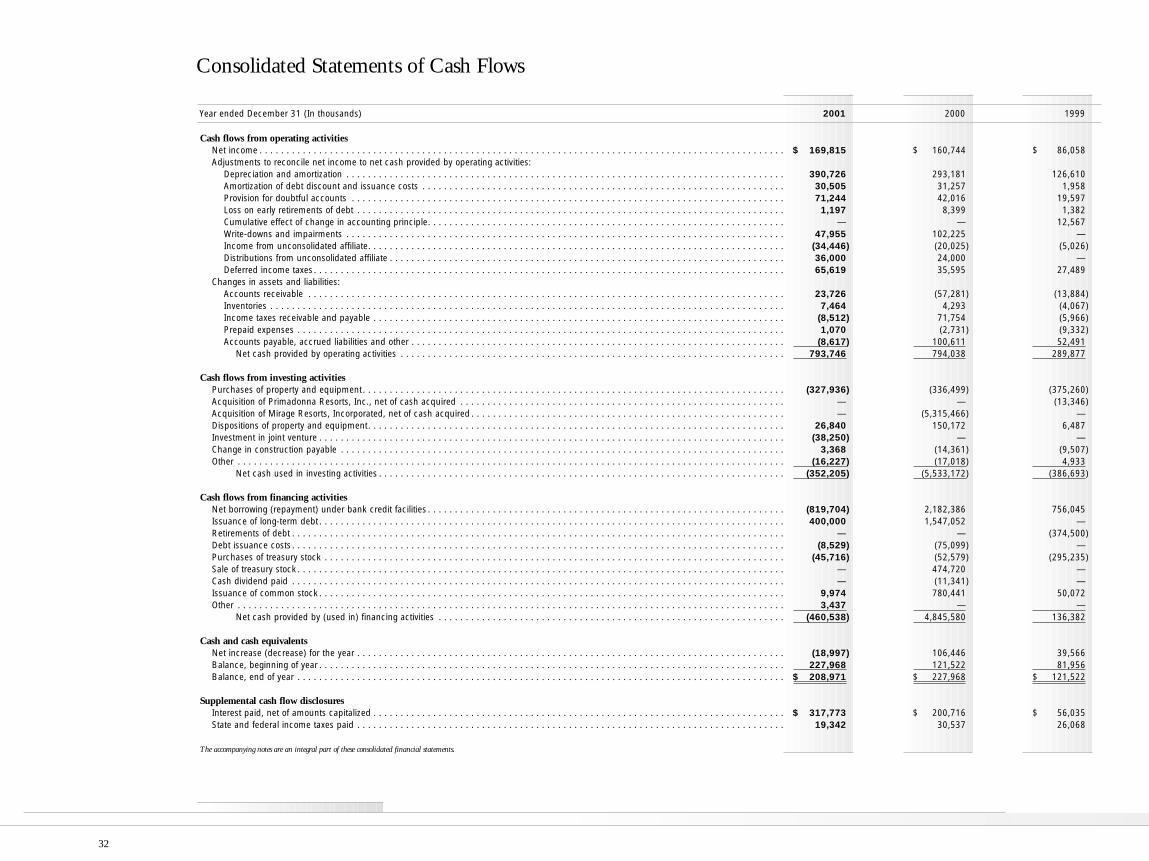
Cash flows from operating activitiesNet income . . . . . . . . . . . . . . . . . . . . . . . . . . . . . . . . . . . . . . . . . . . . . . . . . . . . . . . . . . . . . . . . . . . . . . . . . . . . . . . . . . . . . . . . . . . . . . . . . $ 169,815 $ 160,744 $ 86,058Adjustments to reconcile net income to net cash provided by operating activities:
Depreciation and amortization . . . . . . . . . . . . . . . . . . . . . . . . . . . . . . . . . . . . . . . . . . . . . . . . . . . . . . . . . . . . . . . . . . . . . . . . . . . . . . . . . 390,726 293,181 126,610Amortization of debt discount and issuance costs . . . . . . . . . . . . . . . . . . . . . . . . . . . . . . . . . . . . . . . . . . . . . . . . . . . . . . . . . . . . . . . . . . . 30,505 31,257 1,958Provision for doubtful accounts . . . . . . . . . . . . . . . . . . . . . . . . . . . . . . . . . . . . . . . . . . . . . . . . . . . . . . . . . . . . . . . . . . . . . . . . . . . . . . . . 71,244 42,016 19,597Loss on early retirements of debt . . . . . . . . . . . . . . . . . . . . . . . . . . . . . . . . . . . . . . . . . . . . . . . . . . . . . . . . . . . . . . . . . . . . . . . . . . . . . . . 1,197 8,399 1,382Cumulative effect of change in accounting principle. . . . . . . . . . . . . . . . . . . . . . . . . . . . . . . . . . . . . . . . . . . . . . . . . . . . . . . . . . . . . . . . . . — — 12,567Write-downs and impairments . . . . . . . . . . . . . . . . . . . . . . . . . . . . . . . . . . . . . . . . . . . . . . . . . . . . . . . . . . . . . . . . . . . . . . . . . . . . . . . . . 47,955 102,225 —Income from unconsolidated affiliate. . . . . . . . . . . . . . . . . . . . . . . . . . . . . . . . . . . . . . . . . . . . . . . . . . . . . . . . . . . . . . . . . . . . . . . . . . . . . (34,446) (20,025) (5,026)Distributions from unconsolidated affiliate . . . . . . . . . . . . . . . . . . . . . . . . . . . . . . . . . . . . . . . . . . . . . . . . . . . . . . . . . . . . . . . . . . . . . . . . . 36,000 24,000 —Deferred income taxes . . . . . . . . . . . . . . . . . . . . . . . . . . . . . . . . . . . . . . . . . . . . . . . . . . . . . . . . . . . . . . . . . . . . . . . . . . . . . . . . . . . . . . . 65,619 35,595 27,489
Changes in assets and liabilities:Accounts receivable . . . . . . . . . . . . . . . . . . . . . . . . . . . . . . . . . . . . . . . . . . . . . . . . . . . . . . . . . . . . . . . . . . . . . . . . . . . . . . . . . . . . . . . . 23,726 (57,281) (13,884)Inventories . . . . . . . . . . . . . . . . . . . . . . . . . . . . . . . . . . . . . . . . . . . . . . . . . . . . . . . . . . . . . . . . . . . . . . . . . . . . . . . . . . . . . . . . . . . . . . . 7,464 4,293 (4,067)Income taxes receivable and payable . . . . . . . . . . . . . . . . . . . . . . . . . . . . . . . . . . . . . . . . . . . . . . . . . . . . . . . . . . . . . . . . . . . . . . . . . . . . (8,512) 71,754 (5,966)Prepaid expenses . . . . . . . . . . . . . . . . . . . . . . . . . . . . . . . . . . . . . . . . . . . . . . . . . . . . . . . . . . . . . . . . . . . . . . . . . . . . . . . . . . . . . . . . . . 1,070 (2,731) (9,332)Accounts payable, accrued liabilities and other . . . . . . . . . . . . . . . . . . . . . . . . . . . . . . . . . . . . . . . . . . . . . . . . . . . . . . . . . . . . . . . . . . . . . (8,617) 100,611 52,491
Net cash provided by operating activities . . . . . . . . . . . . . . . . . . . . . . . . . . . . . . . . . . . . . . . . . . . . . . . . . . . . . . . . . . . . . . . . . . . . . . . 793,746 794,038 289,877
Cash flows from investing activitiesPurchases of property and equipment. . . . . . . . . . . . . . . . . . . . . . . . . . . . . . . . . . . . . . . . . . . . . . . . . . . . . . . . . . . . . . . . . . . . . . . . . . . . . . (327,936) (336,499) (375,260)Acquisition of Primadonna Resorts, Inc., net of cash acquired . . . . . . . . . . . . . . . . . . . . . . . . . . . . . . . . . . . . . . . . . . . . . . . . . . . . . . . . . . . . — — (13,346)Acquisition of Mirage Resorts, Incorporated, net of cash acquired . . . . . . . . . . . . . . . . . . . . . . . . . . . . . . . . . . . . . . . . . . . . . . . . . . . . . . . . . . — (5,315,466) —Dispositions of property and equipment. . . . . . . . . . . . . . . . . . . . . . . . . . . . . . . . . . . . . . . . . . . . . . . . . . . . . . . . . . . . . . . . . . . . . . . . . . . . . 26,840 150,172 6,487Investment in joint venture . . . . . . . . . . . . . . . . . . . . . . . . . . . . . . . . . . . . . . . . . . . . . . . . . . . . . . . . . . . . . . . . . . . . . . . . . . . . . . . . . . . . . . (38,250) — —Change in construction payable . . . . . . . . . . . . . . . . . . . . . . . . . . . . . . . . . . . . . . . . . . . . . . . . . . . . . . . . . . . . . . . . . . . . . . . . . . . . . . . . . . 3,368 (14,361) (9,507)Other . . . . . . . . . . . . . . . . . . . . . . . . . . . . . . . . . . . . . . . . . . . . . . . . . . . . . . . . . . . . . . . . . . . . . . . . . . . . . . . . . . . . . . . . . . . . . . . . . . . . . (16,227) (17,018) 4,933
Net cash used in investing activities . . . . . . . . . . . . . . . . . . . . . . . . . . . . . . . . . . . . . . . . . . . . . . . . . . . . . . . . . . . . . . . . . . . . . . . . . . . (352,205) (5,533,172) (386,693)
Cash flows from financing activitiesNet borrowing (repayment) under bank credit facilities . . . . . . . . . . . . . . . . . . . . . . . . . . . . . . . . . . . . . . . . . . . . . . . . . . . . . . . . . . . . . . . . . . (819,704) 2,182,386 756,045Issuance of long-term debt . . . . . . . . . . . . . . . . . . . . . . . . . . . . . . . . . . . . . . . . . . . . . . . . . . . . . . . . . . . . . . . . . . . . . . . . . . . . . . . . . . . . . . 400,000 1,547,052 —Retirements of debt . . . . . . . . . . . . . . . . . . . . . . . . . . . . . . . . . . . . . . . . . . . . . . . . . . . . . . . . . . . . . . . . . . . . . . . . . . . . . . . . . . . . . . . . . . . — — (374,500)Debt issuance costs . . . . . . . . . . . . . . . . . . . . . . . . . . . . . . . . . . . . . . . . . . . . . . . . . . . . . . . . . . . . . . . . . . . . . . . . . . . . . . . . . . . . . . . . . . . (8,529) (75,099) —Purchases of treasury stock . . . . . . . . . . . . . . . . . . . . . . . . . . . . . . . . . . . . . . . . . . . . . . . . . . . . . . . . . . . . . . . . . . . . . . . . . . . . . . . . . . . . . (45,716) (52,579) (295,235)Sale of treasury stock . . . . . . . . . . . . . . . . . . . . . . . . . . . . . . . . . . . . . . . . . . . . . . . . . . . . . . . . . . . . . . . . . . . . . . . . . . . . . . . . . . . . . . . . . . — 474,720 —Cash dividend paid . . . . . . . . . . . . . . . . . . . . . . . . . . . . . . . . . . . . . . . . . . . . . . . . . . . . . . . . . . . . . . . . . . . . . . . . . . . . . . . . . . . . . . . . . . . — (11,341) —Issuance of common stock . . . . . . . . . . . . . . . . . . . . . . . . . . . . . . . . . . . . . . . . . . . . . . . . . . . . . . . . . . . . . . . . . . . . . . . . . . . . . . . . . . . . . . 9,974 780,441 50,072Other . . . . . . . . . . . . . . . . . . . . . . . . . . . . . . . . . . . . . . . . . . . . . . . . . . . . . . . . . . . . . . . . . . . . . . . . . . . . . . . . . . . . . . . . . . . . . . . . . . . . . 3,437 — —
Net cash provided by (used in) financing activities . . . . . . . . . . . . . . . . . . . . . . . . . . . . . . . . . . . . . . . . . . . . . . . . . . . . . . . . . . . . . . . . (460,538) 4,845,580 136,382
Cash and cash equivalentsNet increase (decrease) for the year . . . . . . . . . . . . . . . . . . . . . . . . . . . . . . . . . . . . . . . . . . . . . . . . . . . . . . . . . . . . . . . . . . . . . . . . . . . . . . . (18,997) 106,446 39,566Balance, beginning of year . . . . . . . . . . . . . . . . . . . . . . . . . . . . . . . . . . . . . . . . . . . . . . . . . . . . . . . . . . . . . . . . . . . . . . . . . . . . . . . . . . . . . . 227,968 121,522 81,956Balance, end of year . . . . . . . . . . . . . . . . . . . . . . . . . . . . . . . . . . . . . . . . . . . . . . . . . . . . . . . . . . . . . . . . . . . . . . . . . . . . . . . . . . . . . . . . . . $ 208,971 $ 227,968 $ 121,522
Supplemental cash flow disclosuresInterest paid, net of amounts capitalized . . . . . . . . . . . . . . . . . . . . . . . . . . . . . . . . . . . . . . . . . . . . . . . . . . . . . . . . . . . . . . . . . . . . . . . . . . . . $ 317,773 $ 200,716 $ 56,035State and federal income taxes paid . . . . . . . . . . . . . . . . . . . . . . . . . . . . . . . . . . . . . . . . . . . . . . . . . . . . . . . . . . . . . . . . . . . . . . . . . . . . . . . 19,342 30,537 26,068
The accompanying notes are an integral part of these consolidated financial statements.
Year ended December 31 (In thousands) 2001 2000 1999
Consolidated Statements of Cash Flows
32
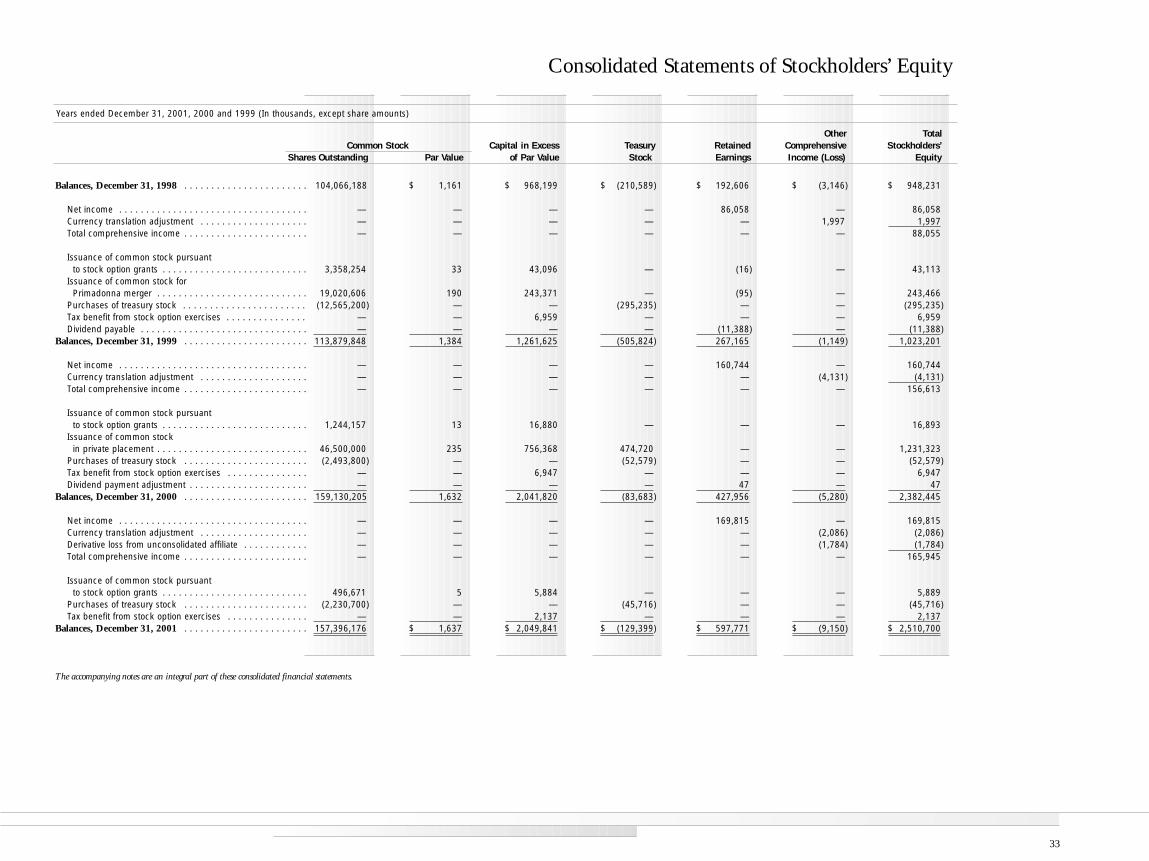
Balances, December 31, 1998 . . . . . . . . . . . . . . . . . . . . . . . 104,066,188 $ 1,161 $ 968,199 $ (210,589) $ 192,606 $ (3,146) $ 948,231
Net income . . . . . . . . . . . . . . . . . . . . . . . . . . . . . . . . . . . — — — — 86,058 — 86,058Currency translation adjustment . . . . . . . . . . . . . . . . . . . . — — — — — 1,997 1,997Total comprehensive income . . . . . . . . . . . . . . . . . . . . . . . — — — — — — 88,055
Issuance of common stock pursuantto stock option grants . . . . . . . . . . . . . . . . . . . . . . . . . . . 3,358,254 33 43,096 — (16) — 43,113
Issuance of common stock forPrimadonna merger . . . . . . . . . . . . . . . . . . . . . . . . . . . . 19,020,606 190 243,371 — (95) — 243,466
Purchases of treasury stock . . . . . . . . . . . . . . . . . . . . . . . (12,565,200) — — (295,235) — — (295,235)Tax benefit from stock option exercises . . . . . . . . . . . . . . . — — 6,959 — — — 6,959Dividend payable . . . . . . . . . . . . . . . . . . . . . . . . . . . . . . . — — — — (11,388) — (11,388)
Balances, December 31, 1999 . . . . . . . . . . . . . . . . . . . . . . . 113,879,848 1,384 1,261,625 (505,824) 267,165 (1,149) 1,023,201
Net income . . . . . . . . . . . . . . . . . . . . . . . . . . . . . . . . . . . — — — — 160,744 — 160,744Currency translation adjustment . . . . . . . . . . . . . . . . . . . . — — — — — (4,131) (4,131)Total comprehensive income . . . . . . . . . . . . . . . . . . . . . . . — — — — — — 156,613
Issuance of common stock pursuantto stock option grants . . . . . . . . . . . . . . . . . . . . . . . . . . . 1,244,157 13 16,880 — — — 16,893
Issuance of common stockin private placement . . . . . . . . . . . . . . . . . . . . . . . . . . . . 46,500,000 235 756,368 474,720 — — 1,231,323
Purchases of treasury stock . . . . . . . . . . . . . . . . . . . . . . . (2,493,800) — — (52,579) — — (52,579)Tax benefit from stock option exercises . . . . . . . . . . . . . . . — — 6,947 — — — 6,947Dividend payment adjustment . . . . . . . . . . . . . . . . . . . . . . — — — — 47 — 47
Balances, December 31, 2000 . . . . . . . . . . . . . . . . . . . . . . . 159,130,205 1,632 2,041,820 (83,683) 427,956 (5,280) 2,382,445
Net income . . . . . . . . . . . . . . . . . . . . . . . . . . . . . . . . . . . — — — — 169,815 — 169,815Currency translation adjustment . . . . . . . . . . . . . . . . . . . . — — — — — (2,086) (2,086)Derivative loss from unconsolidated affiliate . . . . . . . . . . . . — — — — — (1,784) (1,784)Total comprehensive income . . . . . . . . . . . . . . . . . . . . . . . — — — — — — 165,945
Issuance of common stock pursuantto stock option grants . . . . . . . . . . . . . . . . . . . . . . . . . . . 496,671 5 5,884 — — — 5,889
Purchases of treasury stock . . . . . . . . . . . . . . . . . . . . . . . (2,230,700) — — (45,716) — — (45,716)Tax benefit from stock option exercises . . . . . . . . . . . . . . . — — 2,137 — — — 2,137
Balances, December 31, 2001 . . . . . . . . . . . . . . . . . . . . . . . 157,396,176 $ 1,637 $ 2,049,841 $ (129,399) $ 597,771 $ (9,150) $ 2,510,700
The accompanying notes are an integral part of these consolidated financial statements.
Consolidated Statements of Stockholders’ Equity
33
Years ended December 31, 2001, 2000 and 1999 (In thousands, except share amounts)
Other Total Common Stock Capital in Excess Teasury Retained Comprehensive Stockholders’
Shares Outstanding Par Value of Par Value Stock Earnings Income (Loss) Equity
NOTE 1 — OrganizationMGM MIRAGE (the “Company”), formerly known as MGM Grand, Inc., is aDelaware corporation, incorporated on January 29, 1986. As of December 31,2001, approximately 52% of the outstanding shares of the Company’s commonstock were owned by Tracinda Corporation, a Nevada corporation wholly ownedby Kirk Kerkorian.
On May 31, 2000, the Company completed the acquisition (the “MirageAcquisition”) of Mirage Resorts, Incorporated (“Mirage”) (see Note 3). Mirage,through wholly owned subsidiaries, owns and operates the following hotel, casino and entertainment resorts: Bellagio, a European-style luxury resort; TheMirage, a tropically-themed destination resort; Treasure Island at The Mirage, aCaribbean-themed hotel and casino resort; and the Boardwalk Hotel and Casino,all of which are located on the Las Vegas Strip. Mirage owns a 50% interest inthe joint venture that owns and operates the Monte Carlo Resort & Casino, apalatial-style hotel and casino also located on the Las Vegas Strip. Mirage owns andoperates Shadow Creek, an exclusive world-class golf course located approximatelyten miles north of its Las Vegas Strip properties. Mirage also owns and operatesthe Golden Nugget, a hotel and casino in downtown Las Vegas, the GoldenNugget-Laughlin, located in Laughlin, Nevada, and Beau Rivage, a beachfrontresort located in Biloxi, Mississippi.
Through wholly owned subsidiaries, the Company owns and operates the MGM Grand Hotel and Casino (“MGM Grand Las Vegas”), a hotel, casino andentertainment complex, and New York-New York Hotel and Casino, a destinationresort, both located on the Las Vegas Strip. The Company, through whollyowned subsidiaries, also owns and operates three resorts located in Primm,Nevada at the California/Nevada state line: Whiskey Pete’s, Buffalo Bill’s and the Primm Valley Resort (the “Primm Properties”), as well as two championshipgolf courses located near the Primm Properties. Prior to March 1, 1999, theCompany was a 50% owner of New York-New York. The remaining 50%
interest, along with the Primm Properties and the nearby golf courses, wereacquired via the acquisition of Primadonna Resorts, Inc. on March 1, 1999 (the “Primadonna Acquisition”) (see Note 3).
The Company, through its wholly owned subsidiary, MGM Grand Detroit, Inc.,and its local partners formed MGM Grand Detroit, LLC, to develop a hotel,casino and entertainment complex in Detroit, Michigan. On July 29, 1999,MGM Grand Detroit, LLC commenced gaming operations in an interim facilitylocated directly off of the John C. Lodge Expressway in downtown Detroit.
A limited liability company owned 50-50 with Boyd Gaming Corporation isdeveloping the Borgata, a hotel and casino resort on 27 acres at RenaissancePointe, located in the Marina area of Atlantic City, New Jersey. The Companyalso owns approximately 95 acres adjacent to the Borgata site which is availablefor future development.
Through its wholly owned subsidiary, MGM Grand Australia Pty Ltd., theCompany owns and operates the MGM Grand Hotel and Casino in Darwin,Australia (“MGM Grand Australia”), which is located on 18 acres of beachfrontproperty on the north central coast of Australia.
Through its wholly owned subsidiary, MGM Grand South Africa, Inc., theCompany manages three permanent casinos and one interim casino in the Republicof South Africa. The Company receives management fees from its partner, TsogoSun Gaming & Entertainment, which is responsible for providing all projectcosts. The Company has entered into an agreement to sell its operations in SouthAfrica. The transaction, which is subject to regulatory approval, is expected to becompleted in the second quarter of 2002.
Notes to Consolidated Financial Statements
34
NOTE 2 — Significant Accounting Policies and Basis of PresentationPrinciples of consolidation. The consolidated financial statements include theaccounts of the Company and its subsidiaries. Investments in unconsolidatedaffiliates which are 50% or less owned are accounted for under the equity method(see Note 13). All significant intercompany balances and transactions have beeneliminated in consolidation.
Management’s use of estimates. The consolidated financial statements have beenprepared in conformity with generally accepted accounting principles. Thoseprinciples require management to make estimates and assumptions that affect the reported amounts of assets and liabilities and disclosure of contingent assetsand liabilities at the date of the financial statements and the reported amounts of revenues and expenses during the reporting period. Actual results could differfrom those estimates.
Cash and cash equivalents. Cash and cash equivalents include investments inbank certificates of deposit and other interest bearing instruments with initialmaturities of three months or less. Such investments are carried at cost whichapproximates market value.
Concentrations of credit risk. Financial instruments that potentially subject theCompany to concentrations of credit risk consist principally of casino accounts receivable.
The Company extends credit to approved casino customers following backgroundchecks and investigations of creditworthiness. At December 31, 2001, a substantialportion of the Company’s receivables was due from customers residing in foreigncountries. Business or economic conditions or other significant events in thesecountries could affect the collectibility of such receivables.
An estimated allowance for doubtful accounts is maintained to reduce the Company’sreceivables to their carrying amount, which approximates fair value. Management
believes that as of December 31, 2001, no significant concentrations of credit riskexisted for which an allowance had not already been determined and recorded.
Inventories. Inventories generally consist of food and beverage, retail merchandiseand operating supplies, and are stated at the lower of cost or market. Cost is deter-mined by the first-in, first-out method.
Property and equipment. Property and equipment are stated at cost. Maintenanceand repairs that neither materially add to the value of the property nor appreciablyprolong its life are charged to expense as incurred. Gains or losses on dispositions ofproperty and equipment are included in the determination of income. Depreciationand amortization are provided on a straight-line basis over the estimated usefullives of the assets as follows:
Buildings and improvements . . . . . . . . . . . . . . . . . . 15 to 40 yearsEquipment, furniture and fixtures . . . . . . . . . . . . . . 3 to 7 yearsLand improvements . . . . . . . . . . . . . . . . . . . . . . . . 10 to 15 yearsLeasehold improvement . . . . . . . . . . . . . . . . . . . . . 5 to 20 years
Capital leases are depreciated over the estimated useful life of the assets or the lifeof the lease, whichever is shorter.
Goodwill. Goodwill represents the excess of purchase price over fair market value ofnet assets acquired in business combinations. The Company’s goodwill relates to the1995 acquisition of MGM Grand Australia and the 2000 Mirage Acquisition. TheCompany has historically amortized goodwill on a straight-line basis over 40 years.
Statement of Financial Accounting Standards No. 142, “Goodwill and OtherIntangible Assets,” was issued in June 2001. The statement provides that goodwillwill no longer be amortized effective January 1, 2002, but will instead be reviewedfor impairment upon adoption of the statement and at least annually thereafter.The balance of goodwill at December 31, 2001 was $103 million. The Companyhas not yet completed its initial assessment of potential impairment of this balance.
Notes to Consolidated Financial Statements
35
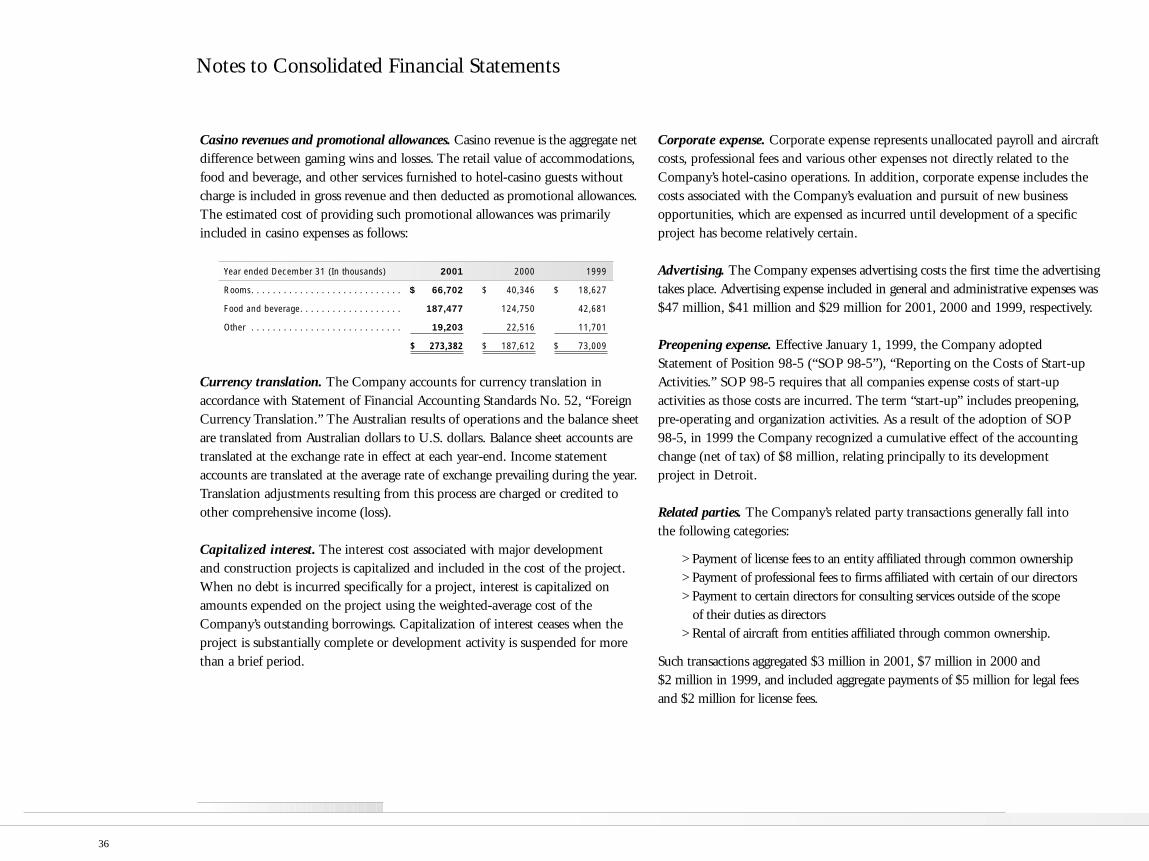
Casino revenues and promotional allowances. Casino revenue is the aggregate netdifference between gaming wins and losses. The retail value of accommodations,food and beverage, and other services furnished to hotel-casino guests withoutcharge is included in gross revenue and then deducted as promotional allowances.The estimated cost of providing such promotional allowances was primarilyincluded in casino expenses as follows:
Year ended December 31 (In thousands) 2001 2000 1999
Rooms. . . . . . . . . . . . . . . . . . . . . . . . . . . . $ 66,702 $ 40,346 $ 18,627
Food and beverage. . . . . . . . . . . . . . . . . . . 187,477 124,750 42,681
Other . . . . . . . . . . . . . . . . . . . . . . . . . . . . 19,203 22,516 11,701
$ 273,382 $ 187,612 $ 73,009
Currency translation. The Company accounts for currency translation in accordance with Statement of Financial Accounting Standards No. 52, “ForeignCurrency Translation.” The Australian results of operations and the balance sheetare translated from Australian dollars to U.S. dollars. Balance sheet accounts aretranslated at the exchange rate in effect at each year-end. Income statementaccounts are translated at the average rate of exchange prevailing during the year.Translation adjustments resulting from this process are charged or credited toother comprehensive income (loss).
Capitalized interest. The interest cost associated with major development and construction projects is capitalized and included in the cost of the project.When no debt is incurred specifically for a project, interest is capitalized onamounts expended on the project using the weighted-average cost of theCompany’s outstanding borrowings. Capitalization of interest ceases when theproject is substantially complete or development activity is suspended for morethan a brief period.
Corporate expense. Corporate expense represents unallocated payroll and aircraftcosts, professional fees and various other expenses not directly related to theCompany’s hotel-casino operations. In addition, corporate expense includes thecosts associated with the Company’s evaluation and pursuit of new businessopportunities, which are expensed as incurred until development of a specificproject has become relatively certain.
Advertising. The Company expenses advertising costs the first time the advertisingtakes place. Advertising expense included in general and administrative expenses was$47 million, $41 million and $29 million for 2001, 2000 and 1999, respectively.
Preopening expense. Effective January 1, 1999, the Company adoptedStatement of Position 98-5 (“SOP 98-5”), “Reporting on the Costs of Start-upActivities.” SOP 98-5 requires that all companies expense costs of start-up activities as those costs are incurred. The term “start-up” includes preopening,pre-operating and organization activities. As a result of the adoption of SOP 98-5, in 1999 the Company recognized a cumulative effect of the accountingchange (net of tax) of $8 million, relating principally to its development project in Detroit.
Related parties. The Company’s related party transactions generally fall into the following categories:
> Payment of license fees to an entity affiliated through common ownership> Payment of professional fees to firms affiliated with certain of our directors> Payment to certain directors for consulting services outside of the scope
of their duties as directors> Rental of aircraft from entities affiliated through common ownership.
Such transactions aggregated $3 million in 2001, $7 million in 2000 and $2 million in 1999, and included aggregate payments of $5 million for legal feesand $2 million for license fees.
Notes to Consolidated Financial Statements
36
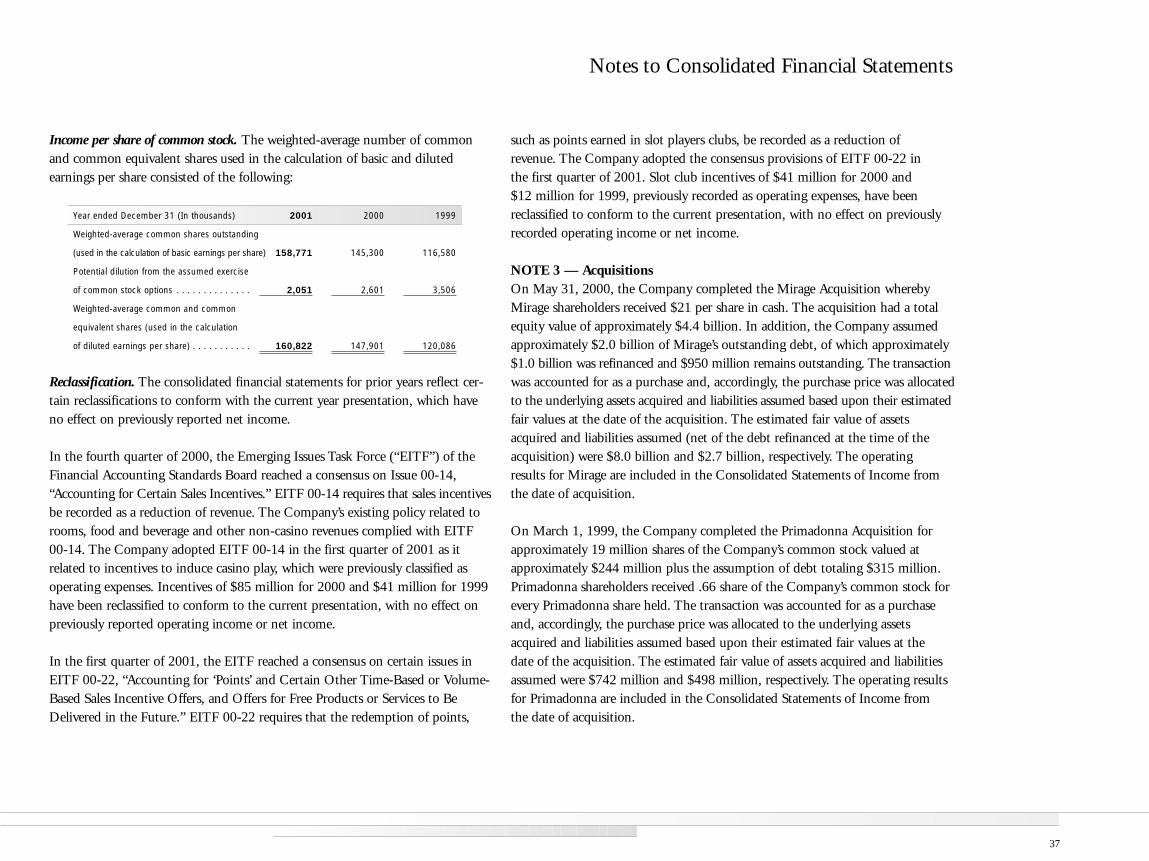
Income per share of common stock. The weighted-average number of commonand common equivalent shares used in the calculation of basic and diluted earnings per share consisted of the following:
Year ended December 31 (In thousands) 2001 2000 1999
Weighted-average common shares outstanding
(used in the calculation of basic earnings per share) 158,771 145,300 116,580
Potential dilution from the assumed exercise
of common stock options . . . . . . . . . . . . . . 2,051 2,601 3,506
Weighted-average common and common
equivalent shares (used in the calculation
of diluted earnings per share) . . . . . . . . . . . 160,822 147,901 120,086
Reclassification. The consolidated financial statements for prior years reflect cer-tain reclassifications to conform with the current year presentation, which haveno effect on previously reported net income.
In the fourth quarter of 2000, the Emerging Issues Task Force (“EITF”) of theFinancial Accounting Standards Board reached a consensus on Issue 00-14,“Accounting for Certain Sales Incentives.” EITF 00-14 requires that sales incentivesbe recorded as a reduction of revenue. The Company’s existing policy related torooms, food and beverage and other non-casino revenues complied with EITF00-14. The Company adopted EITF 00-14 in the first quarter of 2001 as it related to incentives to induce casino play, which were previously classified asoperating expenses. Incentives of $85 million for 2000 and $41 million for 1999have been reclassified to conform to the current presentation, with no effect onpreviously reported operating income or net income.
In the first quarter of 2001, the EITF reached a consensus on certain issues inEITF 00-22, “Accounting for ‘Points’ and Certain Other Time-Based or Volume-Based Sales Incentive Offers, and Offers for Free Products or Services to BeDelivered in the Future.” EITF 00-22 requires that the redemption of points,
such as points earned in slot players clubs, be recorded as a reduction of revenue. The Company adopted the consensus provisions of EITF 00-22 in the first quarter of 2001. Slot club incentives of $41 million for 2000 and $12 million for 1999, previously recorded as operating expenses, have been reclassified to conform to the current presentation, with no effect on previouslyrecorded operating income or net income.
NOTE 3 — AcquisitionsOn May 31, 2000, the Company completed the Mirage Acquisition wherebyMirage shareholders received $21 per share in cash. The acquisition had a totalequity value of approximately $4.4 billion. In addition, the Company assumedapproximately $2.0 billion of Mirage’s outstanding debt, of which approximately$1.0 billion was refinanced and $950 million remains outstanding. The transactionwas accounted for as a purchase and, accordingly, the purchase price was allocatedto the underlying assets acquired and liabilities assumed based upon their estimatedfair values at the date of the acquisition. The estimated fair value of assetsacquired and liabilities assumed (net of the debt refinanced at the time of theacquisition) were $8.0 billion and $2.7 billion, respectively. The operating results for Mirage are included in the Consolidated Statements of Income fromthe date of acquisition.
On March 1, 1999, the Company completed the Primadonna Acquisition forapproximately 19 million shares of the Company’s common stock valued atapproximately $244 million plus the assumption of debt totaling $315 million.Primadonna shareholders received .66 share of the Company’s common stock forevery Primadonna share held. The transaction was accounted for as a purchaseand, accordingly, the purchase price was allocated to the underlying assetsacquired and liabilities assumed based upon their estimated fair values at the date of the acquisition. The estimated fair value of assets acquired and liabilitiesassumed were $742 million and $498 million, respectively. The operating resultsfor Primadonna are included in the Consolidated Statements of Income from the date of acquisition.
Notes to Consolidated Financial Statements
37
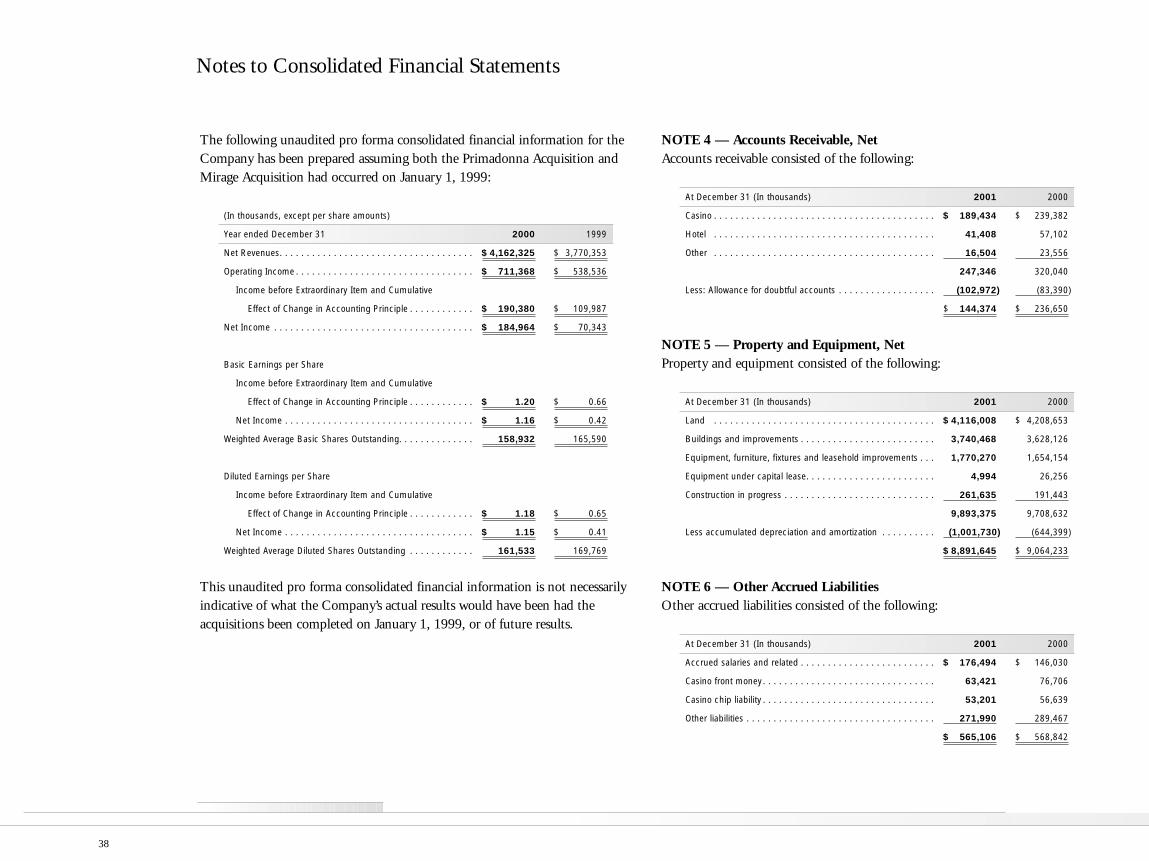
The following unaudited pro forma consolidated financial information for theCompany has been prepared assuming both the Primadonna Acquisition andMirage Acquisition had occurred on January 1, 1999:
(In thousands, except per share amounts)
Year ended December 31 2000 1999
Net Revenues. . . . . . . . . . . . . . . . . . . . . . . . . . . . . . . . . . . . $ 4,162,325 $ 3,770,353
Operating Income . . . . . . . . . . . . . . . . . . . . . . . . . . . . . . . . . $ 711,368 $ 538,536
Income before Extraordinary Item and Cumulative
Effect of Change in Accounting Principle . . . . . . . . . . . . $ 190,380 $ 109,987
Net Income . . . . . . . . . . . . . . . . . . . . . . . . . . . . . . . . . . . . . $ 184,964 $ 70,343
Basic Earnings per Share
Income before Extraordinary Item and Cumulative
Effect of Change in Accounting Principle . . . . . . . . . . . . $ 1.20 $ 0.66
Net Income . . . . . . . . . . . . . . . . . . . . . . . . . . . . . . . . . . . $ 1.16 $ 0.42
Weighted Average Basic Shares Outstanding. . . . . . . . . . . . . . 158,932 165,590
Diluted Earnings per Share
Income before Extraordinary Item and Cumulative
Effect of Change in Accounting Principle . . . . . . . . . . . . $ 1.18 $ 0.65
Net Income . . . . . . . . . . . . . . . . . . . . . . . . . . . . . . . . . . . $ 1.15 $ 0.41
Weighted Average Diluted Shares Outstanding . . . . . . . . . . . . 161,533 169,769
This unaudited pro forma consolidated financial information is not necessarilyindicative of what the Company’s actual results would have been had the acquisitions been completed on January 1, 1999, or of future results.
NOTE 4 — Accounts Receivable, NetAccounts receivable consisted of the following:
At December 31 (In thousands) 2001 2000
Casino . . . . . . . . . . . . . . . . . . . . . . . . . . . . . . . . . . . . . . . . . $ 189,434 $ 239,382
Hotel . . . . . . . . . . . . . . . . . . . . . . . . . . . . . . . . . . . . . . . . . 41,408 57,102
Other . . . . . . . . . . . . . . . . . . . . . . . . . . . . . . . . . . . . . . . . . 16,504 23,556
247,346 320,040
Less: Allowance for doubtful accounts . . . . . . . . . . . . . . . . . . (102,972) (83,390)
$ 144,374 $ 236,650
NOTE 5 — Property and Equipment, NetProperty and equipment consisted of the following:
At December 31 (In thousands) 2001 2000
Land . . . . . . . . . . . . . . . . . . . . . . . . . . . . . . . . . . . . . . . . . $ 4,116,008 $ 4,208,653
Buildings and improvements . . . . . . . . . . . . . . . . . . . . . . . . . 3,740,468 3,628,126
Equipment, furniture, fixtures and leasehold improvements . . . 1,770,270 1,654,154
Equipment under capital lease. . . . . . . . . . . . . . . . . . . . . . . . 4,994 26,256
Construction in progress . . . . . . . . . . . . . . . . . . . . . . . . . . . . 261,635 191,443
9,893,375 9,708,632
Less accumulated depreciation and amortization . . . . . . . . . . (1,001,730) (644,399)
$ 8,891,645 $ 9,064,233
NOTE 6 — Other Accrued LiabilitiesOther accrued liabilities consisted of the following:
At December 31 (In thousands) 2001 2000
Accrued salaries and related . . . . . . . . . . . . . . . . . . . . . . . . . $ 176,494 $ 146,030
Casino front money. . . . . . . . . . . . . . . . . . . . . . . . . . . . . . . . 63,421 76,706
Casino chip liability . . . . . . . . . . . . . . . . . . . . . . . . . . . . . . . . 53,201 56,639
Other liabilities . . . . . . . . . . . . . . . . . . . . . . . . . . . . . . . . . . . 271,990 289,467
$ 565,106 $ 568,842
Notes to Consolidated Financial Statements
38
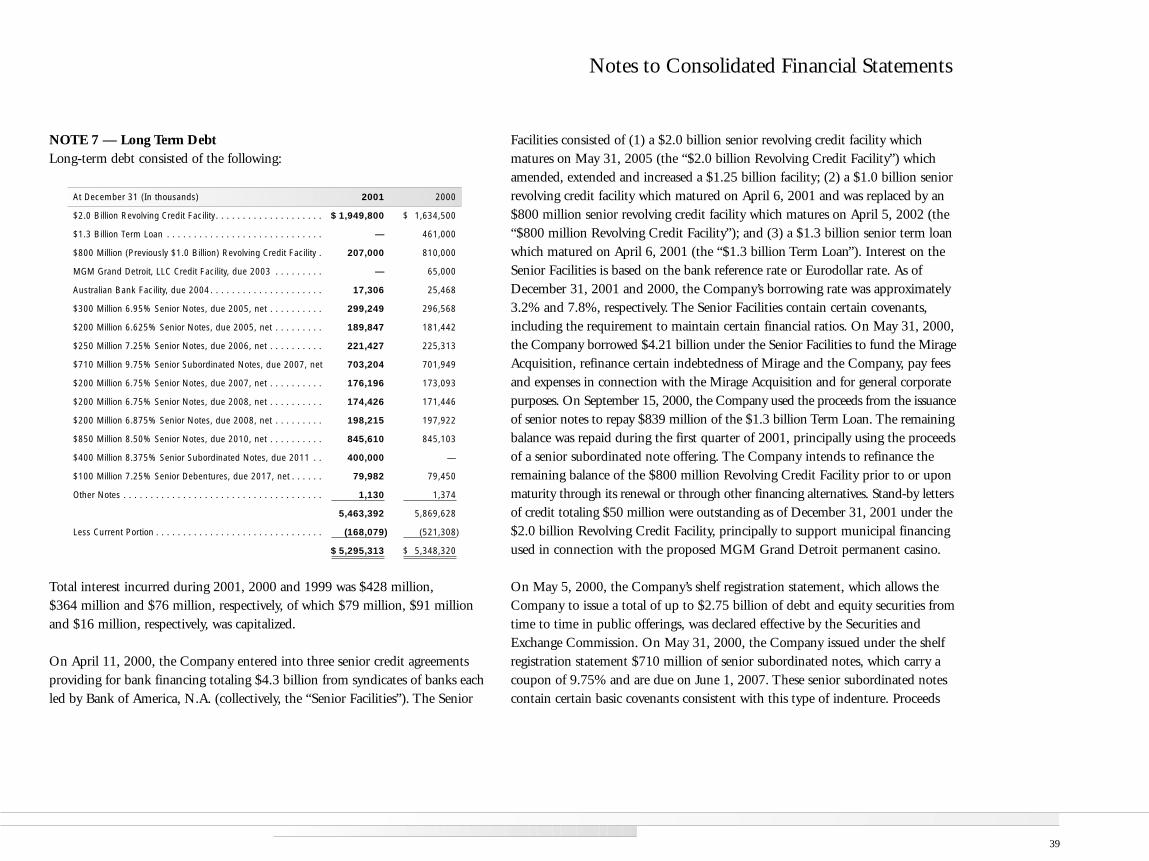
NOTE 7 — Long Term DebtLong-term debt consisted of the following:
At December 31 (In thousands) 2001 2000
$2.0 Billion Revolving Credit Facility. . . . . . . . . . . . . . . . . . . . $ 1,949,800 $ 1,634,500
$1.3 Billion Term Loan . . . . . . . . . . . . . . . . . . . . . . . . . . . . . — 461,000
$800 Million (Previously $1.0 Billion) Revolving Credit Facility . 207,000 810,000
MGM Grand Detroit, LLC Credit Facility, due 2003 . . . . . . . . . — 65,000
Australian Bank Facility, due 2004. . . . . . . . . . . . . . . . . . . . . 17,306 25,468
$300 Million 6.95% Senior Notes, due 2005, net . . . . . . . . . . 299,249 296,568
$200 Million 6.625% Senior Notes, due 2005, net . . . . . . . . . 189,847 181,442
$250 Million 7.25% Senior Notes, due 2006, net . . . . . . . . . . 221,427 225,313
$710 Million 9.75% Senior Subordinated Notes, due 2007, net 703,204 701,949
$200 Million 6.75% Senior Notes, due 2007, net . . . . . . . . . . 176,196 173,093
$200 Million 6.75% Senior Notes, due 2008, net . . . . . . . . . . 174,426 171,446
$200 Million 6.875% Senior Notes, due 2008, net . . . . . . . . . 198,215 197,922
$850 Million 8.50% Senior Notes, due 2010, net . . . . . . . . . . 845,610 845,103
$400 Million 8.375% Senior Subordinated Notes, due 2011 . . 400,000 —
$100 Million 7.25% Senior Debentures, due 2017, net . . . . . . 79,982 79,450
Other Notes . . . . . . . . . . . . . . . . . . . . . . . . . . . . . . . . . . . . . 1,130 1,374
5,463,392 5,869,628
Less Current Portion . . . . . . . . . . . . . . . . . . . . . . . . . . . . . . . (168,079) (521,308)
$ 5,295,313 $ 5,348,320
Total interest incurred during 2001, 2000 and 1999 was $428 million, $364 million and $76 million, respectively, of which $79 million, $91 millionand $16 million, respectively, was capitalized.
On April 11, 2000, the Company entered into three senior credit agreementsproviding for bank financing totaling $4.3 billion from syndicates of banks eachled by Bank of America, N.A. (collectively, the “Senior Facilities”). The Senior
Facilities consisted of (1) a $2.0 billion senior revolving credit facility whichmatures on May 31, 2005 (the “$2.0 billion Revolving Credit Facility”) whichamended, extended and increased a $1.25 billion facility; (2) a $1.0 billion seniorrevolving credit facility which matured on April 6, 2001 and was replaced by an$800 million senior revolving credit facility which matures on April 5, 2002 (the“$800 million Revolving Credit Facility”); and (3) a $1.3 billion senior term loanwhich matured on April 6, 2001 (the “$1.3 billion Term Loan”). Interest on theSenior Facilities is based on the bank reference rate or Eurodollar rate. As ofDecember 31, 2001 and 2000, the Company’s borrowing rate was approximately3.2% and 7.8%, respectively. The Senior Facilities contain certain covenants,including the requirement to maintain certain financial ratios. On May 31, 2000,the Company borrowed $4.21 billion under the Senior Facilities to fund the MirageAcquisition, refinance certain indebtedness of Mirage and the Company, pay feesand expenses in connection with the Mirage Acquisition and for general corporatepurposes. On September 15, 2000, the Company used the proceeds from the issuanceof senior notes to repay $839 million of the $1.3 billion Term Loan. The remainingbalance was repaid during the first quarter of 2001, principally using the proceedsof a senior subordinated note offering. The Company intends to refinance theremaining balance of the $800 million Revolving Credit Facility prior to or uponmaturity through its renewal or through other financing alternatives. Stand-by lettersof credit totaling $50 million were outstanding as of December 31, 2001 under the$2.0 billion Revolving Credit Facility, principally to support municipal financingused in connection with the proposed MGM Grand Detroit permanent casino.
On May 5, 2000, the Company’s shelf registration statement, which allows theCompany to issue a total of up to $2.75 billion of debt and equity securities fromtime to time in public offerings, was declared effective by the Securities andExchange Commission. On May 31, 2000, the Company issued under the shelfregistration statement $710 million of senior subordinated notes, which carry acoupon of 9.75% and are due on June 1, 2007. These senior subordinated notescontain certain basic covenants consistent with this type of indenture. Proceeds
Notes to Consolidated Financial Statements
39
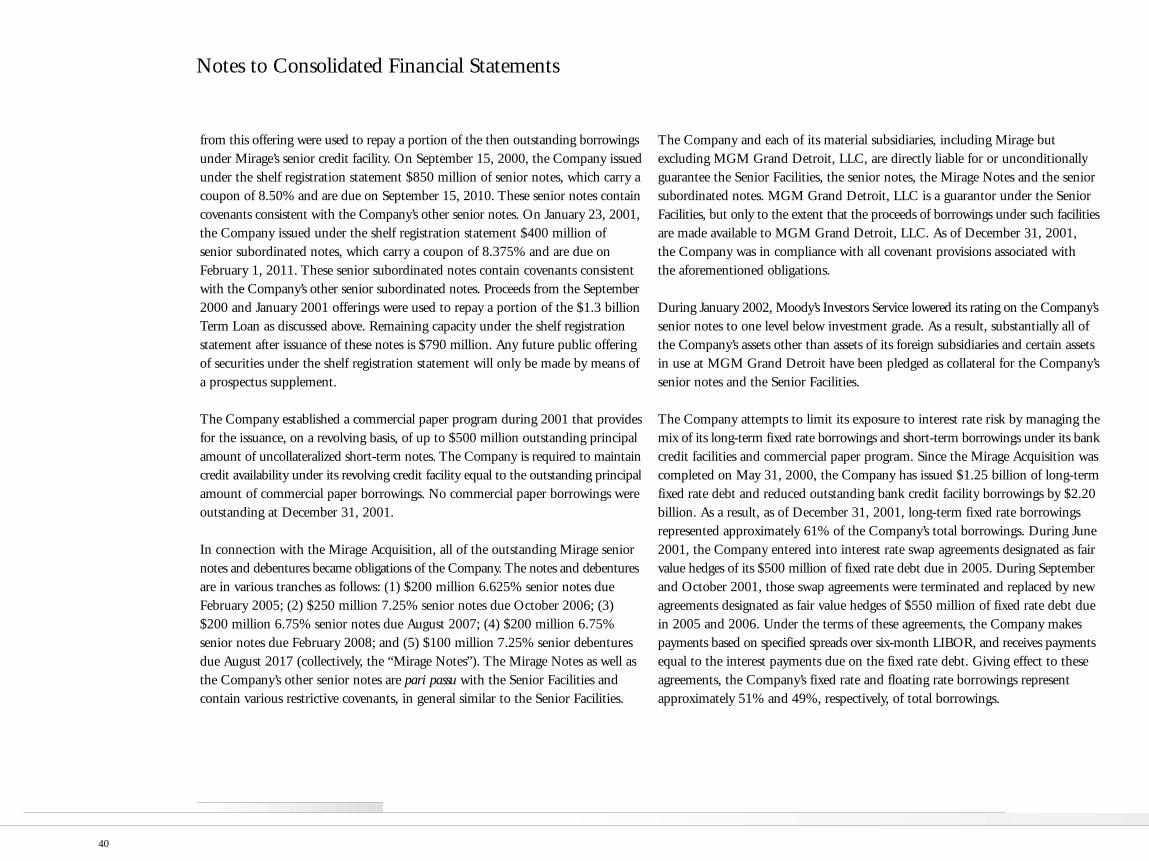
from this offering were used to repay a portion of the then outstanding borrowingsunder Mirage’s senior credit facility. On September 15, 2000, the Company issuedunder the shelf registration statement $850 million of senior notes, which carry acoupon of 8.50% and are due on September 15, 2010. These senior notes containcovenants consistent with the Company’s other senior notes. On January 23, 2001,the Company issued under the shelf registration statement $400 million of senior subordinated notes, which carry a coupon of 8.375% and are due onFebruary 1, 2011. These senior subordinated notes contain covenants consistentwith the Company’s other senior subordinated notes. Proceeds from the September2000 and January 2001 offerings were used to repay a portion of the $1.3 billionTerm Loan as discussed above. Remaining capacity under the shelf registrationstatement after issuance of these notes is $790 million. Any future public offeringof securities under the shelf registration statement will only be made by means ofa prospectus supplement.
The Company established a commercial paper program during 2001 that providesfor the issuance, on a revolving basis, of up to $500 million outstanding principalamount of uncollateralized short-term notes. The Company is required to maintaincredit availability under its revolving credit facility equal to the outstanding principalamount of commercial paper borrowings. No commercial paper borrowings wereoutstanding at December 31, 2001.
In connection with the Mirage Acquisition, all of the outstanding Mirage seniornotes and debentures became obligations of the Company. The notes and debenturesare in various tranches as follows: (1) $200 million 6.625% senior notes dueFebruary 2005; (2) $250 million 7.25% senior notes due October 2006; (3)$200 million 6.75% senior notes due August 2007; (4) $200 million 6.75% senior notes due February 2008; and (5) $100 million 7.25% senior debenturesdue August 2017 (collectively, the “Mirage Notes”). The Mirage Notes as well asthe Company’s other senior notes are pari passu with the Senior Facilities andcontain various restrictive covenants, in general similar to the Senior Facilities.
The Company and each of its material subsidiaries, including Mirage but excluding MGM Grand Detroit, LLC, are directly liable for or unconditionallyguarantee the Senior Facilities, the senior notes, the Mirage Notes and the seniorsubordinated notes. MGM Grand Detroit, LLC is a guarantor under the SeniorFacilities, but only to the extent that the proceeds of borrowings under such facilitiesare made available to MGM Grand Detroit, LLC. As of December 31, 2001, the Company was in compliance with all covenant provisions associated with the aforementioned obligations.
During January 2002, Moody’s Investors Service lowered its rating on the Company’ssenior notes to one level below investment grade. As a result, substantially all ofthe Company’s assets other than assets of its foreign subsidiaries and certain assetsin use at MGM Grand Detroit have been pledged as collateral for the Company’ssenior notes and the Senior Facilities.
The Company attempts to limit its exposure to interest rate risk by managing themix of its long-term fixed rate borrowings and short-term borrowings under its bankcredit facilities and commercial paper program. Since the Mirage Acquisition wascompleted on May 31, 2000, the Company has issued $1.25 billion of long-termfixed rate debt and reduced outstanding bank credit facility borrowings by $2.20billion. As a result, as of December 31, 2001, long-term fixed rate borrowingsrepresented approximately 61% of the Company’s total borrowings. During June2001, the Company entered into interest rate swap agreements designated as fairvalue hedges of its $500 million of fixed rate debt due in 2005. During Septemberand October 2001, those swap agreements were terminated and replaced by newagreements designated as fair value hedges of $550 million of fixed rate debt duein 2005 and 2006. Under the terms of these agreements, the Company makespayments based on specified spreads over six-month LIBOR, and receives paymentsequal to the interest payments due on the fixed rate debt. Giving effect to theseagreements, the Company’s fixed rate and floating rate borrowings representapproximately 51% and 49%, respectively, of total borrowings.
Notes to Consolidated Financial Statements
40
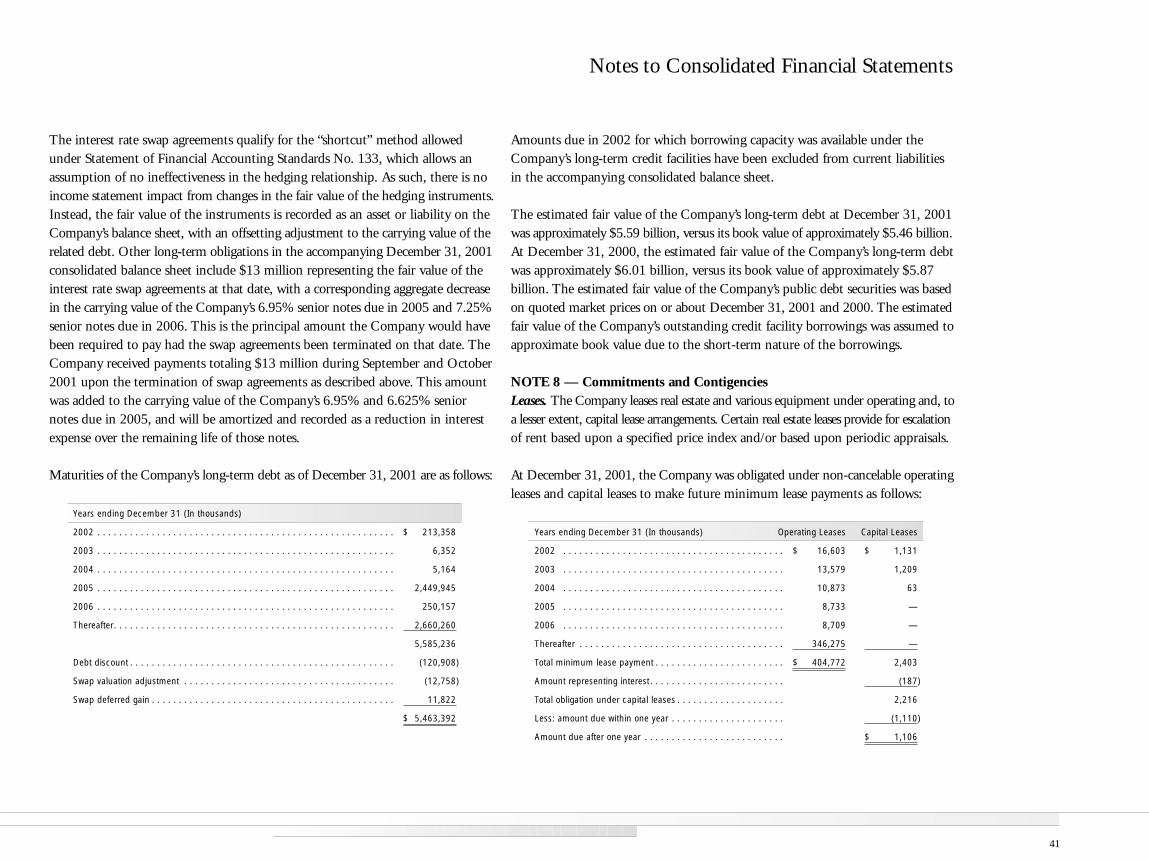
The interest rate swap agreements qualify for the “shortcut” method allowedunder Statement of Financial Accounting Standards No. 133, which allows anassumption of no ineffectiveness in the hedging relationship. As such, there is noincome statement impact from changes in the fair value of the hedging instruments.Instead, the fair value of the instruments is recorded as an asset or liability on theCompany’s balance sheet, with an offsetting adjustment to the carrying value of therelated debt. Other long-term obligations in the accompanying December 31, 2001consolidated balance sheet include $13 million representing the fair value of theinterest rate swap agreements at that date, with a corresponding aggregate decreasein the carrying value of the Company’s 6.95% senior notes due in 2005 and 7.25%senior notes due in 2006. This is the principal amount the Company would havebeen required to pay had the swap agreements been terminated on that date. TheCompany received payments totaling $13 million during September and October2001 upon the termination of swap agreements as described above. This amountwas added to the carrying value of the Company’s 6.95% and 6.625% seniornotes due in 2005, and will be amortized and recorded as a reduction in interestexpense over the remaining life of those notes.
Maturities of the Company’s long-term debt as of December 31, 2001 are as follows:
Years ending December 31 (In thousands)
2002 . . . . . . . . . . . . . . . . . . . . . . . . . . . . . . . . . . . . . . . . . . . . . . . . . . . . . . . $ 213,358
2003 . . . . . . . . . . . . . . . . . . . . . . . . . . . . . . . . . . . . . . . . . . . . . . . . . . . . . . . 6,352
2004 . . . . . . . . . . . . . . . . . . . . . . . . . . . . . . . . . . . . . . . . . . . . . . . . . . . . . . . 5,164
2005 . . . . . . . . . . . . . . . . . . . . . . . . . . . . . . . . . . . . . . . . . . . . . . . . . . . . . . . 2,449,945
2006 . . . . . . . . . . . . . . . . . . . . . . . . . . . . . . . . . . . . . . . . . . . . . . . . . . . . . . . 250,157
Thereafter. . . . . . . . . . . . . . . . . . . . . . . . . . . . . . . . . . . . . . . . . . . . . . . . . . . . 2,660,260
5,585,236
Debt discount . . . . . . . . . . . . . . . . . . . . . . . . . . . . . . . . . . . . . . . . . . . . . . . . . (120,908)
Swap valuation adjustment . . . . . . . . . . . . . . . . . . . . . . . . . . . . . . . . . . . . . . . (12,758)
Swap deferred gain . . . . . . . . . . . . . . . . . . . . . . . . . . . . . . . . . . . . . . . . . . . . . 11,822
$ 5,463,392
Amounts due in 2002 for which borrowing capacity was available under theCompany’s long-term credit facilities have been excluded from current liabilitiesin the accompanying consolidated balance sheet.
The estimated fair value of the Company’s long-term debt at December 31, 2001was approximately $5.59 billion, versus its book value of approximately $5.46 billion.At December 31, 2000, the estimated fair value of the Company’s long-term debtwas approximately $6.01 billion, versus its book value of approximately $5.87 billion. The estimated fair value of the Company’s public debt securities was basedon quoted market prices on or about December 31, 2001 and 2000. The estimatedfair value of the Company’s outstanding credit facility borrowings was assumed toapproximate book value due to the short-term nature of the borrowings.
NOTE 8 — Commitments and ContigenciesLeases. The Company leases real estate and various equipment under operating and, toa lesser extent, capital lease arrangements. Certain real estate leases provide for escalationof rent based upon a specified price index and/or based upon periodic appraisals.
At December 31, 2001, the Company was obligated under non-cancelable operatingleases and capital leases to make future minimum lease payments as follows:
Years ending December 31 (In thousands) Operating Leases Capital Leases
2002 . . . . . . . . . . . . . . . . . . . . . . . . . . . . . . . . . . . . . . . . . $ 16,603 $ 1,131
2003 . . . . . . . . . . . . . . . . . . . . . . . . . . . . . . . . . . . . . . . . . 13,579 1,209
2004 . . . . . . . . . . . . . . . . . . . . . . . . . . . . . . . . . . . . . . . . . 10,873 63
2005 . . . . . . . . . . . . . . . . . . . . . . . . . . . . . . . . . . . . . . . . . 8,733 —
2006 . . . . . . . . . . . . . . . . . . . . . . . . . . . . . . . . . . . . . . . . . 8,709 —
Thereafter . . . . . . . . . . . . . . . . . . . . . . . . . . . . . . . . . . . . . . 346,275 —
Total minimum lease payment . . . . . . . . . . . . . . . . . . . . . . . . $ 404,772 2,403
Amount representing interest. . . . . . . . . . . . . . . . . . . . . . . . . (187)
Total obligation under capital leases . . . . . . . . . . . . . . . . . . . . 2,216
Less: amount due within one year . . . . . . . . . . . . . . . . . . . . . (1,110)
Amount due after one year . . . . . . . . . . . . . . . . . . . . . . . . . . $ 1,106
Notes to Consolidated Financial Statements
41
The current and long-term obligations under capital leases are included in the“Other accrued liabilities” and “Other long-term obligations” captions, respectively,in the accompanying consolidated balance sheets.
Rental expense for operating leases was $24 million, $18 million and $9 millionfor the years ended December 31, 2001, 2000 and 1999, respectively.
Litigation. The Company is a party to various legal proceedings, most of whichrelate to routine matters incidental to its business. Management does not believethat the outcome of such proceedings will have a material adverse effect on theCompany’s financial position or results of operations.
NOTE 9— Stockholders’ EquityOn March 1, 1999, the Company issued approximately 19 million shares of its common stock valued at approximately $244 million in connection with thePrimadonna Acquisition.
On June 10, 1999, the Company announced a $25.00 per share tender offer for up to 12 million shares of its common stock. The offer commenced on June 17, 1999 and expired on July 23, 1999. Based upon the final results, 30.2million shares of the Company’s common stock were tendered, and accordingly,the shares were prorated. The total acquisition cost of the 12 million shares wasapproximately $282 million. The Company recognized certain non-recurringcompensation costs totaling approximately $19 million related to exercisableoptions that were tendered.
On August 5, 1999, the Company announced a 12-month stock repurchase program for up to 10 million shares of its common stock. The Company purchased a total of 3.1 million shares for an approximate cost of $66 millionthrough February 2000. The repurchase program was suspended as a result of the Mirage Acquisition and subsequently expired.
On December 13, 1999, the Board of Directors approved a two-for-one split of the Company’s common stock and declared an initial quarterly cash dividendof $0.10 per share, after giving effect to the stock split. The additional shares weredistributed on February 25, 2000 to stockholders of record on February 10, 2000.All references to share and per share data herein have been adjusted retroactivelyto give effect to the stock split. Concurrently, the Board of Directors increased thenumber of authorized shares of the Company’s common stock from 75 millionshares to 300 million shares. As a result of the Mirage Acquisition, the Companyannounced on April 19, 2000 the discontinuance of the quarterly dividend policy.
On April 18, 2000, the Company completed a private placement of 46.5 millionshares of its common stock for a total purchase price of $1.23 billion. On May 18,2000, as required by the private placement agreement, the Company filed a shelfregistration statement to register the resale of these shares. Tracinda Corporationpurchased 23 million shares in the private placement.
On August 29, 2001, the Company announced a stock repurchase program for up to 10 million shares of its common stock. The Company purchased a total of 2.2 million shares at a total cost of $46 million through December 31, 2001.
NOTE 10 — Stock Option PlansThe Company has adopted nonqualified stock option plans and incentive stockoption plans which provide for the granting of stock options to eligible directors,officers and employees. The plans are administered by the Compensation andStock Option Committee of the Board of Directors. Salaried officers, directorsand other key employees of the Company and its subsidiaries are eligible toreceive options. The exercise price in each instance is 100% of the fair marketvalue of the Company’s common stock on the date of grant. The options have 10-year terms and in most cases are exercisable in either four or five equalannual installments.
Notes to Consolidated Financial Statements
42
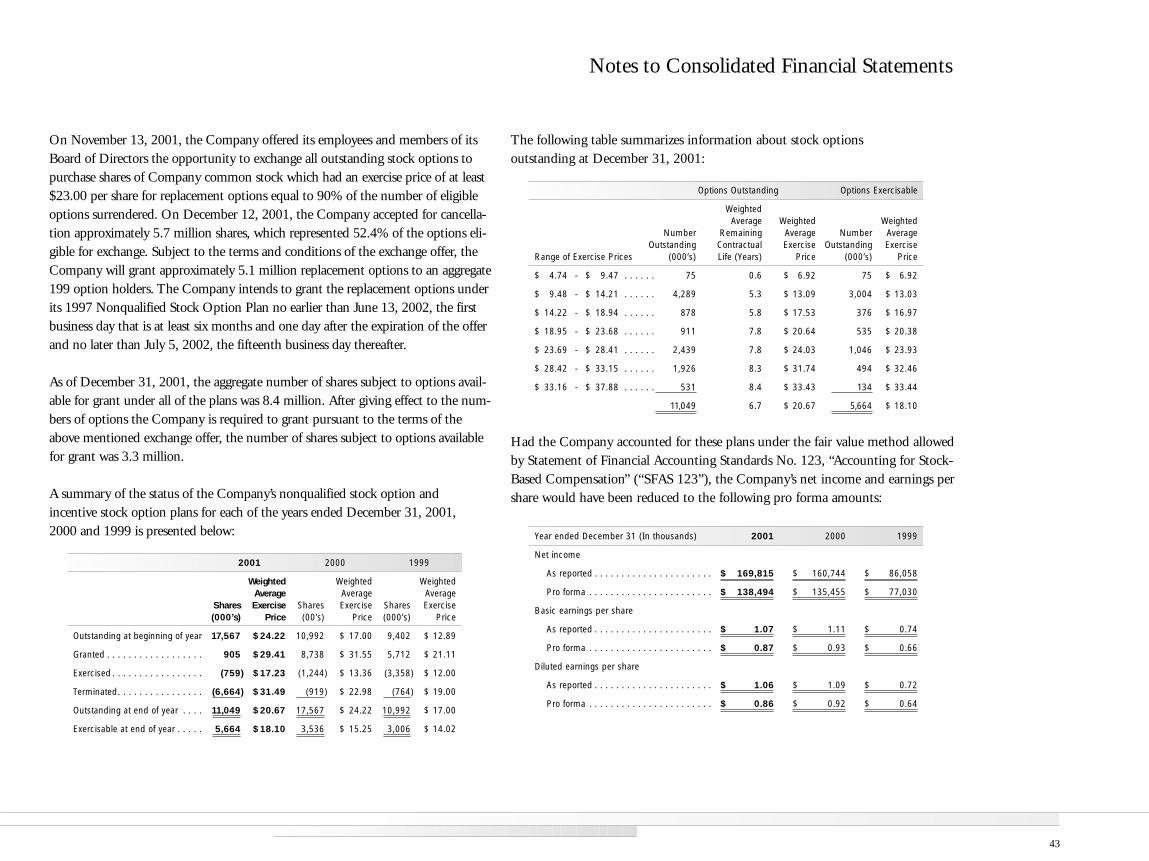
On November 13, 2001, the Company offered its employees and members of itsBoard of Directors the opportunity to exchange all outstanding stock options topurchase shares of Company common stock which had an exercise price of at least$23.00 per share for replacement options equal to 90% of the number of eligibleoptions surrendered. On December 12, 2001, the Company accepted for cancella-tion approximately 5.7 million shares, which represented 52.4% of the options eli-gible for exchange. Subject to the terms and conditions of the exchange offer, theCompany will grant approximately 5.1 million replacement options to an aggregate199 option holders. The Company intends to grant the replacement options underits 1997 Nonqualified Stock Option Plan no earlier than June 13, 2002, the firstbusiness day that is at least six months and one day after the expiration of the offerand no later than July 5, 2002, the fifteenth business day thereafter.
As of December 31, 2001, the aggregate number of shares subject to options avail-able for grant under all of the plans was 8.4 million. After giving effect to the num-bers of options the Company is required to grant pursuant to the terms of theabove mentioned exchange offer, the number of shares subject to options availablefor grant was 3.3 million.
A summary of the status of the Company’s nonqualified stock option and incentive stock option plans for each of the years ended December 31, 2001, 2000 and 1999 is presented below:
2001 2000 1999
Weighted Weighted WeightedAverage Average Average
Shares Exercise Shares Exercise Shares Exercise(000’s) Price (00’s) Price (000’s) Price
Outstanding at beginning of year 17,567 $24.22 10,992 $ 17.00 9,402 $ 12.89
Granted . . . . . . . . . . . . . . . . . . 905 $29.41 8,738 $ 31.55 5,712 $ 21.11
Exercised . . . . . . . . . . . . . . . . . (759) $17.23 (1,244) $ 13.36 (3,358) $ 12.00
Terminated. . . . . . . . . . . . . . . . (6,664) $31.49 (919) $ 22.98 (764) $ 19.00
Outstanding at end of year . . . . 11,049 $20.67 17,567 $ 24.22 10,992 $ 17.00
Exercisable at end of year . . . . . 5,664 $18.10 3,536 $ 15.25 3,006 $ 14.02
The following table summarizes information about stock options outstanding at December 31, 2001:
Options Outstanding Options Exercisable
WeightedAverage Weighted Weighted
Number Remaining Average Number AverageOutstanding Contractual Exercise Outstanding Exercise
Range of Exercise Prices (000’s) Life (Years) Price (000’s) Price
$ 4.74 - $ 9.47 . . . . . . 75 0.6 $ 6.92 75 $ 6.92
$ 9.48 - $ 14.21 . . . . . . 4,289 5.3 $ 13.09 3,004 $ 13.03
$ 14.22 - $ 18.94 . . . . . . 878 5.8 $ 17.53 376 $ 16.97
$ 18.95 - $ 23.68 . . . . . . 911 7.8 $ 20.64 535 $ 20.38
$ 23.69 - $ 28.41 . . . . . . 2,439 7.8 $ 24.03 1,046 $ 23.93
$ 28.42 - $ 33.15 . . . . . . 1,926 8.3 $ 31.74 494 $ 32.46
$ 33.16 - $ 37.88 . . . . . . 531 8.4 $ 33.43 134 $ 33.44
11,049 6.7 $ 20.67 5,664 $ 18.10
Had the Company accounted for these plans under the fair value method allowedby Statement of Financial Accounting Standards No. 123, “Accounting for Stock-Based Compensation” (“SFAS 123”), the Company’s net income and earnings pershare would have been reduced to the following pro forma amounts:
Year ended December 31 (In thousands) 2001 2000 1999
Net income
As reported . . . . . . . . . . . . . . . . . . . . . . $ 169,815 $ 160,744 $ 86,058
Pro forma . . . . . . . . . . . . . . . . . . . . . . . $ 138,494 $ 135,455 $ 77,030
Basic earnings per share
As reported . . . . . . . . . . . . . . . . . . . . . . $ 1.07 $ 1.11 $ 0.74
Pro forma . . . . . . . . . . . . . . . . . . . . . . . $ 0.87 $ 0.93 $ 0.66
Diluted earnings per share
As reported . . . . . . . . . . . . . . . . . . . . . . $ 1.06 $ 1.09 $ 0.72
Pro forma . . . . . . . . . . . . . . . . . . . . . . . $ 0.86 $ 0.92 $ 0.64
Notes to Consolidated Financial Statements
43
The fair value of each option grant was estimated on the date of grant using theBlack-Scholes option-pricing model with the following weighted-average assumptionsused for grants in 2001, 2000 and 1999, respectively: risk-free interest rates of4% in 2001 and 6% in 2000 and 1999; no expected dividend yields for the yearspresented; expected lives of 5, 5 and 8 years, respectively; and expected volatility of40%, 38% and 36%, respectively. The estimated weighted average fair value of optionsgranted in 2001, 2000 and 1999 was $12.23, $13.25 and $11.15, respectively.
NOTE 11 — Employee Benefit PlansEmployees of the Company who are members of various unions are covered byunion-sponsored, collectively bargained, multi-employer health and welfare anddefined benefit pension plans. The Company recorded an expense of $65 millionin 2001, $38 million in 2000 and $5 million in 1999 under such plans. Theplans’ sponsors have not provided sufficient information to permit the Companyto determine its share of unfunded vested benefits, if any.
The Company is self-insured for most health care benefits for its non-unionemployees. The liability for claims filed and estimates of claims incurred but notreported is included in the “Other accrued liabilities” caption in the accompanyingconsolidated balance sheets.
The Company has a retirement savings plan under Section 401(k) of the InternalRevenue Code covering its non-union employees. The plans allow employees todefer, within prescribed limits, up to 20% (15% prior to August 1, 2001) of theirincome on a pre-tax basis through contributions to the plans. The Companymatches, within prescribed limits, a portion of eligible employees’ contributions.The Company recorded charges for matching contributions of $15 million in2001, $12 million in 2000 and $6 million in 1999.
The Company has maintained an employee stock purchase plan. The plan pro-vided eligible employees the opportunity to purchase shares of the Company’scommon stock via payroll deductions. The price for each share of common stockwas the weighted average price paid for all the shares purchased by the plan
administrator on behalf of the participating employees on the last trading day ofeach month. The Company paid the administrative costs of the plan. The planwas discontinued effective February 4, 2002.
The Company and MGM Grand Las Vegas maintain a nonqualified deferredretirement plan for certain key employees. The plan allows participants to defer,on a pre-tax basis, a portion of their salary and bonus and accumulate tax deferredearnings, plus investment earnings on the deferred balances, as a retirement fund. All deferred amounts vest immediately. There are no employer matchingcontributions made under this plan.
The Company implemented a second nonqualified deferred retirement plan effective January 1, 2001 for certain key employees. The plan allows participantsto defer, on a pre-tax basis, a portion of their salary and bonus and accumulatetax deferred earnings, plus investment earnings on the deferred balances, as aretirement fund. Participants receive a Company match of up to 4% of salary, net of any Company match received under the Company’s 401(k) plan. Allemployee deferrals vest immediately. The Company matching contributions vestratably over a three-year period. The Company recorded charges for matchingcontributions of $1 million in 2001.
The Company implemented a supplemental executive retirement plan (the“SERP”) effective January 1, 2001 for certain key employees. The SERP is a nonqualified plan under which the Company makes quarterly contributionswhich are intended to provide a retirement benefit that is a fixed percentage of aparticipant’s estimated final five-year average annual salary, up to a maximum of65%. Company contributions and investment earnings on the contributions aretax-deferred and accumulate as a retirement fund. Employees do not make contributions under this plan. A portion of the Company contributions andinvestment earnings thereon vests after three years of SERP participation and the remaining portion vests after both five years of SERP participation and 10 years of continuous service. The Company recorded expense of $4 millionunder this plan in 2001.
Notes to Consolidated Financial Statements
44
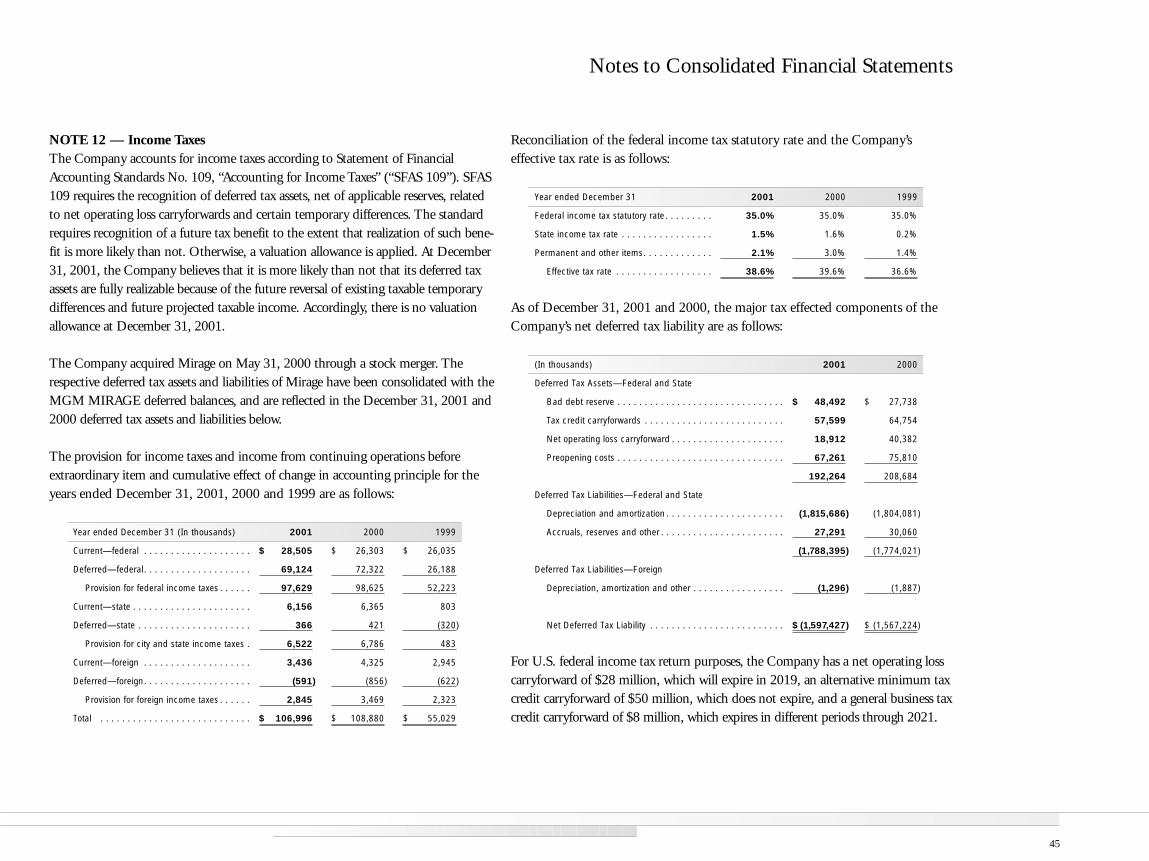
NOTE 12 — Income TaxesThe Company accounts for income taxes according to Statement of FinancialAccounting Standards No. 109, “Accounting for Income Taxes” (“SFAS 109”). SFAS109 requires the recognition of deferred tax assets, net of applicable reserves, relatedto net operating loss carryforwards and certain temporary differences. The standardrequires recognition of a future tax benefit to the extent that realization of such bene-fit is more likely than not. Otherwise, a valuation allowance is applied. At December31, 2001, the Company believes that it is more likely than not that its deferred taxassets are fully realizable because of the future reversal of existing taxable temporarydifferences and future projected taxable income. Accordingly, there is no valuationallowance at December 31, 2001.
The Company acquired Mirage on May 31, 2000 through a stock merger. Therespective deferred tax assets and liabilities of Mirage have been consolidated with theMGM MIRAGE deferred balances, and are reflected in the December 31, 2001 and2000 deferred tax assets and liabilities below.
The provision for income taxes and income from continuing operations beforeextraordinary item and cumulative effect of change in accounting principle for theyears ended December 31, 2001, 2000 and 1999 are as follows:
Year ended December 31 (In thousands) 2001 2000 1999
Current—federal . . . . . . . . . . . . . . . . . . . . $ 28,505 $ 26,303 $ 26,035
Deferred—federal. . . . . . . . . . . . . . . . . . . . 69,124 72,322 26,188
Provision for federal income taxes . . . . . . 97,629 98,625 52,223
Current—state . . . . . . . . . . . . . . . . . . . . . . 6,156 6,365 803
Deferred—state . . . . . . . . . . . . . . . . . . . . . 366 421 (320)
Provision for city and state income taxes . 6,522 6,786 483
Current—foreign . . . . . . . . . . . . . . . . . . . . 3,436 4,325 2,945
Deferred—foreign. . . . . . . . . . . . . . . . . . . . (591) (856) (622)
Provision for foreign income taxes . . . . . . 2,845 3,469 2,323
Total . . . . . . . . . . . . . . . . . . . . . . . . . . . . $ 106,996 $ 108,880 $ 55,029
Reconciliation of the federal income tax statutory rate and the Company’s effective tax rate is as follows:
Year ended December 31 2001 2000 1999
Federal income tax statutory rate. . . . . . . . . 35.0% 35.0% 35.0%
State income tax rate . . . . . . . . . . . . . . . . . 1.5% 1.6% 0.2%
Permanent and other items. . . . . . . . . . . . . 2.1% 3.0% 1.4%
Effective tax rate . . . . . . . . . . . . . . . . . . 38.6% 39.6% 36.6%
As of December 31, 2001 and 2000, the major tax effected components of theCompany’s net deferred tax liability are as follows:
(In thousands) 2001 2000
Deferred Tax Assets—Federal and State
Bad debt reserve . . . . . . . . . . . . . . . . . . . . . . . . . . . . . . . $ 48,492 $ 27,738
Tax credit carryforwards . . . . . . . . . . . . . . . . . . . . . . . . . . 57,599 64,754
Net operating loss carryforward . . . . . . . . . . . . . . . . . . . . . 18,912 40,382
Preopening costs . . . . . . . . . . . . . . . . . . . . . . . . . . . . . . . 67,261 75,810
192,264 208,684
Deferred Tax Liabilities—Federal and State
Depreciation and amortization . . . . . . . . . . . . . . . . . . . . . . (1,815,686) (1,804,081)
Accruals, reserves and other . . . . . . . . . . . . . . . . . . . . . . . 27,291 30,060
(1,788,395) (1,774,021)
Deferred Tax Liabilities—Foreign
Depreciation, amortization and other . . . . . . . . . . . . . . . . . (1,296) (1,887)
Net Deferred Tax Liability . . . . . . . . . . . . . . . . . . . . . . . . . $ (1,597,427) $ (1,567,224)
For U.S. federal income tax return purposes, the Company has a net operating losscarryforward of $28 million, which will expire in 2019, an alternative minimum taxcredit carryforward of $50 million, which does not expire, and a general business taxcredit carryforward of $8 million, which expires in different periods through 2021.
Notes to Consolidated Financial Statements
45
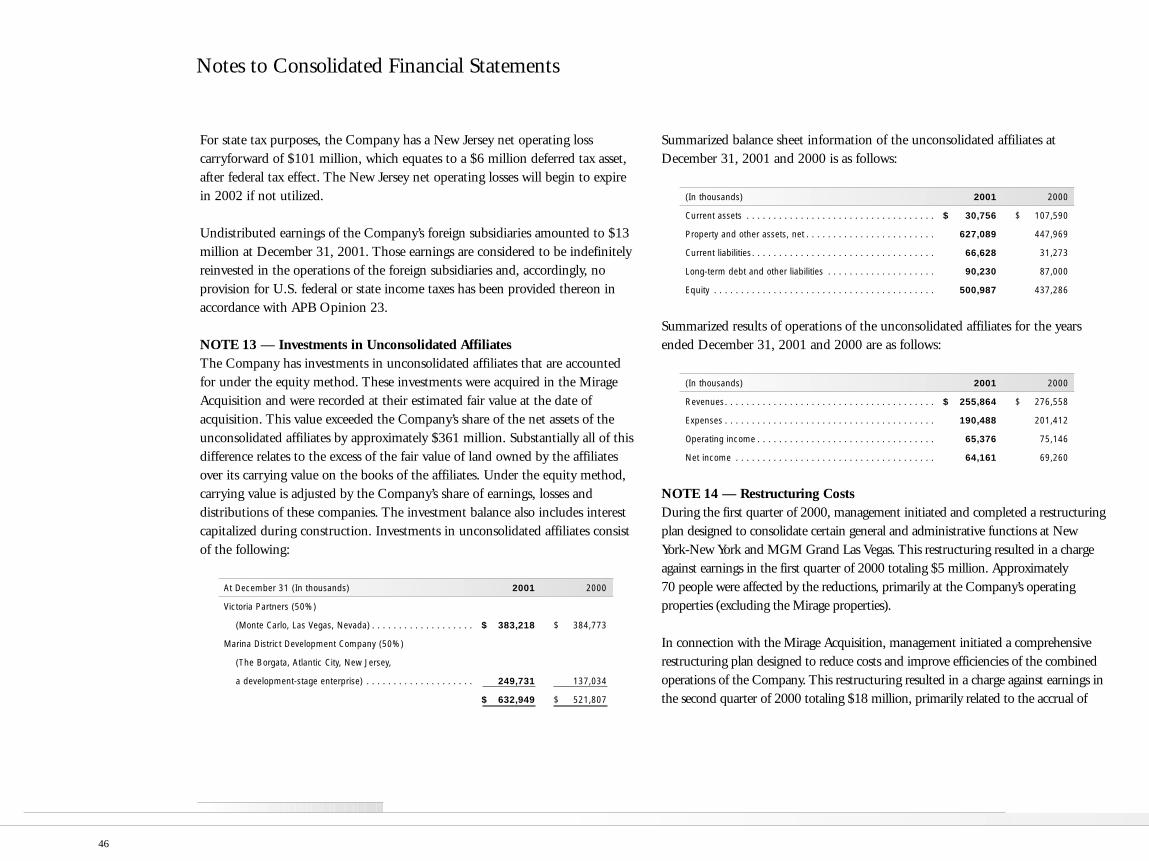
For state tax purposes, the Company has a New Jersey net operating loss carryforward of $101 million, which equates to a $6 million deferred tax asset,after federal tax effect. The New Jersey net operating losses will begin to expire in 2002 if not utilized.
Undistributed earnings of the Company’s foreign subsidiaries amounted to $13million at December 31, 2001. Those earnings are considered to be indefinitelyreinvested in the operations of the foreign subsidiaries and, accordingly, no provision for U.S. federal or state income taxes has been provided thereon inaccordance with APB Opinion 23.
NOTE 13 — Investments in Unconsolidated AffiliatesThe Company has investments in unconsolidated affiliates that are accounted for under the equity method. These investments were acquired in the MirageAcquisition and were recorded at their estimated fair value at the date of acquisition. This value exceeded the Company’s share of the net assets of theunconsolidated affiliates by approximately $361 million. Substantially all of thisdifference relates to the excess of the fair value of land owned by the affiliates over its carrying value on the books of the affiliates. Under the equity method,carrying value is adjusted by the Company’s share of earnings, losses and distributions of these companies. The investment balance also includes interestcapitalized during construction. Investments in unconsolidated affiliates consist of the following:
At December 31 (In thousands) 2001 2000
Victoria Partners (50%)
(Monte Carlo, Las Vegas, Nevada) . . . . . . . . . . . . . . . . . . . $ 383,218 $ 384,773
Marina District Development Company (50%)
(The Borgata, Atlantic City, New Jersey,
a development-stage enterprise) . . . . . . . . . . . . . . . . . . . . 249,731 137,034
$ 632,949 $ 521,807
Summarized balance sheet information of the unconsolidated affiliates atDecember 31, 2001 and 2000 is as follows:
(In thousands) 2001 2000
Current assets . . . . . . . . . . . . . . . . . . . . . . . . . . . . . . . . . . . $ 30,756 $ 107,590
Property and other assets, net . . . . . . . . . . . . . . . . . . . . . . . . 627,089 447,969
Current liabilities. . . . . . . . . . . . . . . . . . . . . . . . . . . . . . . . . . 66,628 31,273
Long-term debt and other liabilities . . . . . . . . . . . . . . . . . . . . 90,230 87,000
Equity . . . . . . . . . . . . . . . . . . . . . . . . . . . . . . . . . . . . . . . . . 500,987 437,286
Summarized results of operations of the unconsolidated affiliates for the yearsended December 31, 2001 and 2000 are as follows:
(In thousands) 2001 2000
Revenues. . . . . . . . . . . . . . . . . . . . . . . . . . . . . . . . . . . . . . . $ 255,864 $ 276,558
Expenses . . . . . . . . . . . . . . . . . . . . . . . . . . . . . . . . . . . . . . . 190,488 201,412
Operating income . . . . . . . . . . . . . . . . . . . . . . . . . . . . . . . . . 65,376 75,146
Net income . . . . . . . . . . . . . . . . . . . . . . . . . . . . . . . . . . . . . 64,161 69,260
NOTE 14 — Restructuring CostsDuring the first quarter of 2000, management initiated and completed a restructuringplan designed to consolidate certain general and administrative functions at NewYork-New York and MGM Grand Las Vegas. This restructuring resulted in a chargeagainst earnings in the first quarter of 2000 totaling $5 million. Approximately 70 people were affected by the reductions, primarily at the Company’s operatingproperties (excluding the Mirage properties).
In connection with the Mirage Acquisition, management initiated a comprehensiverestructuring plan designed to reduce costs and improve efficiencies of the combinedoperations of the Company. This restructuring resulted in a charge against earnings inthe second quarter of 2000 totaling $18 million, primarily related to the accrual of
Notes to Consolidated Financial Statements
46
costs associated with contract terminations and staffing reductions of approximately$6 million, the buyout of various leases of approximately $11 million and other relatedrestructuring costs of $1 million. Approximately 125 people were affected by thereductions, primarily at the Company’s operating properties (excluding the Mirageproperties), relating to duplicative functions within marketing, entertainment, retail,information systems and human resources.
Approximately $12 million of payments have been applied against the 2000 restructur-ing accruals, leaving a remaining unpaid balance of $11 million as of December 31,2001. The remaining balance relates principally to the lease buyouts discussed above.
During the third quarter of 2001, management responded to a decline in business vol-umes caused by the September 11 attacks by implementing cost containment strategieswhich included a significant reduction in payroll and a refocusing of several of theCompany’s marketing programs. Approximately 6,400 employees (on a full-timeequivalent basis) were laid off or terminated, resulting in a $20 million charge againstearnings, primarily related to the accrual of severance pay, extended health care cover-age and other related costs in connection with these personnel reductions.
During the fourth quarter of 2001, there were additional personnel reductions relatedto the September 11 attacks, resulting in a $2 million charge against earnings. Anadditional $2 million fourth quarter restructuring charge related to the termination ofthe Holiday Inn franchise agreement at the Boardwalk Hotel and Casino.
Approximately $8 million of payments have been applied against the 2001 restructuringaccruals, leaving a remaining unpaid balance of $16 million at December 31, 2001.
NOTE 15 — Asset Write-Downs and ImpairmentsDuring June 2000, the Company recognized a charge against earnings of $102 mil-lion related to certain projects previously under development which managementhas determined not to pursue ($49 million), the divesting of certain non-strategicassets ($19 million) and the re-evaluation of certain other assets ($34 million), all asa result of the Mirage acquisition.
During September 2001, the Company reassessed the carrying value of certainassets in light of the September 11 attacks, and recognized an impairment charge of$47 million. Most of this charge related to the Company’s land on the Atlantic CityBoardwalk, which is included in the “Deposits and other assets, net” caption in theaccompanying consolidated balance sheet.
Notes to Consolidated Financial Statements
47
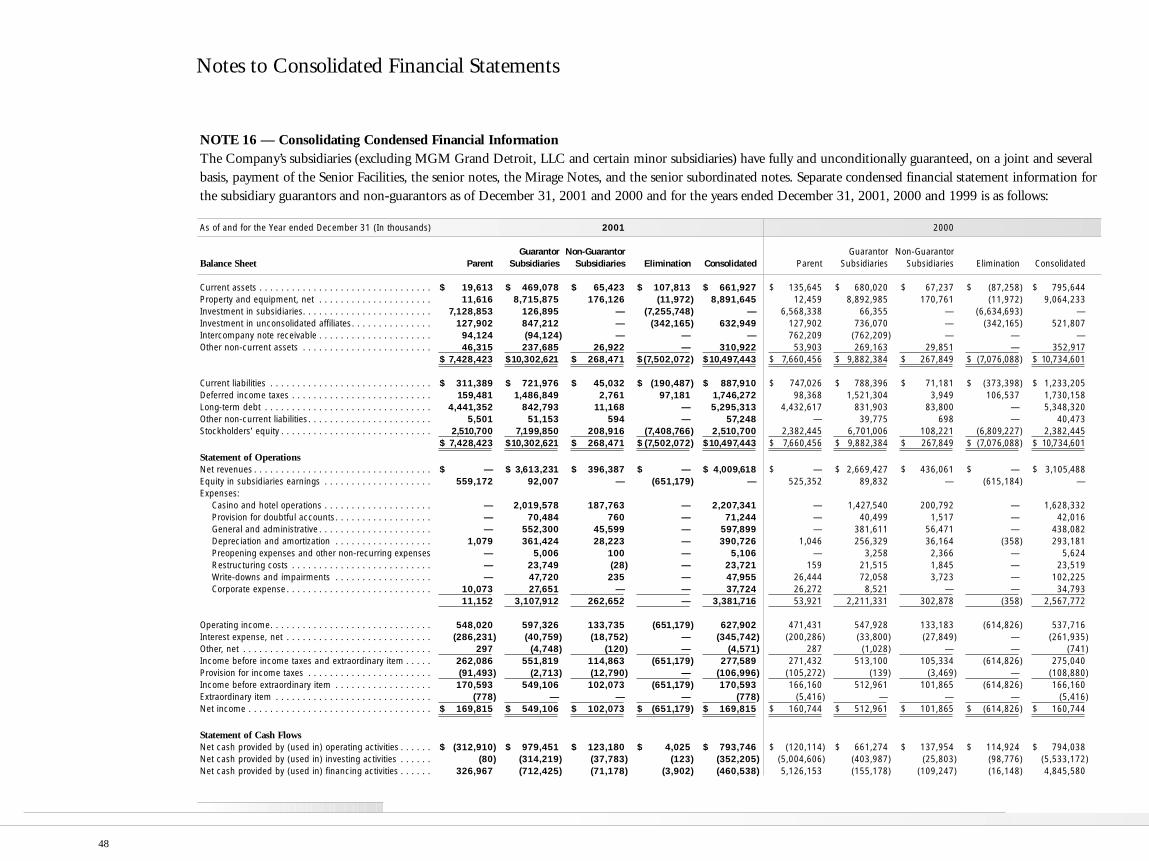
NOTE 16 — Consolidating Condensed Financial InformationThe Company’s subsidiaries (excluding MGM Grand Detroit, LLC and certain minor subsidiaries) have fully and unconditionally guaranteed, on a joint and severalbasis, payment of the Senior Facilities, the senior notes, the Mirage Notes, and the senior subordinated notes. Separate condensed financial statement information forthe subsidiary guarantors and non-guarantors as of December 31, 2001 and 2000 and for the years ended December 31, 2001, 2000 and 1999 is as follows:
As of and for the Year ended December 31 (In thousands) 2001 2000
Guarantor Non-Guarantor Guarantor Non-GuarantorBalance Sheet Parent Subsidiaries Subsidiaries Elimination Consolidated Parent Subsidiaries Subsidiaries Elimination Consolidated
Current assets . . . . . . . . . . . . . . . . . . . . . . . . . . . . . . . . $ 19,613 $ 469,078 $ 65,423 $ 107,813 $ 661,927 $ 135,645 $ 680,020 $ 67,237 $ (87,258) $ 795,644Property and equipment, net . . . . . . . . . . . . . . . . . . . . . 11,616 8,715,875 176,126 (11,972) 8,891,645 12,459 8,892,985 170,761 (11,972) 9,064,233Investment in subsidiaries. . . . . . . . . . . . . . . . . . . . . . . . 7,128,853 126,895 — (7,255,748) — 6,568,338 66,355 — (6,634,693) —Investment in unconsolidated affiliates. . . . . . . . . . . . . . . 127,902 847,212 — (342,165) 632,949 127,902 736,070 — (342,165) 521,807Intercompany note receivable . . . . . . . . . . . . . . . . . . . . . 94,124 (94,124) — — — 762,209 (762,209) — — —Other non-current assets . . . . . . . . . . . . . . . . . . . . . . . . 46,315 237,685 26,922 — 310,922 53,903 269,163 29,851 — 352,917
$ 7,428,423 $10,302,621 $ 268,471 $(7,502,072) $10,497,443 $ 7,660,456 $ 9,882,384 $ 267,849 $ (7,076,088) $ 10,734,601
Current liabilities . . . . . . . . . . . . . . . . . . . . . . . . . . . . . . $ 311,389 $ 721,976 $ 45,032 $ (190,487) $ 887,910 $ 747,026 $ 788,396 $ 71,181 $ (373,398) $ 1,233,205Deferred income taxes . . . . . . . . . . . . . . . . . . . . . . . . . . 159,481 1,486,849 2,761 97,181 1,746,272 98,368 1,521,304 3,949 106,537 1,730,158Long-term debt . . . . . . . . . . . . . . . . . . . . . . . . . . . . . . . 4,441,352 842,793 11,168 — 5,295,313 4,432,617 831,903 83,800 — 5,348,320Other non-current liabilities. . . . . . . . . . . . . . . . . . . . . . . 5,501 51,153 594 — 57,248 — 39,775 698 — 40,473Stockholders’ equity . . . . . . . . . . . . . . . . . . . . . . . . . . . . 2,510,700 7,199,850 208,916 (7,408,766) 2,510,700 2,382,445 6,701,006 108,221 (6,809,227) 2,382,445
$ 7,428,423 $10,302,621 $ 268,471 $ (7,502,072) $10,497,443 $ 7,660,456 $ 9,882,384 $ 267,849 $ (7,076,088) $ 10,734,601
Statement of OperationsNet revenues . . . . . . . . . . . . . . . . . . . . . . . . . . . . . . . . . $ — $ 3,613,231 $ 396,387 $ — $ 4,009,618 $ — $ 2,669,427 $ 436,061 $ — $ 3,105,488Equity in subsidiaries earnings . . . . . . . . . . . . . . . . . . . . 559,172 92,007 — (651,179) — 525,352 89,832 — (615,184) —Expenses:
Casino and hotel operations . . . . . . . . . . . . . . . . . . . . — 2,019,578 187,763 — 2,207,341 — 1,427,540 200,792 — 1,628,332Provision for doubtful accounts. . . . . . . . . . . . . . . . . . — 70,484 760 — 71,244 — 40,499 1,517 — 42,016General and administrative . . . . . . . . . . . . . . . . . . . . . — 552,300 45,599 — 597,899 — 381,611 56,471 — 438,082Depreciation and amortization . . . . . . . . . . . . . . . . . . 1,079 361,424 28,223 — 390,726 1,046 256,329 36,164 (358) 293,181Preopening expenses and other non-recurring expenses — 5,006 100 — 5,106 — 3,258 2,366 — 5,624Restructuring costs . . . . . . . . . . . . . . . . . . . . . . . . . . — 23,749 (28) — 23,721 159 21,515 1,845 — 23,519Write-downs and impairments . . . . . . . . . . . . . . . . . . — 47,720 235 — 47,955 26,444 72,058 3,723 — 102,225Corporate expense . . . . . . . . . . . . . . . . . . . . . . . . . . . 10,073 27,651 — — 37,724 26,272 8,521 — — 34,793
11,152 3,107,912 262,652 — 3,381,716 53,921 2,211,331 302,878 (358) 2,567,772
Operating income. . . . . . . . . . . . . . . . . . . . . . . . . . . . . . 548,020 597,326 133,735 (651,179) 627,902 471,431 547,928 133,183 (614,826) 537,716Interest expense, net . . . . . . . . . . . . . . . . . . . . . . . . . . . (286,231) (40,759) (18,752) — (345,742) (200,286) (33,800) (27,849) — (261,935)Other, net . . . . . . . . . . . . . . . . . . . . . . . . . . . . . . . . . . . 297 (4,748) (120) — (4,571) 287 (1,028) — — (741)Income before income taxes and extraordinary item . . . . . 262,086 551,819 114,863 (651,179) 277,589 271,432 513,100 105,334 (614,826) 275,040Provision for income taxes . . . . . . . . . . . . . . . . . . . . . . . (91,493) (2,713) (12,790) — (106,996) (105,272) (139) (3,469) — (108,880)Income before extraordinary item . . . . . . . . . . . . . . . . . . 170,593 549,106 102,073 (651,179) 170,593 166,160 512,961 101,865 (614,826) 166,160Extraordinary item . . . . . . . . . . . . . . . . . . . . . . . . . . . . . (778) — — — (778) (5,416) — — — (5,416)Net income . . . . . . . . . . . . . . . . . . . . . . . . . . . . . . . . . . $ 169,815 $ 549,106 $ 102,073 $ (651,179) $ 169,815 $ 160,744 $ 512,961 $ 101,865 $ (614,826) $ 160,744
Statement of Cash FlowsNet cash provided by (used in) operating activities . . . . . . $ (312,910) $ 979,451 $ 123,180 $ 4,025 $ 793,746 $ (120,114) $ 661,274 $ 137,954 $ 114,924 $ 794,038Net cash provided by (used in) investing activities . . . . . . (80) (314,219) (37,783) (123) (352,205) (5,004,606) (403,987) (25,803) (98,776) (5,533,172)Net cash provided by (used in) financing activities . . . . . . 326,967 (712,425) (71,178) (3,902) (460,538) 5,126,153 (155,178) (109,247) (16,148) 4,845,580
Notes to Consolidated Financial Statements
48
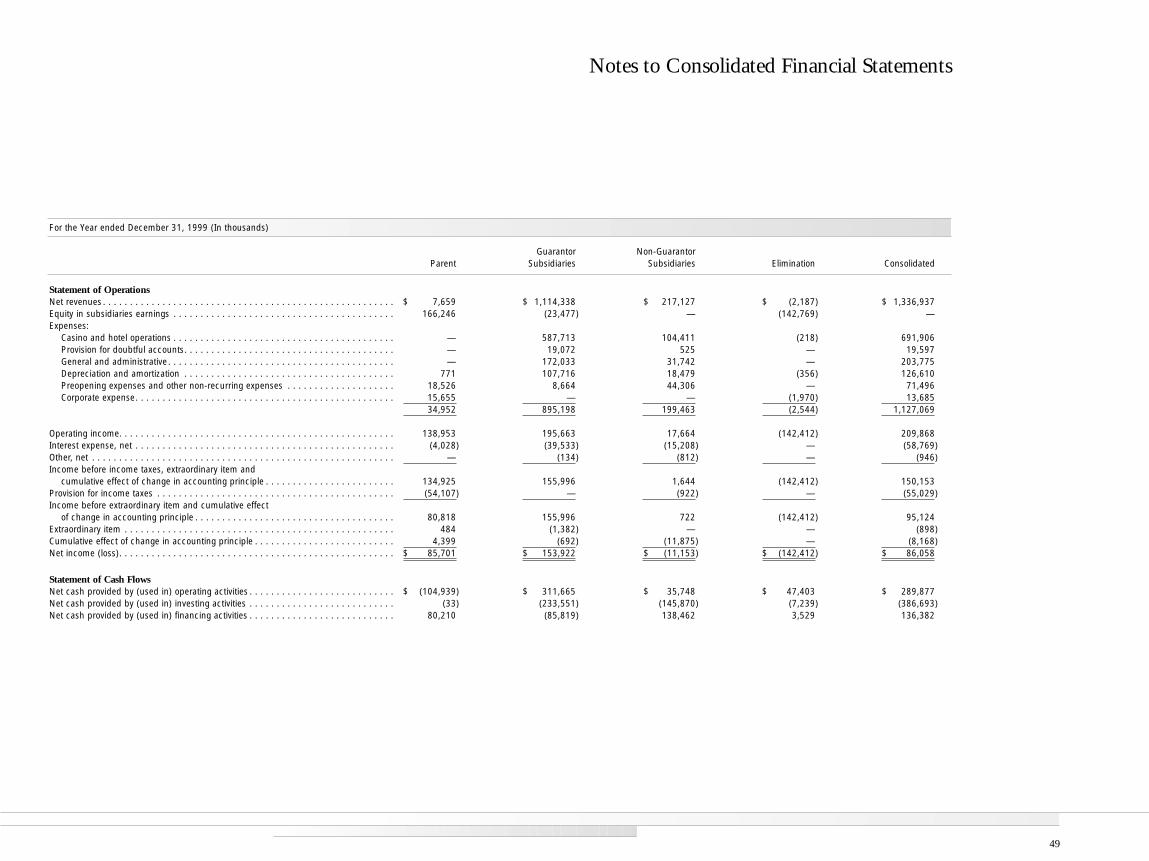
For the Year ended December 31, 1999 (In thousands)
Guarantor Non-GuarantorParent Subsidiaries Subsidiaries Elimination Consolidated
Statement of OperationsNet revenues . . . . . . . . . . . . . . . . . . . . . . . . . . . . . . . . . . . . . . . . . . . . . . . . . . . . . . $ 7,659 $ 1,114,338 $ 217,127 $ (2,187) $ 1,336,937Equity in subsidiaries earnings . . . . . . . . . . . . . . . . . . . . . . . . . . . . . . . . . . . . . . . . . 166,246 (23,477) — (142,769) —Expenses:
Casino and hotel operations . . . . . . . . . . . . . . . . . . . . . . . . . . . . . . . . . . . . . . . . . — 587,713 104,411 (218) 691,906Provision for doubtful accounts. . . . . . . . . . . . . . . . . . . . . . . . . . . . . . . . . . . . . . . — 19,072 525 — 19,597General and administrative . . . . . . . . . . . . . . . . . . . . . . . . . . . . . . . . . . . . . . . . . . — 172,033 31,742 — 203,775Depreciation and amortization . . . . . . . . . . . . . . . . . . . . . . . . . . . . . . . . . . . . . . . 771 107,716 18,479 (356) 126,610Preopening expenses and other non-recurring expenses . . . . . . . . . . . . . . . . . . . . 18,526 8,664 44,306 — 71,496Corporate expense. . . . . . . . . . . . . . . . . . . . . . . . . . . . . . . . . . . . . . . . . . . . . . . . 15,655 — — (1,970) 13,685
34,952 895,198 199,463 (2,544) 1,127,069
Operating income. . . . . . . . . . . . . . . . . . . . . . . . . . . . . . . . . . . . . . . . . . . . . . . . . . . 138,953 195,663 17,664 (142,412) 209,868Interest expense, net . . . . . . . . . . . . . . . . . . . . . . . . . . . . . . . . . . . . . . . . . . . . . . . . (4,028) (39,533) (15,208) — (58,769)Other, net . . . . . . . . . . . . . . . . . . . . . . . . . . . . . . . . . . . . . . . . . . . . . . . . . . . . . . . . — (134) (812) — (946)Income before income taxes, extraordinary item and
cumulative effect of change in accounting principle . . . . . . . . . . . . . . . . . . . . . . . . 134,925 155,996 1,644 (142,412) 150,153Provision for income taxes . . . . . . . . . . . . . . . . . . . . . . . . . . . . . . . . . . . . . . . . . . . . (54,107) — (922) — (55,029)Income before extraordinary item and cumulative effect
of change in accounting principle . . . . . . . . . . . . . . . . . . . . . . . . . . . . . . . . . . . . . 80,818 155,996 722 (142,412) 95,124Extraordinary item . . . . . . . . . . . . . . . . . . . . . . . . . . . . . . . . . . . . . . . . . . . . . . . . . . 484 (1,382) — — (898)Cumulative effect of change in accounting principle . . . . . . . . . . . . . . . . . . . . . . . . . . 4,399 (692) (11,875) — (8,168)Net income (loss). . . . . . . . . . . . . . . . . . . . . . . . . . . . . . . . . . . . . . . . . . . . . . . . . . . $ 85,701 $ 153,922 $ (11,153) $ (142,412) $ 86,058
Statement of Cash FlowsNet cash provided by (used in) operating activities . . . . . . . . . . . . . . . . . . . . . . . . . . . $ (104,939) $ 311,665 $ 35,748 $ 47,403 $ 289,877Net cash provided by (used in) investing activities . . . . . . . . . . . . . . . . . . . . . . . . . . . (33) (233,551) (145,870) (7,239) (386,693)Net cash provided by (used in) financing activities . . . . . . . . . . . . . . . . . . . . . . . . . . . 80,210 (85,819) 138,462 3,529 136,382
Notes to Consolidated Financial Statements
49
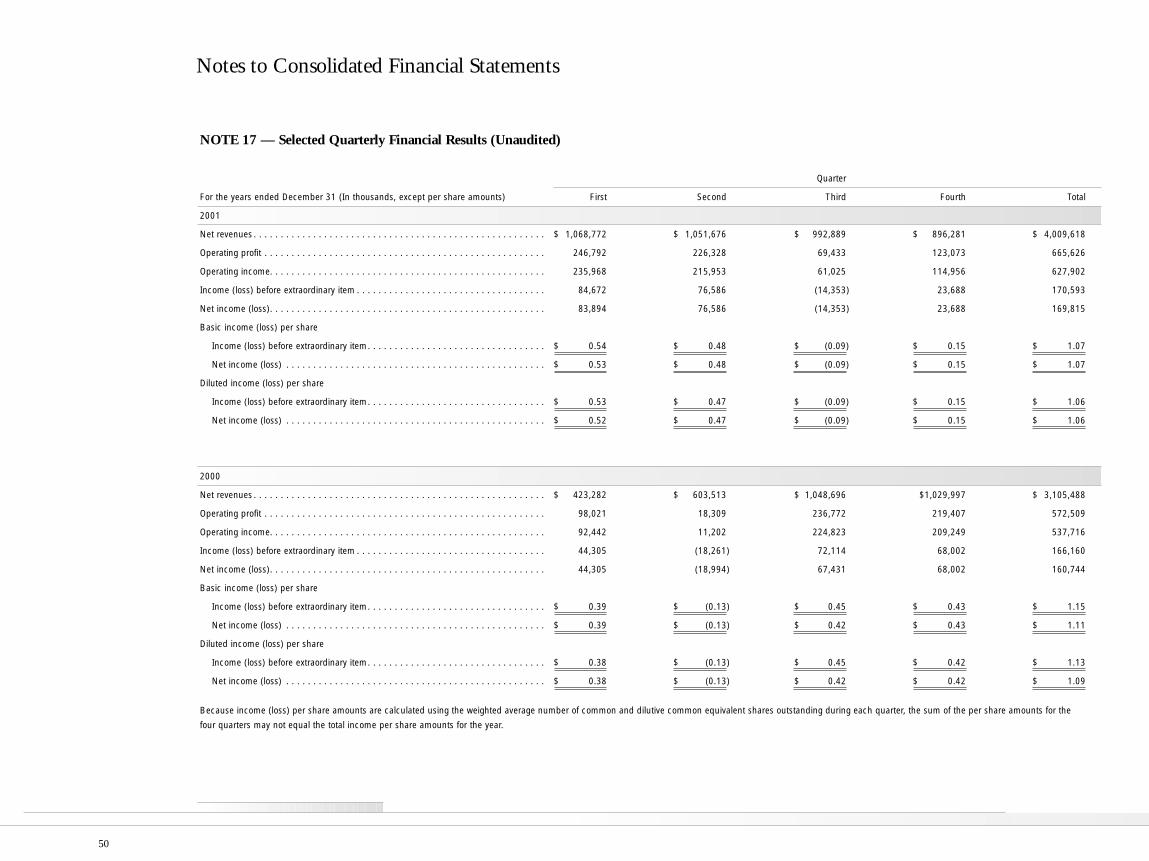
NOTE 17 — Selected Quarterly Financial Results (Unaudited)
Quarter
For the years ended December 31 (In thousands, except per share amounts) First Second Third Fourth Total
2001
Net revenues . . . . . . . . . . . . . . . . . . . . . . . . . . . . . . . . . . . . . . . . . . . . . . . . . . . . . . $ 1,068,772 $ 1,051,676 $ 992,889 $ 896,281 $ 4,009,618
Operating profit . . . . . . . . . . . . . . . . . . . . . . . . . . . . . . . . . . . . . . . . . . . . . . . . . . . . 246,792 226,328 69,433 123,073 665,626
Operating income. . . . . . . . . . . . . . . . . . . . . . . . . . . . . . . . . . . . . . . . . . . . . . . . . . . 235,968 215,953 61,025 114,956 627,902
Income (loss) before extraordinary item . . . . . . . . . . . . . . . . . . . . . . . . . . . . . . . . . . . 84,672 76,586 (14,353) 23,688 170,593
Net income (loss). . . . . . . . . . . . . . . . . . . . . . . . . . . . . . . . . . . . . . . . . . . . . . . . . . . 83,894 76,586 (14,353) 23,688 169,815
Basic income (loss) per share
Income (loss) before extraordinary item. . . . . . . . . . . . . . . . . . . . . . . . . . . . . . . . . $ 0.54 $ 0.48 $ (0.09) $ 0.15 $ 1.07
Net income (loss) . . . . . . . . . . . . . . . . . . . . . . . . . . . . . . . . . . . . . . . . . . . . . . . . $ 0.53 $ 0.48 $ (0.09) $ 0.15 $ 1.07
Diluted income (loss) per share
Income (loss) before extraordinary item. . . . . . . . . . . . . . . . . . . . . . . . . . . . . . . . . $ 0.53 $ 0.47 $ (0.09) $ 0.15 $ 1.06
Net income (loss) . . . . . . . . . . . . . . . . . . . . . . . . . . . . . . . . . . . . . . . . . . . . . . . . $ 0.52 $ 0.47 $ (0.09) $ 0.15 $ 1.06
2000
Net revenues . . . . . . . . . . . . . . . . . . . . . . . . . . . . . . . . . . . . . . . . . . . . . . . . . . . . . . $ 423,282 $ 603,513 $ 1,048,696 $1,029,997 $ 3,105,488
Operating profit . . . . . . . . . . . . . . . . . . . . . . . . . . . . . . . . . . . . . . . . . . . . . . . . . . . . 98,021 18,309 236,772 219,407 572,509
Operating income. . . . . . . . . . . . . . . . . . . . . . . . . . . . . . . . . . . . . . . . . . . . . . . . . . . 92,442 11,202 224,823 209,249 537,716
Income (loss) before extraordinary item . . . . . . . . . . . . . . . . . . . . . . . . . . . . . . . . . . . 44,305 (18,261) 72,114 68,002 166,160
Net income (loss). . . . . . . . . . . . . . . . . . . . . . . . . . . . . . . . . . . . . . . . . . . . . . . . . . . 44,305 (18,994) 67,431 68,002 160,744
Basic income (loss) per share
Income (loss) before extraordinary item. . . . . . . . . . . . . . . . . . . . . . . . . . . . . . . . . $ 0.39 $ (0.13) $ 0.45 $ 0.43 $ 1.15
Net income (loss) . . . . . . . . . . . . . . . . . . . . . . . . . . . . . . . . . . . . . . . . . . . . . . . . $ 0.39 $ (0.13) $ 0.42 $ 0.43 $ 1.11
Diluted income (loss) per share
Income (loss) before extraordinary item. . . . . . . . . . . . . . . . . . . . . . . . . . . . . . . . . $ 0.38 $ (0.13) $ 0.45 $ 0.42 $ 1.13
Net income (loss) . . . . . . . . . . . . . . . . . . . . . . . . . . . . . . . . . . . . . . . . . . . . . . . . $ 0.38 $ (0.13) $ 0.42 $ 0.42 $ 1.09
Because income (loss) per share amounts are calculated using the weighted average number of common and dilutive common equivalent shares outstanding during each quarter, the sum of the per share amounts for the
four quarters may not equal the total income per share amounts for the year.
Notes to Consolidated Financial Statements
50
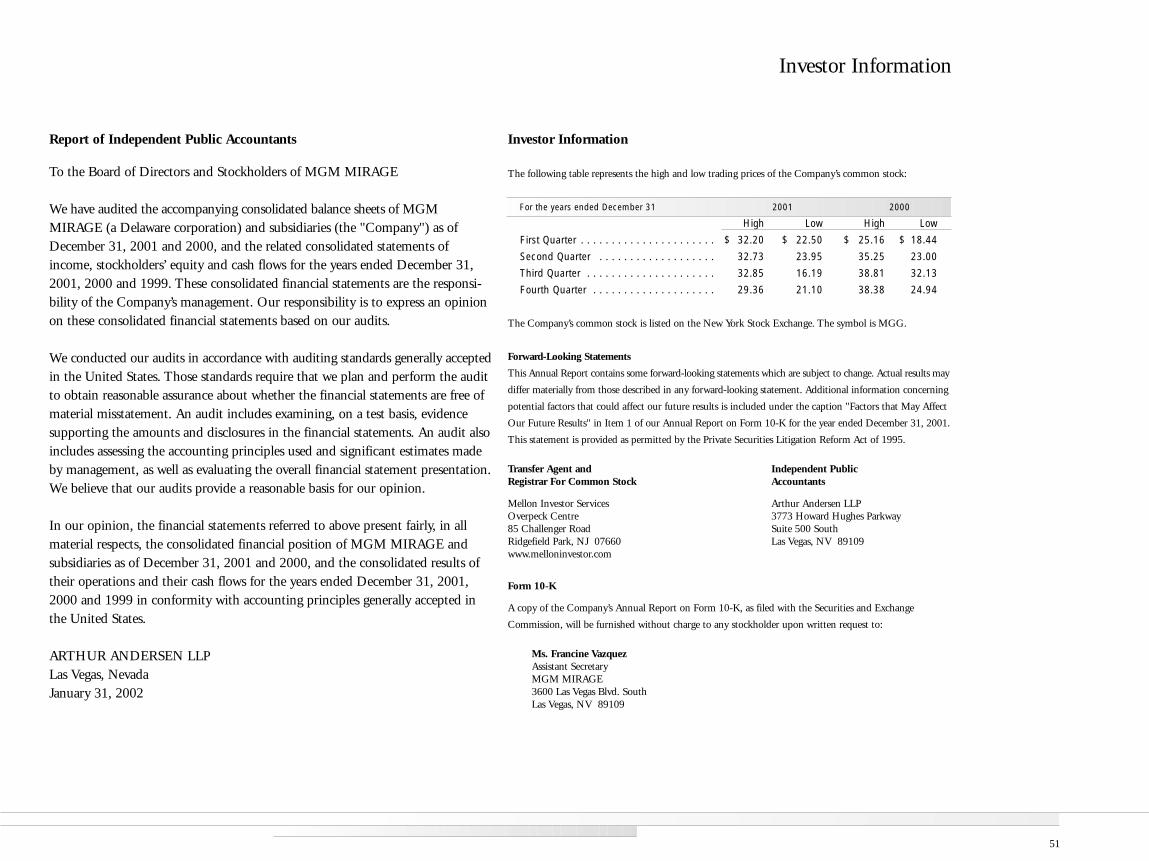
Report of Independent Public Accountants
To the Board of Directors and Stockholders of MGM MIRAGE
We have audited the accompanying consolidated balance sheets of MGMMIRAGE (a Delaware corporation) and subsidiaries (the "Company") as ofDecember 31, 2001 and 2000, and the related consolidated statements ofincome, stockholders’ equity and cash flows for the years ended December 31,2001, 2000 and 1999. These consolidated financial statements are the responsi-bility of the Company’s management. Our responsibility is to express an opinionon these consolidated financial statements based on our audits.
We conducted our audits in accordance with auditing standards generally acceptedin the United States. Those standards require that we plan and perform the auditto obtain reasonable assurance about whether the financial statements are free ofmaterial misstatement. An audit includes examining, on a test basis, evidencesupporting the amounts and disclosures in the financial statements. An audit alsoincludes assessing the accounting principles used and significant estimates madeby management, as well as evaluating the overall financial statement presentation.We believe that our audits provide a reasonable basis for our opinion.
In our opinion, the financial statements referred to above present fairly, in allmaterial respects, the consolidated financial position of MGM MIRAGE andsubsidiaries as of December 31, 2001 and 2000, and the consolidated results oftheir operations and their cash flows for the years ended December 31, 2001,2000 and 1999 in conformity with accounting principles generally accepted inthe United States.
ARTHUR ANDERSEN LLPLas Vegas, NevadaJanuary 31, 2002
Investor Information
The following table represents the high and low trading prices of the Company’s common stock:
For the years ended December 31 2001 2000
High Low High Low
First Quarter . . . . . . . . . . . . . . . . . . . . . . $ 32.20 $ 22.50 $ 25.16 $ 18.44
Second Quarter . . . . . . . . . . . . . . . . . . . 32.73 23.95 35.25 23.00
Third Quarter . . . . . . . . . . . . . . . . . . . . . 32.85 16.19 38.81 32.13
Fourth Quarter . . . . . . . . . . . . . . . . . . . . 29.36 21.10 38.38 24.94
The Company’s common stock is listed on the New York Stock Exchange. The symbol is MGG.
Forward-Looking Statements
This Annual Report contains some forward-looking statements which are subject to change. Actual results may
differ materially from those described in any forward-looking statement. Additional information concerning
potential factors that could affect our future results is included under the caption "Factors that May Affect
Our Future Results" in Item 1 of our Annual Report on Form 10-K for the year ended December 31, 2001.
This statement is provided as permitted by the Private Securities Litigation Reform Act of 1995.
Transfer Agent and Independent PublicRegistrar For Common Stock Accountants
Mellon Investor Services Arthur Andersen LLPOverpeck Centre 3773 Howard Hughes Parkway85 Challenger Road Suite 500 SouthRidgefield Park, NJ 07660 Las Vegas, NV 89109www.melloninvestor.com
Form 10-K
A copy of the Company’s Annual Report on Form 10-K, as filed with the Securities and Exchange
Commission, will be furnished without charge to any stockholder upon written request to:
Ms. Francine VazquezAssistant SecretaryMGM MIRAGE3600 Las Vegas Blvd. SouthLas Vegas, NV 89109
Investor Information
51
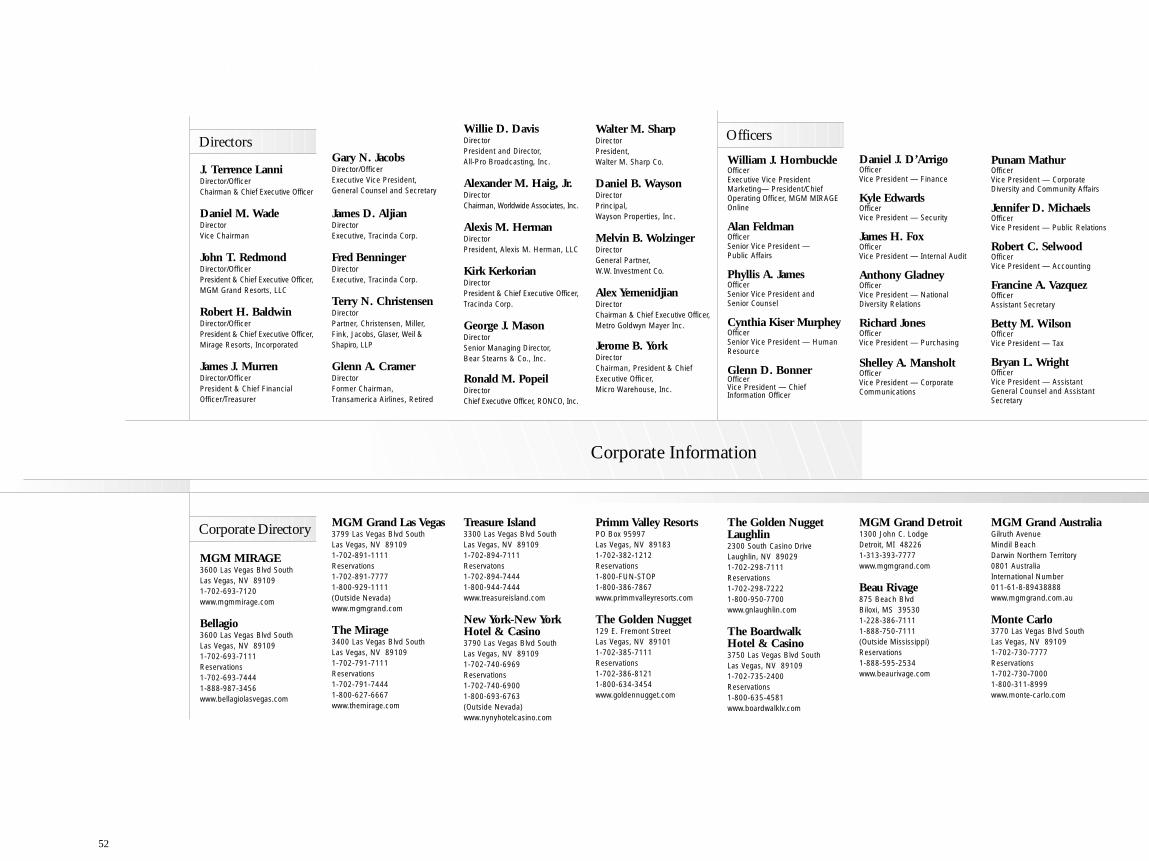
J. Terrence LanniDirector/OfficerChairman & Chief Executive Officer
Daniel M. WadeDirectorVice Chairman
John T. RedmondDirector/OfficerPresident & Chief Executive Officer,MGM Grand Resorts, LLC
Robert H. BaldwinDirector/OfficerPresident & Chief Executive Officer,Mirage Resorts, Incorporated
James J. MurrenDirector/OfficerPresident & Chief FinancialOfficer/Treasurer
Gary N. JacobsDirector/OfficerExecutive Vice President, General Counsel and Secretary
James D. AljianDirectorExecutive, Tracinda Corp.
Fred BenningerDirectorExecutive, Tracinda Corp.
Terry N. ChristensenDirectorPartner, Christensen, Miller, Fink, Jacobs, Glaser, Weil &Shapiro, LLP
Glenn A. CramerDirectorFormer Chairman, Transamerica Airlines, Retired
Willie D. DavisDirectorPresident and Director, All-Pro Broadcasting, Inc.
Alexander M. Haig, Jr.DirectorChairman, Worldwide Associates, Inc.
Alexis M. HermanDirectorPresident, Alexis M. Herman, LLC
Kirk KerkorianDirectorPresident & Chief Executive Officer,Tracinda Corp.
George J. MasonDirectorSenior Managing Director, Bear Stearns & Co., Inc.
Ronald M. PopeilDirectorChief Executive Officer, RONCO, Inc.
Walter M. SharpDirectorPresident, Walter M. Sharp Co.
Daniel B. WaysonDirectorPrincipal, Wayson Properties, Inc.
Melvin B. WolzingerDirectorGeneral Partner,W.W. Investment Co.
Alex YemenidjianDirectorChairman & Chief Executive Officer,Metro Goldwyn Mayer Inc.
Jerome B. YorkDirectorChairman, President & ChiefExecutive Officer, Micro Warehouse, Inc.
William J. HornbuckleOfficerExecutive Vice PresidentMarketing— President/ChiefOperating Officer, MGM MIRAGEOnline
Alan FeldmanOfficerSenior Vice President —Public Affairs
Phyllis A. JamesOfficerSenior Vice President and Senior Counsel
Cynthia Kiser MurpheyOfficerSenior Vice President — HumanResource
Glenn D. BonnerOfficerVice President — ChiefInformation Officer
Daniel J. D’ArrigoOfficerVice President — Finance
Kyle EdwardsOfficerVice President — Security
James H. FoxOfficerVice President — Internal Audit
Anthony GladneyOfficerVice President — NationalDiversity Relations
Richard JonesOfficerVice President — Purchasing
Shelley A. MansholtOfficerVice President — CorporateCommunications
Punam MathurOfficerVice President — CorporateDiversity and Community Affairs
Jennifer D. MichaelsOfficerVice President — Public Relations
Robert C. SelwoodOfficerVice President — Accounting
Francine A. VazquezOfficerAssistant Secretary
Betty M. WilsonOfficerVice President — Tax
Bryan L. WrightOfficerVice President — AssistantGeneral Counsel and AssistantSecretary
MGM MIRAGE3600 Las Vegas Blvd SouthLas Vegas, NV 891091-702-693-7120www.mgmmirage.com
Bellagio3600 Las Vegas Blvd SouthLas Vegas, NV 891091-702-693-7111Reservations1-702-693-74441-888-987-3456www.bellagiolasvegas.com
MGM Grand Las Vegas3799 Las Vegas Blvd SouthLas Vegas, NV 891091-702-891-1111Reservations1-702-891-77771-800-929-1111 (Outside Nevada)www.mgmgrand.com
The Mirage3400 Las Vegas Blvd SouthLas Vegas, NV 891091-702-791-7111Reservations1-702-791-74441-800-627-6667www.themirage.com
Treasure Island3300 Las Vegas Blvd SouthLas Vegas, NV 891091-702-894-7111Reservatons1-702-894-74441-800-944-7444www.treasureisland.com
New York-New York Hotel & Casino3790 Las Vegas Blvd SouthLas Vegas, NV 891091-702-740-6969Reservations1-702-740-69001-800-693-6763 (Outside Nevada)www.nynyhotelcasino.com
Primm Valley ResortsPO Box 95997Las Vegas, NV 891831-702-382-1212Reservations1-800-FUN-STOP1-800-386-7867www.primmvalleyresorts.com
The Golden Nugget129 E. Fremont StreetLas Vegas, NV 891011-702-385-7111Reservations1-702-386-81211-800-634-3454www.goldennugget.com
The Golden NuggetLaughlin2300 South Casino DriveLaughlin, NV 890291-702-298-7111Reservations1-702-298-72221-800-950-7700www.gnlaughlin.com
The Boardwalk Hotel & Casino3750 Las Vegas Blvd SouthLas Vegas, NV 891091-702-735-2400Reservations1-800-635-4581www.boardwalklv.com
MGM Grand Detroit1300 John C. LodgeDetroit, MI 482261-313-393-7777www.mgmgrand.com
Beau Rivage875 Beach BlvdBiloxi, MS 395301-228-386-71111-888-750-7111 (Outside Mississippi)Reservations1-888-595-2534www.beaurivage.com
MGM Grand AustraliaGilruth AvenueMindil BeachDarwin Northern Territory0801 AustraliaInternational Number011-61-8-89438888www.mgmgrand.com.au
Monte Carlo3770 Las Vegas Blvd SouthLas Vegas, NV 891091-702-730-7777Reservations1-702-730-70001-800-311-8999www.monte-carlo.com
Corporate Information
52
Corporate Information
OfficersDirectors
Corporate Directory

2001 was a year of great education for us.
We learned that successfully implementing a Diversity Initiative that provides mean-ingful and long-lasting results involves overcoming significant and complex issues thatare deeply rooted in our society. There are no quick fixes and no magic remedies. Welearned the best chance for our success lies in our ability to forge successful collaborationsand by working together in a spirit of mutual respect and in search of common goals.
At our inaugural Diversity Annual Report Luncheon, held this past February, we werepleased to announce progress in three major areas. We put in place an extensive top-to-bottom organizational structure to facilitate the Diversity Initiative in our company.
We created a complete company-wide strategic plan that incorporates the input andexpertise of every major department throughout our company and we developed atracking system to provide meaningful and reliable data concerning our efforts.
To sum up, while we made some headway in 2001, perhaps the most importantaccomplishments were developing partnerships locally and nationally, creating a specificplan to accomplish results, and having meaningful measurements of our current statusand our progress.
Our resolve as a company has only strengthened and our focus sharpened by all welearned in 2001.
Anthony Gladney > VP, National Diversity Relations
Punam Mathur > VP, Corporate Diversity & Community Affairs
“It is clear that our success is inextricably linked to the relationships we have with other like-minded organizations. It is through these relationships that we feel we will make significant progress.” ...... Anthony Gladney
“The focus of our Diversity Initiative is to generate results by working with our community partners locally, regionally and nationally to meet the challenges that impede us as a society.” ...... Punam Mathur
Leading the Way in Diversity
> >
> M
GM
MIR
AG
E>
20
01
AN
NU
AL
RE
PO
RT
>Leading the W
ay > > >


![AR01...2012/03/06 · Annual Return, Mar. 06, 2012. Companies House.] AR01 Annual Return (For returns made up to a date on or after 1 October 2011) w Company typeo Please confirm](https://static.fdocuments.in/doc/165x107/5f565ca97a6540408437eb8d/ar01-20120306-annual-return-mar-06-2012-companies-house-ar01-annual.jpg)
