MGM Resorts International Second Quarter 2016 Earnings ... · MGM RESORTS INTERNATIONAL Second...
47
MGM RESORTS INTERNATIONAL Second Quarter 2016 Earnings Presentation August 4, 2016
Transcript of MGM Resorts International Second Quarter 2016 Earnings ... · MGM RESORTS INTERNATIONAL Second...
MGM RESORTS INTERNATIONAL Second Quarter 2016 Earnings Presentation
August 4, 2016
1
Forward-Looking Statements
Statements in this presentation that are not historical facts are forward-looking statements, within the meaning of the Private Securities Litigation Reform Act of 1995 and involve risks and/or uncertainties, including those described in the Company's public filings with the Securities and Exchange Commission. The Company has based forward-looking statements on management’s current expectations and assumptions and not on historical facts. Examples of these statements include, but are not limited to, the Company’s ability to generate future cash flow growth and to execute on future development and other projects, such as the Profit Growth Plan, the expected results of the Profit Growth Plan, the Company’s expectations regarding future financial results (including guidance in this presentation), the realization of any benefits from the MGP transactions and the Company’s ability to execute its strategic plan and improve its financial flexibility. These forward-looking statements involve a number of risks and uncertainties. Among the important factors that could cause actual results to differ materially from those indicated in such forward-looking statements include effects of economic conditions and market conditions in the markets in which the Company operates and competition with other destination travel locations throughout the United States and the world, the design, timing and costs of expansion projects, risks relating to international operations, permits, licenses, financings, approvals and other contingencies in connection with growth in new or existing jurisdictions and additional risks and uncertainties described in the Company’s Form 10-K, Form 10-Q and Form 8-K reports (including all amendments to those reports). In providing forward-looking statements, the Company is not undertaking any duty or obligation to update these statements publicly as a result of new information, future events or otherwise, except as required by law. If the Company updates one or more forward-looking statements, no inference should be drawn that it will make additional updates with respect to those other forward-looking statements.
Note Regarding Presentation of Non-GAAP Financial Measures
The following presentation includes certain “non-GAAP financial measures” as defined in Regulation G under the Securities Exchange Act of 1934, as amended. Schedules that reconcile the non-GAAP financial measures to the most directly comparable financial measures calculated and presented in accordance with Generally Accepted Accounting Principles in the United States are included on slide 46 and in our earnings releases that have been furnished with the SEC and are available on our website at www.mgmresorts.com.
.
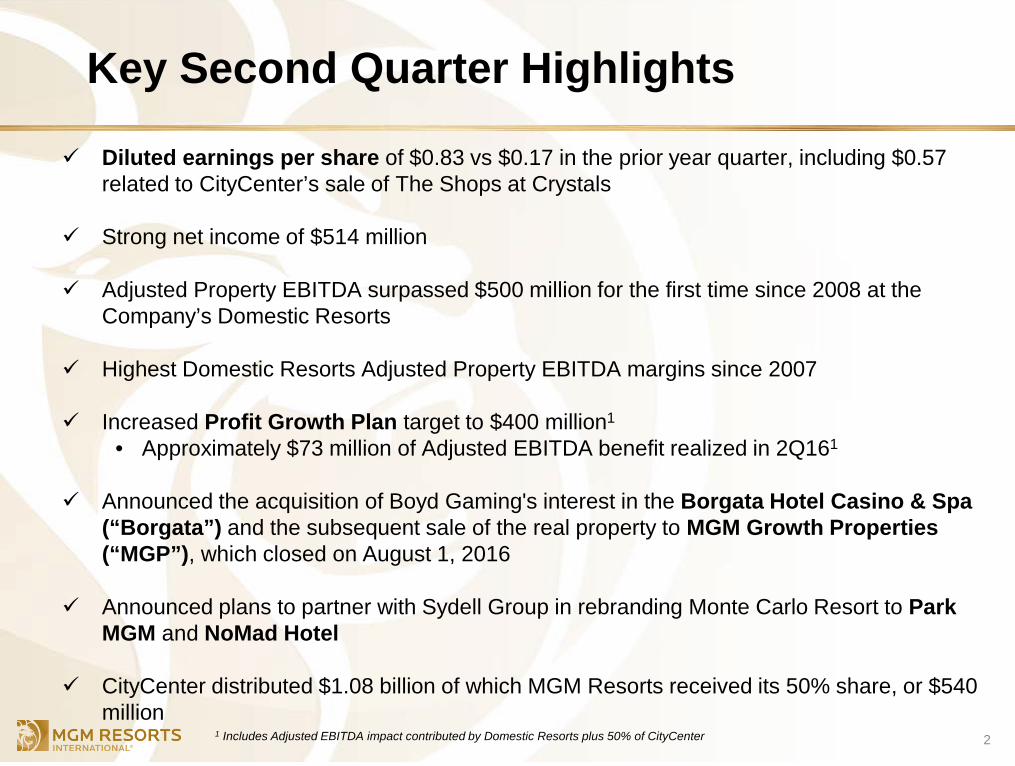
Key Second Quarter Highlights
Diluted earnings per share of $0.83 vs $0.17 in the prior year quarter, including $0.57 related to CityCenter’s sale of The Shops at Crystals
Strong net income of $514 million
Adjusted Property EBITDA surpassed $500 million for the first time since 2008 at the Company’s Domestic Resorts
Highest Domestic Resorts Adjusted Property EBITDA margins since 2007
Increased Profit Growth Plan target to $400 million1
• Approximately $73 million of Adjusted EBITDA benefit realized in 2Q161
Announced the acquisition of Boyd Gaming's interest in the Borgata Hotel Casino & Spa (“Borgata”) and the subsequent sale of the real property to MGM Growth Properties (“MGP”), which closed on August 1, 2016
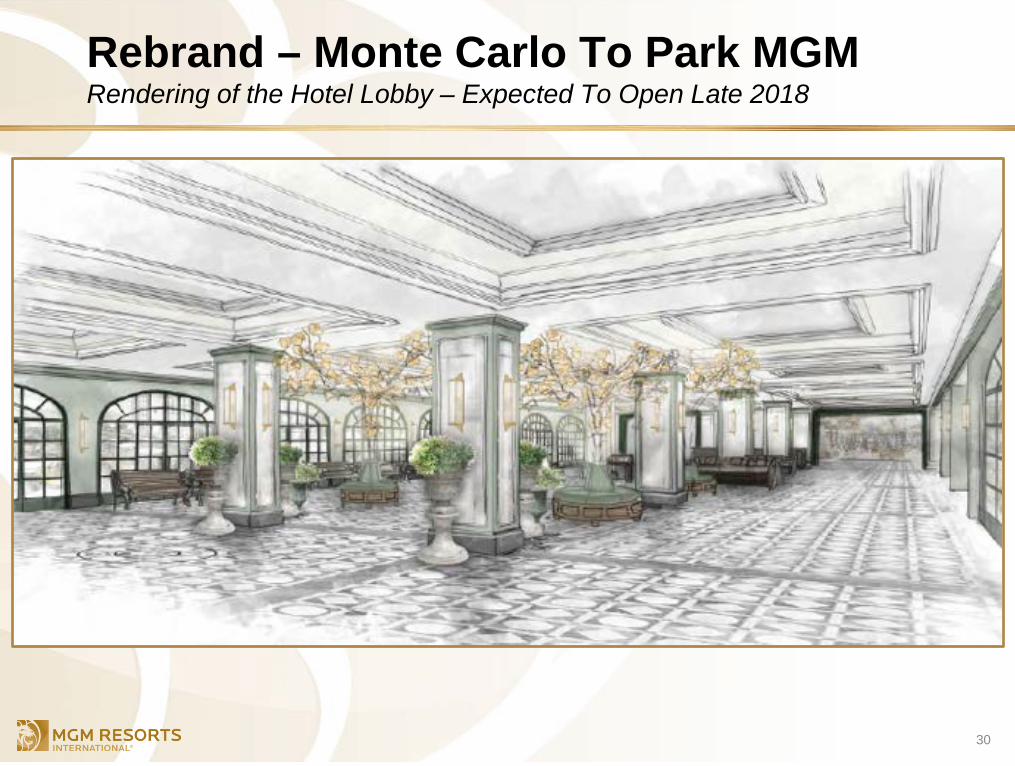
Announced plans to partner with Sydell Group in rebranding Monte Carlo Resort to Park MGM and NoMad Hotel
CityCenter distributed $1.08 billion of which MGM Resorts received its 50% share, or $540 million
2 1 Includes Adjusted EBITDA impact contributed by Domestic Resorts plus 50% of CityCenter
Quarter Items At A Glance
3
• Terminology change as a result of the MGP transaction: • “Wholly Owned Domestic” resorts now referred to as “Domestic” resorts • “Wholly Owned Las Vegas Strip” resorts now referred to as
“Las Vegas Strip” resorts
• Crystals sale impact: CityCenter reported a $411 million gain within discontinued operations for the second quarter of 2016
• MGM Resorts recorded a $406 million gain, which included $205 million representing its 50% share of the gain recorded by CityCenter and $201 million representing the reversal of certain basis differences
• Challenging comparison quarter, which included the Mayweather vs. Pacquiao fight held on May 2, 2015 at the MGM Grand Garden Arena as well as two weekends of Rock in Rio in May 2015
• Beginning in January 2016, the Las Vegas Arena Company (venture between MGM Resorts and AEG) managed the MGM Grand Garden Arena operations
• As a result, MGM Grand Garden Arena’s operations will be recorded as part of “Income from Unconsolidated Affiliates”
2Q 2016 Financial Highlights Domestic Resorts
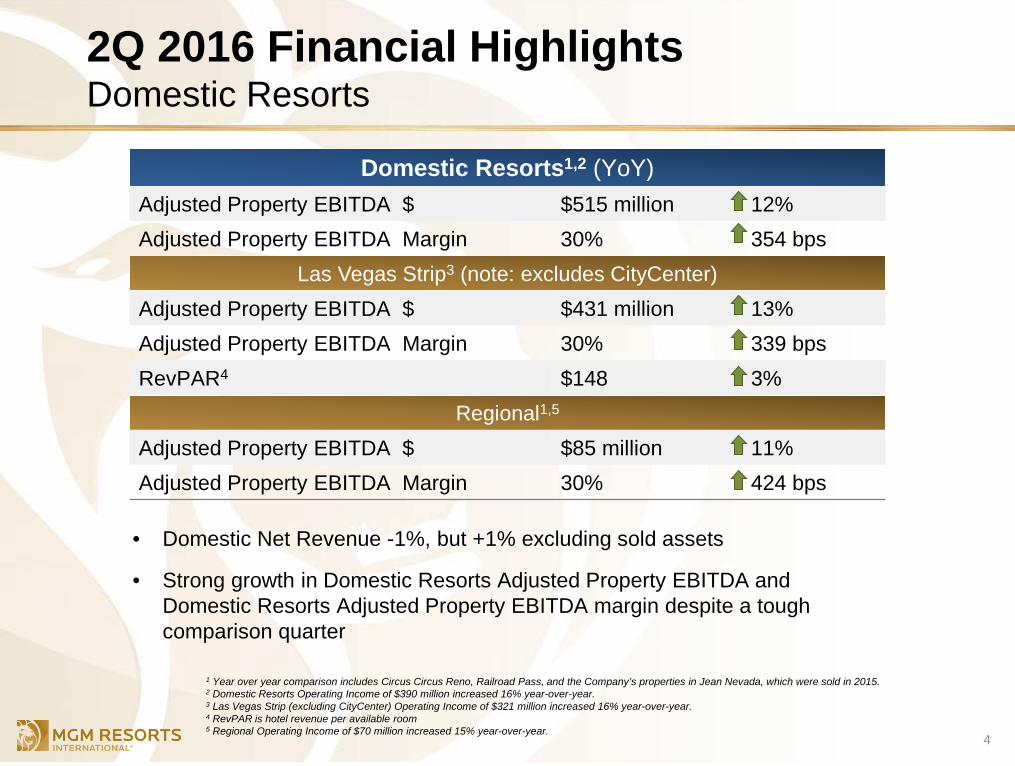
• Domestic Net Revenue -1%, but +1% excluding sold assets
• Strong growth in Domestic Resorts Adjusted Property EBITDA and Domestic Resorts Adjusted Property EBITDA margin despite a tough comparison quarter
4
Domestic Resorts1,2 (YoY) Adjusted Property EBITDA $ $515 million 12% Adjusted Property EBITDA Margin 30% 354 bps
Las Vegas Strip3 (note: excludes CityCenter)
Adjusted Property EBITDA $ $431 million 13% Adjusted Property EBITDA Margin 30% 339 bps RevPAR4 $148 3%
Regional1,5
Adjusted Property EBITDA $ $85 million 11% Adjusted Property EBITDA Margin 30% 424 bps
1 Year over year comparison includes Circus Circus Reno, Railroad Pass, and the Company’s properties in Jean Nevada, which were sold in 2015. 2 Domestic Resorts Operating Income of $390 million increased 16% year-over-year. 3 Las Vegas Strip (excluding CityCenter) Operating Income of $321 million increased 16% year-over-year. 4 RevPAR is hotel revenue per available room 5 Regional Operating Income of $70 million increased 15% year-over-year.
2Q 2016 Adjusted Property EBITDA Growth Drivers
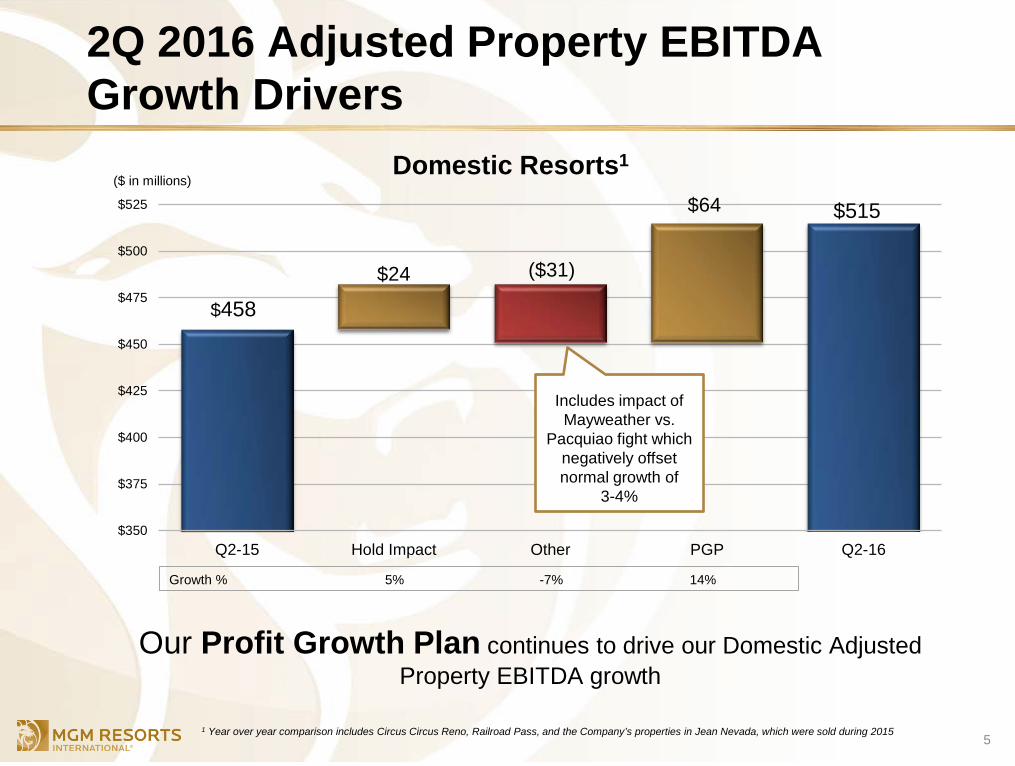
Our Profit Growth Plan continues to drive our Domestic Adjusted Property EBITDA growth
5
$458
$515
$24 ($31)
$64
$350
$375
$400
$425
$450
$475
$500
$525
Q2-15 Hold Impact Other PGP Q2-16
Growth % 5% -7% 14%
Domestic Resorts1 ($ in millions)
1 Year over year comparison includes Circus Circus Reno, Railroad Pass, and the Company’s properties in Jean Nevada, which were sold during 2015
Includes impact of Mayweather vs.
Pacquiao fight which negatively offset normal growth of
3-4%
Two-Year Comparison Exhibits Healthy Growth Over a Unique 2Q15
6
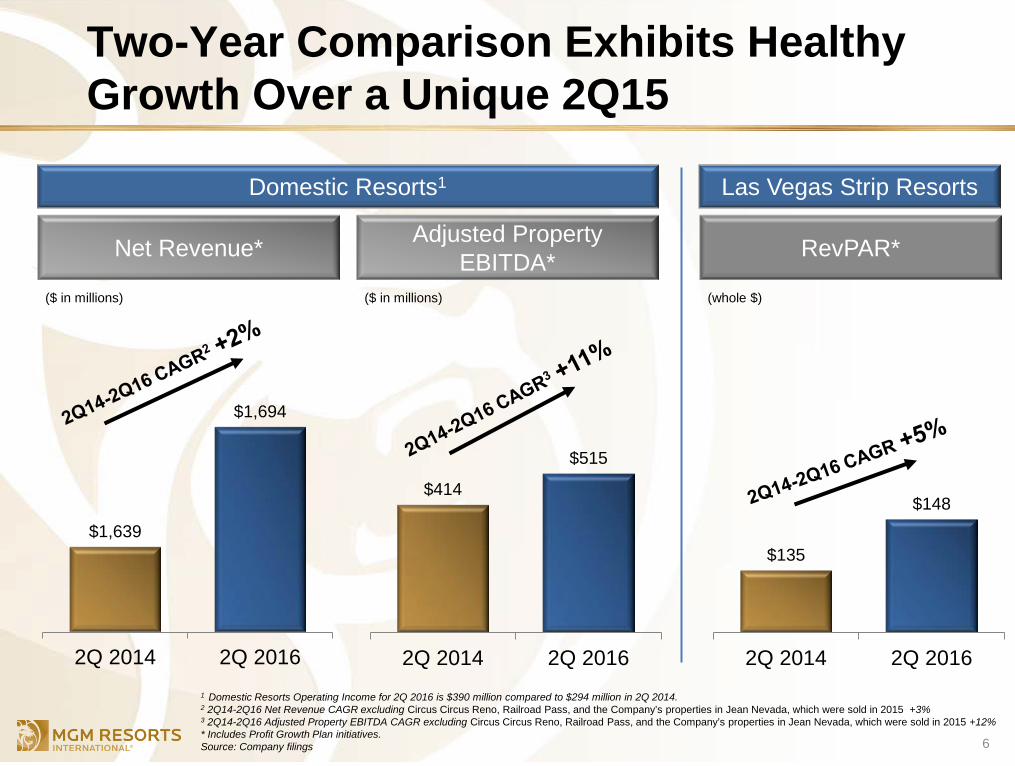
1 Domestic Resorts Operating Income for 2Q 2016 is $390 million compared to $294 million in 2Q 2014. 2 2Q14-2Q16 Net Revenue CAGR excluding Circus Circus Reno, Railroad Pass, and the Company’s properties in Jean Nevada, which were sold in 2015 +3% 3 2Q14-2Q16 Adjusted Property EBITDA CAGR excluding Circus Circus Reno, Railroad Pass, and the Company’s properties in Jean Nevada, which were sold in 2015 +12% * Includes Profit Growth Plan initiatives. Source: Company filings
$1,639
$1,694
2Q 2014 2Q 2016
$414
$515
2Q 2014 2Q 2016
Domestic Resorts1
($ in millions)
($ in millions)
$135
$148
2Q 2014 2Q 2016
Las Vegas Strip Resorts
(whole $)
Net Revenue* Adjusted Property EBITDA* RevPAR*
10%
5% 5% 5%
3%
5%
6%
8%
6%
5%
7%
14%
6% 6%
7%
1%
6%
8%
12%
8%
3%
0%
2%
4%
6%
8%
10%
12%
14%
16%
1Q14 2Q14 3Q14 4Q14 1Q15 2Q15 3Q15 4Q15 1Q16 2Q16 3Q16E
Guidance RevPAR growth Reported RevPAR growth
6%
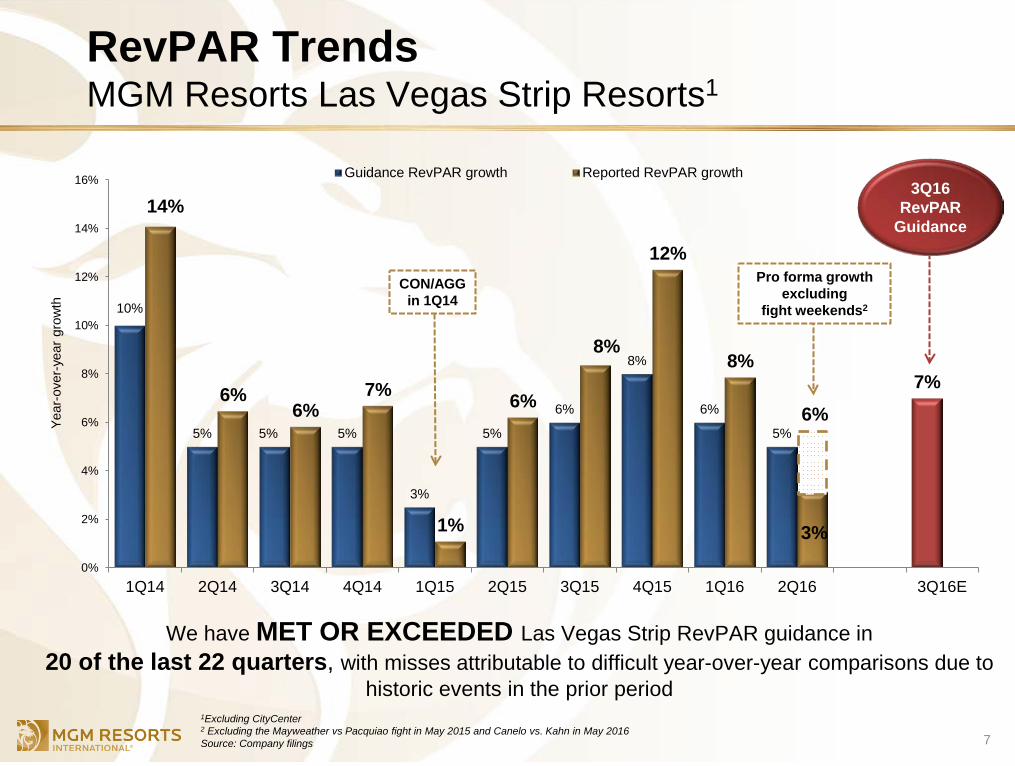
RevPAR Trends MGM Resorts Las Vegas Strip Resorts1
We have MET OR EXCEEDED Las Vegas Strip RevPAR guidance in 20 of the last 22 quarters, with misses attributable to difficult year-over-year comparisons due to
historic events in the prior period
7
CON/AGG in 1Q14
Year
-ove
r-ye
ar g
row
th
1Excluding CityCenter 2 Excluding the Mayweather vs Pacquiao fight in May 2015 and Canelo vs. Kahn in May 2016 Source: Company filings
Pro forma growth excluding
fight weekends2
3Q16 RevPAR
Guidance
2Q 2016 Financial Highlights CityCenter Resort Operations
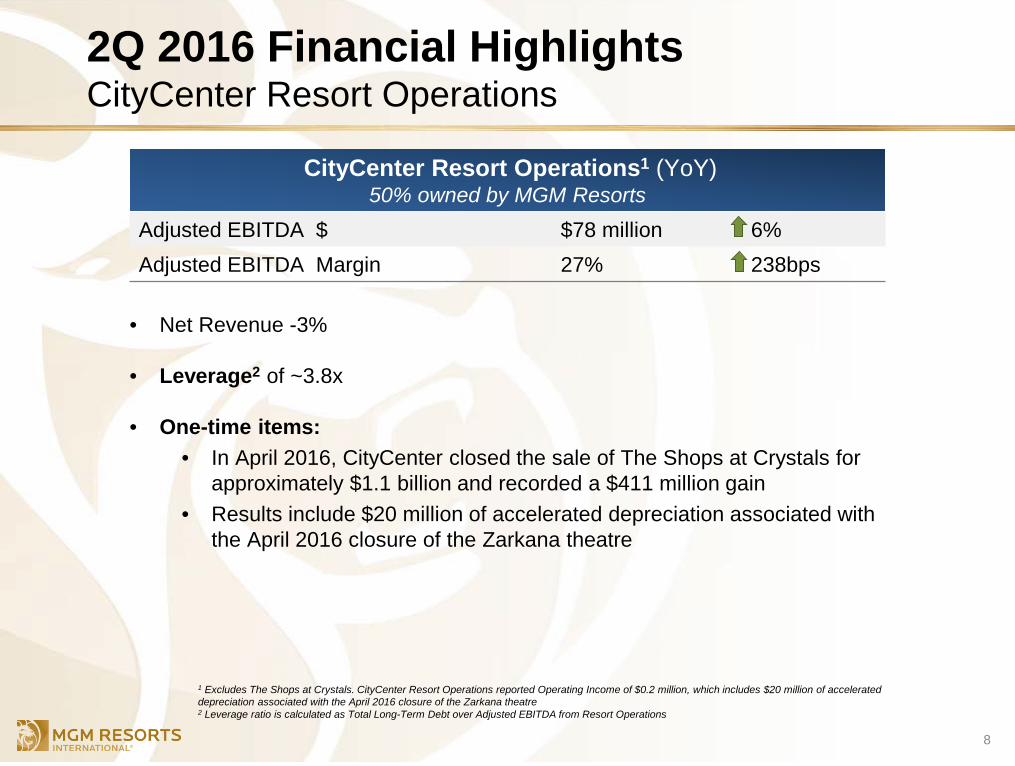
• Net Revenue -3%
• Leverage2 of ~3.8x
• One-time items: • In April 2016, CityCenter closed the sale of The Shops at Crystals for
approximately $1.1 billion and recorded a $411 million gain • Results include $20 million of accelerated depreciation associated with
the April 2016 closure of the Zarkana theatre
8
CityCenter Resort Operations1 (YoY) 50% owned by MGM Resorts
Adjusted EBITDA $ $78 million 6% Adjusted EBITDA Margin 27% 238bps
1 Excludes The Shops at Crystals. CityCenter Resort Operations reported Operating Income of $0.2 million, which includes $20 million of accelerated depreciation associated with the April 2016 closure of the Zarkana theatre 2 Leverage ratio is calculated as Total Long-Term Debt over Adjusted EBITDA from Resort Operations
2Q 2016 Financial Highlights MGM China
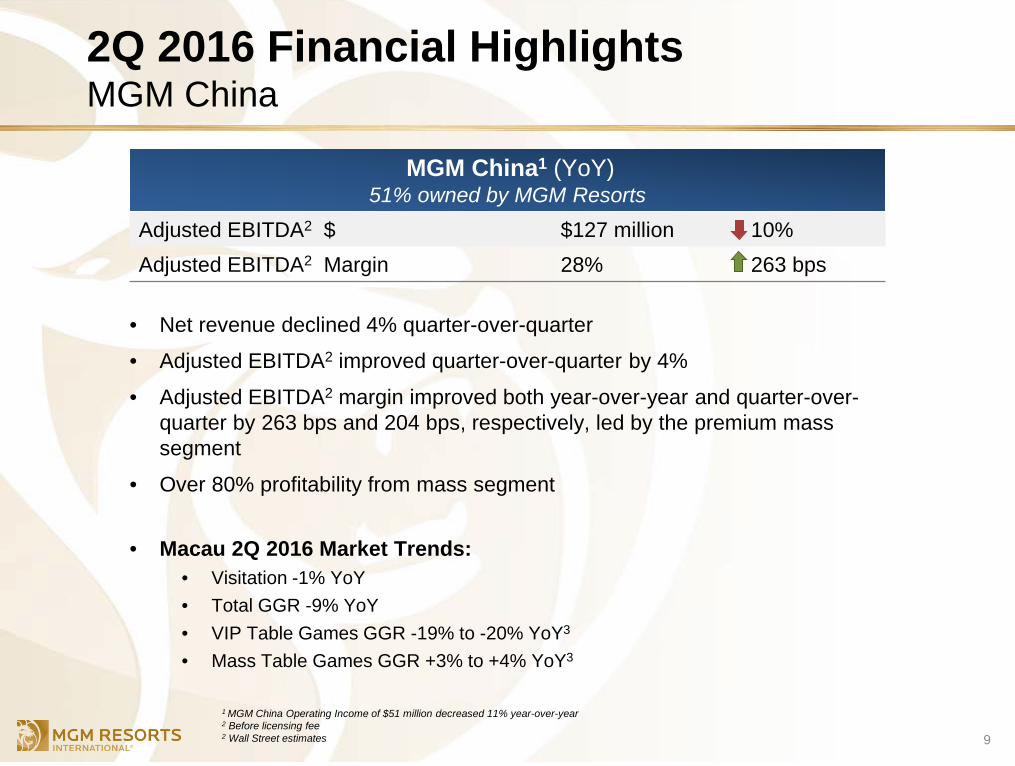
• Net revenue declined 4% quarter-over-quarter
• Adjusted EBITDA2 improved quarter-over-quarter by 4%
• Adjusted EBITDA2 margin improved both year-over-year and quarter-over-quarter by 263 bps and 204 bps, respectively, led by the premium mass segment
• Over 80% profitability from mass segment
• Macau 2Q 2016 Market Trends: • Visitation -1% YoY • Total GGR -9% YoY • VIP Table Games GGR -19% to -20% YoY3
• Mass Table Games GGR +3% to +4% YoY3
9
MGM China1 (YoY) 51% owned by MGM Resorts
Adjusted EBITDA2 $ $127 million 10% Adjusted EBITDA2 Margin 28% 263 bps
1 MGM China Operating Income of $51 million decreased 11% year-over-year
2 Before licensing fee 2 Wall Street estimates
2Q 2016 Financial Highlights MGM Growth Properties
10
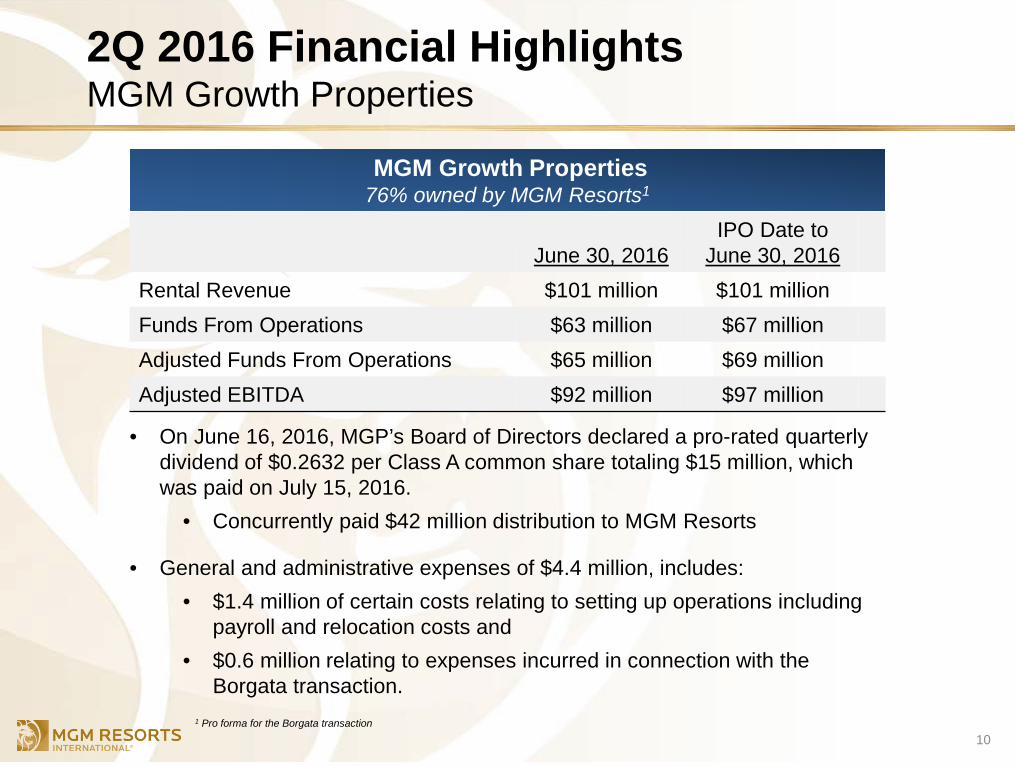
• On June 16, 2016, MGP’s Board of Directors declared a pro-rated quarterly dividend of $0.2632 per Class A common share totaling $15 million, which was paid on July 15, 2016.
• Concurrently paid $42 million distribution to MGM Resorts
• General and administrative expenses of $4.4 million, includes: • $1.4 million of certain costs relating to setting up operations including
payroll and relocation costs and • $0.6 million relating to expenses incurred in connection with the
Borgata transaction. 1 Pro forma for the Borgata transaction
MGM Growth Properties 76% owned by MGM Resorts1
June 30, 2016 IPO Date to
June 30, 2016 Rental Revenue $101 million $101 million Funds From Operations $63 million $67 million Adjusted Funds From Operations $65 million $69 million Adjusted EBITDA $92 million $97 million
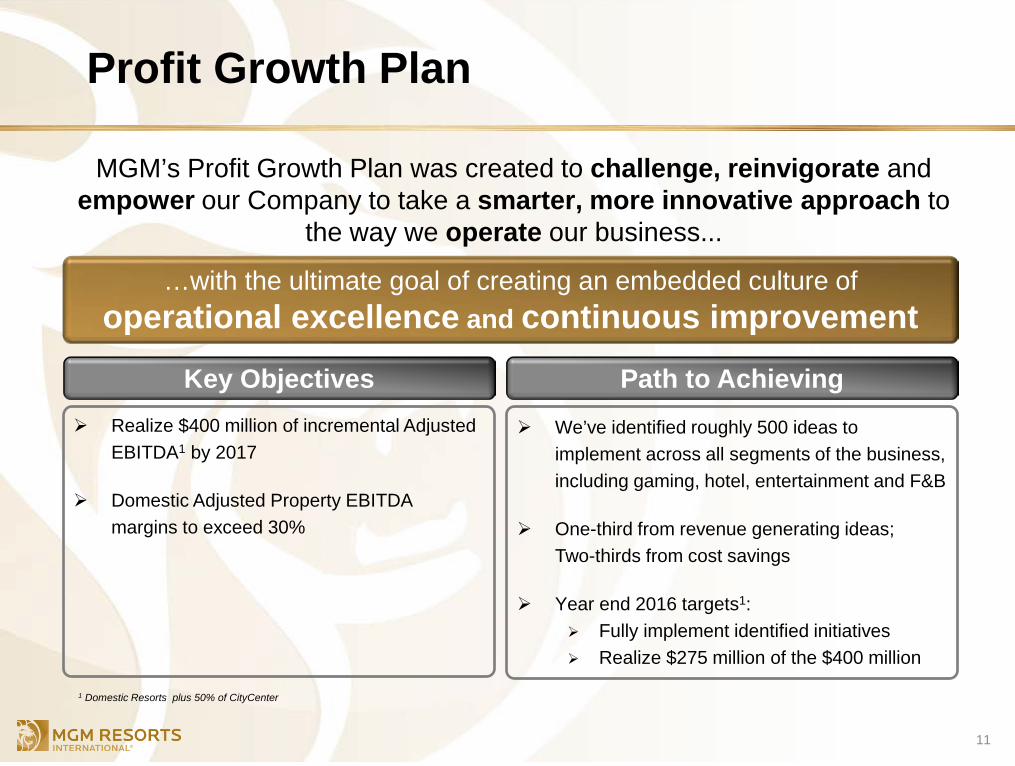
Profit Growth Plan
MGM’s Profit Growth Plan was created to challenge, reinvigorate and empower our Company to take a smarter, more innovative approach to
the way we operate our business...
11
…with the ultimate goal of creating an embedded culture of operational excellence and continuous improvement
Key Objectives Path to Achieving We’ve identified roughly 500 ideas to
implement across all segments of the business, including gaming, hotel, entertainment and F&B
One-third from revenue generating ideas; Two-thirds from cost savings
Year end 2016 targets1: Fully implement identified initiatives Realize $275 million of the $400 million
Realize $400 million of incremental Adjusted EBITDA1 by 2017
Domestic Adjusted Property EBITDA
margins to exceed 30%
1 Domestic Resorts plus 50% of CityCenter
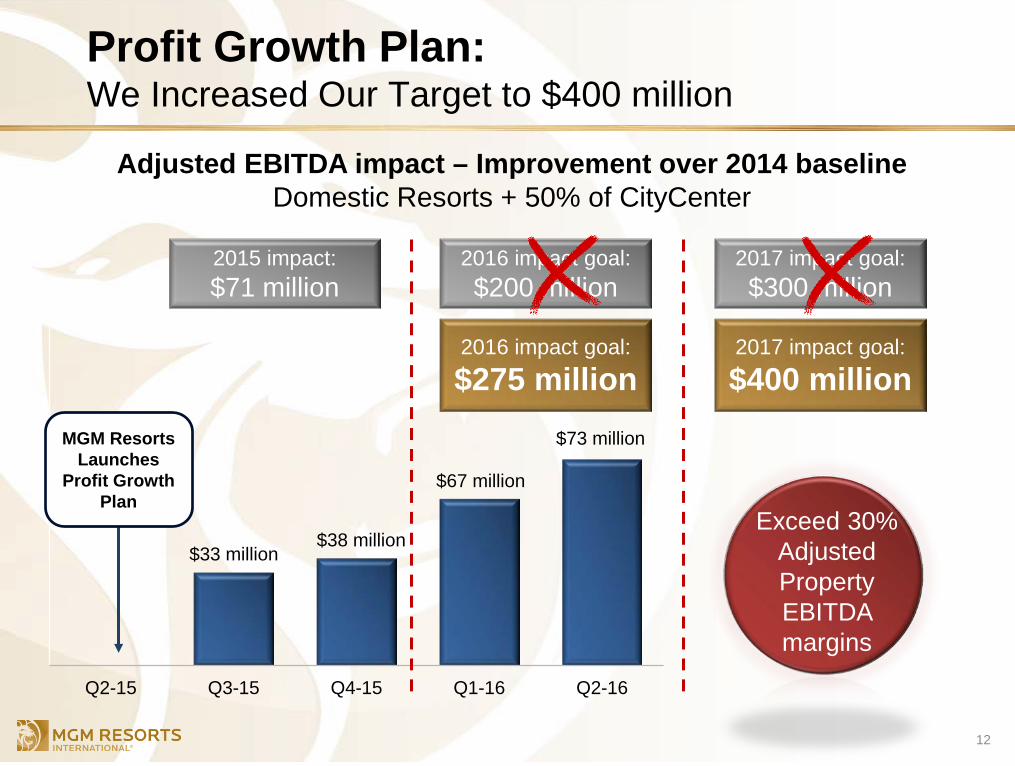
Profit Growth Plan: We Increased Our Target to $400 million
12
$33 million $38 million
$67 million
$73 million
Q2-15 Q3-15 Q4-15 Q1-16 Q2-16
2015 impact: $71 million
MGM Resorts Launches
Profit Growth Plan
2017 impact goal: $300 million
Exceed 30% Adjusted Property EBITDA margins
2016 impact goal: $200 million
2017 impact goal:
$400 million
Adjusted EBITDA impact – Improvement over 2014 baseline Domestic Resorts + 50% of CityCenter
2016 impact goal:
$275 million
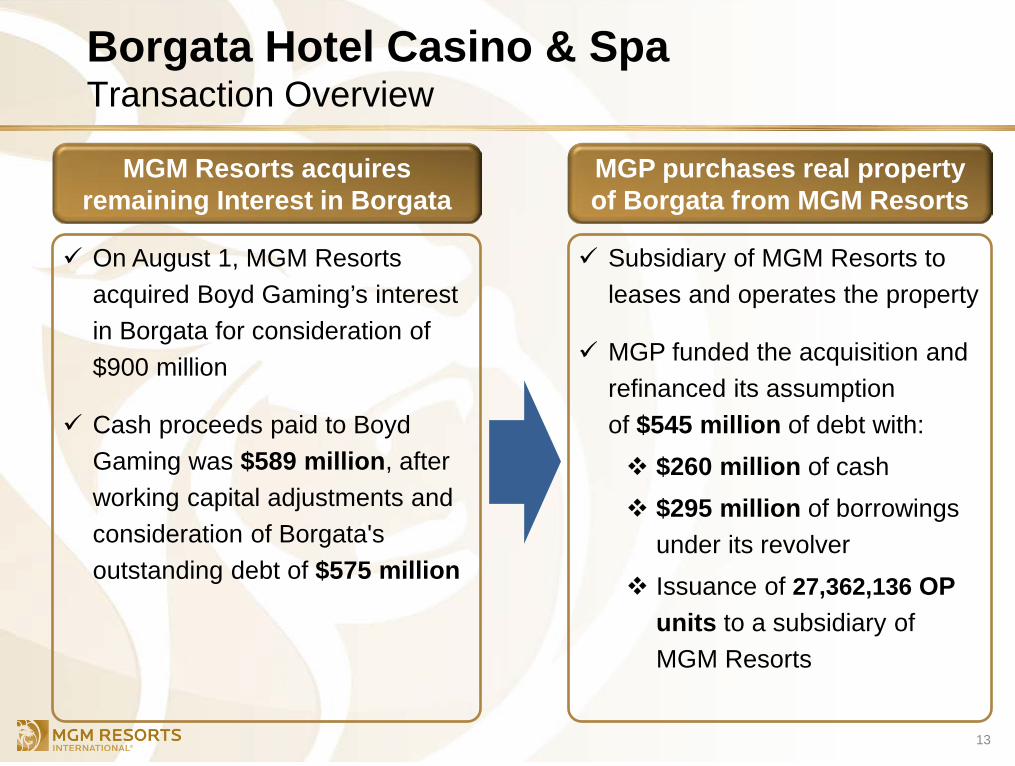
Borgata Hotel Casino & Spa Transaction Overview
13
MGM Resorts acquires remaining Interest in Borgata
MGP purchases real property of Borgata from MGM Resorts
On August 1, MGM Resorts acquired Boyd Gaming’s interest in Borgata for consideration of $900 million
Cash proceeds paid to Boyd Gaming was $589 million, after working capital adjustments and consideration of Borgata's outstanding debt of $575 million
Subsidiary of MGM Resorts to leases and operates the property
MGP funded the acquisition and refinanced its assumption of $545 million of debt with: $260 million of cash $295 million of borrowings
under its revolver Issuance of 27,362,136 OP
units to a subsidiary of MGM Resorts
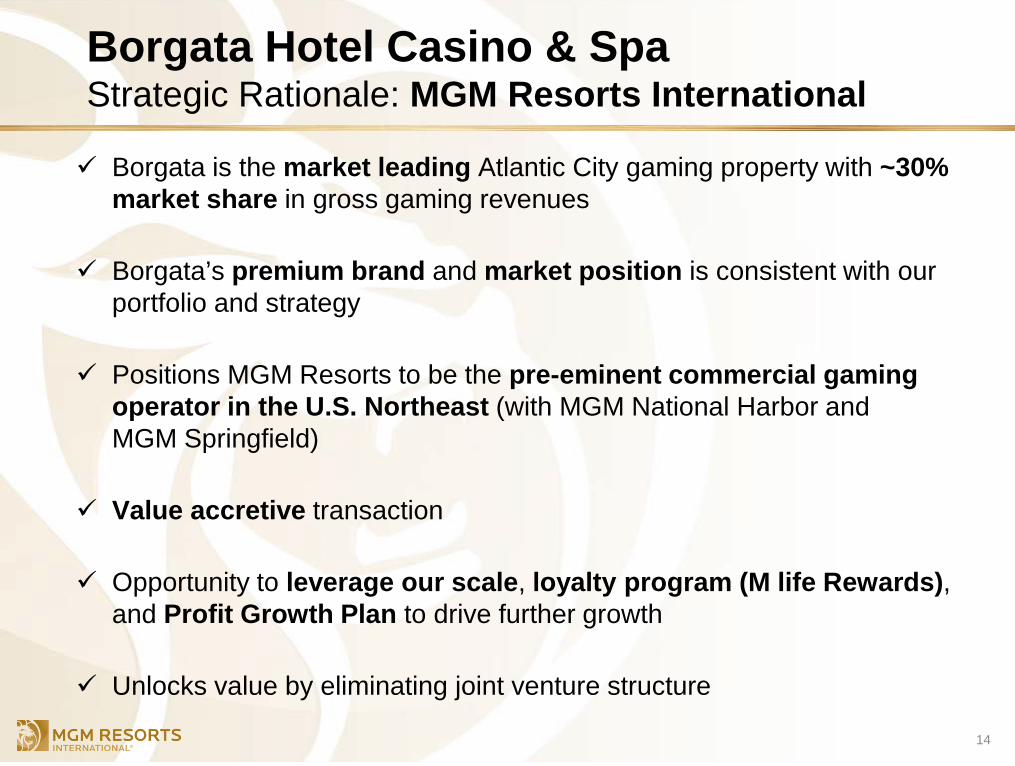
Borgata Hotel Casino & Spa Strategic Rationale: MGM Resorts International
Borgata is the market leading Atlantic City gaming property with ~30% market share in gross gaming revenues
Borgata’s premium brand and market position is consistent with our portfolio and strategy
Positions MGM Resorts to be the pre-eminent commercial gaming operator in the U.S. Northeast (with MGM National Harbor and MGM Springfield)
Value accretive transaction
Opportunity to leverage our scale, loyalty program (M life Rewards), and Profit Growth Plan to drive further growth
Unlocks value by eliminating joint venture structure
14
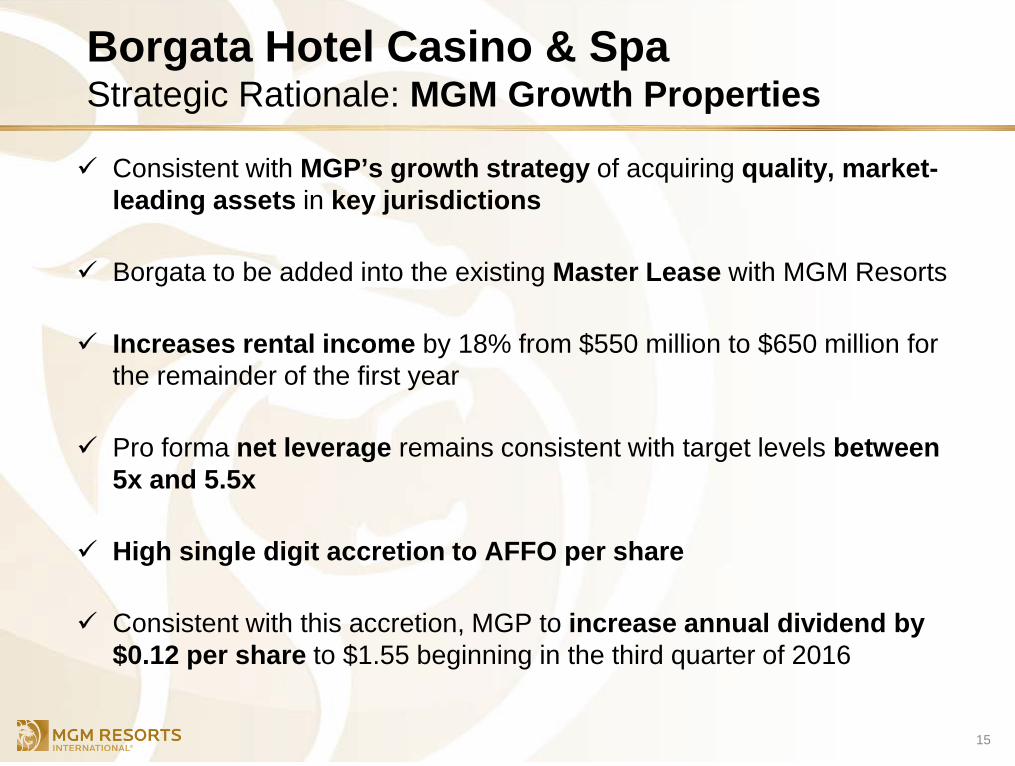
Borgata Hotel Casino & Spa Strategic Rationale: MGM Growth Properties
Consistent with MGP’s growth strategy of acquiring quality, market-leading assets in key jurisdictions
Borgata to be added into the existing Master Lease with MGM Resorts
Increases rental income by 18% from $550 million to $650 million for the remainder of the first year
Pro forma net leverage remains consistent with target levels between 5x and 5.5x
High single digit accretion to AFFO per share
Consistent with this accretion, MGP to increase annual dividend by $0.12 per share to $1.55 beginning in the third quarter of 2016
15
Actual 6/30/2016
BorgataAdjustments
Pro Forma6/30/2016
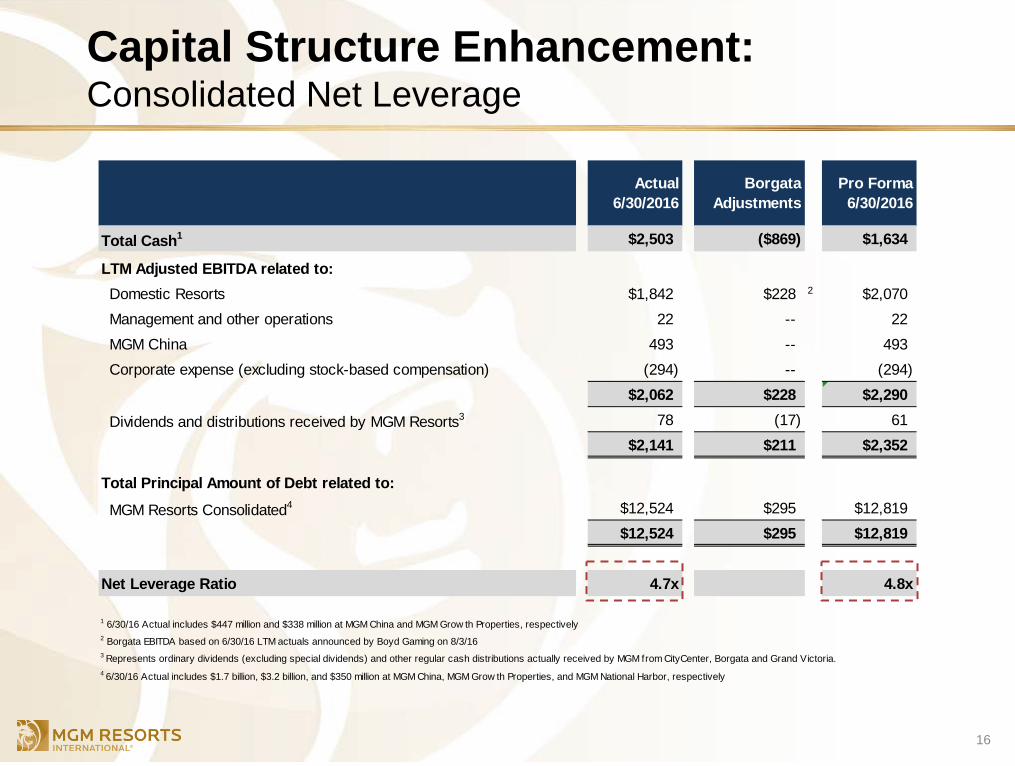
Total Cash1 $2,503 ($869) $1,634
LTM Adjusted EBITDA related to:Domestic Resorts $1,842 $228 2 $2,070Management and other operations 22 -- 22MGM China 493 -- 493Corporate expense (excluding stock-based compensation) (294) -- (294)
$2,062 $228 $2,290
Dividends and distributions received by MGM Resorts3 78 (17) 61$2,141 $211 $2,352
Total Principal Amount of Debt related to:
MGM Resorts Consolidated4 $12,524 $295 $12,819$12,524 $295 $12,819
Net Leverage Ratio 4.7x 4.8x
1 6/30/16 Actual includes $447 million and $338 million at MGM China and MGM Grow th Properties, respectively2 Borgata EBITDA based on 6/30/16 LTM actuals announced by Boyd Gaming on 8/3/16
4 6/30/16 Actual includes $1.7 billion, $3.2 billion, and $350 million at MGM China, MGM Grow th Properties, and MGM National Harbor, respectively
3 Represents ordinary dividends (excluding special dividends) and other regular cash distributions actually received by MGM from CityCenter, Borgata and Grand Victoria.
Capital Structure Enhancement: Consolidated Net Leverage
16

2Q 2016 Capital Expenditures
• Domestic Operations: $85 million – Includes The Park theater and general maintenance and growth
• U.S. Development Projects: $200 million – MGM National Harbor: $178 million
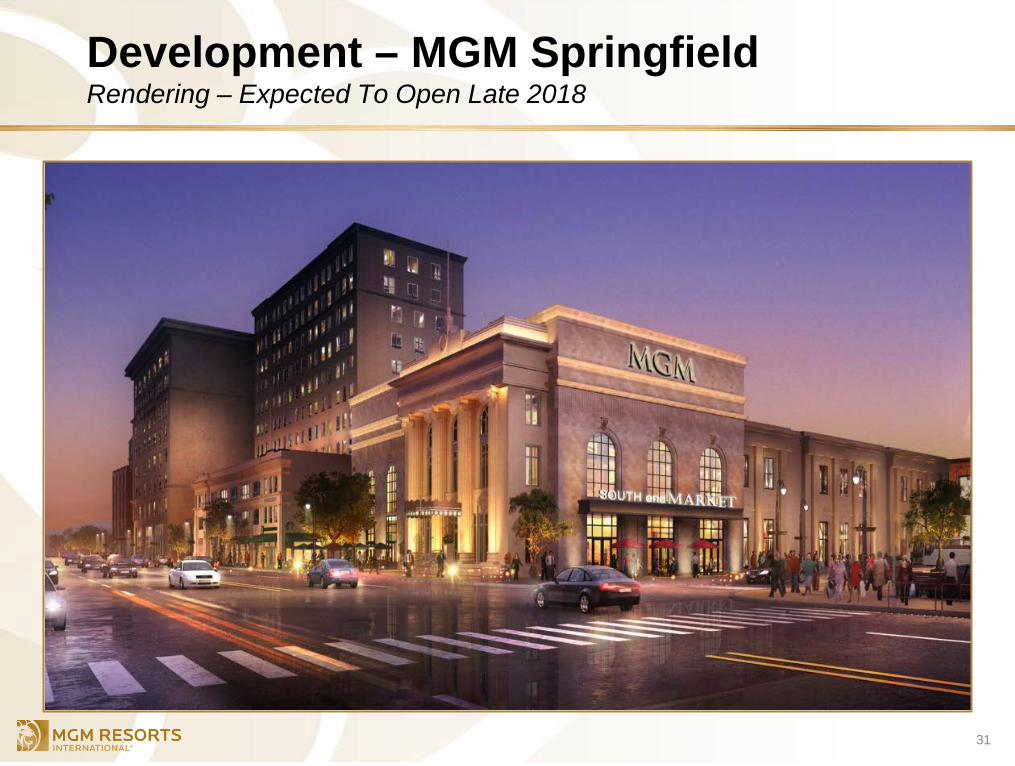
– MGM Springfield: $22 million
• MGM China: $232 million
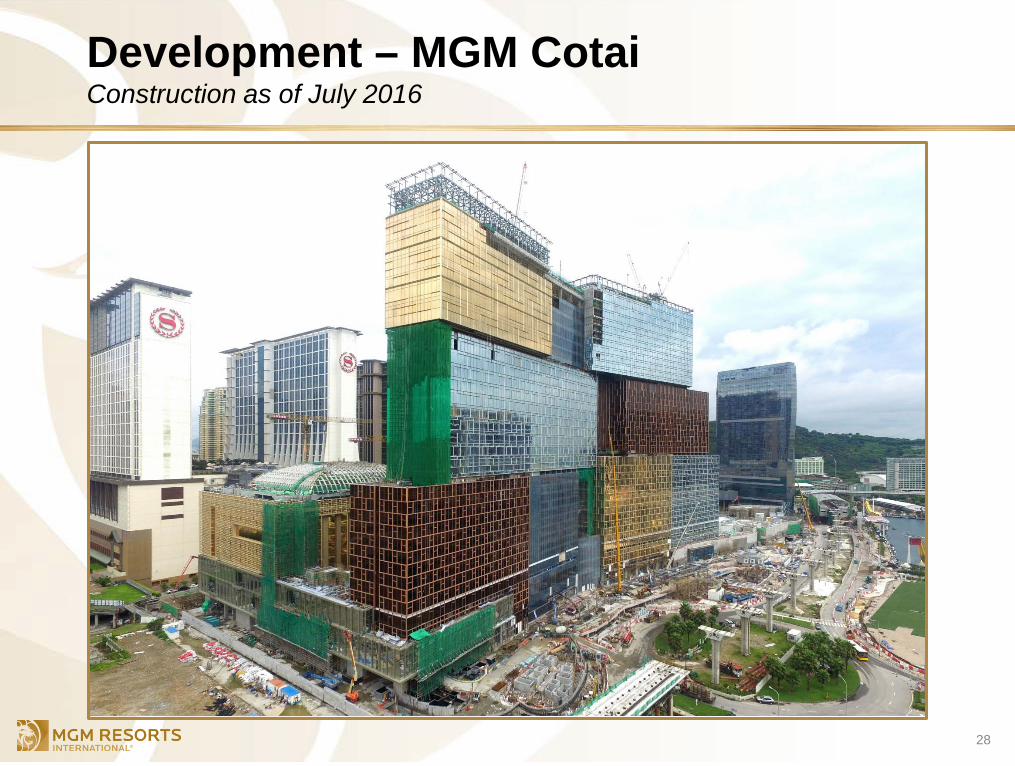
– MGM Cotai: $225 million
– MGM Macau: $7 million
17
Excludes capitalized interest, pre-opening expense and development fees
2016 At A Glance
18
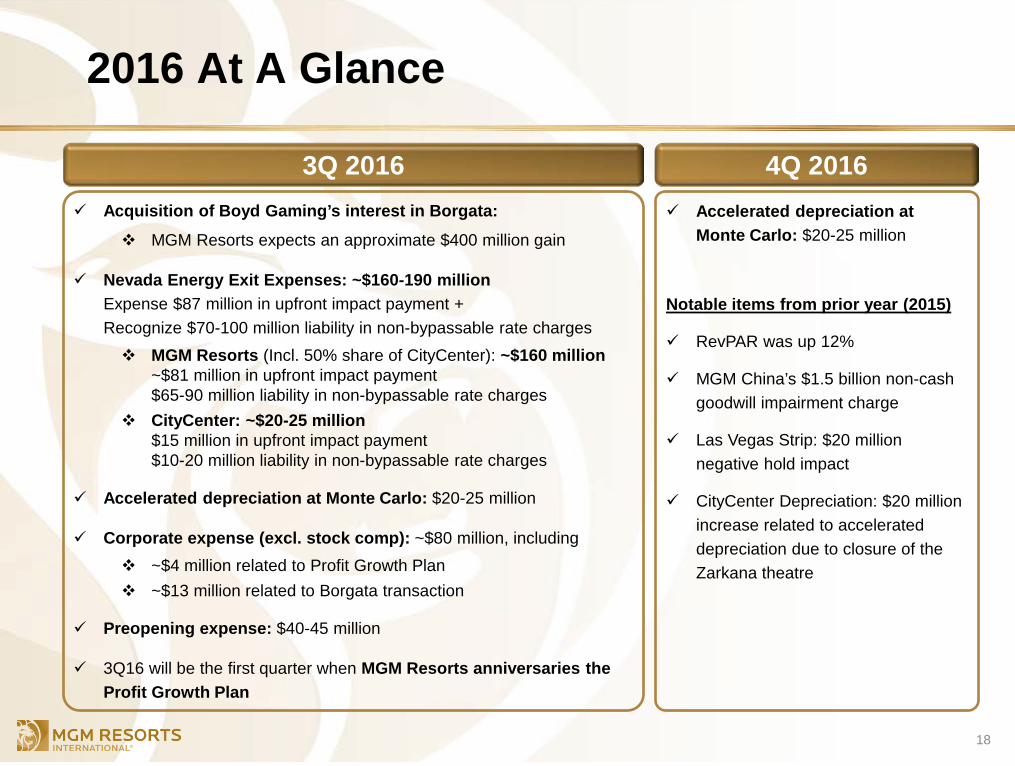
3Q 2016 4Q 2016 Accelerated depreciation at
Monte Carlo: $20-25 million
Notable items from prior year (2015)
RevPAR was up 12%
MGM China’s $1.5 billion non-cash goodwill impairment charge
Las Vegas Strip: $20 million negative hold impact
CityCenter Depreciation: $20 million increase related to accelerated depreciation due to closure of the Zarkana theatre
Acquisition of Boyd Gaming’s interest in Borgata:
MGM Resorts expects an approximate $400 million gain
Nevada Energy Exit Expenses: ~$160-190 million Expense $87 million in upfront impact payment + Recognize $70-100 million liability in non-bypassable rate charges MGM Resorts (Incl. 50% share of CityCenter): ~$160 million
~$81 million in upfront impact payment $65-90 million liability in non-bypassable rate charges
CityCenter: ~$20-25 million $15 million in upfront impact payment $10-20 million liability in non-bypassable rate charges
Accelerated depreciation at Monte Carlo: $20-25 million
Corporate expense (excl. stock comp): ~$80 million, including ~$4 million related to Profit Growth Plan ~$13 million related to Borgata transaction
Preopening expense: $40-45 million
3Q16 will be the first quarter when MGM Resorts anniversaries the Profit Growth Plan
Conclusions from our Analyst & Investor Day: We remain focused on our Strategic Goals
19
Premier operator in the industry
Profit Growth Plan: Strong “One Company” culture with a focus on continuous improvement and operational excellence
Stable and improving balance sheets at all of our entities
Targeted, accretive growth opportunities Continue to invest in existing properties Disciplined approach to new market opportunities
Become an investment grade company once again, positioned to generate significant excess cash
APPENDIX
20
Las Vegas Market Position
MGM Resorts Capital Initiative Projects
MGM Growth Properties
Supplemental Data
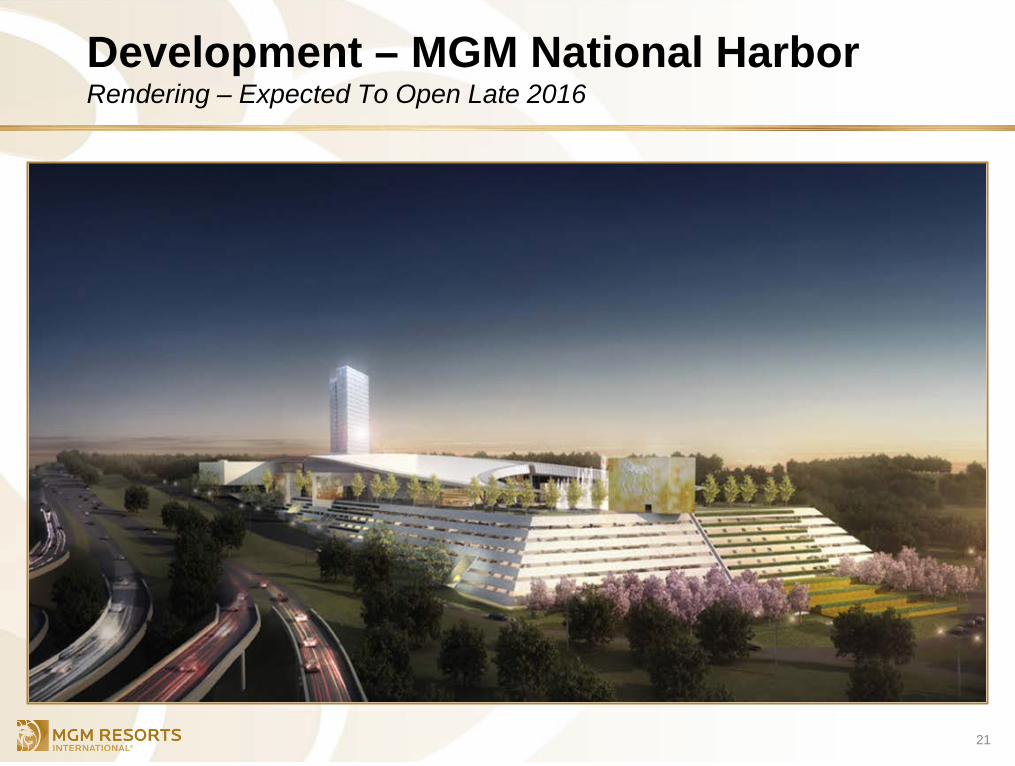
Development – MGM National Harbor Rendering – Expected To Open Late 2016
21
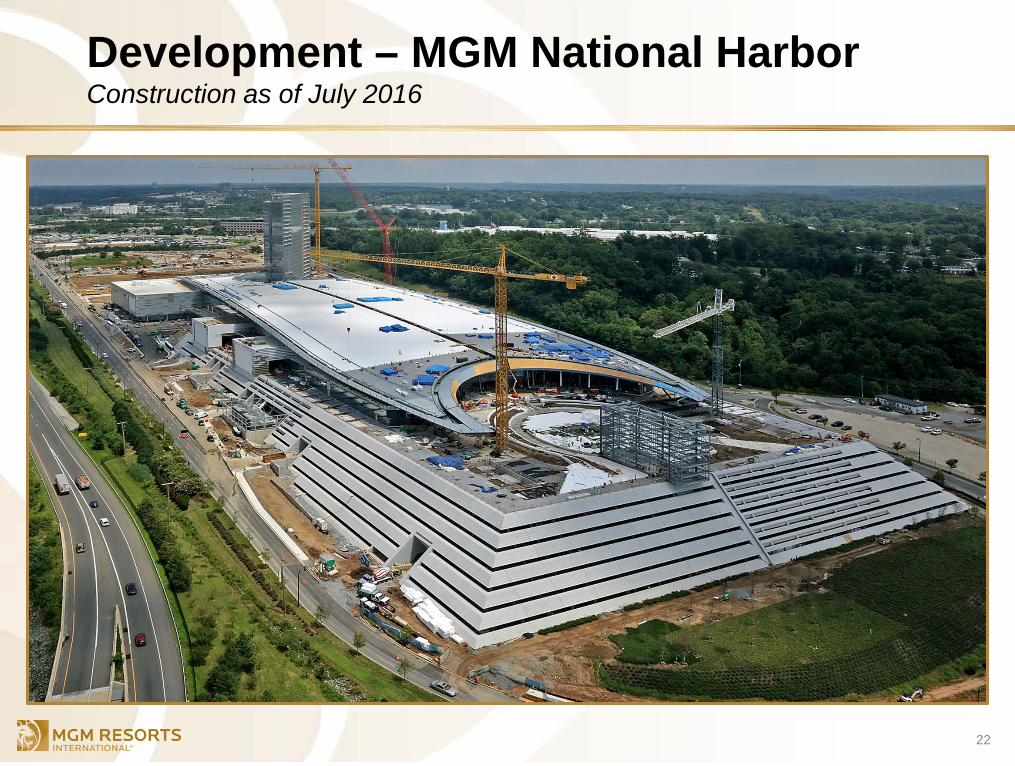
Development – MGM National Harbor Construction as of July 2016
22
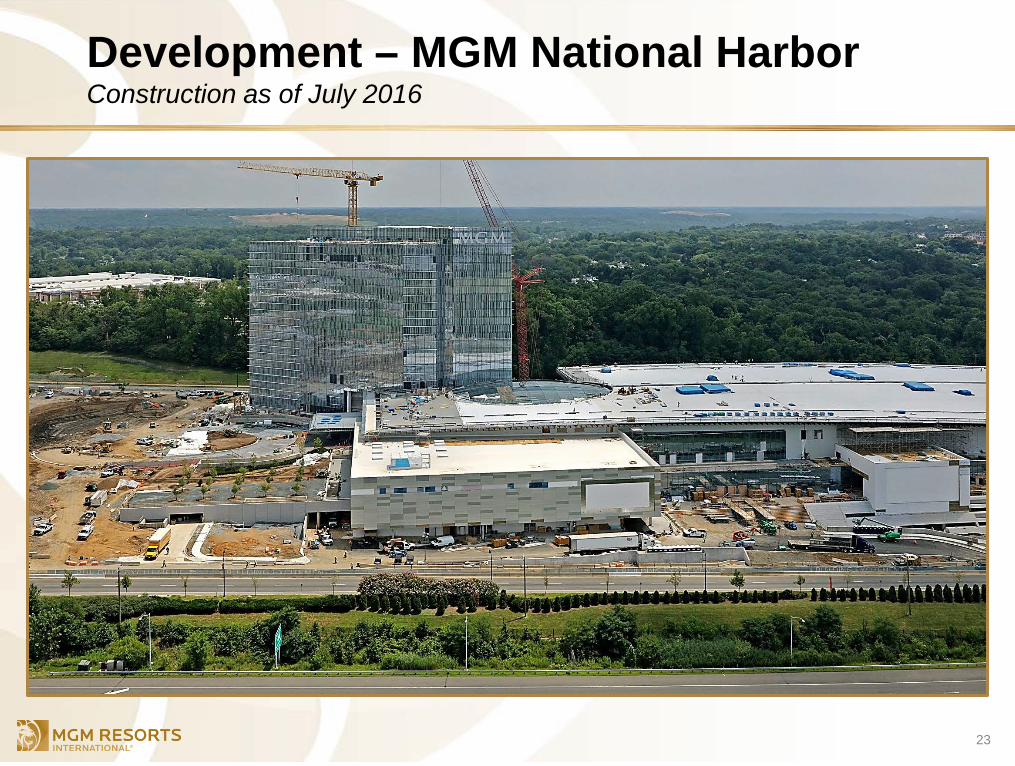
Development – MGM National Harbor Construction as of July 2016
23
24
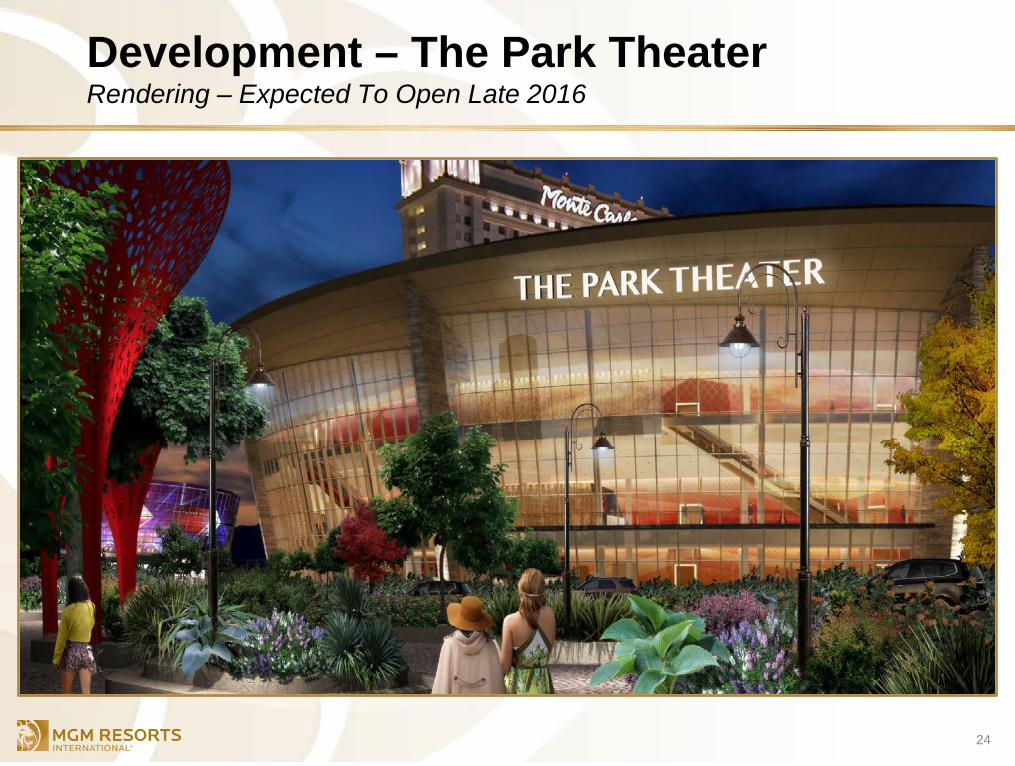
Development – The Park Theater Rendering – Expected To Open Late 2016
25
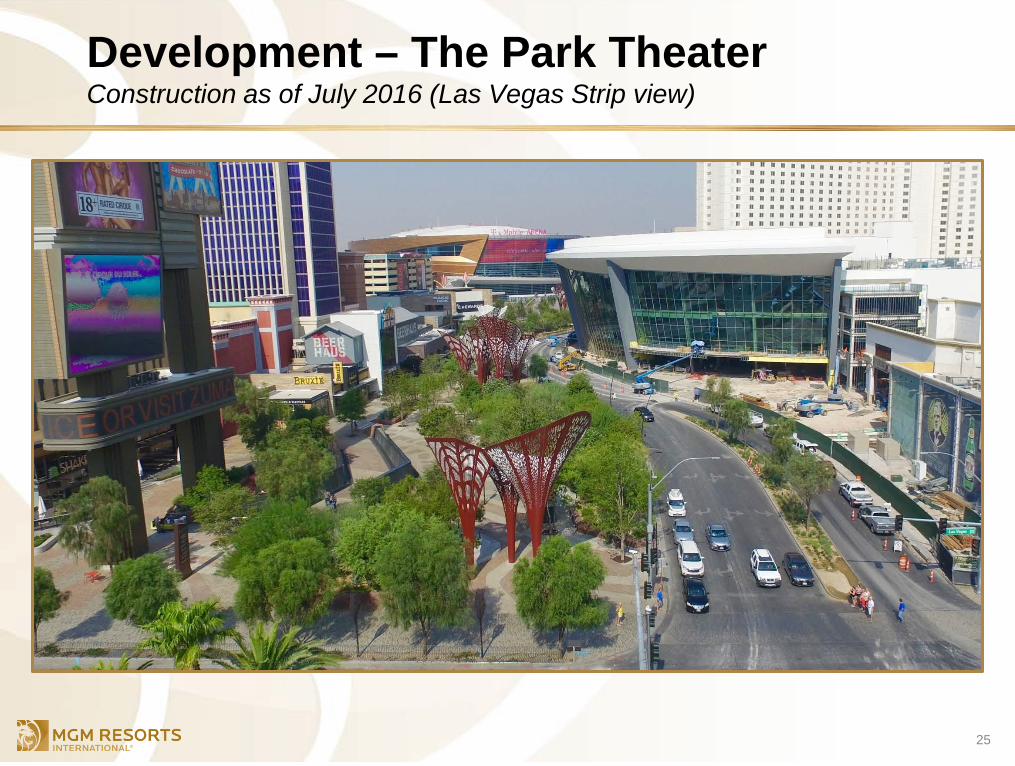
Development – The Park Theater Construction as of July 2016 (Las Vegas Strip view)
26
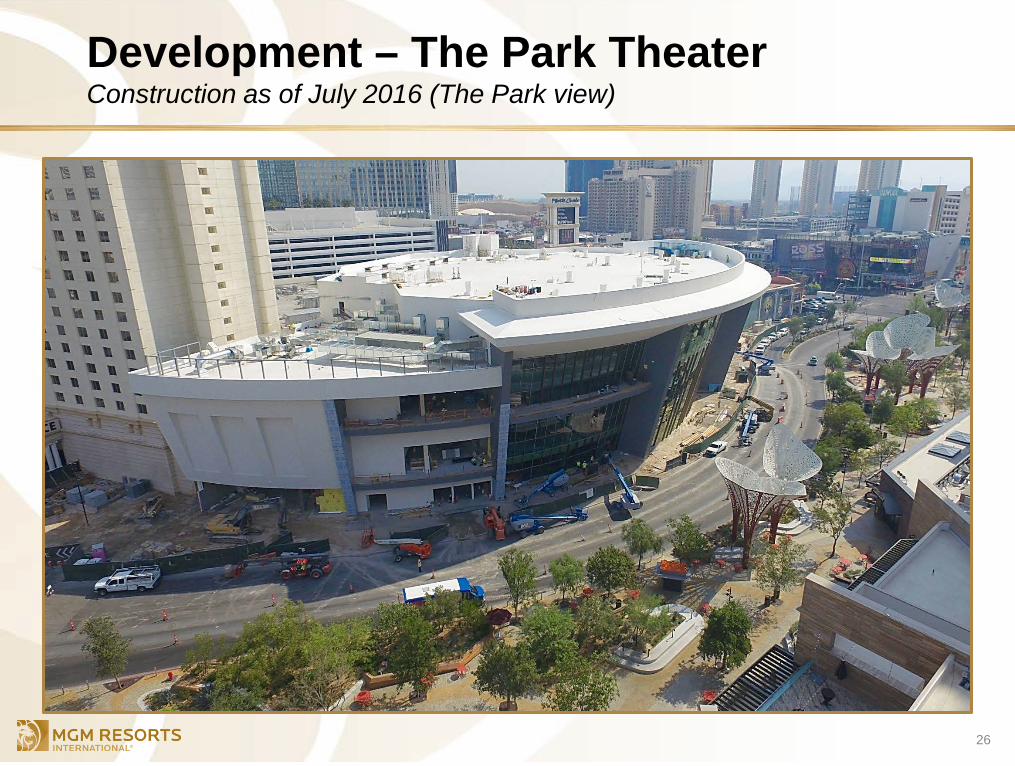
Development – The Park Theater Construction as of July 2016 (The Park view)
27
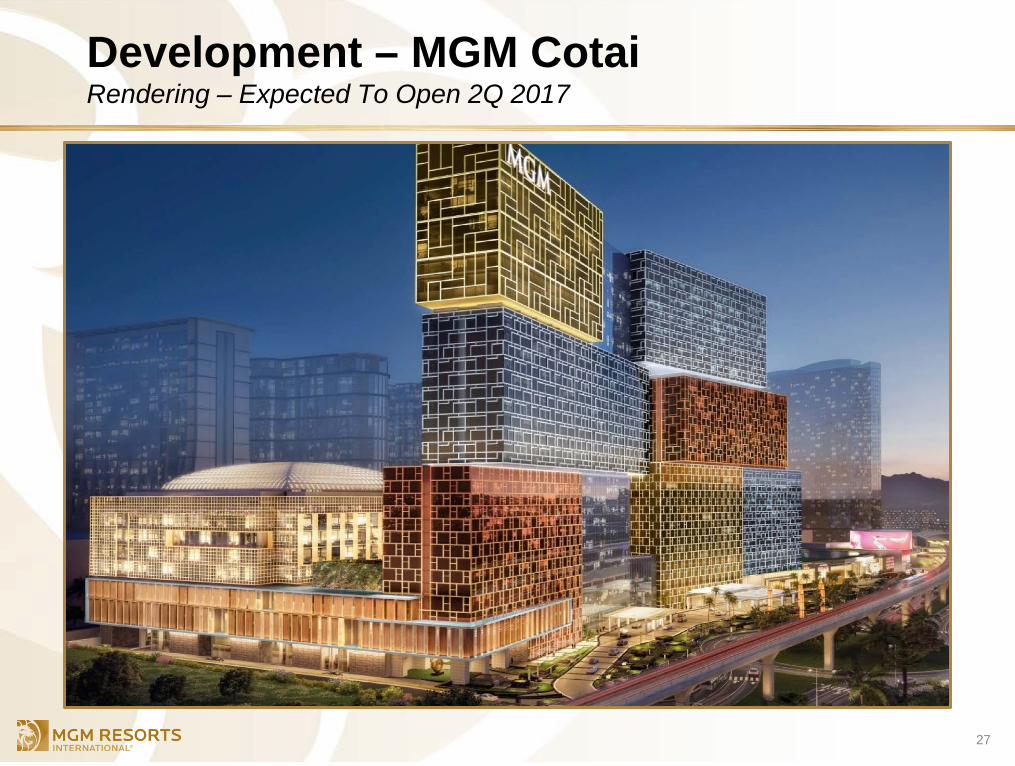
Development – MGM Cotai Rendering – Expected To Open 2Q 2017
28
Development – MGM Cotai Construction as of July 2016
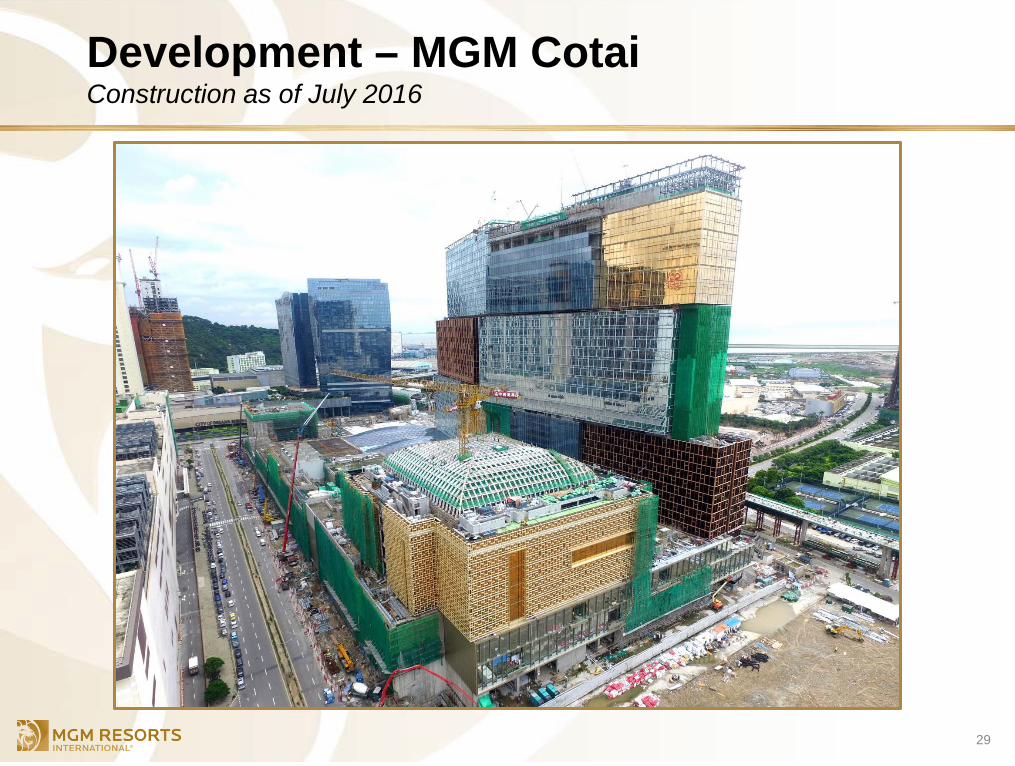
Development – MGM Cotai Construction as of July 2016
29
30
Rebrand – Monte Carlo To Park MGM Rendering of the Hotel Lobby – Expected To Open Late 2018
31
Development – MGM Springfield Rendering – Expected To Open Late 2018
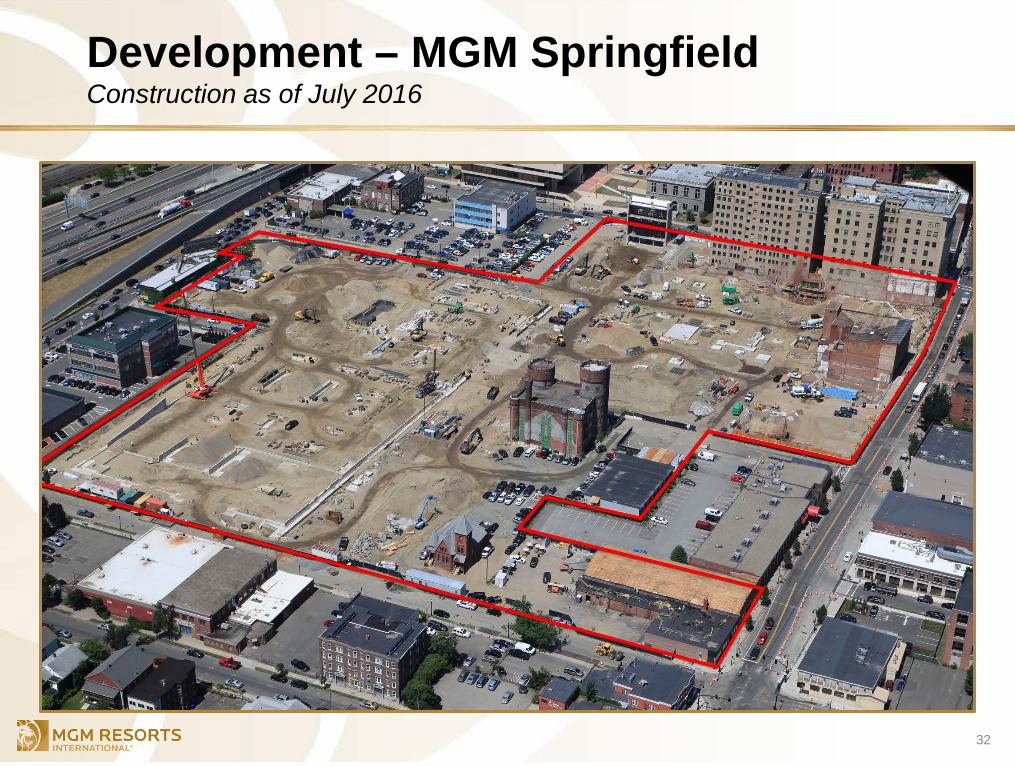
32
Development – MGM Springfield Construction as of July 2016
APPENDIX
33
MGM Resorts Capital Initiative Projects
Las Vegas Market Position
MGM Growth Properties
Supplemental Data
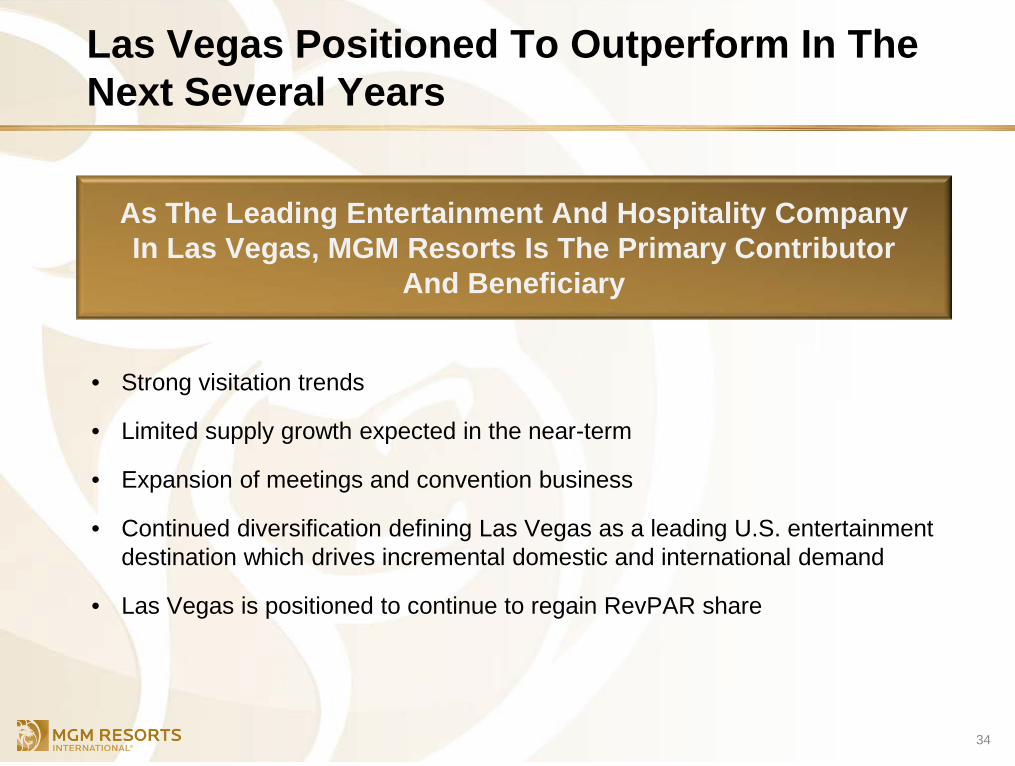
Las Vegas Positioned To Outperform In The Next Several Years
34
As The Leading Entertainment And Hospitality Company In Las Vegas, MGM Resorts Is The Primary Contributor
And Beneficiary
• Strong visitation trends
• Limited supply growth expected in the near-term
• Expansion of meetings and convention business
• Continued diversification defining Las Vegas as a leading U.S. entertainment destination which drives incremental domestic and international demand
• Las Vegas is positioned to continue to regain RevPAR share
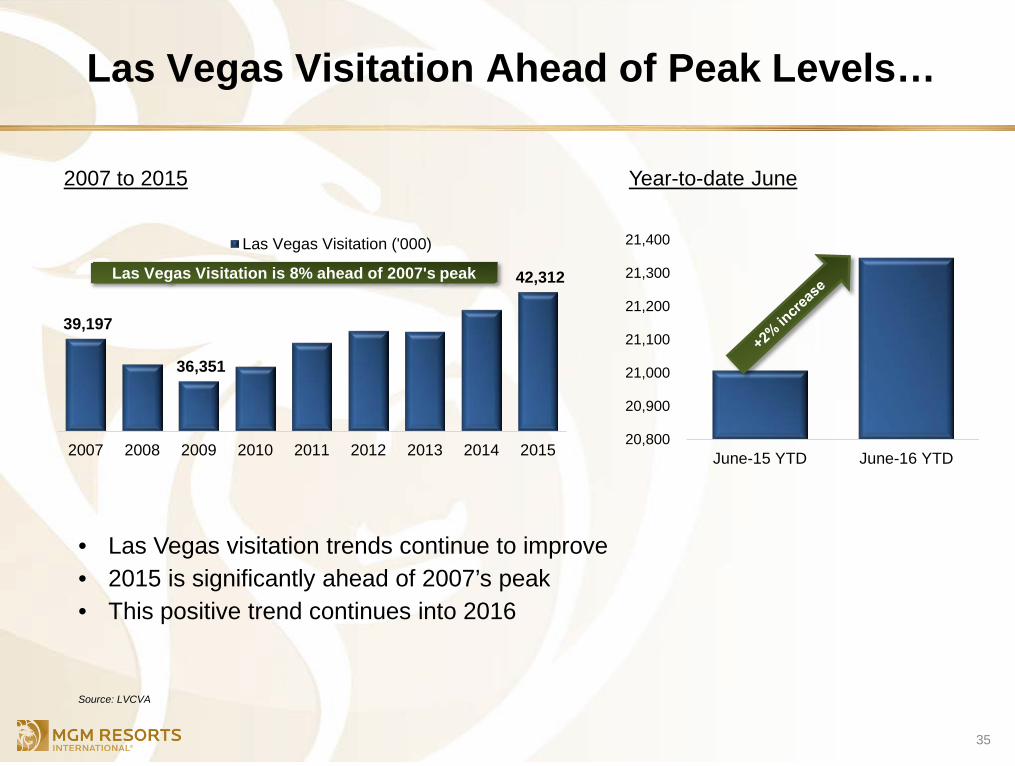
Las Vegas Visitation Ahead of Peak Levels…
35
• Las Vegas visitation trends continue to improve • 2015 is significantly ahead of 2007’s peak • This positive trend continues into 2016
2007 to 2015 Year-to-date June
39,197
36,351
42,312
2007 2008 2009 2010 2011 2012 2013 2014 2015
Las Vegas Visitation ('000)
Las Vegas Visitation is 8% ahead of 2007's peak
20,800
20,900
21,000
21,100
21,200
21,300
21,400
June-15 YTD June-16 YTD
Source: LVCVA
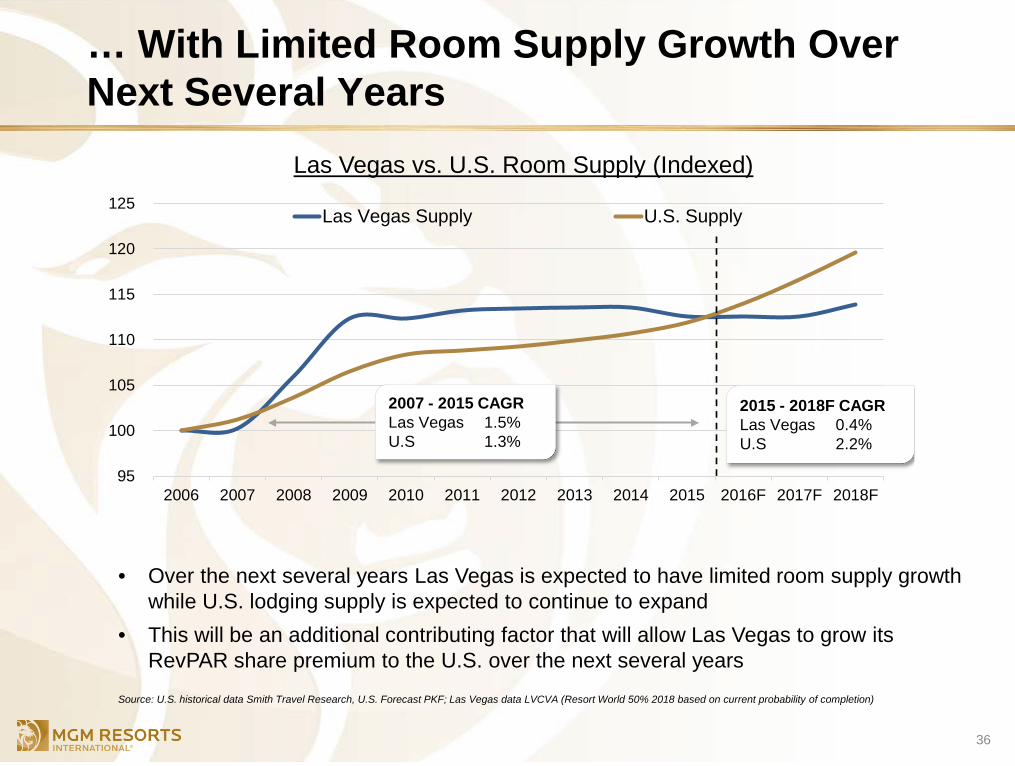
… With Limited Room Supply Growth Over Next Several Years
36
• Over the next several years Las Vegas is expected to have limited room supply growth while U.S. lodging supply is expected to continue to expand
• This will be an additional contributing factor that will allow Las Vegas to grow its RevPAR share premium to the U.S. over the next several years
Source: U.S. historical data Smith Travel Research, U.S. Forecast PKF; Las Vegas data LVCVA (Resort World 50% 2018 based on current probability of completion)
95
100
105
110
115
120
125
2006 2007 2008 2009 2010 2011 2012 2013 2014 2015 2016F 2017F 2018F
Las Vegas Supply U.S. Supply
2007 - 2015 CAGR Las Vegas 1.5% U.S 1.3%
2015 - 2018F CAGR Las Vegas 0.4% U.S 2.2%
Las Vegas vs. U.S. Room Supply (Indexed)
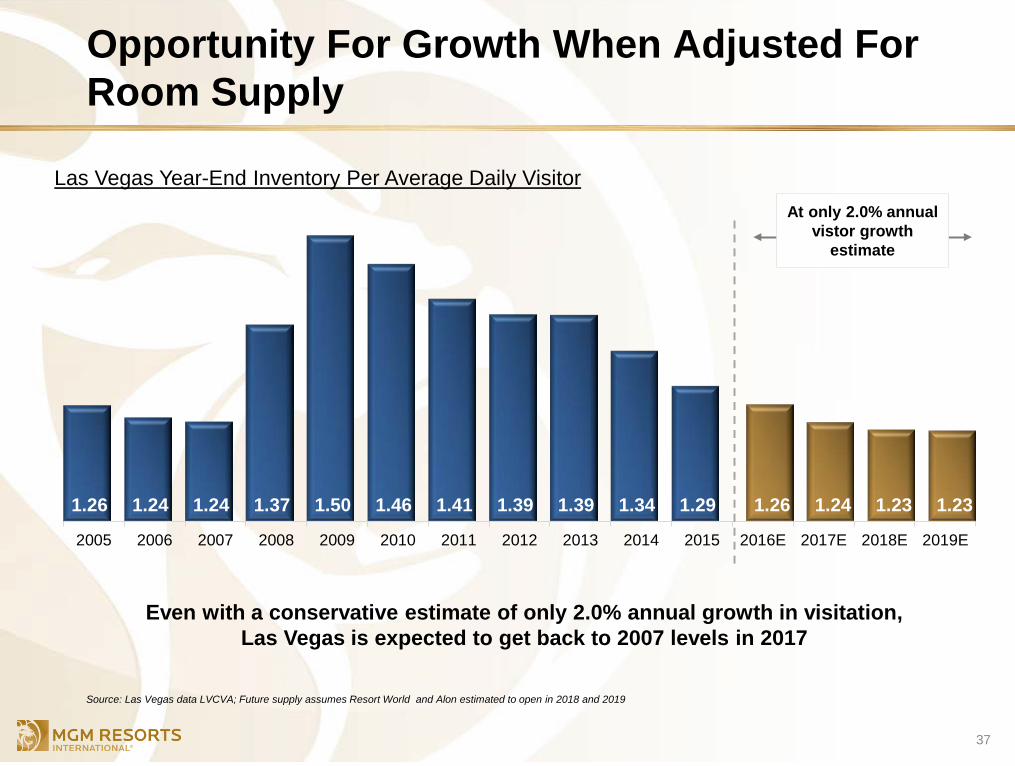
Opportunity For Growth When Adjusted For Room Supply
37
Even with a conservative estimate of only 2.0% annual growth in visitation, Las Vegas is expected to get back to 2007 levels in 2017
Source: Las Vegas data LVCVA; Future supply assumes Resort World and Alon estimated to open in 2018 and 2019
1.26 1.24 1.24 1.37 1.50 1.46 1.41 1.39 1.39 1.34 1.29 1.26 1.24 1.23 1.23
2005 2006 2007 2008 2009 2010 2011 2012 2013 2014 2015 2016E 2017E 2018E 2019E
At only 2.0% annual vistor growth
estimate
Las Vegas Year-End Inventory Per Average Daily Visitor
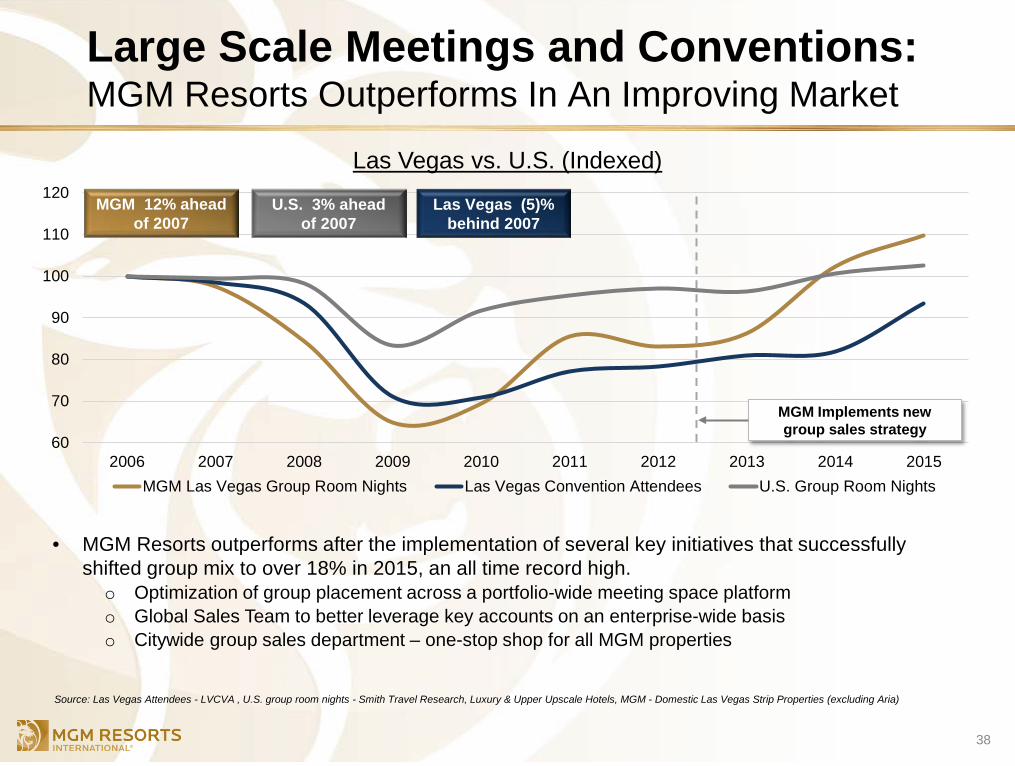
Large Scale Meetings and Conventions: MGM Resorts Outperforms In An Improving Market
38
Las Vegas vs. U.S. (Indexed)
• MGM Resorts outperforms after the implementation of several key initiatives that successfully shifted group mix to over 18% in 2015, an all time record high. o Optimization of group placement across a portfolio-wide meeting space platform o Global Sales Team to better leverage key accounts on an enterprise-wide basis o Citywide group sales department – one-stop shop for all MGM properties
Source: Las Vegas Attendees - LVCVA , U.S. group room nights - Smith Travel Research, Luxury & Upper Upscale Hotels, MGM - Domestic Las Vegas Strip Properties (excluding Aria)
60
70
80
90
100
110
120
2006 2007 2008 2009 2010 2011 2012 2013 2014 2015MGM Las Vegas Group Room Nights Las Vegas Convention Attendees U.S. Group Room Nights
MGM 12% ahead of 2007
Las Vegas (5)% behind 2007
MGM Implements new group sales strategy
U.S. 3% ahead of 2007
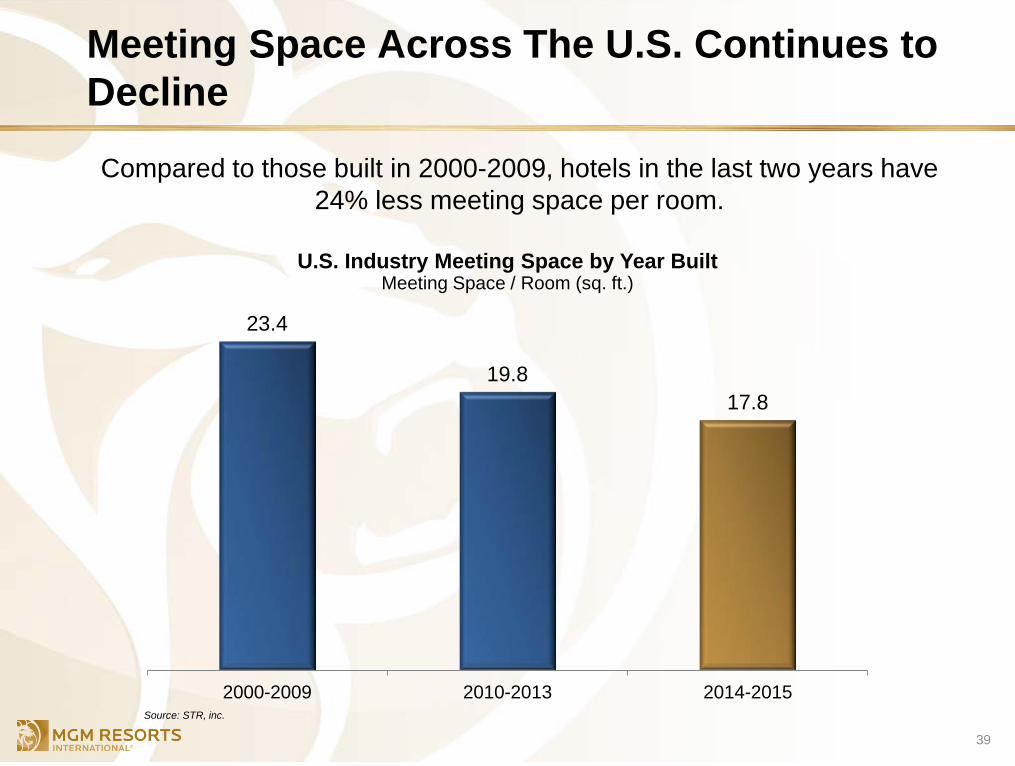
Meeting Space Across The U.S. Continues to Decline
Compared to those built in 2000-2009, hotels in the last two years have 24% less meeting space per room.
39
Source: STR, inc.
23.4
19.8 17.8
2000-2009 2010-2013 2014-2015
U.S. Industry Meeting Space by Year Built Meeting Space / Room (sq. ft.)
Las Vegas Positioned To Continue Regaining RevPAR Share
40
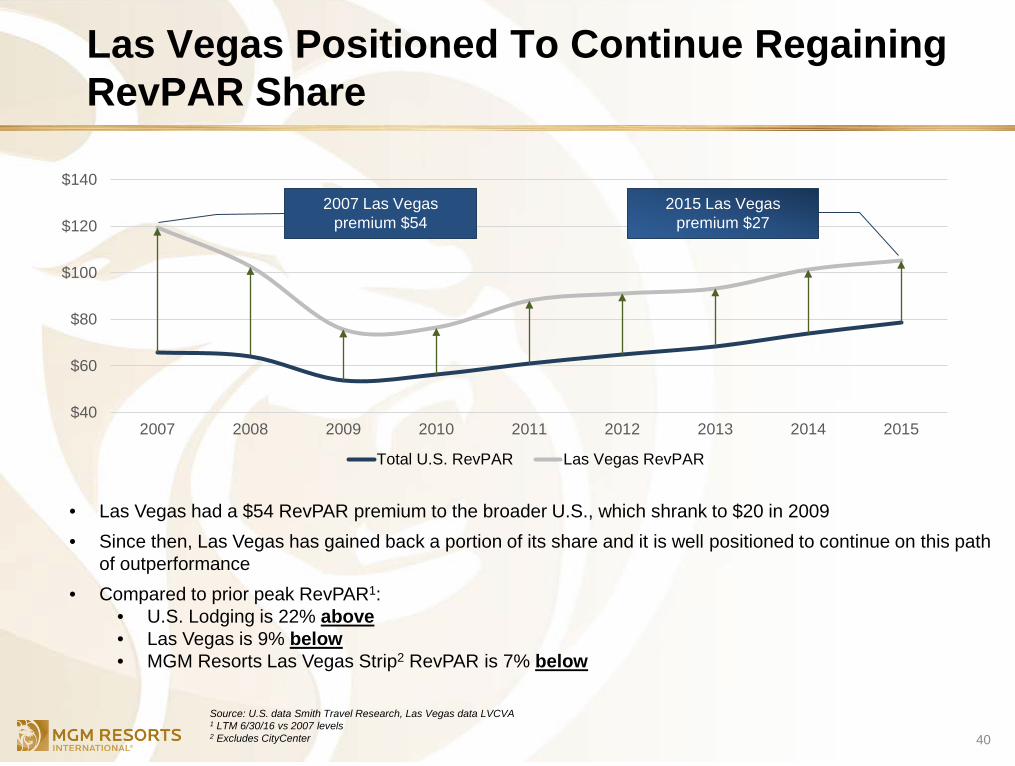
• Las Vegas had a $54 RevPAR premium to the broader U.S., which shrank to $20 in 2009 • Since then, Las Vegas has gained back a portion of its share and it is well positioned to continue on this path
of outperformance • Compared to prior peak RevPAR1:
• U.S. Lodging is 22% above • Las Vegas is 9% below • MGM Resorts Las Vegas Strip2 RevPAR is 7% below
Source: U.S. data Smith Travel Research, Las Vegas data LVCVA 1 LTM 6/30/16 vs 2007 levels 2 Excludes CityCenter
$40
$60
$80
$100
$120
$140
2007 2008 2009 2010 2011 2012 2013 2014 2015
Total U.S. RevPAR Las Vegas RevPAR
2007 Las Vegas premium $54
2015 Las Vegas premium $27
APPENDIX
41
MGM Resorts Capital Initiative Projects
MGM Growth Properties
Las Vegas Market Position
Supplemental Data
MGM Growth Properties
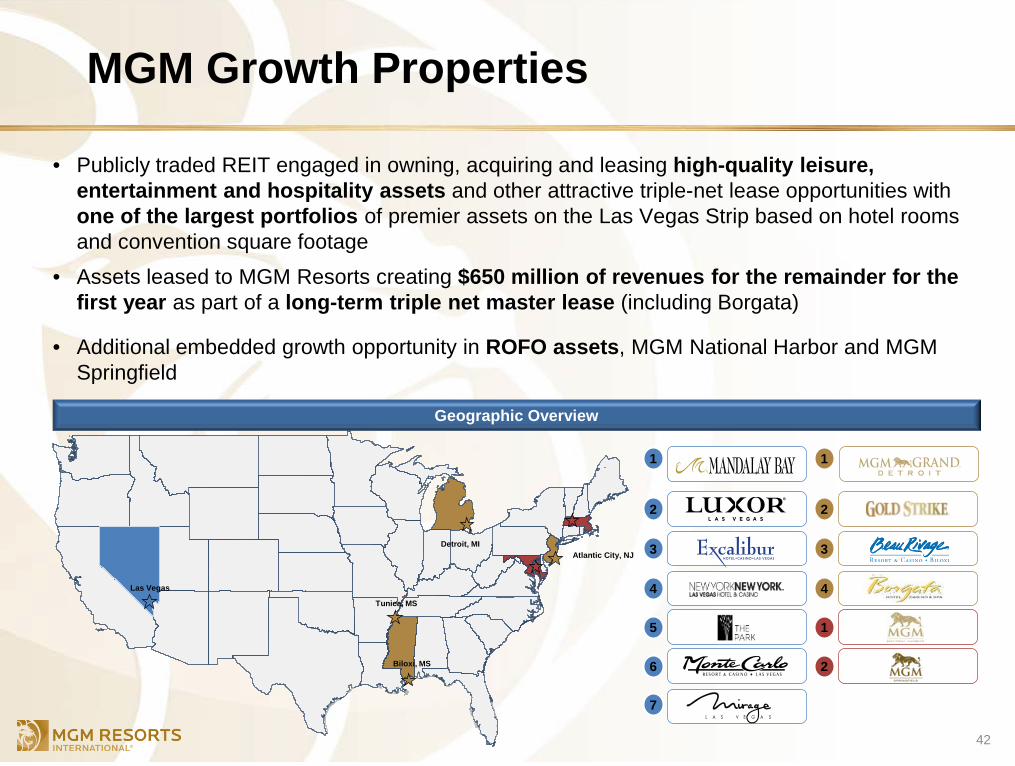
• Publicly traded REIT engaged in owning, acquiring and leasing high-quality leisure, entertainment and hospitality assets and other attractive triple-net lease opportunities with one of the largest portfolios of premier assets on the Las Vegas Strip based on hotel rooms and convention square footage
• Assets leased to MGM Resorts creating $650 million of revenues for the remainder for the first year as part of a long-term triple net master lease (including Borgata)
• Additional embedded growth opportunity in ROFO assets, MGM National Harbor and MGM Springfield
42
Geographic Overview
Las Vegas
Biloxi, MS
Tunica, MS
Detroit, MI Atlantic City, NJ
1
2
3
4
5
6
7
1
2
3
4
1
2
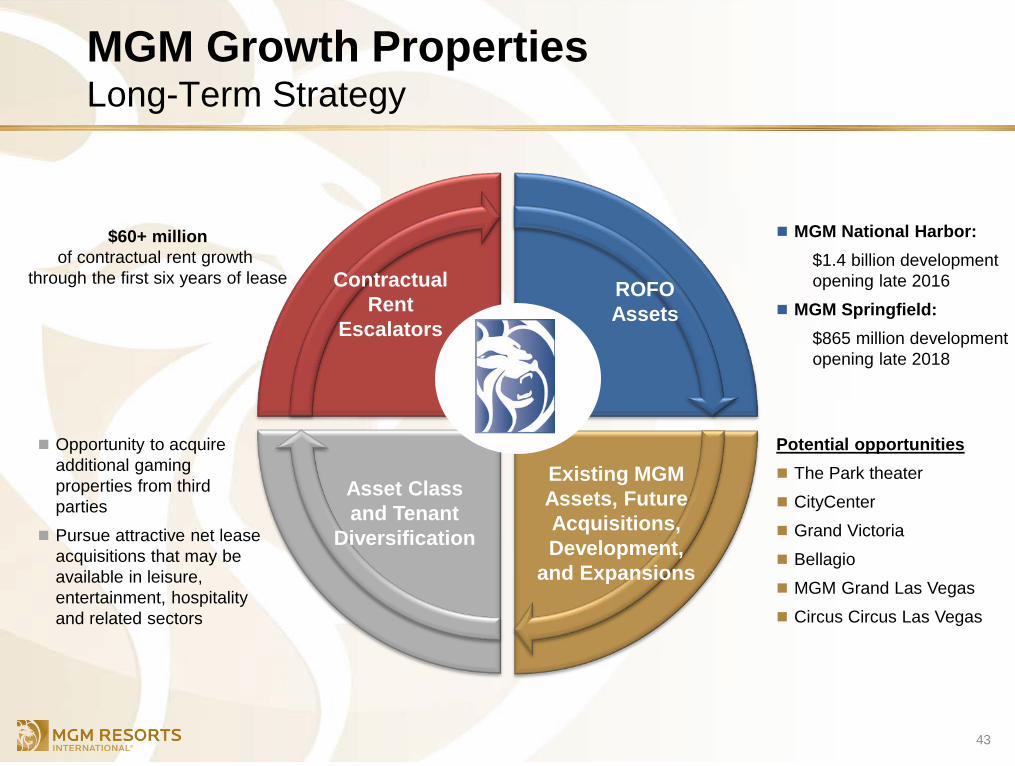
MGM Growth Properties Long-Term Strategy
43
ROFO Assets
Existing MGM Assets, Future Acquisitions, Development,
and Expansions
Asset Class and Tenant
Diversification
Contractual Rent
Escalators
$60+ million
of contractual rent growth through the first six years of lease
Opportunity to acquire additional gaming properties from third parties
Pursue attractive net lease acquisitions that may be available in leisure, entertainment, hospitality and related sectors
Potential opportunities The Park theater
CityCenter
Grand Victoria
Bellagio
MGM Grand Las Vegas
Circus Circus Las Vegas
MGM National Harbor: $1.4 billion development opening late 2016
MGM Springfield: $865 million development opening late 2018
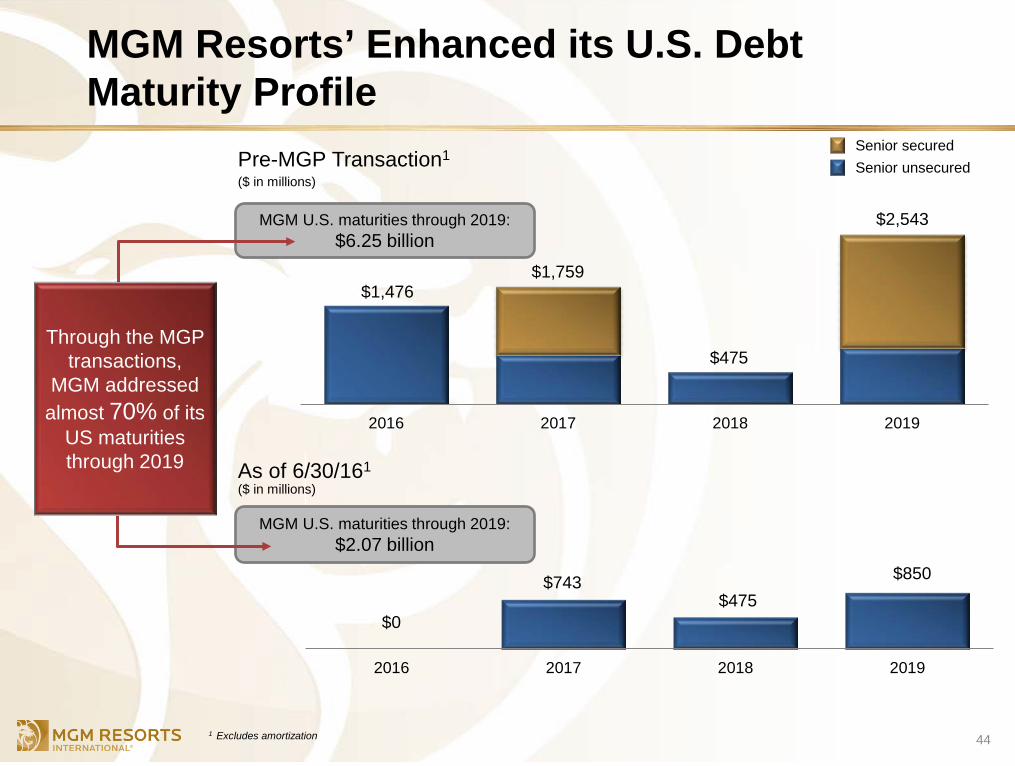
MGM Resorts’ Enhanced its U.S. Debt Maturity Profile
44
$1,476
$475
2016 2017 2018 2019
$743 $475
$850
2016 2017 2018 2019
$1,759
$2,543 MGM U.S. maturities through 2019: $6.25 billion
MGM U.S. maturities through 2019: $2.07 billion
Pre-MGP Transaction1
As of 6/30/161
Through the MGP transactions,
MGM addressed almost 70% of its
US maturities through 2019
Senior secured Senior unsecured
$0
($ in millions)
($ in millions)
1 Excludes amortization
APPENDIX
45
MGM Resorts Capital Initiative Projects
Supplemental Data
Las Vegas Market Position
MGM Growth Properties
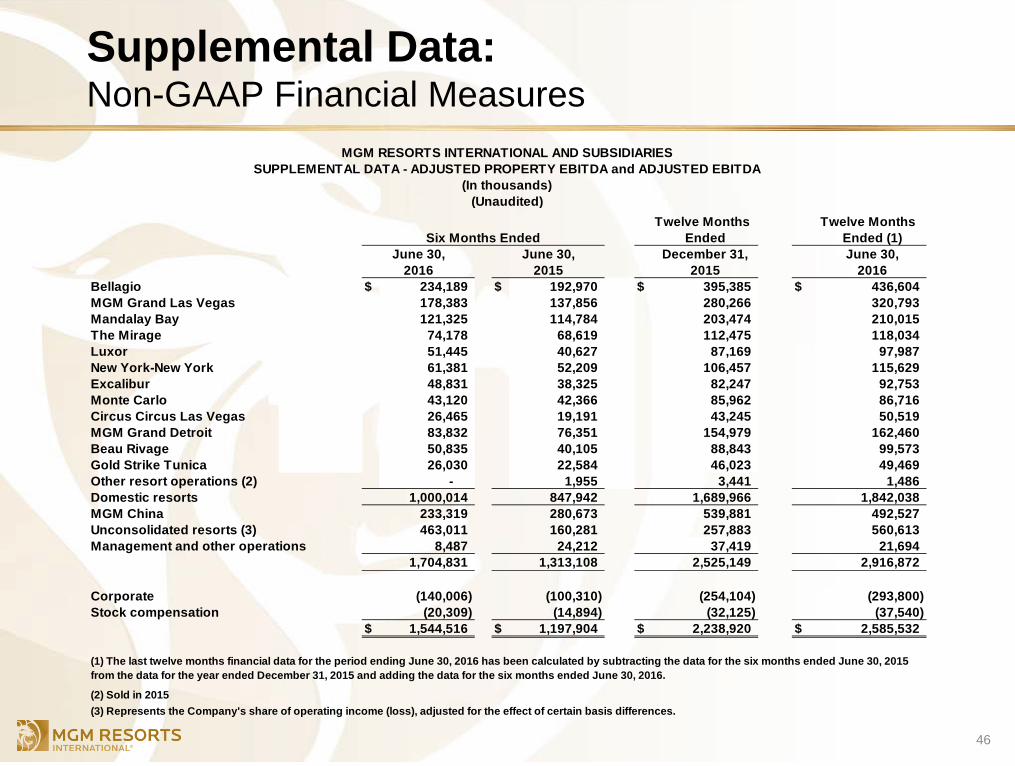
Supplemental Data: Non-GAAP Financial Measures
46
Twelve Months Twelve MonthsEnded Ended (1)
December 31, June 30,2015 2016
Bellagio $ 234,189 $ 192,970 $ 395,385 $ 436,604 MGM Grand Las Vegas 178,383 137,856 280,266 320,793 Mandalay Bay 121,325 114,784 203,474 210,015 The Mirage 74,178 68,619 112,475 118,034 Luxor 51,445 40,627 87,169 97,987 New York-New York 61,381 52,209 106,457 115,629 Excalibur 48,831 38,325 82,247 92,753 Monte Carlo 43,120 42,366 85,962 86,716 Circus Circus Las Vegas 26,465 19,191 43,245 50,519 MGM Grand Detroit 83,832 76,351 154,979 162,460 Beau Rivage 50,835 40,105 88,843 99,573 Gold Strike Tunica 26,030 22,584 46,023 49,469 Other resort operations (2) - 1,955 3,441 1,486 Domestic resorts 1,000,014 847,942 1,689,966 1,842,038 MGM China 233,319 280,673 539,881 492,527 Unconsolidated resorts (3) 463,011 160,281 257,883 560,613 Management and other operations 8,487 24,212 37,419 21,694
1,704,831 1,313,108 2,525,149 2,916,872
Corporate (140,006) (100,310) (254,104) (293,800) Stock compensation (20,309) (14,894) (32,125) (37,540)
$ 1,544,516 $ 1,197,904 $ 2,238,920 $ 2,585,532
MGM RESORTS INTERNATIONAL AND SUBSIDIARIESSUPPLEMENTAL DATA - ADJUSTED PROPERTY EBITDA and ADJUSTED EBITDA
(In thousands)(Unaudited)
Six Months Ended
(1) The last twelve months financial data for the period ending June 30, 2016 has been calculated by subtracting the data for the six months ended June 30, 2015 from the data for the year ended December 31, 2015 and adding the data for the six months ended June 30, 2016.
(3) Represents the Company's share of operating income (loss), adjusted for the effect of certain basis differences. (2) Sold in 2015
June 30, June 30,2016 2015