MFS Funds Annual report For the year ... - Equity Trustees€¦ · Trust and MFS Global Equity...
67
MFS Funds Annual report For the year ended 30 June 2019 This financial report covers the following MFS Funds: MFS Fully Hedged Global Equity Trust ARSN 112 310 442 MFS Global Equity Trust ARSN 093 197 221 MFS Emerging Markets Equity Trust ARSN 157 689 668
Transcript of MFS Funds Annual report For the year ... - Equity Trustees€¦ · Trust and MFS Global Equity...

MFS FundsAnnual reportFor the year ended 30 June 2019This financial report covers the following MFS Funds:
MFS Fully Hedged Global Equity TrustARSN 112 310 442
MFS Global Equity TrustARSN 093 197 221
MFS Emerging Markets Equity TrustARSN 157 689 668

MFS FundsAnnual reportFor the year ended 30 June 2019Contents
Directors’ reportAuditor’s independence declarationStatements of comprehensive incomeStatements of financial positionStatements of changes in equityStatements of cash flowsNotes to the financial statementsDirectors’ declarationIndependent auditor’s report to the unit holders of MFS Funds
This annual report covers the following Funds as individual entities:
MFS Fully Hedged Global Equity Trust
MFS Global Equity Trust
MFS Emerging Markets Equity Trust
The Responsible Entity of the Funds is Equity Trustees Limited (ABN 46 004 031 298) (AFSL 240975).
The Responsible Entity’s registered office is:Level 1, 575 Bourke StreetMelbourne, VIC 3000.
-1-

Directors’ report
The directors of Equity Trustees Limited, the Responsible Entity of the MFS Funds (the “Funds”), present their report together with the financial statements of the following Fundsfor the year ended 30 June 2019.
MFS Fully Hedged Global Equity Trust
MFS Global Equity Trust
MFS Emerging Markets Equity Trust
The Funds are collectively known as “MFS Funds”.
Principal activities
The principal activity of each Fund is to invest in accordance with the investment objective and guidelines as set out in the respective Funds’ current Product Disclosure Statementand its Constitution.
The Funds did not have any employees during the year.
There were no significant changes in the nature of the Funds’ activities during the year.
The various service providers for the Funds are detailed below:
Service Provider
Responsible Entity Equity Trustees Limited
Investment Manager MFS International Australia Pty Ltd
Custodian and Administrator State Street Australia Limited
Statutory Auditor Deloitte Touche Tohmatsu
Directors
The following persons held office as directors of Equity Trustees Limited during or since the end of the year and up to the date of this report:
Philip D Gentry (Chairman)
Harvey H Kalman
Ian C Westley
Michael J O’Brien (appointed 11 July 2018)
MFS FundsDirectors’ report
30 June 2019
-2-

Directors’ report (continued)
Review and results of operations
During the year, the Funds continued to invest their funds in accordance with the Product Disclosure Statement and the provisions of the Funds’ Constitution.
The Funds’ performance and Funds’ benchmark return for the year ended 30 June 2019 were as follows:
Fund name BenchmarkNet return(net of fees)
Benchmarkreturn
MFS Fully Hedged Global Equity TrustMSCI World Index (with net dividends reinvested beforefees) fully hedged in AUD 13.09% 6.36%
MFS Global Equity TrustMSCI World Index (with net dividends reinvested beforefees) 17.64% 11.95%
MFS Emerging Markets Equity TrustMSCI Emerging Markets Index (with net dividendsreinvested before fees) 5.90% 6.56%
The performance of each Fund, as represented by the results of their operations, was as follows:
MFS Fully Hedged GlobalEquity Trust MFS Global Equity Trust
MFS Emerging MarketsEquity Trust
Year ended Year ended Year ended30 June
201930 June
201830 June
201930 June
201830 June
201930 June
2018
Operating profit/(loss) for the year ($’000) 109,081 50,644 1,171,821 636,410 19,000 64,353
Distributions paid and payable ($’000) - 90,000 943,364 684,676 54,242 35,533
Distributions (cents per unit)* - 9.23 23.41 20.35 6.76 11.31
*Distributions (cents per unit) excludes special distributions paid during the year.
The basis for valuation of the Funds’ assets is disclosed in Note 2 to the financial statements.
MFS FundsDirectors’ report
30 June 2019(continued)
-3-

Directors’ report (continued)
Significant changes in the state of affairs
The Funds have amended their Constitutions to change the obligation to distribute trust income to unit holders effective 1 July 2018 as part of a process to become eligible to electinto the new Attribution Managed Investment Trust (“AMIT”) tax regime.
Michael J O’Brien was appointed as a director of Equity Trustees Limited on 11 July 2018.
In the opinion of the directors, there were no other significant changes in the state of affairs of the Funds that occurred during the financial year.
Matters subsequent to the end of the financial year
No matter or circumstance has arisen since 30 June 2019 that has significantly affected, or may have a significant effect on:
(i) the operations of the Funds in future financial years;(ii) the results of those operations in future financial years; or(iii) the state of affairs of the Funds in future financial years.
Likely developments and expected results of operations
The Funds will continue to be managed in accordance with the investment objectives and guidelines as set out in the Product Disclosure Statement and the provisions of the Funds’Constitution.
The results of the Funds’ operations will be affected by a number of factors, including the performance of investment markets in which the Funds invest. Investment performance isnot guaranteed and future returns may differ from past returns. As investment conditions change over time, past returns should not be used to predict future returns.
Indemnification and insurance of officers
No insurance premiums are paid for out of the assets of the Funds in regards to insurance cover provided to the officers of Equity Trustees Limited. So long as the officers ofEquity Trustees Limited act in accordance with the Funds’ Constitution and the Law, the officers remain indemnified out of the assets of the Funds against losses incurred whileacting on behalf of the Funds.
Indemnification of auditor
The auditor of the Funds is in no way indemnified out of the assets of the Funds.
MFS FundsDirectors’ report
30 June 2019(continued)
-4-

Directors’ report (continued)
Fees paid to and interests held in the Funds by the Responsible Entity and its associates
Fees paid to the Responsible Entity and its associates out of Funds’ property during the year are disclosed in Note 18 to the financial statements.
No fees were paid out of Funds’ property to the directors of the Responsible Entity during the year.
The number of interests in the Funds held by the Responsible Entity or its associates as at the end of the financial year are disclosed in Note 18 to the financial statements.
Interests in the Funds
The movement in units on issue in the Funds during the year is disclosed in Note 11 to the financial statements.
The value of the Funds’ assets and liabilities is disclosed in the statement of financial position and derived using the basis set out in Note 2 to the financial statements.
Environmental regulation
The operations of the Funds are not subject to any particular or significant environmental regulations under Commonwealth, State or Territory law.
Rounding of amounts to the nearest thousand dollars
Amounts in the Directors’ report have been rounded to the nearest thousand dollars in accordance with ASIC Corporations (Rounding in Financial/Directors’ Reports) Instrument2016/191, unless otherwise indicated.
Financial statements presentation
The Funds are entities of the kind referred to in ASIC Corporations (Related Scheme Reports) Instrument 2015/839 and in accordance with that Instrument, Funds with a commonResponsible Entity (or related Responsible Entities) can include their financial reports in adjacent columns in a single set of financial reports.
MFS FundsDirectors’ report
30 June 2019(continued)
-5-

Directors’ report (continued)
Auditor’s independence declaration
A copy of the Auditor’s independence declaration as required under section 307C of the Corporations Act 2001 is set out on page 7.
This report is made in accordance with a resolution of the directors of Equity Trustees Limited through a delegated authority given by Equity Trustees Limited’s Board.
Philip D GentryChairman
Melbourne12 September 2019
MFS FundsDirectors’ report
30 June 2019(continued)
-6-

Liability limited by a scheme approved under Professional Standards Legislation.
Member of Deloitte Asia Pacific Limited and the Deloitte Network.
Deloitte Touche Tohmatsu
ABN 74 490 121 060
550 Bourke Street
Melbourne VIC 3000
GPO Box 78
Melbourne VIC 3001 Australia
Tel: +61 3 9671 7000
Fax: +61 3 9671 7001
www.deloitte.com.au
12 September 2019
The Board of Directors
Equity Trustees Limited
Level 1, 575 Bourke Street
MELBOURNE VIC 3000
Dear Board Members,
Independence Declaration – MFS Funds
In accordance with section 307C of the Corporations Act 2001, I am pleased to provide the following
declaration of independence to the Directors of Equity Trustees Limited, the Responsible Entity,
regarding the financial reports of MFS Emerging Markets Equity Trust, MFS Fully Hedged Global Equity
Trust and MFS Global Equity Trust (collectively the “MFS Funds” or the “Funds”).
As lead audit partner for the audits of the financial statements of the Funds for the financial year
ended 30 June 2019, I declare that to the best of my knowledge and belief, there have been no
contraventions of:
(i) the auditor independence requirements of the Corporations Act 2001 in relation to the audit;
and
(ii) any applicable code of professional conduct in relation to the audit.
Yours faithfully
DELOITTE TOUCHE TOHMATSU
Chester Hii
Partner
Chartered Accountants

Statements of comprehensive income
MFS Fully Hedged GlobalEquity Trust MFS Global Equity Trust
MFS Emerging MarketsEquity Trust
Year ended Year ended Year ended30 June
201930 June
201830 June
201930 June
201830 June
201930 June
2018Note $ ’000 $ ’000 $ ’000 $ ’000 $ ’000 $ ’000
Investment incomeInterest income from financial assets at amortised cost 1 3 22 25 - -Dividend and distribution income 91,687 88,842 163,206 156,293 9,671 8,694Net foreign exchange gain/(loss) - - 3,280 5,480 437 (161)Net gains/(losses) on financial instruments at fair value through profit or loss 6 17,633 (37,878) 1,080,668 549,382 13,823 61,396Other income - - 5 - 75 17Total investment income/(loss) 109,321 50,967 1,247,181 711,180 24,006 69,946
ExpensesManagement fees 18 152 206 54,791 55,056 3,262 3,711Custody and administration fees 65 71 245 411 239 271Withholding taxes - - 19,309 17,634 829 1,098Transaction costs - - 951 1,618 641 448Other expenses 23 46 64 51 35 65Total expenses 240 323 75,360 74,770 5,006 5,593
Operating profit/(loss) for the year 109,081 50,644 1,171,821 636,410 19,000 64,353
Finance costs attributable to unit holdersDistributions to unit holders* 12 - (90,000) - (684,676) - (35,533)(Increase)/decrease in net assets attributable to unit holders 11 - 39,356 - 48,266 - (28,820)
Profit/(loss) for the year 11 109,081 - 1,171,821 - 19,000 -
Other comprehensive income - - - - - -Total comprehensive income for the year 109,081 - 1,171,821 - 19,000 -
* Net assets attributable to unit holders are reclassified from liabilities to equity from 1 July 2018. As a result, the Fund’s distributions are no longer classified as finance costs in thestatement of comprehensive income, but rather as distributions paid and payable in the statement of changes in equity. Refer to Note 1 and Note 11 for further detail.
The above statements of comprehensive income should be read in conjunction with the accompanying notes.
MFS FundsStatements of comprehensive income
For the year ended 30 June 2019
-8-

Statements of financial position
MFS Fully Hedged GlobalEquity Trust MFS Global Equity Trust
MFS Emerging MarketsEquity Trust
As at As at As at30 June
201930 June
201830 June
201930 June
201830 June
201930 June
2018Note $ ’000 $ ’000 $ ’000 $ ’000 $ ’000 $ ’000
AssetsCash and cash equivalents 13 1,016 1,055 57,333 113,295 3,557 342Receivables 15 92,153 88,863 24,559 26,800 1,361 1,288Due from brokers - receivable for securities sold 264 883 6,980 7,675 169 697Financial assets at fair value through profit or loss 7 834,731 873,966 7,179,637 7,312,645 330,440 459,376Total assets 928,164 964,767 7,268,509 7,460,415 335,527 461,703
LiabilitiesBank Overdraft 13(a) - - - - - 844Distributions payable 12 - 90,000 720,123 684,676 15,806 35,533Payables 16 1,518 1,916 12,940 9,397 379 730Due to brokers - payable for securities purchased 184 - 10,921 32,378 - 283Financial liabilities at fair value through profit or loss 8 5,174 26,417 - 47 - -Total liabilities (excluding net assets attributable to unit holders) 6,876 118,333 743,984 726,498 16,185 37,390
Net assets attributable to unit holders - liability* 11 - 846,434 - 6,733,917 - 424,313
Net assets attributable to unit holders - equity* 11 921,288 - 6,524,525 - 319,342 -
* Net assets attributable to unit holders are classified as equity at 30 June 2019 and as a financial liability at 30 June 2018. Refer to Note 1 for further detail.
The above statements of financial position should be read in conjunction with the accompanying notes.
MFS FundsStatements of financial position
As at 30 June 2019
-9-

Statements of changes in equity
MFS Fully Hedged GlobalEquity Trust MFS Global Equity Trust
MFS Emerging MarketsEquity Trust
Year ended Year ended Year ended30 June
201930 June
201830 June
201930 June
201830 June
201930 June
2018Note $ ’000 $ ’000 $ ’000 $ ’000 $ ’000 $ ’000
Total equity at the beginning of the financial year - - - - - -Reclassification due to AMIT tax regime implementation* 11 846,434 - 6,733,917 - 424,313 -Total beginning balance 846,434 - 6,733,917 - 424,313 -
Comprehensive income for the yearProfit/(loss) for the year 109,081 - 1,171,821 - 19,000 -Other comprehensive income - - - - - -Total comprehensive income 109,081 - 1,171,821 - 19,000 -
Transactions with unit holdersApplications 11 185,071 - 775,184 - 24,976 -Redemptions 11 (251,727) - (1,666,799) - (128,268) -Reinvestment of distributions 11 32,429 - 453,766 - 33,563 -Distributions paid and payable 11 - - (943,364) - (54,242) -Total transactions with unit holders (34,227) - (1,381,213) - (123,971) -
Total equity at the end of the financial year* 921,288 - 6,524,525 - 319,342 -
* Effective from 1 July 2018, the Funds’ units have been reclassified from financial liability to equity. Refer to Note 1 and Note 11 for further detail. As a result, equity transactions,including distributions have been disclosed in the above statements for the year ended 30 June 2019.
The above statements of changes in equity should be read in conjunction with the accompanying notes.
MFS FundsStatements of changes in equityFor the year ended 30 June 2019
-10-
Statements of cash flows
MFS Fully Hedged GlobalEquity Trust MFS Global Equity Trust
MFS Emerging MarketsEquity Trust
Year ended Year ended Year ended30 June
201930 June
201830 June
201930 June
201830 June
201930 June
2018Note $ ’000 $ ’000 $ ’000 $ ’000 $ ’000 $ ’000
Cash flows from operating activitiesProceeds from sale of financial instruments at fair value through profit or loss 254,029 287,589 1,348,170 1,408,837 261,859 117,947Purchase of financial instruments at fair value through profit or loss (217,601) (333,691) (155,303) (806,697) (118,855) (120,271)Net foreign exchange gain/(loss) - - 4,170 4,092 484 (291)Interest received 1 3 22 25 - -Dividends and distributions received 88,842 107,779 146,019 134,838 8,489 7,658Other income received 4 - 1 - 68 17Management fees paid (152) (156) (55,112) (54,524) (3,364) (3,484)Custody and administration fees paid (65) (116) (226) (650) (246) (417)Other expenses paid (37) (53) (1,063) (1,643) (631) (567)Net cash inflow/(outflow) from operating activities 14(a) 125,021 61,355 1,286,678 684,278 147,804 592
Cash flows from financing activitiesProceeds from applications by unit holders 184,623 285,856 775,184 1,120,211 24,976 7,630Payments for redemptions by unit holders (252,112) (234,001) (1,662,783) (1,515,761) (128,268) (11,196)Distributions paid to unit holders (57,571) (113,669) (454,151) (274,903) (40,406) (3,832)Net cash inflow/(outflow) from financing activities (125,060) (61,814) (1,341,750) (670,453) (143,698) (7,398)
Net increase/(decrease) in cash and cash equivalents (39) (459) (55,072) 13,825 4,106 (6,806)
Cash and cash equivalents at the beginning of the year 1,055 1,514 113,295 98,082 (502) 6,174Effect of foreign currency exchange rate changes on cash and cash equivalents - - (890) 1,388 (47) 130Cash and cash equivalents at the end of the year 13 1,016 1,055 57,333 113,295 3,557 (502)
Non-cash operating and financing activities 14(b) 32,429 73,079 453,766 557,685 33,563 12,805
The above statements of cash flows should be read in conjunction with the accompanying notes.
MFS FundsStatements of cash flows
For the year ended 30 June 2019
-11-

Notes to the financial statements
Contents
1 General information
2 Summary of significant accounting policies
3 Financial risk management
4 Offsetting financial assets and financial liabilities
5 Fair value measurement
6 Net gains/(losses) on financial instruments at fair value through profit or loss
7 Financial assets at fair value through profit or loss
8 Financial liabilities at fair value through profit or loss
9 Derivative financial instruments
10 Structured entities
11 Net assets attributable to unit holders
12 Distributions to unit holders
13 Cash and cash equivalents
14 Reconciliation of profit/(loss) to net cash inflow/(outflow) from operating activities
15 Receivables
16 Payables
17 Remuneration of auditor
18 Related party transactions
19 Events occurring after the reporting period
20 Contingent assets and liabilities and commitments
MFS FundsNotes to the financial statementsFor the year ended 30 June 2019
-12-
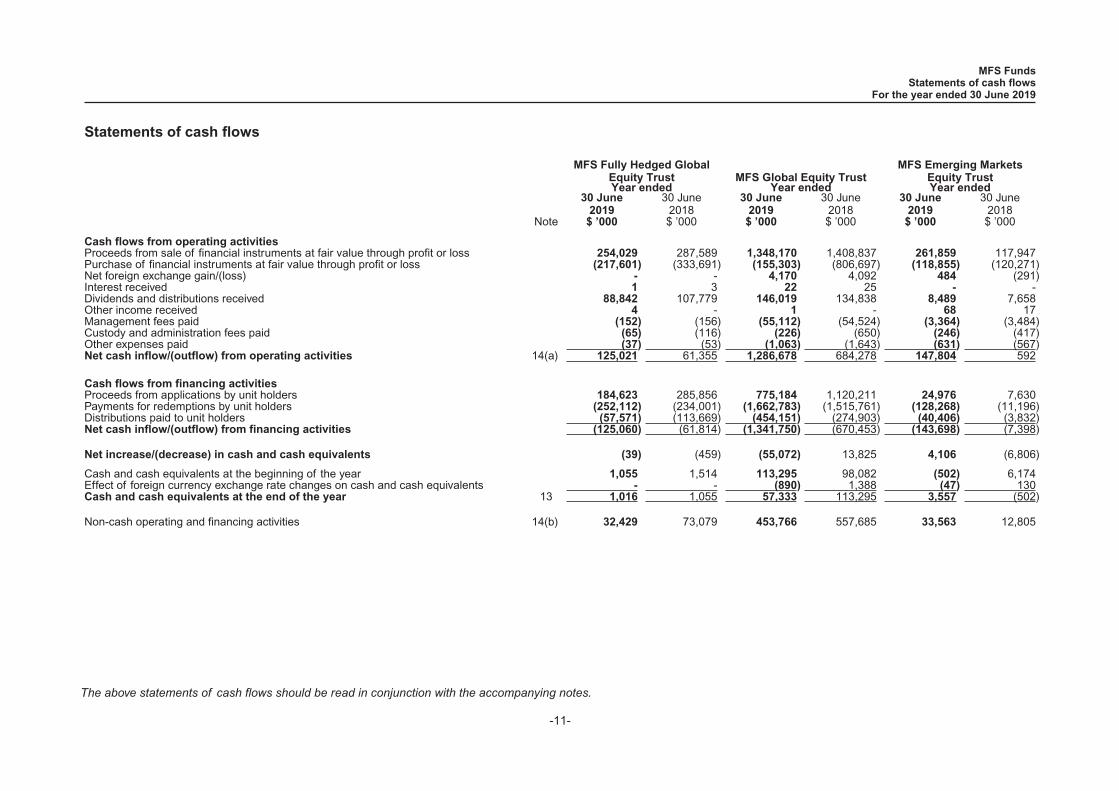
1 General information
These financial statements cover the below Funds (the “Funds”) as individual entities. The Funds are Australian registered managed investment schemes which were constituted onthe dates in the below table and will terminate in accordance with the provisions of the Funds’ Constitution or by Law.
MFS Fully Hedged Global Equity Trust 22 December 2004
MFS Global Equity Trust 22 April 1997
MFS Emerging Markets Equity Trust 05 April 2012
The Responsible Entity of the Funds is Equity Trustees Limited (ABN 46 004 031 298) (AFSL 240975) (the “Responsible Entity”). The Responsible Entity’s registered office isLevel 1, 575 Bourke Street, Melbourne, VIC 3000. The financial statements are presented in the Australian currency unless otherwise noted.
The principal activity of each Fund is to invest in accordance with the investment objective and guidelines as set out in the respective Fund’s current Product Disclosure Statementand its Constitution.
On 5 May 2016, a new tax regime applying to Managed Investment Trusts (“MITs”) was established under the Tax Laws Amendment (New Tax System for Managed InvestmentTrusts) Act 2016. The Attribution Managed Investment Trust (“AMIT”) regime allows MITs that meet certain requirements to make an irrevocable choice to be an AMIT. In order toallow the Funds to elect into the AMIT tax regime, the Funds’ Constitution has been amended and the other conditions to adopt the AMIT tax regime have been met effective 1 July2018. The Responsible Entity is therefore no longer contractually obligated to pay distributions. Consequently, the units in the Funds have been reclassified from a financial liabilityto equity on 1 July 2018, see Note 11 for further information.
The financial statements were authorised for issue by the directors on the date the Directors’ declaration was signed. The directors of the Responsible Entity have the power toamend and reissue the financial statements.
2 Summary of significant accounting policies
The principal accounting policies applied in the preparation of these financial statements are set out below. These policies have been consistently applied to all years presented,unless otherwise stated in the following text.
(a) Basis of preparation
These general purpose financial statements have been prepared in accordance with Australian Accounting Standards and Interpretations issued by the Australian AccountingStandards Board (AASB) and the Corporations Act 2001 in Australia. The Funds are for-profit entities for the purpose of preparing the financial statements.
The financial statements are prepared on the basis of fair value measurement of assets and liabilities except where otherwise stated.
MFS FundsNotes to the financial statementsFor the year ended 30 June 2019
(continued)
-13-

2 Summary of significant accounting policies (continued)
(a) Basis of preparation (continued)
The statements of financial position are presented on a liquidity basis. Assets and liabilities are presented in decreasing order of liquidity and do not distinguish between currentand non-current. All balances are expected to be recovered or settled within 12 months, except for investments in financial assets and liabilities and net assets attributable to unitholders.
The Funds manage financial assets at fair value through profit or loss based on the economic circumstances at any given point in time, as well as to meet any liquidity requirements.As such, it is expected that a portion of the portfolio will be realised within 12 months, however, an estimate of that amount cannot be determined as at reporting date.
In the case of net assets attributable to unit holders, the units are redeemable on demand at the unit holder’s option. However, holders of these instruments typically retain them forthe medium to long term. As such, the amount expected to be settled within 12 months cannot be reliably determined.
(i) Compliance with International Financial Reporting Standards (IFRS)
The financial statements of the Funds also comply with IFRS as issued by the International Accounting Standards Board (IASB).
(ii) New and amended standards adopted by the Funds
The Funds had to change some of their accounting policies as a result of new and revised accounting standards which became effective for the first time in the current reportingperiod. The affected policies are:
• AASB 9 Financial Instruments (and applicable amendments)
AASB 9 became effective for annual periods beginning on or after 1 January 2018. It addresses the classification, measurement and derecognition of financial assets and financialliabilities and replaces the multiple classification and measurement models in AASB 139. The derecognition rules have not changed from the previous requirements and the Fundsdo not apply hedge accounting.
Derivative and equity instruments are measured at fair value through profit or loss unless, for equity instruments not held for trading, an irrevocable option is taken to measure at fairvalue through other comprehensive income. AASB 9 also introduces a new expected credit loss (ECL) impairment model.
AASB 9 has been applied retrospectively by the Funds without the use of hindsight and it has determined that adoption did not result in a change to the classification ormeasurement of financial instruments in either the current or prior periods. The Funds’ investment portfolio continues to be classified as fair value through profit or loss and otherfinancial assets which are held for collection continue to be measured at amortised cost. There was no material impact on adoption from the application of the new impairmentmodel.
MFS FundsNotes to the financial statementsFor the year ended 30 June 2019
(continued)
-14-

2 Summary of significant accounting policies (continued)
(a) Basis of preparation (continued)
(ii) New and amended standards adopted by the Funds (continued)
• AASB 15 Revenue from Contracts with Customers
AASB 15 became effective for annual periods beginning on or after 1 January 2018 which is based on the principle that revenue is recognised when control of a good or servicetransfers to a customer – so the notion of control replaces the existing notion of risks and rewards.
The Funds’ main sources of income are interest, dividends, distributions and gains on financial instruments at fair value. All of these are outside the scope of the new revenuestandard. As a consequence, the adoption of AASB 15 does not have a material impact on the Funds’ accounting policies or the amounts recognised in the financial statements.
(iii) New standards and interpretations not yet adopted
A number of new standards, amendments to standards and interpretations are effective for annual periods beginning after 1 January 2019, and have not been early adopted inpreparing these financial statements.
(iv) Change in accounting estimate: Fair value measurement
From 1 July 2018, the Funds changed their valuation inputs for the fair value of listed financial assets and liabilities recognised in the financial statements from bid and ask to lasttraded prices. Funds consider the last traded price as a more representative estimate of the instruments’ fair value. Consequently, there is no difference between the valuation ofFunds assets for unit pricing and financial reporting for 2019 year onwards. This change is treated as a change in accounting estimate and applied prospectively.
The change in accounting estimate did not have a material impact on the fair value of financial instruments, nor did it have a material impact on the Funds’ financial position orperformance.
(b) Financial instruments
(i) Classification
• Financial assets
The Funds classify their financial assets in the following measurement categories:
- those to be measured at fair value through profit or loss; and- those to be measured at amortised cost.
The Funds classify financial assets based on their business model for managing those financial assets and the contractual cash flow characteristics of the financial assets.
MFS FundsNotes to the financial statementsFor the year ended 30 June 2019
(continued)
-15-

2 Summary of significant accounting policies (continued)
(b) Financial instruments (continued)
(i) Classification (continued)
The Funds’ portfolio of financial assets is managed and performance is evaluated on a fair value basis in accordance with the Funds’ documented investment strategy. The Funds’policy is for the Responsible Entity to evaluate the information about these financial assets on a fair value basis together with other related financial information.
For equity securities, the contractual cash flows of these instruments do not solely represent payments of principal and interest. Consequently, these investments are measured atfair value through profit or loss.
For cash and cash equivalents and receivables, these assets are held in order to collect the contractual cash flows and the contractual terms of these assets give rise on specifieddates to cash flows that are solely payments of principal and interest on the principal amount outstanding. Consequently, these are measured at amortised cost.
• Financial liabilities
The Funds enter into short sales in which a borrowed security is sold in anticipation of a decline in the market value of that security, or it may use short sales for various arbitragetransactions. Short sales are held for trading and are consequently classified as financial liabilities at fair value through profit or loss. Derivative contracts that have a negative fairvalue are presented as liabilities at fair value through profit or loss.
For financial liabilities that are not classified and measured at fair value through profit or loss, these are classified as financial liabilities at amortised cost (distributions payable, dueto brokers, management fees payable, redemption payable, custody and administration fees payable, withholding tax payable and other payables).
(ii) Recognition and derecognition
The Funds recognise financial assets and financial liabilities on the date they become party to the contractual agreement (trade date) and recognise changes in the fair value of thefinancial assets or financial liabilities from this date.
Financial assets are derecognised when the rights to receive cash flows from the financial assets have expired or the Funds have transferred substantially all the risks and rewardsof ownership. Financial liabilities are derecognised when the obligation under the liabilities is discharged.
(iii) Measurement
• Financial instruments at fair value through profit or loss
At initial recognition, the Funds measure a financial asset at its fair value. Transaction costs of financial assets carried at fair value through profit or loss are expensed in thestatement of comprehensive income.
Subsequent to initial recognition, all financial assets and liabilities at fair value through profit or loss are measured at fair value. Gains and losses arising from changes in the fairvalue of ‘financial assets or liabilities at fair value through profit or loss’ category are presented in the statement of comprehensive income within ‘net gains/(losses) on financialinstruments at fair value through profit or loss’ in the period in which they arise.
MFS FundsNotes to the financial statementsFor the year ended 30 June 2019
(continued)
-16-

2 Summary of significant accounting policies (continued)
(b) Financial instruments (continued)
(iii) Measurement (continued)
The fair value of financial assets and liabilities traded in active markets is based on their quoted market prices at the end of the reporting period without any deduction for estimatedfuture selling costs. Prior to 1 July 2018, the quoted market price used for financial assets was the current bid price and the quoted market price for financial liabilities was thecurrent asking price. The Funds changed their fair value inputs for the fair value of listed financial assets and liabilities from bid and ask prices to last traded prices to be consistentwith the inputs used for the calculation of unit prices for applications and redemptions.
For financial assets and financial liabilities at amortised cost, they are initially measured at fair value including directly attributable costs and are subsequently measured accordingto their classification.
For further details on how the fair value of financial instruments is determined please see Note 5 to the financial statements.
(iv) Impairment
At each reporting date, the Funds shall measure the loss allowance on financial assets at amortised cost (cash and cash equivalents, due from brokers and receivables) at anamount equal to the lifetime expected credit losses if the credit risk has increased significantly since initial recognition. If, at the reporting date, the credit risk has not increasedsignificantly since initial recognition, the Funds shall measure the loss allowance at an amount equal to 12-month expected credit losses. Significant financial difficulties of thecounterparty, probability that the counterparty will enter bankruptcy or financial reorganisation, and default in payments are all considered indicators that a loss allowance may berequired. If the credit risk increases to the point that it is considered to be credit impaired, interest income will be calculated based on the gross carrying amount adjusted for theloss allowance. A significant increase in credit risk is defined by management as any contractual payment which is more than 30 days past due. Any contractual payment which ismore than 90 days past due is considered credit impaired.
(v) Offsetting financial instruments
Financial assets and liabilities are offset and the net amount is reported in the statement of financial position when the Funds have a legally enforceable right to offset therecognised amounts, and there is an intention to settle on a net basis or realise the asset and settle the liability simultaneously.
Financial assets and liabilities that have been offset are disclosed in Note 4 to the financial statements.
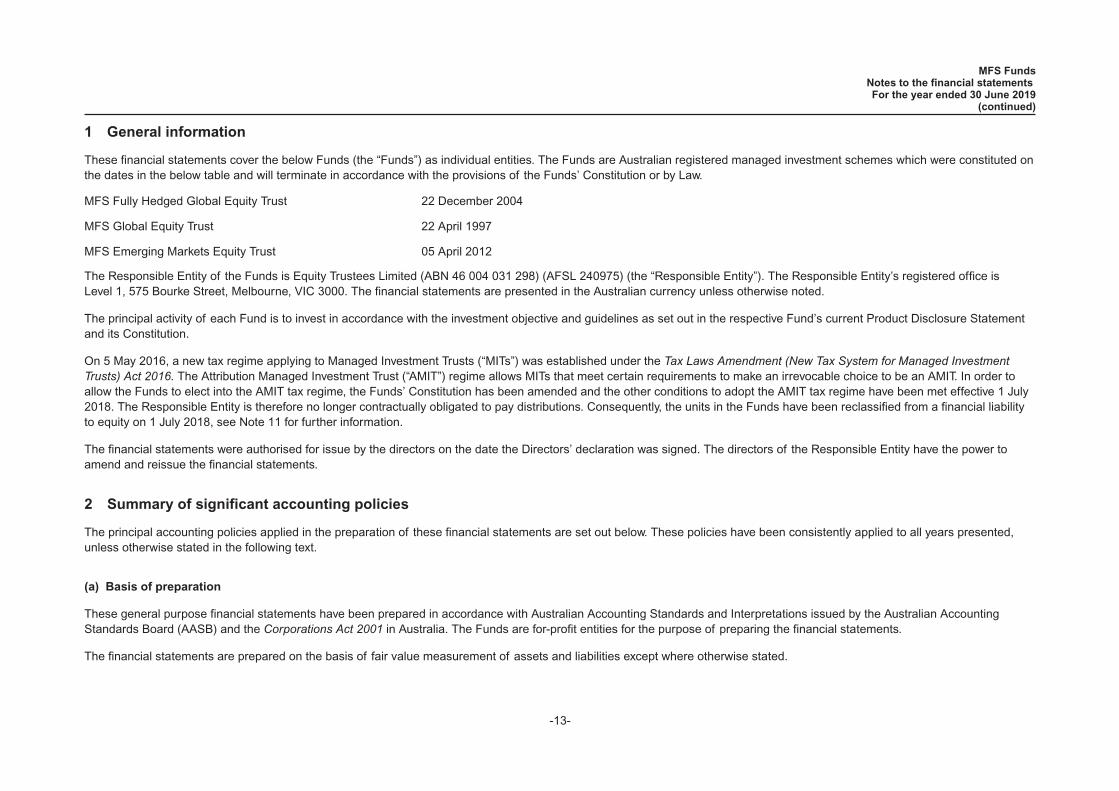
(c) Net assets attributable to unit holders
Units are redeemable at the unit holders’ option; however, applications and redemptions may be suspended by the Responsible Entity if it is in the best interests of the unit holders.
The units can be put back to the Funds at any time for cash based on the redemption price.
The units are carried at the redemption amount that is payable at the reporting date if the holder exercises the right to put the units back to the Funds.
MFS FundsNotes to the financial statementsFor the year ended 30 June 2019
(continued)
-17-
2 Summary of significant accounting policies (continued)
(c) Net assets attributable to unit holders (continued)
Units are classified as equity when they satisfy the following criteria under AASB 132 Financial Instruments: Presentation:
• the puttable financial instrument entitles the holder to a pro-rata share of net assets in the event of the Funds’ liquidation;
• the puttable financial instrument is in the class of instruments that is subordinate to all other classes of instruments and class features are identical;
• the puttable financial instrument does not include any contractual obligations to deliver cash or another financial asset, or to exchange financial instruments with another entityunder potentially unfavourable conditions to the Funds, and it is not a contract settled in the Funds’ own equity instruments; and
• the total expected cash flows attributable to the puttable financial instrument over the life are based substantially on the profit or loss.
As at 30 June 2018, net assets attributable to unit holders are classified as a financial liability. Effective from 1 July 2018, the Funds’ units have been reclassified from financialliability to equity as they satisfied all of the above criteria.
(d) Cash and cash equivalents
For the purpose of presentation in the statement of cash flows, cash and cash equivalents includes cash on hand, deposits held at call with financial institutions and other shortterm, highly liquid investments with original maturities of three months or less that are readily convertible to known amounts of cash and which are subject to an insignificant risk ofchanges in value.
Payments and receipts relating to the purchase and sale of investment securities are classified as cash flows from operating activities, as trading of these securities represent theFunds’ main income generating activity.
(e) Investment income
(i) Interest income
Interest income from financial assets at amortised cost is recognised on a time-proportionate basis using the effective interest method and includes interest from cash and cashequivalents.
(ii) Dividends and distributions
Dividend income is recognised on the ex-dividend date with any related foreign withholding tax recorded as an expense. The Funds currently incur withholding tax imposed bycertain countries on investment income. Such income is recorded gross of withholding tax in the statement of comprehensive income.
Trust distributions are recognised on an entitlement basis.
MFS FundsNotes to the financial statementsFor the year ended 30 June 2019
(continued)
-18-

2 Summary of significant accounting policies (continued)
(f) Expenses
All expenses are recognised in the statement of comprehensive income on an accrual basis.
(g) Income tax
Under current legislation, the Funds are not subject to income tax provided they attribute the entirety of their taxable income to its unit holders. The benefits of any imputationcredits and foreign tax paid are passed on to unit holders.
The Funds currently incur withholding taxes imposed by certain countries on investment income and capital gains. Such income or gains are recorded gross of withholding taxes inthe statements of comprehensive income. Withholding taxes are included in the statements of comprehensive income within other expenses.
(h) Distributions
The Funds may distribute their distributable income, in accordance with the Funds’ Constitution, to unit holders by cash or reinvestment. The distributions are recognised in thestatement of changes in equity as distributions paid and payable.
(i) Increase/decrease in net assets attributable to unit holders
Income not distributed is included in net assets attributable to unit holders. Where the Funds’ units are classified as financial liabilities, movements in net assets attributable to unitholders are recognised in the statement of comprehensive income as finance costs.
(j) Foreign currency translation
(i) Functional and presentation currency
Balances included in the Funds’ financial statements are measured using the currency of the primary economic environment in which it operates (the “functional currency”). This isthe Australian dollar which reflects the currency of the economy in which the Funds compete for funds and is regulated. The Australian dollar is also the Funds’ presentationcurrency.
(ii) Transactions and balances
Foreign currency transactions are translated into the functional currency using the exchange rates prevailing at the dates of the transactions. Foreign exchange gains and lossesresulting from the settlement of such transactions and from the translations at year end exchange rates of monetary assets and liabilities denominated in foreign currencies arerecognised in the statement of comprehensive income.
MFS FundsNotes to the financial statementsFor the year ended 30 June 2019
(continued)
-19-
2 Summary of significant accounting policies (continued)
(j) Foreign currency translation (continued)
(ii) Transactions and balances (continued)
The Funds do not isolate that portion of unrealised gains or losses on financial instruments that are measured at fair value through profit or loss and which is due to changes inforeign exchange rates. Such fluctuations are included with the net gains/(losses) on financial instruments at fair value through profit or loss.
(k) Due from/to brokers
Amounts due from/to brokers represent receivables for securities sold and payables for securities purchased that have been contracted for but not yet delivered by year end. Tradesare recorded on trade date, and for equities normally settled within two business days. The due from brokers balance is held for collection and is recognised initially at fair value andsubsequently measured at amortised cost.
(l) Receivables
Receivables may include amounts for interest, dividends and trust distributions. Dividends and trust distributions are accrued when the right to receive payment is established.Where applicable, interest is accrued on a daily basis. Amounts are generally received within 30 days of being recorded as receivables.
(m) Payables
Payables include liabilities and accrued expenses owed by the Funds which are unpaid as at the end of the reporting period.
A separate distribution payable is recognised in the statement of financial position.
Distributions declared effective 30 June in relation to unit holders who have previously elected to reinvest distributions are recognised as reinvested effective 1 July of the followingfinancial year.
(n) Applications and redemptions
Applications received for units in the Funds are recorded net of any entry fees payable prior to the issue of units in the Funds. Redemptions from the Funds are recorded gross ofany exit fees payable after the cancellation of units redeemed.
MFS FundsNotes to the financial statementsFor the year ended 30 June 2019
(continued)
-20-
2 Summary of significant accounting policies (continued)
(o) Goods and services tax (GST)
The GST incurred on the costs of various services provided to the Funds by third parties such as management, administration and custodian services where applicable, have beenpassed on to the Funds. The Funds qualify for Reduced Input Tax Credits (RITC) at a rate of at least 55%. Hence, fees for these services and any other expenses have beenrecognised in the statement of comprehensive income net of the amount of GST recoverable from the Australian Taxation Office (ATO). Amounts payable are inclusive of GST. Thenet amount of GST recoverable from the ATO is included in receivables in the statement of financial position. Cash flows relating to GST are included in the statement of cash flowson a gross basis.
(p) Use of estimates
The Funds make estimates and assumptions that affect the reported amounts of assets and liabilities within the current and next financial year. Estimates are continually evaluatedand are based on historical experience and other factors, including expectations of future events that are believed to be reasonable under the circumstances.
For the majority of the Funds’ financial instruments, quoted market prices are readily available. However, certain financial instruments, for example over-the-counter derivatives orunquoted securities, are fair valued using valuation techniques. Where valuation techniques (for example, pricing models) are used to determine fair values, they are validated andperiodically reviewed by experienced personnel of the Investment Manager.
Models use observable data, to the extent practicable. However, areas such as credit risk (both own and counterparty), volatilities and correlations, require management to makeestimates. Changes in assumptions about these factors could affect the reported fair value of financial instruments.
For more information on how fair value is calculated refer to Note 5 to the financial statements.
The adoption of AASB 9 introduced a new expected credit loss (ECL) impairment model, which has not materially impacted the Funds. Please see Note 3 for more information oncredit risk.
(q) Rounding of amounts
The Funds are entities of a kind referred to in ASIC Corporations (Rounding in Financial/Directors’ Reports) Instrument 2016/191 relating to the “rounding off” of amounts in thefinancial statements. Amounts in the financial statements have been rounded to the nearest thousand dollars, unless otherwise indicated.
(r) Comparative revisions
Comparative information has been revised where appropriate to enhance comparability. Where necessary, comparative figures have been adjusted to conform with changes inpresentation in the current year.
MFS FundsNotes to the financial statementsFor the year ended 30 June 2019
(continued)
-21-
3 Financial risk management
The Funds’ activities expose them to a variety of financial risks including market risk (which incorporates price risk, foreign exchange risk and interest rate risk), credit risk andliquidity risk.
The Funds’ overall risk management programme focuses on ensuring compliance with the Funds’ Product Disclosure Statement and the investment guidelines of the Funds. It alsoseeks to maximise the returns derived for the level of risk to which the Funds are exposed and seeks to minimise potential adverse effects on the Funds’ financial performance. TheFunds’ policy allows them to use derivative financial instruments in managing their financial risks.
All securities investments present a risk of loss of capital. The maximum loss of capital on unit trusts is limited to the fair value of those positions. The maximum loss of capital onderivatives is limited to the notional contract values of those positions.
The investments of the Funds, and associated risks, are managed by a specialist Investment Manager, MFS International Australia Pty Ltd (“MFS”) under an InvestmentManagement Agreement (IMA) approved by the Responsible Entity, and containing the investment strategy and guidelines of the Funds, consistent with those stated in the ProductDisclosure Statement.
The Funds use different methods to measure different types of risk to which they are exposed. These methods are explained below.
(a) Market risk
(i) Price risk
The Funds are exposed to price risk on equity securities listed or quoted on recognised securities exchanges (For MFS Global Equity Fund and MFS Emerging Markets EquityTrust). MFS Fully Hedged Global Equity Trust is exposed indirectly to price risk on equity securities (through their investment in units of the Underlying Fund). The Funds are alsoexposed to price risk on derivative securities which include forward currency contracts. Price risk arises from investments held by the Funds for which prices in the future areuncertain. Where non-monetary financial instruments are denominated in currencies other than the Australian dollar, the price in the future will also fluctuate because of changes inforeign exchange rates which are considered a component of price risk.
At the portfolio level, price risk is controlled through diversification across markets. At the individual security level, price risk is controlled through diversification across markets andadhering to the mandate guidelines of the Underlying Funds (For MFS Fully Hedged Global Equity Trust). At the Underlying Fund’s individual security level, given MFS’ focus onbottom up security selection, company specific risk, such as weaknesses in a firm’s statement of financial position or management turnover, is carefully evaluated in the course ofits research. MFS will not purchase a security whose fundamentals indicate an unacceptably high level of risk in relation to potential capital appreciation, and will generally sell astock when its fundamentals decline. Price targets for selling a security are set at purchase and serve as a means of prompting continual review.
The table at Note 3(b) summarises the sensitivities of the Funds’ assets and liabilities to price risk.
MFS FundsNotes to the financial statementsFor the year ended 30 June 2019
(continued)
-22-

3 Financial risk management (continued)
(a) Market risk (continued)
(i) Price risk (continued)
MFS Fully Hedged Global Equity Trust and MFS Global Equity Trust
The analysis is based on the assumption that the markets in which the Funds invest move by +/-11% (2018: +/-9%).
MFS Emerging Markets Equity Trust
The analysis is based on the assumption that the markets in which the Fund invests move by +/-12% (2018: +/-10%).
(ii) Foreign exchange risk
The Funds operate internationally and hold both monetary and non-monetary assets denominated in currencies other than the Australian dollar. Foreign exchange risk arises as thevalue of monetary securities denominated in other currencies fluctuate due to changes in exchange rates. The foreign exchange risk relating to non-monetary assets and liabilitiesis a component of price risk and not foreign exchange risk. However, the Investment Manager monitors the exposure of all foreign currency denominated assets and liabilities.
In keeping with the bottom up approach to selecting what MFS believes to be high quality stocks, all MFS analysts examine currency exposure as an integral part of the individualcompany valuation process. When looking at downside risk associated with any company, currency plays an important role in the stress testing conducted by the analysts. Stresstests are run for all companies, which examine the potential risk on a company’s bottom line earnings associated with any move in relevant currencies and the subsequent impacton the stock’s performance. In this way, potential currency impacts are built into the MFS valuation process through their fundamental, bottom up research at the individual stocklevel. However, at the portfolio level, MFS does not seek to actively manage currencies and would hedge only for defensive purposes in rare circumstances. The Funds use forwardcurrency contracts to manage foreign exchange risk.
However, for accounting purposes, the Funds do not designate any derivatives as hedges in a hedging relationship, and hence, these derivative financial instruments are classifiedas at fair value through profit or loss.
MFS FundsNotes to the financial statementsFor the year ended 30 June 2019
(continued)
-23-
3 Financial risk management (continued)
(a) Market risk (continued)
(ii) Foreign exchange risk (continued)
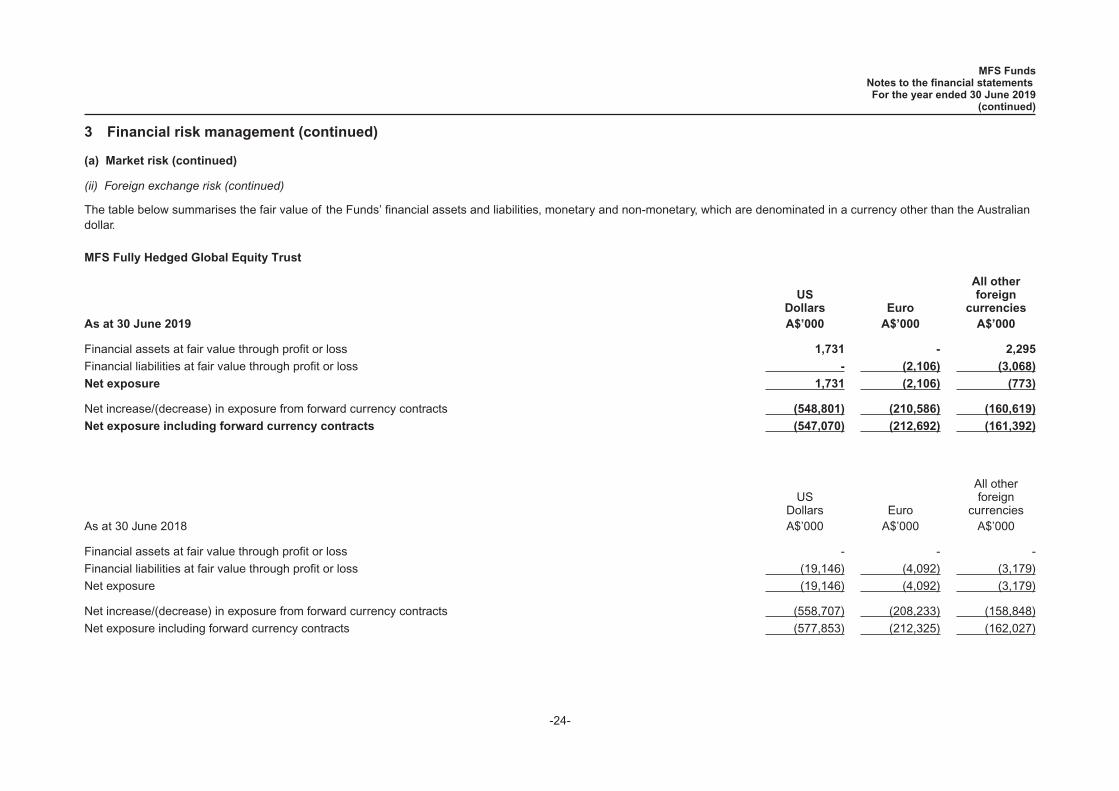
The table below summarises the fair value of the Funds’ financial assets and liabilities, monetary and non-monetary, which are denominated in a currency other than the Australiandollar.
MFS Fully Hedged Global Equity Trust
USDollars Euro
All otherforeign
currenciesAs at 30 June 2019 A$’000 A$’000 A$’000
Financial assets at fair value through profit or loss 1,731 - 2,295
Financial liabilities at fair value through profit or loss - (2,106) (3,068)
Net exposure 1,731 (2,106) (773)
Net increase/(decrease) in exposure from forward currency contracts (548,801) (210,586) (160,619)
Net exposure including forward currency contracts (547,070) (212,692) (161,392)
USDollars Euro
All otherforeign
currenciesAs at 30 June 2018 A$’000 A$’000 A$’000
Financial assets at fair value through profit or loss - - -
Financial liabilities at fair value through profit or loss (19,146) (4,092) (3,179)
Net exposure (19,146) (4,092) (3,179)
Net increase/(decrease) in exposure from forward currency contracts (558,707) (208,233) (158,848)
Net exposure including forward currency contracts (577,853) (212,325) (162,027)
MFS FundsNotes to the financial statementsFor the year ended 30 June 2019
(continued)
-24-

3 Financial risk management (continued)
(a) Market risk (continued)
(ii) Foreign exchange risk (continued)
MFS Global Equity Trust
USDollars Euro
SwissFrancs
BritishPounds
All otherforeign
currenciesAs at 30 June 2019 A$’000 A$’000 A$’000 A$’000 A$’000
Cash and cash equivalents 42,647 - - - -
Due from brokers - receivable from securities sold 6,980 - - - -
Receivables 2,630 5,948 8,160 4,587 1,791
Financial assets at fair value through profit or loss 4,054,740 1,504,749 538,920 533,657 547,571
Due to brokers - payable from securities purchased (7,406) (3,515) - - -
Payables - - - - (216)
Financial liabilities at fair value through profit or loss - - - - -
Net exposure 4,099,591 1,507,182 547,080 538,244 549,146
Net increase/(decrease) in exposure from forward currency contracts (3,515) 3,515 - - -
Net exposure including forward currency contracts 4,096,076 1,510,697 547,080 538,244 549,146
MFS FundsNotes to the financial statementsFor the year ended 30 June 2019
(continued)
-25-

3 Financial risk management (continued)
(a) Market risk (continued)
(ii) Foreign exchange risk (continued)
USDollars Euro
SwissFrancs
BritishPounds
All otherforeign
currenciesAs at 30 June 2018 A$’000 A$’000 A$’000 A$’000 A$’000
Cash and cash equivalents 100,276 - - - -
Due from brokers - receivable for securities sold 7,675 - - - -
Receivables 2,730 6,072 9,453 5,418 1,192
Financial assets at fair value through profit or loss 4,168,983 1,494,861 554,835 602,304 491,662
Due to brokers - payable for securities purchased (21,766) - - - (10,612)
Payables - (360)
Financial liabilities at fair value through profit or loss - - - - (47)
Net exposure 4,257,898 1,500,933 564,288 607,722 481,835
Net increase/(decrease) in exposure from forward currency contracts (10,688) - - - 10,688
Net exposure including forward currency contracts 4,247,210 1,500,933 564,288 607,722 492,523
MFS FundsNotes to the financial statementsFor the year ended 30 June 2019
(continued)
-26-

3 Financial risk management (continued)
(a) Market risk (continued)
(ii) Foreign exchange risk (continued)
MFS Emerging Markets Equity Trust
USDollars
Hong KongDollars
IndianRupees
New TaiwanDollars
All otherforeign
currenciesAs at 30 June 2019 A$’000 A$’000 A$’000 A$’000 A$’000
Cash and cash equivalents 3,157 - - - 100
Receivables 261 76 28 468 411
Due from brokers - receivable from securities sold - - - - 169
Financial assets at fair value through profit or loss 89,165 64,614 27,536 21,822 127,303
Payables - - (57) - (20)
Due to brokers - payable from securities purchased - - - - -
Net exposure 92,583 64,690 27,507 22,290 127,963
Net increase/(decrease) in exposure from forward currency contracts 228 - - - (228)
Net exposure including forward currency contracts 92,811 64,690 27,507 22,290 127,735
MFS FundsNotes to the financial statementsFor the year ended 30 June 2019
(continued)
-27-

3 Financial risk management (continued)
(a) Market risk (continued)
(ii) Foreign exchange risk (continued)
USDollars
Hong KongDollars
IndianRupees
New TaiwanDollars
All otherforeign
currenciesAs at 30 June 2018 A$’000 A$’000 A$’000 A$’000 A$’000
Cash and cash equivalents (336) - - - (1)
Receivables 212 - 1 613 310
Due from brokers - receivable for securities sold 697 - - - -
Financial assets at fair value through profit or loss 142,729 77,111 36,104 26,519 172,590
Payables - - (201) - (128)
Due to brokers - payable for securities purchased - - - - (283)
Net exposure 143,302 77,111 35,904 27,132 172,488
Net increase/(decrease) in exposure from forward currency contracts (285) - - - 285
Net exposure including forward currency contracts 143,017 77,111 35,904 27,132 172,773
The table at Note 3(b) summarises the sensitivities of the Funds’ monetary assets and liabilities to foreign exchange risk. The analysis is based on the assumption that theAustralian dollar weakened or strengthened by 0.33% (2018: +/-1%) against the material foreign currencies to which the Funds are exposed.
(iii) Interest rate risk
Interest rate risk management is undertaken by maintaining as close to a fully invested position as possible, thus limiting the exposure of the Funds to interest rate risk.
The Funds’ interest bearing financial assets expose it to risks associated with the effects of fluctuations in the prevailing levels of market interest rates on its financial position andcash flows. The risk is measured using sensitivity analysis.
MFS FundsNotes to the financial statementsFor the year ended 30 June 2019
(continued)
-28-

3 Financial risk management (continued)
(b) Summarised sensitivity analysis
The following table summarises the sensitivity of the Funds’ operating profit and net assets attributable to unit holders to market risks. The reasonably possible movements in therisk variables have been determined based on management’s best estimate, having regard to a number of factors, including historical levels of changes in foreign exchange rates,interest rates and the historical correlation of the Funds’ investments with the relevant benchmark and market volatility. However, actual movements in the risk variables may begreater or less than anticipated due to a number of factors, including unusually large market movements resulting from changes in the performance of and/or correlation betweenthe performances of the economies, markets and securities in which the Funds invest. As a result, historic variations in risk variables should not be used to predict future variancesin the risk variables.
MFS Fully Hedged Global Equity TrustImpact on operating profit/net assets attributable to unit
holders
Price risk Foreign exchange risk
-11% +11% -1% +1%
$’000 $’000 $’000 $’000
As at 30 June 2019 (91,378) 91,378 9,200 (9,200)
As at 30 June 2018 (78,657) 78,657 9,258 (9,258)
The sensitivity factors for 30 June 2018 were +/-9% for price risk and +/-1% for foreign exchange risk.
MFS Global Equity TrustImpact on operating profit/net assets attributable to unit
holders
Price risk Foreign exchange risk
-11% +11% -1% +1%
$’000 $’000 $’000 $’000
As at 30 June 2019 (789,760) 789,760 (616) 616
As at 30 June 2018 (658,138) 658,138 (1,001) 1,001
The sensitivity factors for 30 June 2018 were +/-9% for price risk and +/-1% for foreign exchange risk.
MFS FundsNotes to the financial statementsFor the year ended 30 June 2019
(continued)
-29-

3 Financial risk management (continued)
(b) Summarised sensitivity analysis (continued)
MFS Emerging Markets Equity TrustImpact on operating profit/net assets attributable to unit
holders
Price risk Foreign exchange risk
-12% +12% -0.33% +0.33%
$’000 $’000 $’000 $’000
As at 30 June 2019 (39,653) 39,653 15 (15)
As at 30 June 2018 (45,938) 45,938 (9) 9
The sensitivity factors for 30 June 2018 were +/-10% for price risk and +/-1% for foreign exchange risk.
(c) Credit risk
The Funds are exposed to credit risk, which is the risk that a counterparty will be unable to pay their obligations in full when they fall due, causing a financial loss to the Funds.
The Funds do not have a significant concentration of credit risk that arises from an exposure to a single counterparty or group of counterparties having similar characteristics. Themain concentration of credit risk, to which the Funds are exposed, arises from cash and cash equivalents and amounts due from brokers’ balances. None of these assets areimpaired nor past their due date. The maximum exposure to credit risk at the reporting date is the carrying amount of cash and cash equivalents and amounts due from brokers.
The Funds determine credit risk and measure expected credit losses for financial assets measured at amortised cost using probability of default, exposure at default and loss givendefault. Management considers both historical analysis and forward looking information in determining any expected credit loss. At 30 June 2019 and 30 June 2018, all receivables,amounts due from brokers, cash and short-term deposits are held with counterparties with a credit rating of AA/Aa or higher and are either callable on demand or due to be settledwithin 1 week. Management considers the probability of default to be close to zero as these instruments have a low risk of default and the counterparties have a strong capacity tomeet their contractual obligations in the near term. As a result, no loss allowance has been recognised based on 12-month expected credit losses as any such impairment would bewholly insignificant to the Funds.
MFS aims to reduce credit risk by following the Funds’ investment objectives in terms of the assets they can invest in.
MFS FundsNotes to the financial statementsFor the year ended 30 June 2019
(continued)
-30-

3 Financial risk management (continued)
(d) Liquidity risk
Liquidity risk is the risk that the Funds may not be able to generate sufficient cash resources to settle their obligations in full as they fall due or can only do so on terms that arematerially disadvantageous.
Exposure to liquidity risk for the Funds may arise from the requirement to meet daily unit holder redemption requests or to fund foreign exchange related cash flow requirements.
Liquidity risk is managed by reviewing the portfolios, MFS aims to maintain predominantly liquid portfolios, although liquidity is not guaranteed.
In order to manage the Funds’ overall liquidity, the Responsible Entity has the discretion to reject an application for units and to defer or adjust redemption of units if the exercise ofsuch discretion is in the best interests of unit holders. The Responsible Entity did not reject any applications or withhold any redemptions during 2019 and 2018.
MFS FundsNotes to the financial statementsFor the year ended 30 June 2019
(continued)
-31-

3 Financial risk management (continued)
(d) Liquidity risk (continued)
(i) Maturities of non-derivative financial liabilities
The tables below analyse the Funds’ non-derivative financial liabilities into relevant maturity groupings based on the remaining period at reporting date to the contractual maturitydate. The amounts in the table are the contractual undiscounted cash flows. Units are redeemed on demand at the unit holder’s option. However, the Responsible Entity does notenvisage that the contractual maturity disclosed in the table below will be representative of the actual cash outflows, as holders of these instruments typically retain them for themedium to long term.
MFS Fully Hedged Global Equity TrustLess than 1
month1-6
months6-12
monthsOver 12months
Total
$ ’000 $ ’000 $ ’000 $ ’000 $ ’000
As at 30 June 2019
Payables 1,518 - - - 1,518
Due to brokers - payable for securities purchased 184 - - - 184
Contractual cash flows (excluding derivatives) 1,702 - - - 1,702
As at 30 June 2018
Distributions payable 90,000 - - - 90,000
Payables 1,916 - - - 1,916
Net assets attributable to unit holders - liability 846,434 - - - 846,434
Contractual cash flows (excluding derivatives) 938,350 - - - 938,350
MFS FundsNotes to the financial statementsFor the year ended 30 June 2019
(continued)
-32-

3 Financial risk management (continued)
(d) Liquidity risk (continued)
(i) Maturities of non-derivative financial liabilities (continued)
MFS Global Equity TrustLess than 1
month1-6
months6-12
monthsOver 12months
Total
$ ’000 $ ’000 $ ’000 $ ’000 $ ’000
As at 30 June 2019
Distributions payable 720,123 - - - 720,123
Payables 12,940 - - - 12,940
Due to brokers - payable for securities purchased 10,921 - - - 10,921
Contractual cash flows (excluding derivatives) 743,984 - - - 743,984
As at 30 June 2018
Distributions payable 684,676 - - - 684,676
Payables 9,397 - - - 9,397
Due to brokers - payable for securities purchased 32,378 - - - 32,378
Net assets attributable to unit holders - liability 6,733,917 - - - 6,733,917
Contractual cash flows (excluding derivatives) 7,460,368 - - - 7,460,368
MFS FundsNotes to the financial statementsFor the year ended 30 June 2019
(continued)
-33-

3 Financial risk management (continued)
(d) Liquidity risk (continued)
(i) Maturities of non-derivative financial liabilities (continued)
MFS Emerging Markets Equity TrustLess than 1
month1-6
months6-12
monthsOver 12months
Total
$ ’000 $ ’000 $ ’000 $ ’000 $ ’000
As at 30 June 2019
Distributions payable 15,806 - - - 15,806
Payables 379 - - - 379
Contractual cash flows (excluding derivatives) 16,185 - - - 16,185
As at 30 June 2018
Overdraft and cash equivalent 844 - - - 844
Distributions payable 35,533 - - - 35,533
Payables 730 - - - 730
Due to brokers - payable for securities purchased 283 - - - 283
Net assets attributable to unit holders - liability 424,313 - - - 424,313
Contractual cash flows (excluding derivatives) 461,703 - - - 461,703
MFS FundsNotes to the financial statementsFor the year ended 30 June 2019
(continued)
-34-

3 Financial risk management (continued)
(d) Liquidity risk (continued)
(ii) Maturities of net settled derivative financial instruments
The tables below analyse the Funds’ net settled derivative financial instruments based on their contractual maturity. The Funds may, at their discretion, settle financial instrumentsprior to their original contractual settlement date, in accordance with their investment strategy, where permitted by the terms and conditions of the relevant instruments.
MFS Fully Hedged Global Equity Trust
Less than 1month
1-6months
6-12months
Over 12months
Total
$ ’000 $ ’000 $ ’000 $ ’000 $ ’000
As at 30 June 2019
Net settled derivatives
Forward currency contracts - (1,148) - - (1,148)
Total net settled derivatives - (1,148) - - (1,148)
As at 30 June 2018
Net settled derivatives
Forward currency contracts - (26,417) - - (26,417)
Total net settled derivatives - (26,417) - - (26,417)
MFS FundsNotes to the financial statementsFor the year ended 30 June 2019
(continued)
-35-

3 Financial risk management (continued)
(d) Liquidity risk (continued)
(ii) Maturities of net settled derivative financial instruments (continued)
MFS Global Equity Trust
Less than 1month
1-6months
6-12months
Over 12months
Total
$ ’000 $ ’000 $ ’000 $ ’000 $ ’000
As at 30 June 2019
Net settled derivatives
Forward currency contracts 8 - - - 8
Total net settled derivatives 8 - - - 8
As at 30 June 2018
Net settled derivatives
Forward currency contracts (47) - - - (47)
Total net settled derivatives (47) - - - (47)
MFS FundsNotes to the financial statementsFor the year ended 30 June 2019
(continued)
-36-

4 Offsetting financial assets and financial liabilities
Financial assets and liabilities are offset and the net amount reported in the statement of financial position when there is a legally enforceable right to offset the recognised amountsand there is an intention to settle on a net basis or realise the asset and settle the liability simultaneously. The gross and net positions of financial assets and liabilities that havebeen offset in the statement of financial position are disclosed in the first three columns of the tables below.
MFS Fully Hedged Global Equity TrustEffects of offsetting on the statement of
financial positionRelated amount not offset
Grossamounts of
financialinstruments
Grossamounts
set off in thestatement of
financialposition
Net amountof
financialinstrumentspresented in
thestatement of
financialposition
Amountssubject to
masternetting
arrangements
Collateralpledged/received
Net amount
As at 30 June 2019 $’000 $’000 $’000 $’000 $’000 $’000
Financial assets
Derivative financial instruments 4,026 - 4,026 (4,026) - -
Total 4,026 - 4,026 (4,026) - -
Financial liabilities
Derivative financial instruments 5,174 - 5,174 (4,026) - 1,148
Total 5,174 - 5,174 (4,026) - 1,148
As at 30 June 2018
Financial assets
Derivative financial instruments - - - - - -
Total - - - - - -
Financial liabilities
Derivative financial instruments 26,417 - 26,417 - - 26,417
Total 26,417 - 26,417 - - 26,417
MFS FundsNotes to the financial statementsFor the year ended 30 June 2019
(continued)
-37-

4 Offsetting financial assets and financial liabilities (continued)
MFS Global Equity Trust
Effects of offsetting on the statement offinancial position
Related amount not offset
Grossamounts of
financialinstruments
Grossamounts
set off in thestatement of
financialposition
Net amountof
financialinstrumentspresented in
thestatement of
financialposition
Amountssubject to
masternetting
arrangements
Collateralpledged/received
Net amount
$’000 $’000 $’000 $’000 $’000 $’000
As at 30 June 2019
Financial assets
Derivative financial instruments 3,523 (3,515) 8 - - 8
Total 3,523 (3,515) 8 - - 8
Financial liabilities
Derivative financial instruments 3,515 (3,515) - - - -
Total 3,515 (3,515) - - - -
As at 30 June 2018
Financial assets
Derivative financial instruments 10,688 (10,688) - - - -
Total 10,688 (10,688) - - - -
Financial liabilities
Derivative financial instruments 10,735 (10,688) 47 - - 47
Total 10,735 (10,688) 47 - - 47
MFS FundsNotes to the financial statementsFor the year ended 30 June 2019
(continued)
-38-

4 Offsetting financial assets and financial liabilities (continued)
MFS Emerging Markets Equity TrustEffects of offsetting on the statement of
financial positionRelated amount not offset
Grossamounts of
financialinstruments
Grossamounts
set off in thestatement of
financialposition
Net amountof
financialinstrumentspresented in
thestatement of
financialposition
Amountssubject to
masternetting
arrangements
Collateralpledged/received
Net amount
$’000 $’000 $’000 $’000 $’000 $’000
As at 30 June 2019
Financial assets
Derivative financial instruments 169 (169) - - - -
Total 169 (169) - - - -
Financial liabilities
Derivative financial instrument 169 (169) - - - -
Total 169 (169) - - - -
As at 30 June 2018
Financial assets
Derivative financial instruments 285 (285) - - - -
Total 285 (285) - - - -
Financial liabilities
Derivative financial instruments 285 (285) - - - -
Total 285 (285) - - - -
MFS FundsNotes to the financial statementsFor the year ended 30 June 2019
(continued)
-39-

4 Offsetting financial assets and financial liabilities (continued)
(a) Master netting arrangement – not currently enforceable
Agreements with derivative counterparties are based on the International Swaps and Derivatives Association (ISDA) Master Agreement. Under the terms of these arrangements,only when certain credit events occur (such as default), the net position owing/receivable to a single counterparty in the same currency will be taken as owing and all the relevantarrangements terminated. As the Funds do not presently have a legally enforceable right of set-off, these amounts have not been offset in the statement of financial position, buthave been presented separately in the above table.
5 Fair value measurement
The Funds measure and recognise financial assets and financial liabilities at fair value through profit or loss on a recurring basis.
The Funds have no assets or liabilities measured at fair value on a non-recurring basis in the current reporting period.
AASB 13 Fair Value Measurement requires disclosure of fair value measurements by level of the following fair value measurement hierarchy:
• Quoted prices (unadjusted) in active markets for identical assets or liabilities (level 1);
• Inputs other than quoted prices included within level 1 that are observable for the asset or liability, either directly or indirectly (level 2); and
• Inputs for the asset or liability that are not based on observable market data (unobservable inputs) (level 3).
The Funds value their investments in accordance with the accounting policies set out in Note 2 to the financial statements. For the majority of their investments, the Funds rely oninformation provided by independent pricing services for the valuation of their investments.
(a) Fair value in an active market (level 1)
The fair value of financial assets and liabilities traded in active markets is subsequently based on their quoted market prices at the end of the reporting period without any deductionfor estimated future selling costs.
A financial instrument is regarded as quoted in an active market if quoted prices are readily and regularly available from an exchange, dealer, broker, industry group, pricing service,or regulatory agency, and those prices represent actual and regularly occurring market transactions on an arm’s length basis.
An active market is a market in which transactions for the asset or liability take place with sufficient frequency and volume to provide pricing information on an ongoing basis.
MFS FundsNotes to the financial statementsFor the year ended 30 June 2019
(continued)
-40-
5 Fair value measurement (continued)
(b) Fair value in an inactive or unquoted market (level 2 and level 3)
The fair value of financial assets and liabilities that are not traded in an active market is determined using valuation techniques. These include the use of recent arm’s length markettransactions, reference to the current fair value of a substantially similar other instrument, discounted cash flow techniques, option pricing models or any other valuation techniquethat provides a reliable estimate of prices obtained in actual market transactions.
The fair value of derivatives that are not exchange traded is estimated at the amount that the Funds would receive or pay to terminate the contract at the end of the reporting periodtaking into account current market conditions (volatility and appropriate yield curve) and the current creditworthiness of the counterparties. The fair value of a forward currencycontract is determined as a net present value of estimated future cash flows, discounted at appropriate market rates as at the valuation date.
Investments in unlisted unit trusts are recorded at the redemption value per unit as reported by the investment Managers of such funds. The Funds may make adjustments to thevalue based on considerations such as: liquidity of the Investee Fund or their underlying investments, the value date of the net asset value provided, or any restrictions onredemptions and the basis of accounting.
Some of the inputs to these models may not be market observable and are therefore estimated based on assumptions. The output of a model is always an estimate orapproximation of a value that cannot be determined with certainty, and valuation techniques employed may not fully reflect all factors relevant to the positions the Funds hold.Valuations are therefore adjusted, where appropriate, to allow for additional factors including liquidity risk and counterparty risk.
MFS FundsNotes to the financial statementsFor the year ended 30 June 2019
(continued)
-41-

5 Fair value measurement (continued)
(c) Recognised fair value measurements
The table below presents the Funds’ financial assets and financial liabilities measured and recognised at fair value as at 30 June 2019.
MFS Fully Hedged Global Equity Trust MFS Global Equity TrustLevel 1 Level 2 Level 3 Total Level 1 Level 2 Level 3 Total$ ’000 $ ’000 $ ’000 $ ’000 $ ’000 $ ’000 $ ’000 $ ’000
As at 30 June 2019
Financial assets at fair value through profit or lossForward currency contracts - 4,026 - 4,026 8 - - 8Equity securities - - - - 7,179,629 - - 7,179,629Unit trusts - 830,705 - 830,705 - - - -
Total financial assets at fair value through profit or loss - 834,731 - 834,731 7,179,637 - - 7,179,637
Financial liabilities at fair value through profit or lossForward currency contracts - 5,174 - 5,174 - - - -
Total financial liabilities at fair value through profit or loss - 5,174 - 5,174 - - - -
As at 30 June 2018
Financial assets at fair value through profit or lossEquity securities - - - - 7,312,645 - - 7,312,645Unit trusts - 873,966 - 873,966 - - - -
Total financial assets at fair value through profit or loss - 873,966 - 873,966 7,312,645 - - 7,312,645
Financial liabilities at fair value through profit or lossForward currency contracts - 26,417 - 26,417 47 - - 47
Total financial liabilities at fair value through profit or loss - 26,417 - 26,417 47 - - 47
MFS FundsNotes to the financial statementsFor the year ended 30 June 2019
(continued)
-42-
5 Fair value measurement (continued)
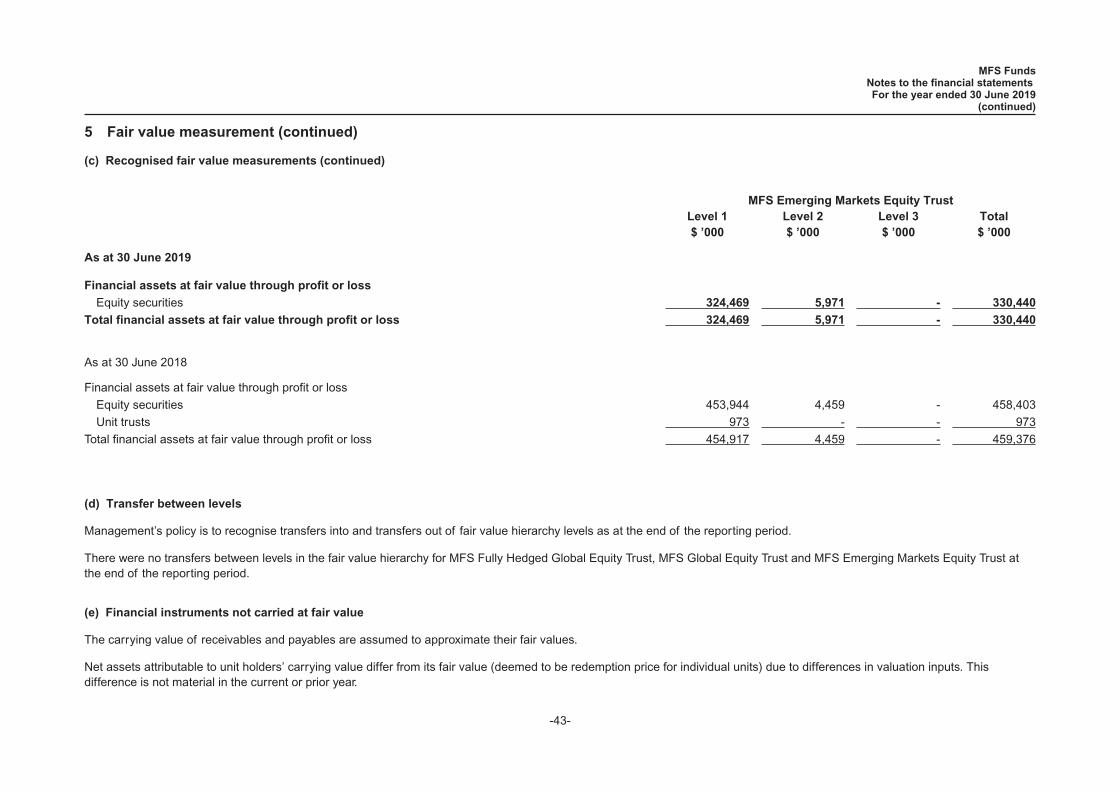
(c) Recognised fair value measurements (continued)
MFS Emerging Markets Equity TrustLevel 1 Level 2 Level 3 Total$ ’000 $ ’000 $ ’000 $ ’000
As at 30 June 2019
Financial assets at fair value through profit or loss
Equity securities 324,469 5,971 - 330,440
Total financial assets at fair value through profit or loss 324,469 5,971 - 330,440
As at 30 June 2018
Financial assets at fair value through profit or loss
Equity securities 453,944 4,459 - 458,403
Unit trusts 973 - - 973
Total financial assets at fair value through profit or loss 454,917 4,459 - 459,376
(d) Transfer between levels
Management’s policy is to recognise transfers into and transfers out of fair value hierarchy levels as at the end of the reporting period.
There were no transfers between levels in the fair value hierarchy for MFS Fully Hedged Global Equity Trust, MFS Global Equity Trust and MFS Emerging Markets Equity Trust atthe end of the reporting period.
(e) Financial instruments not carried at fair value
The carrying value of receivables and payables are assumed to approximate their fair values.
Net assets attributable to unit holders’ carrying value differ from its fair value (deemed to be redemption price for individual units) due to differences in valuation inputs. Thisdifference is not material in the current or prior year.
MFS FundsNotes to the financial statementsFor the year ended 30 June 2019
(continued)
-43-

6 Net gains/(losses) on financial instruments at fair value through profit or loss
Net gains/(losses) recognised in relation to financial assets and liabilities at fair value through profit or loss:
MFS Fully Hedged GlobalEquity Trust MFS Global Equity Trust
MFS Emerging MarketsEquity Trust
Year ended Year ended Year ended30 June
201930 June
201830 June
201930 June
201830 June
201930 June
2018$ ’000 $ ’000 $ ’000 $ ’000 $ ’000 $ ’000
Financial assets
Net realised gain/(loss) on financial assets at fair value through profit or loss 22,363 42,417 675,286 615,742 45,216 28,961
Net unrealised gain/(loss) on financial assets at fair value through profit or loss 34,761 (51,140) 405,335 (65,460) (30,481) 32,478
Net gains/(losses) on financial assets at fair value through profit or loss 57,124 (8,723) 1,080,621 550,282 14,735 61,439
Financial liabilities
Net realised gain/(loss) on financial liabilities at fair value through profit or loss (60,733) (7,710) - (857) (912) (43)
Net unrealised gain/(loss) on financial liabilities at fair value through profit or loss 21,242 (21,445) 47 (43) - -
Net gains/(losses) on financial liabilities at fair value through profit or loss (39,491) (29,155) 47 (900) (912) (43)
Total net gains/(losses) on financial instruments at fair value through profit orloss 17,633 (37,878) 1,080,668 549,382 13,823 61,396
MFS FundsNotes to the financial statementsFor the year ended 30 June 2019
(continued)
-44-
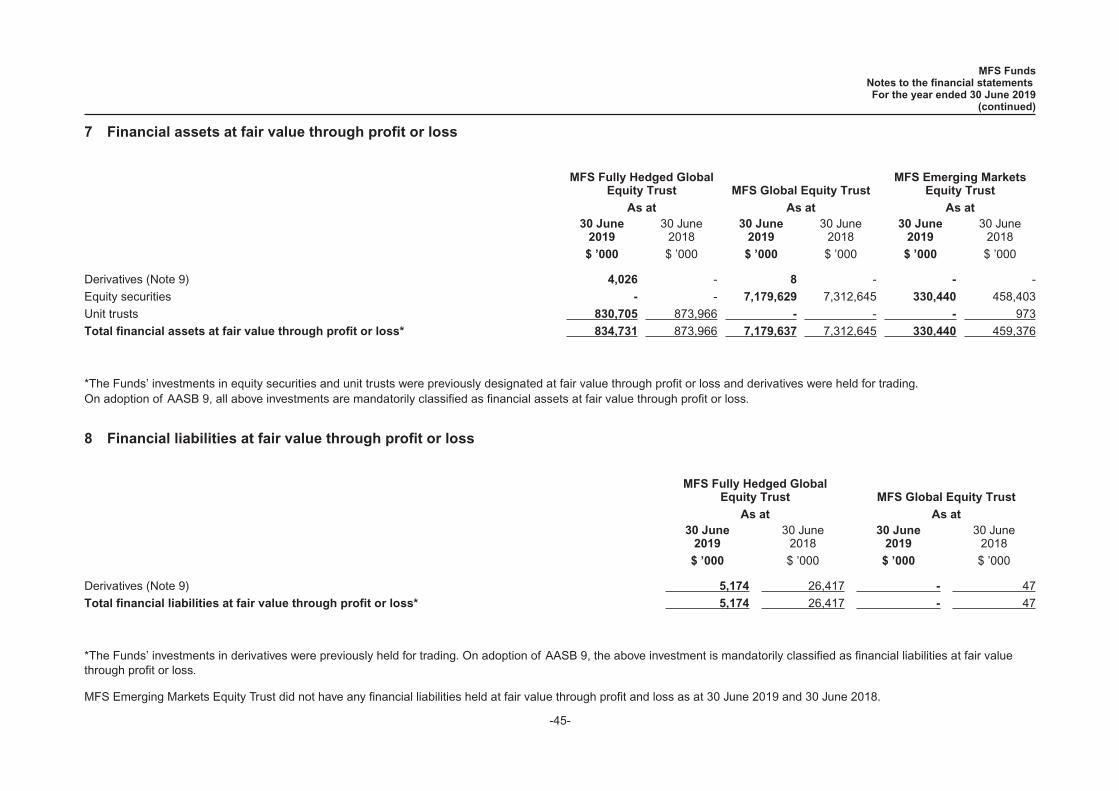
7 Financial assets at fair value through profit or loss
MFS Fully Hedged GlobalEquity Trust MFS Global Equity Trust
MFS Emerging MarketsEquity Trust
As at As at As at30 June
201930 June
201830 June
201930 June
201830 June
201930 June
2018
$ ’000 $ ’000 $ ’000 $ ’000 $ ’000 $ ’000
Derivatives (Note 9) 4,026 - 8 - - -
Equity securities - - 7,179,629 7,312,645 330,440 458,403
Unit trusts 830,705 873,966 - - - 973
Total financial assets at fair value through profit or loss* 834,731 873,966 7,179,637 7,312,645 330,440 459,376
*The Funds’ investments in equity securities and unit trusts were previously designated at fair value through profit or loss and derivatives were held for trading.On adoption of AASB 9, all above investments are mandatorily classified as financial assets at fair value through profit or loss.
8 Financial liabilities at fair value through profit or loss
MFS Fully Hedged GlobalEquity Trust MFS Global Equity Trust
As at As at30 June
201930 June
201830 June
201930 June
2018
$ ’000 $ ’000 $ ’000 $ ’000
Derivatives (Note 9) 5,174 26,417 - 47
Total financial liabilities at fair value through profit or loss* 5,174 26,417 - 47
*The Funds’ investments in derivatives were previously held for trading. On adoption of AASB 9, the above investment is mandatorily classified as financial liabilities at fair valuethrough profit or loss.
MFS Emerging Markets Equity Trust did not have any financial liabilities held at fair value through profit and loss as at 30 June 2019 and 30 June 2018.
MFS FundsNotes to the financial statementsFor the year ended 30 June 2019
(continued)
-45-

9 Derivative financial instruments
In the normal course of business the Funds enter into transactions in various derivative financial instruments which have certain risks. A derivative is a financial instrument or othercontract which is settled at a future date and whose value changes in response to the change in a specified interest rate, financial instrument price, commodity price, foreignexchange rate, index of prices or rates, credit rating or credit index or other variable.
Derivative financial instruments require no initial net investment or an initial net investment that is smaller than would be required for other types of contracts that would be expectedto have a similar response to changes in market factors.
Derivative transactions include many different instruments such as forward currency contracts, futures and options. Derivatives are considered to be part of the investment processand the use of derivatives is an essential part of the Funds’ portfolio management. Derivatives are not managed in isolation. Consequently, the use of derivatives is multifacetedand includes:
• hedging to protect an asset or liability of the Funds against a fluctuation in market values, foreign exchange risk or to reduce volatility;
• a substitution for trading of physical securities; and
• adjusting asset exposures within the parameters set in the investment strategy, and adjusting the duration of fixed interest portfolios or the weighted average maturity of cashportfolios.
While derivatives are used for trading purposes, they are not used to gear (leverage) a portfolio. Gearing a portfolio would occur if the level of exposure to the markets exceeds theunderlying value of the Funds.
The Funds hold the following derivatives:
(a) Forward currency contracts
Forward currency contracts are primarily used by the Funds for the purposes of trading settlements and income repatriations where the Funds agree to receive or deliver a fixedquantity of foreign currency for an agreed upon price on the spot date. These contracts are valued and translated at the prevailing spot bid price at the end of each reporting period.The Funds recognise a gain or loss equal to the change in fair value at the end of each reporting period.
MFS FundsNotes to the financial statementsFor the year ended 30 June 2019
(continued)
-46-

9 Derivative financial instruments (continued)
(a) Forward currency contracts (continued)
The Funds’ derivative financial instruments at year end are detailed below:
MFS Fully Hedged Global Equity Trust MFS Global Equity Trust
Contractual/notional Assets Liabilities
Contractual/notional Assets Liabilities
$ ’000 $ ’000 $ ’000 $ ’000 $ ’000 $ ’000
As at 30 June 2019
Forward currency contracts 920,006 4,026 5,174 3,515 8 -
Total derivatives 920,006 4,026 5,174 3,515 8 -
As at 30 June 2018
Forward currency contracts 925,788 - 26,417 10,688 - 47
Total derivatives 925,788 - 26,417 10,688 - 47
MFS FundsNotes to the financial statementsFor the year ended 30 June 2019
(continued)
-47-

9 Derivative financial instruments (continued)
(a) Forward currency contracts (continued)
MFS Emerging Markets Equity Trust
Contractual/notional Assets Liabilities$ ’000 $ ’000 $ ’000
As at 30 June 2019
Forward currency contracts 228 - -
Total derivatives 228 - -
As at 30 June 2018
Forward currency contracts 285 - -
Total derivatives 285 - -
Information about the Funds’ exposure to credit risk, foreign exchange risk, interest rate risk and about the methods and assumptions used in determining fair values is provided inNote 3 and Note 5 to the financial statements. The maximum exposure to credit risk at the end of the reporting period is the carrying amount of each class of derivative financialinstruments disclosed above.
MFS FundsNotes to the financial statementsFor the year ended 30 June 2019
(continued)
-48-

10 Structured entities
A structured entity is an entity that has been designed so that voting or similar rights are not the dominant factor in deciding who controls the entity, and the relevant activities aredirected by means of contractual arrangement.
The Funds consider all investments in managed investment schemes (the �Schemes�) to be structured entities. The Funds invest in Schemes for the purpose of capital appreciationand or earning investment income.
The exposure to investments in related Schemes at fair value, and any related amounts recognised in the statement of comprehensive income is disclosed at Note 18(i) to thefinancial statements.
11 Net assets attributable to unit holders
Under AASB 132 Financial instruments: Presentation, puttable financial instruments meet the definition of a financial liability to be classified as equity where certain strict criteriaare met. The Funds shall classify a financial instrument as an equity instrument from the date when the instrument has all the features and meets the conditions.
Prior to 1 July 2018 the Funds classified their net assets attributable to unit holders as liabilities in accordance with AASB 132. On 1 July 2018, the Funds have elected into theAMIT tax regime. The Funds’ Constitution has been amended on the same date and it no longer has a contractual obligation to pay distributions to unit holders. Therefore, the netassets attributable to unit holders of the Funds meet the criteria set out under AASB 132 and are classified as equity from 1 July 2018 onwards.
As a result of the reclassification of net assets attributable to unit holders from liabilities to equity, the Funds’ distributions are no longer classified as finance costs in the statementof comprehensive income, but rather as distributions paid and payable in the statement of changes in equity.
MFS FundsNotes to the financial statementsFor the year ended 30 June 2019
(continued)
-49-
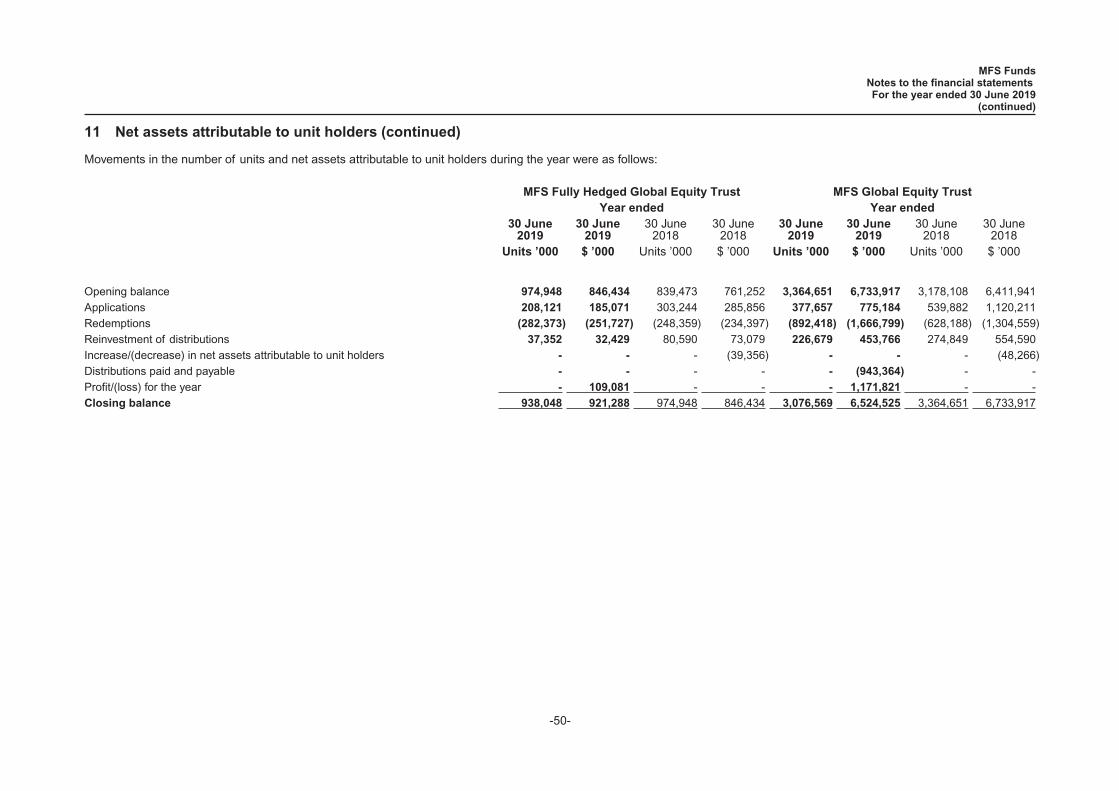
11 Net assets attributable to unit holders (continued)
Movements in the number of units and net assets attributable to unit holders during the year were as follows:
MFS Fully Hedged Global Equity Trust MFS Global Equity TrustYear ended Year ended
30 June2019
30 June2019
30 June2018
30 June2018
30 June2019
30 June2019
30 June2018
30 June2018
Units ’000 $ ’000 Units ’000 $ ’000 Units ’000 $ ’000 Units ’000 $ ’000
Opening balance 974,948 846,434 839,473 761,252 3,364,651 6,733,917 3,178,108 6,411,941Applications 208,121 185,071 303,244 285,856 377,657 775,184 539,882 1,120,211Redemptions (282,373) (251,727) (248,359) (234,397) (892,418) (1,666,799) (628,188) (1,304,559)Reinvestment of distributions 37,352 32,429 80,590 73,079 226,679 453,766 274,849 554,590Increase/(decrease) in net assets attributable to unit holders - - - (39,356) - - - (48,266)Distributions paid and payable - - - - - (943,364) - -Profit/(loss) for the year - 109,081 - - - 1,171,821 - -Closing balance 938,048 921,288 974,948 846,434 3,076,569 6,524,525 3,364,651 6,733,917
MFS FundsNotes to the financial statementsFor the year ended 30 June 2019
(continued)
-50-

11 Net assets attributable to unit holders (continued)
MFS Emerging Markets Equity Trust
Year ended30 June
201930 June
201930 June
201830 June
2018Units ’000 $ ’000 Units ’000 $ ’000
Opening balance 314,179 424,313 306,221 386,254
Applications 18,251 24,976 5,520 7,630
Redemptions (123,289) (128,268) (7,701) (11,196)
Reinvestment of distributions 24,814 33,563 10,139 12,805
Increase/(decrease) in net assets attributable to unit holders - - - 28,820
Distributions paid and payable - (54,242) - -
Profit/(loss) for the year - 19,000 - -
Closing balance 233,955 319,342 314,179 424,313
Net assets attributable to unit holders are classified as equity at 30 June 2019 and as a financial liability at 30 June 2018. Refer to Note 1 for further details.
As stipulated within the Funds’ Constitution, each unit represents a right to an individual share in the Funds and does not extend to a right in the underlying assets of the Funds.
There are no separate classes of units and each unit has the same rights attaching to it as all other units of the Funds.
Units are redeemed on demand at the unit holder’s option. However, holders of these instruments typically retain them for the medium to long term. As such, the amount expectedto be settled within twelve months after the end of the reporting period cannot be reliably determined.
Capital risk management
The Funds consider their net assets attributable to unit holders as capital, notwithstanding that net assets attributable to unit holders are classified as a liability until 30 June 2018.The amount of net assets attributable to unit holders can change significantly on a daily basis as the Funds are subject to daily applications and redemptions at the discretion ofunit holders.
Daily applications and redemptions are reviewed relative to the liquidity of the Funds’ underlying assets on a daily basis by the Responsible Entity. Under the terms of the Funds’Constitution, the Responsible Entity has the discretion to reject an application for units and to defer or adjust redemption of units if the exercise of such discretion is in the bestinterests of unit holders.
MFS FundsNotes to the financial statementsFor the year ended 30 June 2019
(continued)
-51-

12 Distributions to unit holders
The distributions declared during the year were as follows:
MFS Fully Hedged Global Equity Trust MFS Global Equity TrustYear ended Year ended
30 June2019
30 June2019
30 June2018
30 June2018
30 June2019
30 June2019
30 June2018
30 June2018
$ ’000 CPU $ ’000 CPU $ ’000 CPU $ ’000 CPU
DistributionsJanuary* - - - - 47,421 - - -February* - - - - 69,092 - - -June* - - - - 106,728 - - -June (payable) - - 90,000 9.23 720,123 23.41 684,676 20.35Total distributions - 90,000 943,364 684,676
MFS Emerging Markets Equity Trust
Year ended30 June
201930 June
201930 June
201830 June
2018
$ ’000 CPU $ ’000 CPU
Distributions
September* 16,407 - - -
May* 11,133 - - -
June* 10,896 - - -
June (payable) 15,806 6.76 35,533 11.31
Total distributions 54,242 35,533
MFS FundsNotes to the financial statementsFor the year ended 30 June 2019
(continued)
-52-
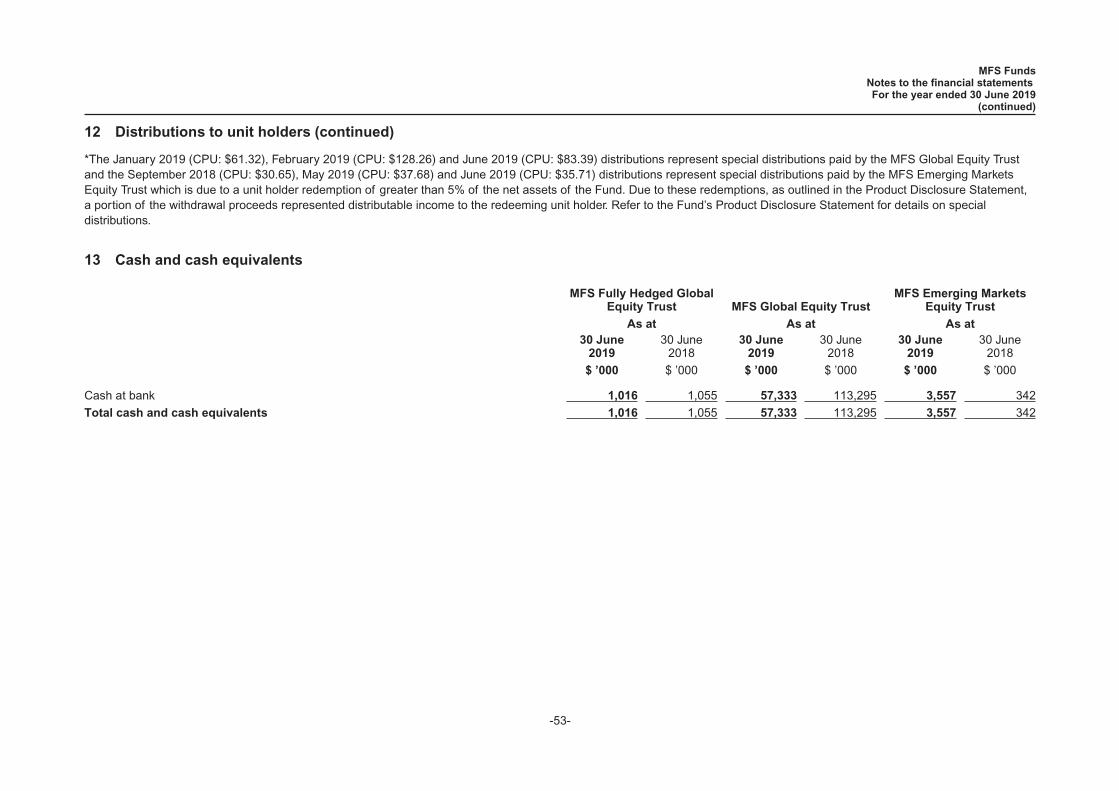
12 Distributions to unit holders (continued)
*The January 2019 (CPU: $61.32), February 2019 (CPU: $128.26) and June 2019 (CPU: $83.39) distributions represent special distributions paid by the MFS Global Equity Trustand the September 2018 (CPU: $30.65), May 2019 (CPU: $37.68) and June 2019 (CPU: $35.71) distributions represent special distributions paid by the MFS Emerging MarketsEquity Trust which is due to a unit holder redemption of greater than 5% of the net assets of the Fund. Due to these redemptions, as outlined in the Product Disclosure Statement,a portion of the withdrawal proceeds represented distributable income to the redeeming unit holder. Refer to the Fund’s Product Disclosure Statement for details on specialdistributions.
13 Cash and cash equivalents
MFS Fully Hedged GlobalEquity Trust MFS Global Equity Trust
MFS Emerging MarketsEquity Trust
As at As at As at30 June
201930 June
201830 June
201930 June
201830 June
201930 June
2018
$ ’000 $ ’000 $ ’000 $ ’000 $ ’000 $ ’000
Cash at bank 1,016 1,055 57,333 113,295 3,557 342
Total cash and cash equivalents 1,016 1,055 57,333 113,295 3,557 342
MFS FundsNotes to the financial statementsFor the year ended 30 June 2019
(continued)
-53-

13 Cash and cash equivalents (continued)
(a) Reconciliation to cash flow statement
The above figures reconcile to the amount of cash shown in the statement of cash flows at the end of the year as follows:
MFS Fully Hedged GlobalEquity Trust MFS Global Equity Trust
MFS Emerging MarketsEquity Trust
As at As at As at30 June
201930 June
201830 June
201930 June
201830 June
201930 June
2018
$ ’000 $ ’000 $ ’000 $ ’000 $ ’000 $ ’000
Balances as above 1,016 1,055 57,333 113,295 3,557 342
Overdraft and cash equivalent - - - - - (844)
Balances as per statement of cash flows 1,016 1,055 57,333 113,295 3,557 (502)
MFS Fully Hedged Global Equity Trust
These accounts are earning a fixed interest rate of 0.15% as at 30 June 2019 (30 June 2018: 0.15%).
MFS Global Equity Trust
These accounts are earning a floating interest rate of between 0.00% and 0.15% as at 30 June 2019 (30 June 2018: -0.60% to 0.35%).
MFS Emerging Markets Equity Trust
These accounts are earning a floating interest rate of between -0.60% and 0.15% as at 30 June 2019 (30 June 2018: 0.15% to 0.35%).
MFS FundsNotes to the financial statementsFor the year ended 30 June 2019
(continued)
-54-

14 Reconciliation of profit/(loss) to net cash inflow/(outflow) from operating activities
MFS Fully Hedged GlobalEquity Trust MFS Global Equity Trust
MFS Emerging MarketsEquity Trust
Year ended Year ended Year ended30 June
201930 June
201830 June
201930 June
201830 June
201930 June
2018
$ ’000 $ ’000 $ ’000 $ ’000 $ ’000 $ ’000
(a) Reconciliation of profit/(loss) to net cash inflow/(outflow) from operatingactivities
Profit/(loss) for the year 109,081 - 1,171,821 - 19,000 -
Increase/(decrease) in net assets attributable to unit holders - (39,356) - (48,266) - 28,820
Distributions to unit holders - 90,000 - 684,676 - 35,533
Proceeds from sale of financial instruments at fair value through profit or loss 254,029 287,589 1,348,170 1,408,837 261,859 117,947
Purchase of financial instruments at fair value through profit or loss (217,601) (333,691) (155,303) (806,697) (118,855) (120,271)
Net (gains)/losses on financial instruments at fair value through profit or loss (17,633) 37,878 (1,080,668) (549,382) (13,823) (61,396)
Net foreign exchange (gain)/loss - - 890 (1,388) 47 (130)
Net change in receivables (2,842) 18,985 2,241 (648) (73) (54)
Net change in payables (13) (50) (473) 241 (351) 143
Dividend and distribution income reinvested - - - (3,095) - -
Net cash inflow/(outflow) from operating activities 125,021 61,355 1,286,678 684,278 147,804 592
(b) Non-cash operating and financing activitiesThe following distribution payments to unit holders were satisfied by the issueof units under the distribution reinvestment plan 32,429 73,079 453,766 554,590 33,563 12,805The following purchases of investments were satisfied by the participation in dividendand distribution reinvestment plans - - - 3,095 - -
Total non-cash operating and financing activities 32,429 73,079 453,766 557,685 33,563 12,805
As described in Note 2(i), income not distributed is included in net assets attributable to unit holders. The change in this amount for the year (as reported in (a) above) represents anon-cash financing cost as it is not settled in cash until such time as it becomes distributable.
MFS FundsNotes to the financial statementsFor the year ended 30 June 2019
(continued)
-55-

15 Receivables
MFS Fully Hedged GlobalEquity Trust MFS Global Equity Trust
MFS Emerging MarketsEquity Trust
As at As at As at30 June
201930 June
201830 June
201930 June
201830 June
201930 June
2018
$ ’000 $ ’000 $ ’000 $ ’000 $ ’000 $ ’000
Dividends and distributions receivable 91,687 88,842 22,599 24,865 1,233 1,132
Applications receivable 448 - - - - -
GST receivable 14 13 1,956 1,935 117 152
Management fee reimbursement receivable 4 6 - - - -
Other receivables - 2 4 - 11 4
Total receivables 92,153 88,863 24,559 26,800 1,361 1,288
16 Payables
MFS Fully Hedged GlobalEquity Trust MFS Global Equity Trust
MFS Emerging MarketsEquity Trust
As at As at As at30 June
201930 June
201830 June
201930 June
201830 June
201930 June
2018
$ ’000 $ ’000 $ ’000 $ ’000 $ ’000 $ ’000
Management fees payable - - 4,255 4,576 161 263
Redemptions payable 1,493 1,878 7,870 3,854 - -
Custody and administration fees payable 25 25 139 120 83 90
Withholding tax payable - - 216 360 77 329
Other payables - 13 460 487 58 48
Total payables 1,518 1,916 12,940 9,397 379 730
MFS FundsNotes to the financial statementsFor the year ended 30 June 2019
(continued)
-56-
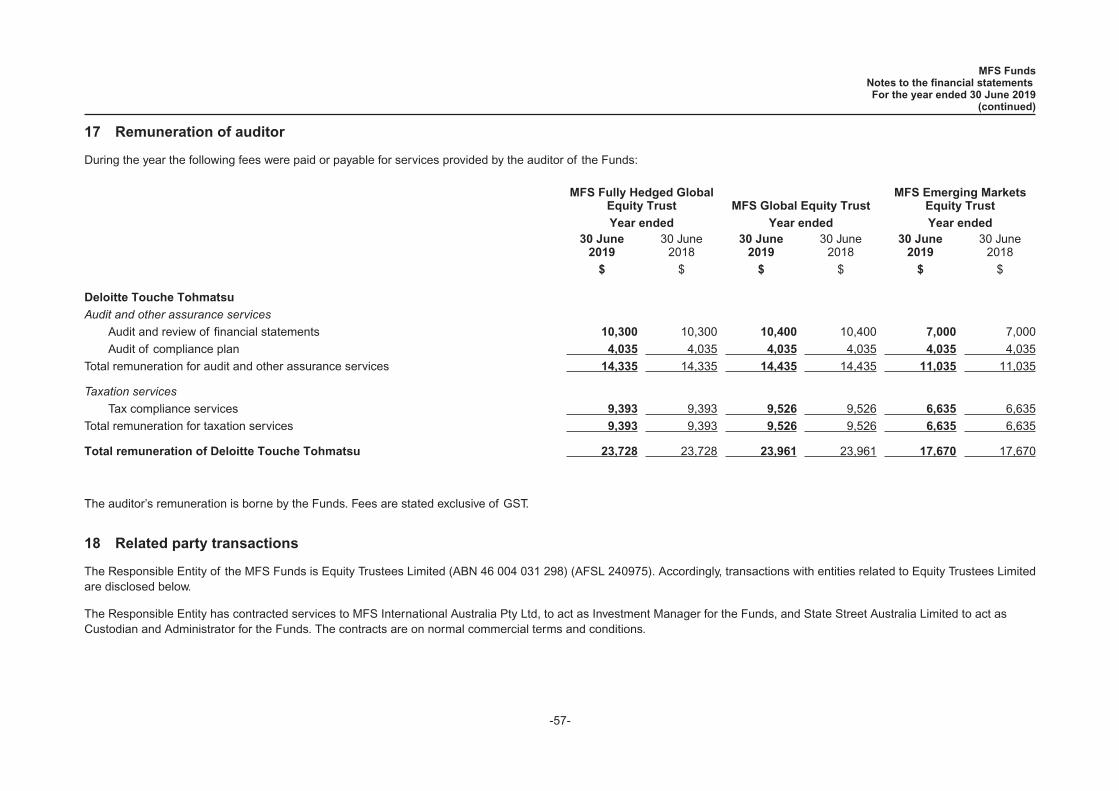
17 Remuneration of auditor
During the year the following fees were paid or payable for services provided by the auditor of the Funds:
MFS Fully Hedged GlobalEquity Trust MFS Global Equity Trust
MFS Emerging MarketsEquity Trust
Year ended Year ended Year ended30 June
201930 June
201830 June
201930 June
201830 June
201930 June
2018
$ $ $ $ $ $
Deloitte Touche Tohmatsu
Audit and other assurance services
Audit and review of financial statements 10,300 10,300 10,400 10,400 7,000 7,000
Audit of compliance plan 4,035 4,035 4,035 4,035 4,035 4,035
Total remuneration for audit and other assurance services 14,335 14,335 14,435 14,435 11,035 11,035
Taxation services
Tax compliance services 9,393 9,393 9,526 9,526 6,635 6,635
Total remuneration for taxation services 9,393 9,393 9,526 9,526 6,635 6,635
Total remuneration of Deloitte Touche Tohmatsu 23,728 23,728 23,961 23,961 17,670 17,670
The auditor’s remuneration is borne by the Funds. Fees are stated exclusive of GST.
18 Related party transactions
The Responsible Entity of the MFS Funds is Equity Trustees Limited (ABN 46 004 031 298) (AFSL 240975). Accordingly, transactions with entities related to Equity Trustees Limitedare disclosed below.
The Responsible Entity has contracted services to MFS International Australia Pty Ltd, to act as Investment Manager for the Funds, and State Street Australia Limited to act asCustodian and Administrator for the Funds. The contracts are on normal commercial terms and conditions.
MFS FundsNotes to the financial statementsFor the year ended 30 June 2019
(continued)
-57-

18 Related party transactions (continued)
(a) Key management personnel
(i) Directors
Key management personnel include persons who were directors of Equity Trustees Limited at any time during or since the end of the financial year and up to the date of this report.
Philip D Gentry (Chairman)
Harvey H Kalman
Ian C Westley
Michael J O’Brien (appointed 11 July 2018)
(ii) Other key management personnel
There were no other key management personnel with responsibility for planning, directing and controlling activities of the Funds, directly or indirectly during the financial year.
(b) Transactions with key management personnel
There were no transactions with key management personnel during the reporting period.
(c) Key management personnel unit holdings
Key management personnel did not hold units in the Funds as at 30 June 2019 (30 June 2018: nil).
(d) Key management personnel compensation
Key management personnel are paid by EQT Services Pty Ltd. Payments made from the Funds to Equity Trustees Limited do not include any amounts directly attributable to thecompensation of key management personnel.
(e) Key management personnel loans
The Funds have not made, guaranteed or secured, directly or indirectly, any loans to key management personnel or their personally related entities at any time during the reportingperiod.
MFS FundsNotes to the financial statementsFor the year ended 30 June 2019
(continued)
-58-
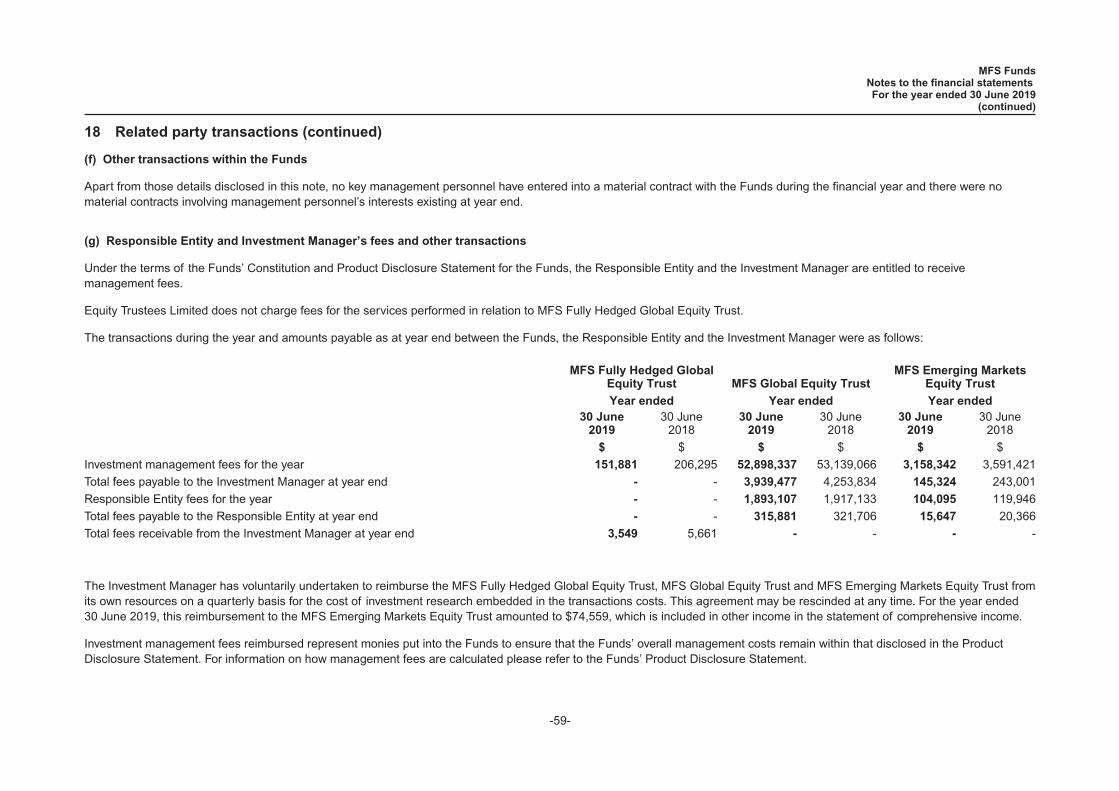
18 Related party transactions (continued)
(f) Other transactions within the Funds
Apart from those details disclosed in this note, no key management personnel have entered into a material contract with the Funds during the financial year and there were nomaterial contracts involving management personnel’s interests existing at year end.
(g) Responsible Entity and Investment Manager’s fees and other transactions
Under the terms of the Funds’ Constitution and Product Disclosure Statement for the Funds, the Responsible Entity and the Investment Manager are entitled to receivemanagement fees.
Equity Trustees Limited does not charge fees for the services performed in relation to MFS Fully Hedged Global Equity Trust.
The transactions during the year and amounts payable as at year end between the Funds, the Responsible Entity and the Investment Manager were as follows:
MFS Fully Hedged GlobalEquity Trust MFS Global Equity Trust
MFS Emerging MarketsEquity Trust
Year ended Year ended Year ended30 June
201930 June
201830 June
201930 June
201830 June
201930 June
2018
$ $ $ $ $ $
Investment management fees for the year 151,881 206,295 52,898,337 53,139,066 3,158,342 3,591,421
Total fees payable to the Investment Manager at year end - - 3,939,477 4,253,834 145,324 243,001
Responsible Entity fees for the year - - 1,893,107 1,917,133 104,095 119,946
Total fees payable to the Responsible Entity at year end - - 315,881 321,706 15,647 20,366
Total fees receivable from the Investment Manager at year end 3,549 5,661 - - - -
The Investment Manager has voluntarily undertaken to reimburse the MFS Fully Hedged Global Equity Trust, MFS Global Equity Trust and MFS Emerging Markets Equity Trust fromits own resources on a quarterly basis for the cost of investment research embedded in the transactions costs. This agreement may be rescinded at any time. For the year ended30 June 2019, this reimbursement to the MFS Emerging Markets Equity Trust amounted to $74,559, which is included in other income in the statement of comprehensive income.
Investment management fees reimbursed represent monies put into the Funds to ensure that the Funds’ overall management costs remain within that disclosed in the ProductDisclosure Statement. For information on how management fees are calculated please refer to the Funds’ Product Disclosure Statement.
MFS FundsNotes to the financial statementsFor the year ended 30 June 2019
(continued)
-59-
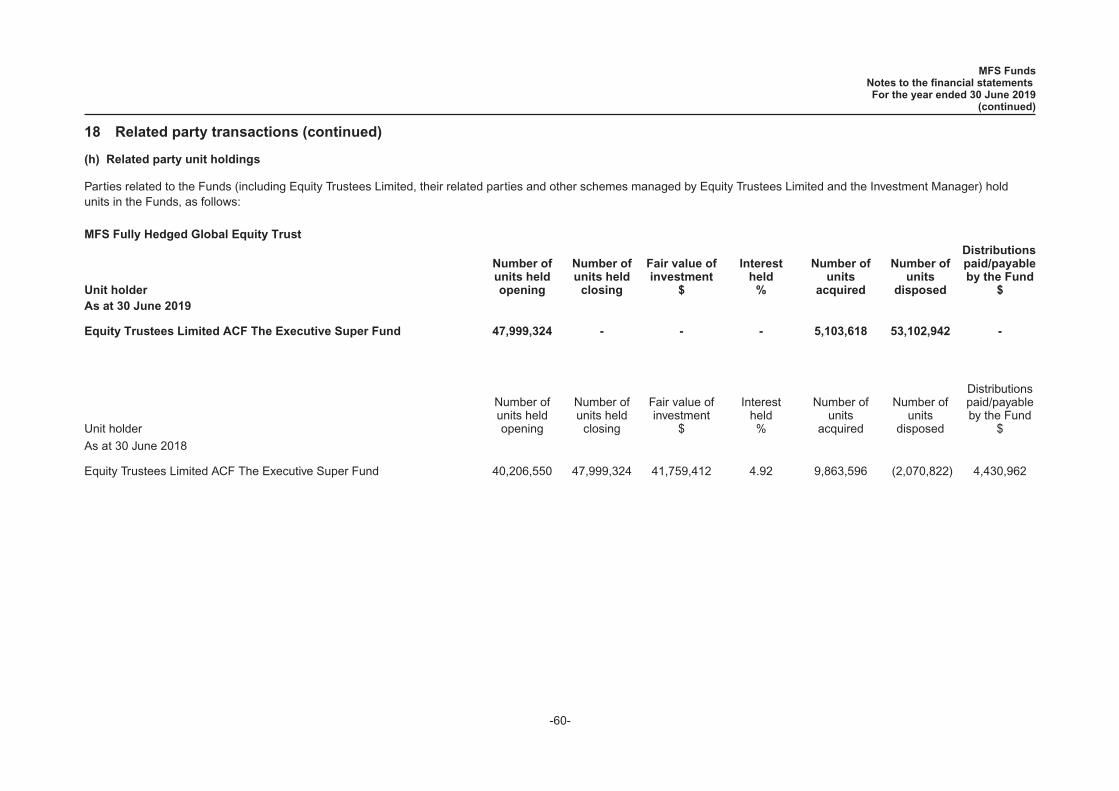
18 Related party transactions (continued)
(h) Related party unit holdings
Parties related to the Funds (including Equity Trustees Limited, their related parties and other schemes managed by Equity Trustees Limited and the Investment Manager) holdunits in the Funds, as follows:
MFS Fully Hedged Global Equity Trust
Unit holder
Number ofunits heldopening
Number ofunits held
closing
Fair value ofinvestment
$
Interestheld
%
Number ofunits
acquired
Number ofunits
disposed
Distributionspaid/payableby the Fund
$As at 30 June 2019
Equity Trustees Limited ACF The Executive Super Fund 47,999,324 - - - 5,103,618 53,102,942 -
Unit holder
Number ofunits heldopening
Number ofunits held
closing
Fair value ofinvestment
$
Interestheld%
Number ofunits
acquired
Number ofunits
disposed
Distributionspaid/payableby the Fund
$
As at 30 June 2018
Equity Trustees Limited ACF The Executive Super Fund 40,206,550 47,999,324 41,759,412 4.92 9,863,596 (2,070,822) 4,430,962
MFS FundsNotes to the financial statementsFor the year ended 30 June 2019
(continued)
-60-

18 Related party transactions (continued)
(h) Related party unit holdings (continued)
MFS Global Equity Trust
Unit holder
Number ofunits heldopening
Number ofunits held
closing
Fair value ofinvestment
$
Interestheld
%
Number ofunits
acquired
Number ofunits
disposed
Distributionspaid/payableby the Fund
$As at 30 June 2019
MFS Fully Hedged Global Equity Trust 436,590,131 391,712,746 830,705,220 12.73 77,946,138 122,823,523 91,687,027
EQT Core International Equity Fund 13,643,686 13,925,584 29,531,986 0.45 1,206,156 924,258 3,259,520
Equity Trustees Limited 6,003,227 5,134,569 10,888,880 0.17 130,952 999,610 1,201,833
Equity Trustees Ltd ACF Freedom of Choice (AMG Super) 2,358,746 1,918,999 4,069,621 0.06 36,447 476,194 449,174
Equity Trustees Ltd ACF Freedom of Choice Portfolio Services 17,798 7,682 16,291 0.00 - 10,116 1,798
Equity Trustees Wealth Services Ltd 572,781 572,781 1,214,697 0.02 - - 134,069
Unit holder
Number ofunits heldopening
Number ofunits held
closing
Fair value ofinvestment
$
Interestheld%
Number ofunits
acquired
Number ofunits
disposed
Distributionspaid/payableby the Fund
$
As at 30 June 2018
MFS Fully Hedged Global Equity Trust 412,944,546 436,590,131 873,180,262 12.98 162,887,527 (139,241,942) 88,842,162
EQT Core International Equity Fund 21,546,641 13,643,686 27,287,371 0.41 2,278,827 (10,181,782) 2,776,367
Equity Trustees Limited 6,656,938 6,003,227 12,006,454 0.18 38,632 (692,343) 1,221,603
Equity Trustees Ltd ACF Freedom of Choice (Executive SF) 2,648,219 2,358,746 4,717,491 0.07 36,867 (326,340) 479,983
Equity Trustees Ltd ACF Freedom of Choice Portfolio Services 17,798 17,798 35,597 0.00 - - 3,622
Equity Trustees Wealth Services Ltd 572,781 572,781 1,145,563 0.02 - - 116,556
Parties related to MFS Emerging Markets Equity Trust (including Equity Trustees Limited, its related parties and other schemes managed by Equity Trustees Limited and theInvestment Manager) held no units in the Fund as at 30 June 2019 (2018: nil).
MFS FundsNotes to the financial statementsFor the year ended 30 June 2019
(continued)
-61-

18 Related party transactions (continued)
(i) Investments
MFS Global Equity Trust and MFS Emerging Markets Equity Trust did not hold any investments in Equity Trustees Limited or their related parties during the year (2018: nil).
MFS Fully Hedged Global Equity Trust held investments in the following schemes which are also managed by Equity Trustees Limited or their related parties:
Fair value ofinvestment
Interestheld
Distributionsreceived
Distributionsreceivable
Unitsacquired
during theyear
Unitsdisposedduring the
yearAs at 30 June 2019 $ % $ $
MFS Global Equity Trust 830,705,220 12.73 91,687,027 91,687,027 77,946,138 122,823,523
Fair value ofinvestment
Interestheld
Distributionsreceived
Distributionsreceivable
Unitsacquired
during theyear
Unitsdisposedduring the
year
As at 30 June 2018 $ % $ $
MFS Global Equity Trust 873,180,262 12.98 88,842,162 88,842,162 162,887,527 (139,241,942)
19 Events occurring after the reporting period
No significant events have occurred since the end of the year which would impact the financial position of the Funds as disclosed in the statement of financial position as at 30 June2019 or on the results and cash flows of the Funds for the year ended on that date.
20 Contingent assets and liabilities and commitments
There are no outstanding contingent assets, liabilities or commitments as at 30 June 2019 and 30 June 2018.
MFS FundsNotes to the financial statementsFor the year ended 30 June 2019
(continued)
-62-

Directors’ declaration
In the opinion of the directors of the Responsible Entity:
(a) The financial statements and notes set out on pages 8 to 62 are in accordance with the Corporations Act 2001, including:
(i) complying with Australian Accounting Standards, the Corporations Regulations 2001 and other mandatory professional reporting requirements; and
(ii) giving a true and fair view of the Funds’ financial position as at 30 June 2019 and of their performance for the financial year ended on that date.
(b) There are reasonable grounds to believe that the Funds will be able to pay their debts as and when they become due and payable; and
(c) Note 2(a) confirms that the financial statements also comply with the International Financial Reporting Standards as issued by the International Accounting StandardsBoard.
This declaration is made in accordance with a resolution of the directors of Equity Trustees Limited through a delegated authority given by Equity Trustees Limited’s Board.
Philip D GentryChairman
Melbourne12 September 2019
MFS FundsDirectors’ declaration
30 June 2019
-63-

Liability limited by a scheme approved under Professional Standards Legislation.
Member of Deloitte Asia Pacific Limited and the Deloitte Network.
Deloitte Touche Tohmatsu
ABN 74 490 121 060
550 Bourke Street
Melbourne VIC 3000
GPO Box 78
Melbourne VIC 3001 Australia
Tel: +61 3 9671 7000
Fax: +61 3 9671 7001
www.deloitte.com.au
Independent Auditor’s Report to the Unit Holders of
MFS Funds
Opinion
We have audited the financial reports of MFS Emerging Markets Equity Trust, MFS Fully Hedged
Global Equity Trust and MFS Global Equity Trust (collectively the “MFS Funds” or the “Funds”) which
comprises the statements of financial position as at 30 June 2019, the statements of comprehensive
income, the statements of cash flows and the statements of changes in equity for the year ended on
that date, and notes to the financial statements, including a summary of significant accounting
policies and other explanatory information, and the Directors’ declaration.
In our opinion, the accompanying financial reports of the Funds are in accordance with the
Corporations Act 2001, including:
(i) giving a true and fair view of the Funds’ financial position as at 30 June 2019 and of their
financial performance for the year then ended; and
(ii) complying with Australian Accounting Standards and the Corporations Regulations 2001.
Basis for Opinion
We conducted our audits in accordance with Australian Auditing Standards. Our responsibilities under
those standards are further described in the Auditor’s Responsibilities for the Audit of the Financial
Report section of our report. We are independent of the Funds in accordance with the auditor
independence requirements of the Corporations Act 2001 and the ethical requirements of the
Accounting Professional and Ethical Standards Board’s APES 110 Code of Ethics for Professional
Accountants (the Code) that are relevant to our audits of the financial reports in Australia. We have
also fulfilled our other ethical responsibilities in accordance with the Code.
We confirm that the independence declaration required by the Corporations Act 2001, which has
been given to the directors of the Responsible Entity of the Funds (the “Directors”), would be in the
same terms if given to Directors as at the time of this auditor’s report.
We believe that the audit evidence we have obtained is sufficient and appropriate to provide a basis
for our opinion.
Other Information
The Directors are responsible for the other information. The other information comprises the
information included in the Directors’ report for the year ended 30 June 2019, but does not include
the financial reports and our auditor’s report thereon.
Our opinion on the financial reports does not cover the other information and we do not express any
form of assurance conclusion thereon.

In connection with our audits of the financial reports, our responsibility is to read the other
information and, in doing so, consider whether the other information is materially inconsistent with
the financial reports or our knowledge obtained in the audits, or otherwise appears to be materially
misstated. If, based on the work we have performed, we conclude that there is a material
misstatement of this other information, we are required to report that fact. We have nothing to report
in this regard.
Responsibilities of the Directors for the Financial Reports
The Directors are responsible for the preparation of the financial reports that gives a true and fair
view in accordance with Australian Accounting Standards and the Corporations Act 2001 and for such
internal control as the Directors determine is necessary to enable the preparation of the financial
reports that gives a true and fair view and is free from material misstatement, whether due to fraud
or error.
In preparing the financial reports, the Directors are responsible for assessing the ability of the Funds
to continue as a going concern, disclosing, as applicable, matters related to going concern and using
the going concern basis of accounting unless the Directors either intend to liquidate the Funds or to
cease operations, or has no realistic alternative but to do so.
Auditor’s Responsibilities for the Audits of the Financial Reports
Our objectives are to obtain reasonable assurance about whether the financial reports as a whole
are free from material misstatement, whether due to fraud or error, and to issue an auditor’s report
that includes our opinion. Reasonable assurance is a high level of assurance, but is not a guarantee
that an audit conducted in accordance with the Australian Auditing Standards will always detect a
material misstatement when it exists. Misstatements can arise from fraud or error and are considered
material if, individually or in the aggregate, they could reasonably be expected to influence the
economic decisions of users taken on the basis of these financial reports.
As part of an audit in accordance with the Australian Auditing Standards, we exercise professional
judgement and maintain professional scepticism throughout the audit. We also:
Identify and assess the risks of material misstatement of the financial reports, whether due
to fraud or error, design and perform audit procedures responsive to those risks, and obtain
audit evidence that is sufficient and appropriate to provide a basis for our opinion. The risk
of not detecting a material misstatement resulting from fraud is higher than for one resulting
from error, as fraud may involve collusion, forgery, intentional omissions,
misrepresentations, or the override of internal control.
Obtain an understanding of internal control relevant to the audits in order to design audit
procedures that are appropriate in the circumstances, but not for the purpose of expressing
an opinion on the effectiveness of the Funds’ internal control.
Evaluate the appropriateness of accounting policies used and the reasonableness of
accounting estimates and related disclosures made by the Directors.
Conclude on the appropriateness of the Directors’ use of the going concern basis of
accounting and, based on the audit evidence obtained, whether a material uncertainty exists
related to events or conditions that may cast significant doubt on the Funds’ ability to
continue as a going concern. If we conclude that a material uncertainty exists, we are
required to draw attention in our auditor’s report to the related disclosures in the financial
reports or, if such disclosures are inadequate, to modify our opinion. Our conclusions are
based on the audit evidence obtained up to the date of our auditor’s report. However, future
events or conditions may cause the Funds to cease to continue as a going concern.
Evaluate the overall presentation, structure and content of the financial reports, including
the disclosures, and whether the financial reports represent the underlying transactions and
events in a manner that achieves fair presentation.

We communicate with the Directors regarding, among other matters, the planned scope and timing
of the audits and significant audit findings, including any significant deficiencies in internal control
that we identify during our audits.
DELOITTE TOUCHE TOHMATSU
Chester Hii
Partner
Chartered Accountants
Melbourne, 12 September 2019