Mexico Sugar Annual Mexico Sugar Annual Report · 4/16/2015 · contracting mills. In exchange,...
12
THIS REPORT CONTAINS ASSESSMENTS OF COMMODITY AND TRADE ISSUES MADE BY USDA STAFF AND NOT NECESSARILY STATEMENTS OF OFFICIAL U.S. GOVERNMENT POLICY Date: GAIN Report Number: Approved By: Prepared By: Report Highlights: Mexican sugar production for marketing year 2015/16 is forecast to be at 6.5 million metric tons raw- value (MMT-RV), although there is not yet an official forecast. Sugar production for MY 2014/15 was revised downward to 6.4 MMT-RV. The sugar export forecast for MY 2015/16 is 1.8 MMT-RV. Post /New total sugar export estimate for MY 2014/15 is 1.6 MMT-RV, where exports to the United States under the suspension agreements are 1,383,969.68 MT-RV. The high fructose corn syrup (HFCS) import forecast for MY 2015/16 is expected to be similar to MY 2014/15 imports, as sugar prices remain low. Dulce Flores and Alicia Hernandez Lloyd Harbert Mexico Sugar Annual Report Sugar Annual Mexico MX5017 4/16/2015 Required Report - public distribution
Transcript of Mexico Sugar Annual Mexico Sugar Annual Report · 4/16/2015 · contracting mills. In exchange,...

THIS REPORT CONTAINS ASSESSMENTS OF COMMODITY AND TRADE ISSUES MADE BY
USDA STAFF AND NOT NECESSARILY STATEMENTS OF OFFICIAL U.S. GOVERNMENT
POLICY
Date:
GAIN Report Number:
Approved By:
Prepared By:
Report Highlights:
Mexican sugar production for marketing year 2015/16 is forecast to be at 6.5 million metric tons raw-
value (MMT-RV), although there is not yet an official forecast. Sugar production for MY 2014/15 was
revised downward to 6.4 MMT-RV. The sugar export forecast for MY 2015/16 is 1.8 MMT-RV. Post
/New total sugar export estimate for MY 2014/15 is 1.6 MMT-RV, where exports to the United States
under the suspension agreements are 1,383,969.68 MT-RV. The high fructose corn syrup (HFCS)
import forecast for MY 2015/16 is expected to be similar to MY 2014/15 imports, as sugar prices
remain low.
Dulce Flores and Alicia Hernandez
Lloyd Harbert
Mexico Sugar Annual Report
Sugar Annual
Mexico
MX5017
4/16/2015
Required Report - public distribution

MX5017 Mexico Sugar Annual Report Page 2
Commodities:
PRODUCTION
Sugar
The Mexican sugar industry expects sugar production levels for marketing year (MY) 2015/16
(October/September) to be close to 6.5 MMT-RV as appropriate cultivation practices, such as
application of fertilizers, pesticides, crop rotation, and pruning, have not been as expected due to lower
export expectations. Although there is not yet an official Mexican forecast for sugar production for MY
2015/16, the Post/New forecast is 6.5 MMT-RV. According to recent reports, renewal of cane fields
continues. Final production will depend on timely maintenance of sugar mills, appropriate cultivation
practices, weather throughout the growing season, and harvest conditions.
In March 2015, the Mexican National Committee for the Sustainable Development of Sugar Cane
(CONADESUCA) issued a second estimate of Sweeteners Production for MY 2014/15 setting sugar
production at 6.5 MMT-RV (6.15 MMT- Actual Weight). Nonetheless, due to weather issues and heavy
rainfall during March 2015, the Post/New estimate is at 6.4 MMT-RV. Mill yields are estimated at 11.1
percent.
According to the Advance Report # 22, from April 4, 2015, the harvest is advancing with respect to the
first estimate of 63 percent of area harvested, 68 percent of milled sugarcane, and 67 percent of sugar
production. However, there is an accumulated deficit of sugar production of 320,363 MT Actual
Weight (339,584 MT-RV) in the current output compared to the first estimate of sugar production (See
Table 1). Official production estimates in Mexico for MY 2013/14 remain unchanged from previous
estimates.
Table 1. Mexico -Sugar Production – Week 27
MY 2014/15 Area Harvested
(Has)
Milled cane
(MT)
Sugar production (MT-Actual
Weight) Mill
Yield
%
Current MY
2014/2015
514,936 37,586,491 4,179,641 11.12
1st. Estimate 2014/15 601,082 40,775,620 4,500,005 11.04
Source: CONADESUCA Report #22 for 2014/15 April 4, 2015
According to reports from CONADESUCA, fifty mills were operating throughout the country by April
2015 and CONADESUCA is expecting two more mills to begin processing soon. Due to rainfall,
Sugar

MX5017 Mexico Sugar Annual Report Page 3
harvesting of sugarcane has been slower than expected and is currently about eight percent behind the
first estimates for MY 2014/15. Some areas in northern Veracruz could slow down harvesting due to
the March rainfall.
Growers are organized within two major unions that represent over 95 percent of all cane growers.
These unions are the National Sugarcane Growers (affiliated with the CNC- a strong organization of
peasants/small agricultural producers that is very close to the ruling PRI Party) and the National
Association of Sugarcane Growers (CNPR). All growers operate with contracts to deliver their cane to
contracting mills. In exchange, they receive technical support and agrochemicals from the mills to grow
cane. The industry has been fostering better working relationships between mills and sugarcane grower
associations to better integrate overall sugar production.
Sugarcane Production
Although there is no official Mexican forecast for sugarcane production for MY 2015/16, based on past
performance, the Post/New forecast of cane to be processed is 55.0 MMT. This forecast is close to
Post’s cane production estimate for the current year, as market uncertainties are not encouraging
investments in cane production. Final production will depend on appropriate cultivation practices and
weather conditions throughout the growing season. Current price uncertainties may discourage best
management practices (e.g., less fertilizer applications) and expansion of production areas. The
Post/New estimate for sugarcane production to be processed for MY 2014/15 was revised downward
from previous estimates to 55.0 MMT. The industry estimates overall cane yields at 67.3 MT/hectare
(Ha) for MY 2014/15, slightly lower than MY 2013/14 yields of 68.7 MT/Ha. Sugarcane production for
MY 2013/14 remains unchanged.
As previously reported, virtually all sugarcane goes to the production of centrifugal sugar. Mills operate
between November and May to coincide with the cane harvest. Although there is no official Mexican
MY 2015/16 forecast for cane planted area, it is expected that area will continue at about the same or
836,000 Ha. According to the information service SAGARPA/SIAP, area planted data includes area
planted in past marketing years, as well as additional new areas, since the growing phase of this crop is
approximately 18 months. In addition to sugar prices, area expansion will depend on weather
conditions, production cost changes, and the level of continued investment by sugar mills. Post/New
estimate for MY 2014/15 for area planted was revised slightly downwards to 835,000 Ha and the
estimate for area harvested was revised upward to 816,000 Ha, based on CONADESUCA’s estimates.
The Post/New MY 2013/14 planted and harvested estimates remain unchanged.
Sugarcane Reference Price
Cane growers receive payment for their cane from sugar mills. The price is negotiated each year and is
based on a complex formula involving sugar prices and other domestic and international market
conditions. These factors are used to determine the Sugarcane Reference Price. According to Article 58
MX5017 Mexico Sugar Annual Report Page 4
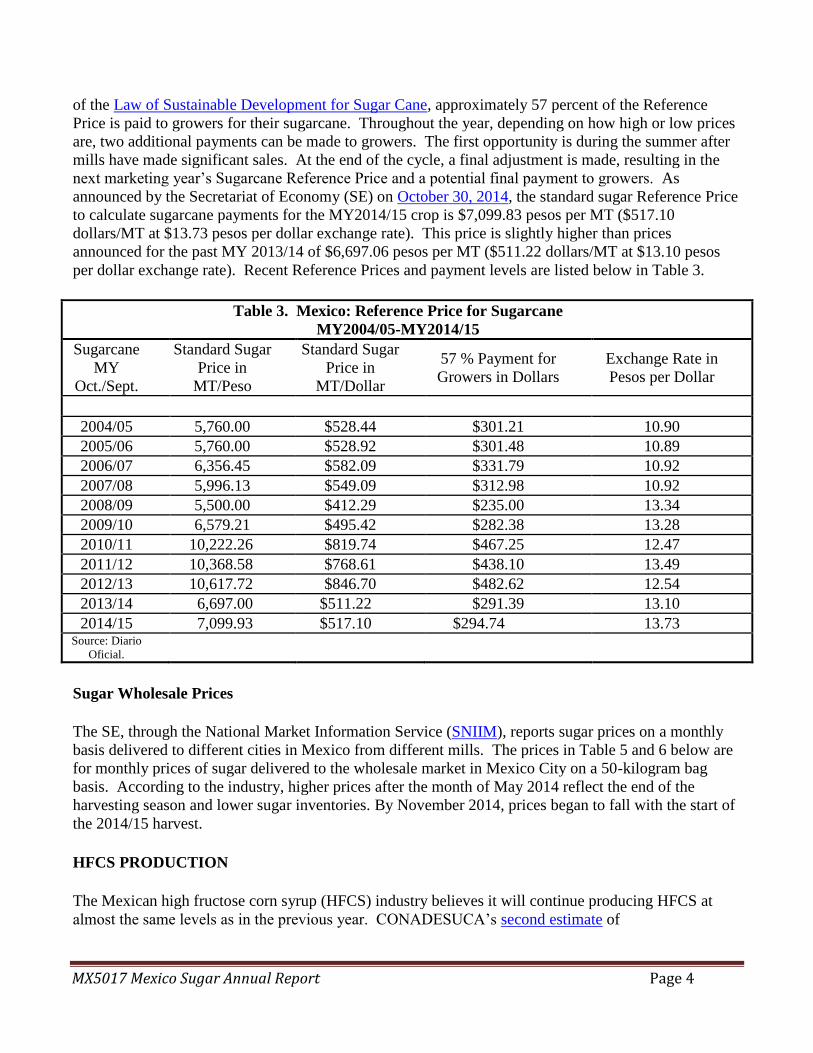
of the Law of Sustainable Development for Sugar Cane, approximately 57 percent of the Reference
Price is paid to growers for their sugarcane. Throughout the year, depending on how high or low prices
are, two additional payments can be made to growers. The first opportunity is during the summer after
mills have made significant sales. At the end of the cycle, a final adjustment is made, resulting in the
next marketing year’s Sugarcane Reference Price and a potential final payment to growers. As
announced by the Secretariat of Economy (SE) on October 30, 2014, the standard sugar Reference Price
to calculate sugarcane payments for the MY2014/15 crop is $7,099.83 pesos per MT ($517.10
dollars/MT at $13.73 pesos per dollar exchange rate). This price is slightly higher than prices
announced for the past MY 2013/14 of $6,697.06 pesos per MT ($511.22 dollars/MT at $13.10 pesos
per dollar exchange rate). Recent Reference Prices and payment levels are listed below in Table 3.
Table 3. Mexico: Reference Price for Sugarcane MY2004/05-MY2014/15
Sugarcane
MY
Oct./Sept.
Standard Sugar
Price in MT/Peso
Standard Sugar
Price in MT/Dollar
57 % Payment for
Growers in Dollars Exchange Rate in
Pesos per Dollar
2004/05 5,760.00 $528.44 $301.21 10.90
2005/06 5,760.00 $528.92 $301.48 10.89
2006/07 6,356.45 $582.09 $331.79 10.92
2007/08 5,996.13 $549.09 $312.98 10.92
2008/09 5,500.00 $412.29 $235.00 13.34
2009/10 6,579.21 $495.42 $282.38 13.28
2010/11 10,222.26 $819.74 $467.25 12.47
2011/12 10,368.58 $768.61 $438.10 13.49
2012/13 10,617.72 $846.70 $482.62 12.54
2013/14 6,697.00 $511.22 $291.39 13.10
2014/15 7,099.93 $517.10 $294.74 13.73 Source: Diario
Oficial.
Sugar Wholesale Prices
The SE, through the National Market Information Service (SNIIM), reports sugar prices on a monthly
basis delivered to different cities in Mexico from different mills. The prices in Table 5 and 6 below are
for monthly prices of sugar delivered to the wholesale market in Mexico City on a 50-kilogram bag
basis. According to the industry, higher prices after the month of May 2014 reflect the end of the
harvesting season and lower sugar inventories. By November 2014, prices began to fall with the start of
the 2014/15 harvest.
HFCS PRODUCTION
The Mexican high fructose corn syrup (HFCS) industry believes it will continue producing HFCS at
almost the same levels as in the previous year. CONADESUCA’s second estimate of

MX5017 Mexico Sugar Annual Report Page 5
Sweeteners Production for MY 2014/15 increased its HFCS domestic production estimate to 503,186
MT dry basis compared to 498,820 MT dry basis in MY 2013/14. This level is nearly at the industry’s
maximum capacity. Industry members indicate that there is no additional HFCS manufacturing
capacity being built or expanded in Mexico. Sources report that as long as HFCS prices remain
competitive, it is easier and more financially prudent to import the remainder of the HFCS demand.
The Mexican HFCS industry produces fructose with domestic and imported U.S. yellow corn.
According to IDAQUIM, the industry group that represents HFCS producers, this industry consumes
about two million tons of yellow corn of which 80 to 90 percent is imported. The Government of
Mexico continues to encourage forward contract purchases between Mexican farmers and yellow corn
buyers in an attempt to increase domestic production of yellow corn but it seems the results have not
been as optimistic as expected and domestic production of yellow corn remains small. Currently the
State of Chihuahua produces about 1.2 million tons of yellow corn and the State of Jalisco produces
about 400,000 tons of yellow corn. The United States will remain the main supplier of yellow corn to
Mexico.
CONSUMPTION
Sugar and HFCS
Assuming current pricing trends for sugar and fluctuating exchange rates, the sugar industry could
expect sugar consumption for MY 2015/16 to grow at a rate slower than last year. Therefore, the
Post/New forecast for domestic consumption for MY 2015/16 is 4.53 MMT-RV. Consumption will
also depend on the substitution of sugar by HFCS.
As reported in January 2014, a value added tax of $1.00 peso/liter (US $0.076/liter) was imposed on
artificially sweetened soft drinks. During the first quarter of 2014, soft drink sales dropped more than
five percent, followed by a four percent drop in sales the second quarter, and a two percent decline the
second half of the year. This decrease in soft drink consumption weakened demand for HFCS and
caused some soft drink producers to alter their recipes to use more sugar, which is currently cheaper
than HFCS. The Post/New estimate for domestic sugar consumption for MY 2014/15 was revised
upward accordingly based on recent official estimates to 4.50 MMT-RV. This increase is also a
consequence of the implementation of the suspension agreements, as less sugar will be exported to the
United States making more sugar available for consumption in the domestic market and pressuring
prices downward. (See Trade Section). The Post/New domestic sugar consumption estimate for MY
2013/14 remains unchanged from previous estimates.
Substitution between HFCS and sugar has been increasing in several industries, including soda bottling
(the largest user of HFCS), over the last few years. However, this change was not enough to increase
consumption as much as previously expected. Trends indicate that substitution between sugar and
HFCS will likely result in a 1.5 percent decrease in HFCS consumption in MY 2014/15 or 1.35 MMT
dry basis. This volume of HFCS represents about 23.5 percent of total domestic sweeteners
consumption. HFCS consumption depends on domestic sugar prices, imported corn prices, and more
importantly on current exchange rates.
Consumption of HFCS for MY 2013/14 remains at 1.37 MMT dry basis, lower than MY 2012/13
consumption of 1.5 MMT dry basis. Industry indicated that lower sugar prices led the soft drink

MX5017 Mexico Sugar Annual Report Page 6
industry to substitute more sugar for HFCS, thus reducing HFCS consumption in their products. This
trend could continue for MY 2015/16, as Mexico is exporting smaller quantities of refined sugar to the
United States, however, bottlers are limited in their ability to substitute sugar for HFCS by infrastructure
and soda formulas. Still, there is uncertainty on how consumption of HFCS will behave due to the sugar
suspension agreements and availability of domestic sugar (See Trade Section).
TRADE
Sugar
On October 28, 2014, the United States and Mexico came to an agreement to avoid antidumping (AD)
and countervailing duties (CVD) on U.S. sugar imports from Mexico. On December 19, 2014, both
governments signed these two suspension agreements. On January 8, 2015, two U.S. industry parties
filed a petition requesting that the U.S. International Trade Commission review the suspension
agreements to determine whether they completely eliminate the injury caused by the alleged dumping of
Mexican sugar. On January 16, 2015, these two parties filed another request with the Department of
Commerce to continue the AD and CVD investigations. Thursday March 19, 2015, ITC Commissioners
voted unanimously in favor of upholding the suspension agreements. The official opinion should be
released later. Meanwhile, Mexico is complying with the agreements to be able to export sugar to the
United States.
The Post/New sugar export forecast for MY 2015/16 is 1.8 MMT-RV. This number is tentative and will
tend to change depending on production, U.S. and international sugar and sweeteners (HFCS) prices,
and the degree to which the Mexican industry is able to comply with the sugar suspension agreements.
CONADESUCA indicates that for MY 2014/15 they are expecting sugar exports at 1.9 MMT-RV, even
though the sugar sector has been concerned about domestic surpluses, falling international prices, the
suspension agreements, and finding third-country markets for Mexican sugar. Therefore, Post/New
total sugar exports estimates for MY 2014/15 were revised downward to 1.6 MMT-RV, where exports
to the United States under the suspension agreements are 1,383,969.68 MMT-RV. The rest is expected
to be exported to third-country markets.
On February 11, 2015, Mexico announced the amount of the total quota of Mexican sugar derived from
sugarcane or beets to be exported to the United States from October 2014-September 2015. The amount
was 1,162,604.75 MT-RV. This announcement was published following a previous announcement of
the guidelines, on February 6, 2015, to request and receive sugar export licenses, in accordance with the
suspension agreements. On March 30, 2015, an adjustment to the quota to be exported to the United
States was published in the Diario Oficial for a total amount of 1,383,969.68 MMT-RV, in compliance
with Point 13 of the February 6, 2015 notification. This calculation was determined based on the March
2015 World Agricultural Supply and Demand Estimates (WASDE) and Mexico’s CONADESUCA data.
The SE is in charge of closely following sugar exports via licenses so that they do not exceed the
established quota to the United States.
According to data, through March, Mexico has exported 438,242 MT-RV of sugar, mostly to the United
States. Exports are substantially lower than previous years because Mexican exporters were holding
back shipments due to the uncertainty surrounding the suspension agreements and the fact that the
guidelines to obtain export licenses were not published until the first week of February. Mexico now has
to quickly export more sugar to the United States as domestic inventories are high. The total export
number is tentative and will tend to change depending on production and the extent of substitution

MX5017 Mexico Sugar Annual Report Page 7
between sugar and alternative domestic and imported sweeteners (HFCS), and total exports under the
suspension agreements. The Mexican sugar export estimate for MY 2013/14 was revised downward
based on official data.
The Post/New sugar import forecast for MY 2015/16 is estimated at 184,000 MT-RV, as domestic
supplies are expected to remain adequate. A large portion of these imports could be used to cover the
needs of the Mexican Sugar Re-export Program industries (IMMEX). The MY 2013/14 sugar import
estimate was revised upward and MY 2014/15 estimate was revised downward from previous estimates
as domestic supplies are expected to provide more sugar for the IMMEX program.
SE recently submitted a proposal to modify the IMMEX program to Mexico’s equivalent of the Office
of Management Budget, COFEMER. This proposal states that IMMEX-certified companies can only
import sugar if that sugar does not benefit from the U.S. Sugar Re-export Program. IMMEX regulations
require that this sugar be transformed into a product with an HTS code that is not included in the Annex
II-A list so that it does not count against Mexico’s sugar export limit to the United States, and then
exported within a specific timeframe. This proposal is intended to comply with the sugar suspension
agreements and is expected to become a final regulation by end of April 2015.
Sugar use under the “other disappearance” category is mainly for the IMMEX program. The Post/New
forecast for MY 2015/16 for sugar use under IMMEX is 343,000 MT-RV based on CONADESUCA’s
information. According to sources, the same industries will be using imported sugar for the processing
of their products. The Post/New estimates for sugar use under IMMEX for MY 2013/14 were revised
upward and MY 2014/15 estimates were revised downward from previous estimates as more domestic
sugar is being used for the IMMEX program. The Government of Mexico is reporting IMMEX sugar
use for MY 2014/15 under the consumption section, whereas before it was reported under the sugar
export section.
HFCS Imports
The HFCS import forecast for MY 2015/16 is expected to be similar to MY 2014/15 imports, as sugar
has continued to be accessible, and the U.S. dollar exchange rate versus the Mexican peso has increased,
thus making HFCS imports more expensive. According to CONADESUCA’s second estimate, imports
of HFCS for MY 2014/15 will be about 880,600 MMT dry basis compared to MY 2013/14 imports of
912,535 MMT dry basis. Imports of HFCS slowed down during 2014, especially the first semester, due
to lower consumption of soft drinks resulting from the special tax on calorically sweetened drinks (See
Consumption Section).
STOCKS
The Post/New sugar ending stock forecast for MY 2015/16 is 1.0 MMT-RV based on expected sugar
production. However, sugar prices and exports will determine the final data. Post/New stocks for MY
2014/15 are likely to end at 1.0 MT-RV based on lower than expected sugar exports. The Post/New
sugar ending stock estimate for MY2013/14 remains unchanged at 881,000 MT-RV.
Sugar stocks in Mexico are held by both government mills and private mills and traders.

MX5017 Mexico Sugar Annual Report Page 8
POLICY
Selling of State Owned Sugar Mills
On March 26, 2015, Mexico’s Service of Administration and Disposition of Assets (SAE) announced
the public tender of nine sugar mills that were administered by FEESA, a fund created in 2001 to
administer the government expropriated sugar mills. The mills are: El Potrero, El Modelo, Providencia,
San Cristobal, and San Miguelito from the State of Veracruz, Casasano and Emiliano Zapata from the
State of Morelos, Plan de San Luis in the State of San Luis Potosi, and finally Atencingo in the State of
Puebla. The mills will be offered in five packages. Additional information on the mills such as location,
production, general information of the sugar sector in Mexico, and how to participate in the tender, can
be found at the SAE’s page as follows: http://ingenios.sae.gob.mx/paginas/default.aspx
Ethanol Production
The Biofuels Law, which first passed the Mexican Congress on April 26, 2007, and was amended in
October 2007, was published in the Diario Oficial on February 1, 2008. The Law contains a
comprehensive biofuels policy that promotes ethanol production from different agricultural
commodities. According to the sugar mill industry, ethanol production from sugarcane in Mexico is
still not as profitable as producing sugar due to the high price of cane, the need for the vast majority of
production to be used for centrifugal sugar, and more importantly the lack of a domestic ethanol
market. There are, however, provisions within the Sugar Law that contain overall goals focused on the
possibility of producing ethanol. PEMEX published a public bid in September 10, 2014, to purchase
ethanol for blending into gasoline on a trial basis, and released results on March 19, 2015. Six
companies will be supplying ethanol to four PEMEX terminal plants; applications from two other
terminals were declared void. As a result of this bid, PEMEX will purchase a minimum amount of
$524.5 million dollars and a maximum of $751.2 million dollars of ethanol produced in Mexico,
through 10 year contracts, allowing a purchase of about 123 million liters per year. There is still no
clear information as to the selling price of ethanol as some sources indicate that the current price is
about $12 pesos/liter (USD$0.78/liter) and PEMEX could be buying at $8.50 pesos/liter
(USD$0.55/liter).
PEMEX indicates that in this first stage 60,000 barrels a day of gasoline blended with ethanol will be
sold in the states of Tamaulipas, San Luis Potosi, and Veracruz. The business model that has been
developed allows buying ethanol at a competitive price at the same time that PEMEX supports regional
producers of sugarcane in Veracruz and sorghum in Tamaulipas. Meanwhile, ethanol trials for blending
into gasoline have been successful in several places in Mexico including Nuevo Leon and Veracruz.
INFORMATION RESOURCES
The National Committee for the Sustainable Development of Sugar Cane (CONADESUCA)
The National Chamber for the Sugar and Alcohol Industries (CNIAA)
The National Service of Market Information (SNIIM-ECONOMIA)
STATISTICAL TABLES
Table 3. Mexico: Centrifugal Sugar PS&D

MX5017 Mexico Sugar Annual Report Page 9
Sugar, Centrifugal 2013/2014 2014/2015 2015/2016
Market Begin Year Oct 2013 Oct 2014 Oct 2016
Mexico USDA Official New post USDA Official New post USDA Official New post
Beginning Stocks 1,548 1,548 881 881 0 1,030
Beet Sugar Production 0 0 0 0 0 0
Cane Sugar Production 6,383 6,382 6,508 6,413 0 6,500
Total Sugar Production 6,383 6,382 6,508 6,413 0 6,500
Raw Imports 0 0 0 0 0 0
Refined Imp.(Raw Val) 137 183 229 184 0 184
Total Imports 137 183 229 184 0 184
Total Supply 8,068 8,113 7,618 7,478 0 7,714
Raw Exports 0 0 0 0 0 0
Refined Exp.(Raw Val) 2,644 2,545 1,779 1,600 0 1,800
Total Exports 2,644 2,545 1,779 1,600 0 1,800
Human Dom. Consumption 4,344 4,344 4,452 4,505 0 4,530
Other Disappearance 199 343 408 343 0 343
Total Use 4,543 4,687 4,860 4,848 0 4,873
Ending Stocks 881 881 979 1,030 0 1,041
Total Distribution 8,068 8,113 7,618 7,478 0 7,714
1000 MT
Table 4. Mexico: Sugar Cane for Centrifugal PS&D
Sugar Cane for Centrifugal 2013/2014 2014/2015 2015/2016
Market Begin Year Nov 2014 Nov 2015 Nov 2016
Mexico USDA Official New post USDA Official New post USDA Official New post
Area Planted 836 836 836 835 0 836
Area Harvested 790 790 790 816 0 800
Production 54,329 54,329 56,000 55,000 0 55,000
Total Supply 54,329 54,329 56,000 55,000 0 55,000
Utilization for Sugar 54,329 54,329 56,000 55,000 0 55,000
Utilization for Alcohol 0 0 0 0 0 0
Total Utilization 54,329 54,329 56,000 55,000 0 55,000
1000 HA, 1000 MT
Table 5. Mexico: Average Wholesale Sugar Prices in Mexico City MX Pesos per 50 Kilograms – Bulk (CIF Basis) Table 3. Mexico:in Mexico City
MX Pesos per 50 Kilograms – Bulk (CIF Basis) Month Standard Refined
2013 2014 Percent Change 2013 2014 Percent Change
January 371.63 380.75 2.45 434.17 430.42 (0.86)
February 393.50 345.50 (12.19) 450.83 416.83 (7.54)
March 391.00 343.25 (12.21) 458.75 422.83 (7.82) April 341.73 337.90 (1.12) 452.40 420.33 (7.08) May 309.63 362.38 17.03 410.58 426.67 3.91 June 343.13 432.50 26.04 400.17 466.25 16.51 July 337.80 422.70 25.13 393.80 462.85 17.53 August 366.92 438.75 19.57 398.75 470.00 17.86
September 349.25 457.50 30.99 391.00 487.06 24.56

MX5017 Mexico Sugar Annual Report Page 10
Table 5. Mexico: Average Wholesale Sugar Prices in Mexico City MX Pesos per 50 Kilograms – Bulk (CIF Basis) Table 3. Mexico:in Mexico City
MX Pesos per 50 Kilograms – Bulk (CIF Basis) October 310.10 456.50 47.21 379.67 493.84 30.00
November 365.50 431.00 17.92 379.59 509.92 34.33
December 399.73 397.80 00.13 435.70 525.93 21.16
Source: Servicio Nacional de Información de Mercados SNIIM-ECONOMIA
Table Table 6. Mexico: Average Wholesale Sugar Prices in Mexico City MX Pesos per 50 Kilograms – Bulk (CIF Basis) Table 4. Mexico: rams – Bulk (CIF
Basis) Month Standard Refined
2014 2015 Percent Change 2014 2015 Percent Change
January 380.75 387.25 1.70 430.42 498.42 15.79
February 345.50 378.50 9.55 416.83 492.92 18.61
March 343.25 370.60 7.96 422.83 486.07 14.95
April 337.90 385.00* 13.93 420.33 481.67* 14.59
May 362.38 426.67
June 432.50 466.25
July 422.70 462.85
August 438.75 470.00
September 457.50 487.06
October 456.50 493.84
November 431.00 509.92
December 397.80 525.93
Source: Servicio Nacional de Información de Mercados SNIIM-ECONOMIA
*Through 1st Week of April 2015
Table 7. Mexico: Monthly Exchange Rate
Averages for 2012-2015
MX Pesos per U.S. $1.00
2012 2013 2014 2015
January 13.46 12.71 13.20 14.68
February 12.79 12.69 13.28 14.92
March 12.75 12.54 13.22 15.21
April 13.05 12.21 13.29 15.02*
May 13.60 12.95 12.93
June 13.94 12.94 12.99
July 13.37 12.77 12.97
August 13.18 12.89 13.14
September 12.95 13.08 13.21
October 12.88 13.00 13.47

MX5017 Mexico Sugar Annual Report Page 11
November 13.08 13.07 13.59
December 12.86 13.00 14.44
Annual Avg 13.15 12.76 13.29
*As of 1st Week of April 2015 Source: Mexican Federal Register Note: Monthly rates are averages of daily exchange rates from the Banco de Mexico
Table 8. Mexico: Trade Matrices HFCS Trade
HFCS 1702460 Unit: Metric Tons Dry Basis
Exports for MY 2013/14 (Oct-Sept) to: Imports for MY 2013/14 (Oct-Sept) from:
U.S. 21,853 U.S. 824,821
Germany 3,689 Canada 2,793
Other 8,078 Other 0
TOTAL 33,620 TOTAL 827,614
SOURCE: Global Trade Information Services, Inc. Global Trade Atlas, Mexico Edition, December 2014
HFCS 1702440 Unit: Metric Tons Dry Basis
Exports for MY 2013/14 (Oct-Sept) to: Imports for MY 2013/14 (Oct-Sept) from:
U.S. 160 U.S. 56,254
Other 34 Other 26
TOTAL 194 TOTAL 56,280
SOURCE: Global Trade Information Services, Inc. Global Trade Atlas, Mexico Edition, December 2014
Other Relevant Reports Submitted by FAS/Mexico:
Report
Number Subject Date Submitted
MX 5013
Mexico Increases Maximum Sugar Export Limit to the U.S. 03/30/2015
MX 5012 Mexico Puts State-Owned Sugar Mills Up for Sale 03/30/2015
MX 5007
Mexico Announces Maximum Sugar Export Quota 02/11/2015
MX 5006 Mexico Announces Guidelines for Sugar Export Licenses 02/09/2015
MX 4076 Mexico Announces Sugar Cane Reference Prices 10/31/2014
MX 4067
Sugar Semi-Annual 09/30/2014

MX5017 Mexico Sugar Annual Report Page 12
For More Information
FAS/Mexico Web Site: We are available at http://www.mexico-usda.com.mx or visit the FAS
headquarters' home page at www.fas.usda.gov for a complete selection of FAS worldwide agricultural
reporting.
Useful Mexican Web Sites: Mexico's equivalent of the U.S. Department of Agriculture (SAGARPA)
can be found at www.sagarpa.gob.mx, the equivalent of the U.S. Department of Commerce (SE) can be
found at www.economia.gob.mx, and the equivalent of the U.S. Food and Drug Administration
(SALUD) can be found at www.salud.gob.mx. These web sites are mentioned for the reader's
convenience but USDA does NOT in any way endorse, guarantee the accuracy of, or necessarily concur
with, the information contained on the mentioned sites.