MEXICO PACKAGING MACHINERY MARKET … PACKAGING MACHINERY MARKET WEBINAR Are you connect to the...
36
MEXICO PACKAGING MACHINERY MARKET WEBINAR Are you connect to the audio portion? Please dial: +866.740.1260 Mexico: +01.800.083.0984 Access code: 6123196#
Transcript of MEXICO PACKAGING MACHINERY MARKET … PACKAGING MACHINERY MARKET WEBINAR Are you connect to the...
MEXICO PACKAGING MACHINERY
MARKET WEBINAR
Are you connect to the audio portion?Please dial: +866.740.1260Mexico: +01.800.083.0984
Access code: 6123196#
Events and Services at EXPO PACK Guadalajara
• Mexico Market Analysis Presentation and Panel of End UsersDate/ Time: Wednesday, June 14 from 8:30 – 10:30AM
Location: Hilton Hotel Mexico III-C
• EXPO PACK Guadalajara Agent Directory
• Complimentary Services available at PMMI’s Pavilion (Booth #2000):• PMMI Member Happy Hour (daily from 5-7pm)
• Export counseling and market information
• Interpreters (on-site only)
• Private meeting rooms
• Internet
• Business Lounge Area
1
OPPORTUNITIES FOR PACKAGING MACHINERY
IN WESTERN MEXICO 2017-2018
Luis Doménech M.
Managing DirectorMarket Intelligence Latin America, S.C.
www.mila.mx
May, 2017
Introduction
• MILA has worked with PMMI covering Mexico’s packaging
machinery market for over 15 years.
• Expo Pack Mexico will be held in Guadalajara, Jalisco from June
13th to June 15th. – Focus in Western Mexico.
• Key goals:
• Identify key trends in Mexico’s packaging machinery market.
• Identify 50 packaging machinery buyers in Western Mexico with
short-term purchasing plans.
• Assist PMMI members increase their exports to Mexico.
3
4
Agenda
Macro Environment
Mexico’s Packaging Machinery Market
Opportunities for PM in Western Mexico
Recommendations / Strategies for Success

Brief Snapshot of Mexico
• Population: 121.05 million (2016 est)- 11th
• Pop. Growth rate: 1.3%
• GDP Growth 2.3%
• GDP (current prices) 1,143 billion USD - 15th
• GDP (PPP) 2,143.49 billion USD - 11th
• GDP per Capita (ppp): 16,490 USD – 66th
• GDP per Capita (nominal) 9,510 USD – 64th
• Inflation 3.4% (2016) forecast 5.0% =2017
• Exports 373.93 billion USD
• Imports 387.06 billion USD
• Trade deficit 13.13 billion USD
• Foreign Direct Investment 26.7 billion USD
• Currency Mexican Peso USD = 18.67
Sources: Mexican Central Bank, IMF, INEGI, 2017

Brief Snapshot of Mexico
• Open Economy - free trade with: • 46 countries – Recently signed Trans-Pacific Partnership (TPP).
• One billion customers and 60% of global GDP.
• 92%+ imports from free-trade countries, thus do not pay import duties.
• Structural Reforms • Key reforms: energy, telecommunications, fiscal, financial, education and political.
• Faster growing and more competitive country.
• Wider foreign direct investment attraction
• Jobs creation.
• Favorable Demographics (Demographic Bonus)
• Working age population outpaces the number of dependents.
• 37% of the population younger than 20 y.o. = 45 million people
• 56% of the population younger than 30 y.o. = 69 million people.
• Migration from rural to urban areas. 2016 estimates = 20% rural vs 80% urban.
Key Economic Challenges
• Slow Economic Growth.
• Oil prices and lower oil production
• 2015 Fiscal deficit of US$35.14 billion = 3.2% of GDP.
• 2016 = 2.8% of GDP
• 25% increase in gasoline prices effective Jan 1st, 2017.
• Uncertainty on the commercial relations with the U.S. (NAFTA).
• Twitter Account @realdonaldtrump
• Currency fluctuations.
• Lower flows of FDI expected in 2017 and 2018.
• Presidential Elections in 2018.

Slow Economic Growth
8
1.4%
-4.7%
5.1%4.0% 3.9%
1.1%2.1% 2.5% 2.3%
1.5%2.2%
2008 2009 2010 2011 2012 2013 2014 2015 2016 2017/f 2018/f
Mexico's GDP Growth 2008-2018/f
Source: MILA with information from Banco de México, 2017.
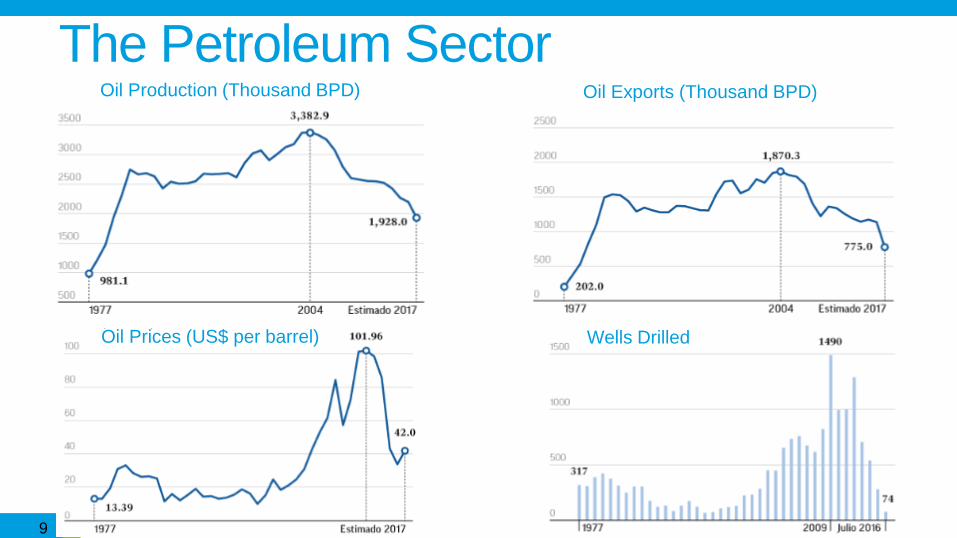
The Petroleum Sector
9
Oil Production (Thousand BPD) Oil Exports (Thousand BPD)
Oil Prices (US$ per barrel) Wells Drilled
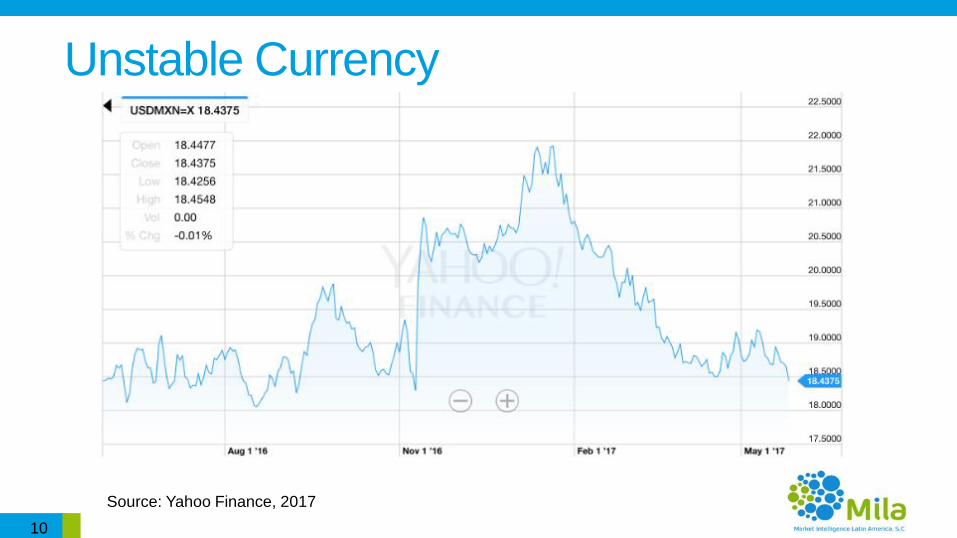
Unstable Currency
10
Source: Yahoo Finance, 2017
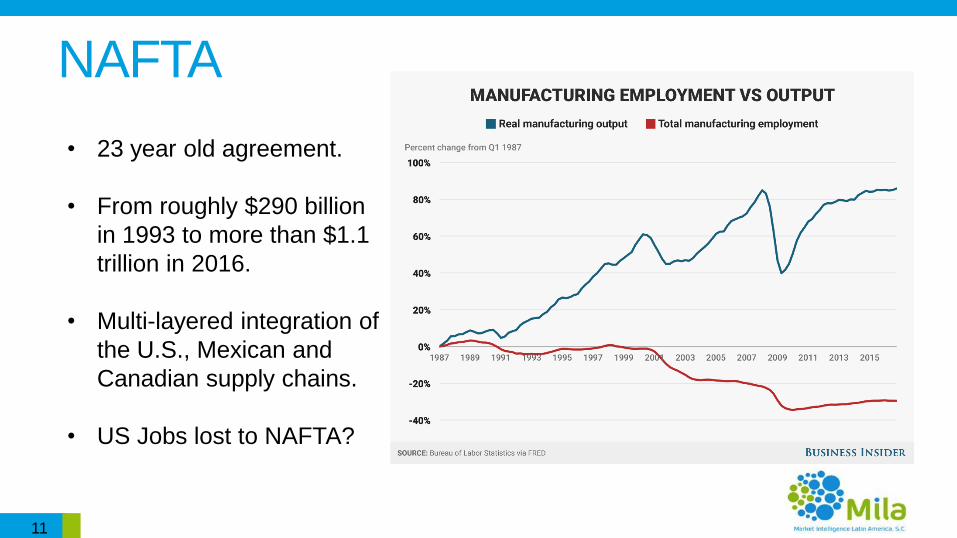
NAFTA
11
• 23 year old agreement.
• From roughly $290 billion
in 1993 to more than $1.1
trillion in 2016.
• Multi-layered integration of
the U.S., Mexican and
Canadian supply chains.
• US Jobs lost to NAFTA?
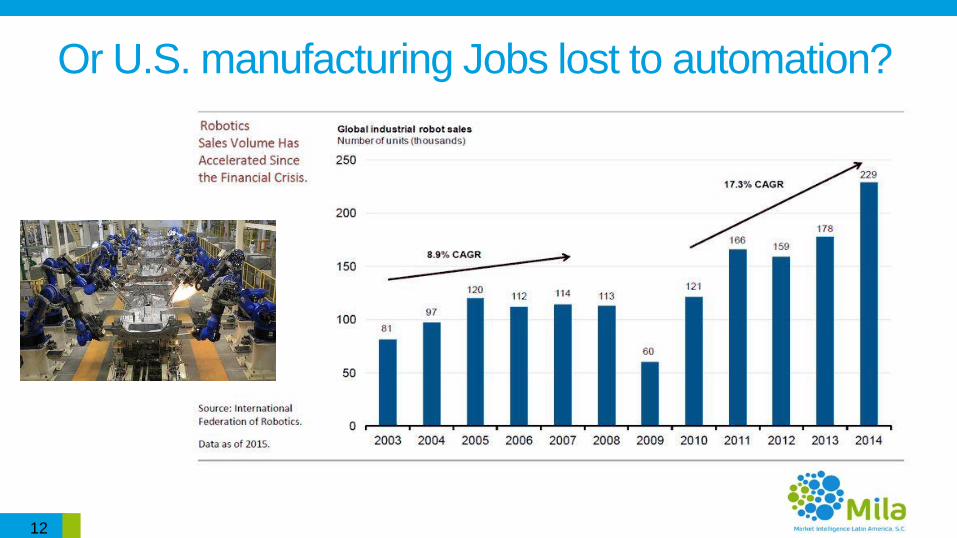
Or U.S. manufacturing Jobs lost to automation?
12

While NAFTA is Reviewed…..
• Slower FDI inflows expected, especially from European
companies targeting the NAFTA market.
• Mexican exporting companies concentrating in
diversifying their exports.
• Nationalistic sentiment increased….several “buy Mexican”
and “Don’t buy American” initiatives in social media.
• Few Mexican companies are placing investments on hold
due to NAFTA revision.
13

There are also positive indicators….
• Strong internal consumption growth.
• Mature retail sector – increasing diversification.
• Until now - Strong FDI attraction.
• Formal jobs at historical high levels.
• The Energy Reform – translating in new players, new wells, and in coming
years a rebound in oil production.
• PEMEX restructure and increasing oil prices are making the National Oil
Company a financially stable company once again.
• The Mexican Government strengthening fiscal discipline.
• Budget is every time less dependent on oil revenue.
14
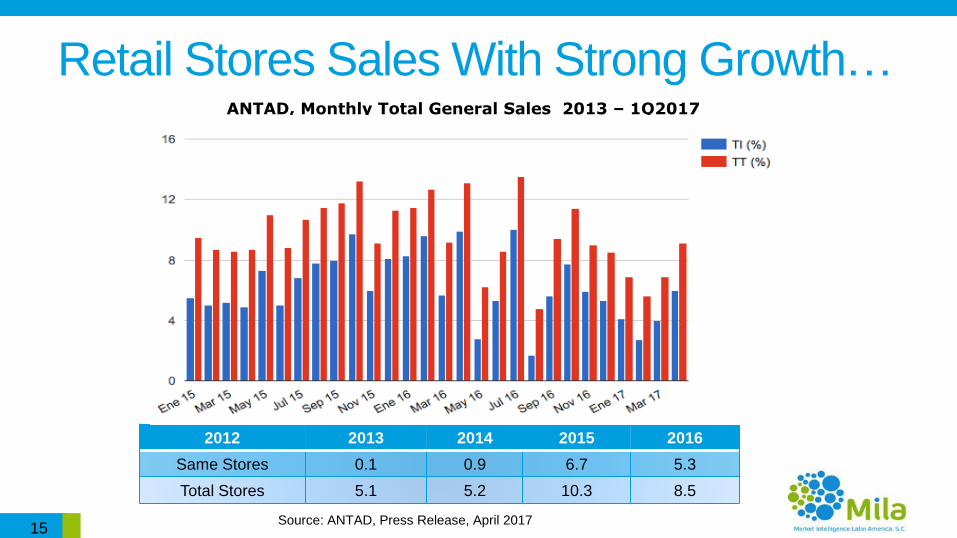
Retail Stores Sales With Strong Growth…
Source: ANTAD, Press Release, April 2017
ANTAD, Monthly Total General Sales 2013 – 1Q2017(YoY nominal growth %)
2012 2013 2014 2015 2016
Same Stores 0.1 0.9 6.7 5.3
Total Stores 5.1 5.2 10.3 8.5
15

16
Agenda
Macro Environment
Mexico’s Packaging Machinery Market
Opportunities for PM in Western Mexico
Recommendations / Strategies for Success

17
Market Size• Approximately 80%-85% of the packaging machinery
installed in Mexico is imported.
• Mexico imported US$696 million in packaging machinery during 2016, 2.7% more than 2015 imports and for second consecutive year a historical high record.
• Total market worth approximately US$831 million in 2016.
• Main growth drivers: Multinational companies, beverage sector (especially beer), large Mexican groups and strong investments in automation to increase efficiency.

18
Market Segmentation (2016)
29%
19%
8%8%
26%
10%
Packaging Machinery Import Value by Segment, 2016
Beverage Food Personal Care Pharmaceutical Packaging Others
19
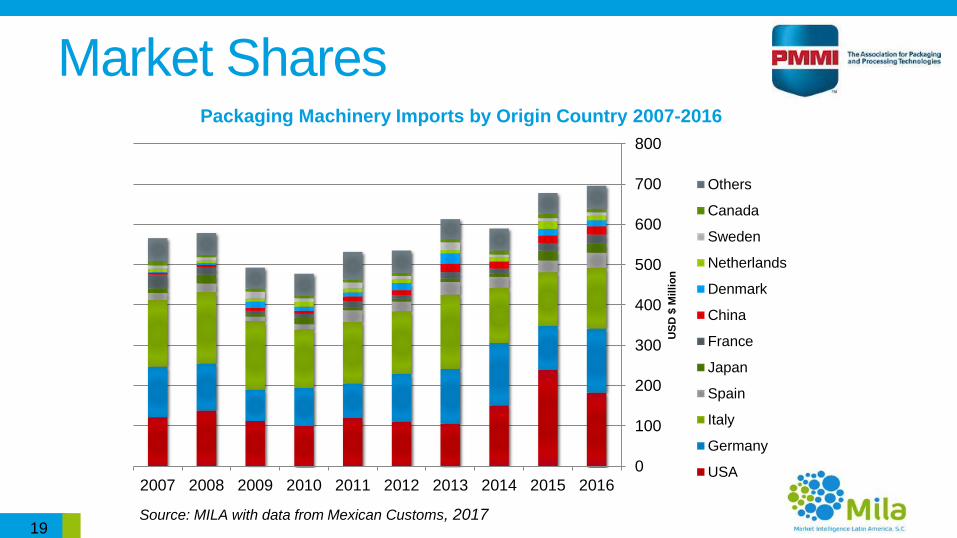
Market Shares
0
100
200
300
400
500
600
700
800
2016201520142013201220112010200920082007
US
D $
Mil
lio
n
Packaging Machinery Imports by Origin Country 2007-2016
Others
Canada
Sweden
Netherlands
Denmark
China
France
Japan
Spain
Italy
Germany
USA
Source: MILA with data from Mexican Customs, 2017

20
Primary Packaging Machinery
29%
28%
17%
6%
20%
Primary Packaging Machinery Import Shares, 2016
Germany
USA
Italy
Spain
Rest of World
0%
5%
10%
15%
20%
25%
30%
35%
40%
45%
50%
2016201520142013201220112010
Primary Packaging Machinery Import Shares 2010-2016
Germany
USA
Italy
Spain
Rest of World
Source: MILA with data from Mexican Customs, 2017

21
Secondary Packaging Machinery
28%
21%
17%
6%
29%
Secondary Packaging Machinery Import Shares, 2016
Italy
USA
Germany
Spain
Rest of World0%
5%
10%
15%
20%
25%
30%
35%
40%
2016201520142013201220112010
Secondary Packaging Machinery Import Shares 2010-2016
Italy
USA
Germany
Spain
Rest of World
Source: MILA with data from Mexican Customs, 2017

22
Largest PM Importers 2016
23
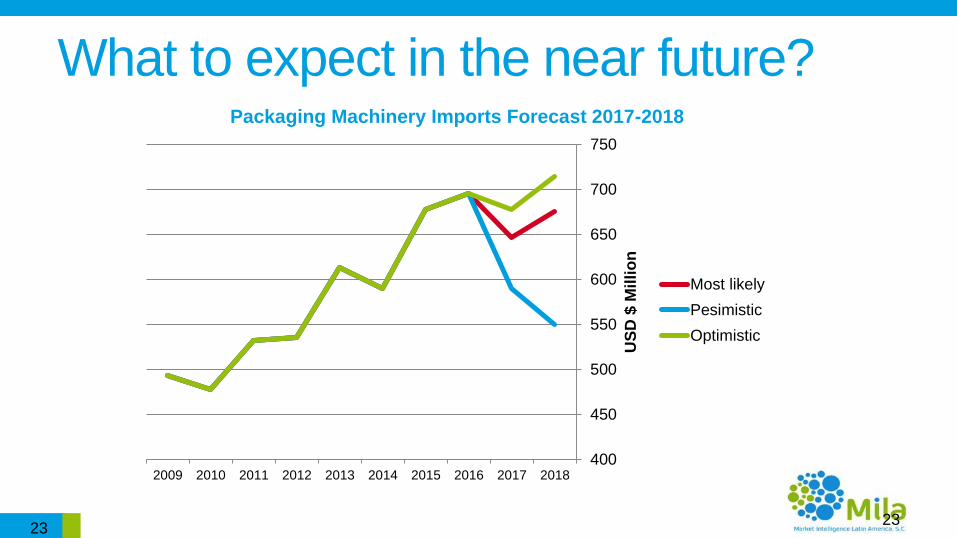
What to expect in the near future?
23
400
450
500
550
600
650
700
750
2018201720162015201420132012201120102009
US
D $
Mil
lio
n
Packaging Machinery Imports Forecast 2017-2018
Most likely
Pesimistic
Optimistic

24
Why we forecast a slight decline• In 1Q 2017 packaging machinery imports are up 6.5% vs the
same period of 2016.
• The huge investments from beer manufacturers are nearing completion (Constellation Brands) or just began operations. (Grupo Modelo).
• New breweries just beginning construction phase, equipment will take place in late 2018 or 2019.
• Slower investments from foreign multinational companies expected until NAFTA revision is complete.
• Currency fluctuations are affecting decision making.
• 2018 Presidential elections.
25
Agenda
Macro Environment
Mexico’s Packaging Machinery Market
Opportunities for PM in Western Mexico
Recommendations / Strategies for Success
26
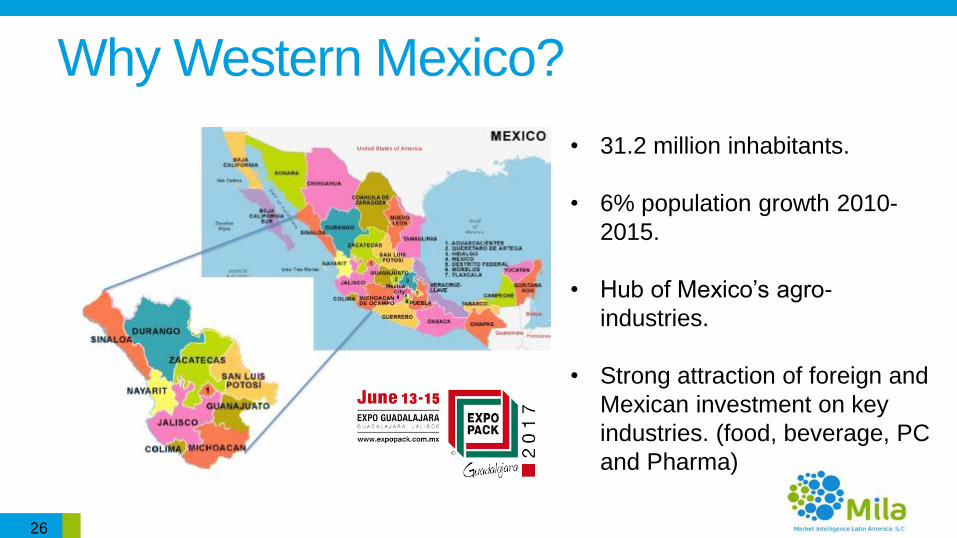
Why Western Mexico?
• 31.2 million inhabitants.
• 6% population growth 2010-
2015.
• Hub of Mexico’s agro-
industries.
• Strong attraction of foreign and
Mexican investment on key
industries. (food, beverage, PC
and Pharma)

27
Western Mexico = Strong PM demand
• In 2015 Jalisco attracted US$2.48 billion in FDI equivalent to 8.7% of the total national; and during the first three quarters of 2016, foreign investments in the State reached US$1.6 billion invested in 36 projects of which 23 were new plants and 13 expansions.
• 50 companies interviewed, totaling investments in packaging machinery worth between US$149.9 and 182.4 million in the 2017-2018 period.
• 25 food companies.
• 11 beverage companies.
• 7 personal care.
• 7 pharmaceutical.
• Home of the Tequila industry.
• Mexican companies from the food and beverage industry increasing investments in the region.
28
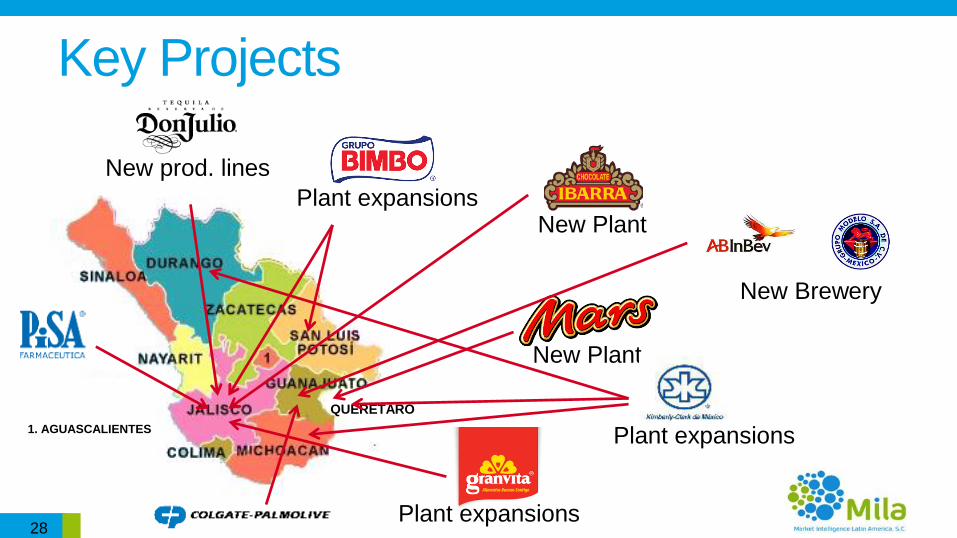
Key Projects
New Plant
QUERETARO
New Plant
Plant expansions
Plant expansions
New Brewery
New prod. lines
Plant expansions1. AGUASCALIENTES

29
What is in the report
• Detailed analysis of Mexico’s packaging machinery
market.
• 50 company profiles including:
• Company description.
• Main products produced and how they are packed.
• Key product images.
• Purchasing and investments decision making process.
• Key contact info.
29

30
Agenda
Macro Environment
Mexico’s Packaging Machinery Market
Opportunities for PM in Western Mexico
Recommendations / Strategies for Success
31
BD Recommendations• Partner a local company.
• Visit your customers – We like doing business with people we’ve met.
• Stay informed about your target markets – Linkedin, Youtube.
• Use resources offered by PMMI, ExIm Bank, SBA, US Embassy, State
Trade Offices to speed up your business development efforts.
• Devote time and resources to your web page, it is your image to the world.
• Personal relations are very important for Mexican businesses.
• Visit Mexico as much as you can, we have good food!

Strategies for Success• No NAFTA advantage.
• Service, flexibility and reliability more important than price.
• Local service is a key competitive advantage.
• Credit options and payment schedules can be strong decision making points. Credits inlocal currency are preferred.
• Equipment leasing schemes, a very attractive option for customers.
• Save margin for negotiation.
• Equipment service packages and local spare parts are a must.
• Invest in developing relationships.
32

Strategies for Success
• The number of companies willing to purchase from suppliers
without a formal presence in Mexico is fast disappearing.
• Invest in marketing – videos, promotional materials, web
page in multiple languages.
33

34
34
QUESTIONS?

35
Contact us:
Thank You!
Luis Doménech Paige Jarvi
Managing Director Global Marketing Coordinator
Market Intelligence Latin America, S.C. PMMI
[email protected] [email protected]
+(52155) 5432-9768 +1 (571) 287-6814
www.mila.mx www.pmmi.org