Mexico Oilseeds and Products Annual Lack of …...2019/04/01 · MX9014 2019 Oilseeds and Products...
21
THIS REPORT CONTAINS ASSESSMENTS OF COMMODITY AND TRADE ISSUES MADE BY USDA STAFF AND NOT NECESSARILY STATEMENTS OF OFFICIAL U.S. GOVERNMENT POLICY Required Report - public distribution Date: 4/1/2019 GAIN Report Number: MX9014 Mexico Oilseeds and Products Annual Lack of Supports to Slow Oilseed Production, while Meal and Oil Remain Stable Approved By: Melinda Sallyards Prepared By: Benjamin Juarez and Tim Harrison Report Highlights: Post expects relatively limited growth in oilseed production in MY 2019/20, due in part to the lack of government programs encouraging oilseed planting. The oilseed meal and oils sectors are expected to grow by approximately three percent, driven by strong meal demand from the poultry and livestock sectors.
Transcript of Mexico Oilseeds and Products Annual Lack of …...2019/04/01 · MX9014 2019 Oilseeds and Products...
THIS REPORT CONTAINS ASSESSMENTS OF COMMODITY AND TRADE ISSUES MADE BY
USDA STAFF AND NOT NECESSARILY STATEMENTS OF OFFICIAL U.S. GOVERNMENT
POLICY
Required Report - public distribution
Date: 4/1/2019
GAIN Report Number: MX9014
Mexico
Oilseeds and Products Annual
Lack of Supports to Slow Oilseed Production, while Meal and Oil
Remain Stable
Approved By:
Melinda Sallyards
Prepared By:
Benjamin Juarez and Tim Harrison
Report Highlights:
Post expects relatively limited growth in oilseed production in MY 2019/20, due in part to the lack of
government programs encouraging oilseed planting. The oilseed meal and oils sectors are expected to
grow by approximately three percent, driven by strong meal demand from the poultry and livestock
sectors.
MX9014 2019 Oilseeds and Products Annual Page 2
EXECUTIVE SUMMARY
Oilseed production is expected to rebound in marketing year (MY) 2019/20, after weather issues
lowered MY 2018/19 yields. However, the new Mexican government has generally prioritized other
commodities, leaving few support programs that would encourage any expansion in oilseed planting. As
a result, Mexican oilseed production is not expected to increase significantly in the foreseeable future.
Given continued demand for oilseeds for crushing, steady growth in imports is likely.
Mexico’s oilseed crushing sector is expected to grow by approximately three percent in marketing year
(MY) 2019/20, driven by continued demand for meals in the livestock sector and stable growth in oil
demand. Macroeconomic factors are expected to remain relatively stable, with overall economic growth
predicted at 1.1-1.2 percent, and population growth at approximately one percent. Oil demand should
generally track with those factors. The poultry and livestock sectors have enjoyed stronger growth,
increasing demand for oilseed meals used in feed.
Given attractive pricing for U.S. soybeans in MY 2018/19, crushers have generally preferred to use
more soy compared to canola or other oilseeds. Strong crushing margins for soy are expected to
continue in MY 2019/20. The Mexican oilseed market continues to be driven mainly by price, despite
growing interest in healthier oils.
OILSEEDS: PRODUCTION, SUPPLY AND DEMAND STATISTICS
Table 1: Mexico: Production, Supply, and Distribution (PSD) for Total Oilseeds
Market Begin Year Total Oilseeds
Mexico 2017 2018 2019
USDA Official New Post USDA Official New Post USDA Official New
Area planted 327 335 270 267 0 315
Area Harvested 332 328 281 260 0 307
Beginning stocks 255 255 258 255 0 295
Production 544 541 452 446 0 515
MY imports 6,602 6,602 6,993 6,993 0 7,047
Total Supply 7,401 7,398 7,703 7,694 0 7,857
MY Exports 35 35 37 37 0 40
Crush Dom. Consump. 6,787 6,787 7,037 7,037 0 7,218
Food Use Dom. Consump. 283 283 287 287 0 293
Feed,Seed, Waste Dm.Cn. 38 38 38 38 0 38
Total Dom. Consumption 7,108 7,108 7,362 7,362 0 7,549
Ending Stocks 258 255 304 295 0 268
Total Distribution 7,401 7,398 7,703 7,694 0 7,857

MX9014 2019 Oilseeds and Products Annual Page 3
Table 2: Mexico: Production, Supply, and Distribution (PSD) for Soybeans Oilseed, Soybean 2017/2018 2018/2019 2019/2020 Market Begin Year Sep 2017 Sep 2018 Sep 2019
Mexico USDA Official New Post USDA Official New Post USDA Official New Post
Area Planted 270 270 220 198 0 245
Area Harvested 263 263 210 191 0 237
Beginning Stocks 158 158 179 179 0 209
Production 433 433 340 335 0 400
MY Imports 4873 4873 5230 5230 0 5260
MY Imp. from U.S. 4533 4533 4900 5000 0 5200
MY Imp. from EU 0 0 0 0 0 0
Total Supply 5464 5464 5749 5744 0 5869
MY Exports 0 0 0 0 0 0
MY Exp. to EU 0 0 0 0 0 0
Crush 5250 5250 5500 5500 0 5660
Food Use Dom. Cons. 0 0 0 0 0 0
Feed Waste Dom. Cons. 35 35 35 35 0 35
Total Dom. Cons. 5285 5285 5535 5535 0 5695
Ending Stocks 179 179 214 209 0 174
Total Distribution 5464 5464 5749 5744 0 5869
CY Imports 5210 4925 5300 5300 0 5375
CY Imp. from U.S. 4900 4675 5000 5000 0 5070
CY Exports 0 0 0 0 0 0
CY Exp. to U.S. 0 0 0 0 0 0
Yield 1.6464 1.6464 1.619 1.7539 0 1.6878
(1000 HA) ,(1000 MT) ,(MT/HA)
Table 3: Mexico: Production, Supply, and Distribution (PSD) for Rapeseed Oilseed, Rapeseed 2017/2018 2018/2019 2019/2020 Market Begin Year Oct 2017 Oct 2018 Oct 2019
Mexico USDA Official New Post USDA Official New Post USDA Official New Post
Area Planted 0 2 0 4 0 3
Area Harvested 6 2 6 4 0 3
Beginning Stocks 69 69 46 43 0 47
Production 5 2 5 4 0 3
MY Imports 1472 1472 1500 1500 0 1520
Total Supply 1546 1543 1551 1547 0 1570
MY Exports 0 0 0 0 0 0
Crush 1500 1500 1500 1500 0 1520
Food Use Dom. Cons. 0 0 0 0 0 0
Feed Waste Dom. Cons. 0 0 0 0 0 0
Total Dom. Cons. 1500 1500 1500 1500 0 1520
Ending Stocks 46 43 51 47 0 50
Total Distribution 1546 1543 1551 1547 0 1570
(1000 HA) ,(1000 MT) ,(MT/HA)

MX9014 2019 Oilseeds and Products Annual Page 4
Table 4: Mexico: Production, Supply, and Distribution (PSD) for Sunflower Seed Oilseed, Sunflowerseed 2017/2018 2018/2019 2019/2020 Market Begin Year Oct 2017 Oct 2018 Oct 2019
Mexico USDA Official New Post USDA Official New Post USDA Official New Post
Area Planted 0 6 0 8 0 8
Area Harvested 6 6 8 8 0 8
Beginning Stocks 2 2 2 2 0 4
Production 9 9 10 10 0 10
MY Imports 27 27 28 28 0 27
Total Supply 38 38 40 40 0 41
MY Exports 0 0 0 0 0 0
Crush 33 33 33 33 0 34
Food Use Dom. Cons. 0 0 0 0 0 0
Feed Waste Dom. Cons. 3 3 3 3 0 3
Total Dom. Cons. 36 36 36 36 0 37
Ending Stocks 2 2 4 4 0 4
Total Distribution 38 38 40 40 0 41
(1000 HA) ,(1000 MT) ,(MT/HA)
Table 5: Mexico: Production, Supply, and Distribution (PSD) for Peanuts
Oilseed, Peanut 2017/2018 2018/2019 2019/2020 Market Begin Year Sep 2017 Sep 2018 Sep 2019
Mexico USDA Official New Post USDA Official New Post USDA Official New Post
Area Planted 57 57 57 57 0 59
Area Harvested 57 57 57 57 0 59
Beginning Stocks 26 26 31 31 0 35
Production 97 97 97 97 0 102
MY Imports 230 230 235 235 0 240
Total Supply 353 353 363 363 0 377
MY Exports 35 35 37 37 0 40
Crush 4 4 4 4 0 4
Food Use Dom. Cons. 283 283 287 287 0 293
Feed Waste Dom. Cons. 0 0 0 0 0 0
Total Dom. Cons. 287 287 291 291 0 297
Ending Stocks 31 31 35 35 0 40
Total Distribution 353 353 363 363 0 377
(1000 HA) ,(1000 MT) ,(MT/HA)
OILSEED PRODUCTION
Mexico's overall oilseed production is forecast to increase by approximately 18 percent in MY 2019/20.
All of this growth is attributed, essentially, to an increase in soybean production. Still, the 400,000 MT
of soybeans that are expected to be produced in this marketing year is rather low compared to MY
2017/18. In general, many Mexican farmers are moving productive agricultural land into relatively
more profitable alternative crops, such as corn or wheat. Moreover, according to private and official
sources, it is unlikely that planted area will increase significantly in the coming years, as many supports
granted by the Federal and state governments were canceled or reduced, which should adversely affect
the planting decisions of oilseeds growers. (See the policy section below for more details.)
According to official and private sources the planted area for soybeans will reach 245,000 hectares (ha),
a 24 percent increase from the revised MY 2018/19 area estimate of 198,000 ha. This increase reflects
expectations for higher yields this marketing year, and assumes the resumption of normal weather
MX9014 2019 Oilseeds and Products Annual Page 5
conditions. Despite this increase in production, Mexican growers still only supply seven percent of total
domestic consumption and is lower than the production level of MY 2017/18.
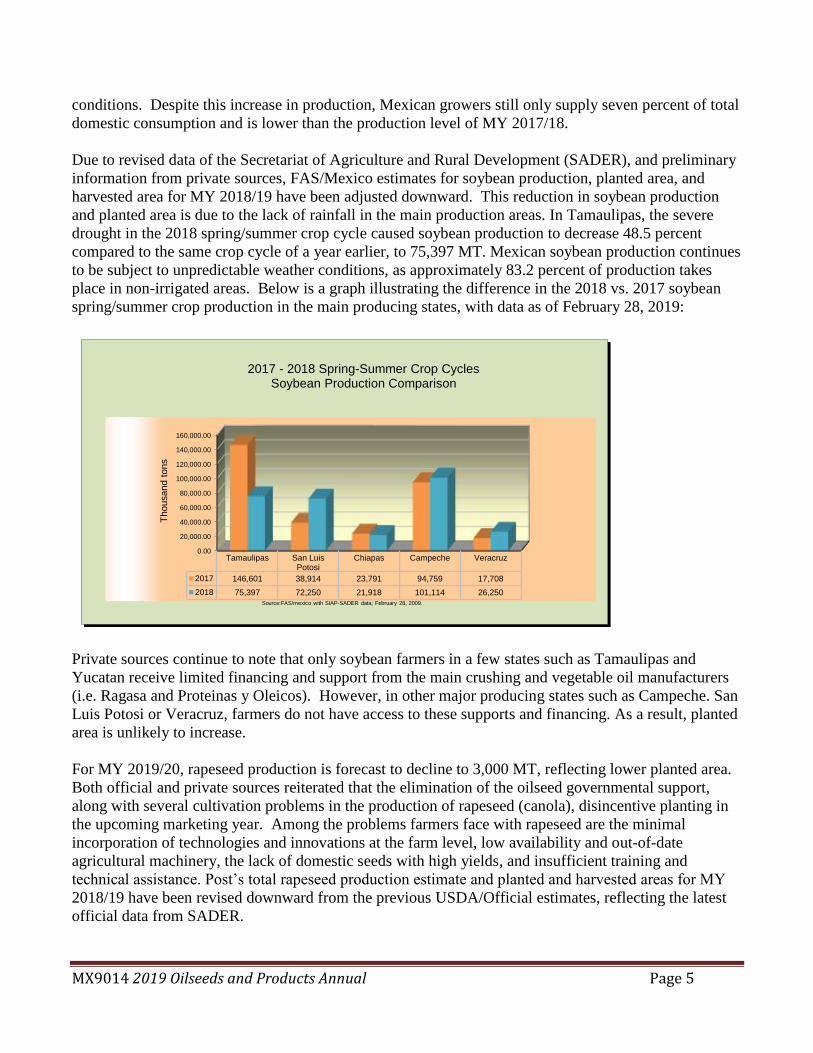
Due to revised data of the Secretariat of Agriculture and Rural Development (SADER), and preliminary
information from private sources, FAS/Mexico estimates for soybean production, planted area, and
harvested area for MY 2018/19 have been adjusted downward. This reduction in soybean production
and planted area is due to the lack of rainfall in the main production areas. In Tamaulipas, the severe
drought in the 2018 spring/summer crop cycle caused soybean production to decrease 48.5 percent
compared to the same crop cycle of a year earlier, to 75,397 MT. Mexican soybean production continues
to be subject to unpredictable weather conditions, as approximately 83.2 percent of production takes
place in non-irrigated areas. Below is a graph illustrating the difference in the 2018 vs. 2017 soybean
spring/summer crop production in the main producing states, with data as of February 28, 2019:
0.00
20,000.00
40,000.00
60,000.00
80,000.00
100,000.00
120,000.00
140,000.00
160,000.00
Tamaulipas San LuisPotosi
Chiapas Campeche Veracruz
2017 146,601 38,914 23,791 94,759 17,708
2018 75,397 72,250 21,918 101,114 26,250
Thousand t
ons
Source:FAS/mexico with SIAP-SADER data; February 28, 2009.
2017 - 2018 Spring-Summer Crop Cycles Soybean Production Comparison
Private sources continue to note that only soybean farmers in a few states such as Tamaulipas and
Yucatan receive limited financing and support from the main crushing and vegetable oil manufacturers
(i.e. Ragasa and Proteinas y Oleicos). However, in other major producing states such as Campeche. San
Luis Potosi or Veracruz, farmers do not have access to these supports and financing. As a result, planted
area is unlikely to increase.
For MY 2019/20, rapeseed production is forecast to decline to 3,000 MT, reflecting lower planted area.
Both official and private sources reiterated that the elimination of the oilseed governmental support,
along with several cultivation problems in the production of rapeseed (canola), disincentive planting in
the upcoming marketing year. Among the problems farmers face with rapeseed are the minimal
incorporation of technologies and innovations at the farm level, low availability and out-of-date
agricultural machinery, the lack of domestic seeds with high yields, and insufficient training and
technical assistance. Post’s total rapeseed production estimate and planted and harvested areas for MY
2018/19 have been revised downward from the previous USDA/Official estimates, reflecting the latest
official data from SADER.
MX9014 2019 Oilseeds and Products Annual Page 6
Sunflower seed production for MY 2019/20 is forecast to remain stable at just 10,000 MT. Despite
official data showing an expansion of sunflower planted area, private sources indicate that sunflower
planting is more likely to remain constant. Post therefore estimates that planted area will remain at
approximately 8,000 ha. Farmers have had very little incentive to expand planted area, given a lack of
governmental supports and limited of knowledge about best practices for planting. Several years ago, an
international seed company launched a pilot program to encourage the use of improved sunflower seed
with higher oleic content. The program was supported by a multinational snack food company, which
was the main purchaser of the oil produced from the sunflower seeds. However, the sunflower seeds
produced under the program were relatively expensive, and the pilot project has since been cancelled.
As a result, there are limited prospects for expansion in the sunflower sector.
MY 2019/20 peanut production is forecast at 102,000 MT, a five percent increase over the previous
marketing year. This increase is primarily due to a slight expansion in planted area, according to
farmer’s stated planting intentions. Production has remained relatively stable over the past few years,
with few factors to encourage any significant change to planting trends. There are no particular
government programs to support peanut production, though some snack food companies do help farmers
with financing in states like Chihuahua. Observers note that peanut production in Mexico does not use
current technologies, making Mexican peanuts less competitive compared to peanuts from other origins.
A majority of peanut production is non-irrigated.
OILSEED CONSUMPTION
Total oilseed consumption is expected to increase by nearly 2.6 percent in MY 2019/20, a lower rate of
increase than that of MY 2018/19 (3.6 percent). This increase in demand is primarily attributable to the
growth in the livestock sector and stable population growth. It should be noted, however, than an
anticipated slowdown in the Mexican economy could lead to a slight slump in the beef, pork, and
poultry meat markets in the medium term. Industry sources stated the reduced growth predicted this
year reflects the expectation that consumers may have less purchasing power than in previous years.
According to animal feed industry data, for example, poultry producers estimate that consumption of
oilseed meals will increase around three percent in CY 2019. This is slightly lower than last year, when
the poultry sector increased oilseed meal consumption by four percent. The poultry sector continues to
be the major consumer of soybean meal in Mexico. Price and credit availability continue to be the main
factors driving consumption decisions for oilseeds and its by-products. In addition, the pork sector’s
2019 outlook is also relatively optimistic.
Large companies such as Agydsa, Ragasa, Proteinas y Oleicos, and Cargill continue to represent nearly
80 percent of crushing capacity in Mexico. Competition between these firms continues to be intense,
and in order to stay competitive these firms have made significant investments in their plants in recent
years with an eye towards reducing costs and expanding services.
For example, Agydsa is building a new plant in Jalisco with a crushing capacity of 4,000 MT daily,
which should be operating next July or August. Similarly, Cargill recently invested 16 million USD to
install a production and bottling line for edible vegetable oil in its plant in Hidalgo. As a result, Cargill
began participating in the vegetable oils and fats retail sector in Mexico. According to media reports,
the bottling line required the construction of a 40,000 square meter industrial warehouse. With the new
production line, the Cargill plant in Hidalgo became one of the company’s largest and most modern
MX9014 2019 Oilseeds and Products Annual Page 7
worldwide. The plant itself produces 13,000 tons of soybean oil per month, which is sold in bulk and in
packaging.
Industry sources stated that crushing margins have been very favorable in CY 2018 and are expected to
increase slightly, mainly in soybeans, as the more efficient crushers control a large part of the market
and international soybeans prices continue to be competitive.
MY 2019/20 domestic soybean demand is forecast at 5.695 million metric tons (MMT), approximately
three percent higher than the MY 2018/19 consumption estimate. The increase in feed demand, stronger
processor demand, and population growth (1.01 percent) drive this increase. Similarly, the animal feed
industry expects three percent growth in CY 2019, due to the growth in the poultry and pork sectors
noted above.
The forecast for rapeseed (or canola) consumption in MY 2019/20 is expected to increase slightly to
1.52 MMT, about 1.3 percent. Private sources have mentioned Mexican crushers have a particular
market for canola oil due to its higher oleic content, and they will import canola when the price is
competitive. However, soy prices are expected to continue giving better margins to crushers.
Sunflower seed consumption for MY 2019/20 is expected to increase very slightly to 41,000 MT,
primarily due to a small increase in crushing. In general, crushing demand has remained relatively
stable for several years, with just a few companies interested in processing sunflower seeds. No change
is expected in the approximately 3,000 MT of sunflower seed that is used primarily for bird feed each
year. A limited amount of sunflower seed is believed to be used for direct human consumption as a
snack, though there are no reliable estimates for this use.
Total peanut consumption is expected to increase to 293,000 MT in MY 2019/20, driven primarily by a
slight increase in food use. Peanuts are primarily used as a snack food in Mexico, with minimal
crushing or processing. Industry sources continue to note that peanuts are often an impulse purchase at
the point of sale in Mexico, and as such are highly dependent on the macroeconomic situation. Peanut
consumption generally tracks with economic growth and population growth, which is expected to be
about two percent in this marketing year. Mexico is primarily a price-driven market in terms of peanut
consumption. It is estimated that over half of peanuts are sold at the retail sector, with approximately a
quarter of peanut consumption occurring in the food-processing sector. Retail sales vary from single-
serve packets in a variety of flavors to sales of bulk peanuts in small shops or stands, often flavored with
lime and salt or chili powder.
MX9014 2019 Oilseeds and Products Annual Page 8
OILSEED TRADE
Total oilseed import forecast for MY2019/20 is estimated to increase to 7.05 MMT, a slight increase
over the MY2018/19 estimate. This increase is driven by population growth (1.01 percent) and the
expected growth in Mexico’s livestock and poultry sector.
Private sources stated due to the strong Chinese demand for South American soybeans in CY 2018,
Mexican crushers and vegetable oil refiners imported practically all their requirements from the United
States, where they found very affordable prices. These sources have expressed that if the bearish
international soybean market conditions continue in the MY 2019/20, the margin expectations of the
domestic crushers and vegetable oil refiners would continue being good or could increase slightly.
Soybean is the primary oilseed imported by Mexico for crushing domestically, and this is expected that
continue in the near future.
Soybean imports are expected to increase slightly in MY 2019/20 to 5.3 MMT, due to of the moderate
increase in feed demand and population growth. Regarding animal feed demand, Post expects to see
growing demand from the poultry producers, given that poultry is one of the cheapest animal protein
sources for Mexican consumers.
For MY 2019/20, rapeseed imports are estimated to increase slightly to 1.52 MMT. This increase
assumes that the international soybean market continues to be bearish, which will push Mexican
importers’ preferences to soy instead of rapeseed. According to industry sources, Mexico’s import
decisions continue to be based largely on prices, rather than quality or strong consumer preferences.
Canada has continued to be the primary supplier to the Mexican market and is expected to remain so in
the next few years.
Imports of sunflower seeds are forecast to decline very slightly in MY 2019/20, to 27,000 MT. The
major suppliers of sunflower seeds to Mexico are the United States and Argentina, with Bulgaria also
taking some market share in recent years.
Peanut imports are expected to increase by about two percent to 240,000 MT in MY 2019/20. The
United States is by far the largest supplier of peanuts to Mexico. However, Mexico imports from a
variety of other countries, including Nicaragua, China, and Brazil. China is the largest supplier of in-
shell peanuts. Mexico exports a small amount of peanuts each year, with the United States as the
primary export market. Exports are forecast to grow to 40,000 MT in MY 2019/20.

MX9014 2019 Oilseeds and Products Annual Page 9
OIL MEALS: PRODUCTION, SUPPLY AND DEMAND STATISTICS
Table 6: Mexico: Production, Supply, and Distribution (PSD) for Total Meals
Market Begin Year Total Oil Meals
Mexico 2017 2018 2019
USDA Official New Post USDA Official New Post USDA Official New Post
Crush 6,783 6,783 7,033 7,033 0 7,214
Extr. Rate
2 2 0 2
Beginning stocks 53 53 54 54 0 61
Production 5,029 5,029 5,071 5,071 0 5,209
MY imports 1,841 1,841 2,025 2,025 0 2,077
Total Supply 6,923 6,923 7,150 7,150 0 7,347
MY Exports 15 15 15 15 0 15
Industrial Dom. Cons. 0 0 0 0 0 0
Food Use Dom. Cons. 50 50 50 50 0 50
Feed Waste Dom. Cons. 6,804 6,804 7,024 7,024 0 7,227
Total Dom. Consumption 6,854 6,854 7,074 7,074 0 7,277
Ending Stocks 54 54 61 61 0 55
Total Distribution 6,923 6,923 7,150 7,150 0 7,347
Table 7: Mexico: Production, Supply, and Distribution (PSD) for Soybean Meal Meal, Soybean 2017/2018 2018/2019 2019/2020 Market Begin Year Sep 2017 Sep 2018 Sep 2019
Mexico USDA Official New Post USDA Official New Post USDA Official New Post
Crush 5250 5250 5500 5500 0 5660
Extr. Rate, 999.9999 0.7909 0.7909 0.7622 0.7622 0 0.7633
Beginning Stocks 36 36 41 41 0 48
Production 4152 4152 4192 4192 0 4320
MY Imports 1818 1818 2000 2000 0 2050
MY Imp. from U.S. 1816 1816 1945 1945 0 2050
MY Imp. from EU 0 0 0 0 0 0
Total Supply 6006 6006 6233 6233 0 6418
MY Exports 15 15 15 15 0 15
MY Exp. to EU 0 0 0 0 0 0
Industrial Dom. Cons. 0 0 0 0 0 0
Food Use Dom. Cons. 50 50 50 50 0 50
Feed Waste Dom. Cons. 5900 5900 6120 6120 0 6305
Total Dom. Cons. 5950 5950 6170 6170 0 6355
Ending Stocks 41 41 48 48 0 48
Total Distribution 6006 6006 6233 6233 0 6418
(1000 MT) ,(PERCENT)
MX9014 2019 Oilseeds and Products Annual Page 10
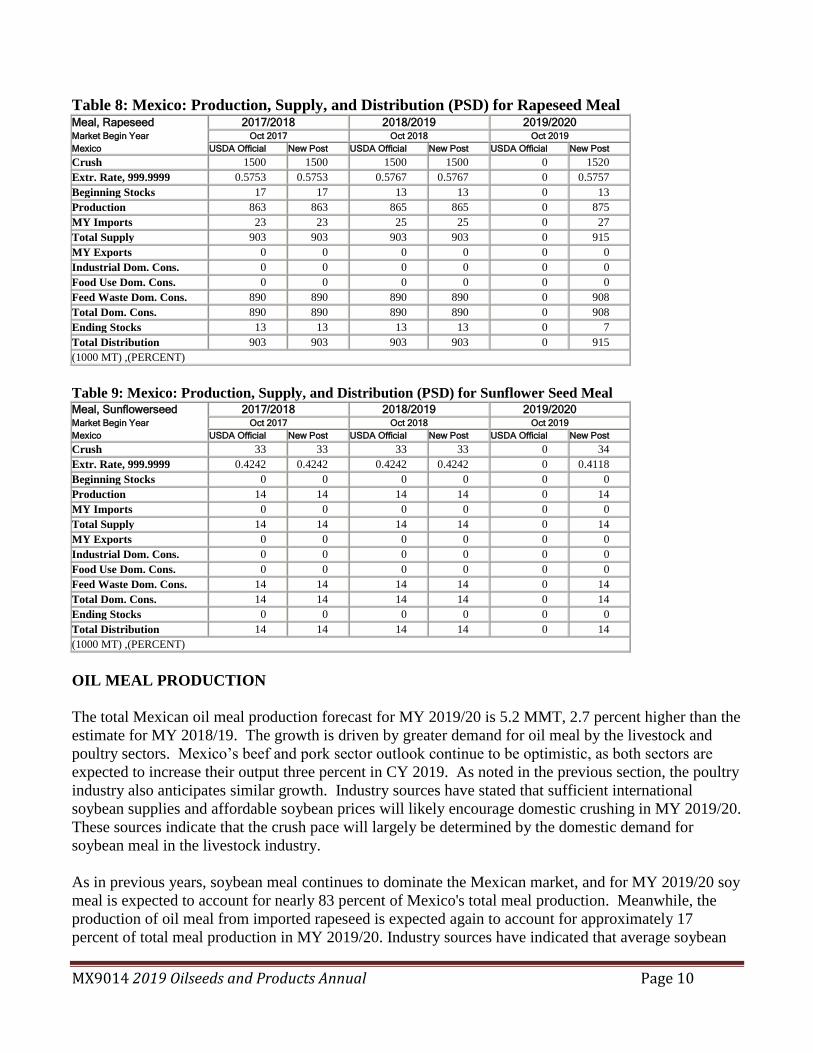
Table 8: Mexico: Production, Supply, and Distribution (PSD) for Rapeseed Meal Meal, Rapeseed 2017/2018 2018/2019 2019/2020 Market Begin Year Oct 2017 Oct 2018 Oct 2019
Mexico USDA Official New Post USDA Official New Post USDA Official New Post
Crush 1500 1500 1500 1500 0 1520
Extr. Rate, 999.9999 0.5753 0.5753 0.5767 0.5767 0 0.5757
Beginning Stocks 17 17 13 13 0 13
Production 863 863 865 865 0 875
MY Imports 23 23 25 25 0 27
Total Supply 903 903 903 903 0 915
MY Exports 0 0 0 0 0 0
Industrial Dom. Cons. 0 0 0 0 0 0
Food Use Dom. Cons. 0 0 0 0 0 0
Feed Waste Dom. Cons. 890 890 890 890 0 908
Total Dom. Cons. 890 890 890 890 0 908
Ending Stocks 13 13 13 13 0 7
Total Distribution 903 903 903 903 0 915
(1000 MT) ,(PERCENT)
Table 9: Mexico: Production, Supply, and Distribution (PSD) for Sunflower Seed Meal Meal, Sunflowerseed 2017/2018 2018/2019 2019/2020 Market Begin Year Oct 2017 Oct 2018 Oct 2019
Mexico USDA Official New Post USDA Official New Post USDA Official New Post
Crush 33 33 33 33 0 34
Extr. Rate, 999.9999 0.4242 0.4242 0.4242 0.4242 0 0.4118
Beginning Stocks 0 0 0 0 0 0
Production 14 14 14 14 0 14
MY Imports 0 0 0 0 0 0
Total Supply 14 14 14 14 0 14
MY Exports 0 0 0 0 0 0
Industrial Dom. Cons. 0 0 0 0 0 0
Food Use Dom. Cons. 0 0 0 0 0 0
Feed Waste Dom. Cons. 14 14 14 14 0 14
Total Dom. Cons. 14 14 14 14 0 14
Ending Stocks 0 0 0 0 0 0
Total Distribution 14 14 14 14 0 14
(1000 MT) ,(PERCENT)
OIL MEAL PRODUCTION
The total Mexican oil meal production forecast for MY 2019/20 is 5.2 MMT, 2.7 percent higher than the
estimate for MY 2018/19. The growth is driven by greater demand for oil meal by the livestock and
poultry sectors. Mexico’s beef and pork sector outlook continue to be optimistic, as both sectors are
expected to increase their output three percent in CY 2019. As noted in the previous section, the poultry
industry also anticipates similar growth. Industry sources have stated that sufficient international
soybean supplies and affordable soybean prices will likely encourage domestic crushing in MY 2019/20.
These sources indicate that the crush pace will largely be determined by the domestic demand for
soybean meal in the livestock industry.
As in previous years, soybean meal continues to dominate the Mexican market, and for MY 2019/20 soy
meal is expected to account for nearly 83 percent of Mexico's total meal production. Meanwhile, the
production of oil meal from imported rapeseed is expected again to account for approximately 17
percent of total meal production in MY 2019/20. Industry sources have indicated that average soybean

MX9014 2019 Oilseeds and Products Annual Page 11
prices are expected to remain more affordable than those of rapeseed. Moreover, manufacturers have
pointed out that soybean meal has higher protein content than rapeseed meal. Consequently, more
soybeans would be crushed at the expense of rapeseed.
The upward trend in meal production has continued over the last few years, which also reflects increased
domestic crush capacity. As previously noted, this capacity continues to be highly concentrated in few
leading companies, such as Ragasa, Agydsa, Proteinas y Oleicos, and Cargill, among others. These
companies have expanded physical capacity in their crushing facilities and have also made their
crushing process and mechanical systems more efficient. However, private sources noted that this trend
of expansion and modernization of crush capacity could slow down in MY 2019/20 due to the economic
uncertainty in Mexico, and the consequent relatively bearish demand for oil meals and vegetable oils.
Rapeseed meal production is forecast to increase 1.2 percent for MY 2019/20, supported by an expected
increase in domestic pork production in CY 2019. The pork industry continues to be a major consumer
of rapeseed meal in Mexico.
Production of sunflower meal is expected to remain constant at 14,000 MT in MY 2019/20. Stable
crushing levels and relatively weak demand for sunflower meal will limit opportunities for increased
production.
MEAL CONSUMPTION
For MY 2019/20, total oil meal consumption is expected to increase by approximately 2.9 percent. As
noted above, the animal feed industry is expected to grow approximately three percent in 2019. The
poultry sector continues to be the major user of oilseeds meals in Mexico (mainly soybean meal).
According to the National Union of Poultry Farmers (UNA), the Mexican poultry industry, as a whole,
grew by three percent in 2018, and this trend is expected to continue in 2019. UNA stated that feed
continues representing approximately 63 percent of the total cost of chicken production. Factors that
play into continued poultry sector growth include modernization of farms, improved biosecurity
measures, new technologies and relatively well-priced feed (i.e. such as oilseed meals). As indicated in
the previous section, poultry remains the most affordable animal protein for the low and mid-income
population, accounting for 60 percent of animal protein consumption. For additional information on the
Mexican poultry sector, please see MX9013.
In addition, swine production is expected to increase nearly three percent, due to infrastructure
modernization, vertical integration, and improved biosecurity, which are allowing Mexican pork
producers to ramp up production to meet the increasing domestic demand for pork. In addition,
Mexico’s recognition as being free from Classical Swine Fever (CSF) has open new export markets and
allowed states like Veracruz and Puebla to invest in facility expansion. The swine sector is the largest
consumer of rapeseed meals, and CY 2018 saw an increase of 2.21 percent from 2017. Similarly,
animal feed industry sources stated the swine industry consumed 17 percent (6.4 MMT) of total feed
production in 2017. Private sources forecast this use by the swine sector could increase to 7.7 MMT by
2020. For additional information about the livestock sector, please see MX9003.
MX9014 2019 Oilseeds and Products Annual Page 12
Soybean meal consumption is expected to continue increasing at 6.35 MMT or three percent higher,
which is slightly lower rate than a year earlier (3.7 percent). This increase is driven by the expanding
poultry and hog industries.
For MY 2019/20, consumption of rapeseed meal is also expected to increase to 908,000 MT, due to
expected growth in the dairy and swine industries. Soybean meal is, and will likely to continue to be,
the meal of choice in the poultry industry. Rapeseed meal consumption should continue to account for
about 13 percent of total meal consumption in MY 2019/20, similar level that the previous year.
Essentially all sunflower meal produced in Mexico will be used for feed consumption. Demand for
sunflower meal is fairly weak, as industry sources note that protein levels and other characteristics
provide limited opportunities for sunflower meal outside of cattle feed.
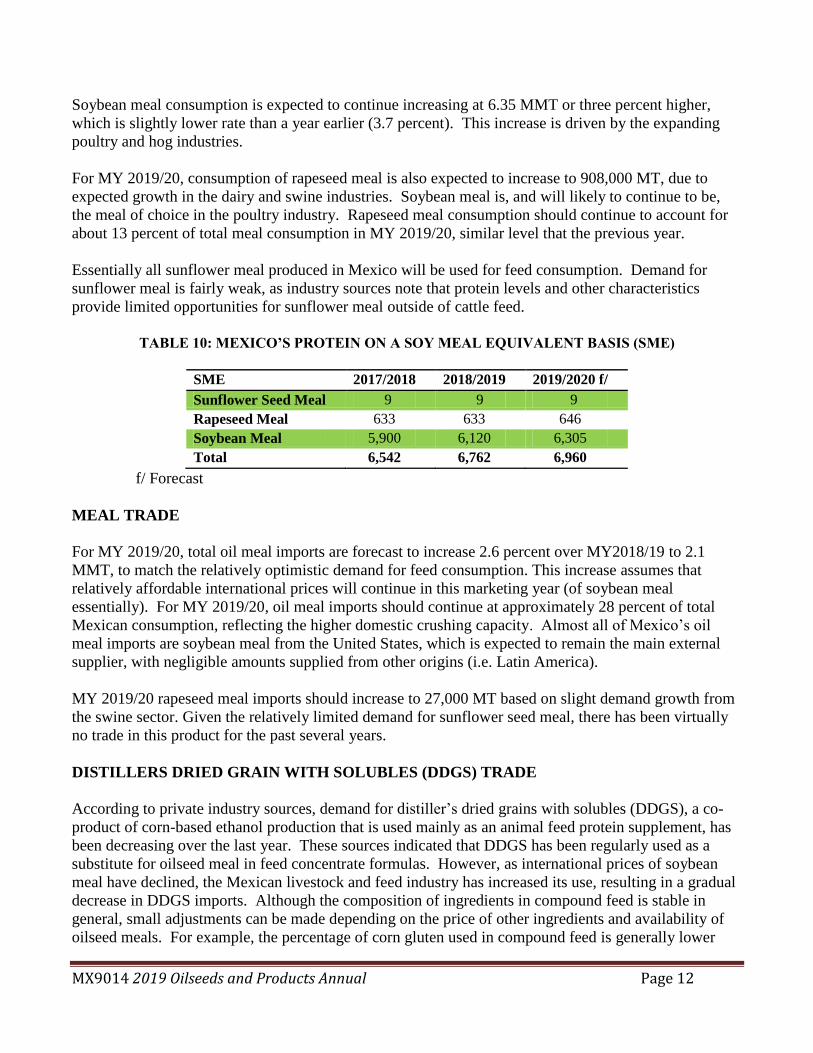
TABLE 10: MEXICO’S PROTEIN ON A SOY MEAL EQUIVALENT BASIS (SME)
SME 2017/2018 2018/2019 2019/2020 f/
Sunflower Seed Meal 9 9 9
Rapeseed Meal 633 633 646
Soybean Meal 5,900 6,120 6,305
Total 6,542 6,762 6,960
f/ Forecast
MEAL TRADE
For MY 2019/20, total oil meal imports are forecast to increase 2.6 percent over MY2018/19 to 2.1
MMT, to match the relatively optimistic demand for feed consumption. This increase assumes that
relatively affordable international prices will continue in this marketing year (of soybean meal
essentially). For MY 2019/20, oil meal imports should continue at approximately 28 percent of total
Mexican consumption, reflecting the higher domestic crushing capacity. Almost all of Mexico’s oil
meal imports are soybean meal from the United States, which is expected to remain the main external
supplier, with negligible amounts supplied from other origins (i.e. Latin America).
MY 2019/20 rapeseed meal imports should increase to 27,000 MT based on slight demand growth from
the swine sector. Given the relatively limited demand for sunflower seed meal, there has been virtually
no trade in this product for the past several years.
DISTILLERS DRIED GRAIN WITH SOLUBLES (DDGS) TRADE
According to private industry sources, demand for distiller’s dried grains with solubles (DDGS), a co-
product of corn-based ethanol production that is used mainly as an animal feed protein supplement, has
been decreasing over the last year. These sources indicated that DDGS has been regularly used as a
substitute for oilseed meal in feed concentrate formulas. However, as international prices of soybean
meal have declined, the Mexican livestock and feed industry has increased its use, resulting in a gradual
decrease in DDGS imports. Although the composition of ingredients in compound feed is stable in
general, small adjustments can be made depending on the price of other ingredients and availability of
oilseed meals. For example, the percentage of corn gluten used in compound feed is generally lower

MX9014 2019 Oilseeds and Products Annual Page 13
than the amount of DDGS due corn gluten’s higher price. Other ingredients used in feed concentrate
formulas are fish and meat meal. The trend to use soybean meal instead of DDGS is expected to
continue through CY 2019 (see graphic below).
Source: Global Trade Atlas
OILS: PRODUCTION, SUPPLY AND DEMAND STATISTICS
Table 11: Mexico: Production, Supply, and Distribution (PSD) for Total Oils
Market Begin Year Total Oils
Mexico 2017 2018 2019
USDA Official New Post USDA Official New Post USDA Official New Post
Crush 6,783 6,783 7,033 7,033 0 7,224
Extr. Rate
Beginning stocks 198 198 273 273 0 252
Production 1,551 1,551 1,596 1,596 0 1,634
MY imports 1,323 434 365 385 0 377
Total Supply 2,183 2,183 2,234 2,254 0 2,263
MY Exports 50 50 52 52 0 53
Industrial Dom. Cons. 0 0 0 0 0 0
Food Use Dom. Cons. 1,860 1,860 1,940 1,950 0 1,968
Feed Waste Dom. Cons. 0 0 0 0 0 0
Total Dom. Consumption 1,860 1,860 1,940 1,950 0 1,968
Ending Stocks 273 273 242 252 0 242
Total Distribution 2,183 2,183 2,234 2,254 0 2,263
Table 12: Mexico: Production, Supply, and Distribution (PSD) for Soybean Oil Oil, Soybean 2017/2018 2018/2019 2019/2020 Market Begin Year Sep 2017 Sep 2018 Sep 2019
Mexico USDA Official New Post USDA Official New Post USDA Official New Post
Crush 5250 5250 5500 5500 0 5660
Extr. Rate, 999.9999 0.1785 0.1785 0.1785 0.1785 0 0.1784
Beginning Stocks 172 172 218 218 0 200
MX9014 2019 Oilseeds and Products Annual Page 14
Production 937 937 982 982 0 1010
MY Imports 195 195 175 175 0 177
MY Imp. from U.S. 194 194 175 175 0 177
MY Imp. from EU 0 0 0 0 0 0
Total Supply 1304 1304 1375 1375 0 1387
MY Exports 26 26 25 25 0 26
MY Exp. to EU 0 0 0 0 0 0
Industrial Dom. Cons. 0 0 0 0 0 0
Food Use Dom. Cons. 1060 1060 1150 1150 0 1170
Feed Waste Dom. Cons. 0 0 0 0 0 0
Total Dom. Cons. 1060 1060 1150 1150 0 1170
Ending Stocks 218 218 200 200 0 191
Total Distribution 1304 1304 1375 1375 0 1387
(1000 MT) ,(PERCENT)
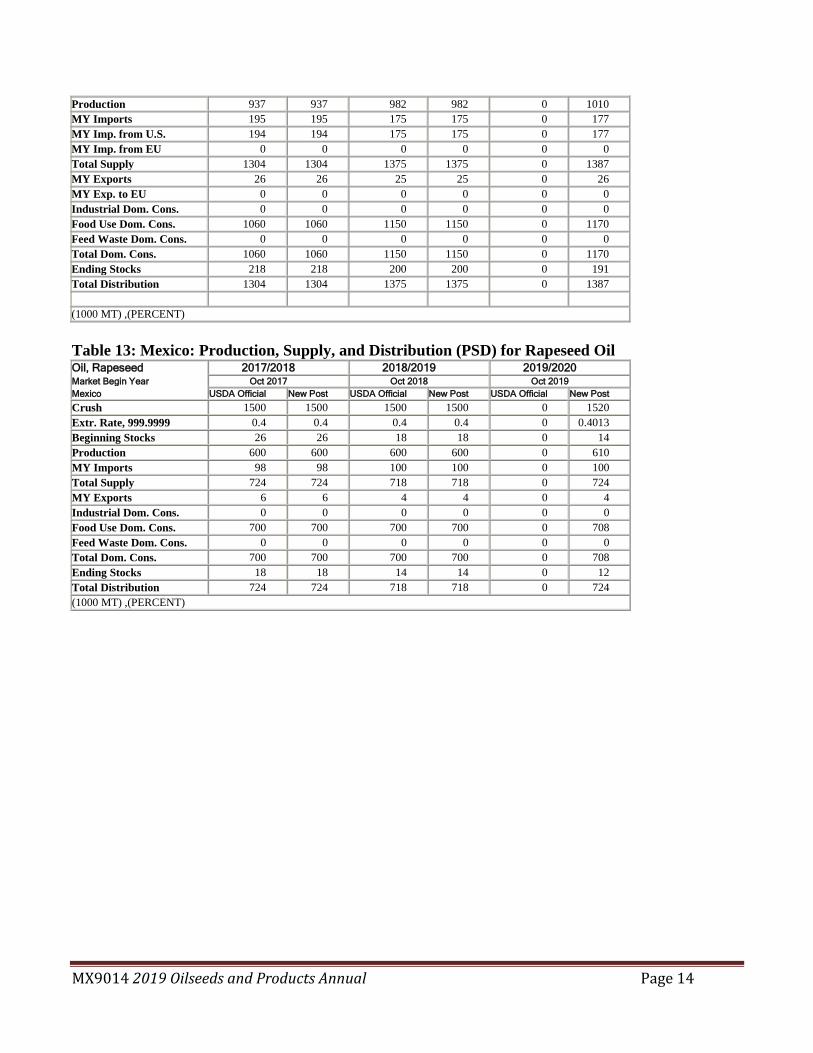
Table 13: Mexico: Production, Supply, and Distribution (PSD) for Rapeseed Oil Oil, Rapeseed 2017/2018 2018/2019 2019/2020 Market Begin Year Oct 2017 Oct 2018 Oct 2019
Mexico USDA Official New Post USDA Official New Post USDA Official New Post
Crush 1500 1500 1500 1500 0 1520
Extr. Rate, 999.9999 0.4 0.4 0.4 0.4 0 0.4013
Beginning Stocks 26 26 18 18 0 14
Production 600 600 600 600 0 610
MY Imports 98 98 100 100 0 100
Total Supply 724 724 718 718 0 724
MY Exports 6 6 4 4 0 4
Industrial Dom. Cons. 0 0 0 0 0 0
Food Use Dom. Cons. 700 700 700 700 0 708
Feed Waste Dom. Cons. 0 0 0 0 0 0
Total Dom. Cons. 700 700 700 700 0 708
Ending Stocks 18 18 14 14 0 12
Total Distribution 724 724 718 718 0 724
(1000 MT) ,(PERCENT)

MX9014 2019 Oilseeds and Products Annual Page 15
Table 14: Mexico: Production, Supply, and Distribution (PSD) for Sunflower Seed Oil Oil, Sunflowerseed 2017/2018 2018/2019 2019/2020 Market Begin Year Oct 2017 Oct 2018 Oct 2019
Mexico USDA Official New Post USDA Official New Post USDA Official New Post
Crush 33 33 33 33 0 34
Extr. Rate, 999.9999 0.4242 0.4242 0.4242 0.4242 0 0.4118
Beginning Stocks 0 0 37 37 0 38
Production 14 14 14 14 0 14
MY Imports 141 141 90 110 0 100
Total Supply 155 155 141 161 0 152
MY Exports 18 18 23 23 0 23
Industrial Dom. Cons. 0 0 0 0 0 0
Food Use Dom. Cons. 100 100 90 100 0 90
Feed Waste Dom. Cons. 0 0 0 0 0 0
Total Dom. Cons. 100 100 90 100 0 90
Ending Stocks 37 37 28 38 0 39
Total Distribution 155 155 141 161 0 152
(1000 MT) ,(PERCENT)
OIL PRODUCTION
Total oil production for MY 2019/20 is expected to increase by 2.4 percent to 1.6 MMT. This increase is
driven by population growth (1.01 percent), along with the expected growth in the Mexican economy in
2019. Mexico’s central bank (BANXICO) recently lowered its economic growth estimates for CY 2019
and next. Citing the recent slowdown in domestic activity as well as slower global growth and trade,
BANXICO estimates GDP growth between 1.1 and 1.2 percent in 2019, compared with its previous
estimate of 1.7 to 2.7 percent. BANXICO also lowered the forecast for 2020 to a range of 1.7 percent to
2.7 percent from the previous two to three percent. Industry sources have indicated that the crush is
determined in part by domestic demand for vegetable oils, and traditionally this demand grows at a
similar pace to GDP growth. In addition, these sources stated that production is expected to increase
more rapidly than consumption in the current marketing year, due to crushers’ desire to utilize their
newly installed capacity.
Soybean oil remains the major oil produced domestically, accounting for 62 percent of total production.
For the past year, about 96 percent of domestically produced soybean oil was extracted from imported
U.S. soybeans. For MY 2019/20, soybean oil production is forecast to increase approximately three
percent over MY2018/19 to 1.01 MMT due in part to demand for soy meal in the livestock sector, as
previously discussed. Rapeseed oil production is expected to increase by approximately 1.7 percent in
MY 2019/20, to keep pace with consumption.
Given steady crush volumes, MY 2019/20 production of sunflower oil is expected to remain at similar
levels to past years, or about 14,000 MT. As mentioned elsewhere in this report, just a few Mexican
companies crush and market sunflower oil, which tends to have lower margins than alternative oils.
According to trade sources, crushers are operating at 65-70 percent of capacity. That figure is expected
to continue unchanged in MY 2019/20. Industry sources stated that the total capacity of Mexican
crushing industry is nearly 10.0 MMT. Most of the major crushers are able to switch some portion of
their production easily between soybean and rapeseed oil production, depending on the crushing
margins. Recently, the margins have favored soybean crushing, according to industry sources.

MX9014 2019 Oilseeds and Products Annual Page 16
Palm oil is not included in the overall oil production numbers in this report, but the industry has grown
in the past fifteen years to make palm oil the third largest oil produced in Mexico by volume. This
growth has been driven in a large part by government programs encouraging the planting of oil palm in
the states of Veracruz, Tabasco, Chiapas, and Campeche. Private sector sources estimate that
approximately 237,000 MT of crude palm oil were produced in calendar year 2018, representing a
nearly 25 percent increase from the previous year. Approximately 13,000 MT of palm kernel oil was
also produced.
However, the private sector is less optimistic regarding the potential for future growth in this sector.
The oil palm production incentive programs championed by the previous government have now ended,
and the new government has not included oil palm in any of its current support programs. Additionally,
senior administration officials have publicly noted concerns regarding the sustainability and
environmental impact of palm oil production, casting doubt on whether it will be supported in the future.
In fact, the government appears to be encouraging planning of other types of trees (fruit trees and
hardwoods) in the same states that had previously been key palm oil production areas.
OIL CONSUMPTION
For MY 2019/20 oil consumption is forecast to increase just one percent, about the same rate as
population growth. In more difficult economic times, consumers may shift to cheaper protein sources
(e.g., pork to eggs or beans), but typically do not significantly change the amount of their oil
consumption. Based on private industry information, current per capita consumption of vegetable oils is
approximately 18 kg, of which 12 kg is cooking oil for home use and the remaining 6 kg is HRI and
industrial consumption.
Soybean oil continues to dominate the Mexican market, and soybean oil is expected to reach
approximately 60 percent market share in MY 2019/20, which is slightly higher than in MY 2018/19.
Most oil consumption continues to be accounted for by the food processing and oil blending industries.
Industry sources stated that marketing efforts and packaging improvements have continued to promote
soybean oil as a retail vegetable oil in its own right. For example, Agydsa, a Guadalajara-based
company, has continued bottling pure soybean oil under the name Soyaplus.
Rapeseed oil consumption is expected to increase slightly in MY 2019/20 to 708,000 MT, due to market
preferences for this vegetable oil. According to private sources, some Mexican consumers continue
transitioning into more health-conscious food choices and demanding edible oils that can provide a
healthier alternative when cooking. Cases of high cholesterol and triglycerides are becoming
increasingly common in the country, making this new tendency an opportunity for companies that
produce edible oils. As a result, companies are now offering edible oils with added vitamins and
antioxidants. Some sources stated that some marketing efforts for rapeseed (canola) oil have focused on
these healthy benefits, highlighting aspects such hearth health. Contacts pointed out that rapeseed
(canola) oil has less saturated fat than any other vegetable oil commonly used in the Mexican market.
Sunflower oil consumption is forecast at 90,000 MT in MY 2019/20, a decrease from the revised
estimate for MY 2018/19. Sunflower oil continues to be seen as a healthier alternative to other oil
options, which has made it attractive to snack makers in Mexico. This has especially been true in the
past several years, when the government has paid greater attention to the obesity epidemic in Mexico

MX9014 2019 Oilseeds and Products Annual Page 17
through advertising campaigns, additional taxes on some food products, and front-of-package labeling,
among other initiatives. However, sunflower oil continues to be a fairly expensive option for many
companies, which has limited demand growth. The relatively high cost of sunflower oil has also limited
home use, as Mexico is a price-dominated market.
The MY 2018/19 estimate for sunflower oil consumption has been increased based on updated official
data.
Private sector sources estimate palm oil consumption at approximately 676,000 MT in CY 2018 (these
figures not included in the oil consumption totals in this report). An additional 69,000 MT of palm
kernel oil and 38,000 MT of refined palm oil were also consumed. Palm oil has become increasingly
important for the food processing industry in recent years since companies began to remove trans-fats
from their recipes. A number of snack food companies have also switched to palm oil for products such
as potato chips due to its attractive pricing. However, consistent with the environmental concerns being
raised on the production side, private sector sources have suggested that increased consumer awareness
of deforestation and other concerns may have an impact on palm oil consumption in the medium to long
term.
OIL TRADE
For MY 2019/20, oil imports are forecast to decrease by approximately two percent. Two main factors
are driving the slight decline in oil imports:
Most of the new investments that the main companies have made in the recent years in additional
crushing and refining capacity and updates to existing machinery have entered into production.
As a result, a higher domestic crushing is expected and the consequent production of oil and
meal should cover domestic demand.
The ongoing slowdown of the Mexican economy should adversely affect the volume of oil
imports and the purchasing consumer power.
For MY 2019/20, soybean oil import is forecast to rise moderately to 177,000 MT.
Imports of soybean oil in MY 2019/20 will account for 47 percent of total oil imports, slightly higher
than a year earlier. The United States continues to be the main supplier of soybean oil into the Mexican
market and, due to lower freight costs, should maintain and potentially increase its share of the import
market. As previously noted, price continues to be the overriding factor in marketing vegetable oils and
oilseeds in Mexico.
Rapeseed oil imports for MY 2019/20 forecast are expected to remain stable at the same level as in MY
2018/19, due to the expected increase in domestic production.
Imports of sunflower oil are forecast to decrease slightly compared to the revised MY 2018/19 estimate
to 90,000 MT. The MY 2018/19 estimate has been increased to 110,000 MT, based on updated official
data. The majority of imported sunflower oil is crude oil from Argentina, which is refined in Mexico.
Private industry sources note that Argentina had a particularly large sunflower crop that contributed to
an increase in such imports during the 2018/20 marketing year.

MX9014 2019 Oilseeds and Products Annual Page 18
Mexico does export small volumes of sunflower/safflower oil, mainly to the United States. MY 2019/20
exports are forecast to remain constant at approximately 23,000 MT.
Despite growing palm oil production, Mexico is heavily dependent on imports to meet demand.
Approximately 65 percent of crude palm oil consumption (and a higher percentage of palm kernel oil
and all refined palm oil) is supplied through imports. In CY 2018, crude palm oil imports were
estimated at approximately 439,000 MT.
Source: Servicio Nacional de Información de mercados, SNIIM-SE. Exchange rate (March 22, 2018) US $ 1.00 = 18.69 Pesos
Oil Wholesale Prices
100
300
500
Peso
s p
er
Lt.
Mixed veg. 1Lt.12 bottle box 249.37 217.66 216.15 243.33 267.50 279.37
Soybean 1Lt.12 bottle box 272.00 255.50 248.75 244.62 281.50 279.75
Safflower 17 lt. Can( *1lt. 12
bottle box)
267.50* 248.00 232.50 250.00 270.00 387.00
Corn 418.00 330.00 331.00 383.00 399.00 312.00
Feb-14 Feb-15 Feb-16 Feb-17 Feb-18 Feb-19
*1lt.12bottle box
MX9014 2019 Oilseeds and Products Annual Page 19
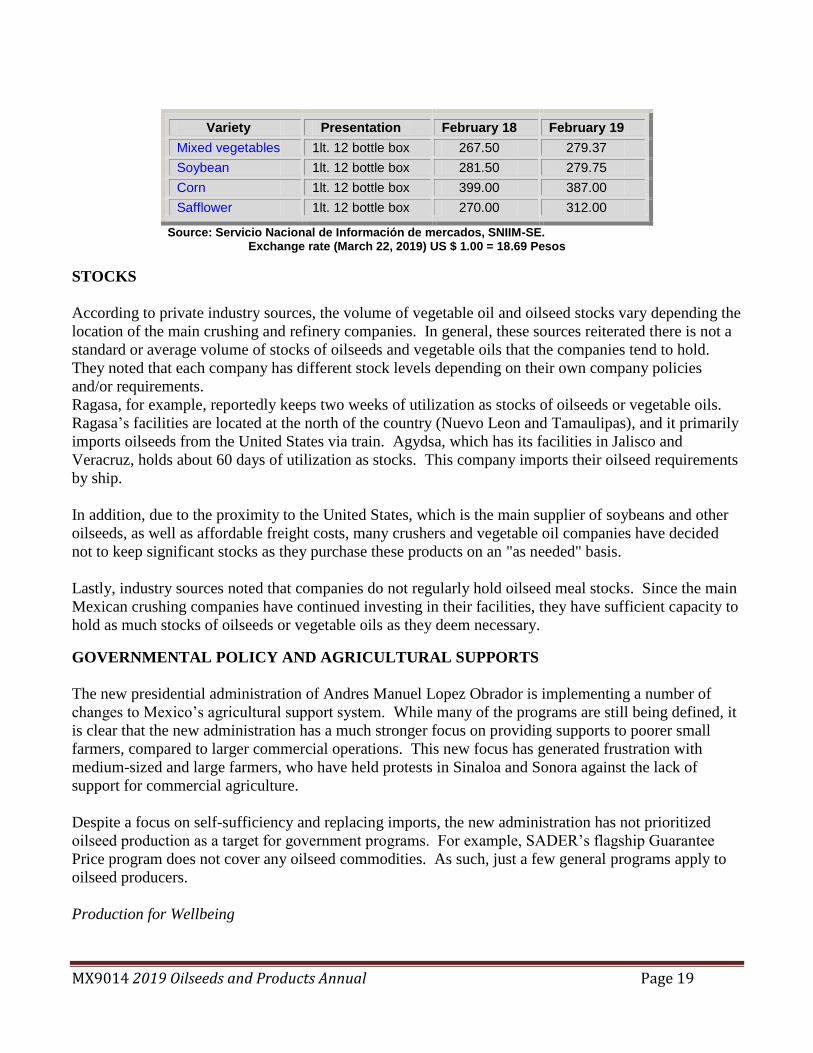
Variety Presentation February 18 February 19
Mixed vegetables 1lt. 12 bottle box 267.50 279.37
Soybean 1lt. 12 bottle box 281.50 279.75
Corn 1lt. 12 bottle box 399.00 387.00
Safflower 1lt. 12 bottle box 270.00 312.00
Source: Servicio Nacional de Información de mercados, SNIIM-SE. Exchange rate (March 22, 2019) US $ 1.00 = 18.69 Pesos
STOCKS
According to private industry sources, the volume of vegetable oil and oilseed stocks vary depending the
location of the main crushing and refinery companies. In general, these sources reiterated there is not a
standard or average volume of stocks of oilseeds and vegetable oils that the companies tend to hold.
They noted that each company has different stock levels depending on their own company policies
and/or requirements.
Ragasa, for example, reportedly keeps two weeks of utilization as stocks of oilseeds or vegetable oils.
Ragasa’s facilities are located at the north of the country (Nuevo Leon and Tamaulipas), and it primarily
imports oilseeds from the United States via train. Agydsa, which has its facilities in Jalisco and
Veracruz, holds about 60 days of utilization as stocks. This company imports their oilseed requirements
by ship.
In addition, due to the proximity to the United States, which is the main supplier of soybeans and other
oilseeds, as well as affordable freight costs, many crushers and vegetable oil companies have decided
not to keep significant stocks as they purchase these products on an "as needed" basis.
Lastly, industry sources noted that companies do not regularly hold oilseed meal stocks. Since the main
Mexican crushing companies have continued investing in their facilities, they have sufficient capacity to
hold as much stocks of oilseeds or vegetable oils as they deem necessary.
GOVERNMENTAL POLICY AND AGRICULTURAL SUPPORTS
The new presidential administration of Andres Manuel Lopez Obrador is implementing a number of
changes to Mexico’s agricultural support system. While many of the programs are still being defined, it
is clear that the new administration has a much stronger focus on providing supports to poorer small
farmers, compared to larger commercial operations. This new focus has generated frustration with
medium-sized and large farmers, who have held protests in Sinaloa and Sonora against the lack of
support for commercial agriculture.
Despite a focus on self-sufficiency and replacing imports, the new administration has not prioritized
oilseed production as a target for government programs. For example, SADER’s flagship Guarantee
Price program does not cover any oilseed commodities. As such, just a few general programs apply to
oilseed producers.
Production for Wellbeing

MX9014 2019 Oilseeds and Products Annual Page 20
As described in more detail in MX9002, the new Production for Wellbeing program replaces the
previous Proagro Productivo program, maintaining a similar structure. Production for Wellbeing is a
direct support program for small and medium producers of corn, dry beans, bread wheat, rice, and other
grains. Producers registered under the previous Proagro or PIMAF programs will be automatically
included in the new Production for Wellbeing system. The support amounts remain very similar to the
Proagro amounts:
Stratum Definition Allocation per eligible
hectare
Small Grower
Registered under Proagro, with up to 5 ha non-irrigated or
0.2 ha irrigated 1,600.00 pesos (84.21
USD)
Registered under PIMAF, with up to 3 ha
Medium
Grower
Registered under Proagro, with 5-20 ha non-irrigated or
0.2-5 ha irrigated
1,000.00 pesos (52.64
USD)
A total of nine billion pesos (approximately 474 million USD) will be available for this program in
2019, including some payments to settle debts inherited from the previous cycle of the Proagro
Productivo program.
Forward Contract Program
The Forward Contract program (originally described in 2008 GAIN Report MX8075) was formally
renewed via a Diario Oficial notice on March 21, 2019. The program will continue with essentially the
same structure as before. This is a hedging program, which encourages farmers to sign contracts with
domestic users of basic grains. Under the new administration, the supports to growers has been further
reduced from the previous 75 percent of the coverage cost (i.e., put or call) to 50 percent. This is due to
limited funds and a government-wide effort to reduce expenditures. Mexican industrial corn users
complained that in 2018, many farmers did not honor the contracts they signed. It is unclear whether
contract enforcement will become more stringent in future cycles.
Target Income Program
Like the Forward Contract program, the Target Income program was formally renewed in the March 21,
2019 notice. This program gives farmers a supplementary payment per ton of grains if the price they
received is lower than the target price (for further information on the establishment of this program,
please see MX9001. In 2018, the target income prices were increased to the levels in the table below,
which remain in effect for 2019 (see MX8028 for additional details):
Commodity Target Price per Metric Ton
Corn 3,960 pesos
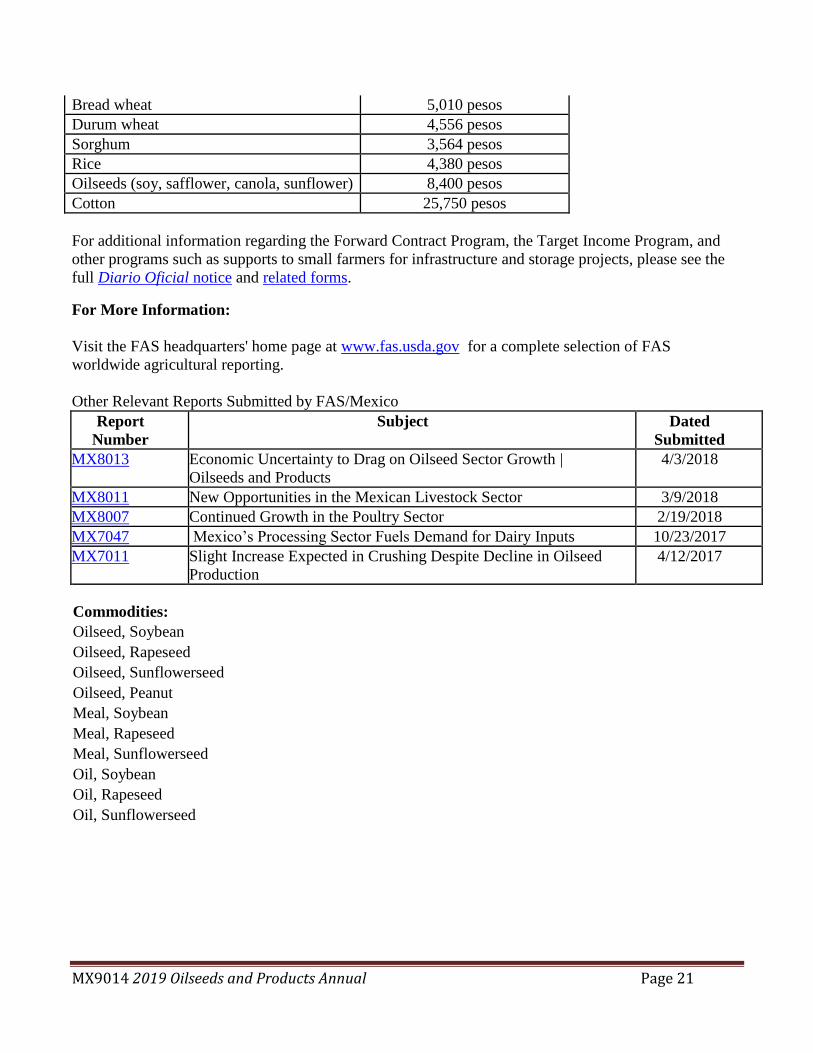
MX9014 2019 Oilseeds and Products Annual Page 21
Bread wheat 5,010 pesos
Durum wheat 4,556 pesos
Sorghum 3,564 pesos
Rice 4,380 pesos
Oilseeds (soy, safflower, canola, sunflower) 8,400 pesos
Cotton 25,750 pesos
For additional information regarding the Forward Contract Program, the Target Income Program, and
other programs such as supports to small farmers for infrastructure and storage projects, please see the
full Diario Oficial notice and related forms.
For More Information:
Visit the FAS headquarters' home page at www.fas.usda.gov for a complete selection of FAS
worldwide agricultural reporting.
Other Relevant Reports Submitted by FAS/Mexico
Report
Number Subject Dated
Submitted
MX8013 Economic Uncertainty to Drag on Oilseed Sector Growth |
Oilseeds and Products
4/3/2018
MX8011 New Opportunities in the Mexican Livestock Sector 3/9/2018
MX8007 Continued Growth in the Poultry Sector 2/19/2018
MX7047 Mexico’s Processing Sector Fuels Demand for Dairy Inputs 10/23/2017
MX7011 Slight Increase Expected in Crushing Despite Decline in Oilseed
Production
4/12/2017
Commodities:
Oilseed, Soybean
Oilseed, Rapeseed
Oilseed, Sunflowerseed
Oilseed, Peanut
Meal, Soybean
Meal, Rapeseed
Meal, Sunflowerseed
Oil, Soybean
Oil, Rapeseed
Oil, Sunflowerseed