Mexichem Reports Fourth Quarter and Full Year 2017 …€¦ · Mexichem Reports Fourth Quarter and...
27
1 Mexichem Reports Fourth Quarter and Full Year 2017 Results Tlalnepantla de Baz, Estado de Mexico, February 21, 2018 - Mexichem, S.A.B. de C.V. (BMV: MEXCHEM*) (“the Company” or “Mexichem”) announced its unaudited results for the fourth quarter and full year 2017. The figures have been prepared in accordance with International Financial Reporting Standards (“NIIF” or “IFRS”), having US dollars as the functional and reporting currency. All comparisons are made against the same period of the prior year. Unless specified to the contrary all figures are in millions. In some cases, numbers and percentages have been rounded and may not add up. Please note that the presentation of Mexichem’s 2016 fourth quarter results reflect the effects of several actions taken by the Company in 2016 and 2017. A detailed review of these actions and their impact can be found on Page 16 & 17 of this release. It is highly recommended that you read these Clarifications prior to analyzing the Company´s 4Q17 results. Fourth Quarter 2017 Financial and Operating Highlights (compared to 4Q16): • Revenues increased 15% to $1.5 billion. EBITDA was $277 million, a 40% increase over EBITDA of $198 million. EBITDA Margin increased 337 bps to 18.9%. • Income from continuing operations was $123 million, an increase of 137%. • Consolidated net loss of $22 million resulted from PMV´s VCM, Ethylene plants and auxiliary services related to those plants, classified as discontinued operations, following the decision of its shareholders to not rebuild its VCM production capacity, announced on December 20, 2017. • Cash Flow before dividends was up 103% to $258 million and Free Cash Flow increased 73% to $197 million. • ROE and ROIC adjusted for continuing operations were 9.8% and 8.2%, up 110 bps and 150 bps, respectively. CONSOLIDATED SELECTED FINANCIAL RESULTS For comparable purposes figures for 2016 and 2017 consider the discontinued operation related to the decision of PMV´s shareholders not to rebuild VCM production capacity. As such, adjusted figures present in previous financial reports related to PMV are no longer reported since they are allocated as a discontinued operation. mm US$ Selected Financial Results 2017 2016 %Var. 2017 2016 % Var. Net sales 1,468 1,278 15% 5,828 5,344 9% Operating income 162 116 40% 708 582 22% EBITDA 277 198 40% 1,106 895 24% EBITDA margin 18.9% 15.5% 337 bps 19.0% 16.7% 223 bps Income (loss) from continuing operations 123 52 137% 357 311 15% EBT 150 88 70% 535 422 27% Consolidated net income (loss) -22 83 N/A 214 247 -13% Net majority income 14 72 -81% 194 263 -26% Operating cash flow before capex 339 221 53% 683 558 22% Total CAPEX (organic & JV) -81 -95 -15% -289 -414 -30% Cash Flow before dividends 258 127 103% 394 144 174% Free cash flow 197 114 73% 201 90 123% Fourth Quarter January - December Stock Information Mexican Stock Exchange Ticker: MEXCHEM* Investor Relations contact: Fabiola Molina del Valle Phone: + (52) 55.5366.4050 [email protected] www.mexichem.com
-
Upload
duongnguyet -
Category
Documents
-
view
218 -
download
3
Transcript of Mexichem Reports Fourth Quarter and Full Year 2017 …€¦ · Mexichem Reports Fourth Quarter and...

1
Mexichem Reports Fourth Quarter and Full Year 2017 Results
Tlalnepantla de Baz, Estado de Mexico, February 21, 2018 - Mexichem, S.A.B. de C.V. (BMV: MEXCHEM*) (“the Company” or “Mexichem”) announced its unaudited results for the fourth quarter and full year 2017. The figures have been prepared in accordance with International Financial Reporting Standards (“NIIF” or “IFRS”), having US dollars as the functional and reporting currency. All comparisons are made against the same period of the prior year. Unless specified to the contrary all figures are in millions. In some cases, numbers and percentages have been rounded and may not add up. Please note that the presentation of Mexichem’s 2016 fourth quarter results reflect the effects of several actions taken by the Company in 2016 and 2017. A detailed review of these actions and their impact can be found on Page 16 & 17 of this release. It is highly recommended that you read these Clarifications prior to analyzing the Company´s 4Q17 results. Fourth Quarter 2017 Financial and Operating Highlights (compared to 4Q16):
• Revenues increased 15% to $1.5 billion. EBITDA was $277 million, a 40% increase over EBITDA of $198 million. EBITDA Margin increased 337 bps to 18.9%.
• Income from continuing operations was $123 million, an increase of 137%. • Consolidated net loss of $22 million resulted from PMV´s VCM, Ethylene plants and auxiliary
services related to those plants, classified as discontinued operations, following the decision of its shareholders to not rebuild its VCM production capacity, announced on December 20, 2017.
• Cash Flow before dividends was up 103% to $258 million and Free Cash Flow increased 73% to $197 million.
• ROE and ROIC adjusted for continuing operations were 9.8% and 8.2%, up 110 bps and 150 bps, respectively.
CONSOLIDATED SELECTED FINANCIAL RESULTS
For comparable purposes figures for 2016 and 2017 consider the discontinued operation related to the decision of PMV´s shareholders not to rebuild VCM production capacity. As such, adjusted figures present in previous financial reports related to PMV are no longer reported since they are allocated as a discontinued operation.
mm US$
Selected Financial Results 2017 2016 %Var. 2017 2016 % Var.
Net sales 1,468 1,278 15% 5,828 5,344 9%
Operating income 162 116 40% 708 582 22%
EBITDA 277 198 40% 1,106 895 24%
EBITDA margin 18.9% 15.5% 337 bps 19.0% 16.7% 223 bps
Income (loss) from continuing operations 123 52 137% 357 311 15%
EBT 150 88 70% 535 422 27%
Consolidated net income (loss) -22 83 N/A 214 247 -13%
Net majority income 14 72 -81% 194 263 -26%
Operating cash flow before capex 339 221 53% 683 558 22%
Total CAPEX (organic & JV) -81 -95 -15% -289 -414 -30%
Cash Flow before dividends 258 127 103% 394 144 174%
Free cash flow 197 114 73% 201 90 123%
Fourth Quarter January - December
Stock Information Mexican Stock Exchange Ticker: MEXCHEM*
Investor Relations contact: Fabiola Molina del Valle
Phone: + (52) 55.5366.4050 [email protected]
www.mexichem.com

2
FY17 Financial and Operating Highlights (compared to 2016)
• Revenues Increased 9% to $5.8 billion. • Company meets high end of EBITDA GUIDANCE range; EBITDA increased 25% when compared
to $884 million EBITDA reported a year ago and 24% to $1.1 billion compared to $895 million, which is the EBITDA adjusted for PMV´s VCM, Ethylene plants and auxiliary services related to those plants, classified as discontinued operations. EBITDA Margin increased 223 bps to 19%.
• Income from continuing operations of $357 million was 15% higher year-on-year. • Consolidated Net Income decreased 13% due to PMV´s VCM, Ethylene plants and auxiliary
services related to those plants, classified as discontinued operations following the decision to not rebuild the VCM production capacity, announced on December 20, 2017.
• Cash Flow before dividends increased 174% to $394 million and Free Cash Flow increased 123% to $201 million.
Company Expects EBITDA Growth of between 20% to 25% in 2018 including Netafim´s results.
MANAGEMENT COMMENTARY
Performance and Outlook
The fourth quarter represented a strong finish to a record year for Mexichem. EBITDA growth significantly outpaced revenue gains, and EBITDA margin expanded considerably from year-ago levels.
Mexichem’s fourth quarter results reflected improved market conditions and increased efficiencies across most of our business groups, resulting in considerable growth in operating profitability. Our Vinyl Business Group continued to be a key contributor to EBITDA growth, benefitting primarily from higher PVC pricing and the vertical integration benefits of our joint venture ethylene cracker. In the Fluor Business Group, strong demand for fluorspar, and higher refrigerant gas prices drove double-digit EBITDA growth. As expected, Fluent LatAm recovered sales momentum in the fourth quarter, and Fluent US/Canada and Europe each improved their margins. Fluent Business Group’s overall EBITDA was lower year-on-year, due to the lag-time in passing through rising PVC input prices to customers, economic headwinds in certain LatAm markets, expenses related to the acquisition of Netafim and the provision related to the CADE investigation in Brazil reported by the company in the 2Q16.
For the full year, we are pleased to report that Mexichem’s EBITDA performance came in at the high end of our guidance range, showing a year-on-year increase of 25% when compared to the EBITDA reported a year ago of $884 million, and a 24% increase when compared to the EBITDA adjusted by the re-classification as a discontinued operation of PMV´s VCM, Ethylene plants and auxiliary services related to those plants. This strong comparison reflected effective execution across each of the key pillars of our growth strategy, namely: greater vertical integration of our PVC production, an expanded portfolio of specialty products serving high growth markets, and the build out of our geographical footprint. Specific highlights of the year included: the commission of our joint venture ethylene cracker that became operational during the first quarter 2017; the end market diversification of our fluorspar business; the ITC resolution in March 2017 that supported higher refrigerant gas prices; the benefits of several bolt-on acquisitions that have added specialty products and new geographies to the Mexichem platform; and our acquisition of Netafim, which was completed early in 2018.
In addition to positioning Mexichem as the leader in the high growth micro irrigation market, Netafim is a transformational acquisition that will accelerate our drive into specialty products and solutions, and one that will enable us to address long term global issues around water and food security. Netafim will be consolidated into our Fluent Business Group for financial reporting purposes, and we will combine our irrigation product line under Netafim. With this scale, we will be well positioned in the worldwide agricultural sector.
Mexichem ended 2017 in a strong financial position and with very positive financial performance metrics, as full year ROIC and ROE on continuing operations increased by 110 and 150 bps, respectively. We have entered

3
2018 with the strongest operating platform in our history and a clear strategy for continued growth. We plan to maintain our focus on increasing returns and rolling out cross selling initiatives and operating synergies across the Company.
Based on our current business portfolio, we expect 2018 to be another year of strong growth for Mexichem with contributions from each of our key business areas. We are guiding to EBITDA growth of between 20% and 25% for 2018, supported by the full year benefit from our joint venture ethylene cracker, assumptions of continued higher pricing for key products, including PVC, fluorspar and refrigerant gases, recovery of Fluent LatAm, increased demand for our Fluent Business Group’s industrial products and an eleven-month contribution from Netafim.
“These tailwinds and the determination and skill of Mexichem’s over 18,000 employees worldwide and the more than 4,000 individuals coming from the Netafim team, give us confidence in our ability to continue to achieve significant profitable growth as a purpose-driven organization.”
REVENUES
Fourth quarter 2017 revenues were $1.5 billion, up $190 million, or 15%, from 4Q16 led by higher sales in all our Business Groups. Revenue growth in our Resins, Compounds, and Derivatives business unit continued to be driven mainly by positive market dynamics in the PVC industry associated with oil prices and supply constraints in China due to increased government environmental enforcement activities during the quarter. These factors led to a 13% increase in revenues on a 2% decrease in volumes, reflecting higher prices. Fluent Business Group revenues grew 11% or $76 million, mainly due to healthy revenue growth in US/Canada, Europe and LatAm, where sales increased by 27%, 13% and 8%, respectively, which more than compensated for the decline in AMEA. Fluor Business Group revenues increased 40%, fueled by significant volume growth in our upstream businesses resulting from higher demand from steel and cement industry customers and in our downstream businesses by higher refrigerant prices in Europe and the US. In 4Q17, the exchange rate translation effect negatively impacted consolidated sales by $76 million, mainly due to the depreciation of the Venezuelan bolivar against the US dollar, which more than compensated the 9% appreciation of the Euro against the US dollar. Out of the $76 million net effect of FX, 148% came from Venezuela where inflationary effect on sales was much higher than the devaluation effect of the Venezuelan bolivar due to the hyperinflationary environment. Without the Venezuelan impact, the translation effect would have a positive $37 million impact on consolidated sales, as such sales would have increased 12%. In 2017, consolidated revenues increased $484 million or 9% year-on-year to $5.8 billion. On a constant currency basis, total sales would have increased 11% year-on-year. Foreign currency translations reduced total sales by $106 million mainly resulting from the Venezuelan bolivar devaluation, partially offset by a 2% appreciation of the Euro against the US dollar. Out of the $106 million net FX impact, 107% came from Venezuela. Without the Venezuelan impact, the translation effect would have had a positive impact in consolidated sales of $7 million, and sales growth for the year would have remained at 9%.
4
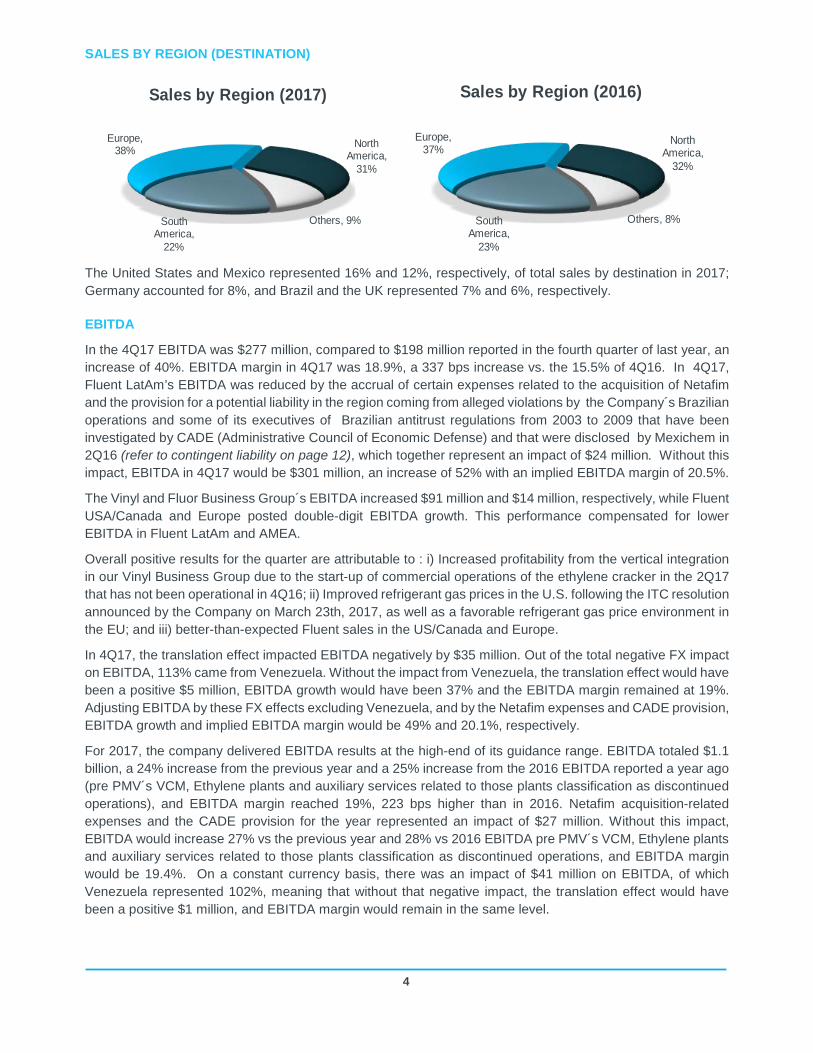
SALES BY REGION (DESTINATION)
The United States and Mexico represented 16% and 12%, respectively, of total sales by destination in 2017; Germany accounted for 8%, and Brazil and the UK represented 7% and 6%, respectively.
EBITDA
In the 4Q17 EBITDA was $277 million, compared to $198 million reported in the fourth quarter of last year, an increase of 40%. EBITDA margin in 4Q17 was 18.9%, a 337 bps increase vs. the 15.5% of 4Q16. In 4Q17, Fluent LatAm’s EBITDA was reduced by the accrual of certain expenses related to the acquisition of Netafim and the provision for a potential liability in the region coming from alleged violations by the Company´s Brazilian operations and some of its executives of Brazilian antitrust regulations from 2003 to 2009 that have been investigated by CADE (Administrative Council of Economic Defense) and that were disclosed by Mexichem in 2Q16 (refer to contingent liability on page 12), which together represent an impact of $24 million. Without this impact, EBITDA in 4Q17 would be $301 million, an increase of 52% with an implied EBITDA margin of 20.5%.
The Vinyl and Fluor Business Group´s EBITDA increased $91 million and $14 million, respectively, while Fluent USA/Canada and Europe posted double-digit EBITDA growth. This performance compensated for lower EBITDA in Fluent LatAm and AMEA.
Overall positive results for the quarter are attributable to : i) Increased profitability from the vertical integration in our Vinyl Business Group due to the start-up of commercial operations of the ethylene cracker in the 2Q17 that has not been operational in 4Q16; ii) Improved refrigerant gas prices in the U.S. following the ITC resolution announced by the Company on March 23th, 2017, as well as a favorable refrigerant gas price environment in the EU; and iii) better-than-expected Fluent sales in the US/Canada and Europe.
In 4Q17, the translation effect impacted EBITDA negatively by $35 million. Out of the total negative FX impact on EBITDA, 113% came from Venezuela. Without the impact from Venezuela, the translation effect would have been a positive $5 million, EBITDA growth would have been 37% and the EBITDA margin remained at 19%. Adjusting EBITDA by these FX effects excluding Venezuela, and by the Netafim expenses and CADE provision, EBITDA growth and implied EBITDA margin would be 49% and 20.1%, respectively.
For 2017, the company delivered EBITDA results at the high-end of its guidance range. EBITDA totaled $1.1 billion, a 24% increase from the previous year and a 25% increase from the 2016 EBITDA reported a year ago (pre PMV´s VCM, Ethylene plants and auxiliary services related to those plants classification as discontinued operations), and EBITDA margin reached 19%, 223 bps higher than in 2016. Netafim acquisition-related expenses and the CADE provision for the year represented an impact of $27 million. Without this impact, EBITDA would increase 27% vs the previous year and 28% vs 2016 EBITDA pre PMV´s VCM, Ethylene plants and auxiliary services related to those plants classification as discontinued operations, and EBITDA margin would be 19.4%. On a constant currency basis, there was an impact of $41 million on EBITDA, of which Venezuela represented 102%, meaning that without that negative impact, the translation effect would have been a positive $1 million, and EBITDA margin would remain in the same level.
Europe, 38% North
America, 31%
Others, 9%South America,
22%
Sales by Region (2017)
Europe, 37%
North America,
32%
Others, 8%South America,
23%
Sales by Region (2016)

5
OPERATING INCOME
For the 4Q17, Mexichem reported operating income of $162 million, compared to the $116 million reported in the 4Q16, a 40% increase. Excluding Netafim acquisition-related expenses and the CADE provision, operating income would be $186 million, an increase of 60%. This was mainly the result of the same factors mentioned above.
For 2017, operating income was $708 million, compared to the $582 million reported in 2016, an increase of 22%, and operating margin increased 127 bps to 12.2%. Without the Netafim acquisition-related expenses and the CADE provision, operating income would be $735 million representing an increase of 26% and an operating margin of 12.6%
FINANCIAL COSTS
In 4Q17, financial costs decreased $14 million or 52% compared to 4Q16. This decrease was mainly due to the profit originated by the inflation effects in Venezuela of $29 million recognized in 4Q17, as in the period the official accumulated inflation went from 500% to 2,616%. This effect was partially offset by an increase of $13 million in interest expenses related to the Company’s issuance of a long term, international bond in the amount of $1 billion that was completed in the third quarter.
Financial costs for 2017 increased $14 million or 9% to $176 million compared to 2016. This increase was mainly related to the company's debt denominated in Mexican pesos, as in 2017 the peso appreciated against the dollar, generating an exchange rate loss of $14 million in the period while in 2016, the peso depreciated against the dollar and an exchange rate gain of $15 million was recorded, meaning an increase in expenses of $29 million. Likewise, monetary losses of $33 million were recognized in 2017 related to net obligations less liabilities (when liabilities are greater than assets) recorded in currencies other than the functional currency, while in 2016 the same recognition was equivalent to losses of $13 million, generating an increase in expenses in 2017 vs 2016 of $20 million. All of those effects were partially offset by the profit generated in 2017 as a result of the inflationary effects of Venezuela of $49 million which in 2016 was $17 million, resulting in a benefit increase of $32 million and there was a net decrease in commissions and interest of $ 3 million.
TAXES
In 4Q17, cash tax declined 89% or $55 million compared with 4Q16, mainly due to the change in a mix of Mexichem’s subsidiaries that generate net earnings and those generating net losses added by the fluctuation of different currencies against the dollar recognizing some taxable profits in 2017 which are not accounting profits due to the functional and reporting currency. Mexichem then used some of its net operating losses (NOLs) to offset taxable income associated with the FX gains mentioned above Additionally, the use of bonus depreciation in our cracker JV in Texas allowed us to increase our Income from continuing operations without increasing the Company’s cash tax, reducing the cash tax rate from 70% in 4Q16 to 4% in 4Q17.
Deferred tax expense increased from a benefit of $25 million in 4Q16 to an expense of $20 million, mainly because of the use of NOL´s mentioned above, which was partially offset by the reduction in the U.S. corporate tax rate approved in 4Q17, which reduced the passive deferred tax position of the Company.
Thus, income taxes decreased from $37 million to $27 million, resulting in a decline in the effective tax rate to 18% in 4Q17 from 41% in 4Q16, while income from continuing operations increased from $88 million to $150 million.
In 2017, cash tax decreased from $189 million to $111 million mainly due to the fact that in 2016 the U.S. dollar appreciated against the Mexican peso while in 2017 it depreciated. In 2016, this generated exchange rate profits in our Fluor Business Group coming from our dollar denominated accounts receivable, while in 2017 there were losses, which reduced the cash tax. Additionally, the start-up of the cracker in February of 2017 increased our income from continuing operations while the use of bonus depreciation in the cracker JV in Texas

6
eliminated the tax payment on the income generated by the cracker. This resulted in a reduction in the cash tax rate from 45% in 2016 to 21% in 2017.
Conversely, 2017 deferred tax expense increased from a benefit of $79 million in 2016 to an expense of $66 million. This effect is mainly explained by the fact that in 2016 FX losses generated a deferred tax asset that benefited the company's results, while in 2017 the FX gains offset tax losses, decreasing the deferred tax asset which increased the deferred tax expense.
CONSOLIDATED NET INCOME (LOSS) AND MAJORITY INCOME (LOSS)
In 4Q17, the Company reported a Consolidated net loss of $22 million and Net Majority Income of $14 million, compared to reported Consolidated Net Income and Net Majority Income of $83 million and $72 million, respectively, in the 4Q16. Results were affected by the decision of PMV shareholders not to rebuild its VCM production capacity, which Mexichem announced on December 20, 2017. Therefore, the joint venture’s VCM production, and the assets and liabilities associated with ethylene production and auxiliary services associated with VCM and ethylene were re-classified on that date as discontinued operations. This re-classification was made on Mexichem’s financial statements for the years 2015, 2016 and 2017, since the decision implies the exit of PMV from the VCM and ethylene businesses in Mexico, and therefore, all of the impacts and the revenues recognized related to the incident at the VCM plant are presented as discontinued operations.
The combined results of discontinued operations included in the consolidated income statement and other comprehensive income are detailed in Appendixes I and II.
Income from continuing operations before income tax increased 70% in the 4Q17, while income from continuing operations after cash tax grew 450% to $143 million from $26 million, mainly due to the fact that the cracker generated higher Income from continuing operations but does not incur taxes due to the use of bonus depreciation.
Net Majority Income for the quarter declined 81% mainly as a result of the discontinued operation classification despite lower cash taxes.
For 2017, the Company posted $214 million and $194 million in Consolidated Net Income and Net Majority Income, respectively, compared to the $247 million and $263 million reported in 2016.
Income from continuing operations before income tax was 27% higher, however, Consolidated Net Income declined 13%, as a result of the discontinued operation mentioned previously and higher deferred tax expense effects that do not have any cash flow impact. Income from continuing operations after cash tax increased 82%,
Income statement 2017 2016 %
150 88 70%
Cash tax 7 62 -89%
143 26 450%
Deferred taxes 20 (25) N/A
Income (loss) from continuing operations 123 52 137%
Discontinued operations (145) 32 N/A
Consolidated net income (loss) (22) 83 N/A
Minority stockholders (36) 11 N/A
Net income (loss) 14 72 -81%
Income (loss) from continuing operations before income tax
Income (loss) from continuing operations after cash tax
USD in millions Fourth Quarter
7
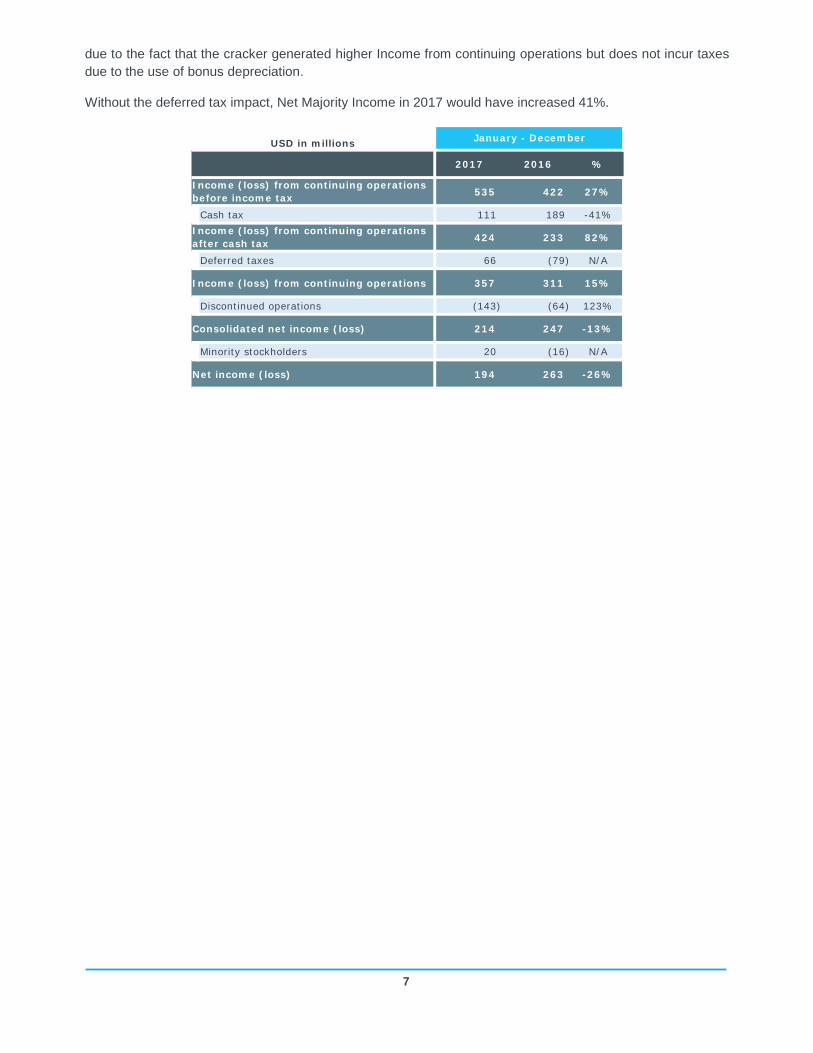
due to the fact that the cracker generated higher Income from continuing operations but does not incur taxes due to the use of bonus depreciation.
Without the deferred tax impact, Net Majority Income in 2017 would have increased 41%.
2017 2016 %
535 422 27%
Cash tax 111 189 -41%
424 233 82%
Deferred taxes 66 (79) N/A
Income (loss) from continuing operations 357 311 15%
Discontinued operations (143) (64) 123%
Consolidated net income (loss) 214 247 -13%
Minority stockholders 20 (16) N/A
Net income (loss) 194 263 -26%
January - December
Income (loss) from continuing operations after cash tax
Income (loss) from continuing operations before income tax
USD in millions

8
Adjusted ROE and ROIC from continuing operations:
ROE: Income from continuing operations / Adjusted Average Equity from continuing operations
ROIC: Adjusted NOPAT from continuing operations/Adjusted Equity from continuing operations + Liabilities with cost – Cash Income from continuing operations and NOPAT (EBIT-taxes) consider trailing twelve months.
4.4
7.0
8.7 8.0 7.7 7.6
9.8
ROE (%)Mexichem w/o Disc. Oper. PMV
5.4
6.5 6.7 6.4 6.8 7.2 8.2
ROIC (%)Mexichem w/o Disc. Oper. PMV

9
OPERATING CASH FLOW HIGHLIGHTS
• Operating Cash Flow before Capex grew 53% in the quarter due to higher EBITDA, lower cash taxes and net interest costs (interest payments related to the debt offering announced on September 27, 2017 will not be paid until 2018). Working capital needs in the quarter declined 23% vs 4Q16 due to an increase in accounts receivable, partially offset by higher accounts payable.
• For 2017 Operating Cash Flow before Capex grew 22% compared to 2016, benefitting from higher EBITDA, lower taxes and net interest costs (interest payments related to the debt offering announced on September 27, 2017 will not be paid until 2018). Working capital needs for the year increased mainly due to the start-up of the cracker JV in Texas, and higher PVC and refrigerant gas prices, which increased the dollar value of accounts receivable and inventories.
• Capital expenditures in 4Q17 decreased by 15% to $81 million, of which $14 million was utilized in PMV and $66 million was allocated to organic projects. For 2017 Capital Expenditures declined by 30% due to lower investments in the cracker JV in Texas.
NET WORKING CAPITAL
As of December 31, 2017, working capital needs increased by $103 million compared to December 2016. This represents an increase of $165 million in demand for working capital, compared to the $62 million in reduced demand between December 2016 and December 2015. This increase in the demand for working capital was
mm US$
2017 2016 %Var. 2017 2016 % Var.
EBITDA 277 198 40% 1,106 895 24%
Taxes paid -18 -62 -71% -122 -189 -35%
Net interest paid -3 -39 -92% -137 -152 -10%
Bank commissions -6 -9 -33% -27 -30 -10%
Exchange rate gains (losses) -16 -2 700% -33 -27 22%
Change in trade working capital 104 135 -23% -103 62 N/A
Operating cash flow before capex 339 221 53% 683 558 22%
CAPEX (Organic) -66 -54 22% -215 -204 5%
CAPEX (Total JV) -14 -77 -82% -119 -376 -68%
CAPEX JV (OXY share) 0 37 -100% 45 166 -73%
NET CAPEX JV -14 -40 -65% -74 -210 -65%
Total CAPEX (organic & JV) -81 -95 -15% -289 -414 -30%
Cash flow before dividends 258 127 103% 394 144 174%
Shareholders' dividend -61 -12 408% -193 -54 257%
Free cash flow 197 114 73% 201 90 123%
Fourth Quarter January - December
sep-17 dec-16 ∆ ($) sep-16 dec-15 ∆ ($)
Working Capital 287 184 -103 184 246 62
2017 Variation 2016 Variation

10
mainly due to the startup of the cracker in February 2017 and higher PVC and refrigerant gas prices in 2017 compared to 2016.
FINANCIAL DEBT
Net debt USD includes $0.9 million of letters of credit with maturities of more than 180 days that for covenant purposes are considered gross debt, although they are not booked in the accounting debt.
Total financial debt as of December 31, 2017 was $3.2 billion, plus $0.9 million in letters of credit with maturities of more than 180 days, for a total financial debt of $3.2 billion, while cash and cash equivalents totaled $1.9 billion, resulting in net financial debt of $1.35 billion. It is important to note that cash equivalents include the proceeds of the international bond offering completed on September 27, 2017, which were used to partially finance acquisition of Netafim, a privately-held Israeli company and a leader in precision irrigation solutions, that was completed on February 7, 2018.
The Net Debt/EBITDA ratio was 1.2x at December 31, 2017, while Interest Coverage was 5.7x.
Net Debt USD million
Net Debt/EBITDA 12 M
Interest coverage
Outstanding shares (millions) 2,100 2,100
1.2x 1.8x
5.7x 4.7x
Dec 2017 Dec 2016
1,356 1,587
Last Twelve Months

11
CONSOLIDATED BALANCE SHEET
Financial Assets
On April 20th, 2016, an explosion occurred in the VCM plant inside the Pajaritos Petroquemical Complex, where two of the three facilities of PMV are located (VCM and Ethylene). The chlorine and caustic soda plant is located on a separate site. There was no damage to the chlorine-caustic soda plant, but there was business interruption in the supply of raw material. The VCM plant (Clorados III) is the one that sustained most of the damage, the major economic impact of which was the write-off of the asset and the shutdown of that plant. The direct economic impacts of this incident are the following: (i) $276 million related to the VCM plant asset write off (property damage), (ii) $44 million in costs related to the closure of the plant (damages to third parties/civil liability, environmental, lawyers, advisors, partial demounting, etc), for a total of $320 million.
In 2016, PMV gathered sufficient information to decide to recognize the account receivable related to insurance coverages. During 2017 and 2016 associated to the incident in the VCM plant, PMV recognized $283 million as revenue and accounts receivable related to property damage, damages to third parties (civil liability) and directors and officer’s insurance coverages. The difference between $320 million for damages mentioned in the paragraph above and the $283 million related to revenues and accounts receivables recognized during 2016 and 2017 are dependent on the assembly policy insurance coverage which is in process to be claimed. PMV recognized business interruption insurance proceeds of $48 million for the VCM and Ethylene plants, $23
Balance sheet Dec 2017 Dec 2016
Total assets 9,759 8,354
Cash and temporary investments 1,900 714
Receivables 975 848
Inventories 675 606
Others current assets 403 393
Long term assets 5,807 5,794
Total liabilities 6,079 4,772
Current portion of long-term debt 45 58
Suppliers 1,362 1,270
Other current liabilities 723 658
Long-term debt 3,210 2,241
Other long-term liabilities 738 546
Consolidated shareholders'equity 3,681 3,582
Minority shareholders' equity 878 904
Majority shareholders' equity 2,803 2,678
Total liabilities & shareholders' equity 9,759 8,354
USD in millions

12
million for the Chlorine-Caustic Soda plant and our Resins, Compounds and Derivatives business unit recognized $18 million for our PVC plants.
On December 20, 2017, Mexichem announced the decision of PMV shareholders not to rebuild its VCM production capacity. Therefore, the joint venture’s VCM production, and the assets and liabilities associated with ethylene production and auxiliary services associated with VCM and ethylene were classified on that date as discontinued operations in Mexichem’s financial statements for the years 2015, 2016 and 2017, since this implies the exit of PMV from the VCM and ethylene businesses in Mexico. Thus, all of the impacts and the revenues recognized by PMV related to the incident in the VCM plant are presented as discontinued operations, except for the business interruption related to the Chlorine-Caustic soda plant.
Additionally, the PMV decision not to rebuild the VCM plant triggered the asset write-off of the Ethylene plant and auxiliary services related to the VCM and Ethylene plants equivalent to $196 million, also presented as discontinued operations.
Contingent Asset
As a result of the VCM Plant (Clorados III) incident described in the financial asset disclosure, there is a difference between the $320 million in damages and the $283 million of revenues and accounts receivable recognized during 2016 and 2017 related to the incident that are dependent on the assembly policy insurance coverage which is in process of being claimed. Additionally, and depending on the resolution of the environmental authorities mentioned in Contingent Liabilities below, the company would recognize revenue and accounts receivable according to the conditions contained in the environmental insurance coverage.
Contingent Liability
As a result of the VCM Plant (Clorados III) incident described in the contingent asset disclosure, PMV performed an environmental assessment to determine if any pollutants were deposited in areas surrounding the facility, delivered the report to the environmental authorities and is working with them in order to determine environmental damages, if any. Also, PMV could be responsible for third party injuries, if any. Based on the information the Company has as of this report, there is no evidence that there are additional relevant liabilities.
As reported in 2Q16, Mexichem’s Brazilian subsidiary was notified by CADE of alleged violations of the rules of economic competition in Brazil, committed by the subsidiary and some of its executives, from 2003 to 2009. Mexichem is fully committed to complying with local regulations in all countries where it operates. As of the date of these consolidated financial statements, Mexichem has recognized the amount of the potential liability that it has been able to reliably estimate at this stage of the process. As the process progresses, the amount of the liability may change.

13
CONSOLIDATED INCOME STATEMENT
OPERATING RESULTS BY BUSINESS GROUP
VINYL Business Group (38% and 46% of Mexichem’s sales (before eliminations) and EBITDA respectively, in 2017)
* Intercompany sales were $51 million and $41 million in 4Q17 and 4Q16, respectively, and as of December 2017 and 2016 they were $184 million and $152 million, respectively.
* Intercompany sales were $59 million and $48 million in the 4Q17 and 4Q16, respectively, and as of December 2017 and 2016 were $215 million and $184 million, respectively. Of these amounts $9 million and $7 million were invoiced to PMV in 4Q17 and 4Q16, respectively and $31 million and $33 million accrued to December 2017 and 2016.
INCOME STATEMENT 2017 2016 % 2017 2016 %
Net sales 1,468 1,278 15% 5,828 5,344 9%
Cost of sales 1,086 1,001 8% 4,375 4,078 7%
Gross profit 382 277 38% 1,453 1,266 15%
Operating expenses 219 161 36% 745 685 9%
Operating income (loss) 162 116 40% 708 582 22%
Financial cost 13 27 -52% 176 162 9%
Equity in income of associated entity (1) 1 N/A (2) (3) -33%
150 88 70% 535 422 27%
Cash tax 7 62 -89% 111 189 -41%
Deferred taxes 20 (25) N/A 66 (79) N/A
Income tax 27 36 -25% 178 111 60%
Income (loss) from continuing operations 123 52 137% 357 311 15%
Discontinued operations (145) 32 N/A (143) (64) 123%
Consolidated net income (loss) (22) 83 N/A 214 247 -13%
Minority stockholders (36) 11 N/A 20 (16) N/A
Net income (loss) 14 72 -81% 194 263 -26%
EBITDA 277 198 40% 1,106 895 24%
January - DecemberUSD in millions Fourth Quarter
Income (loss) from continuing operations before income tax
mm US$
Vinyl 2017 2016 %Var. 2017 2016 % Var.
Volume (K tons) 589 575 2% 2,505 2,454 2%
Total sales* 568 496 15% 2,317 2,026 14%
Operating income 98 30 227% 325 171 90%
EBITDA 150 59 154% 507 283 79%
Fourth Quarter January - December
mm US$
Resins, Compounds & Derivatives 2017 2016 %Var. 2017 2016 % Var.
Volume (K tons) 517 525 -2% 2,226 2,179 2%
Total sales* 551 487 13% 2,254 1,982 14%
Operating income 93 35 166% 311 167 86%
EBITDA 143 62 131% 482 272 77%
Fourth Quarter January - December

14
* Intercompany sales invoiced to Resins, Compounds and Derivatives were $1.1 million and $0.8 million in 4Q17 and 4Q16, respectively. And, as of December 2017 and 2016 were $6 million and $4 million, respectively.
In 4Q17, the Vinyl Business Group reported a 2% increase in volumes, and 15% growth in sales to $568 million, reflecting better PVC dynamics globally, mainly associated with oil prices and supply constraints coming from Asia. Also, revenues continued to benefit from the integration of Vinyl Compounds, Ltd into our Compounds business.
EBITDA for the Vinyl Business Group was $150 million, compared to $59 million in 4Q16, an increase of 154%. This growth resulted from better PVC market conditions (prices and volumes), product mix, efficiencies in our operations, and the benefits of our increased vertical integration across the ethane-to-PVC value chain due to the start of commercial operations of our JV ethylene cracker in Texas. EBITDA margin was 26.4% in 4Q17 compared to 11.9% in 4Q16.
For the quarter, Resins, Compounds and Derivatives revenues and EBITDA increased 13% and 131%, respectively, to $551 million and $143 million from 4Q16 levels, on a 2% decline in volumes to 517 thousand tons. Revenues benefited from better PVC market conditions and our strategic acquisition of Vinyl Compounds, Ltd. EBITDA improved dramatically because of the previously-mentioned factors, but mainly due to a decline in our PVC production costs as a result of increased vertical integration and its associated benefits in the Vinyl Business Group. Operating income for Resins, Compounds and Derivatives was $93 million, an increase of 166% from the $35 million reported in 4Q16.
In 4Q17, PMV sales were $26 million, the majority of which came from our chlorine-caustic soda operations. It is important to note that positive $7 million EBITDA contribution from PMV in 4Q17 was entirely related to its operations.
In 2017, the Vinyl Business Group’s sales increased 14% due to better market conditions in PVC (volumes and prices). EBITDA was $507 million, 79% higher than in 2016, because of better PVC trends and increased vertical integration across the ethane-to PVC value chain and its associated benefits, resulting in a 21.9% EBITDA margin, while in 2016 EBITDA Margin was 13.9%.
FLUENT Business Group (50% and 35% of Mexichem’s sales (before eliminations) and EBITDA, respectively, in 2017)
mm US$
PMV 2017 2016 %Var. 2017 2016 % Var.
Volume (K tons) 77 56 38% 309 314 -2%
Total sales* 26 17 53% 99 80 24%
Operating income 5 -5 N/A 14 4 250%
EBITDA 7 -3 N/A 25 11 127%
Fourth Quarter January - December
mm US$
Fluent 2017 2016 %Var. 2017 2016 % Var.
Sales 765 689 11% 3,023 2,892 5%
Fluent LatAm 314 292 8% 1,132 1,100 3%
Fluent Europe 315 278 13% 1,321 1,269 4%
Fluent US & Canada 108 85 27% 449 384 17%
Fluent AMEA 31 38 -18% 138 149 -7%
Intercompany eliminations (3) (4) -25% (17) (10) 70%
Operating income 31 57 -46% 234 284 -18%
EBITDA 76 93 -18% 385 421 -9%
Fourth Quarter January - December

15
In 4Q17, the Fluent Business Group’s sales were $765 million, an 11% increase compared to the $689 million reported one year ago, mainly driven by higher sales in US/Canada, Europe and LatAm which grew 27%, 13% and 8%, respectively. Operations in LatAm, improved compared to the first three quarters of 2017.
On a constant currency basis, total sales in the Fluent Business Group would have been $846 million, which represents an $80 million negative impact year-over-year, mainly as a result of the hyperinflationary environment in Venezuela, where the inflationary effect on sales was much higher than the devaluation of the Venezuelan bolivar. Out of the $80 million, $112 million came from Venezuela. Without the Venezuelan impact, the translation effect would have a positive $32 million impact on consolidated sales, and sales would have grown 6.3%. The $32 million FX positive impact is mainly due to the 9% appreciation of the Euro against the US dollar.
EBITDA for 4Q17 was $76 million, an 18% decrease compared to 4Q16, mainly impacted by the accrual of certain expenses related to the acquisition of Netafim and the Company’s decision to provision a potential liability from CADE (Administrative Council of Economic Defense) in Brazil (refer to contingent liability on page 12), which together represent an impact of $24 million. Without this impact, EBITDA in 4Q17 would be $100 million, an increase of 8%. It is noteworthy to comment that EBITDA margin in the US/Canada and Europe improved by 90 bps to 14.7% and 11.6%, respectively, compared to the 4Q16. Fluent´s Consolidated EBITDA margin was 9.9% compared to 13.6% in 4Q16, mostly due to the accrual of certain Netafim expenses and the provision of the potential liability from CADE, but without those EBITDA margin would be 13%. Operating income decreased 46% to $31 million, but without the Netafim and CADE effects, the decrease would be only 3.5% to $55 million.
EBITDA for 4Q17 had a negative impact from currency translation effects of $37 million, out of which $40 million came from Venezuela where the inflationary effect outpaced the devaluation of the Venezuelan bolivar, due to the hyperinflationary environment. Without this Venezuelan impact, the translation effect would have been a positive $1.6 million impact, and also adjusting for the Netafim and CADE effects, EBITDA would have increased 6%. For 2017 revenues increased 5%, growing in most regions with the exception of AMEA where sales declined 7%. The translation effect on sales was $92 million, out of which $113 came from Venezuela. On a neutral currency basis, sales would have been $3.1 billion, up 8% vs. 2016, but without the Venezuelan effect, sales would have grown 4%.
For 2017 EBITDA declined 9% compared to the same period in 2016 due to the abovementioned effects, but without the Netafim and CADE effects of $27 million for FY17, EBITDA would be $412 million, 2.1% below FY2016. EBITDA margin was 12.7% compared to 14.6% the previous year. Adjusted for the Netafim and CADE effects, implied 2017 EBITDA margin would be 13.6%.
4Q16 4Q17 4Q17/4Q16Sales Sales FX Total % Var292 Fluent LatAm 314 99 414 42%278 Fluent Europe 315 -18 297 7%85 Fluent US/Canada 108 0 108 27%38 Fluent AMEA 31 -1 29 -24%-4 Intercompany Eliminations -3 0 - 3 -25%
689 Total 765 80 846 23%
mm US$4Q17
12M16 12M17 12M17/12M16Sales Sales FX Total % Var1,100 Fluent LatAm 1,132 81 1,213 10%1,269 Fluent Europe 1,321 14 1,335 5%384 Fluent US/Canada 449 -1 448 17%149 Fluent AMEA 138 -2 137 -8%-10 Intercompany Eliminations -17 0 - 17 70%
2,892 Total 3,023 92 3,115 8%
mm US$12M17

16
On a constant currency basis EBITDA for 2017 would have decreased only 1% to $424 million, implying an EBITDA margin of 14%. From the negative translation effect of $39 million, 107% is due to the Venezuela effect, without which there would have been a positive impact of $3 million which is roughly neutral to the EBITDA growth rate and to EBITDA margin.
FLUOR BUSINESS GROUP (11% and 23% of Mexichem’s sales (before eliminations) and EBITDA, in 2017)
In 4Q17, the Fluor Business Group reported a 40% increase in sales, reflecting significant growth in both the upstream and the downstream parts of the business due to improved demand for fluorspar from the cement and steel industries, and higher refrigerant gas prices in the U.S. and Europe. EBITDA in 4Q17 grew 26% year-over-year to $68 million, and EBITDA margin was 36.6%. Operating income was $53 million, a 29% year-over-year increase. In 2017 revenues were up 17% to $681 million, while EBITDA increased by 14% to $259 million. EBITDA margin was 38%, and operating income rose 17% to $206 million.
Clarifications
- As reported in 4Q16, as part of our core strategy of shifting to higher margin products in our Fluent Business Group, at the end of 1Q16 we decided to exit from our pressure pipe business in the US, which impacted our Fluent US/ AMEA Business. This decision was made in order to shift our capacity from pressure pipes, where products have low margins to Datacom, where margins are higher. This is due to the reclassification of Fluent’s pressure pipe business as discontinued operations, which had a net effect of $4 million, $7 million and $7 million on revenues and $1.4 million, $2.4 million and $2.3 million on EBITDA during 1Q16, 2Q16 and 3Q16, respectively.
- In 2016, Mexichem performed an analysis to determine whether the company is the “agent” or
“principal” in terms of IAS 18 Revenue, in order to determine how freight costs should be recorded and reported on our P&L. The conclusion was that the company is “principal” and that freight costs should be included in Cost of Goods Sold (COGS) instead of Sales, General and Administrative Expenses (SG&A), as it was during the first three quarters of 2016 and in previous years. Consequently, in the fourth quarter of 2016, we reclassified the FY16 freight costs from SG&A to COGS.
The freight costs related to the 1st, 2nd, 3rd and 4th quarters of 2016 were $73 million, $79 million, $78 million and $70 million, respectively. For the 2016 1st, 2nd, and 3rd quarters freight costs impacted 4Q16 COGS. This reclassification does not have any effect on EBITDA, but it does have an effect on reported gross profit.
mm US$
Fluor 2017 2016 %Var. 2017 2016 % Var.
Sales 186 133 40% 681 583 17%
Operating income 53 41 29% 206 176 17%
EBITDA 68 54 26% 259 228 14%
Fourth Quarter January - December

17
- As announced in our 4Q16 earnings report, Mexichem’s Audit Committee and Board of Directors have
authorized a change in the Company’s accounting policy related to fixed asset valuation from the revaluation method to the historical cost recognition method. Effective in 1Q17, Mexichem reduced its fixed assets by $452 million, deferred taxes by $136 million and equity value by $316 million on its balance sheet by eliminating the revaluation value that has been accrued since Mexichem adopted IFRS in 2010. For comparative purposes, starting with the 1Q17 quarterly report, and during 2017, Mexichem includes quarterly information showing the 2016 changes in depreciation on the Income Statement, as well as the changes in fixed assets, deferred taxes and equity value on its Balance Sheet as if the accounting policy change would have been authorized in 1Q16. Additional details are contained on page 27.
- On April 20th, 2016, an explosion occurred in the VCM plant inside the Pajaritos Petroquemical Complex, where two of the three facilities of PMV are located (VCM and Ethylene). The chlorine and caustic soda plant is located on a separate site. There was no damage to the chlorine-caustic soda plant, but there was business interruption in the supply of raw material. The VCM plant (Clorados III) is the one that sustained most of the damage, the major economic impact of which was the write-off of the asset and the shutdown of that plant. The direct economic impacts of this incident are the following: (i) $276 million related to the VCM plant asset write off (property damage), (ii) $44 million in costs related to the closure of the plant (damages to third parties/civil liability, environmental, lawyers, advisors, partial demounting, etc), for a total of $320 million. In 2016, PMV gathered sufficient information to decide to recognize the account receivable related to insurance coverages. During 2017 and 2016 associated to the incident in the VCM plant, PMV recognized $283 million as revenue and accounts receivable related to property damage, damages to third parties (civil liability) and directors and officer’s insurance coverages. The difference between $320 million for damages mentioned in the paragraph above and the $283 million related to revenues and accounts receivables recognized during 2016 and 2017 are dependent on the assembly policy insurance coverage which is in process to be claimed. Additionally, PMV recognized $47 million related to the business interruption coverage for the VCM and Ehtylene plants. On December 20, 2017, Mexichem announced the decision of PMV shareholders to not rebuild its VCM production capacity. Therefore, the joint venture’s VCM production, and the assets and liabilities associated with ethylene production and auxiliary services associated with VCM and ethylene were classified on that date as discontinued operations in Mexichem’s financial statements for the years 2015, 2016 and 2017, since this implies the exit of PMV from the VCM and ethylene businesses in Mexico. Thus, all the impacts and the revenues recognized by PMV related to the incident in the VCM plant are presented as discontinued operations except for the business interruption related to the Chlorine-Caustic soda plant. Additionally, the PMV decision to not rebuild the VCM plant, triggered the asset write-off of the Ethylene plant and auxiliary services related to the VCM and Ethylene plants for $196 million, also presented as discontinued operations.
The restructured figures with the abovementioned effects are shown in Appendix I, Appendix II and Appendix III.

18
RECENT EVENTS
- On February 7, 2018, Mexichem announced that it had completed the acquisition of an 80% stake in Netafim, Ltd. (“Netafim”) from a company backed by the Permira funds following the receipt of all the governmental authorizations and the satisfaction of all the precedent conditions required by the Share Purchase Agreement had been obtained and completed. Netafim is a privately-held Israeli company and a leader in precision irrigation solutions. The total enterprise value of the transaction was US$1.895 billion. Kibbutz Hatzerim retains 20% ownership in Netafim, which will maintain its headquarters in Israel. As previously-disclosed, Mexichem financed the acquisition with a combination of cash and debt.
- On February 7, 2018, Mexichem announced that its Board of Directors has unanimously ratified the appointment of Daniel Martínez Valle as the Chief Executive Officer of the Company
- On January 22, 2018, Mexichem announced that it had acquired Sylvin Technologies Inc., a niche PVC compounds manufacturer based in Denver, Pennsylvania for an Enterprise Value of $39 million based on a debt free cash free valuation. Sylvin is expected to have total sales of $29 million for the full year of 2017. The Company has a 30-year history of serving a broad range of industries including: wire and cable, electrical, industrial, automotive, medical and food products. Mexichem will consolidate Sylvin under the Company’s Vinyl Business Group as part of its Compounds Business Unit, a leading supplier of PVC compound solutions serving the global market.
- On December 20, 2017, Mexichem announced the decision of PMV shareholders to not rebuild its VCM production capacity.
For all the news please visit the following webpage http://www.mexichem.com/news/
Conference Call Details:
Mexichem will host a conference call to discuss its 4Q17 results on February 22, 2018 at 10:00 am Mexico City /11:00 NY. To access the call, please dial 001-855-817-7630 (Mexico), or 1-888-349-0106 (United States) or 1-412-902-0131 (International). All callers should dial in a minimum of 15 minutes prior to the start time and ask for the Mexichem conference call.
The call will also be available through an audio only live webcast until May 22, 2018. A replay of the call will be available approximately two hours after the end of the call. The replay can be accessed via Mexichem’s website at www.mexichem.com

19
RECONCILIATION SUMMARY BY BUSINESS GROUP
Fourth Quarter 2017 Financial and Operating Highlights
Sub=Subtotal
2017 Financial and Operating Highlights
Quarter
mm US$ 4Q16 4Q17 %Var. 4Q16 4Q17 %Var. 4Q16 4Q17 bps
Vinyl 496 568 15% 59 150 154% 11.9% 26.4% 1,456
Fluent 689 765 11% 93 76 -18% 13.6% 9.9% -368
Fluor 133 186 40% 54 68 26% 40.5% 36.3% -416
Energy 0 0 0 0 0
Eliminations/ Holding -40 -51 28% -8 -16 100% 20.7% 31.1% 1,036
Mexichem Consolidated 1,278 1,468 15% 198 277 40% 15.5% 18.9% 337
Sales EBITDA EBITDA Margin
4Q16 4Q17 4Q17/4Q16Sales Sales FX Total % Var496 Vinyl 568 -2 566 14%689 Fluent 765 80 846 23%
1,185 Ethylene (Vinyl + Fluent) 1,333 78 1,412 19%133 Fluor 186 -2 184 38%0 Energy 0 0 0
-40 Eliminations / Holding -51 0 - 51 28%1,278 Total 1,468 76 1,544 21%
mm US$4Q17
4Q16 4Q17 4Q17/4Q16EBITDA EBITDA FX Total % Var
59 Vinyl 150 0 150 154%93 Fluent 76 37 112 20%
152 Ethylene (Vinyl + Fluent) 226 36 262 72%54 Fluor 68 -1 67 24%0 Energy 0 0 0 -8 Eliminations / Holding -16 0 - 16 100%
198 Total 277 35 313 58%
mm US$4Q17
mm US$ 12M16 12M17 %Var. 12M16 12M17 %Var. 12M16 12M17 bps
Vinyl 2,026 2,317 14% 283 507 79% 14.0% 21.9% 790
Fluent 2,892 3,023 5% 421 385 -9% 14.6% 12.7% -183
Fluor 583 681 17% 228 259 14% 39.1% 38.1% -100
Energy 2 2 0% 1 1 0% 0
Eliminations / Holding -159 -193 21% -38 -46 21% 24.2% 24.0% -14
Mexichem Consolidated 5,344 5,828 9% 895 1,106 24% 16.7% 19.0% 223
Sales EBITDA EBITDA Margin
12M16 12M17 12M17/12M16Sales Sales FX Total % Var2,026 Vinyl 2,317 6 2,323 15%2,892 Fluent 3,023 92 3,115 8%4,918 Ethylene (Vinyl + Fluent) 5,340 98 5,438 11%583 Fluor 681 8 689 18%2 Energy 2 0 2
-159 Eliminations / Holding -193 0 -193 21%5,344 Total 5,828 106 5,934 11%
mm US$12M17
12M16 12M17 12M17/12M16EBITDA EBITDA FX Total % Var
283 Vinyl 507 1 508 80%421 Fluent 385 39 424 1%705 Ethylene (Vinyl + Fluent) 892 40 932 32%228 Fluor 259 1 260 14%1 Energy 1 0 1
-38 Eliminations / Holding -46 0 -46 21%895 Total 1,106 41 1,147 28%
mm US$12M17

20
About Mexichem
Mexichem is a global leader in plastic piping and one of the world’s largest chemical and petrochemical companies. The company contributes to global development by delivering an extended portfolio of products to high growth sectors such as infrastructure, housing, agriculture, datacom and water management, among others. With operations in 41 countries, 137 facilities worldwide and more than 22,000 employees, Mexichem has the rights to produce fluorspar in two mines in Mexico, as well as 8 training academies and 17 R&D labs. Operations are divided into three Business Groups: Fluent, Vinyl and Fluor. Mexichem has annual revenues of US$5.8 billion and has been traded on the Mexican Stock Exchange for more than 30 years. The company is member of the Mexican Stock Exchange Sustainability Index and the sustainability emerging markets index FTSE4Good.
Forward-looking Statements In addition to historical information, this press release contains "forward-looking" statements that reflect management's expectations for the future. The words “anticipate,” “believe,” “expect,” “hope,” “have the intention of,” “might,” “plan,” “should” and similar expressions generally indicate comments on expectations. The final results may be materially different from current expectations due to several factors, which include, but are not limited to, global and local changes in politics, the economy, business, competition, market and regulatory factors, cyclical trends in relevant sectors; as well as other factors that are highlighted under the title “Risk Factors” on the annual report submitted by Mexichem to the Mexican National Banking and Securities Commission (CNBV). The forward-looking statements included herein represent Mexichem’s views as of the date of this press release. Mexichem undertakes no obligation to revise or update publicly any forward-looking statement for any reason unless required by law.” Mexichem has implemented a Code of Ethics that rules its relationships with its employees, clients, suppliers and general groups. Mexichem’s Code of Ethics is available for consulting in the following link: http://www.mexichem.com/Codigo_de_etica.html Additionally, according to the terms contained in the Securities Exchange Act No 42, Mexichem Audit Committee established a mechanism of contact, which allows that any person that knows the unfulfillment of operational and accounting records guidelines and lack of internal controls of the Code of Ethics, from the Company itself or from the subsidiaries that this controls, file a complaint which is anonymously guaranteed. The whistleblower program is facilitated by a third party. The telephone number in Mexico is 01-800-062-12-03. The website is http://www.ethic-line.com/mexichem and contact e-mail is [email protected]. Mexichem’s Audit Committee will be notified of all complaints for immediate investigation.

21
INDEPENDENT ANALYSTS
Currently, the following investment firms have analysts who cover Mexichem:
1. -Actinver 2. -Bank of America Merrill Lynch 3. -Banorte-Ixe 4. -Barclays 5. -BBVA Bancomer 6. -Bradesco BBI 7. -BTG Pactual 8. -Citigroup 9. -Credit Suisse 10. -GBM-Grupo Bursátil Mexicano 11. -Grupo Santander 12. -HSBC 13. -Intercam 14. -Invex Casa de Bolsa 15. -Interacciones 16. -ITAU BBA 17. -JP Morgan 18. -Morgan Stanley 19. -Monex 20. -UBS 21. -Vector
INTERNAL CONTROL Mexichem’s bylaws provide the existence of the Audit and Corporate Practices Committees, intermediate corporate organs constituted in agreement with the applicable law to assist the Board of Directors to carry on their functions. Through these committees and the external auditor, it is given reasonable safety that transactions and company’s acts are executed and registered in accordance with the terms and parameters set by the Board and directives of Mexichem, the applicable law and different general guidelines, criterion and IFRS (International Financial Reporting Standards).

22
APPENDIX I: CONSOLIDATED RESTRUCTURED FIGURES OF QUARTERLY RESULTS AS A CONSEQUENCE OF FLUENT BUSINESS GROUP’S DISCONTINUED OPERATIONS, FREIGHT RECLASSIFICATIONS, FIXED ASSET ACCOUNTING POLICY CHANGES AND PMV’S DISCONTINUED OPERATIONS.
CHANGES 1Q16
CHANGES 2Q16
INCOME STATEMENT 1Q16 reported
Disc.operations and freight
reclassificationFixed assets Disc. operations
PMV* Total effect 1Q16 adjusted
Net sales 1,262 (4) - (4) (8) 1,254 Cost of sales 903 67 (8) (4) 55 958
Gross Profit 359 (71) 8 - (63) 296 Operating expenses 250 (72) (3) (1) (76) 174
Operating Income 109 1 11 1 13 122 Financial cost 43 - - - - 43 Equity income of associated entities (1) - - - - (1)
67 1 11 1 13 80
Cash tax 40 - - - - 40 Deferred tax (22) 1 4 (6) (1) (23)
Income Tax 18 1 4 (6) (1) 17 Income from continued operations 49 - 7 7 14 63
Discontinued Operations 1 - - (7) (7) (6) Net Consolidated Income 50 - 7 - 7 57
Minority Interest (1) - - - - (1) Net Majority Income 51 - 7 - 7 58
EBITDA 200 1 - (5) (4) 196 *Includes Clorados III, the ethylene cracker and other related assets
Income from continued operations before income tax
mm US$ Changes reported in 1Q16
INCOME STATEMENT 2Q16 reported
Disc.operations and freight
reclassificationFixed assets Disc. operations
PMV* Total effect 2Q16 adjusted
Net sales 1,427 (7) - (1) (8) 1,419 Cost of sales 998 70 (8) (5) 57 1,055
Gross Profit 429 (77) 8 4 (65) 364 Operating expenses 549 (79) - (286) (365) 184
Operating Income (120) 2 8 290 300 180 Financial cost 43 - - - - 43 Equity income of associated entities (3) - - - - (3)
(160) 2 8 290 300 140
Cash tax 52 - - - - 52 Deferred tax (82) 1 2 71 74 (8)
Income Tax (30) 1 2 71 74 44 Income from continued operations (130) 1 6 219 226 96
Discontinued Operations 1 (1) - (219) (220) (219) Net Consolidated Income (129) - 6 - 6 (123)
Minority Interest (96) - - - - (96) Net Majority Income (33) - 6 - 6 (27)
EBITDA (29) 2 - 286 288 259 *Includes Clorados III, the ethylene cracker and other related assets
Income from continued operations before income tax
mm US$ Changes reported in 2Q16

23
CHANGES 3Q16
CHANGES 4Q16
INCOME STATEMENT 3Q16 reported
Disc.operations and freight
reclassificationFixed assets Disc. operations
PMV* Total effect 3Q16 adjusted
Net sales 1,400 (7) - (1) (8) 1,392 Cost of sales 1,012 69 (8) (10) 51 1,063
Gross Profit 388 (76) 8 9 (59) 329 Operating expenses 14 (79) - 233 154 168
Operating Income 374 3 8 (224) (213) 161 Financial cost 50 - - - - 50 Equity income of associated entities - - - - - -
324 3 8 (224) (213) 111
Cash tax 36 - - - - 36 Deferred tax 57 1 2 (83) (80) (23)
Income Tax 93 1 2 (83) (80) 13 Income from continued operations 231 2 6 (141) (133) 98
Discontinued Operations (7) (2) - 140 138 131 Net Consolidated Income 224 - 6 (1) 5 229
Minority Interest 69 - - - - 69 Net Majority Income 155 - 6 (1) 5 160
EBITDA 466 2 - (227) (225) 241 *Includes Clorados III, the ethylene cracker and other related assets
Income from continued operations before income tax
mm US$ Changes reported in 3Q16
INCOME STATEMENT 4Q16 reported
Disc.operations and freight
reclassificationFixed assets Disc. operations
PMV* Total effect 4Q16 adjusted
Net sales 1,260 18 - - 18 1,278 Cost of sales 1,230 (205) (10) (12) (227) 1,003
Gross Profit 30 223 10 12 245 275 Operating expenses (122) 232 (1) 51 282 160
Operating Income 152 (9) 11 (39) (37) 115 Financial cost 28 - - - - 28 Equity income of associated entities 1 - - - - 1
123 (9) 11 (39) (37) 86
Cash tax 62 - - - - 62 Deferred tax (20) (3) 5 (6) (4) (24)
Income Tax 42 (3) 5 (6) (4) 38 Income from continued operations 81 (6) 6 (33) (33) 48
Discontinued Operations (5) 6 - 33 39 34 Net Consolidated Income 76 - 6 - 6 82
Minority Interest 11 - - - - 11 Net Majority Income 65 - 6 - 6 71
EBITDA 247 (6) - (42) (48) 199 *Includes Clorados III, the ethylene cracker and other related assets
Income from continued operations before income tax
mm US$ Changes reported in 4Q16

24
CHANGES FY16
INCOME STATEMENT 2016 reported
Disc.operations and freight
reclassificationFixed assets Disc. operations
PMV* Total effect 2016 adjusted
Net sales 5,349 - - (6) (6) 5,343 Cost of sales 4,143 1 (34) (31) (64) 4,079
Gross Profit 1,206 (1) 34 25 58 1,264 Operating expenses 691 2 (4) (3) (5) 686
Operating Income 515 (3) 38 28 63 578 Financial cost 164 - - (1) (1) 163 Equity income of associated entities (3) - - - - (3)
354 (3) 38 29 64 418
Cash tax 190 - - - - 190 Deferred tax (67) - 13 (24) (11) (78)
Income Tax 123 - 13 (24) (11) 112 Income from continued operations 231 (3) 25 53 75 306
Discontinued Operations (10) 3 - (53) (50) (60) Net Consolidated Income 221 - 25 - 25 246
Minority Interest (17) - - - - (17) Net Majority Income 238 - 25 - 25 263
EBITDA 884 - - 11 11 895 *Includes Clorados III, the ethylene cracker and other related assets
Changes reported in 2016
Income from continued operations before income tax
mm US$

25
APPENDIX II: CONSOLIDATED RESTRUCTURED FIGURES OF QUARTERLY RESULTS AS A CONSEQUENCE OF PMV’S DISCONTINUED OPERATIONS.
CHANGES 1Q17
CHANGES 2Q17
INCOME STATEMENT 1Q17 reported
Disc. operations PMV*
1Q16 adjusted
Net sales 1,395 (1) 1,394 Cost of sales 1,097 (11) 1,086
Gross Profit 298 10 308 Operating expenses 175 12 187
Operating Income 123 (2) 121 Financial cost 45 (1) 44 Equity income of associated entities - - -
78 (1) 77
Cash tax 29 - 29 Deferred tax (4) - (4)
Income Tax 25 - 25 Income from continued operations 53 (1) 52
Discontinued Operations - 1 1 Net Consolidated Income 53 - 53
Minority Interest 1 - 1 Net Majority Income 52 - 52
EBITDA 207 (5) 202 *Includes Clorados III, the ethylene cracker and other related assets
Income from continued operations before income tax
mm US$ Changes reported in 1Q16
INCOME STATEMENT 2Q17 reported
Disc. operations PMV*
2Q17 adjusted
Net sales 1,464 (1) 1,463 Cost of sales 1,083 (9) 1,074
Gross Profit 381 8 389 Operating expenses 152 13 165
Operating Income 229 (5) 224 Financial cost 75 - 75 Equity income of associated entities - - -
154 (5) 149
Cash tax 40 - 40 Deferred tax 23 - 23
Income Tax 63 - 63 Income from continued operations 91 (5) 86
Discontinued Operations - 4 4 Net Consolidated Income 91 (1) 90
Minority Interest 25 - 25 Net Majority Income 66 (1) 65
EBITDA 334 (7) 327 *Includes Clorados III, the ethylene cracker and other related assets
Income from continued operations before income tax
mm US$ Changes reported in 2Q17

26
CHANGES 3Q17
INCOME STATEMENT 3Q17 reported
Disc. operations PMV*
3Q17 adjusted
Net sales 1,505 (1) 1,504 Cost of sales 1,137 (7) 1,130
Gross Profit 368 6 374 Operating expenses 172 1 173
Operating Income 196 5 201 Financial cost 44 - 44 Equity income of associated entities (1) - (1)
153 5 158
Cash tax 34 - 34 Deferred tax 28 - 28
Income Tax 62 - 62 Income from continued operations 91 5 96
Discontinued Operations 1 (5) (4) Net Consolidated Income 92 - 92
Minority Interest 30 - 30 Net Majority Income 62 - 62
EBITDA 297 3 300 *Includes Clorados III, the ethylene cracker and other related assets
Income from continued operations before income tax
mm US$ Changes reported in 3Q17

27
APPENDIX III: CONSOLIDATED RESTRUCTURED FIGURES OF BALANCE SHEET BY QUARTER AS A CONSEQUENCE OF FIXED ASSET ACCOUNTING POLICY CHANGES
mm US$
Consolidated 2015 Adjustments
Consolidated 2015
Adjusted
Consolidated March 2016 Adjustments
Consolidated March 2016
Adjusted
Consolidated June 2016 Adjustments
Consolidated June 2016 Adjusted
Consolidated September
2016Adjustments
Consolidated September
2016 Adjusted
Consolidated December
2016Adjustments
Consolidated December
2016 Adjusted
Current AssetsCash and Cash equivalents 653 - 653 586 - 586 662 - 662 651 - 651 714 - 714 Net Account Receivable 884 - 884 975 - 975 988 - 988 1,277 - 1,277 1,181 - 1,181 Other current assets 698 - 698 716 - 716 702 - 702 704 - 704 644 - 644 Assets held for sale 17 - 17 16 - 16 15 - 15 15 - 15 21 - 21 Total Current Assets 2,252 - 2,252 2,293 - 2,293 2,367 - 2,367 2,647 - 2,647 2,560 - 2,560 Property, plant and equipment 4,203 (471) 3,732 4,305 (462) 3,843 4,167 (456) 3,711 4,213 (450) 3,763 4,202 (452) 3,750 Net other assets 2,215 - 2,215 2,242 - 2,242 2,228 - 2,228 2,222 - 2,222 2,044 - 2,044 Total Assets 8,670 (471) 8,199 8,840 (462) 8,378 8,762 (456) 8,306 9,082 (450) 8,632 8,806 (452) 8,354
Current LiabilitiesBank loans and current portion of long-term debt 44 - 44 61 - 61 62 - 62 64 - 64 58 - 58 Suppliers and letters of credit of suppliers 1,201 - 1,201 1,240 - 1,240 1,244 - 1,244 1,292 - 1,292 1,270 - 1,270 Other current liabilities 554 - 554 513 - 513 604 - 604 558 - 558 645 - 645 Liabilities associated with asset held for sale 20 - 20 16 - 16 15 - 15 18 - 18 13 - 13 Total Current Liabilities 1,819 - 1,819 1,830 - 1,830 1,925 - 1,925 1,932 - 1,932 1,986 - 1,986 Bank loans and long-term debt 2,291 - 2,291 2,280 - 2,280 2,264 - 2,264 2,249 - 2,249 2,241 - 2,241 Long-term other liabilities 882 (142) 740 931 (137) 794 815 (135) 680 889 (132) 757 682 (136) 546 Total Liabilities 4,992 (142) 4,850 5,041 (137) 4,904 5,004 (135) 4,869 5,070 (132) 4,938 4,909 (136) 4,773 Capital stock 1,755 - 1,755 1,755 - 1,755 1,755 - 1,755 1,755 - 1,755 1,755 - 1,755 Retained earnings 1,007 256 1,263 1,074 263 1,337 1,036 269 1,305 1,192 274 1,466 1,126 281 1,407 Other comprehensive income 140 (569) (429) 154 (572) (418) 192 (575) (383) 176 (577) (401) 98 (582) (484) Controlling interest 2,902 (313) 2,589 2,983 (309) 2,674 2,983 (306) 2,677 3,123 (303) 2,820 2,979 (301) 2,678 Non-controlling interest 776 (16) 760 816 (16) 800 775 (15) 760 889 (15) 874 918 (15) 903 Total stockholders’ equity 3,678 (329) 3,349 3,799 (325) 3,474 3,758 (321) 3,437 4,012 (318) 3,694 3,897 (316) 3,581