Metsä Board, January-June 2017 results presentation
26
Metsä Board Half Year Report 1 − 6/2017 Presentation material
-
Upload
metsa-board -
Category
Investor Relations
-
view
1.631 -
download
0
Transcript of Metsä Board, January-June 2017 results presentation

Metsä BoardHalf Year Report 1−6/2017Presentation material

• Good demand for high-quality paperboardscontinued
• Stable or rising market price levels• Metsä Board’s paperboard deliveries up by 11%
from Q1 2017• The average price of folding boxboard was
burdened by Husum’s geographic sales mix• Steady working capital despite the strong sales
growth• New extrusion coating line in Husum started up
2017 Half Year Report2
Q2 2017 in summary

All-time high in paperboard deliveries
204 213 224 224 227 250 266 245 265 304
130 141 137 131 142148 148
143163
173
0
100
200
300
400
500
Q1 2015 Q2 2015 Q3 2015 Q4 2015 Q1 2016 Q2 2016 Q3 2016 Q4 2016 Q1 2017 Q2 2017
Folding boxboard White fresh fibre linerboard
1,00
0 to
nnes
Growth in total paperboarddeliveries:
+11% Q2/17 vs. Q1/17
+18% H1/17 vs. H1/16
+12% FY16 vs. FY15
3 2017 Half Year Report
FY 2015:1.4m tonnes
FY 2016:1.6m tonnes
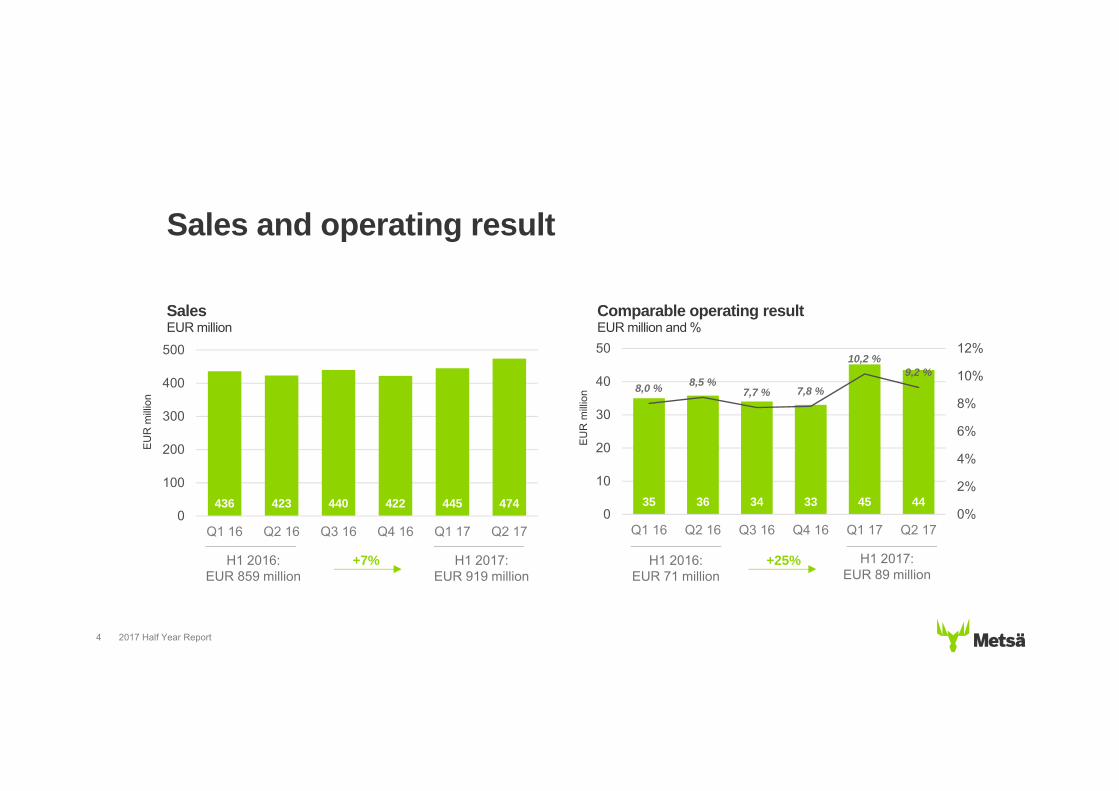
Sales and operating result
SalesEUR million
436 423 440 422 445 4740
100
200
300
400
500
Q1 16 Q2 16 Q3 16 Q4 16 Q1 17 Q2 17
+7%
35 36 34 33 45 44
8,0 % 8,5 %7,7 % 7,8 %
10,2 %9,2 %
0%
2%
4%
6%
8%
10%
12%
0
10
20
30
40
50
Q1 16 Q2 16 Q3 16 Q4 16 Q1 17 Q2 17
+25%
2017 Half Year Report4
Comparable operating resultEUR million and %
H1 2016:EUR 859 million
EU
R m
illio
n
EU
R m
illio
n
H1 2017:EUR 919 million
H1 2016:EUR 71 million
H1 2017:EUR 89 million
45 44
01020304050
Q1 2017 Q2 2017
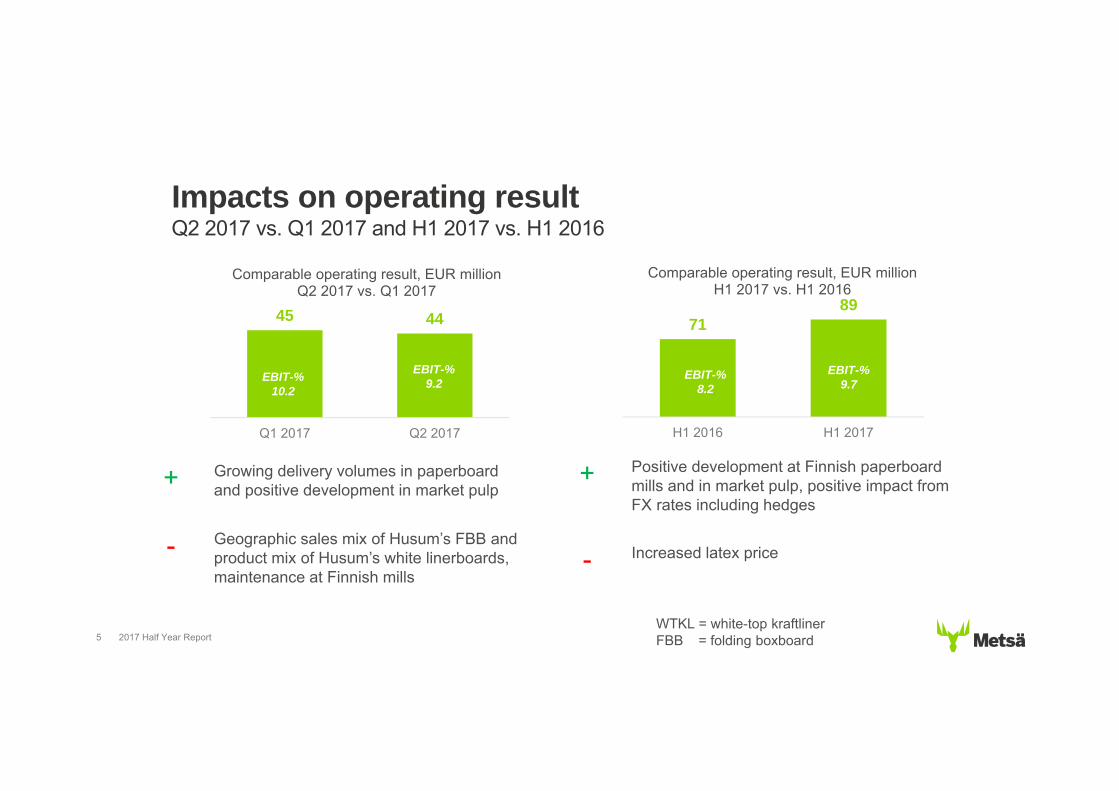
Comparable operating result, EUR millionQ2 2017 vs. Q1 2017
2017 Half Year Report5
Impacts on operating resultQ2 2017 vs. Q1 2017 and H1 2017 vs. H1 2016
7189
0102030405060708090
H1 2016 H1 2017
Comparable operating result, EUR millionH1 2017 vs. H1 2016
+ Growing delivery volumes in paperboardand positive development in market pulp
- Geographic sales mix of Husum’s FBB and product mix of Husum’s white linerboards, maintenance at Finnish mills
+ Positive development at Finnish paperboardmills and in market pulp, positive impact fromFX rates including hedges
- Increased latex price
EBIT-%8.2
EBIT-%9.7EBIT-%
10.2
EBIT-%9.2
WTKL = white-top kraftlinerFBB = folding boxboard
0%
2%
4%
6%
8%
10%
12%
14%
16%
18%
Q1/13 Q2/13 Q3/13 Q4/13 Q1/14 Q2/14 Q3/14 Q4/14 Q1/15 Q2/15 Q3/15 Q4/15 Q1/16 Q2/16 Q3/16 Q4/16 Q1/17 Q2/17
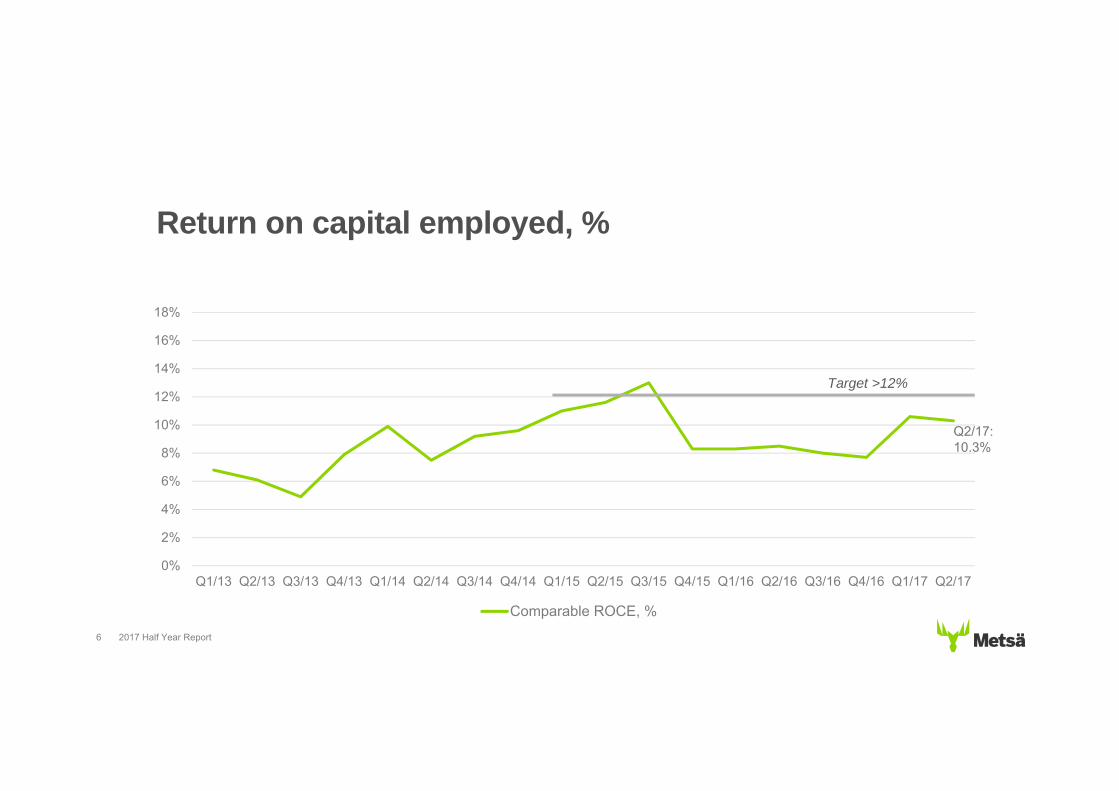
Comparable ROCE, %
2017 Half Year Report6
Return on capital employed, %
Target >12%
Q2/17:10.3%
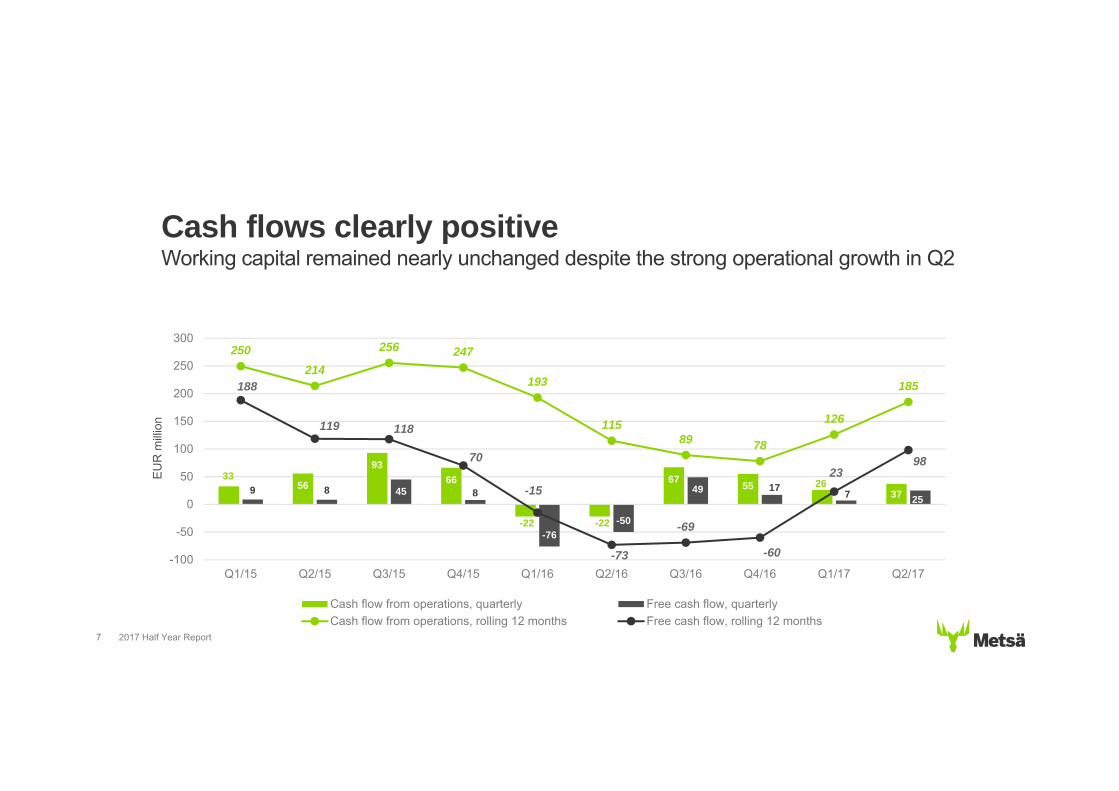
Cash flows clearly positiveWorking capital remained nearly unchanged despite the strong operational growth in Q2
3356
9366
-22 -22
67 55 26379 8 45 8
-76-50
49 17 7 25
250214
256 247
193
11589 78
126
185188
119 118
70
-15
-73
-69
-60
2398
-100
-50
0
50
100
150
200
250
300
Q1/15 Q2/15 Q3/15 Q4/15 Q1/16 Q2/16 Q3/16 Q4/16 Q1/17 Q2/17
Cash flow from operations, quarterly Free cash flow, quarterlyCash flow from operations, rolling 12 months Free cash flow, rolling 12 months
EUR
milli
on
7 2017 Half Year Report

Stable balance sheet
333 464 541 488 464 458 495
1,2
2,0 2,1 2,1 2,0 1,9 2,0
0,0
1,0
2,0
3,0
0
200
400
600
2015 2016 6/16 9/16 12/16 3/17 6/17
Interest-bearing net debt, EUR millionInterest-bearing net debt / EBITDA (rolling 12-month)
Interest-bearing net debt / comparable EBITDA
333 464 541 488 464 458 495
32%
44%
54%49%
44% 44% 45%
0
0,1
0,2
0,3
0,4
0,5
0,6
0
200
400
600
2015 2016 6/16 9/16 12/16 3/17 6/17
Interest-bearing net debt, EUR millionNet gearing, %
Net gearing, %
8 2017 Half Year Report
Financial target: <2.5x
9
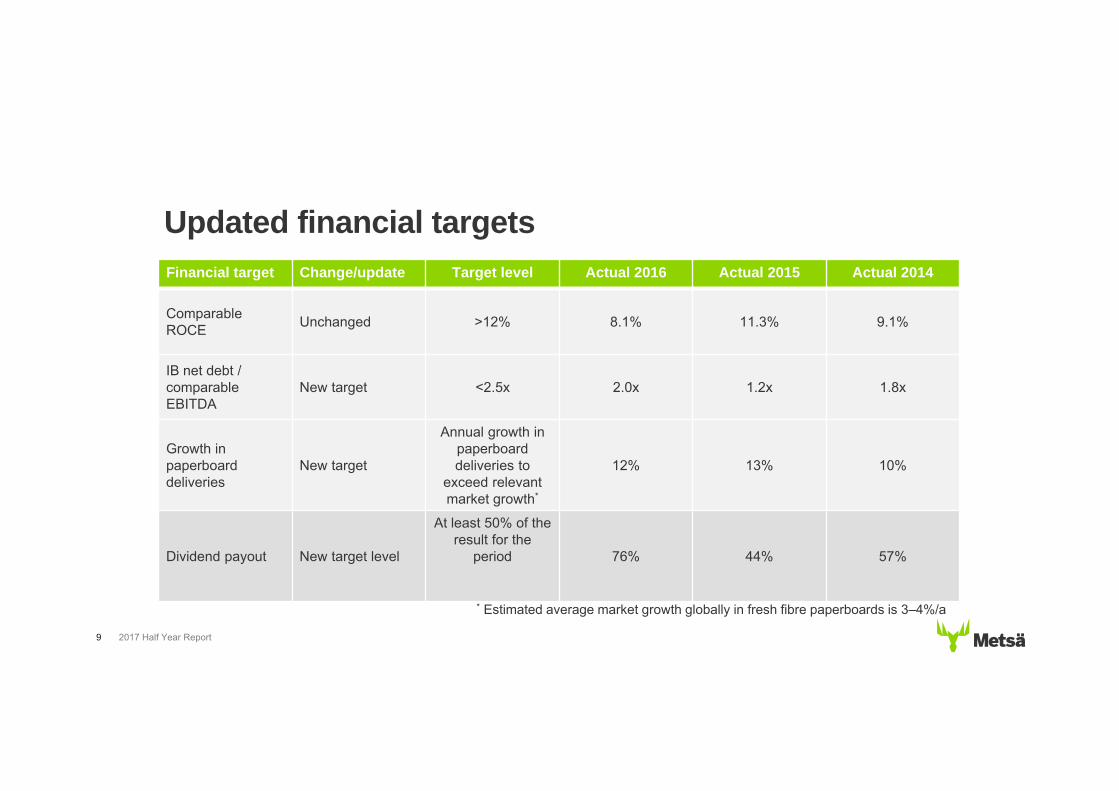
Updated financial targetsFinancial target Change/update Target level Actual 2016 Actual 2015 Actual 2014
ComparableROCE Unchanged >12% 8.1% 11.3% 9.1%
IB net debt / comparableEBITDA
New target <2.5x 2.0x 1.2x 1.8x
Growth in paperboarddeliveries
New target
Annual growth in paperboarddeliveries to
exceed relevant market growth*
12% 13% 10%
Dividend payout New target level
At least 50% of theresult for the
period 76% 44% 57%
* Estimated average market growth globally in fresh fibre paperboards is 3–4%/a
2017 Half Year Report

• Capacity utilisation rate during H1 2017 was 70%– In June, both production and deliveries were over 85% of
monthly capacity – The target of having the capacity in full use by end of 2018
is intact
• Production costs per tonne still higher compared to Finnish mills
• Geographic sales mix burdened the average price• Deliveries of own PE-coated paperboards to customers
have started
2017 Half Year Report10
Update on Husum’s foldingboxboard

11
Potential to improve profitability of HusumAt least EUR 100 million EBIT improvement from 2016 to 2019
2016 2019
+ EUR
25 million+ EUR
5 million+ EUR
>70 million
120,000 tonnesof pulp
productionlost in 2016
Restructuring:
Efficiency improvementprogramme
FBB capacityutilisation rate
>95% withnormal sales
price
2017 Half Year Report
Better consumer experiences with less environmental impact
Metsä Board approach for challenges of today
Betterwith Less
2017 Half Year Report12

2017 Half Year Report13
Near-term outlook
• Price levels in FBB are expected to be stable, several linerboard producers have announced price increases. Pulp market expected to remain in balance
• Metsä Board’s Q3 paperboard delivery volumes are expected to stay flat compared to Q2
• Focus on improving the geographic sales mix of Husum’s folding boxboard and to increase the share of North American sales, in particular
• Start-up phase of Metsä Fibre’s new bioproduct mill is expected to have only a minor negative impact on Metsä Board’s result

Metsä Board's comparable operating result for the third quarter of 2017 is expected to improve slightly compared to the second quarter of 2017.
2017 Half Year Report14
Profit guidance

• Good demand in high-qualitypaperboards is continuing
• Metsä Board’s paperboard deliveryvolumes grew strongly during H1 2017
• The target of having the currentpaperboard capacity in full use by theend of 2018 is intact
• Renewed key messages and unifiedproduct portfolio support sales growth
2017 Half Year Report15
Summary
Appendix

2017 Half Year Report17
Key financialsQ2/17 Q1/17
ChangeQ2/17
vs. Q1/17H1/17 H1/16
ChangeH1/17
vs. H1/162016
Sales EUR, m 474 445 +7% 919 859 +7% 1,720
EBITDA* EUR, m 68 69 -1% 136 119 +14% 231
Operating result* EUR, m 44 45 -2% 89 71 +25% 138
% of sales % 9.2 10.2 9.7 8.2 8.0
Result before taxes* EUR, m 37 40 -8% 77 57 +35% 107
Earnings per share EUR 0.09 0.10 -10% 0.19 0.13 +46% 0.25
ROCE* % 10.3 10.6 10.3 8.4 8.1
Capex EUR, m 12 19 -37% 31 103 -70% 162
Cash flow from operations EUR, m 37 26 +42% 63 -45 77
IB Net debt, at end of period EUR, m 495 458 +8% 495 541 -9% 464*comparable
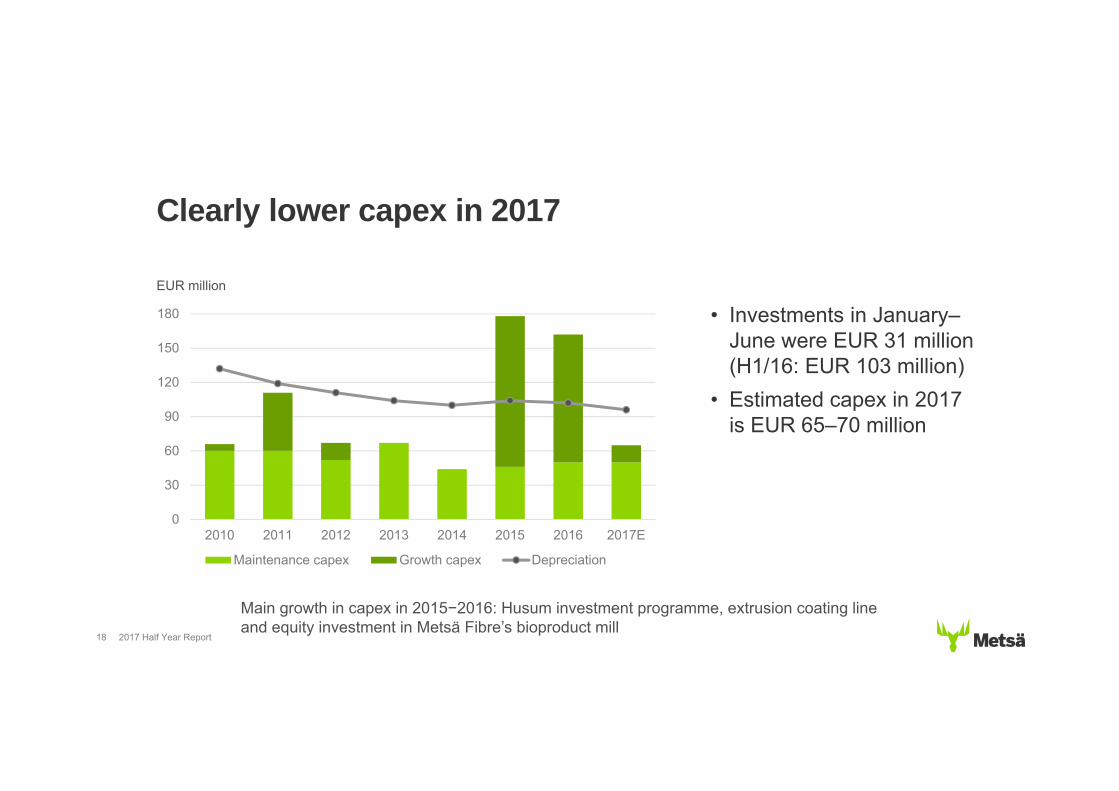
• Investments in January–June were EUR 31 million (H1/16: EUR 103 million)
• Estimated capex in 2017 is EUR 65–70 million
Clearly lower capex in 2017
0
30
60
90
120
150
180
2010 2011 2012 2013 2014 2015 2016 2017E
Maintenance capex Growth capex Depreciation
EUR million
18 2017 Half Year Report
Main growth in capex in 2015−2016: Husum investment programme, extrusion coating line and equity investment in Metsä Fibre’s bioproduct mill

Impact of FX rate changes including hedges– Q2 2017 vs. Q1 2017: EUR -1.5 million– H1 2017 vs. H1 2016: EUR 11 million
FX exposure and sensitivities
58 %35 %
5 %2 %USD
SEK
GBP
Othercurrencies
Annual transaction exposureEUR 1.1 billion
FX sensitivities excluding hedges
10% strengthening of foreign currency vs. EUR will have an impact on Metsä Board’s EBIT of
Currency Next 12 months
USD, $ EUR +70 million
SEK EUR -40 million
GBP, £ EUR +7 million
19 2017 Half Year Report Hedging policy: 100% of balance sheet position and 50% of annual net FX flows

Debt structure and liquidity30 June 2017
223
149111
23
134
Bonds
Loans fromfinancial institutions
Pension loans
Finance leases andother loans
Other short-termloans
141
100
102
Cash and cashequivalentsRevolving creditfacilityUnraised pensionloans
Interest-bearing debt, total EUR 640 million
Available liquidity, total EUR 343 million
Average maturity of long-term loans on 30 June 2017 was 2.0 years. 20 2017 Half Year Report

Long-term debt and financial costs
Net financial costs (EUR million) and average interest rate (%)
Maturity schedule in long-term IB debtEUR million
8242
258
174
1 2
100 102
0
50
100
150
200
250
300
2017 2018 2019 2020 2021 >2022
Long-term interest bearing liabilities, EUR million
Committed undrawn credit facilities, EUR million
21 2017 Half Year Report
56 39 32 31 12
4,6
4,2
3,8
3,3 3,3
3,0
3,5
4,0
4,5
5,0
0
15
30
45
60
2013 2014 2015 2016 H1/2017
Net financial costs, EUR million
Average interest rate at the end of period, %
500
600
700
800
900
1000
1100
1200
2009 2010 2011 2012 2013 2014 2015 2016 2017
Folding boxboard White-top kraftliner
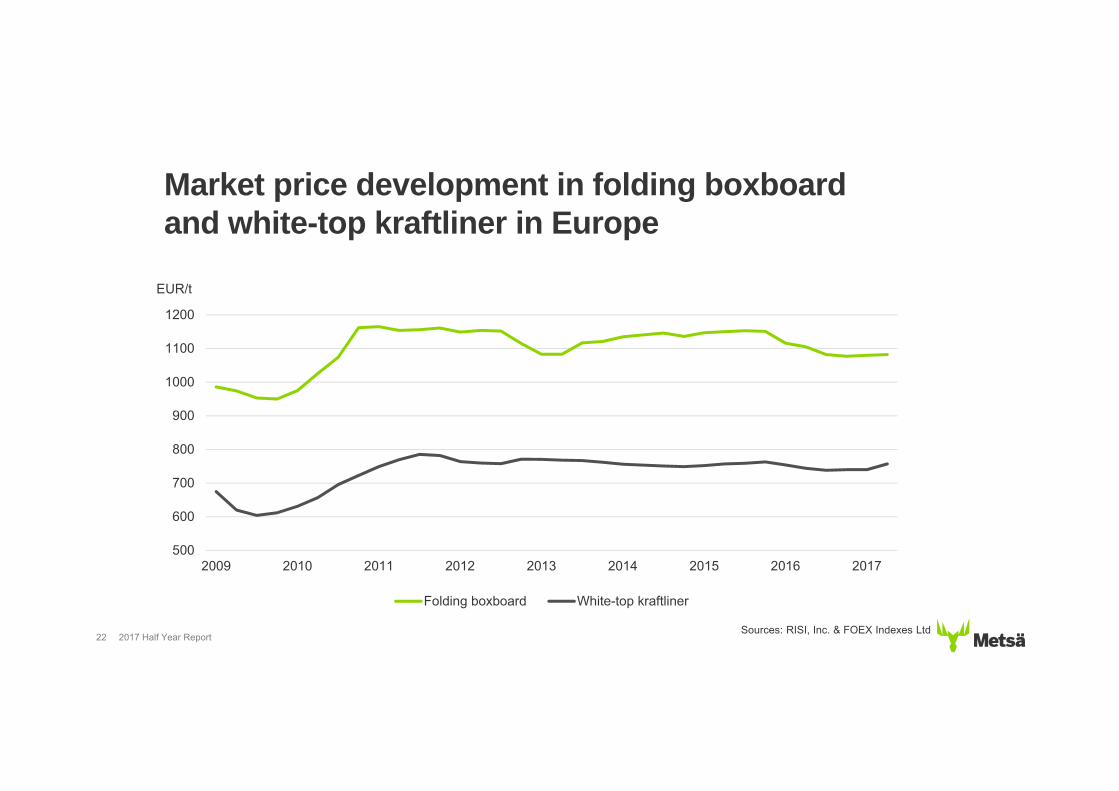
2017 Half Year Report22
Market price development in folding boxboard and white-top kraftliner in Europe
EUR/t
Sources: RISI, Inc. & FOEX Indexes Ltd

Source: Foex Indexes Ltd
Softwood, USD
Softwood, EUR
Hardwood, EUR
Hardwood, USD
USDEUR
Pulp price development (PIX)
23
350400450
500550600650
700750800850900
95010001050
'10 '11 '12 '13 '14 '15 '16 '17350400450
500550600650
700750800850900
95010001050
2017 Half Year Report

• Metsä Board’s dividend payout target is at least 50% of the result for the financial period
• Dividend for 2016:– EUR 0.19 per share– Totalling EUR 68 million– Corresponds to 76% of EPS 0
0,1
0,2
0,3
0,4
0,5
2012 2013 2014 2015 2016
Earnings per share Dividend per share
2017 Half Year Report24
Steadily growing dividends
EUR

Market cap and foreign owners30 June 2017
Ownership distribution30 June 2017
Market cap and ownership distribution
0
4
8
12
16
20
24
0
500
1 000
1 500
2 000
2 500
2012 2013 2014 2015 2016 1-6/2017
Market cap, EUR million
Share of foreign owners, %
42 %
22 %
18 %
18 % MetsäliittoCooperative
Domestic institutionalinvestors
Domestic privateinvestors
Foreign owners
EUR million
* Metsäliitto Cooperative has 61% of voting rights
*
25
%
2017 Half Year Report
In Q2 2017, a total of 8,969 Metsä Board A shares were converted to B shares. After the conversion, the amount of A-shares is 35,886,682 and the amount of B-shares 319,626,064.