Metsa Group half year financial report 2016 presentation
39
Metsä Group Half year financial report January–June 2016 Kari Jordan President and CEO 4.8.2016
-
Upload
metsae-group -
Category
Presentations & Public Speaking
-
view
37 -
download
6
Transcript of Metsa Group half year financial report 2016 presentation
Metsä Group Half year financial reportJanuary–June 2016
Kari JordanPresident and CEO
4.8.2016

• Sales EUR 2,339 million (1–6/2016: 2,585 million)• Operating result* EUR 229 million (266 million)• Operating result* 9.8% (10.3%) of sales• Return on capital employed* 11.0% (13.7%) • Operating result compared to previous year was affected by
lower market price of pulp and start-up phase of new folding boxboard production line at Metsä Board’s Husum mill
4.8.20162
Business developed as expected
Metsä Group – Q2
*excluding non-recurring items
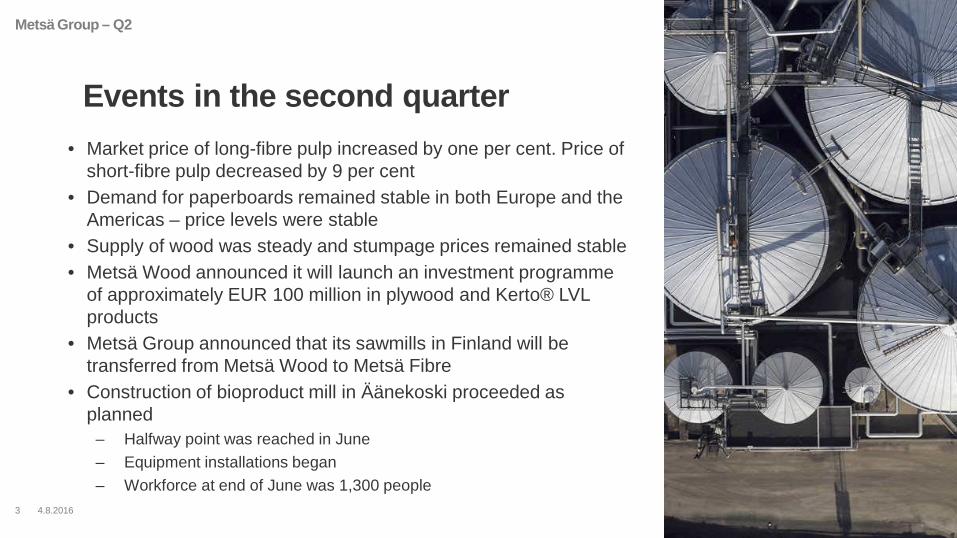
• Market price of long-fibre pulp increased by one per cent. Price of short-fibre pulp decreased by 9 per cent
• Demand for paperboards remained stable in both Europe and the Americas – price levels were stable
• Supply of wood was steady and stumpage prices remained stable• Metsä Wood announced it will launch an investment programme
of approximately EUR 100 million in plywood and Kerto® LVL products
• Metsä Group announced that its sawmills in Finland will be transferred from Metsä Wood to Metsä Fibre
• Construction of bioproduct mill in Äänekoski proceeded as planned
– Halfway point was reached in June– Equipment installations began – Workforce at end of June was 1,300 people
4.8.20163
Events in the second quarter
Metsä Group – Q2
4.8.20164
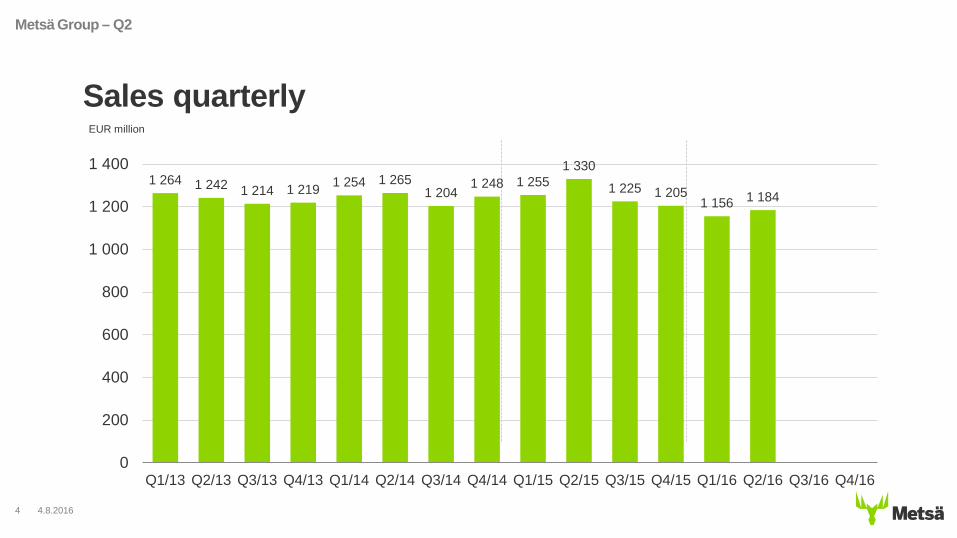
Sales quarterly
Metsä Group – Q2
EUR million
1 264 1 242 1 214 1 219 1 254 1 2651 204
1 248 1 2551 330
1 225 1 2051 156 1 184
0
200
400
600
800
1 000
1 200
1 400
Q1/13 Q2/13 Q3/13 Q4/13 Q1/14 Q2/14 Q3/14 Q4/14 Q1/15 Q2/15 Q3/15 Q4/15 Q1/16 Q2/16 Q3/16 Q4/16

4.8.20165
Operating result
Metsä Group – Q2
EUR million
8994
7387
10592
104117
129137
149
123109 120
94 89
63
88
70
160
10384
118
154142 128
107119
0
20
40
60
80
100
120
140
160
180
Q1/13 Q2/13 Q3/13 Q4/13 Q1/14 Q2/14 Q3/14 Q4/14 Q1/15 Q2/15 Q3/15 Q4/15 Q1/16 Q2/16 Q3/16 Q4/16
excl. non-recurring items incl. non-recurring items
4.8.20166
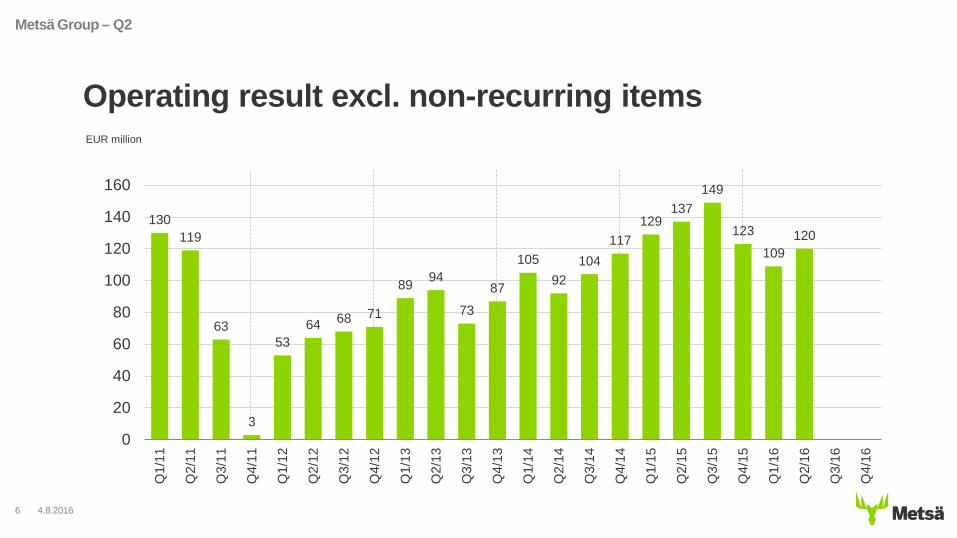
Operating result excl. non-recurring items
Metsä Group – Q2
EUR million
130119
63
3
5364 68 71
89 94
73
87
10592
104117
129137
149
123
109120
0
20
40
60
80
100
120
140
160
Q1/
11
Q2/
11
Q3/
11
Q4/
11
Q1/
12
Q2/
12
Q3/
12
Q4/
12
Q1/
13
Q2/
13
Q3/
13
Q4/
13
Q1/
14
Q2/
14
Q3/
14
Q4/
14
Q1/
15
Q2/
15
Q3/
15
Q4/
15
Q1/
16
Q2/
16
Q3/
16
Q4/
16
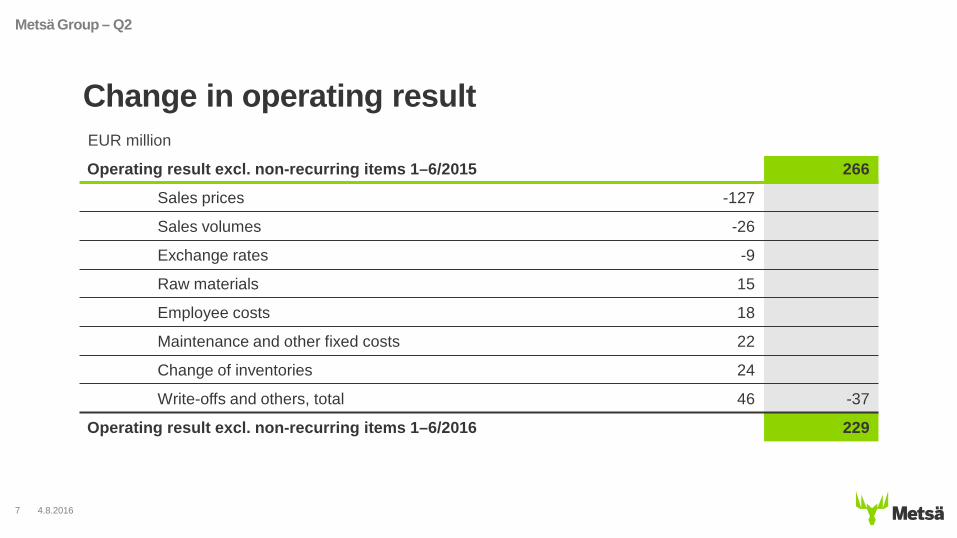
Change in operating result
4.8.20167
Metsä Group – Q2
EUR million
Operating result excl. non-recurring items 1–6/2015 266
Sales prices -127
Sales volumes -26
Exchange rates -9
Raw materials 15
Employee costs 18
Maintenance and other fixed costs 22
Change of inventories 24
Write-offs and others, total 46 -37
Operating result excl. non-recurring items 1–6/2016 229

Non-recurring items Q1–Q2/2016
8
Metsä Group – Q2
4.8.2016
EUR million Q1–Q2/2016
Operating result incl. non-recurring 225.3
Non-recurring items
Metsä Wood / Additional expenses related to divestment of Metsä Wood France S.A.S. -0.4
Metsä Board / Restructuring of Simpele paperboard mill -1.8
Metsä Board / Loss related to divestment of Alrec Boiler -1.1
Metsä Board / Organisation of Benelux sales office -0.7
Non-recurring items total -4.0
Operating result excl. non-recurring items 229,3

9
ROCE, excluding non-recurring items
Metsä Group – Q2
%
Target>10%
4.8.2016
6.6
9.8
11.3
13.7
11.0
0
2
4
6
8
10
12
14
16
Q1–Q2/2012 Q1–Q2/2013 Q1–Q2/2014 Q1–Q2/2015 Q1–Q2/2016
4.8.201610
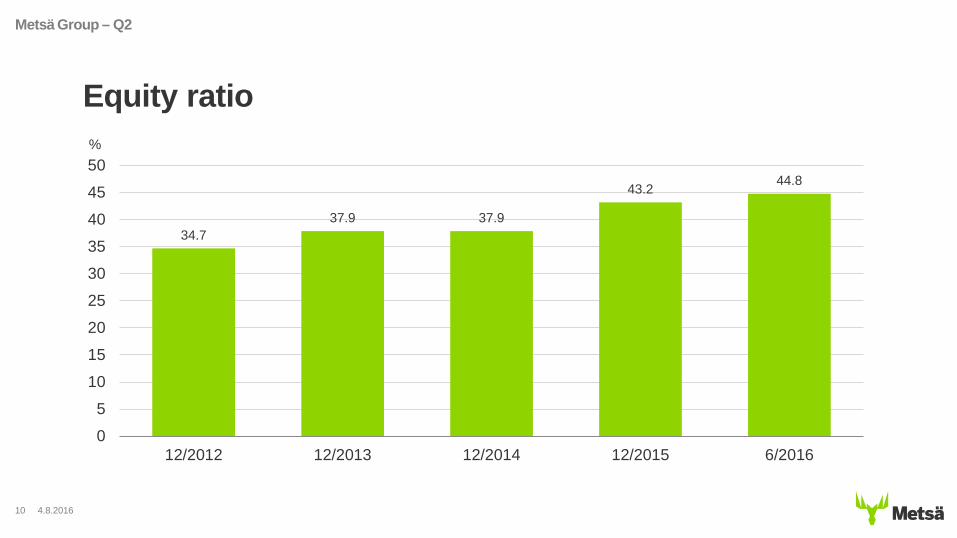
Equity ratio
Metsä Group – Q2
%
34.737.9 37.9
43.2 44.8
0
5
10
15
20
25
30
35
40
45
50
12/2012 12/2013 12/2014 12/2015 6/2016

11
Interest-bearing net liabilities
Metsä Group – Q2
EUR million
4.8.2016
1 6091 510
938
610
945
0
250
500
750
1 000
1 250
1 500
1 750
2 000
12/2012 12/2013 12/2014 12/2015 6/2016
12
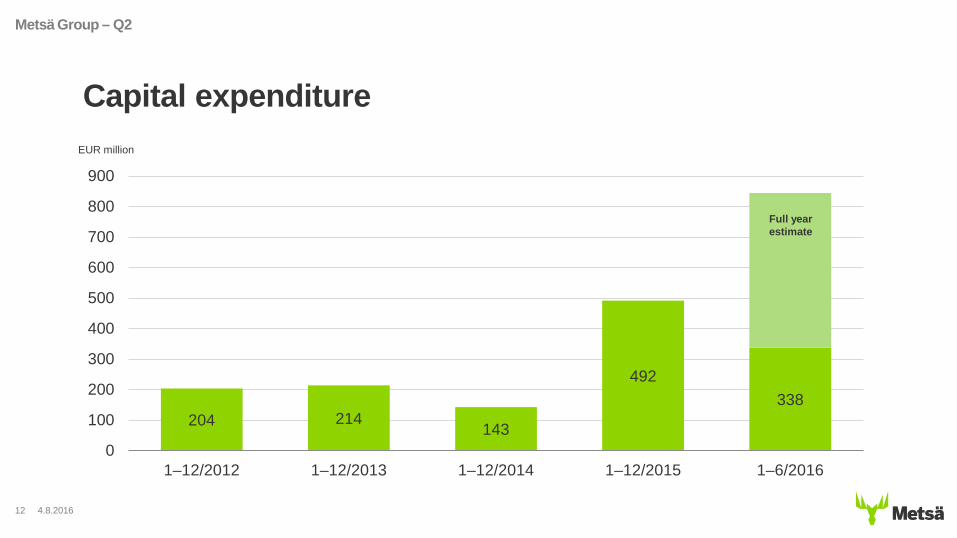
Capital expenditure
Metsä Group – Q2
EUR million
4.8.2016
204 214143
492338
0
100
200
300
400
500
600
700
800
900
1–12/2012 1–12/2013 1–12/2014 1–12/2015 1–6/2016
Full yearestimate
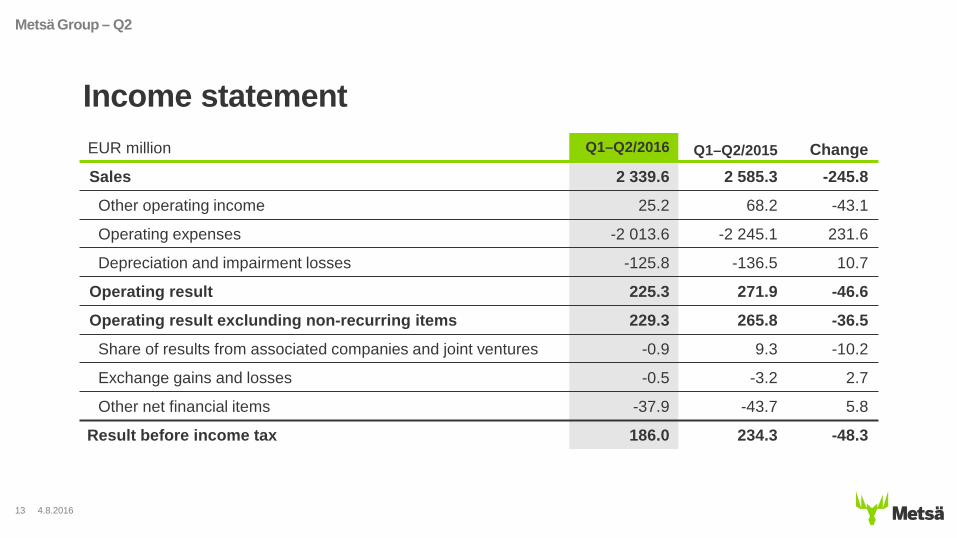
Income statement
13
Metsä Group – Q2
EUR million Q1–Q2/2016 Q1–Q2/2015 ChangeSales 2 339.6 2 585.3 -245.8
Other operating income 25.2 68.2 -43.1
Operating expenses -2 013.6 -2 245.1 231.6
Depreciation and impairment losses -125.8 -136.5 10.7
Operating result 225.3 271.9 -46.6
Operating result exclunding non-recurring items 229.3 265.8 -36.5
Share of results from associated companies and joint ventures -0.9 9.3 -10.2
Exchange gains and losses -0.5 -3.2 2.7
Other net financial items -37.9 -43.7 5.8
Result before income tax 186.0 234.3 -48.3
4.8.2016

Key figures
14
Metsä Group – Q2
Q1–Q2/2016 Q1–Q2/2015 ChangeROCE, % 10.8 14.0 -3.2
excluding non-recurring items 11.0 13.7 -2.7
ROE, % 11.8 16.6 -4.8
excluding non-recurring items 12.1 16.3 -4.2
Equity ratio, % 44.8 41.9 2.9
Net gearing ratio, % 38 34 4
Interest-bearing net liabilities, EUR million 945 779 166
Investments, EUR million 338 140 198
Personnel at end of period 10 075 10 442 -367
4.8.2016
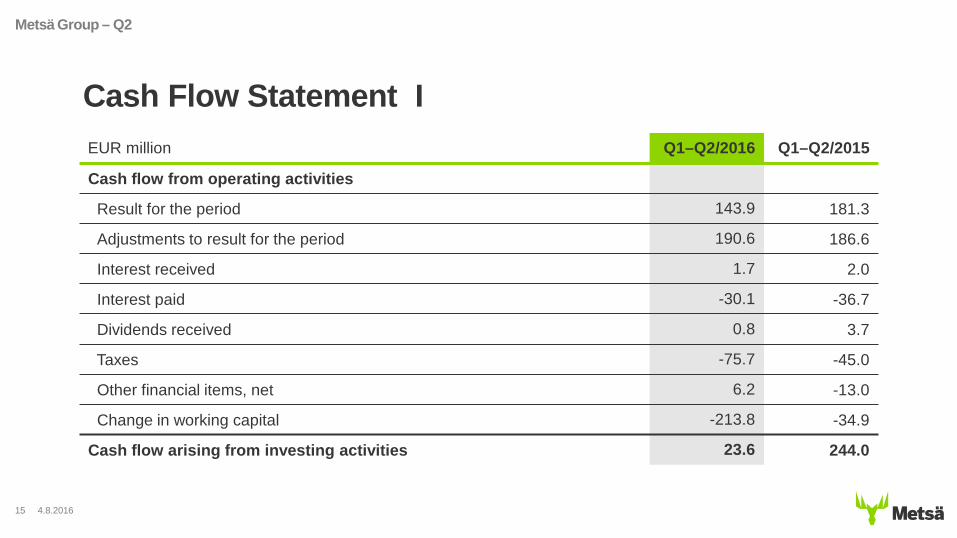
Cash Flow Statement I
15
Metsä Group – Q2
EUR million Q1–Q2/2016 Q1–Q2/2015
Cash flow from operating activities
Result for the period 143.9 181.3
Adjustments to result for the period 190.6 186.6
Interest received 1.7 2.0
Interest paid -30.1 -36.7
Dividends received 0.8 3.7
Taxes -75.7 -45.0
Other financial items, net 6.2 -13.0
Change in working capital -213.8 -34.9
Cash flow arising from investing activities 23.6 244.0
4.8.2016

Cash Flow Statement IIEUR million Q1–Q2/2016 Q1–Q2/2015Net cash flow from operating activities 23.6 244.0
Purchase of shares 0.0 0.0Investments -337.9 -140.2Sales of assets and others 16.4 37.3Changes in members' capital and in other capital 81.5 108.3Interest on members' capital and dividends paid -120.2 -94.9Change in long-term loans and committed facilities -31.3 -53.0
Change in cash and cash equivalents -367.9 101.4
Cash and cash equivalents at beginning of period 1 120.8 947.9Translation differences and others 0.4 1.2Change in cash and cash equivalents -367.9 101.4
Cash and cash equivalents at end of period 753.3 1 050.4
16
Metsä Group – Q2
4.8.2016

17
Personnel
Metsä Group – Q2
4.8.2016
* Approximately 850 summer employees at end of June
11 44710 736 10 410
9 59910 075
0
2 000
4 000
6 000
8 000
10 000
12 000
14 000
12/2012 12/2013 12/2014 12/2015 6/2016*

Wood Supply and Forest Services
Wood Supply and Forest Services
19
Metsä Forest – Wood Supply and Forest Services
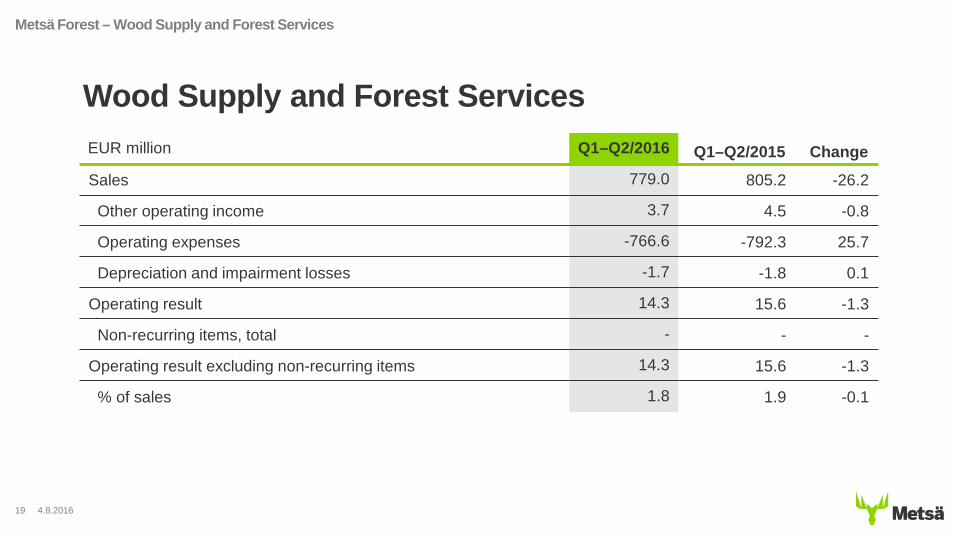
EUR million Q1–Q2/2016 Q1–Q2/2015 Change
Sales 779.0 805.2 -26.2
Other operating income 3.7 4.5 -0.8
Operating expenses -766.6 -792.3 25.7
Depreciation and impairment losses -1.7 -1.8 0.1
Operating result 14.3 15.6 -1.3
Non-recurring items, total - - -
Operating result excluding non-recurring items 14.3 15.6 -1.3
% of sales 1.8 1.9 -0.1
4.8.2016

Popularity of electronic services increases• Supply of wood was steady and stumpage
prices remained stable• Metsä Forest delivered a total of 15.7 million
cubic metres of wood (15.9)• Wood was harvested as targeted and deliveries
to customers' production units were carried out as planned
• Sales of forest management services continued strong and increased by 20 per cent compared to corresponding period last year
• Nearly 20% of wood acquired from private forests was purchased electronically
• Nearly 30% of forest management services was sold electronically
20
Operating result excl. non-recurring itemsEUR million
Metsä Forest – Wood Supply and Forest Services
4.8.2016
8.6
7.0
4.5
8.18.7
6.9 7.06.3
7.8
6.5
0
1
2
3
4
5
6
7
8
9
10
Q1/
14
Q2/
14
Q3/
14
Q4/
14
Q1/
15
Q2/
15
Q3/
15
Q4/
15
Q1/
16
Q2/
16
Q3/
16
Q4/
16
Wood Products Industry

Wood Products Industry
22
Metsä Wood – Wood Products Industry
EUR million Q1–Q2/2016 Q1–Q2/2015 ChangeSales 437.9 452.2 -14.3
Other operating income 5.2 2.2 -3.0
Operating expenses -411.3 -441.8 30.5
Depreciation and impairment losses -17.1 -16.9 -0.2
Operating result 14.7 -4.3 19.0
Non-recurring items, total 5.5 22.3 -16.8
Operating result excluding non-recurring items 20.2 18.0 2.2
% of sales 4.6 4.0 0.6
4.8.2016
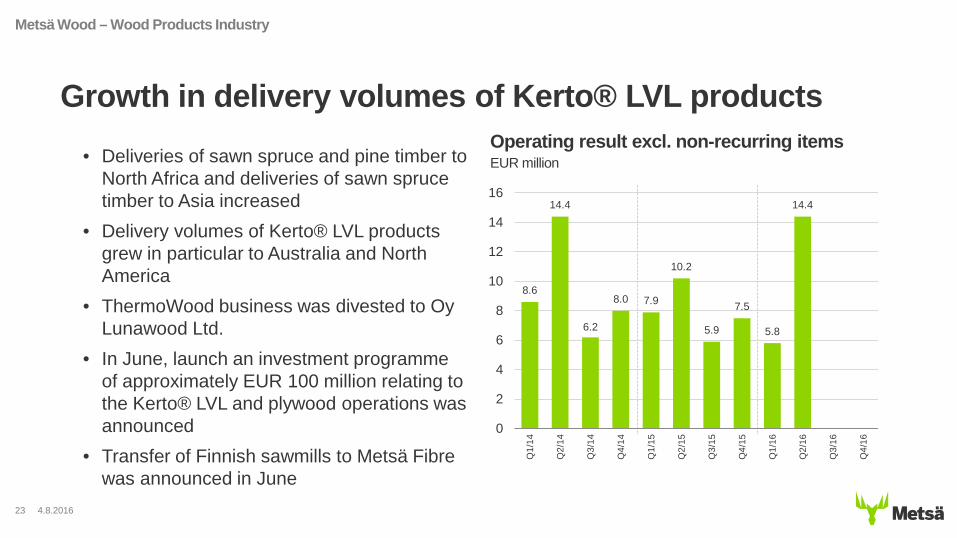
Growth in delivery volumes of Kerto® LVL products • Deliveries of sawn spruce and pine timber to
North Africa and deliveries of sawn spruce timber to Asia increased
• Delivery volumes of Kerto® LVL products grew in particular to Australia and North America
• ThermoWood business was divested to Oy Lunawood Ltd.
• In June, launch an investment programmeof approximately EUR 100 million relating to the Kerto® LVL and plywood operations was announced
• Transfer of Finnish sawmills to Metsä Fibre was announced in June
23
Operating result excl. non-recurring itemsEUR million
Metsä Wood – Wood Products Industry
4.8.2016
8.6
14.4
6.2
8.0 7.9
10.2
5.9
7.5
5.8
14.4
0
2
4
6
8
10
12
14
16
Q1/
14
Q2/
14
Q3/
14
Q4/
14
Q1/
15
Q2/
15
Q3/
15
Q4/
15
Q1/
16
Q2/
16
Q3/
16
Q4/
16

Pulp Industry
Pulp Industry
25
Metsä Fibre – Pulp Industry
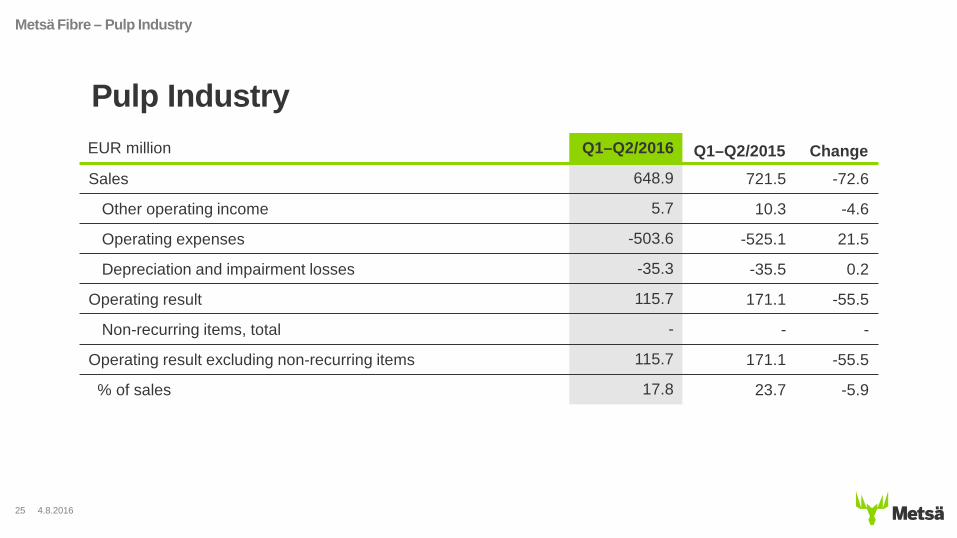
EUR million Q1–Q2/2016 Q1–Q2/2015 ChangeSales 648.9 721.5 -72.6
Other operating income 5.7 10.3 -4.6
Operating expenses -503.6 -525.1 21.5
Depreciation and impairment losses -35.3 -35.5 0.2
Operating result 115.7 171.1 -55.5
Non-recurring items, total - - -
Operating result excluding non-recurring items 115.7 171.1 -55.5
% of sales 17.8 23.7 -5.9
4.8.2016
Metsä Group26
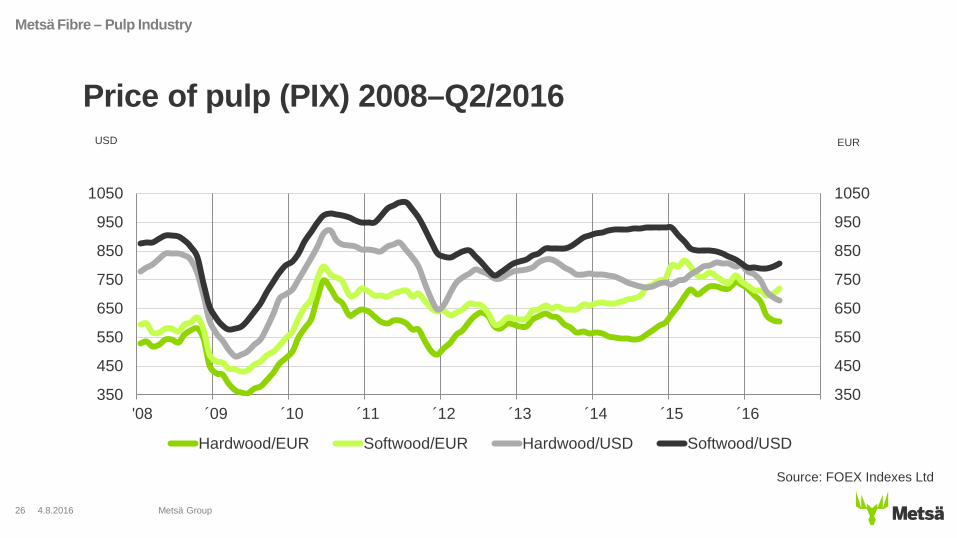
Price of pulp (PIX) 2008–Q2/2016
Metsä Fibre – Pulp Industry
USD EUR
Source: FOEX Indexes Ltd
4.8.2016
350
450
550
650
750
850
950
1050
350
450
550
650
750
850
950
1050
'08 ´09 ´10 ´11 ´12 ´13 ´14 ´15 ´16
Hardwood/EUR Softwood/EUR Hardwood/USD Softwood/USD

Currency-denominated market prices of pulp on a lower level than previous year• Currency-denominated market prices of long-
fibre pulp decreased 10% and of short-fibre pulp 5% from corresponding period previous year
• Price of long-fibre pulp in Europe was USD 794 per tonne at the beginning of January and USD 806 at end of review period
• Price of short-fibre pulp was USD 781 and USD 680, respectively
• Transfer of Finnish sawmills to Metsä Fibrewas announced in June to utilise the industrial synergies even better
Metsä Group27
Operating result excl. non-recurring items EUR million
Metsä Fibre – Pulp Industry
54.9
36.3
51.8
64.5
78.7
92.585.5
80.5
63.7
0
10
20
30
40
50
60
70
80
90
100
Q1/
14
Q2/
14
Q3/
14
Q4/
14
Q1/
15
Q2/
15
Q3/
15
Q4/
15
Q1/
16
Q2/
16
Q3/
16
Q4/
16
4.8.2016
Paperboard Industry

Paperboard Industry
29
Metsä Board – Paperboard Industry
EUR million Q1–Q2/2016 Q1–Q2/2015 ChangeSales 858.5 1 047.7 -189.2
Other operating income 14.3 31.8 -17.5
Operating expenses -757.7 -916.9 159.2
Depreciation and impairment losses -48.0 -52.3 4.3
Operating result 67.2 110.3 -43.1
Non-recurring items, total 3.6 -20.1 23.7
Operating result excluding non-recurring items 70.8 90.2 -19.4
% of sales 8.2 8.6 -0.4
4.8.2016

30
Prices of folding boxboard and white top krafliner in Europe
Metsä Board – Paperboard Industry
EUR/tonne
Sources: Pöyry Management Consultingand FOEX Indexes Ltd.
4.8.2016
600650700750800850900950
100010501100
2010 2011 2012 2013 2014 2015 2016
Folding boxboard White top kraftliner
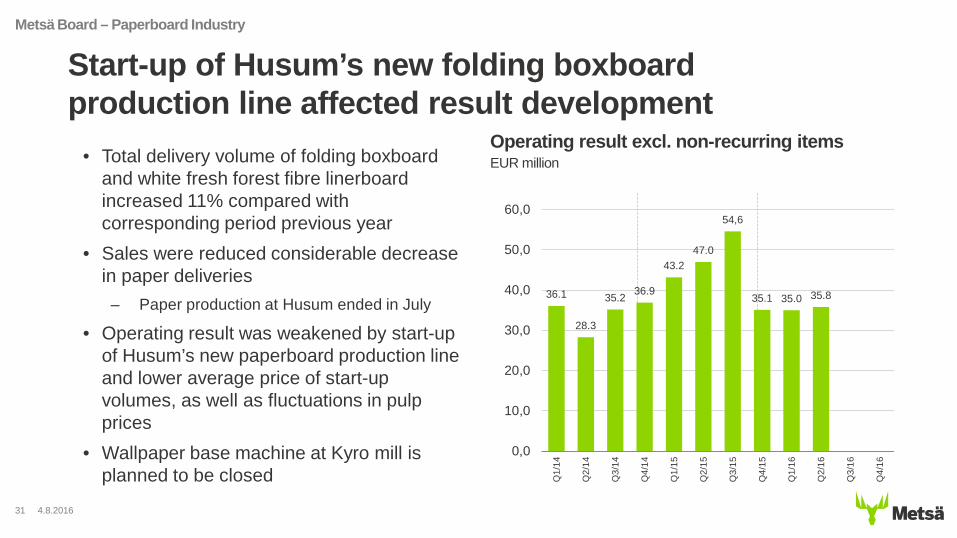
Start-up of Husum’s new folding boxboard production line affected result development
• Total delivery volume of folding boxboard and white fresh forest fibre linerboard increased 11% compared with corresponding period previous year
• Sales were reduced considerable decrease in paper deliveries
– Paper production at Husum ended in July
• Operating result was weakened by start-up of Husum’s new paperboard production line and lower average price of start-up volumes, as well as fluctuations in pulp prices
• Wallpaper base machine at Kyro mill is planned to be closed
31
Operating result excl. non-recurring items EUR million
Metsä Board – Paperboard Industry
4.8.2016
36.1
28.3
35.2 36.9
43.247.0
54,6
35.1 35.0 35.8
0,0
10,0
20,0
30,0
40,0
50,0
60,0
Q1/
14
Q2/
14
Q3/
14
Q4/
14
Q1/
15
Q2/
15
Q3/
15
Q4/
15
Q1/
16
Q2/
16
Q3/
16
Q4/
16

Tissue and Cooking papers
Tissue and Cooking Papers
33
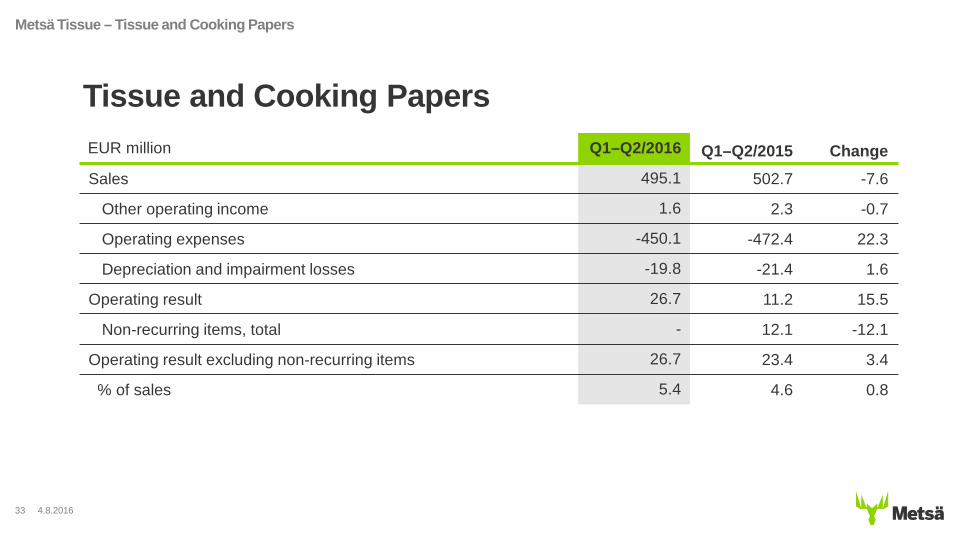
Metsä Tissue – Tissue and Cooking Papers
EUR million Q1–Q2/2016 Q1–Q2/2015 ChangeSales 495.1 502.7 -7.6
Other operating income 1.6 2.3 -0.7
Operating expenses -450.1 -472.4 22.3
Depreciation and impairment losses -19.8 -21.4 1.6
Operating result 26.7 11.2 15.5
Non-recurring items, total - 12.1 -12.1
Operating result excluding non-recurring items 26.7 23.4 3.4
% of sales 5.4 4.6 0.8
4.8.2016
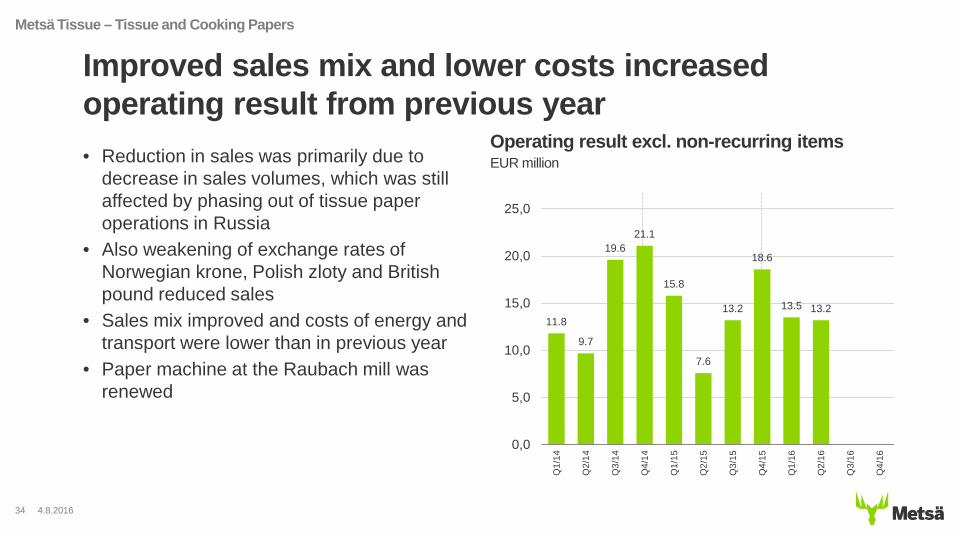
Improved sales mix and lower costs increased operating result from previous year• Reduction in sales was primarily due to
decrease in sales volumes, which was still affected by phasing out of tissue paper operations in Russia
• Also weakening of exchange rates of Norwegian krone, Polish zloty and British pound reduced sales
• Sales mix improved and costs of energy and transport were lower than in previous year
• Paper machine at the Raubach mill was renewed
34
Operating result excl. non-recurring items EUR million
Metsä Tissue – Tissue and Cooking Papers
4.8.2016
11.8
9.7
19.621.1
15.8
7.6
13.2
18.6
13.5 13.2
0,0
5,0
10,0
15,0
20,0
25,0
Q1/
14
Q2/
14
Q3/
14
Q4/
14
Q1/
15
Q2/
15
Q3/
15
Q4/
15
Q1/
16
Q2/
16
Q3/
16
Q4/
16
Summary
Outlook for the business areas 1/2Wood Supply and Forest Services• Wood demand will target felling sites to be harvested when the ground is unfrozen and, in terms of energy
wood, crown wood • Uncertainties related to Act on the Financing of Sustainable Forestry will have a negative impact on
demand for forest management services
Wood Products Industry • Market balance and sales prices of sawn timber are expected to improve as a whole• Market situation in Northern Africa will create uncertainty in demand for pine sawn timber and demand in
Chinese market is expected to quiet down seasonally • Lively demand for Kerto® LVL wood products is expected to continue • Competition in plywood products is expected to remain tense
Pulp• Moderate demand growth for long-fibre pulp is expected to continue globally• Annual maintenance shutdowns of two of Metsä Fibre’s pulp mills are scheduled for third quarter
36
Summary
4.8.2016
Outlook for the business areas 2/2Paperboard• Demand for paperboard is expected to remain stable in both Europe and America
• Paperboard deliveries are expected to grow in July–September from second quarter of 2016
• Market prices of folding boxboard and white fresh forest fibre linerboard are expected to remain stable or increase slightly
• Metsä Board has announced increase in the price of white fresh forest fibre linerboard and folding boxboard in Europe
• Result development will be affected by start-up volumes of folding boxboard at Husum, which reduce average price of folding boxboard
Tissue and Cooking papers• In tissue and cooking paper markets, demand is expected to continue to be stable in all market areas• Demand for tissue paper is expected to increase in particular in eastern Central Europe and for cooking
papers demand is expected to increase in Asia
37
Summary
4.8.2016
• Metsä Group’s operating result excluding non-recurring items is in the third quarter of 2016 expected to be slightly weaker than in the second quarter of 2016
4.8.201638
Near-term outlook
Summary