Metropolitan Airports Commission Environmental Program ...
31
To give our customers the best airport experience in North America Metropolitan Airports Commission Environmental Program Highlights Planning, Development & Environment Committee March 7, 2016
Transcript of Metropolitan Airports Commission Environmental Program ...

To give our customers the best airport experience in North America
Metropolitan Airports CommissionEnvironmental Program Highlights
Planning, Development & Environment Committee
March 7, 2016

2
Outline
• Water Quality and Conservation• Recycling and Organics• Aircraft Noise and 2015 MSP
Noise Contour• Air Quality• Greenhouse Gas Emissions• Environmental Management
Information System

3
• NPDES Co-Permittee Program Implementation• Implemented construction Best Management Practices• Established MSP Airfield and Aircraft Deicing Program• Developed Storm Water Pollution Prevention Plans• Constructed stormwater detention ponds at MSP• Installed oil-water separators at fueling load racks and incorporated into project design• Developed a Comprehensive Well Network• Implemented an Airport-Wide Integrated Spill Response Plan• Constructed stormwater detention ponds at Reliever Airports • Constructed grass areas between runways and taxiways• Removed cooling water wells• Environmental Management Information System (EMIS)
2014‐2015 percent of CBOD5reduction to the Minnesota River was 90% ‐ highest in the history of
the program
Water Quality Compliance Measures

MSP NPDES Permit
• National Pollutant Discharge Elimination System (NPDES) Permit• 1972 Clean Water Act – regulates municipal, commercial, and industrial point source discharges for pollutants
• MSP NPDES/SDS Permit Reissuance on April 5, 2013 – Supersedes Previous Permit Issued on September 29, 1993• MAC + Airlines + Operators = Permittees• Shared responsibility under the new permit requires a new level of coordination and collaboration to ensure
compliance with the permit and the related conditions
• Permit Compliance Considerations• Limits for CBOD5, TSS, phosphorus, pH, oil and grease• Monitoring and reporting• Prohibited discharges• SWPPPs• Mercury and phosphorus minimization plans• Compliance schedules• Construction stormwater considerations• Chemical additive reporting (MSDS)
5
2014/2015 Deicing Season
• Total snow fall = 32.4” (avg. of past eight seasons is 51.2”)• 42 days with measureable snowfall (avg. of past eight seasons is 40.8)• 970,000 gallons of glycol applied – 55 gallons avg per aircraft deiced• 6.4 million gallons of GISW collected• 92.4% of collected glycol processed through recycling system• 77% of glycol was applied at the pads• 17,642 aircraft deiced• Total 2015 CBOD5 discharge = 199 tons
6

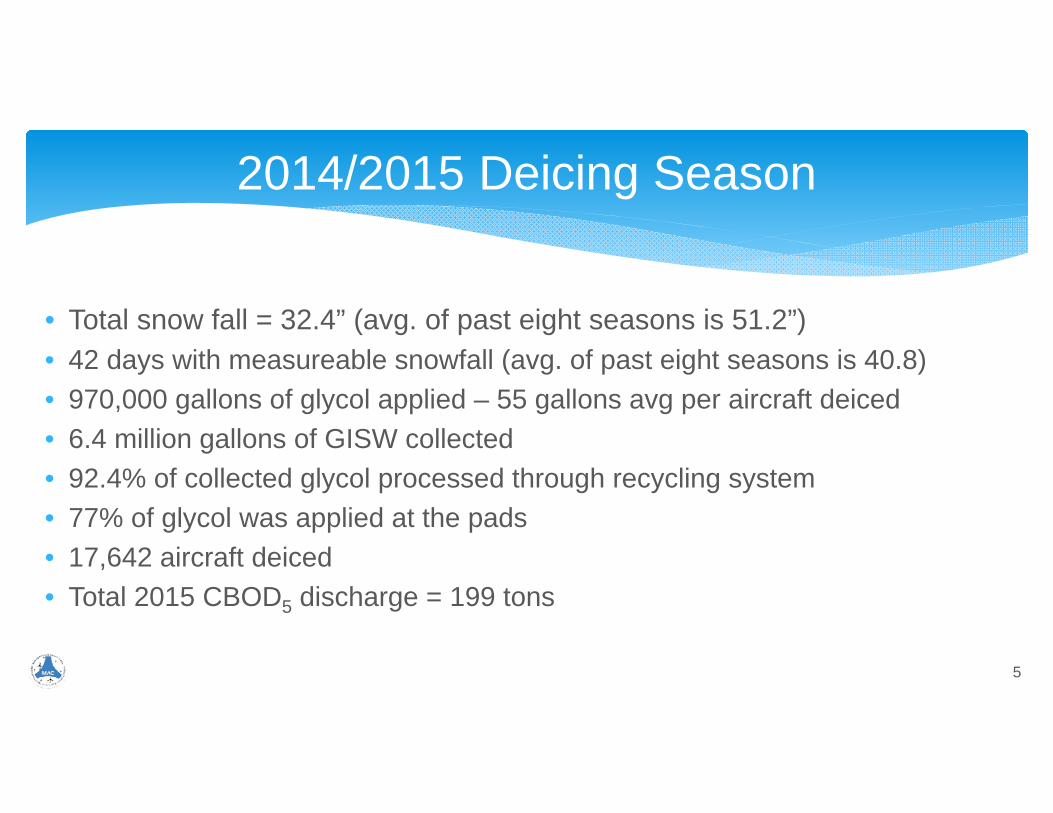
Glycol Application and Pad Usage Trends
7

8

2015/2016 Deicing Season (through February)
9
• Total snow fall = 18.7” (avg. of past eight seasons is 51.2” season total)• 19 days with measureable snowfall (avg. of past eight seasons is 40.8 season
total)• 530,000 gallons of glycol applied – 48 gallons avg per aircraft deiced• 4.6 million gallons of GISW collected• 87.0% of collected glycol processed through recycling system• 74.2% of glycol was applied at the pads• 11,024 aircraft deiced• Through February 18th CBOD5 discharge = 34 tons (avg. over past eight
seasons is ~90 tons through February)
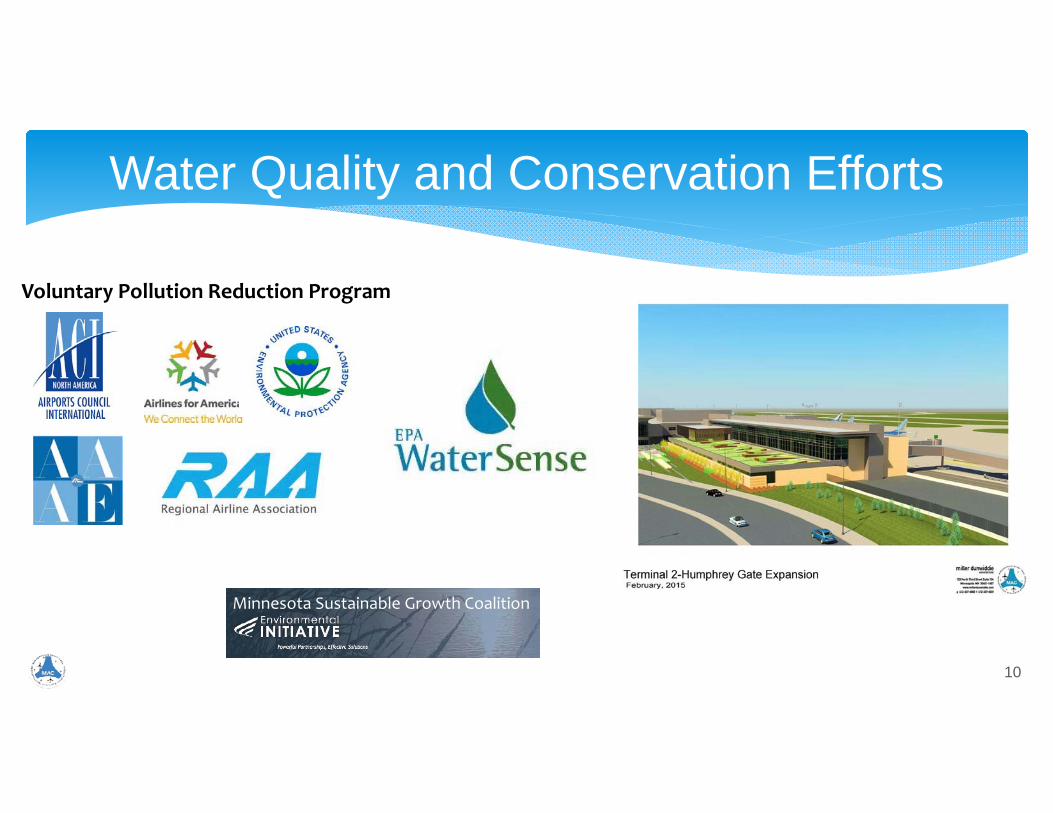
Water Quality and Conservation Efforts
10
Voluntary Pollution Reduction Program
Minnesota Sustainable Growth Coalition

Recycling and Organics
11
• In 2015, recycled or diverted 1,678 tons of materials, avoiding more than $174,355 in disposal costs. This was the highest annual total in the history of the program.
• In 2015, 100 tons of used cooking oil/grease was recycled and converted into biodiesel
• In 2015, composted 466 tons of food waste. This was the highest annual total in the history of the program.
• Only 2.4% of waste to landfill in 2015• In 2015, coordinated service crew
training with Delta for cabin recycling = 2015 Delta recycled over 40,300 lbs. of aluminum a 6,000 lb. increase from 2014

Recyclables and Waste Management Breakdown
12
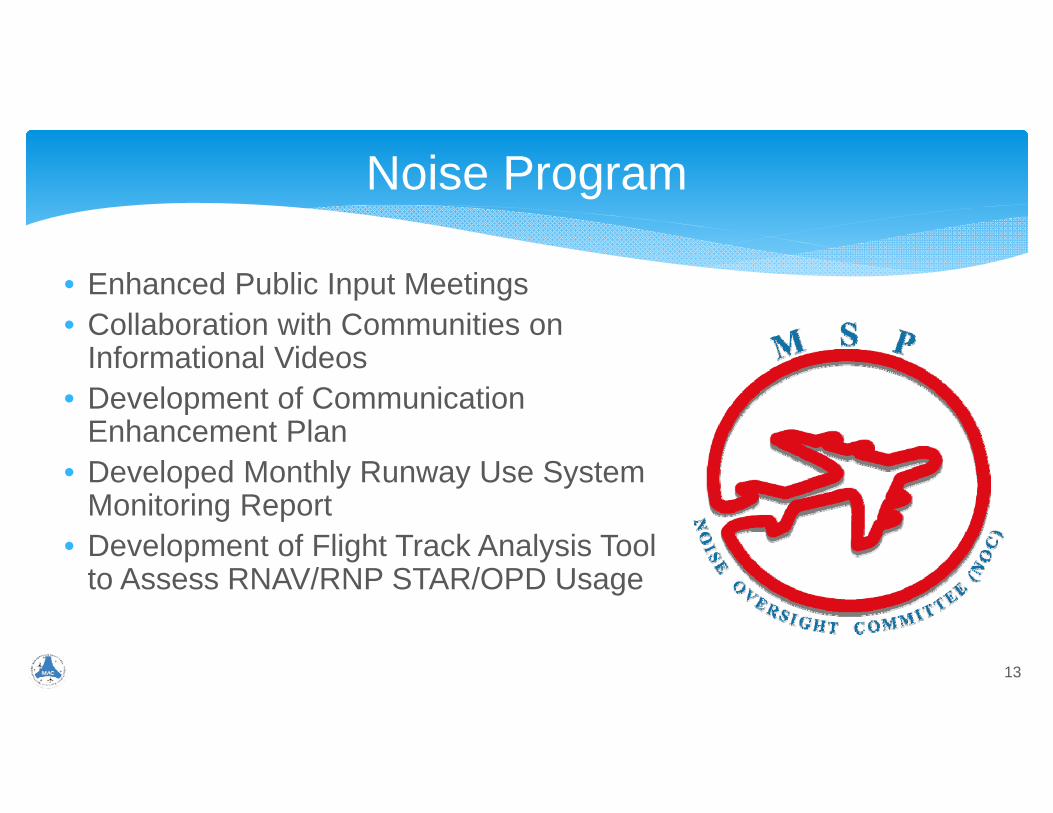
Noise Program
13
• Enhanced Public Input Meetings• Collaboration with Communities on
Informational Videos• Development of Communication
Enhancement Plan• Developed Monthly Runway Use System
Monitoring Report• Development of Flight Track Analysis Tool
to Assess RNAV/RNP STAR/OPD Usage
14
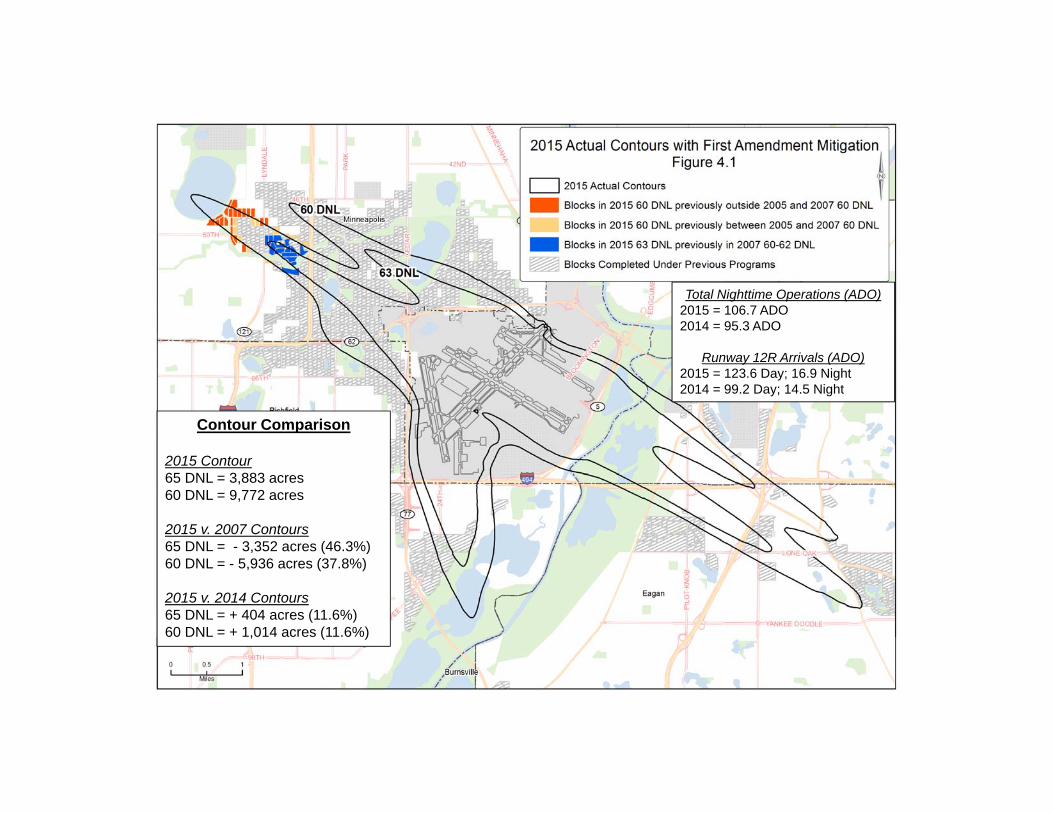
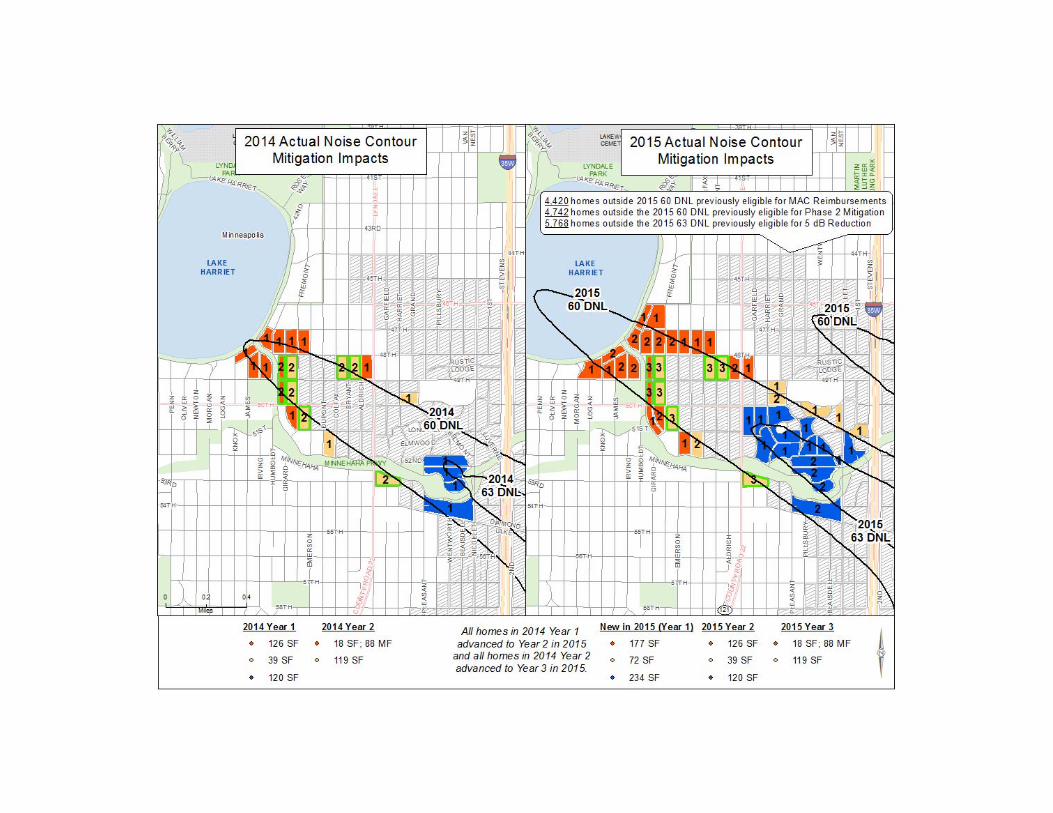
Contour Comparison
2015 Contour65 DNL = 3,883 acres60 DNL = 9,772 acres
2015 v. 2007 Contours65 DNL = - 3,352 acres (46.3%)60 DNL = - 5,936 acres (37.8%)
2015 v. 2014 Contours65 DNL = + 404 acres (11.6%)60 DNL = + 1,014 acres (11.6%)
Total Nighttime Operations (ADO)2015 = 106.7 ADO2014 = 95.3 ADO
Runway 12R Arrivals (ADO)2015 = 123.6 Day; 16.9 Night 2014 = 99.2 Day; 14.5 Night

15
16
Legislative Landscape – Aircraft Noise
17
• Quiet Communities Act (H.R. 3384)• Reestablish the Office of Noise Abatement and Control (“ONAC”) within the US Environmental
Protection Agency (EPA) for regulating environmental noise• FAA Community Accountability Act (H.R. 3965)
• Require the FAA to take actions to limit negative impacts on the human environment near airports when considering new or revised procedures in the implementation of NextGenincluding the creation of a Community Ombudsmen to make recommendations for addressing community concerns
• Silent Skies Act (H.R. 4171)• All aircraft over 75,000 lbs. certified after Dec. 31, 2017 comply with Stage 5 and phase out of
Stage 3 by 2037• FAA Reauthorization
• Provisions addressing RNAV departure dispersal, NextGen CatEx notification and airport consultation requirement, revisions to Part 150 Land Use Compatibility Guidelines

NOC RNAV Resolution #01-2014
18
• Prior to the commencement of any future RNAV SID design and implementation efforts at MSP, FAA should present a case study of the successful implementation of RNAV at an airport with similar challenges to those existing at MSP, which includes the airport’s location adjacent to densely populated residential areas.
• The case study should detail, how the FAA’s proposed design and implementation plan for MSP builds on the proven successes at the other similarly-situated airport.
• Future RNAV implementation at MSP should incorporate the community outreach recommendations previously communicated.
• Future implementation of RNAV SID should be delayed until said study and outreach plan are finalized.

Stage 5 Noise Standard
19
• In 2014 ICAO CAEP amended Annex 16, Chapter 14
• January 14, 2016 FAA NPRM to establish Stage 5
• 7 EPNdB below Stage 4• Apply to new aircraft with MTOW over
121,254 pounds December 31, 2017• Apply to new aircraft with MTOW less than
121,254 pounds after December 31, 2020
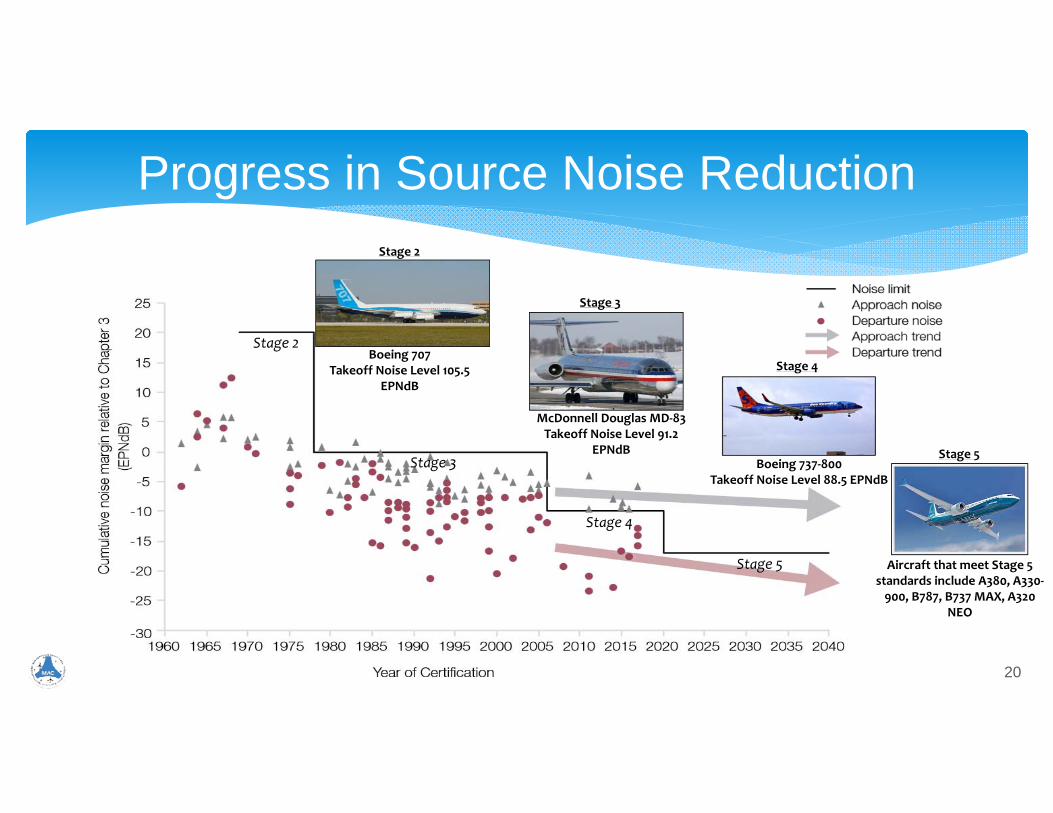
Progress in Source Noise Reduction
20
Stage 2
Stage 3
Stage 4
Stage 5
Stage 2
Stage 3
Stage 4
Boeing 737‐800Takeoff Noise Level 88.5 EPNdB
Boeing 707Takeoff Noise Level 105.5
EPNdB
McDonnell Douglas MD‐83Takeoff Noise Level 91.2
EPNdB
Aircraft that meet Stage 5 standards include A380, A330‐900, B787, B737 MAX, A320
NEO
Stage 5
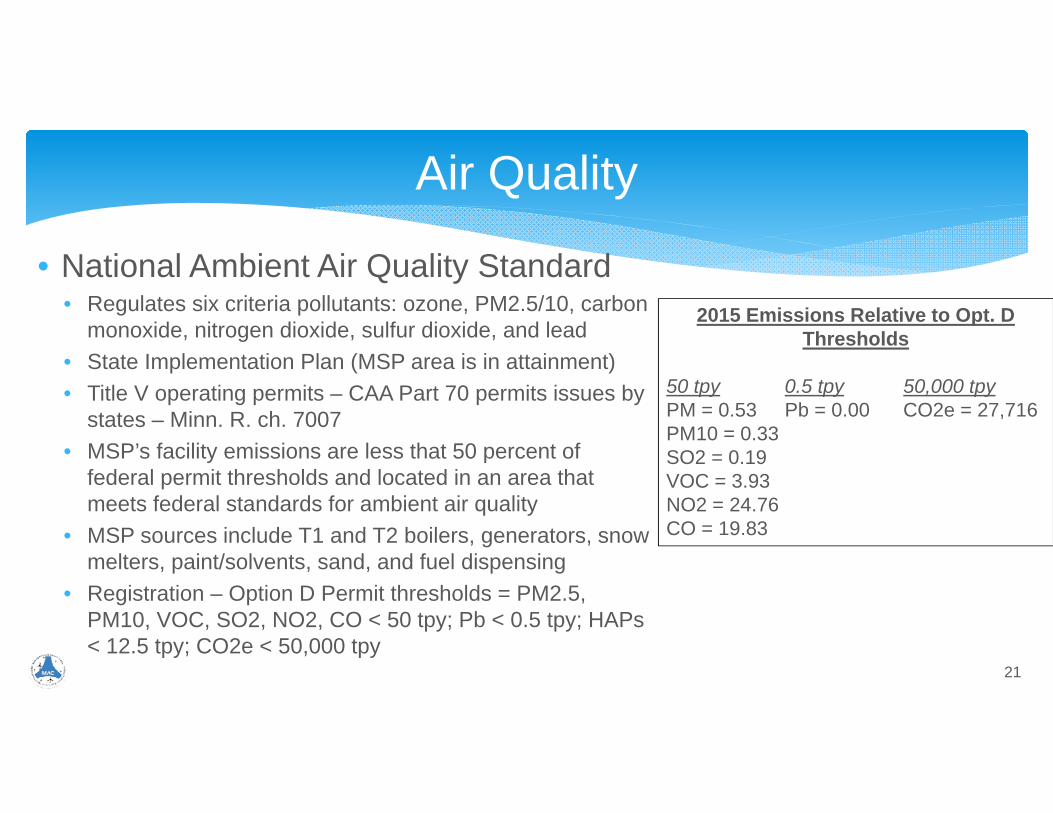
Air Quality
21
• National Ambient Air Quality Standard• Regulates six criteria pollutants: ozone, PM2.5/10, carbon
monoxide, nitrogen dioxide, sulfur dioxide, and lead• State Implementation Plan (MSP area is in attainment)• Title V operating permits – CAA Part 70 permits issues by
states – Minn. R. ch. 7007• MSP’s facility emissions are less that 50 percent of
federal permit thresholds and located in an area that meets federal standards for ambient air quality
• MSP sources include T1 and T2 boilers, generators, snow melters, paint/solvents, sand, and fuel dispensing
• Registration – Option D Permit thresholds = PM2.5, PM10, VOC, SO2, NO2, CO < 50 tpy; Pb < 0.5 tpy; HAPs < 12.5 tpy; CO2e < 50,000 tpy
2015 Emissions Relative to Opt. D Thresholds
50 tpy 0.5 tpy 50,000 tpyPM = 0.53 Pb = 0.00 CO2e = 27,716PM10 = 0.33SO2 = 0.19VOC = 3.93NO2 = 24.76CO = 19.83

• 2002 to 2007 MPCA monitored toxic chemicals and PM2.5 at MSP (PM2.5, VOCs, Carbonyls, Metals)
• 2005 MPCA added two monitoring locations near MSP in Minneapolis and Richfield (Wenonah School and Richfield Intermediate School)
• 2006 MPCA published an Update on Air Monitoring near the Minneapolis-St. Paul International Airport, which concluded that:
“…overall, median and average concentrations of pollutants monitored near MSP Airport are similar to concentrations monitored at other locations in the Twin Cities Metropolitan Area.”
MPCA Monitoring at MSP
22

• EPA Electronic Greenhouse Gas Reporting Tool (e-GGRT)
• Voluntary Greenhouse Gas Inventory Report
• Transition to Airport Carbon Accreditation (ACA) Program
23
Greenhouse Gas Reporting Program
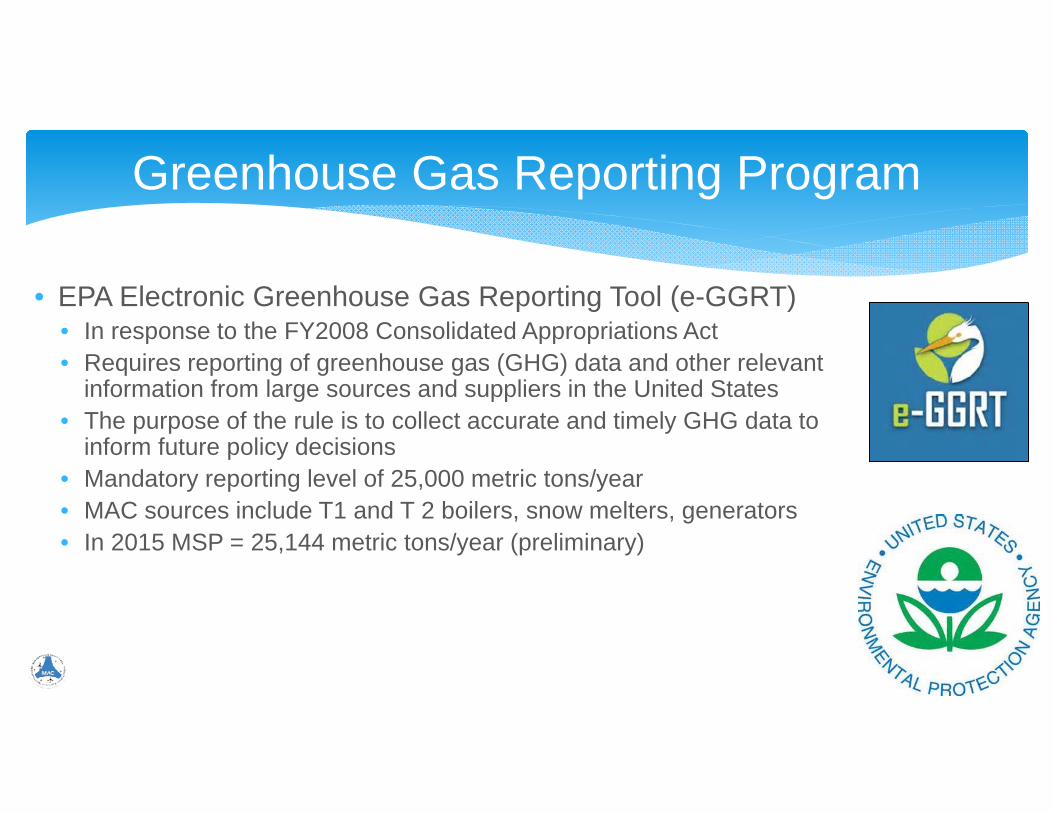
• EPA Electronic Greenhouse Gas Reporting Tool (e-GGRT)• In response to the FY2008 Consolidated Appropriations Act• Requires reporting of greenhouse gas (GHG) data and other relevant
information from large sources and suppliers in the United States• The purpose of the rule is to collect accurate and timely GHG data to
inform future policy decisions• Mandatory reporting level of 25,000 metric tons/year• MAC sources include T1 and T 2 boilers, snow melters, generators• In 2015 MSP = 25,144 metric tons/year (preliminary)
Greenhouse Gas Reporting Program
24

Voluntary Greenhouse Inventory Report
25
General Statistics• 2014 emissions were down by 19% from 2005• MAC-controlled sources are 1% of the total MSP footprint• Aircraft emission account for 96% of total MSP emissions

GHG Emissions v. 2005 Baseline
26

Industry Reporting and Reduction Framework: Airport Carbon Accreditation Program
27
Objective: “encourage and enable airports to implement best practice carbon and energy management processes and to gain public recognition for their achievements.”
Origins: The global airport industry agreed to reduce carbon emissions in a special resolution passed at the 2007 ACI World Annual Congress and Assembly. Since then a growing number of airports are joining the Airport Carbon Accreditation program.
Membership: 151 accredited airports worldwide – representing 27% of global passenger traffic – November 2014 program launched in North America

Program Certification
28
• MSP Level 1 certification 2016
• Level 2 certification planned in 2017
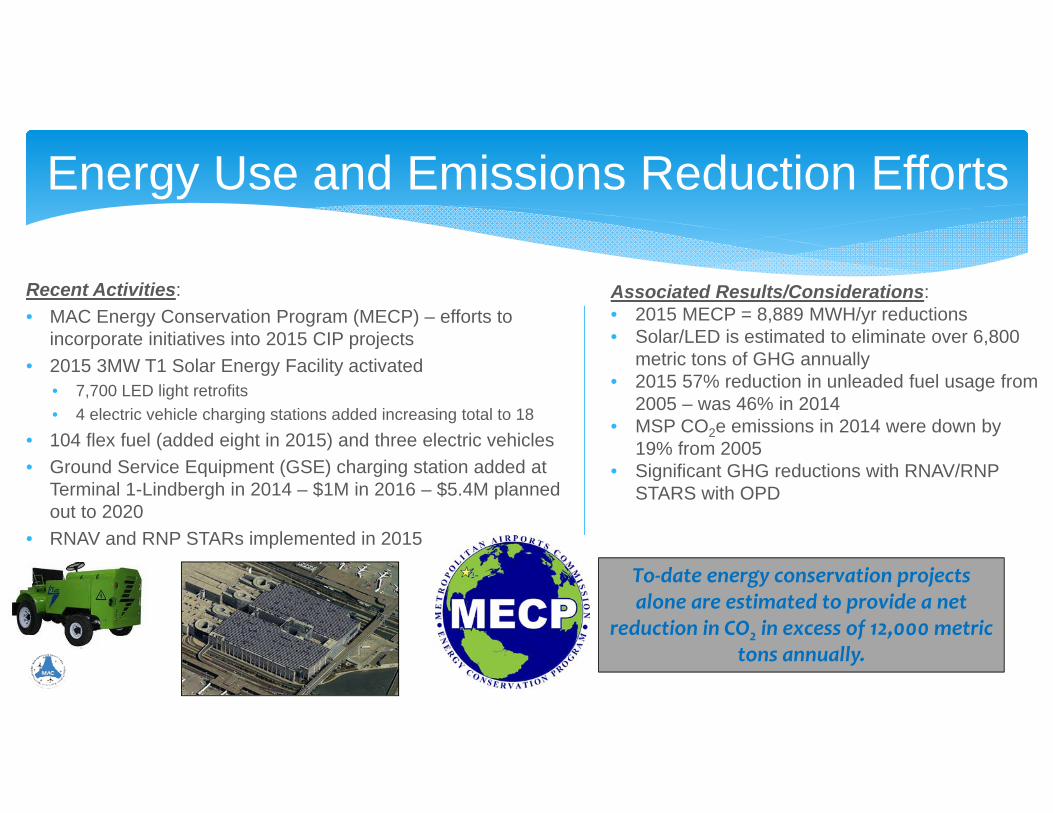
Energy Use and Emissions Reduction Efforts
Recent Activities:• MAC Energy Conservation Program (MECP) – efforts to
incorporate initiatives into 2015 CIP projects• 2015 3MW T1 Solar Energy Facility activated
• 7,700 LED light retrofits• 4 electric vehicle charging stations added increasing total to 18
• 104 flex fuel (added eight in 2015) and three electric vehicles• Ground Service Equipment (GSE) charging station added at
Terminal 1-Lindbergh in 2014 – $1M in 2016 – $5.4M planned out to 2020
• RNAV and RNP STARs implemented in 2015
Associated Results/Considerations:• 2015 MECP = 8,889 MWH/yr reductions• Solar/LED is estimated to eliminate over 6,800
metric tons of GHG annually • 2015 57% reduction in unleaded fuel usage from
2005 – was 46% in 2014• MSP CO2e emissions in 2014 were down by
19% from 2005• Significant GHG reductions with RNAV/RNP
STARS with OPD
To‐date energy conservation projects alone are estimated to provide a net
reduction in CO2 in excess of 12,000 metric tons annually.

Moving the Needle
30
Optimized Profile Descent (OPD)
Between March 24, 2015 and May 11, 2015 a total of 24,778 arrival operation at MSP used the new procedure - over 1.2 million gallons of jet fuel was saved and carbon emissions were reduced by as much as 12.2 metric tons.
MAC is in the process of collaborating with the FAA and Delta Air Lines to develop an OPD tracking system that will provide fuel burn reductions and emission reductions on a per-operation basis.

31To give our customers the best airport experience in North America
2015 Enhancements• Air quality data input, dashboards and reporting• Pavement deicing data input• MSP and Reliever UST/AST/facility inspection
app., dashboards, automated reporting• Additional automated reports to better share
collected data with MAC staff and consultants• A spill reporting online form and automated
reporting