Metroltek Six Sigma Charts XControlsmetroltek.com/PDF Documents/Metroltek Six Sigma Charts...
18
A set of XControls to produce Six Sigma Style Charts in the LabVIEW development environment Uses the Microsoft MSChart as the underlying chart engine Implements all of the common data analysis chart types: Control Chart Error Chart Histogram Pareto Chart Probability Distribution More… Data conditioning and formatting is built into the data analysis XControls…You only have to wire in the raw data, the XControl functionality does the rest to render a plot You can also produce XY Graphs, Waveform Graphs, Pie Charts, Polar Plots, more… Built in chart templates to load in directly from the block diagram at run time A chart designer application lets you customize chart styles to apply gradients, 3D effects, hatch styles and more Metroltek Six Sigma Charts XControls Axis string category data type Example XControl Pareto Chart with string axis data type
Transcript of Metroltek Six Sigma Charts XControlsmetroltek.com/PDF Documents/Metroltek Six Sigma Charts...

A set of XControls to produce Six Sigma Style Charts in the LabVIEW development environmentUses the Microsoft MSChart as the underlying chart engineImplements all of the common data analysis chart types:
Control Chart Error Chart HistogramPareto Chart Probability DistributionMore…
Data conditioning and formatting is built into the data analysis XControls…You only have to wire in the raw data, the XControl functionality does the rest to render a plot You can also produce XY Graphs, Waveform Graphs, Pie Charts, Polar Plots, more…Built in chart templates to load in directly from the block diagram at run timeA chart designer application lets you customize chart styles to apply gradients, 3D effects, hatch styles and more
Metroltek Six Sigma Charts XControls
Axis string category data type
Example
XControl
Pareto
Chart
with
string
axis data
type
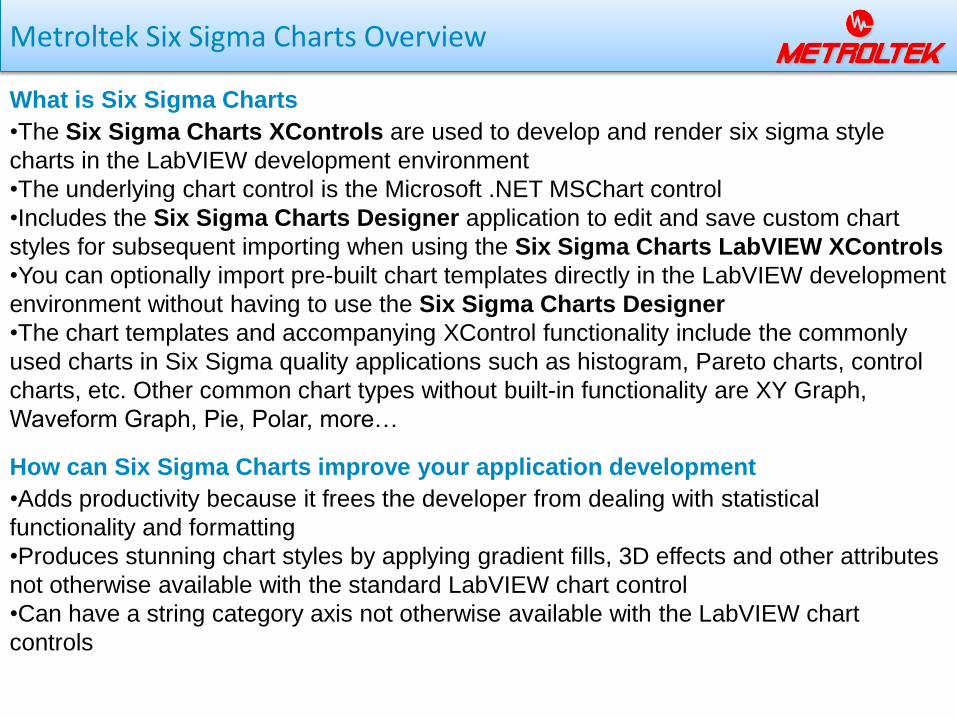
Metroltek Six Sigma Charts Overview
•The Six Sigma Charts XControls are used to develop and render six sigma style
charts in the LabVIEW development environment
•The underlying chart control is the Microsoft .NET MSChart control
•Includes the Six Sigma Charts Designer application to edit and save custom chart
styles for subsequent importing when using the Six Sigma Charts LabVIEW XControls
•You can optionally import pre-built chart templates directly in the LabVIEW development
environment without having to use the Six Sigma Charts Designer
•The chart templates and accompanying XControl functionality include the commonly
used charts in Six Sigma quality applications such as histogram, Pareto charts, control
charts, etc. Other common chart types without built-in functionality are XY Graph,
Waveform Graph, Pie, Polar, more…
•Adds productivity because it frees the developer from dealing with statistical
functionality and formatting
•Produces stunning chart styles by applying gradient fills, 3D effects and other attributes
not otherwise available with the standard LabVIEW chart control
•Can have a string category axis not otherwise available with the LabVIEW chart
controls
What is Six Sigma Charts
How can Six Sigma Charts improve your application development

Components of Six Sigma Charts
Six Sigma Charts Designer Application
Select chart template or open existing XML File
Edit appearanceSave chart as XML
file
Six Sigma Charts XControls
Wire in data RunAdd XControl of
selected chart type to user form
Supported development software: NI LabVIEW and Microsoft .NET languages such as C# and VB.NET, C++.NET
XControl includes built-in data conditioning and functionality for
the data analysis charts
Components of Six Sigma Charts include a library of XControls and a chart designer application
Optionally load in XML file created with
the chart designer

Implementing a Chart – Front Panel
Histogram XControl includes functionality to create the bins from raw data and output computed results
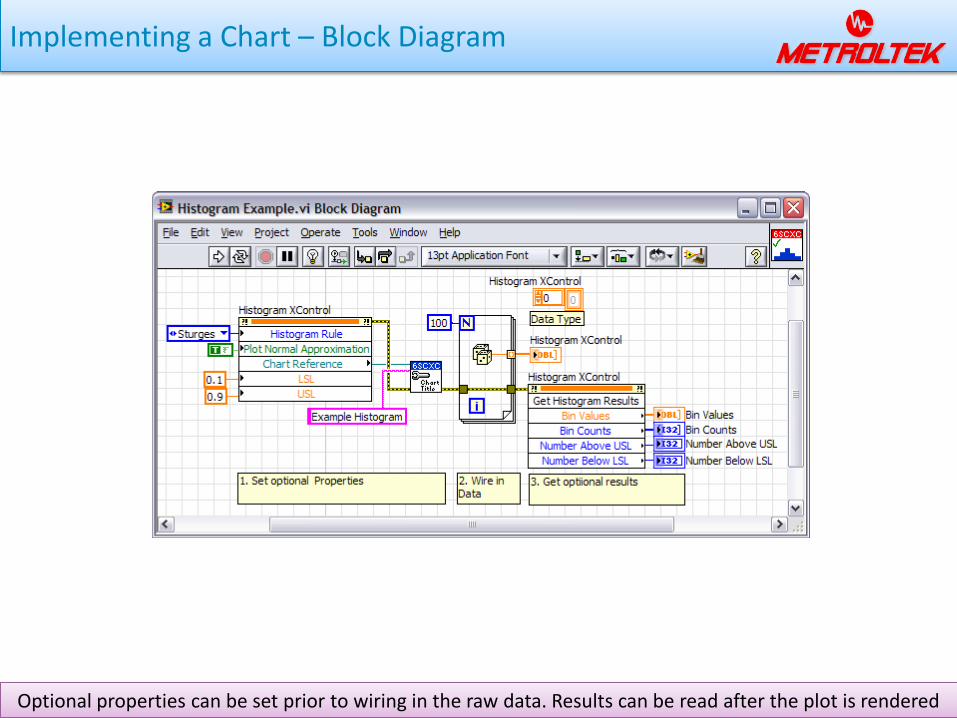
Implementing a Chart – Block Diagram
Optional properties can be set prior to wiring in the raw data. Results can be read after the plot is rendered
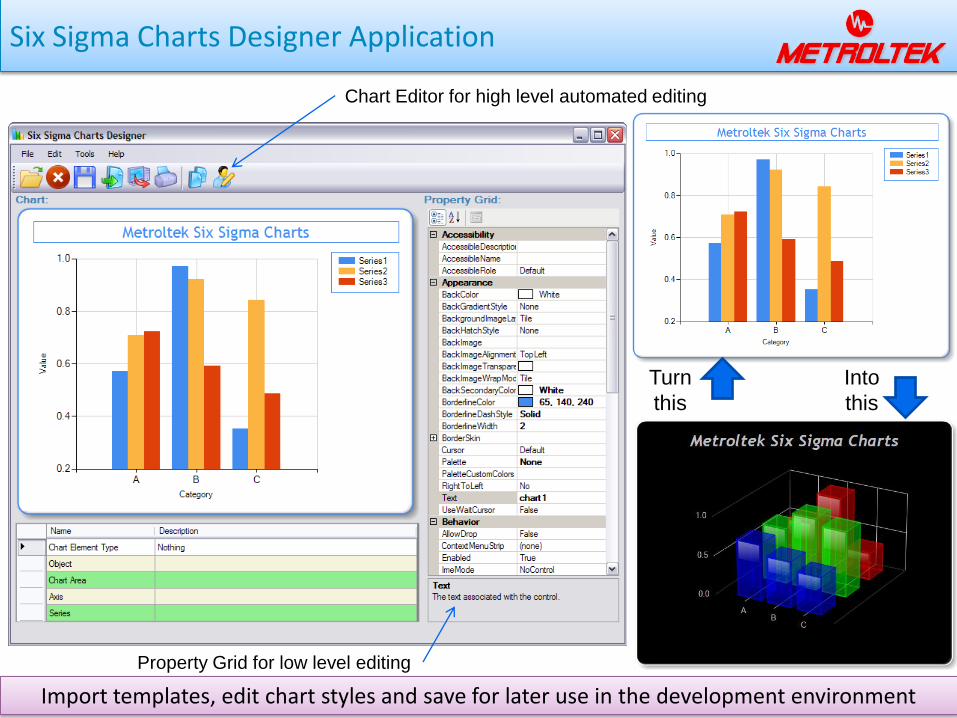
Six Sigma Charts Designer Application
Import templates, edit chart styles and save for later use in the development environment
Chart Editor for high level automated editing
Property Grid for low level editing
Turn
this
Into
this

Six Sigma Charts Designer Import Template Dialog
After selecting pre-built chart template, return to the main application to edit style and save
To load template hereMake selection here…
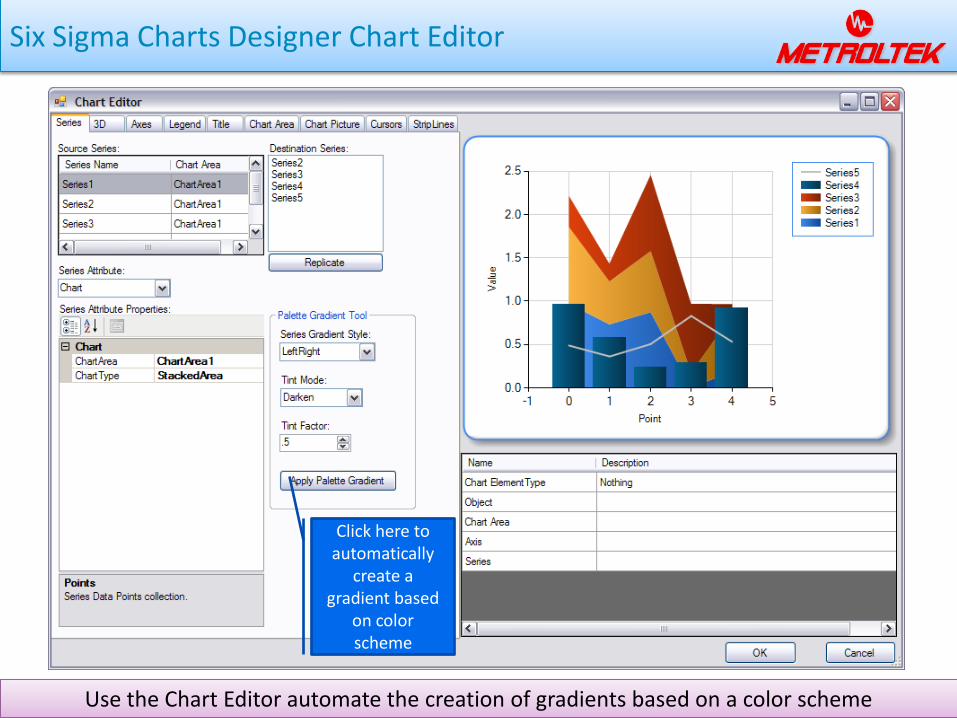
Six Sigma Charts Designer Chart Editor
Use the Chart Editor automate the creation of gradients based on a color scheme
Color scheme for selected palette Click here to
automatically create a
gradient based on color scheme
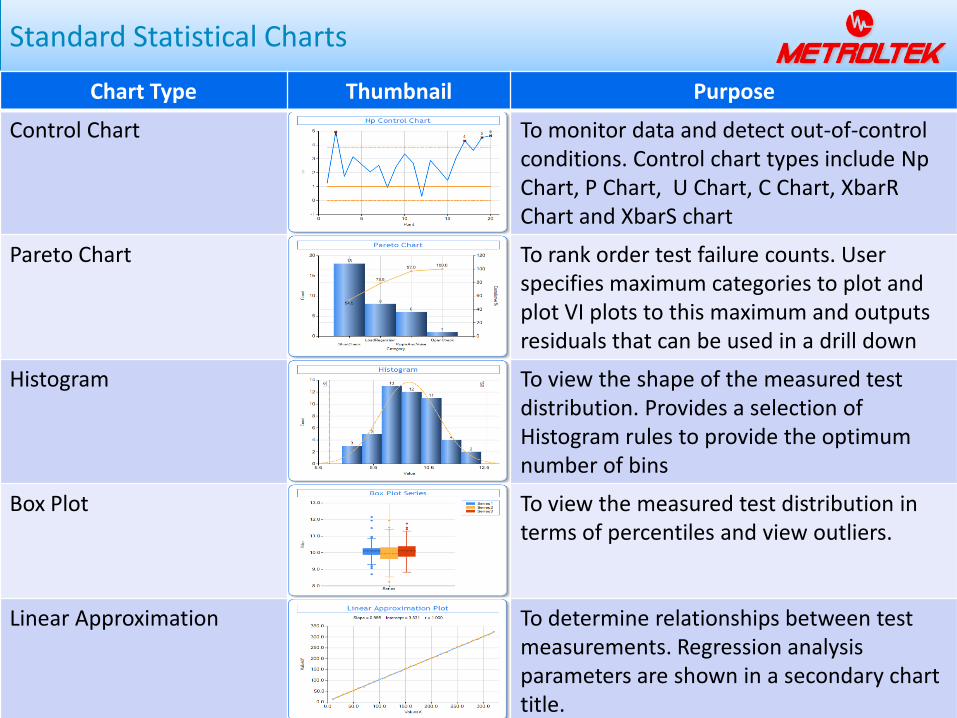
Standard Statistical Charts
Chart Type Thumbnail Purpose
Control Chart To monitor data and detect out-of-control conditions. Control chart types include Np Chart, P Chart, U Chart, C Chart, XbarR Chart and XbarS chart
Pareto Chart To rank order test failure counts. User specifies maximum categories to plot and plot VI plots to this maximum and outputs residuals that can be used in a drill down
Histogram To view the shape of the measured test distribution. Provides a selection of Histogram rules to provide the optimum number of bins
Box Plot To view the measured test distribution in terms of percentiles and view outliers.
Linear Approximation To determine relationships between testmeasurements. Regression analysis parameters are shown in a secondary chart title.
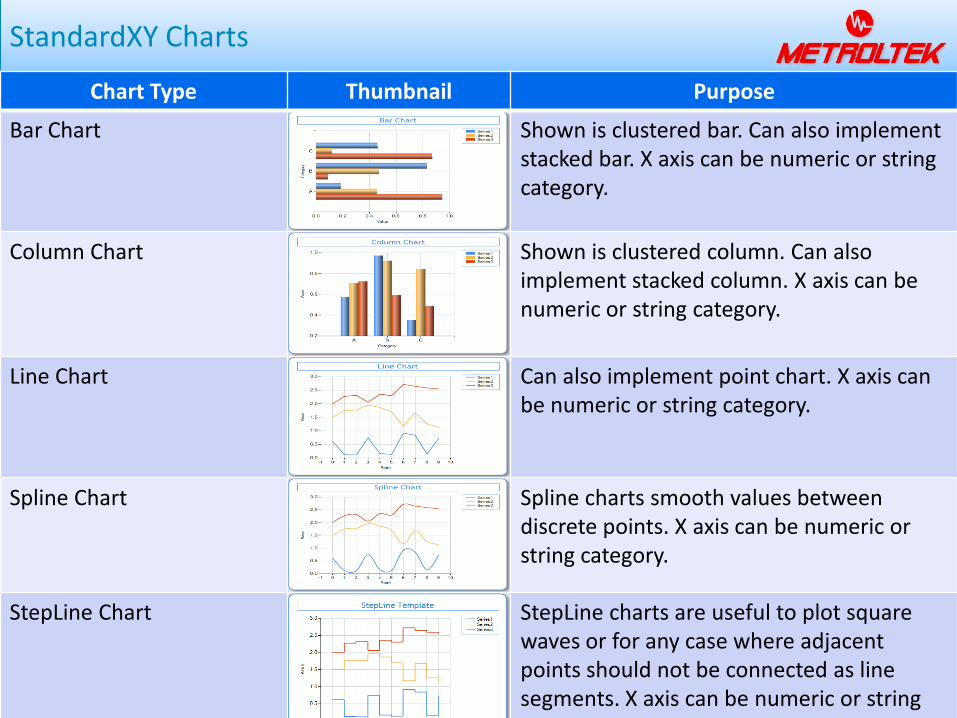
StandardXY Charts
Chart Type Thumbnail Purpose
Bar Chart Shown is clustered bar. Can also implement stacked bar. X axis can be numeric or string category.
Column Chart Shown is clustered column. Can also implement stacked column. X axis can be numeric or string category.
Line Chart Can also implement point chart. X axis can be numeric or string category.
Spline Chart Spline charts smooth values between discrete points. X axis can be numeric or string category.
StepLine Chart StepLine charts are useful to plot square waves or for any case where adjacent points should not be connected as line segments. X axis can be numeric or string category.
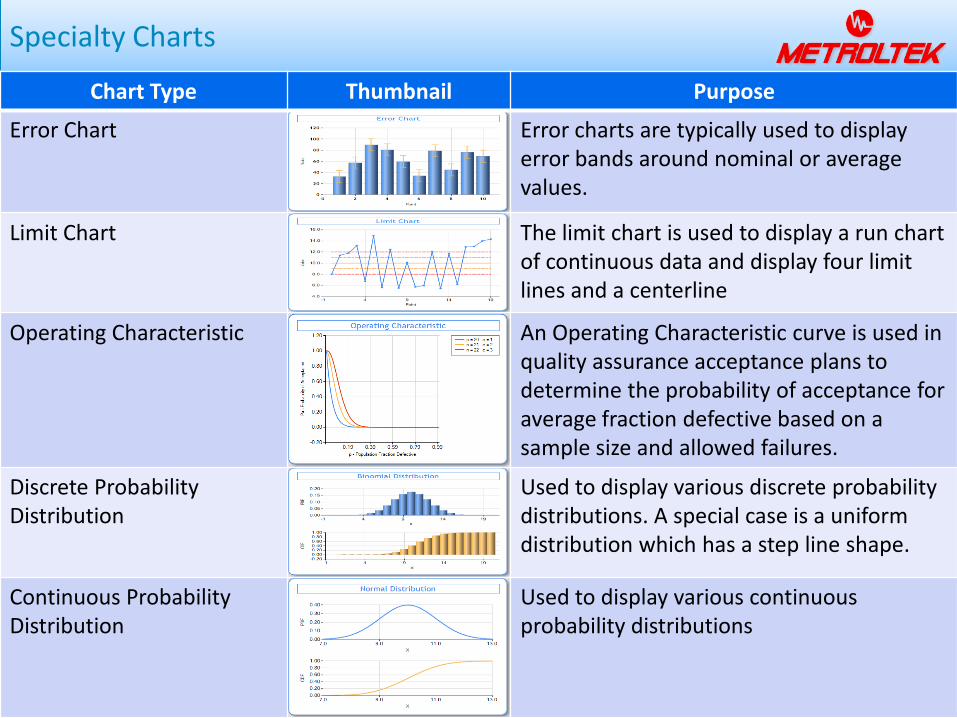
Specialty Charts
Chart Type Thumbnail Purpose
Error Chart Error charts are typically used to display error bands around nominal or average values.
Limit Chart The limit chart is used to display a run chart of continuous data and display four limit lines and a centerline
Operating Characteristic An Operating Characteristic curve is used in quality assurance acceptance plans to determine the probability of acceptance for average fraction defective based on a sample size and allowed failures.
Discrete Probability Distribution
Used to display various discrete probabilitydistributions. A special case is a uniform distribution which has a step line shape.
Continuous Probability Distribution
Used to display various continuous probability distributions
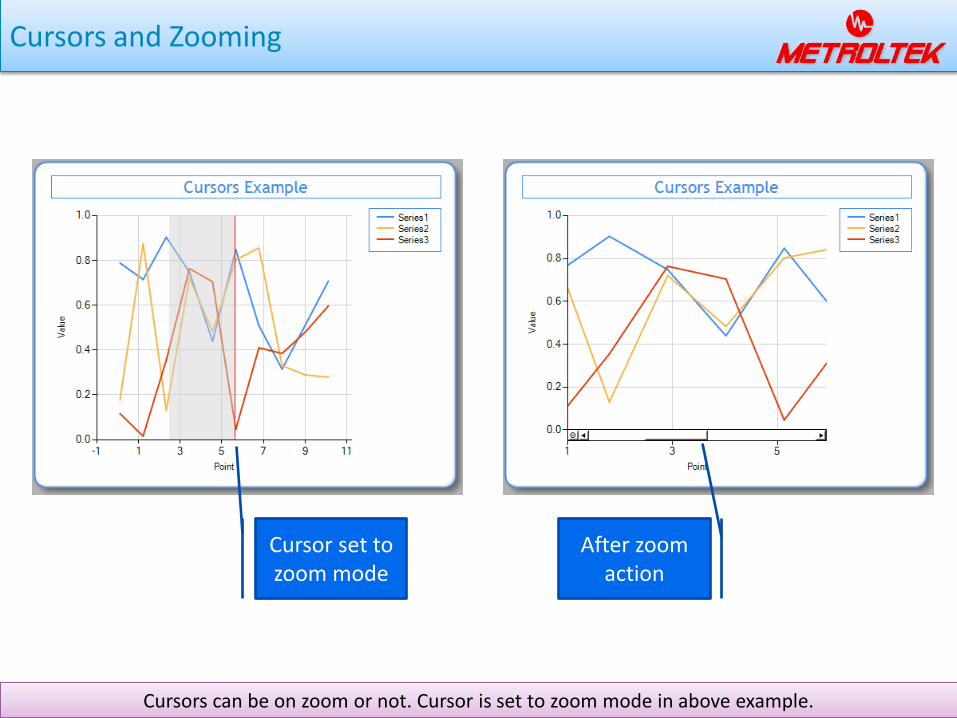
Cursors and Zooming
Cursors can be on zoom or not. Cursor is set to zoom mode in above example.
Cursor set to zoom mode
After zoom action
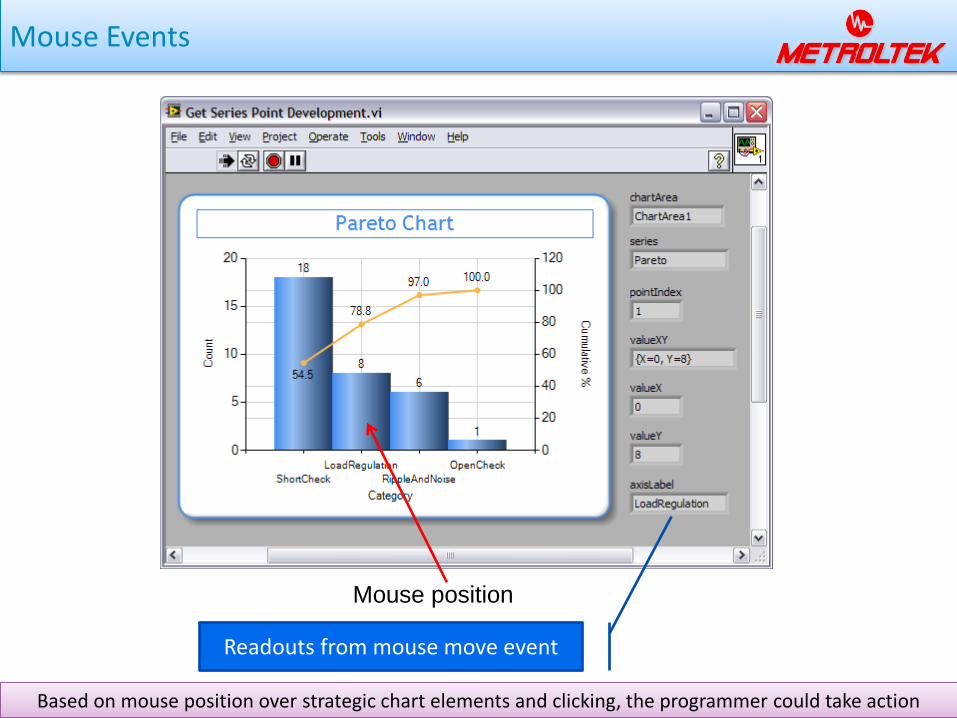
Mouse Events
Based on mouse position over strategic chart elements and clicking, the programmer could take action
Readouts from mouse move event
Mouse position
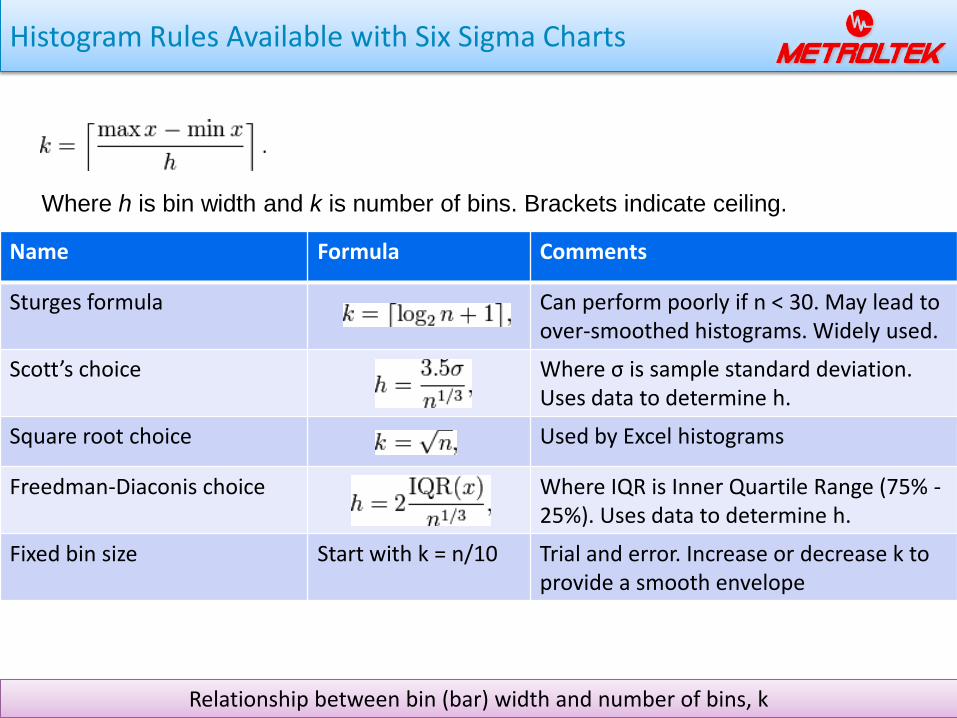
Histogram Rules Available with Six Sigma Charts
Where h is bin width and k is number of bins. Brackets indicate ceiling.
Relationship between bin (bar) width and number of bins, k
Name Formula Comments
Sturges formula Can perform poorly if n < 30. May lead to over-smoothed histograms. Widely used.
Scott’s choice Where σ is sample standard deviation. Uses data to determine h.
Square root choice Used by Excel histograms
Freedman-Diaconis choice Where IQR is Inner Quartile Range (75% -25%). Uses data to determine h.
Fixed bin size Start with k = n/10 Trial and error. Increase or decrease k to provide a smooth envelope
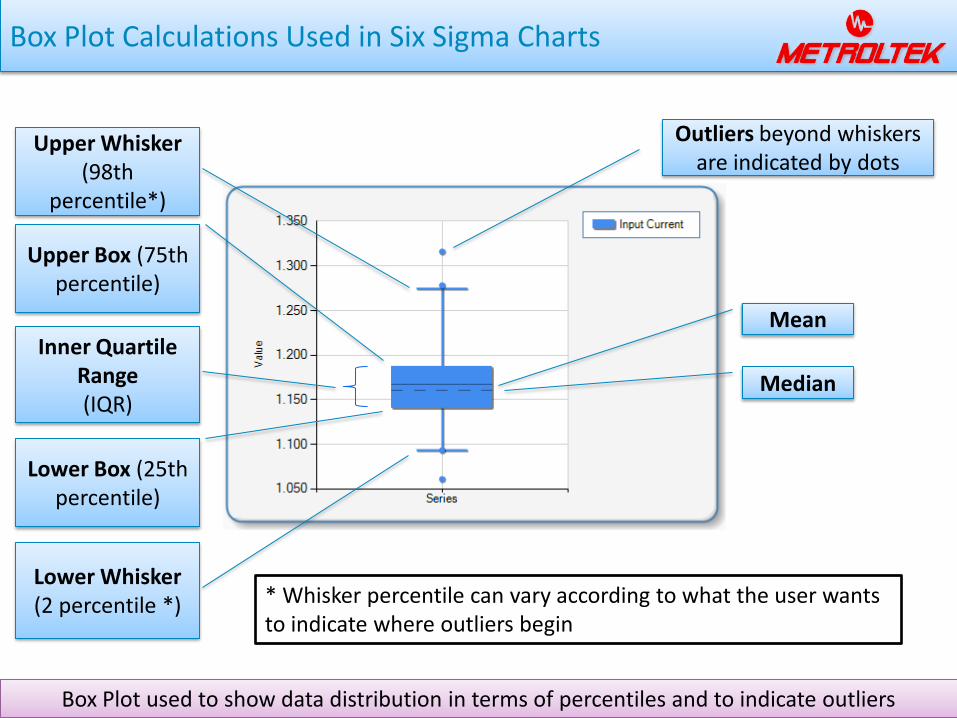
Box Plot Calculations Used in Six Sigma Charts
Mean
Median
Inner Quartile Range(IQR)
Lower Whisker (2 percentile *)
Upper Whisker (98th
percentile*)
* Whisker percentile can vary according to what the user wants to indicate where outliers begin
Outliers beyond whiskers are indicated by dots
Upper Box (75th percentile)
Lower Box (25th percentile)
Box Plot used to show data distribution in terms of percentiles and to indicate outliers

Offline Analysis Versus Real Time Monitoring
Offline Analysis Real Time Monitoring
•Test Sequencer stands alone and saves data to database or other media•Engineer monitors data and performs analysis in an offline computer, remote from the test station•Response to out-of-control conditions and immediate action may not be possible•By the time a special cause condition is observed, the process or component mix may have reverted and the questionable product may have been moved to subsequent operations
•Test Sequencer has the ability to perform real time SPC on the data•Both detection of out-of-control conditions and analysis can be performed synchronously with testing at the test station•Actions such as containment and feedback to the process is more immediate•Actions can be more timely and effective•Can detect and set aside outliers for subsequent analysis
Use for historical review, process capabilitystudies, and continuous improvement analysis
Build real time SPC into test sequencer to detect and act upon special cause problems
Metroltek Six Sigma Charts Enables Real Time SPC Monitoring in Manufacturing Test
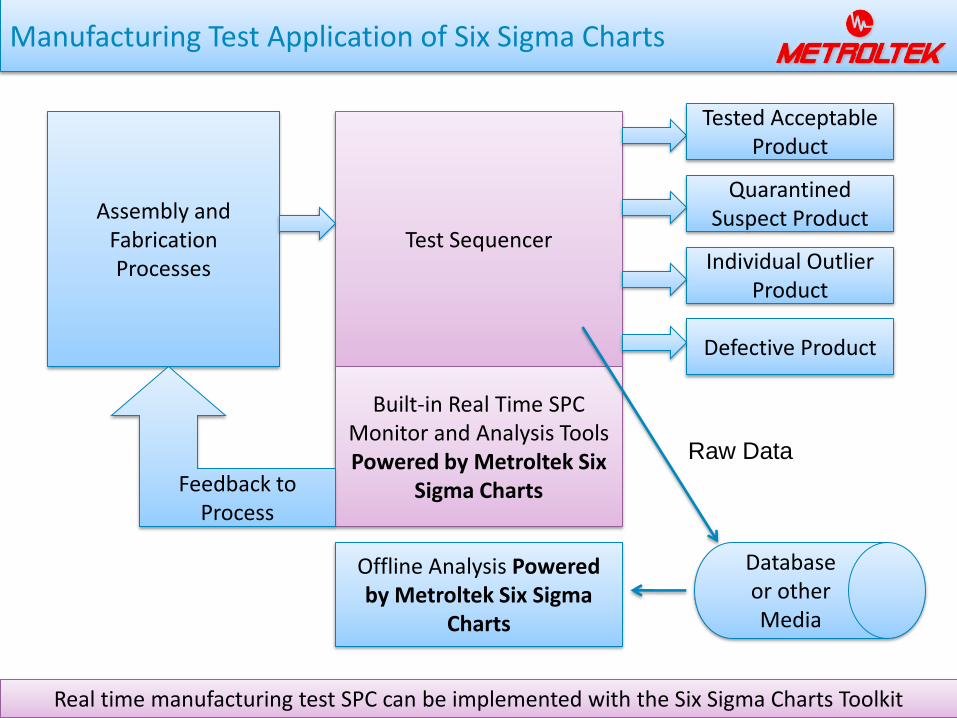
Manufacturing Test Application of Six Sigma Charts
Assembly and FabricationProcesses
Test Sequencer
Built-in Real Time SPC Monitor and Analysis Tools Powered by Metroltek Six
Sigma Charts
Offline Analysis Powered by Metroltek Six Sigma
Charts
Tested Acceptable Product
Quarantined Suspect Product
Defective Product
Feedback to Process
Database or other Media
Individual Outlier Product
Raw Data
Real time manufacturing test SPC can be implemented with the Six Sigma Charts Toolkit

Contact Information
Six Sigma Charts is certified by National Instruments as Compatible with LabVIEW
Contact Jim Dougherty at [email protected] or call 214.679.9811 for
information on how to obtain a demo or purchase the product