metro shoes - annual report - 2021 divider
143
Transcript of metro shoes - annual report - 2021 divider


2 - 4
5
6
7 - 16
17 - 34
35 - 41
43
44
45
46
47 - 80
81 - 86
87 - 91
92 - 130

B9/C9, Bhagwan Sheth Estate,Next to Arihant Commercial Complex,Purna Village,Bhiwandi-421302.
44th Annual General Meeting of Members will be held through Video Conference on 20th August, 2021 at 5.00 p.m.
S
Mr. Rafique A. Malik (Chairman)
Ms. Farah Malik Bhanji (Managing Director & Chief Executive Officer)
Mr. Mohammed Iqbal Hasanally Dossani
Mr. Utpal Sheth
Mr. Manoj Kumar Maheshwari
Ms. Aruna Advani
Mr. Arvind Kumar Singhal
Mr. Vikas Khemani
Mr. Srikanth Velamakanni
Ms. Aruna Advani (Chairperson)
Mr. Rafique A. Malik
Mr. Utpal Sheth
Mr. Manoj Kumar Maheshwari
Ms. Aruna Advani (Chairperson)
Ms. Farah Malik Bhanji
Mr.Mohammed Iqbal Hasanally Dossani
Mr. Rafique A. Malik (Chairman)
Ms. Farah Malik Bhanji
Ms. Aziza R. Malik
Mr. Sohel Kamdar
Ms. Alisha R. Malik
Mr. Kaushal Parekh
Mr. Rafique A. Malik (Chairman)
Ms. Farah Malik Bhanji
Mr. Utpal Sheth
Mr. Kaushal Parekh
Mr. Jayesh Dattani
Ms.Tarannum Bhanpurwala
IPO COMMITTEE
Ms.Tarannum Bhanpurwala
Link Intime India Pvt. Ltd,
C 101, 247 Park, L.B.S.Marg,
Vikhroli (West), Mumbai - 400083
Toll-free number : 1800 1020 878
Website : www.linkintime.co.in
Email : [email protected]
ISIN : INE317I01021
(Seemandhra) Kakinada 2
Rajahmundry 1
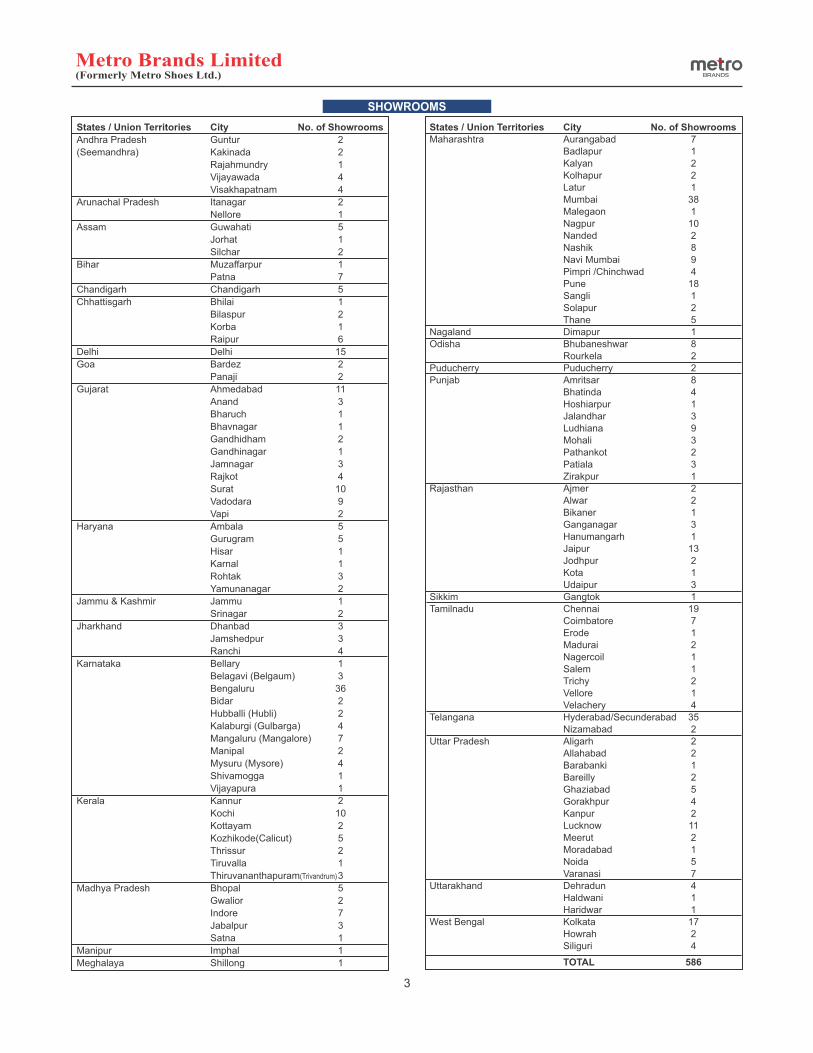
States / Union Territories City No. of Showrooms
Andhra Pradesh Guntur 2
Vijayawada 4
Visakhapatnam 4
Arunachal Pradesh Itanagar 2
Nellore 1
Assam Guwahati 5
Jorhat 1
Silchar 2
Bihar Muzaffarpur 1
Patna 7
Chandigarh Chandigarh 5
Chhattisgarh Bhilai 1
Bilaspur 2
Korba 1
Raipur 6
Delhi Delhi 15
Goa Bardez 2
Panaji 2
Gujarat Ahmedabad 11
Anand 3
Bharuch 1
Bhavnagar 1
Gandhidham 2
Gandhinagar 1
Jamnagar 3
Rajkot 4
Surat 10
Vadodara 9
Vapi 2
Haryana Ambala 5
Gurugram 5
Hisar 1
Karnal 1
Rohtak 3
Yamunanagar 2
Jammu & Kashmir Jammu 1
Srinagar 2
Jharkhand Dhanbad 3
Jamshedpur 3
Ranchi 4
Karnataka Bellary 1
Belagavi (Belgaum) 3
Bengaluru 36
Bidar 2
Hubballi (Hubli) 2
Kalaburgi (Gulbarga) 4
Mangaluru (Mangalore) 7
Manipal 2
Mysuru (Mysore) 4
Shivamogga 1
Vijayapura 1
Kerala Kannur 2
Kochi 10
Kottayam 2
Kozhikode(Calicut) 5
Thrissur 2
Tiruvalla 1
Thiruvananthapuram(Trivandrum) 3
Madhya Pradesh Bhopal 5
Gwalior 2
Indore 7
Jabalpur 3
Satna 1
Manipur Imphal 1
Meghalaya Shillong 1
Lucknow 11
Hoshiarpur 1
Mohali 3
Rourkela 2Puducherry Puducherry 2
Jalandhar 3 Ludhiana 9
Pathankot 2
Punjab Amritsar 8 Bhatinda 4
Salem 1
Patiala 3 Zirakpur 1
Nagercoil 1
Jodhpur 2 Kota 1 Udaipur 3Sikkim Gangtok 1Tamilnadu Chennai 19 Coimbatore 7 Erode 1 Madurai 2
Ganganagar 3
Jaipur 13
Trichy 2
Bareilly 2 Ghaziabad 5
Vellore 1
Allahabad 2 Barabanki 1
Bikaner 1
Hanumangarh 1
Velachery 4Telangana Hyderabad/Secunderabad 35 Nizamabad 2Uttar Pradesh Aligarh 2
Sangli 1
Nagaland Dimapur 1
Pune 18 Pimpri /Chinchwad 4 Navi Mumbai 9 Nashik 8 Nanded 2 Nagpur 10
Rajasthan Ajmer 2 Alwar 2
Solapur 2 Thane 5
Odisha Bhubaneshwar 8
Kanpur 2 Gorakhpur 4
Kalyan 2
Malegaon 1 Mumbai 38 Latur 1 Kolhapur 2
Badlapur 1Maharashtra Aurangabad 7States / Union Territories City No. of Showrooms
Noida 5 Varanasi 7Uttarakhand Dehradun 4 Haldwani 1 Haridwar 1West Bengal Kolkata 17 Howrah 2
Moradabad 1 Meerut 2
Siliguri 4
TOTAL 586


Particulars 2011-12 2012-13 2013-14 2014-15 2015-16 2016-17 2017-18 2018-19 2019-20 2020-21
No.of Showrooms 222 239 281 290 317 362 419 504 551 586
Gross Sales 54,675.30 66,604.74 76,599.06 84,155.37 91,919.58 103,113.64 121,577.66 135,288.94 141,188.69 91,942.80
Increase over previous years 32.70% 21.82% 15.01% 9.86% 9.23% 12.18% 17.91% 11.28% 4.36% -34.88%
Net Sales 46,415.39 55,907.52 63,609.10 70,195.16 76,718.14 86,755.31 104,300.81 115,445.84 120,916.55 78,841.48
Increase over previous years 26.66% 20.45% 13.78% 10.35% 9.29% 13.08% 20.22% 10.69% 4.74% -34.80%
EBIDTA (Earning Before 8,996.05 9,951.77 11,895.74 13,179.23 13,796.23 15,463.87 22,328.43 24,639.30 24,546.52 13,498.02Dep,Interest & Tax)
Depreciation 398.03 1,259.83 1,099.46 1,179.59 1,283.23 1,568.76 1,921.58 2,228.79 11,993.13 12,120.89
Profit Before Tax 8,596.98 8,674.92 10,794.97 11,993.16 12,513.09 13,895.12 20,452.95 22,386.66 20,708.29 9,113.80
Profit After Tax 5,833.97 5,890.95 7,160.09 7,926.46 8,204.76 9,199.85 13,462.92 14,706.25 15,231.64 7,441. 56
Equity Dividend (%) 250% 100% 110% 120% 125% 135% 200% 24% 30% 30%
Dividend Payout (%) 24.39% 29.02% 26.46% 26.74% 26.96% 26.15% 26.24% 25.98% 26.15% 54.92%
Equity Share Capital 489.80 1,471.07 * 1,472.05 1,472.05 1,472.75 1,472.75 1,472.75 13,276.71* 13,276.71 13,276.71
Reserves & Surplus 17,038.46 20,308.87 25,583.75 31,350.63 37,355.11 44,126.68 54,664.86 53,178.04 64,725.06 67,187.86
Net Worth 17,528.26 21,779.94 27,055.80 32,822.68 38,827.86 45,599.43 56,137.61 66,454.75 78,001.77 80,464.57
Investments 720.87 3,560.22 7,863.06 3,696.25 7,652.50 9,057.50 17,894.56 20,276.96 34,046.00 39,236.92
Gross Fixed Assets 6,809.67 8,211.12 10,005.56 16,446.62 18,389.64 23,024.67 25,865.43 31,287.94 33,411.59 35,501.43
Net Fixed Assets 5,557.24 5,803.88 6,688.44 12,161.11 13,381.17 17,023.85 18,341.88 22,182.96 22,343.47 22,242.69
Particulars 2011-12 2012-13 2013-14 2014-15 2015-16 2016-17 2017-18 2018-19 2019-20 2020-21
Gross Margin (%) 48.45% 47.82% 48.61% 48.64% 48.89% 49.44% 55.15% 55.24% 56.27% 55.38%
EBIDTA (%) 19.38% 17.80% 18.70% 18.78% 17.98% 17.82% 21.41% 21.34% 20.30% 17.12%
PAT (%) 12.57% 10.54% 11.26% 11.29% 10.69% 10.60% 12.91% 12.74% 12.60% 9.44%
Earning per share (in ₹) 39.67 # 40.05 # 48.66 53.85 55.72 62.13 10.20 * 11.14 * 5.72 $ 2.73 $
Book Value per share (in ₹) 119.20 # 148.05 # 183.80 222.97 263.64 309.62 42.28 * 50.05 * 29.38 $ 30.30 $
Return on Capital Employed (%) 49.05% 39.83% 39.90% 36.54% 32.23% 30.47% 36.43% 33.69% 26.55% 11.33% (ROCE)
Return on Net Worth (%) (RONW) 33.28% 27.05% 26.46% 24.15% 21.13% 20.07% 24.08% 22.25% 19.47% 9.01%
* Bonus Issue in the Ratio 2 : 1 in Financial year 2012-13, bonus issue in the Ratio 8:1 in Financial year 2018-19.
# Impact of bonus issue of shares .
$ Impact of sub-division of shares from face value of ₹ 10 per equity share to face value of ₹5 per equity share in Financial year 2020-21.
5
(₹ in Lakhs)
Key Indicators (Previous year comparative numbers updated for below corporate events)
(STANDALONE)

155
223 246 245
135
-
50
100
150
200
250
300
FY 17 FY 18 FY 19 FY 20 FY 21
EBIDTA ` In Crore
92
135 147 152
74
-
20
40
60
80
100
120
140
160
FY 17 FY 18 FY 19 FY 20 FY 21
Profit After Tax ` In Crore
62.13
10.20 11.145.72
2.73
-
10
20
30
40
50
60
70
FY 17 *FY 18 *FY 19 $ FY 20 $ FY 21
Earning Per Share `
310.00
42.00 50.0029.38 30.30
-
50
100
150
200
250
300
350
FY 17 * FY 18 *FY 19 $ FY 20 $ FY 21
Book Value Per Share `
125%
200%
24% 30% 30%
0%
50%
100%
150%
200%
250%
FY 17 FY 18 FY 19 FY 20 FY 21
Dividend %
362 419
504 551
586
-
100
200
300
400
500
600
700
FY 17 FY 18 FY 19 FY 20 FY 21
No. of Showrooms
456
561
665
780 805
-
100
200
300
400
500
600
700
800
900
FY 17 FY 18 FY 19 FY 20 FY 21
Net Worth ` In Crore
1,031
1,216 1,353 1,412
919
-
200
400
600
800
1,000
1,200
1,400
1,600
FY 17 FY 18 FY 19 FY 20 FY 21
Turnover ` In Crore
* Bonus Issue in the Ratio 2 : 1 in Financial year 2012-13, bonus issue in the Ratio 8:1 in Financial year 2018-19. $ Impact of sub-division of shares from face value of ₹ 10 per equity share to face value of ₹5 per equity share in Financial year 2020-21.
6


1.2 Consolidated
Your Company has been financing its operations and expansions through internal accruals. Your Company retained highest credit rating A1+ for short term and AA for long term by CARE, a leading rating agency.
5. FINANCE
The Board of Directors of your Company has decided not to transfer any amount to the Reserves for the year under review.
4. GENERAL RESERVE
The Board of Directors of your Company has declared and paid an interim dividend of ₹0.75/- per equity share of the face value of ₹10/- per share (7.5%). The Board of Director has proposed Final Dividend of ₹1.125 per Equity Share of face value ₹ 5/- per Equity Share (22.5%) for the Financial Year 2020-21. Total Dividend payout for the FY 2020-21 would be 30% same as previous year. The dividend declared and paid / proposed to be declared during the year is in accordance with the Dividend Distribution Policy, as approved and adopted by the Board of Directors of the Company. Total Dividend payment for FY 2020-21 would be ₹39.83 Crore.
3. DIVIDEND
Consequently, The Profit before Tax was lower at ₹ 84.51 crore compared to ₹ 218.42 crore in the previous year. The Profit after Tax was lower at ₹ 66.47 crore compared to ₹ 161.22 crore in the previous year a degrowth of 58.77%.
On a Consolidated basis, the Company was able to achieve Gross Turnover of ₹ 938.52 crore as against the Gross Turnover of ₹ 1512.65 crore during the previous year a degrowth of 37.96%.
Dear Members,
We begin with a tribute to the people who lost their lives in the worst ever pandemic of human life and express our deepest sympathies to their families. We present herewith the 44th Annual Report together with the Audited Accounts of Metro Brands Limited ('Your Company' or 'Metro') for the year ended 31st March 2021.
1. FINANCIAL RESULTS (₹ in Lakhs)
Particulars Standalone Consolidated
2020-21 2019-20 2020-21 2019-20
Gross Sales 91,943 141,189 93,852 151,265
Less: Taxes 13,101 20,272 13,951 23,197
Sales (Net of Taxes) 78,841 120,917 79,901 128,068
Profit before depreciation & Tax 21,235 32,702 20,636 33,902
Less: Depreciation 12,121 11,993 12,184 12,061
Profit Before Tax 9,114 20,708 8,451 21,842
Less: Provision for tax 2,428 5,289 2,428 5,622
Less: Deferred Tax Liability (497) 157 (426) 164
(Add) / Less: Tax pertaining to earlier years (70) 75 (74) 84
(Add) / Less: Share of profit attributable to Joint venture - - 60 (85)
Profit After Tax 7,252 15,188 6,462 16,058
Add/ (Less): Other comprehensive income / (Loss) (net of taxes) 189 44 185 64
Total Comprehensive Income 7,442 15,232 6,647 16,122
Less: Total Comprehensive Income attributable to Non-Controlling Interest - - (360) 395
Total Comprehensive Income attributable to Owners of the Company 7,442 15,232 7,007 15,727
2. Performance Overview
The year under review will be remembered as the year of Covid-19 Pandemic. Closure of the business operations on account of lockdowns imposed to control widespread of the pandemic caused major setback in our business performance during initial months however we invested a lot of efforts and energies to identify newer growth areas and cost savings / rationalization efforts. Post reopening of the business activities, the demand picked up and performance improved gradually in the later half of the year.
1.1 Standalone
Even amidst such a global crisis, we are glad to state that despite not able to operate for the full year, your Company was able to achieve the standalone Gross Turnover of ₹ 919.43 crore as compared to Gross Turnover of ₹1,411.89 crore during the previous year a degrowth of 34.88%. The Profit after tax was lower at ₹ 74.42 crore compared to ₹ 152.32 crores in the previous year, a degrowth of 51.14%.
8

7. METRO'S FIGHT AGAINST COVID-19:
The Loyalty club members increased to 85.38 Lacs (previous year 76.85 Lacs) with growth of 11.09 % for the year.
The COVID-19 pandemic has emerged as a global challenge, creating disruption across the world. This unprecedented pandemic has pushed organizations to adopt and adapt newer processes and technologies to survive and grow. Amidst this crisis, digital transformation, and cyber security, thus, is no longer a choice, but rather an imperative for businesses to achieve continuity. The swift transition to work from home was facilitated by the Company. The physical and emotional wellbeing of employees continue to be a top priority for the Company, with several initiatives to support employees and their families during the pandemic. The Company has reimagined employee engagement, which transcends geographic barriers by embracing virtual technologies and embraces our diverse workforce and to boost morale of the employees. We are actively encouraging our employees to get vaccinated and facilitate the same. Stringent safety measures and SOPs have been put in place for all the business locations of the Company which include sanitization of premises, social distancing norms, uses of gloves, masks, sanitizers, regular cleaning of shelves etc.
In every way, we are firmly on our way to becoming a more future-ready company and determined to keep formulating robust strategies and means to combat the challenges thrown by the pandemic.
With a view to broad base the investor base by encouraging the participation of the retail investors in the proposed Initial Public Issue ('IPO'), the Company, through Special Resolution held on 30th March, 2021, has sub-divided the nominal value of the equity shares of the company from 1 (One) equity share of ₹10/- (Rupees Ten only) each into 2 (Two) equity shares of ₹5/- (Rupees Five only) each and consequently amended Capital clause of the Memorandum of Association. There has been no change in the Authorised or Nominal Share Capital of the Company.
In compliance with the Companies (Prospectus and Allotment of Securities) Third Amendment Rules, 2018, all the shares of the Company have been converted into and continuous to be in dematerialized mode.
During the year under review, the number of Premium and Affordable fashion stores increased from 363 to 364 contributing sales ₹ 678.70 Crores against ₹ 1,119.53 Crores for the previous year. The number of Value line stores increased from 49 to 52 contributing sales ₹ 36.41 Crores against ₹ 53.45 Crores for the previous year whereas Value line (Shop-in-Shops) remained unchanged at 21 contributing sales ₹ 3.91 Crores against ₹ 8.87 Crores for the previous year. The Crocs stores increased from 118 to 149 registering sales ₹ 138.30 Crores against ₹ 185.40 Crores for the previous year. Under challenging business environment, the offline sales performance suffered major setback however online sales increased significantly. The online sales increased to ₹ 55.35 Crores from ₹ 33.15 Crores during the previous year. The Raw material and Footwear components trading division achieved sales of ₹ 3.75 Crores against ₹ 9.62 Crores during the previous year.
8. SIGNIFICANT ACTIVITIES AND DEVELOPMENTS
The Company has tried to turn this crisis into an opportunity for its business.
The Company's new 1,50,000 sq. ft. warehouse at Bhiwandi has become operational in June 2020. The Company has discontinued its additional warehouses for E-Commerce, Raw Materials and Repairs and consolidated these activities under the new warehouse.
The Company has taken step towards environmentally friendly products by introducing sustainable footwear collection made from Merino wool and fabrics made from recycled pet bottles. Sustainable packaging has also been introduced for filler paper and boxes made from recycled and bio-degradable products and eco-friendly materials.
The Company has taken various cost control steps to fight the COVID crisis such as negotiation of rentals with the Landlords based on the revenue share and sales trend, rationalization of front end and back-end manpower cost, fit-out cost, packing and admin cost, fixed retainer and tech cost etc. Work from Home setting has also resulted in cost savings for the Company.
The Company has started monitoring statutory compliances through a system driven software Legatrix which has the facility of capturing all the compliances under statutes that impact the Company's operations. Due compliances are ensured by online monitoring and delay or noncompliance are escalated and reported for remedial action.
9. SUB-DIVISION OF THE VALUE OF SHARES
The Financial year 2021-22 too has started with lockdowns imposed by the administrative authorities in their respective states of the country due to quick and sudden increase in the cases affected in the second wave of COVID-19. Situation is coming under control though gradually. The gross sales during the first 2 months have been ₹ 83.50 Crore with total 589 no. of stores.
Your Company is recognized as a Specialty Branded Footwear Retailer with nationwide presence across premium, affordable and value categories. Despite slowdown, Your Company continued with its expansion plan and opened 59 new stores including relocation of 3 existing stores. Your Company has opened its first stores in the cities of Hisar (Haryana), Kannur (Kerala), Malegaon (Maharashtra), Nellore (Andhra Pradesh), Nizamabad (Telangana), Srinagar (Jammu & Kashmir) and Vellore (Tamil Nadu). The total number of stores reached 586 at the end of the year.
6. BUSINESS OPERATIONS
9

During the year under review, the following changes took place in the composition of Board of Directors:
The annual accounts of Metmill along with the related detailed information, is available for inspection by the members at the Registered Office of the Company during business hours, up to the date of the Annual General Meeting. The copies of the audited accounts of 'Metmill' can be sought by any member by making a written request addressed to the registered office.
13. BOARD OF DIRECTORS
The Board of your Company consists of 9 members of whom 3 are Executive Directors and 6 are Non-Executive Directors including 5 Independent Directors.
The annual accounts of MVSC along with the related detailed information, is available for inspection by the members at the Registered Office of your Company during business hours, up to the date of the Annual General Meeting. The copies of the audited accounts of MVSC can be sought by any member by making a written request addressed to the registered office.
M.V. Shoe Care Private Limited (MVSC), a Joint Venture, wherein your Company holds 49% of Equity Shares, has reported Gross Sales of ₹ 14.32 Crores as compared to Gross Sales of ₹ 26.56 crores during the previous year, a degrowth of 46.08% and Loss of ₹ 1.43 Crores for the year under review compared to Profit after Tax of ₹ 2.03 crores in the previous year, a degrowth of 170.44%.
Pursuant to Section 129(3) of the Companies Act, 2013 read with Rule 5 of the Companies (Account) Rules, 2014, a separate statement containing the salient features of the financial statement of MVSC in the prescribed format, AOC - 1 is also attached as per Annexure - 2 of this Report.
12. JOINT VENTURE
During the Financial Year 2020-21, Metmill has appointed two Independent Directors, constituted Audit Committee, Nomination and Remuneration Committee, and Corporate Social Responsibility Committee of the Board and is in the process of dematerialization of Equity Shares of the Company.
The Management Discussion and Analysis Report has been presented as Annexure – 1 forming a part of this Annual Report.
11. SUBSIDIARY COMPANY
Pursuant to Section 129(3) of the Companies Act, 2013 read with Rule 5 of the Companies (Account) Rules, 2014 a separate statement containing the salient features of the financial statement of 'Metmill' in the prescribed format, AOC - 1 is attached as per Annexure - 2 of this Report.
The Audited Consolidated Financials (CFS) of your Company for the Financial Year ended 31st March, 2021 prepared in compliance with the provisions of IND AS 27 issued by the Institute of Chartered Accountants of India (ICAI) and notified by the Ministry of Corporate Affairs (MCA), Government of India also forms part of this Annual Report.
10. MANAGEMENT DISCUSSION AND ANALYSIS REPORT
Metmill Footwear Private Limited (Metmill) (a 51% subsidiary of your Company) has reported Gross Sales of ₹ 56.75 Crores as compared to Gross Sales of ₹ 205.02 crores during the previous year, a degrowth of 72.32% with a loss of ₹ 10.21 Crores for the year under review compared to Profit after Tax of ₹ 9.47 crores in the previous year, a degrowth of 207.81%.
We welcome all incoming directors to the Board.
Mr. Subhash Malik (DIN: 08079949) has retired from the position of Director w.e.f. 26th November, 2020. Mr. Malik was
Ms. Aziza R. Malik (DIN: 00167534) has retired from the position of Whole-time Director w.e.f. 26th November, 2020. Ms. Malik was functioning as a Whole Time Director of the Company since 1986 and actively involved in the sourcing of shoes and accessories since last 34 years. She has played a crucial role in the progress of the Company over the years. Her retirement is a great loss to the Company. However, the Company has been availing her services in the sourcing of products and other business operations of the Company though she has retired as a Director of the Company.
Resignation / Retirement:
Mr. Manoj Maheshwari and Ms. Aruna Advani have been re-appointed as Independent Directors in the Annual General Meeting of the Company held on 17th September, 2020, for a further period of 5 years w.e.f. 6th February, 2020.
Re-appointment:
Mr. Srikanth Velamakanni has been appointed as an Independent Director in the Board Meeting held on 25th March, 2021. He is the co-founder, Group Chief Executive and Executive Vice Chairman of Fractal, one of the leading players in artificial intelligence and digital transformation. He completed his B.Tech. in Electrical Engineering from the Indian Institute of Technology (IIT), Delhi and holds an MBA in Management, Finance and Marketing Degree from Indian Institute of Management (IIM), Ahmedabad.
Mr. Iqbal Dossani has been appointed as an Additional Director in the Board Meeting held on 26th November, 2020. He completed his graduation from University of Mumbai in Financial Accounting and Auditing and currently pursuing HarvardX from EdX Inc. He has also completed the Leadership Orientation Program from National Council for India, Aga Khan Development Network (AKDN). With more than 15 years of experience in senior management, he is an active volunteer at AKDN and is the Chairman of Aga Khan Social Welfare Board.
Appointment:
10

After serving 18 years into the Company, Mr. Jaiprakash J. Desai (PAN: AEGPD3198E; ICSI membership Number: A7411) retired on 26th November, 2020 from his position of Company Secretary and CFO due to superannuation. The Board of Directors places on record their appreciation for the services rendered by Mr. Desai for the Company.
(appointed w.e.f. 25th March, 2021) 1 - - - -
14. RETIREMENT / APPOINTMENT OF CEO, CFO AND COMPANY SECRETARY
ATTENDANCE OF DIRECTORS AT BOARD AND COMMITTEE MEETINGS AND NUMBER OF MEETINGS ATTENDED BY EACH DIRECTOR:
The Board met 4 times during the year under review on 30th July, 2020, 26th November, 2020, 28th January, 2021 and 25th March, 2021. The maximum gap between any two Board Meetings was less than one hundred and twenty days, except the first Board Meeting of the Financial year under review pursuant to relaxation provided by Ministry of Corporate Affairs in view of COVID-19 outbreak. The Number of meetings attended by each Director at Board and Committee meetings held during the year under review is as follows:
Your Company has received declarations from the Independent Directors of your Company confirming that they meet the criteria of independence as prescribed under section 149(6) and Schedule IV of the Companies Act, 2013.
In accordance with the provisions of the applicable Act, the Articles of Association of your Company and Subscription and Shareholders Agreement, amended from time to time, Ms. Farah Malik Bhanji (DIN: 00530676) and Mr. Utpal Sheth (DIN: 00081012), Directors, retire by rotation at the ensuing Annual General Meeting and being eligible offer themselves for re-appointment. The Board recommends their re-appointment.
It is proposed to renew the appointment of Mr. Rafique A. Malik (DIN: 00521563), Chairman, Ms. Farah Malik Bhanji (DIN: 00521563), Managing Director, Mr. Arvind Kumar Singhal (DIN: 00709084) for a further period of 5 years with effect from 1st April, 2022, in the upcoming Annual General Meeting.
The Board of Directors places on record their appreciation for the immense contributions by all the outgoing directors in the growth of the Company.
Mr. Karan Singh (DIN: 00901342) has resigned from the position of Independent Director w.e.f. 25th March 2021 due to preoccupation. Mr. Singh was an Independent Director of the Company since 9th March, 2017. He brought fresh perspectives to the directors of the Company.
Mr. Rakesh Jhunjhunwala (DIN: 00777064) has resigned from the position of Director w.e.f. 25th March 2021 due to his commitments in his investing business and various charitable initiatives. Mr. Jhunjhunwala was a Director of the Company since 14th March 2007. He has always been highly valuable to the Board of Directors of the Company.
associated with the Company for more than 40 years.
(resigned w.e.f. 25th March, 2021) 4 - - -
Mr. Srikanth Velamakanni
Mr. Vikas Khemani 3 - - - 0
(retired w.e.f. 26th November, 2020) 2 - - - - Mr. Subhash Malik
(resigned w.e.f. 25th March, 2021) 3 - - - 0
Mr. Karan Singh
Mr. Arvind Kumar Singhal 4 - - 3 1
Ms. Aruna Advani 4 4 3 - 1
Mr. Manoj Kumar Maheshwari 4 4 3 - 1
Mr. Utpal Sheth 4 - - - -
Mr. Rakesh Jhunjhunwala
(retired w.e.f. 26th November, 2020) 2 - - - -
Ms. Aziza R. Malik
(appointed w.e.f. 26th November, 2020) 2 - - - -
Mr. Mohammed Iqbal Hasanally Dossani
Ms. Farah Malik Bhanji 4 4 - 3 -
Mr. Rafique Malik 4 - 3 3 -
Meetings Held 4 4 3 3 1
Name of the Director Board Meeting
Audit Committee
Meeting
Nomination, Remuneration
and Compensation
Committee Meeting
Corporate Social
Responsibility Committee
Meeting
Independent Directors' Meeting
11

The Company has appointed Mr. Nissan Joseph as the Chief Executive Officer of the Company, effective July 1, 2021. Mr. Joseph joins the Company from MAP Active & Planet Sports Inc. in the Philippines, a lifestyle retailer in Southeast Asia, where he was CEO since March 2020. Holding a master’s degree in business administration from the University of Western Sydney, he has in the past worked with Payless Shoes Pty Ltd and Hickory Brands, Inc. He has also spent over five years in key roles in Crocs, where he also worked with the Company. Nissan brings to the Company an experience of 20 years in retail and brand management.
Mr. Kaushal Parekh (PAN: AJYPP0331L; ICAI Membership Number: 120153) has been appointed as the Chief Financial Officer of the Company). Mr. Parekh is a Chartered Accountant and Company Secretary by qualification with more than 20 years of experience in Accounts, Finance, Treasury, Taxation, Stock / Inventory control and Audit. Mr. Parekh has been associated with the Company since March 2012 and prior to his appointment, was holding position of Vice President - Finance and Business Processes in the Company. The Board welcomes Mr. Parekh to his new position.
15. KEY MANAGERIAL PERSONNEL:
Ms. Tarannum Bhanpurwala (PAN: BPCPB4583H; ICSI Membership Number: A42872) has been appointed as a Whole time Company Secretary of the Company. Ms. Tarannum Bhanpurwala is a qualified Company Secretary and has completed LL.B. (General) and Master of Commerce from University of Mumbai. She had joined the Company as Company Secretary - Management Trainee in March,2014 and prior to her appointment, was holding position of Deputy Company Secretary in the Company. The Board welcomes Ms. Bhanpurwala to her new position.
1. Mr. Rafique A. Malik (Chairman) (DIN: 00521563)
On recommendation of Nomination, Remuneration and Compensation Committee, the Board of Directors, in its meeting held on 26th November 2020 has re-designated the following persons as Key Managerial Personnel:
2. Ms. Farah Malik Bhanji (Managing Director & CEO) (DIN: 00530676)
3. Mr. Mohammed Iqbal Hasan ally Dossani (Whole-time Director) (DIN: 08908594)
4. Ms. Alisha Malik (Vice President – E-Commerce) (PAN: AKUPM8942M)
A separate meeting of the Independent Directors was held on 25th March 2021, without the attendance of non-independent Directors and members of the management. All Independent Directors, except Mr. Karan Singh and Mr. Vikas Khemani, attended the said meeting.
5. Ms. Sohel Kamdar (Chief Operating Officer) (PAN: AGEPK5670L)
6. Mr. Kaushal Parekh (Chief Financial Officer) (PAN: AJYPP0331L)
7. Ms. Tarannum Bhanpurwala (Company Secretary) (PAN: BPCPB4583H)
16. METRO STOCK OPTION PLAN 2008 (ESOP 2008):
In september’2008. the Company had implemented an ESOP plan ‘Metro Stock Option Plan 2008’ (“ESOP 2008”/ “Plan”) for its employees. The plan was last amended in September’2014 with its tenure expiring in September 2020. Since then, there have been significant regulatory changes in the Companies Act and Rules thereunder, it was considered expedient to update the Plan with a view to align it with these regulatory changes. Accordingly, The Nomination, Remuneration and Compensation Committee and the Board of Directors have approved the amendments to the ESOP 2008 and the approval of the members was obtained in the Annual General Meeting held on 17th September 2020.
17. GENERAL MEETINGS
Annual General Meeting
The 43rd Annual General Meeting of the members of the Company was held on 17th September, 2020, through Video Conference pursuant to the Circular No. 14/2020 dated April 08, 2020, Circular No.17/2020 dated April 13, 2020 issued by the Ministry of Corporate Affairs ("MCA") followed by Circular No. 20/2020 dated May 05, and all other relevant circulars issued from time to time (collectively referred to as “MCA Circulars”) to approve Financial Statements and other matters. All the Whole-time Directors were present in the meeting.
Extra-ordinary General Meeting
In addition, the Company held an Extra-ordinary General Meeting on 21st June, 2021, through Video Conference pursuant to MCA Circulars, at short notice after taking consent from members of the Company representing 99.51% of the paid-up share capital of the Company, to confirm and approve managerial remuneration. All the Whole-time Directors were present in the meeting.
The Company held an Extra-ordinary General Meeting on 30th March 2021, through Video Conference pursuant to MCA Circulars, at short notice after taking consent from members of the Company representing 99.55% of the paid-up share capital of the Company, to approve sub-division of the face value of Equity Share Capital, alteration of clause V of Memorandum of Association and to raise capital through an Initial Public Offering of Equity Shares of the Company. All the Whole-time Directors were present in the meeting.
18. PERFORMANCE EVALUATION OF THE DIRECTORS AND THE BOARD
The Chairman had organized the evaluation process as per the provisions of Section 178(2) of the Companies Act, 2013. The
12

Board reviewed the performance of the Board of Directors as a whole, Managing Director, Whole Time Directors, Non-Executive and Independent Directors, Committees, and the Chairman as per the evaluation reports placed at the meeting.
19. COMMITTEES OF THE DIRECTORS
Members Mr. Manoj Kumar Maheshwari, Independent Director
Your Company has following committees of the Directors as per the provisions of the Companies Act as on 31st March, 2021:
AUDIT COMMITTEE
Ms. Farah Malik Bhanji, Managing Director and CEO, and
Meetings The Committee met three times during the year under review on the following dates:
Policy The Nomination, Remuneration and Compensation Policy of the Company is available at the website of the Company at: https://metrobrands.com/corporate-governance/
iii. 25th March, 2021
ii. 26th November, 2020
The Company Secretary acts as a Secretary to the Committee.
i. 30th July, 2020
Re- Due to resignation of Mr. Rakesh Jhunjhunwala, former Director, the Nomination, Remuneration and Compensation Committee was re-constituted in the Board Meeting held on 25th March, 2021.
iv. 25th March, 2021
Mr. Manoj Kumar Maheshwari, Independent Director.
Mr. Utpal Sheth, Director and
Mr. Rafique Malik, Chairman of the Company,
Members Ms. Aruna Advani, Independent Director
NOMINATION, REMUNERATION AND COMPENSATION COMMITTEE
• M/s. Aneja Assurance Private Limited, Internal Auditors are also invited to represent quarterly reports in the meetings of the Audit Committee
iii. 28th January, 2021 and
ii. 26th November, 2020
i. 30th July, 2020
Meetings The Committee met four times during the year under review on the following dates:
Invitees • The Chief Financial Officer, Chief Operating Officer and Head – Internal Audit are permanent invitees to the Meetings of the Committee.
The Company Secretary acts as a Secretary to the Committee.
Ms. Aruna Advani, Independent Director
CORPORATE SOCIAL RESPONSIBILITY (CSR) COMMITTEE
Members Mr. Rafique Malik, Chairman of the Company
Ms. Farah Malik Bhanji, Managing Director and CEO
Mr. Arvind Kumar Singhal, Independent Director
The Company Secretary acts as a Secretary to the Committee. Mr. Aziz Fidai, Deputy General Manager - CSR & Process Assurance act as an invitee to the Committee Meeting.
Meetings The Committee met three times during the year under review on the following dates:
i. 30th July, 2020
ii. 28th January, 2021 and
iii. 25th March, 2021
CSR Policy Your Board of Directors has amended CSR policy of the Company pursuant to recent amendment pertaining to CSR activities.
Stakeholders may find the CSR Policy at: https://metrobrands.com/corporate-governance/
Annual The Annual report on CSR activities undertaken during the year under review has been annexed and on forms part as per Annexure - 3 of this Report report
CSR activities
constitution
13
20. RELATED PARTIES TRANSACTIONS
All related party transactions that were entered during the Financial Year were at arm's length relationship and were in ordinary course of business. These transactions were approved by the Audit Committee and the Board.
The Particulars of contracts or arrangements with related parties referred to in Section 188 (1) of the Companies Act 2013 for the Financial Year 2020-21 in the prescribed format, AOC - 2 are provided in Annexure - 4 to this Report.
21. LOANS, GUARANTEES AND INVESTMENTS
The Particulars of loans, investments or guarantees covered under the provision of Section 186 of the Companies Act, 2013 are provided in Annexure - 5 to this Report.
22. RISK MANAGEMENT
Your Company has an elaborate Risk Management procedure and has the Risk Management Policy in place to identify the risks including those which in the opinion of the Board may threaten the existence of the Company, monitor the risks and their mitigating actions.
Risk management process has been established across the Company and is designed to identify, assess and frame a response to threats that affect the achievement of its objectives. Further it is embedded across all the major functions and revolves around the goals and objectives of the organization. The key risks are also discussed at the Audit Committee meetings. The Board has set out a review process so as to report to the Board the progress on the initiatives for the major risks of the Company.
During the year under review, Risk Officer of your Company had reviewed risk assessment of Company's operations in discussion with various stakeholders and updated the Risk Register accordingly. The risks arising out of pandemic Covid-19 have also been reviewed and steps taken to address those risks.
23. INTERNAL FINANCIAL CONTROLS AND SYSTEMS
Your Company's internal control systems are commensurate with the nature of its business and the size and complexity of operations. These controls ensure safeguarding of the assets of the Company and deviations if any are reported for appropriate action.
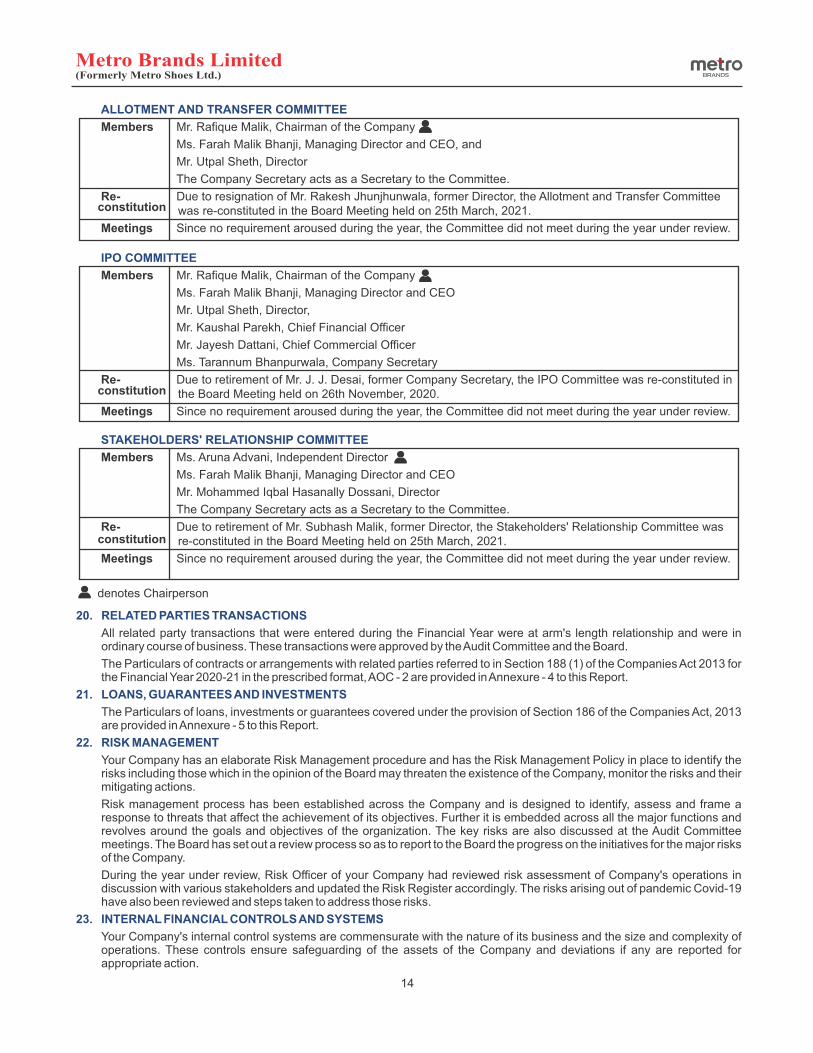
ALLOTMENT AND TRANSFER COMMITTEE
Members Mr. Rafique Malik, Chairman of the Company
Ms. Farah Malik Bhanji, Managing Director and CEO, and
Mr. Utpal Sheth, Director
The Company Secretary acts as a Secretary to the Committee.
Re- Due to resignation of Mr. Rakesh Jhunjhunwala, former Director, the Allotment and Transfer Committee was re-constituted in the Board Meeting held on 25th March, 2021.
Meetings Since no requirement aroused during the year, the Committee did not meet during the year under review.
constitution
IPO COMMITTEE
Members Mr. Rafique Malik, Chairman of the Company
Ms. Farah Malik Bhanji, Managing Director and CEO
Mr. Utpal Sheth, Director,
Mr. Kaushal Parekh, Chief Financial Officer
Mr. Jayesh Dattani, Chief Commercial Officer
Ms. Tarannum Bhanpurwala, Company Secretary
Re- Due to retirement of Mr. J. J. Desai, former Company Secretary, the IPO Committee was re-constituted in the Board Meeting held on 26th November, 2020.
Meetings Since no requirement aroused during the year, the Committee did not meet during the year under review.
constitution
STAKEHOLDERS' RELATIONSHIP COMMITTEE
Members Ms. Aruna Advani, Independent Director
Ms. Farah Malik Bhanji, Managing Director and CEO
Mr. Mohammed Iqbal Hasanally Dossani, Director
The Company Secretary acts as a Secretary to the Committee.
Re- Due to retirement of Mr. Subhash Malik, former Director, the Stakeholders' Relationship Committee was re-constituted in the Board Meeting held on 25th March, 2021.
Meetings Since no requirement aroused during the year, the Committee did not meet during the year under review.
denotes Chairperson
constitution
14

Internal audit reports are discussed in the Audit Committee meetings to review adequacy and effectiveness of your Company's internal control environment and necessary action are taken to strengthen the control in the required areas of business operations. The process is in place to monitor the implementation of audit recommendations, including those relating to strengthening of your Company's risk management policies and systems.
The control criteria ensures the orderly and efficient conduct of the Company's business, including adherence to its policies, the safeguarding of its assets, the prevention and detection of frauds and errors, the accuracy and completeness of the accounting records and the timely preparation of reliable financial information.
Based on the assessment carried out by the Management and the evaluation of the results of the assessment, the Board of Directors are of the opinion that the Company has adequate Internal Financial Controls system that is operating effectively as at 31st March, 2021.
There were no instances of fraud which necessitates reporting of material misstatement to the Company's operations.
24. GENERAL
The Directors state that no disclosure or reporting is required in respect of the following items as there were no transactions / matters on these items during the year under review:
i. Details relating to deposits covered under Chapter V of the Act.
ii. Issue of equity shares with differential rights as to dividend, voting or otherwise.
iii. Neither the Managing Director nor the Whole-time Director of your Company received any remuneration or commission from any of its subsidiaries.
iv. No significant or material orders were passed by the Regulators or Courts or Tribunals which impact the going concern status and Company's operations in future.
25. POLICY ON PREVENTION OF SEXUAL HARASSMENT AT WORK PLACE
The company has in place a Policy for prevention of Sexual Harassment at the Workplace in line with the requirements of the Sexual Harassment of Women at the Workplace (Prevention, Prohibition & Redressal) Act, 2013. Internal Complaints Committee (ICC) has been set up to redress complaints received regarding sexual harassment. All employees (permanent, contractual, temporary, trainees) are covered under this policy. During the year under review no complaint was received.
26. AUDITORS
Statutory Auditor:
Pursuant to Section 139, 142 and other applicable provisions of the Companies Act, 2013 (the Act) and the Rules made thereunder, (including any statutory modification(s) or re-enactment thereof for the time being in force), M/s. Deloitte Haskins & Sells, Chartered Accountants, (Regn. No. 117365W) who are statutory auditors of your Company, were appointed for a period of 3 years and holds office till the conclusion of the 45th Annual General Meeting of the Company.
Internal Auditor:
M/s. Aneja Assurance Private Limited (Chartered Accountants) are the Internal Auditors of the Company for the year under review.
Secretarial Auditor:
CS A. Sekar, Practicing Company Secretary (COP No. 2450) is the Secretarial Auditor of the Company for the past 6 years and has been re-appointed for the year under review.
27. AUDITORS REPORT
The Auditors' Reports prepared by the Statutory Auditors both in respect of Standalone Financial Statement and Consolidated Financial Statement do not contain any qualification, reservation or adverse remark.
28. COST AUDIT
As per the Companies (Cost Records and Audit) Rules, 2014, your Company does not fall under any of the classes of companies prescribed in the Act. Hence as specified under Section 148(1) of the Companies Act, 2013, your Company is not required to include cost records in their books of account and get its cost accounting records audited by a Cost Accountant and submit a compliance report in the prescribed form.
29. SECRETARIAL AUDIT REPORT
Mr. A. Sekar, Practicing Company Secretary, was appointed as a Secretarial Auditor to conduct Secretarial Audit of the records and documents for the Financial Year 2020-21. The Secretarial Audit Report confirms that your Company has complied with the provisions of the Act, Rules, Regulations, Guidelines, Standards, etc. and do not contain any qualification, reservation or adverse remark.
The Secretarial Audit Report for the financial year ended March 31, 2021 is annexed marked as Annexure - 6 to this Report.
30. COMPLIANCE WITH SECRETARIAL STANDARDS
As per paragraph 9 of Secretarial Standard on Meetings of the Board of Directors (SS-1), the Company has complied with all the provisions of the applicable Secretarial Standards.
31. PARTICULARS OF EMPLOYEES
The statement containing information forming part of this Directors Report is provided in the Annexure – 7 to this Report.
15
32. CONSERVATION OF ENERGY, TECHNOLOGY ABSORPTION, FOREIGN EXCHANGE EARNINGS AND OUTGO
The information required under Section 134 of the Companies Act, 2013 read with the Companies (Accounts) Rules, 2014 for conservation of energy, technology absorption, foreign exchange earnings and outgo is provided as Annexure – 8 to this Report.
33. CORPORATE GOVERNANCE AND DISCLOSURES
Your Company being unlisted, is not required to furnish any information about Corporate Governance under clause 49 of the listing agreements with the Stock Exchange. Your Company has provided mandatory disclosures required under Companies Act, 2013 by this Report and attachments as under.
Annexure – 4: Particulars of contracts / arrangements made with the related parties
Annexure – 8: Conservation of energy, technology absorption, foreign exchange earnings and outgo
Annexure – 6: Secretarial Audit Report
35. DIRECTORS' RESPONSIBILITY STATEMENT
Annexure –1: Management Discussion and Analysis Report
Annexure – 5: Particulars of loans, investments or guarantees.
Annexure – 3: CSR Report
b) the Directors had selected such accounting policies and applied them consistently and made judgments and estimates that are reasonable and prudent so as to give a true and fair view of the state of affairs of your Company as on 31st March 2021 and of the profits of your Company for the period ended 31st March 2021;
Annexure –2: Statement containing the salient features of the financial statement of 'Metmill' (Subsidiary Company) and MVSC (Associate Company)
Following reports have been annexed and form the part of this report.
Annexure – 7: Particulars of employees
Your Company believes in the conduct of affairs in a fair and transparent manner with the highest standards of professionalism, honesty, integrity and ethics. The Vigil Mechanism as envisaged in the Companies Act 2013 the Rules prescribed thereunder is implemented through the Company's Vigil Mechanism / Whistle Blower Policy, as adopted by the Board, to enable the Directors, employees and all stakeholders of the Company to report to the management, instances of unethical behavior, actual or suspected fraud or violation of your Company's Ethics Policy, to provide for adequate safeguards against victimization of persons who use such mechanism and make provision for direct access to the Ethics Officer and Chairman of the Audit Committee. Concerned persons may send mail to [email protected] in or call this number: 8928009932.
34. VIGILANCE MECHANISM
a) in the preparation of the annual accounts for the year ended 31st March 2021, the applicable accounting standards had been followed.
Pursuant to the requirements of Section 134 of the Companies Act, 2013 it is hereby confirmed that,
DATED: June 25, 2021PLACE: Mumbai
Rafique A. MalikSd/-
Chairman
e) the Directors had devised proper systems to ensure compliance with the provisions of all applicable laws and that such systems were adequate and operating effectively.
FOR AND ON BEHALF OF THE BOARD OF DIRECTORS
The Directors deeply regret the loss of life caused due to the outbreak of COVID-19 and are grateful to every person who risked their life and safety to fight this pandemic.
Most importantly, your Directors acknowledge the support and dedication of all the employees of your Company and also wish to express their gratitude to the Members for their continued support. Your support is our driving force and makes us want to do our best together under present challenging time.
Your Directors would like to thank the Customers, Suppliers, Banks and other Stakeholders for overwhelming trust and confidence reposed in the Company that helped us to maintain the growth even during this difficult time.
36. ACKNOWLEDGEMENTS
d) the Directors had prepared the annual accounts for the period ended 31st March, 2021 on a going concern basis.
c) the Directors had taken proper and sufficient care for the maintenance of adequate accounting records in accordance with the provisions of the Act for safeguarding the assets of your Company and for preventing and detecting fraud and other irregularities.
16


The Premium & affordable fashion stores had significant share of 73.8% followed by Crocs stores 15%, Value line stores 4.4%, Ecommerce 6% and Raw materials 0.4%.
On a standalone basis, your Company clocked Gross Turnover of ` 919.43 crore , a de-growth of 34.9% for the year. The Covid pandemic has had an adverse impact on the company’s sales and operations. In spite of fall in sales, the cost saving measures undertaken by the company during the year viz. negotiation in rentals, fit-outs costs, packing & admin costs and other discretionary costs, has enabled the company to achieve positive bottomline.
Business review
Fiscal 2021 has been a challenging year for the Indian economy, which was already experiencing a slowdown before the pandemic created the 'perfect storm'. India's economy contracted 7.3% as lockdowns and other containment efforts to control COVID-19 slashed domestic consumption without halting the spread of the disease despite drastic fiscal and monetary stimulus. After contracting in the first half because of the Covid-19 pandemic, the economy rebounded in the second half, growing 0.5% and 1.6% on-year in the third and fourth quarters, respectively. While the economy shrank as a whole in fiscal 2021, agriculture and allied activities, and electricity, gas, water supply and other utility services were the outliers, logging positive growth. On the other hand, the contact-intensive trade, hotels, transport and communication sectors, and services related to broadcasting were hit the most and continued to shrink in all the quarters. Construction – a labor-intensive sector – was also severely hit in the first half but rebounded in the second half. Though there has been some pick-up in recent months, recovery is weak. And indeed, the scars of the pandemic continue to run deep for small businesses, the urban poor and most of the services sector. The gains made by the economy in the fourth quarter of fiscal 2021 seem to have fizzled out in the first quarter of fiscal 2022 because of the fierce second wave of Covid-19, leading to localized lockdowns in most states. The second wave suggests the pandemic remains an ongoing risk. India's second wave has wreaked havoc, daily cases crossing a staggering 3 lakh in the week through April 25. India's daily infections recorded the highest number of cases in a single day among countries worldwide, and daily deaths crossed the peak of the first wave. India is getting back on its feet slowly, with divergent growth trends. Domestic demand will be required to be supported by continued monetary and fiscal stimulus. Economy is expected to have a gradual recovery as consumer sentiment remains weak on pandemic-related uncertainties. We expect economic recovery to gain momentum from H2 (2021) as we see vaccination ramp up and the resultant control of the pandemic lifting consumer and business confidence. Indian economy will surely benefit from policy support including higher spending on infrastructure, rural development, health and a stronger than expected recovery in services and manufacturing. Good monsoon all over the country will play as a booster for the rural economy. CRISIL forecasts India's GDP growth to rebound to 9.5% in fiscal 2022.
Indian Economy
Global challenges remained in 2020 as well. According to the UN report, in 2020, the world economy shrank by 4.3 per cent, over two and half times more than during the global financial crisis of 2009. Developed economies shrank the most in 2020, by 5.6 per cent, due to economic shutdowns and subsequent waves of the pandemic increasing the risk of premature austerity measures that would only derail recovery efforts globally. Developing countries saw a less severe contraction at 2.5 per cent. The COVID-19 crisis has wreaked havoc on labor markets in the developing world. By mid-2020, unemployment rates had quickly escalated to record highs. 131 million more people were pushed into poverty in 2020, many of them women, children and people from marginalized communities. The pandemic has adversely affected women and girls disproportionately, exposing them to increased risk of economic devastation, poverty, violence and illiteracy. Women make up more than 50 per cent of the workforce in high-risk labor and service intensive sectors, such as retail, hospitality and tourism - areas hardest hit by the lockdown. Many of them have limited or no access to social protection. Massive and timely stimulus measures prevented a total collapse of the world economy and averted a Great Depression. However, stark disparity in the size of the stimulus packages rolled out by developed and developing countries will put them on different trajectories of recovery. The stimulus spending per capita by the developed countries has been nearly 580 times higher than those of the least developed countries (LDCs) although the average per capita income of the developed countries has been only 30 times higher than that of the LDCs. The drastic disparity underscores the need for greater international solidarity and support, including debt relief, for the most vulnerable group of countries. According to the report, global trade shrank by an estimated 7.6 per cent in 2020 against the backdrop of massive disruptions in global supply chains and tourism flows. Lingering trade tensions between major economies and stalemates in multilateral trade negotiations were already constraining global trade before the pandemic. The modest recovery of 4.7 per cent expected in 2021 would barely offset the losses of 2020. Developed economies, projected to see a 4 per cent output growth whereas Developing countries are expected rebound of 5.7 per cent in 2021. In most economies, domestic demand will be supported by continued monetary and fiscal stimulus. The projections, however, are highly contingent on the successful containment of the Covid-19 virus, both domestically and abroad. With multiple waves of the pandemic threatening to trigger another round of widespread lockdowns, downside risks to the growth outlook remain high.
Global Economy
18
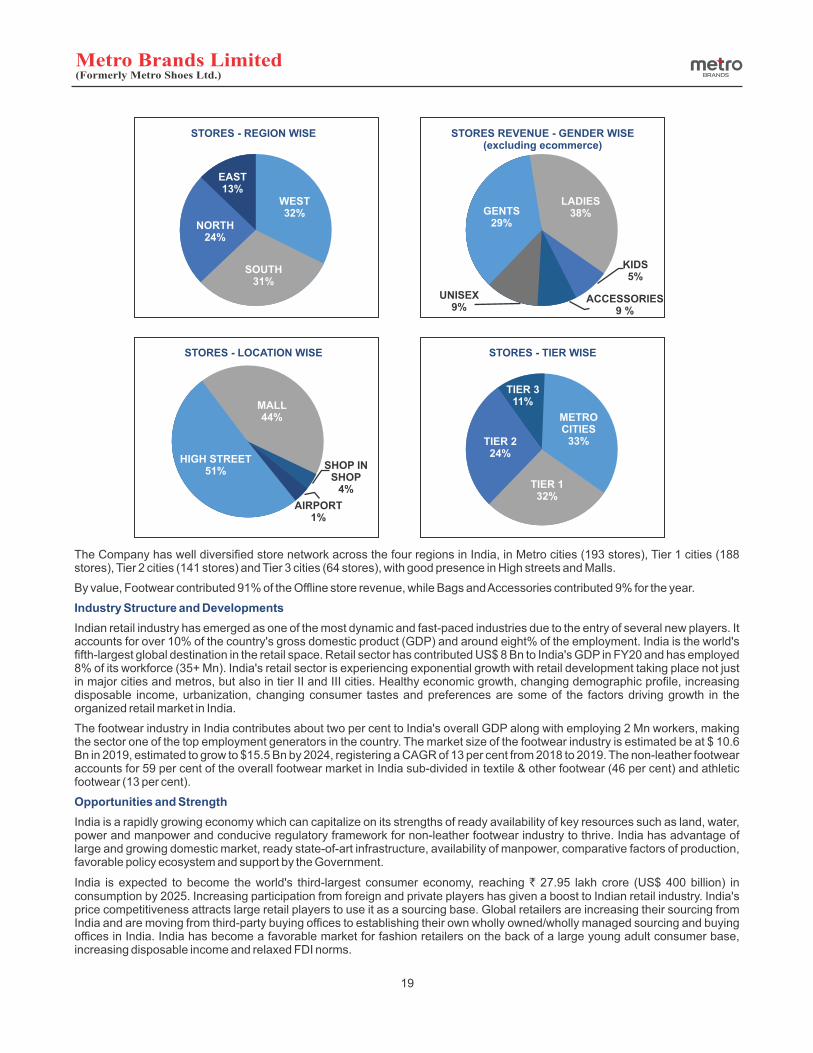
EAST13%
WEST32%
SOUTH31%
NORTH24%
STORES - REGION WISE STORES REVENUE - GENDER WISE(excluding ecommerce)
LADIES38%
UNISEX9%
GENTS29%
KIDS5%
ACCESSORIES9 %
India is expected to become the world's third-largest consumer economy, reaching ` 27.95 lakh crore (US$ 400 billion) in consumption by 2025. Increasing participation from foreign and private players has given a boost to Indian retail industry. India's price competitiveness attracts large retail players to use it as a sourcing base. Global retailers are increasing their sourcing from India and are moving from third-party buying offices to establishing their own wholly owned/wholly managed sourcing and buying offices in India. India has become a favorable market for fashion retailers on the back of a large young adult consumer base, increasing disposable income and relaxed FDI norms.
India is a rapidly growing economy which can capitalize on its strengths of ready availability of key resources such as land, water, power and manpower and conducive regulatory framework for non-leather footwear industry to thrive. India has advantage of large and growing domestic market, ready state-of-art infrastructure, availability of manpower, comparative factors of production, favorable policy ecosystem and support by the Government.
Opportunities and Strength
The footwear industry in India contributes about two per cent to India's overall GDP along with employing 2 Mn workers, making the sector one of the top employment generators in the country. The market size of the footwear industry is estimated be at $ 10.6 Bn in 2019, estimated to grow to $15.5 Bn by 2024, registering a CAGR of 13 per cent from 2018 to 2019. The non-leather footwear accounts for 59 per cent of the overall footwear market in India sub-divided in textile & other footwear (46 per cent) and athletic footwear (13 per cent).
Indian retail industry has emerged as one of the most dynamic and fast-paced industries due to the entry of several new players. It accounts for over 10% of the country's gross domestic product (GDP) and around eight% of the employment. India is the world's fifth-largest global destination in the retail space. Retail sector has contributed US$ 8 Bn to India's GDP in FY20 and has employed 8% of its workforce (35+ Mn). India's retail sector is experiencing exponential growth with retail development taking place not just in major cities and metros, but also in tier II and III cities. Healthy economic growth, changing demographic profile, increasing disposable income, urbanization, changing consumer tastes and preferences are some of the factors driving growth in the organized retail market in India.
Industry Structure and Developments
By value, Footwear contributed 91% of the Offline store revenue, while Bags and Accessories contributed 9% for the year.
The Company has well diversified store network across the four regions in India, in Metro cities (193 stores), Tier 1 cities (188 stores), Tier 2 cities (141 stores) and Tier 3 cities (64 stores), with good presence in High streets and Malls.
19
STORES - LOCATION WISE STORES - TIER WISE
METROCITIES
33%TIER 224%
MALL44%
HIGH STREET51%
AIRPORT1%
SHOP INSHOP
4%
TIER 311%
TIER 132%

The statements in this report describing the Company's plans, projections, estimates and expectations may constitute into “Forward Looking Statements” within the meaning of applicable laws and regulations. Actual results may differ materially from those expressed or implied.
Cautionary Statement
Your Company is recipient of - India's Retail Champions 2021 – a prestigious award presented by Bhartiya Mall of Bengaluru and supported by RAI (Retailers Association of India). This award is felicitated to the retail companies and brands that have constantly pushed the envelope to excel, innovate and stay relevant for the consumer.
Awards
Your Company will continue to maintain focus on freshness in its products by introducing different and innovative designs, delightful customer service, availability of best quality products, development of brands, store designs of international standards, inventory management and best use of the technology for business. The Company is confident of withstanding the competition as in the past and to emerge as a stronger player in the Industry.
E-commerce is expanding steadily in the country. Customers have the ever-increasing choice of products at the lowest rates. E-commerce is probably creating the biggest revolution in retail industry, and this trend is likely to continue in the years to come. Retailers should leverage digital retail channels (E-commerce), which would enable them to spend less money on real estate while reaching out to more customers all over the country.
Overall, long-term outlook for the industry looks positive, supported by rising income, favorable demographics, entry of foreign players, and increasing urbanization. Factors that make India so attractive include the second largest population in the world, a middle class of 600 mn people, increasing urbanization, rising household incomes, connected rural consumers and increasing consumer spending.
Outlook
Footwear priced up to ₹ 1,000 attract 5% GST whereas footwear priced above ₹ 1,000 attract higher rate of 18% GST. High tax rate is major concern in promoting growth of the industry and therefore the Industry is advocating for a uniform rate of 12% GST on all footwear.
Indian Government has prescribed a requirement to bear a BIS certification mark issued in terms of the Bureau of Indian Standards (Conformity Assessment) Regulations, 2018. The goods mentioned in the Notifications include rubber hawai chappal, rubber slippers, canvas shoes with rubber gum boots and ankle boots, rubber sole, canvas boots with rubber sole, derby shoes, etc. In terms of the Notifications, both domestic as well as imported goods are required to be certified by the Bureau of Indian Standards ('BIS'). Post implementation of this standard, a shoe manufacturer will not be able to sell any footwear if it does not comply with the abovesaid regulations. The Footwear Industry needs time to be ready and be compliant with this standard and hence has sought some relaxation in the norms and extension of the effective timeline by at-least 6 months to gear up for the said requirement.
The ongoing coronavirus pandemic across the globe is severely affecting the growth of footwear market. Supply of raw material imports such as laces, shoe lining, ornaments, buckles, insoles, outsoles, cellulose board, shank board, form and packing material has adversely affected. There has been negative impact on export orders too as major markets of EU and USA were severely affected by the pandemic and closed down.
Threats and Concerns
Your Company has strength as a Specialty Branded Footwear Retailer with strong nationwide presence across all footwear segments and categories, having a brand appeal among aspirational consumer segments in the fast-growing footwear retail industry. Your Company has presence across multiple formats and offers a wide range of brands and products catering to all occasions across age groups and market segments resulting in strong customer loyalty. Your Company is a platform of choice for third party brands looking to expand in India.
As per report released by the Department for the promotion of Industry and Internal Trade (DPIIT) footwear sector has capacity to generate 250 jobs for every investment of INR 1 Crore. For every 1000 pairs produced and sold in India, the sector can create 425 jobs spanning manufacturing, allied Industries and retail. The footwear sector can create up to four Mn jobs in the next five years in India by imparting basic skills and creating blue collar jobs in a short span of time. Having significant potential this industry does not cause any harm to the environment nor adds pressure to existing resources such as land, water, energy.
In worldwide consumption terms, 86 per cent of global footwear consumption has become non-leather by volume. Leather is being constantly replaced by non-leather material due to increasing awareness about sustainability and leather being relatively more expensive material. Herein, lies a double-digit growth opportunity which India, the second largest producer and consumer of footwear in the world, is ready to tap into.
20
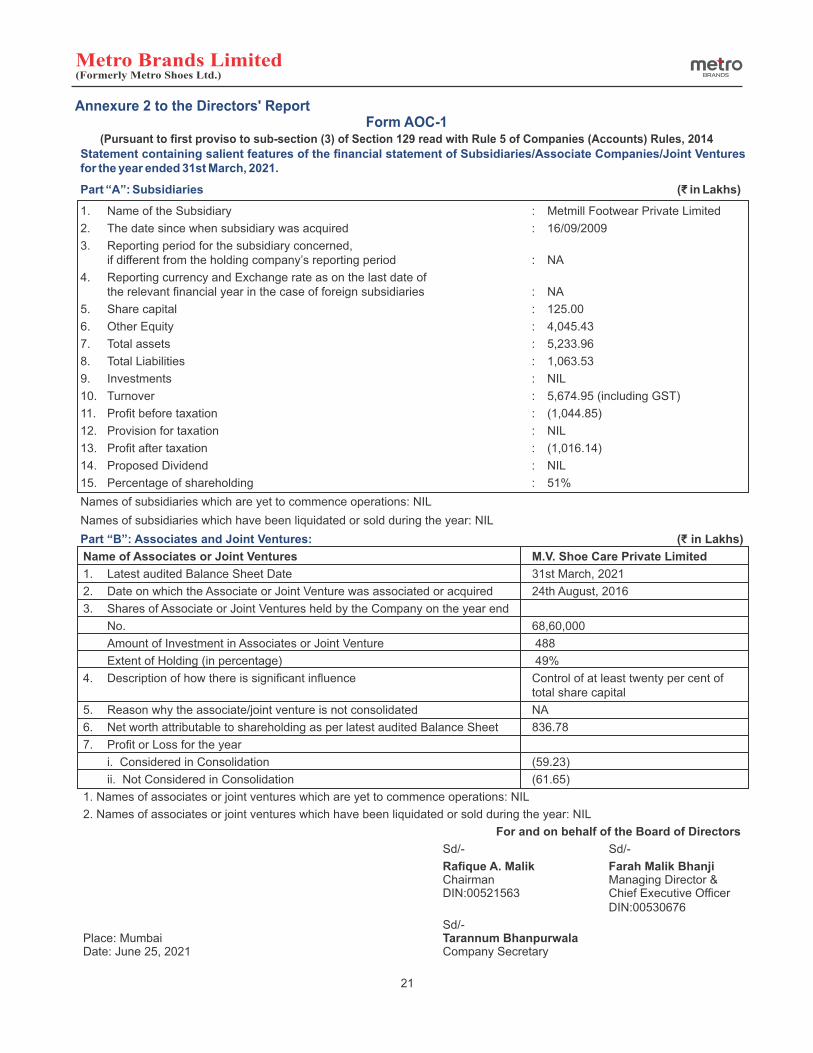
4. Description of how there is significant influence Control of at least twenty per cent of total share capital
5. Reason why the associate/joint venture is not consolidated NA
6. Net worth attributable to shareholding as per latest audited Balance Sheet 836.78
7. Profit or Loss for the year
i. Considered in Consolidation (59.23)
ii. Not Considered in Consolidation (61.65)
1. Names of associates or joint ventures which are yet to commence operations: NIL
2. Names of associates or joint ventures which have been liquidated or sold during the year: NIL
For and on behalf of the Board of Directors
Sd/- S d/-
13. Profit after taxation : (1,016.14)
Rafique A. Malik Farah Malik Bhanji Chairman Managing Director & DIN:00521563 Chief Executive Officer DIN:00530676
Sd/-
10. Turnover : 5,674.95 (including GST)
11. Profit before taxation : (1,044.85)
12. Provision for taxation : NIL
14. Proposed Dividend : NIL
15. Percentage of shareholding : 51%
Names of subsidiaries which are yet to commence operations: NIL
Names of subsidiaries which have been liquidated or sold during the year: NIL
Part “B”: Associates and Joint Ventures: (₹ in Lakhs)
Name of Associates or Joint Ventures M.V. Shoe Care Private Limited
1. Latest audited Balance Sheet Date 31st March, 2021
2. Date on which the Associate or Joint Venture was associated or acquired 24th August, 2016
3. Shares of Associate or Joint Ventures held by the Company on the year end
No. 68,60,000
Amount of Investment in Associates or Joint Venture 488
Extent of Holding (in percentage) 49%
4. Reporting currency and Exchange rate as on the last date of the relevant financial year in the case of foreign subsidiaries : NA
7. Total assets : 5,233.96
6. Other Equity : 4,045.43
3. Reporting period for the subsidiary concerned, if different from the holding company’s reporting period : NA
2. The date since when subsidiary was acquired : 16/09/2009
1. Name of the Subsidiary : Metmill Footwear Private Limited
Statement containing salient features of the financial statement of Subsidiaries/Associate Companies/Joint Ventures for the year ended 31st March, 2021.
5. Share capital : 125.00
Part “A”: Subsidiaries (₹ in Lakhs)
9. Investments : NIL
8. Total Liabilities : 1,063.53
Date: June 25, 2021 Company SecretaryPlace: Mumbai Tarannum Bhanpurwala
21

21
22
7. (a) Two percent of average net profit of the company as per section 135(5) : ̀ 406.38 Lakhs
6. Average net profit of the company as per section 135(5) : ̀ 20,319.08 Lakhs
4. Provide the details of Impact assessment of CSR projects carried out in pursuance of sub-rule (3) of rule 8 of the Companies Corporate Social responsibility Policy) Rules, 2014, if applicable (attach the report): NA
5. Details of the amount available for set off in pursuance of sub-rule (3) of rule 7 of the Companies (Corporate Social responsibility Policy) Rules, 2014 and amount required for set off for the financial year, if any
(c) Amount required to be set off for the financial year, if any : NIL
(b) Surplus arising out of the CSR projects or programs or activities of the previous financial years : NIL
3
8. (a) CSR amount spent or unspent for the financial year:
(d) Total CSR obligation for the financial year (7a+7b- 7c) : ̀ 406.38 Lakhs
1
TOTAL
2 NIL
1 Mr. Rafique Malik Chairman 3 3
3 Mr. Arvind Kumar Singhal Independent Director 3 3
2 Ms. Farah Malik Bhanji Managing Director 3 3 and CEO
iii. Mr. Arvind Kumar Singhal
i. Mr. Rafique Malik (Chairman),
ii. Ms. Farah Malik Bhanji,
3. Provide the web-link where Composition of CSR committee, CSR Policy and CSR projects approved by the board are disclosed on the website of the company: https://metrobrands.com/corporate-governance/
2. Composition of CSR Committee:
The objective of the CSR policy is to provide an appropriate roadmap and formulate the procedure and criteria for the Company to participate in organized and transparent manner in the CSR activities within the country while recognizing the interest of all its stakeholders and thereby support in building / strengthening the nation for the coming future. Stakeholders may find the CSR Policy at: https://metrobrands.com/corporate-governance/
1. Brief outline on CSR Policy of the Company: Through CSR, your company intends to serve the interests of the society by taking responsibility for the impact of all its activities on customers, employees, shareholders, communities, and the environment in all aspects of our operations. For your company, corporate social responsibility is not about just giving back randomly but about bringing benefits to all our stakeholders who are in need, including the environment, and community at large. To achieve this, in the current year we have strengthened our internal CSR team and have prepared a roadmap for engaging in the overall CSR activities as mentioned in the schedule VII of the companies act including but not limited to environment conservation, skilling and upliftment of footwear Karigar community at large.
Note – The company will transfer ̀ 110.21 Lakhs in PM Cares Fund on or before the time limit prescribed under second proviso to section 135(5) of the Companies Act 2013.
214.06 23.92 ̀ 58.19 29.04.2021 PM Cares Fund ̀ 110.21 Refer Note
Name of Director Designation /Nature of Directorship
Number of meetings of CSR Committee held during the year
Number of meetings of CSR Committee attended during the year
Financial Year Amount available for set-off from preceding financial years (in Rs)
Amount required to be set- off for the financial year, if any (in Rs)
Total Amount Spent for the
Financial Year.( in Lakhs.) `
Amount Unspent ( in Lakhs.) `
Total Amount transferred to Unspent CSR Account as per
section 135(6).
Total Amount Spent during
April 2021 pertaining to FY 20-21
( in Lakhs.) `
Amount transferred to any fund specified under Schedule VII as per second
proviso to section 135(5).
Amount Date of transfer Name of the Fund Amount Date of transfer

23
Supporting Railway station based shoe shiners
No Poverty
Name of the Project.
Item from the list of activities in Schedule VII to the Act.
Local area (Yes/No).
Project duration
Amount allocated
for the project ( In `
Lakhs).
(9) (10)
Amount spent in
the current
financial Year ( In `
Lakhs)
Amount spent in
April 2021
Pertaining to
current financial
year ( In `
Lakhs)
State District
Location of the project.
Amount trans-ferred
toUnspent
CSR Account for the project as per
Section 135(6) ( In `
Lakhs)
(11)
Mode of
Imple-ment-ation -Direct (Yes/No).
(12)
Mode of Implementation–
Through Implementing
Agency
Name CSRRegistr-
ation number
1 Yes Mahar-ashtra
Mumbai Ongoing 28.70 0.00 - 28.70 Yes Dentsu Comm-unica-tions India
Private Limited
Not applic-able
Co-processing discarded footwear in Eco-Friendly manner.
Climate action
2 Yes Mahar-ashtra
Mumbai Ongoing 25.96 0.00 8.42 17.55 Yes Ekatvam Plastic Recy-cling Servi-ces
Not applic-able
To distribute refurbished slippers to school children
Climate action
3 No Telan-gana
Nizam-abad
Ongoing 11.94 0.00 - 11.94 No Green-sole
Found-ation
CSR00003
279
To provide upper limbs who have lost it
Good Health and Well Being.
4 Hyder-abad
Ongoing 13.00 0.00 13.00 No Inali Found-ation
CSR00000965
No Telan-gana
0.00
To fund treatment cost of EWS patients
Good Health and Well Being.
5 Mumbai Ongoing 30.89 28.39 2.50 No Prince Aly
Khan Hospital
CSR00005415
Yes Mahar-ashtra
0.00
Total 110.49 28.39 23.92 58.19
(b) Details of CSR amount spent against ongoing projects for the financial year:

24
(b) Details of CSR amount spent against other than ongoing projects for the financial year:
Food Support forthe needy
Zero Hunger
Name of the Project.
Item from the list of activities in Schedule VII to the Act.
Local area (Yes/No).
Amount allocated
for the project ( In `
Lakhs).
State District.
Location of the project.
Mode of Implementation -Direct (Yes/No).
Mode of Implementation – Through Implementing Agency
Name CSR Registration number
1 Yes Mahar-ashtra
Mumbai 6.00 No Anfaal Foundation Not applicable
Educating needy girl children
Education2 Yes Mahar-ashtra
Karjat 3.40 No empowHER Foundation
(legally known as SKS Chakshu
Foundation)
Not applicable
Hospital Project Good Health and Well Being.
3 Yes Mahar-ashtra
Mumbai 65.00 No Cancare Trust Not applicable
Educating needy girl children
Education4 Yes Mahar-ashtra
Mumbai 19.95 No Fidai Girls Educational
Institute
Not applicable
Providing tablets to needy children
Education5 Yes Gujarat Vapi 33.01 No Focus Humanitarian
Assistance India
Not applicable
To find solution and treatment for Muscular Dystrophy
Good Health and Well Being
6 Yes 5.00 No Parent Project Muscular Dystrophy
Not applicableMahar-ashtra
Mumbai
Food Support for the needy
Zero Hunger7 Yes 20.00 No Salaam Bombay Foundation
Not applicableMahar-ashtra
Mumbai
Capacity Building Education8 Yes 5.00 No Social Entrepreneurs Foundation India,
Brand Name: UnLtd India
Not applicableMahar-ashtra
Mumbai
Safety gears for Health and community workers
9 Yes 18.11 No United Way Mumbai
Not applicableMahar-ashtra
MumbaiGood Health and Well Being
Footwear distribution for Migrants and Needy
10 Yes 0.00 No United Way Mumbai & Roatary Club of
Mumbai West
Not applicableMahar-ashtra
MumbaiReduced Inequalities
Total 175.47
(d) Amount spent in Administrative Overheads : ̀ 10.19 Lakhs
(e) Amount spent on Impact Assessment, if applicable : Not Applicable.
(f) Total amount spent for the Financial Year (8b+8c+8d+8e) : ̀ 237.98 Lakhs
(g) Excess amount for set off, if any

Sl. No. Particular Amount ( in Lakhs)`
(i) Two percent of average net profit of the company as per section 135(5) 406.38
(ii) Total amount spent for the Financial Year 237.98
(iii) Excess amount spent for the financial year [(ii)-(i)] NIL
(iv) Surplus arising out of the CSR projects or programmes or activities of the previous financial years, if any NIL
(v) Amount available for set off in succeeding financial years [(iii)-(iv)] NIL
25
9. (a) Details of Unspent CSR amount for the preceding three financial years:
Preceding Financial Year.
Amount transferred
to Unspent CSR Account under section 135 (6)
(in )`
Amount transferred to any fund specifiedunder Schedule VII as per section
135(6), if any.
Amount spent in the
reporting Financial
Year (in ).`
Amount remainingto be spent
in succeeding financial years.
(in )`
Name ofthe Fund
Amount (in ).`
Date of transfer.
1
2
3
TOTAL
-------NIL-------
(b) Details of CSR amount spent in the financial year for ongoing projects of the preceding financial year(s):
NA Prince Aly Khan
Hospital
Project ID. Name of the Project.
Financial Year inwhich the project was commenced
1 2019-2020
Project duration. Total amount allocated for the project
( In Lakhs).`
Amount spent on the project in
the reporting Financial Year ( In Lakhs).`
Cumulative amount
spent at the end of reporting Financial Year.
( In Lakhs)`
Status of the project -Completed/Ongoing
(9)
Ongoing 125.00 23.96 125.00 Completed
TOTAL 125.00 23.96 125.00
10. In case of creation or acquisition of capital asset, furnish the details relating to the asset so created or acquired through CSR spent in the financial year (asset-wise details).
(a) Date of creation or acquisition of the capital asset(s). – The work in progress for building the 93 bedded Cancer care hospital in Mumbai.
(b) Amount of CSR spent for creation or acquisition of capital asset. – 65 Lakhs`
(c) Details of the entity or public authority or beneficiary under whose name such capital asset is registered, their address etc.- A 508 Byculla Service Industries Premises CHS Ltd, Dadaji Kondev road, Byculla East Mumbai 4000027.
(d) Provide details of the capital asset(s) created or acquired (including complete address and location of the capital asset). - CS no 254 (part) of Mazgaon division, Barister Nath Pai Marg, Mazgaon Mumbai 400010.
11. Specify the reason(s), if the company has failed to spend two per cent of the average net profit as per section 135(5). – Not Applicable.
For and on behalf of the Board of Directors Sd/- Sd/- Ketan Vora Rafique A.Malik Farah Malik Bhanji Partner Chairman - Managing Director & Chief Executive Officer CSR Committee DIN:00521563 DIN:00530676 P lace: Mumbai
Date : June 25, 2021

Form for Disclosure of particulars of contracts/arrangements entered into by the company with related parties referred to in sub section (1) of section 188 of the Companies Act, 2013 including certain arm's length transaction under third proviso thereto.
1. Details of contracts or arrangements or transactions not at Arm's length basis.
SL. No. Particulars Details
a Name (s) of the related party & nature of relationship
b Nature of contracts/arrangements/transaction
c Duration of the contracts/arrangements/transaction
d Salient terms of the contracts or arrangements or transaction including the value, if any
e Justification for entering into such contracts or arrangements or transactions’
f Date of approval by the Board
g Amount paid as advances, if any
h Date on which the special resolution was passed in General meeting as required under first proviso to section 188
2. Details of contracts or arrangements or transactions at Arm's length basis.
(I) Appointment of Key Managerial Personnel
SL. Particulars DetailsNo.
a Name (s) of the related party & nature of relationship Mr. Rafique A. Malik (Chairman) (DIN: 00521563)
Ms. Farah Malik Bhanji (Managing Director & CEO) (DIN: 00530676)
Mr. Mohammed Iqbal Hasanally Dossani (Whole-time Director) (DIN: 08908594)
Ms. Alisha Malik (Vice President – E-Commerce and Marketing)
Ms. Sohel Kamdar (Chief Operating Officer)
Mr. Kaushal Parekh (Chief Financial Officer)
Ms. Tarannum Bhanpurwala (Company Secretary)
b Nature of contracts/arrangements/transaction Appointment of Key Managerial Personnel
c Duration of the contracts/arrangements/transaction As per terms of appointment
d Salient terms of the contracts or arrangements Appointment of Key Managerial Personnel as per or transaction including the value, if any section 2(51) of the companies Act, 2013
e Date of approval by the Board 26th November, 2020
f Date of approval by members NA
g Amount paid as advances, if any NIL
NIL
21
26

(II) Renewal of Omnibus approval for Related Party Transactions – Metmill Footwear Private Limited - Subsidiary Company:
SL. Particulars DetailsNo
a Name (s) of the related party & nature of relationship Metmill Footwear Private Limited (Metmill) - Subsidiary Company
b Nature of contracts/arrangements/transaction Renewal of Omnibus approval for Related Party Transactions
c Duration of the contracts/arrangements/transaction 1 year (Apr21 – Mar22)
d Salient terms of the contracts or arrangements or transaction Renewal of Omnibus approval for Related Party including the value, if any Transactions on Annual Basis
1. Nature of the transaction: Sale / Purchase of goods
2. Maximum amount per transaction: ₹ 5 Crores, plus taxes per transaction
3. Maximum Value of transactions, in aggregate: ₹ 25 Crores, plus taxes
e Date of approval by the Board 25th March, 2021
f Date of approval by members NA
g Amount paid as advances, if any NIL
(III) Renewal of Omnibus approval for Related Party Transactions – Design Matrix Interiors LLP:
SL. Particulars DetailsNo
a Name (s) of the related party & nature of relationship Design Matrix Interiors LLP
Mr. Suleiman Bhanji is the Husband of Ms. Farah Malik Bhanji, Managing Director of the Company.
b Nature of contracts/arrangements/transaction Renewal of Omnibus approval for Related Party Transactions
c Duration of the contracts/arrangements/transaction 1 year (Apr 21 – Mar 22)
d Salient terms of the contracts or arrangements or transaction Renewal of Omnibus approval for Related Party including the value, if any Transactions on Annual Basis
1. Nature of the transaction: Consultancy services with respect to the fitout work for Showrooms
2. Maximum amount per transaction: ₹ 10 Lakhs, plus taxes per Showroom
3. Maximum Value of transactions, in aggregate: ₹ 4 Crores, plus taxes
e Date of approval by the Board 25th March, 2021
f Date of approval by members NA
g Amount paid as advances, if any NIL
27

(IV) Renewal of Omnibus approval for Related Party Transactions – M.V. Shoe Care Private Limited (MVSC) - Associate Company:
SL. Particulars DetailsNo
a Name (s) of the related party & nature of relationship M.V. Shoe Care Private Limited (MVSC) - Associate Company
b Nature of contracts/arrangements/transaction Renewal of Omnibus approval for Related Party Transactions
c Duration of the contracts/arrangements/transaction 1 year (Apr21 – Mar22)
d Salient terms of the contracts or arrangements or transaction Renewal of Omnibus approval for Related Party including the value, if any Transactions on Annual Basis
1. Nature of the transaction: Purchase of goods
2. Maximum amount per transaction: ₹ 15 Lakhs, plus taxes per transaction
3. Maximum Value of transactions, in aggregate: ₹ 25 Crores, plus taxes.
e Date of approval by the Board 25th March, 2021
f Date of approval by members NA
g Amount paid as advances, if any NIL
For and on behalf of the Board of Directors
Sd/- Sd/-
Rafique A. Malik Farah Malik Bhanji Chairman Managing Director & DIN:00521563 Chief Executive Officer DIN:00530676
Sd/-Place: Mumbai Tarannum BhanpurwalaDate: June 25, 2021 Company Secretary
28
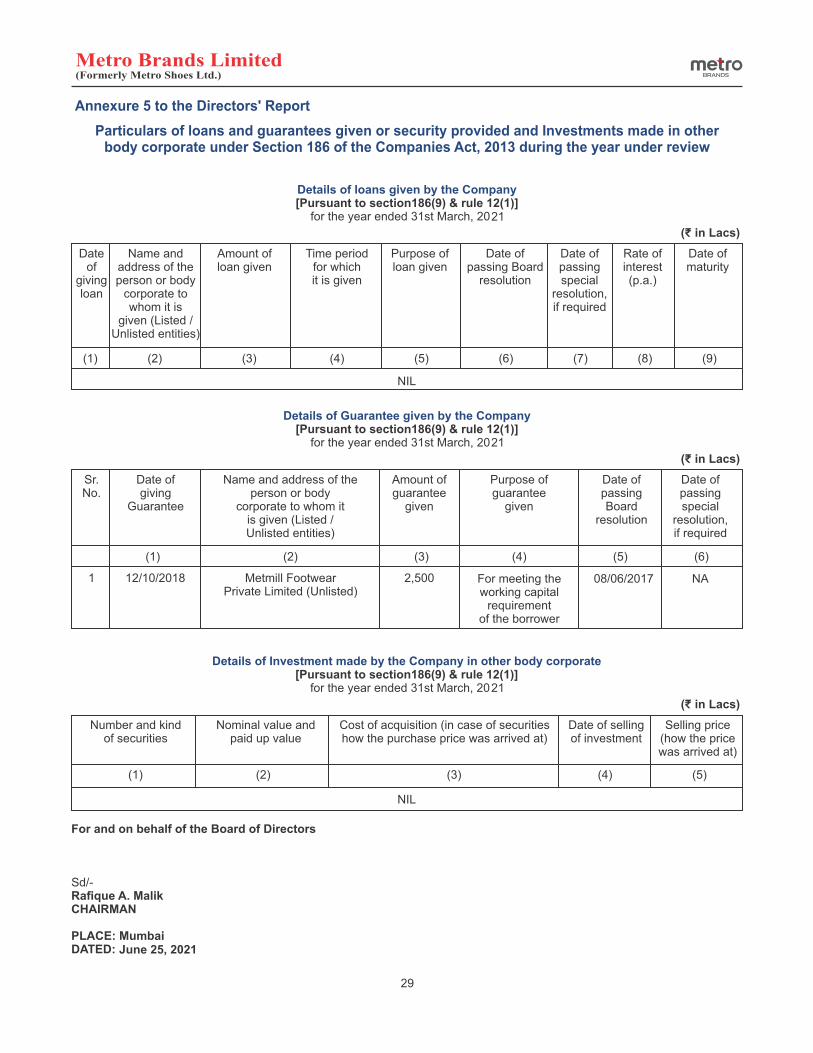
21
21
21
June 25, 2021
29

Annexure 6 to the Directors' Report
SECRETARIAL AUDIT REPORT FOR THE YEAR ENDED MARCH 31, 2021
ToThe MembersMetro Brands Limited401, Zillion, 4th Floor,Kurla WestMumbai – 400 070
I have conducted the Secretarial Audit of the compliance of applicable statutory provisions and the adherence to good Corporate Practices by Metro Brands Limited (hereinafter called the Company). Secretarial Audit was conducted in the manner that provided me a reasonable basis for evaluating the corporate conducts / statutory compliances and expressing my opinion thereon.
Based on my verification of the Company's books, papers, minute books, forms and returns filed and other records maintained by the Company and also the information provided by the Company, its officers, agents and authorized representative during the conduct of Secretarial Audit, I hereby report that in my opinion the Company has during the year ended 31st March, 2021, complied with the statutory provisions listed hereunder and also that the Company has proper Board processes and compliance mechanism in place.
I have examined the books, papers, minute books, forms and returns filed and other records maintained by the Company for the year under review, according to the provision of:
(i) The Companies Act, 2013 (the Act) and the rules made thereunder;
(ii) The Depositories Act, 1996 and the Regulations and Bye-laws framed thereunder;
(iii) The following Regulations and Guidelines prescribed under the Securities and Exchange Board of India Act, 1992 (“SEBI Act”) to the extent they are applicable to the company
(a) The Securities and Exchange Board of India (Registrars to an Issue and Share Transfer Agents) Regulations 1993 regarding the Companies Act and dealing with client;
(iv) Legal Metrology (Packaged Commodity) Act, 2009
During the period under review, the Company has complied with the provisions of the Acts, Rules, Regulations, Guidelines, Standards, etc., mentioned above
I further report that
The Board of Directors of the Company is duly constituted with proper balance of Executive Directors, Non-Executive Directors and Independent Directors. The changes in the composition of the Board of Directors that took place during the period under review were carried out in compliance with the provisions of the Act.
Adequate notice is given to all directors to schedule the Board Meetings, agenda and detailed notes on agenda were sent at least seven days in advance, and a system exists for seeking and obtaining further information and clarifications on the agenda items before the meeting and for meaningful participation at the meeting.
Majority decision is carried through while the dissenting members' views are capture and recorded as part of the minutes.
I further report that based on compliance mechanism established by the Company and on the basis of compliance certificates issued by the Compliance Officer and taken on record by the Board of Directors, prima facie there are adequate systems and processes in the Company commensurate with the size and operations of the Company to monitor and ensure compliance with applicable laws, rules, regulations and guidelines. Also, as informed, the Company has responded appropriately to notices received from various statutory authorities / regulatory authorities including initiating actions for corrective measures, where found necessary.
I further report that during the audit period, the company has undertaken the following actions having a major bearing on the company's affairs in pursuance of the above referred laws: -
a) With the approval of the members in the extra-ordinary general meeting of the of the company held on 30th March, 2021, the nominal value of the equity shares of the company of Rs. 10/- per share has been sub-divided into equity shares of Rs. 5/- per share.
b) The company has obtained enabling approvals from its members in the extra-ordinary general meeting of the company held on 30th March, 2021 to allot for cash the Equity Shares for a consideration of up to ₹800 Crores as may be decided pursuant to a fresh issue (the “Fresh Issue”) together with an offer for sale by certain existing shareholders of the Company, in accordance with the Securities and Exchange Board of India (Issue of Capital and Disclosure) Regulations, 2018 (SEBI ICDR Regulations) (the “Offer for Sale” and such shareholders, the “Selling Shareholders”; the Offer for Sale together with the Fresh Issue), the “Offer” or the “IPO”, at such price as may be determined in accordance with the book building process under the SEBI ICDR Regulations.
Sd/- A. SEKARPLACE : Mumbai COMPANY SECRETARYDATE : 25th June, 2021 ACS 8649 CP 2450
This report is to be read with our letter of even date which is annexed as Annexure A and forms an integral part of this report.
30
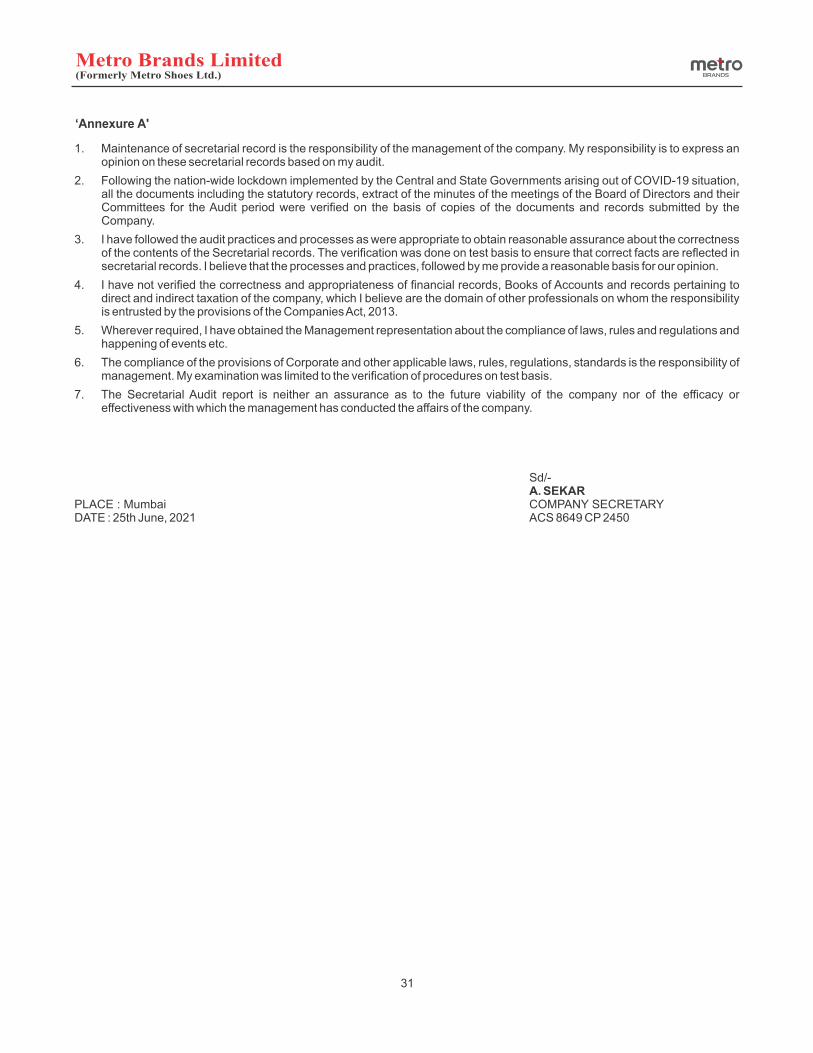
1. Maintenance of secretarial record is the responsibility of the management of the company. My responsibility is to express an opinion on these secretarial records based on my audit.
2. Following the nation-wide lockdown implemented by the Central and State Governments arising out of COVID-19 situation, all the documents including the statutory records, extract of the minutes of the meetings of the Board of Directors and their Committees for the Audit period were verified on the basis of copies of the documents and records submitted by the Company.
3. I have followed the audit practices and processes as were appropriate to obtain reasonable assurance about the correctness of the contents of the Secretarial records. The verification was done on test basis to ensure that correct facts are reflected in secretarial records. I believe that the processes and practices, followed by me provide a reasonable basis for our opinion.
4. I have not verified the correctness and appropriateness of financial records, Books of Accounts and records pertaining to direct and indirect taxation of the company, which I believe are the domain of other professionals on whom the responsibility is entrusted by the provisions of the Companies Act, 2013.
5. Wherever required, I have obtained the Management representation about the compliance of laws, rules and regulations and happening of events etc.
6. The compliance of the provisions of Corporate and other applicable laws, rules, regulations, standards is the responsibility of management. My examination was limited to the verification of procedures on test basis.
7. The Secretarial Audit report is neither an assurance as to the future viability of the company nor of the efficacy or effectiveness with which the management has conducted the affairs of the company.
Sd/- A. SEKARPLACE : Mumbai COMPANY SECRETARYDATE : 25th June, 2021 ACS 8649 CP 2450
31
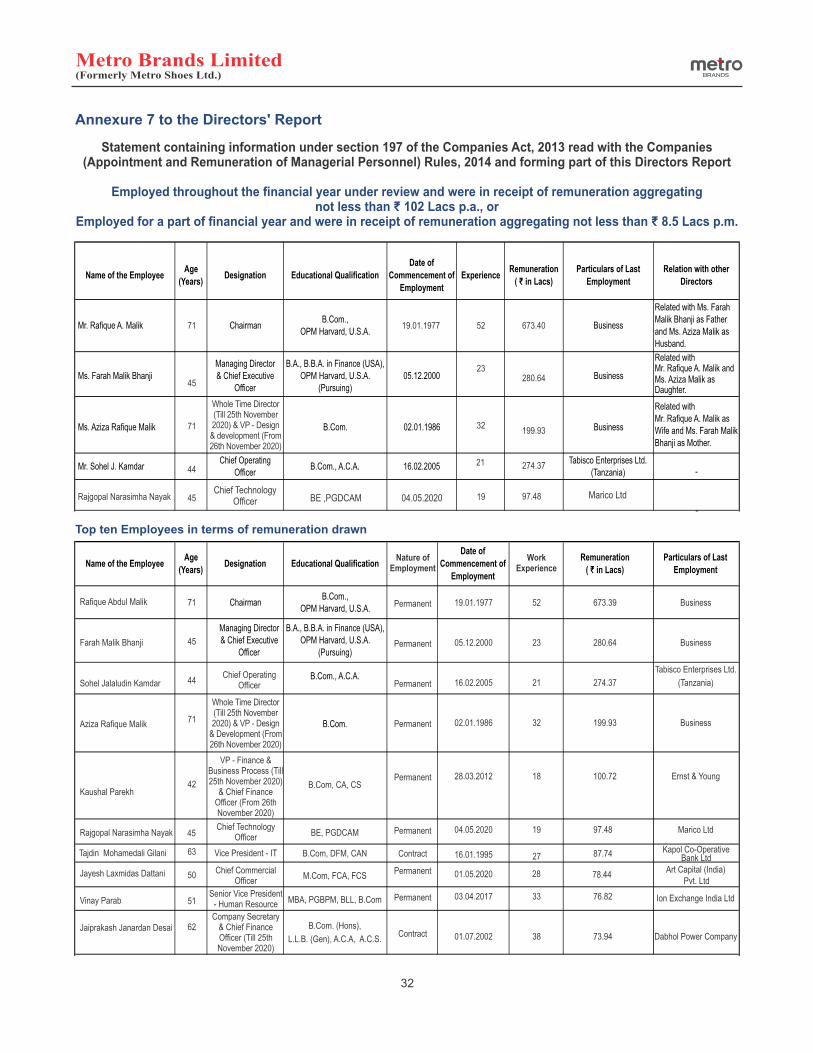
71
45
71
44
45
52
23
32
21
19
673.40
280.64
199.93
274.37
97.48
32
19.01.1977
Annexure 7 to the Directors' Report
Top ten Employees in terms of remuneration drawn
71
45
44
71
42
45
63
50
51
62
19.01.1977
05.12.2000
16.02.2005
02.01.1986
28.03.2012
04.05.2020
16.01.1995
01.05.2020
03.04.2017
01.07.2002
Rafique Abdul Malik
Farah Malik Bhanji
Sohel Jalaludin Kamdar
Aziza Rafique Malik
Kaushal Parekh
Rajgopal Narasimha Nayak
Tajdin Mohamedali Gilani
Jayesh Laxmidas Dattani
Vinay Parab
Jaiprakash Janardan Desai
Nature of Employment
Work Experience
Chief Operating Officer
Permanent
Permanent
Permanent
Permanent
Permanent
Permanent
Contract
Permanent
Permanent
Contract
Whole Time Director (Till 25th November 2020) & VP - Design
& Development (From 26th November 2020)
VP - Finance & Business Process (Till 25th November 2020)
& Chief Finance Officer (From 26th November 2020)
Vice President - IT
Chief TechnologyOfficer
Chief Commercial Officer
Senior Vice President - Human Resource
Company Secretary & Chief Finance Officer (Till 25th November 2020)
B.Com, CA, CS
BE, PGDCAM
B.Com, DFM, CAN
M.Com, FCA, FCS
MBA, PGBPM, BLL, B.Com
B.Com. (Hons),
L.L.B. (Gen), A.C.A, A.C.S.
52
23
21
32
18
19
27
28
33
38
673.39
280.64
274.37
199.93
100.72
97.48
87.74
78.44
76.82
73.94
Business
Business
Tabisco Enterprises Ltd.
(Tanzania)
Business
Ernst & Young
Marico Ltd
Kapol Co-Operative Bank Ltd
Art Capital (India) Pvt. Ltd
Ion Exchange India Ltd
Dabhol Power Company
Whole Time Director (Till 25th November 2020) & VP - Design & development (From 26th November 2020)
Rajgopal Narasimha NayakChief Technology
Officer BE ,PGDCAM 04.05.2020 Marico Ltd

33
Note:
1. All appointments are contractual and terminable by notice on either side.
2. None of the employees referred above draws remuneration more than the remuneration drawn by the Managing Director or Whole-time Director or manager and holds, by themselves or along with their spouse and dependent children, two percent or more of the equity shares of the Company.
3. Experience includes number of years service both within the Company and elsewhere.
ON BEHALF OF THE BOARD OF DIRECTORS
Sd/-
Rafique A. MalikCHAIRMAN PLACE : Mumbai DATED : June 25, 2021

A. Conservation of Energy:
The Company's operations involve low energy consumption. Wherever possible, energy conservation measures have already been implemented. The Company has been using energy efficient LED lights in the showrooms which are very effective in power saving. The Company has also started installing energy efficient VRF Inverter based Air-conditioning systems in the Showrooms. These systems are comparatively costly however provide substantial saving in terms of monthly energy costs. The efforts to conserve and optimize the use of energy through improved operational methods and other means will continue.
Installation of rooftop solar system at the Company's warehouse located at Bhiwandi – Based on our commitment to switch to renewable energy sources than to depend on non-renewable ones. In the month of Dec-19, we decided to install a 110 KW solar power system. The solar power system has since been installed in June 2020. We are expecting substantial savings in our electricity consumption at our Bhiwandi unit on installation of this solar system.
B. Technology Absorption:
(i) Efforts made for technology absorption & Benefits derived: The operations of the Company do not involve any technology absorption. The Company has not imported any technology during the previous years and has no technical collaboration with any party.
(ii) Details of technology imported during the last three years reckoned from the beginning of the financial year: NIL
(iii) Expenditure incurred on Research & Development: The Company does not have any specific present or future plan of action for research and development. However, it will continue its efforts to implement innovative ways for customer service and delighting the customers.
C. Foreign Exchange Earnings / Outgo:
Particulars 2020-21 2019-20
Foreign Exchange Earnings
Sale of Footwear and Accessories NIL NIL
Foreign Exchange Outgo
a) Purchase of Footwear and Accessories 2,269.55 5,066.89
b) Travelling & Other Expenses - 15.69
c) Professional & Consultancy Fees 47.53 61.01
34
Annexure 8 to the Directors' Report


INDEPENDENT AUDITOR'S REPORTTo The Members of Metro Brands Limited (formerly known as Metro Shoes Limited)
Report on the Audit of the Standalone Financial Statements
Opinion
We have audited the accompanying standalone financial statements of Metro Brands Limited (“the Company”), which comprise the Balance Sheet as at 31 March 2021, and the Statement of Profit and Loss (including Other Comprehensive Income), the Statement of Cash Flows and the Statement of Changes in Equity for the year then ended, and a summary of significant accounting policies and other explanatory information.
In our opinion and to the best of our information and according to the explanations given to us,the aforesaid standalone financial statements give the information required by the Companies Act, 2013 (“the Act”) in the manner so required and give a true and fair view in conformity with the Indian Accounting Standards prescribed under section 133 of the Act read with the Companies (Indian Accounting Standards) Rules, 2015, as amended, (“Ind AS”)and other accounting principles generally accepted in India, of the state of affairs of the Company as at 31 March 2021, and its profit ,total comprehensive income, its cash flows and the changes in equity for the year ended on that date.
Basis for Opinion
We conducted our audit of the standalone financial statements in accordance with the Standards on Auditing specified under section 143(10) of the Act (SAs). Our responsibilities under those Standards are further described in the Auditor’s Responsibility for the Audit of the Standalone Financial Statements section of our report. We are independent of the Company in accordance with the Code of Ethics issued by the Institute of Chartered Accountants of India (ICAI) together with the ethical requirements that are relevant to our audit of the standalone financial statements under the provisions of the Act and the Rules made thereunder, and we have fulfilled our other ethical responsibilities in accordance with these requirements and the ICAI’s Code of Ethics. We believe that the audit evidence obtained by us is sufficient and appropriate to provide a basis for our audit opinion on the standalone financial statements.
Information Other than the Financial Statements and Auditor's Report Thereon
The Company’s Board of Directors is responsible for the other information. The other information comprises the information included in the Director's report, but does not include the consolidated financial statements, standalone financial statements and our auditor’s report thereon.
● Our opinion on the standalone financial statements does not cover the other information and we do not express any form of assurance conclusion there on
● In connection with our audit of the standalone financial statements, our responsibility is to read the other information and, in doing so, consider whether the other information is materially inconsistent with the standalone financial statements or our knowledge obtained during the course of our audit or otherwise appears to be materially misstated.
● If, based on the work we have performed, we conclude that there is a material misstatement of this other information, we are required to report that fact. We have nothing to report in this regard.
Management's Responsibility for the Standalone Financial Statements
The Company's Board of Directors is responsible for the matters stated in section 134(5) of the Act with respect to the preparation of these standalone financial statements that give a true and fair view of the financial position, financial performance including other comprehensive income, cash flows and changes in equity of the Company in accordance with the Ind AS and other accounting principles generally accepted in India. This responsibility also includes maintenance of adequate accounting records in accordance with the provisions of the Act for safeguarding the assets of the Company and for preventing and detecting frauds and other irregularities; selection and application of appropriate accounting policies; making judgments and estimates that are reasonable and prudent; and design, implementation and maintenance of adequate internal financial controls, that were operating effectively for ensuring the accuracy and completeness of the accounting records, relevant to the preparation and presentation of the standalone financial statement that give a true and fair view and are free from material misstatement, whether due to fraud or error.
In preparing the standalone financial statements, management is responsible for assessing the Company’s ability to continue as a going concern, disclosing, as applicable, matters related to going concern and using the going concern basis of accounting unless management either intends to liquidate the Company or to cease operations, or has no realistic alternative but to do so.
Those Board of Directors are also responsible for overseeing the Company’s financial reporting process.
Auditor's Responsibility for the Audit of the Standalone Financial Statements
Our objectives are to obtain reasonable assurance about whether the standalone financial statements as a whole are free from material misstatement, whether due to fraud or error, and to issue an auditor’s report that includes our opinion. Reasonable assurance is a high level of assurance, but is not a guarantee that an audit conducted in accordance with SAs will always detect a material misstatement when it exists. Misstatements can arise from fraud or error and are considered material if, individually or in the aggregate, they could reasonably be expected to influence the economic decisions of users taken on the
36

basis of these standalone financial statements.
As part of an audit in accordance with SAs, we exercise professional judgment and maintain professional skepticism throughout the audit. We also:
● Identify and assess the risks of material misstatement of the standalone financial statements, whether due to fraud or error, design and perform audit procedures responsive to those risks, and obtain audit evidence that is sufficient and appropriate to provide a basis for our opinion. The risk of not detecting a material misstatement resulting from fraud is higher than for one resulting from error, as fraud may involve collusion, forgery, intentional omissions, misrepresentations, or the override of internal control.
● Obtain an understanding of internal financial control relevant to the audit in order to design audit procedures that are appropriate in the circumstances. Under section143(3)(I) of the Act, we are also responsible for expressing our opinion on whether the Company has adequate internal financial controls system in place and the operating effectiveness of such controls
● Evaluate the appropriateness of accounting policies used and the reasonableness of accounting estimates and related disclosures made by the management.
● Conclude on the appropriateness of management’s use of the going concern basis of accounting and, based on the audit evidence obtained, whether a material uncertainty exists related to events or conditions that may cast significant doubt on the Company’s ability to continue as a going concern. If we conclude that a material uncertainty exists, we are required to draw attention in our auditor’s report to the related disclosures in the standalone financial statements or, if such disclosures are inadequate, to modify our opinion. Our conclusions are based on the audit evidence obtained up to the date of our auditor’s report. However, future events or conditions may cause the Company to cease to continue as a going concern.
● Evaluate the overall presentation, structure and content of the standalone financial statements, including the disclosures, and whether the standalone financial statements represent the underlying transactions and events in a manner that achieves fair presentation.
Materiality is the magnitude of misstatements in the standalone financial statements that, individually or in aggregate, makes it probable that the economic decisions of a reasonably knowledgeable user of the standalone financial statements may be influenced. We consider quantitative materiality and qualitative factors in (i) planning the scope of our audit work and in evaluating the results of our work; and (ii) to evaluate the effect of any identified misstatements in the standalone financial statements.
We communicate with those charged with governance regarding, among other matters, the planned scope and timing of the audit and significant audit findings, including any significant deficiencies in internal control that we identify during our audit.
We also provide those charged with governance with a statement that we have complied with relevant ethical requirements regarding independence, and to communicate with them all relationships and other matters that may reasonably be thought to bear on our independence, and where applicable, related safeguards.
Report on Other Legal and Regulatory Requirements
1. As required by Section 143(3) of the Act, based on our audit we report that:
a) We have sought and obtained all the information and explanations which to the best of our knowledge and belief were necessary for the purposes of our audit.
b) In our opinion, proper books of account as required by law have been kept by the Company so far as it appears from our examination of those books.
c) The Balance Sheet, the Statement of Profit and Loss including Other Comprehensive Income, the Statement of Cash Flows and Statement of Changes in Equity dealt with by this Report are in agreement with the books of account.7
d) In our opinion, the a fore said standalone financial statements comply with the Ind AS specified under Section 133 of the Act.
e) On the basis of the written representations received from the directors as on 31 March, 2021 taken on record by the Board of Directors, none of the directors is disqualified as on 31 March, 2021 from being appointed as a director in terms of Section 164(2) of the Act.
f) With respect to the adequacy of the internal financial controls over financial reporting of the Company and the operating effectiveness of such controls, refer to our separate Report in “Annexure A”. Our report expresses an unmodified opinion on the adequacy and operating effectiveness of the Company’s internal financial controls over financial reporting
g) With respect to the other matters to be included in the Auditor’s report in accordance with the requirements of section 197(16) of the Act, as amended, in our opinion and to the best of our information and according to the explanations given to us, the remuneration paid by the Company to its directors during the year is in accordance with the provisions of section 197 of the Act.
h) With respect to the other matters to be included in the Auditor’s Report in accordance with Rule 11 of the Companies (Audit and Auditors) Rules,2014, as amended in our opinion and to the best of our information and according to the explanations given to us:
37

i. The Company has disclosed the impact of pending litigations on its financial position in its standalone financial statements. Refer Note 25 to the standalone financial Statements
ii. The Company did not have any long-term contracts including derivative contracts for which there were any material foreseeable losses.
iii. There were no amounts which were required to be transferred to the Investor Education and Protection Fund by the Company.
As required by the Companies (Auditor’s Report) Order, 2016 (“the Order”) issued by the Central Government in terms of Section 143(11) of the Act, we give in “Annexure B” a statement on the matters specified in paragraphs 3 and 4 of the Order.
For DELOITTE HASKINS & SELLS Chartered Accountants
(Firm's Registration No. 117365W)
Ketan Vora Partner
(Membership No. 100459) UDIN: 21100459AAAAKX5184
Place: MumbaiDate: 25 June 2021
38

ANNEXURE “A” TO THE INDEPENDENT AUDITOR'S REPORT
We have audited the internal financial controls over financial reporting of Metro Brands Limited (formerly known as Metro Shoes Limited) (“the Company”) as of March 31, 2021 in conjunction with our audit of the standalone Ind As financial statements of the Company for the year ended on that date.Management's Responsibility for Internal Financial ControlsThe Company’s management is responsible for establishing and maintaining internal financial controls based on the internal control over financial reporting criteria established by the Company considering the essential components of internal control stated in the Guidance Note on Audit of Internal Financial Controls Over Financial Reporting issued by the Institute of Chartered Accountants of India. These responsibilities include the design, implementation and maintenance of adequate internal financial controls that were operating effectively for ensuring the orderly and efficient conduct of its business, including adherence to company’s policies, the safeguarding of its assets, the prevention and detection of frauds and errors, the accuracy and completeness of the accounting records, and the timely preparation of reliable financial information, as required under the Companies Act, 2013.Auditor's ResponsibilityOur responsibility is to express an opinion on the Company's internal financial controls over financial reporting of the Company based on our audit. We conducted our audit in accordance with the Guidance Note on Audit of Internal Financial Controls Over Financial Reporting (the “Guidance Note”) issued by the Institute of Chartered Accountants of India and the Standards on Auditing prescribed under Section 143(10) of the Companies Act, 2013, to the extent applicable to an audit of internal financial controls. Those Standards and the Guidance Note require that we comply with ethical requirements and plan and perform the audit to obtain reasonable assurance about whether adequate internal financial controls over financial reporting was established and maintained and if such controls operated effectively in all material respects.Our audit involves performing procedures to obtain audit evidence about the adequacy of the internal financial controls system over financial reporting and their operating effectiveness. Ouraudit of internal financial controls over financial reporting included obtaining an understanding of internal financial controls over financial reporting, assessing the risk that a material weakness exists, and testing and evaluating the design and operating effectiveness of internal control based on the assessed risk. The procedures selected depend on the auditor’s judgement, including the assessment of the risks of material misstatement of the financial statements, whether due to fraud or error.We believe that the audit evidence we have obtained is sufficient and appropriate to provide a basis for our audit opinion on the Company’s internal financial controls system over financial reporting.Meaning of Internal Financial Controls Over Financial ReportingA company's internal financial control over financial reporting is a process designed to provide reasonable assurance regarding the reliability of financial reporting and the preparation of financial statements for external purposes in accordance with generally accepted accounting principles. A company's internal financial control over financial reporting includes those policies and procedures that (1) pertain to the maintenance of records that, in reasonable detail, accurately and fairly reflect the transactions and dispositions of the assets of the company; (2) provide reasonable assurance that transactions are recorded as necessary to permit preparation of financial statements in accordance with generally accepted accounting principles, and that receiptsand expenditures of the company are being made only in accordance with authorisations of management and directors of the company; and (3) provide reasonable assurance regarding prevention or timely detection of unauthorised acquisition, use, or disposition of the company's assets that could have a material effect on the financial statements.Inherent Limitations of Internal Financial Controls Over Financial ReportingBecause of the inherent limitations of internal financial controls over financial reporting, including the possibility of collusion or improper management override of controls, material misstatements due to error or fraud may occur and not be detected. Also, projections of any evaluation of the internal financial controls over financial reporting to future periods are subject to the risk that the internal financial control over financial reporting may become inadequate because of changes in conditions, or that the degree of compliance with the policies or procedures may deteriorate.OpinionIn our opinion, to the best of our information and according to the explanations given to us, the Company has, in all material respects, an adequate internal financial controls system over financial reporting and such internal financial controls over financial reporting were operating effectively as at March 31, 2021, based on the criteria for internal financial control over financial reporting established by the Company considering the essential components of internal control stated in the Guidance Note on Audit of Internal Financial Controls Over Financial Reporting issued by the Institute of Chartered Accountants of India.
For DELOITTE HASKINS & SELLS Chartered Accountants
(Firm's Registration No. 117365W)
Ketan Vora Partner
Place: Mumbai (Membership No. 100459) Date: 25June 2021 UDIN: 21100459AAAAKX5184
(Referred to in paragraph 1(f) under ‘Report on Other Legal and Regulatory Requirements’ section of our report of even date to the members of Metro Brands Limited (formerly known as Metro Shoes Limited) on the standalone financial statements for the year ended March 31, 2021)
Report on the Internal Financial Controls Over Financial Reporting under Clause (i) of Sub-section 3 of Section 143 of the Companies Act, 2013 (“the Act”)
39

ANNEXURE B TO THE INDEPENDENT AUDITOR'S REPORT
(Referred to in paragraph 2 under ‘Report on Other Legal and Regulatory Requirements’ section of our report of even date to the members of Metro Brands Limited (formerly known as Metro Shoes Limited) on the standalone financial statements for the year ended March 31, 2021)
(i) (a) The Company has maintained proper records showing full particulars, including quantitative details and situation of the fixed assets (Property, Plant and Equipment).
(i) (b) The Company has a program of verification of fixed assets (Property, Plant and Equipment) to cover all the items in a phased manner over a period of two years which, in our opinion, is reasonable having regard to the size of the Company and the nature of its assets. Pursuant to the program, certain Property, Plant and Equipment were physically verified by the Management during the year. According to the information and explanations given to us, no material discrepancies were noticed on such verification.
(i) (c) According to the information and explanations given to us and the records examined by us and based on the examination of the registered agreements for sale provided to us, we report that, the title deeds, comprising all the immovable properties of units in a building which are freehold, are held in the name of the Company as at the Balance Sheet date.
(ii) As explained to us, the inventories were physically verified during the year by the Management at reasonable intervals and no material discrepancies were noticed on physical verification.
(iii) According to the information and explanations given to us, the Company has granted unsecured loans tot he companies covered in the register maintained under section 189 of the Companies Act, 2013, in respect of which:
(a) The terms and conditions of the grant of such loan is, in our opinion, prima facie, not prejudicial to the Company’s interest.
(b) The loan is repayable on demand. The receipt of interest has been as per stipulations.
(c) There is no amount overdue for more than 90 days at the Balance Sheet date.
(iv) In our opinion and according to the information and explanations given to us, the Company has complied with the provisions of Sections 185 and 186 of the Companies Act, 2013 in respect of grant of loans, making investments and providing guarantees and securities, as applicable.
(v) According to the information and explanations given to us, the Company has not accepted any deposit during the year. The Company does not have unclaimed deposits as at March 31, 2021and accordingly, provisions of Section 73 to 76 or any other relevant provisions of the Companies Act, 2013 are not applicable to the Company.
(vi) The maintenance of cost records has not been specified by the Central Government under section 148(1) of the Companies Act, 2013.
(vii) According to the information and explanations given to us, in respect of statutory dues:
(vii) (a) The Company has been generally regular in depositing undisputed statutory dues, including Provident Fund, Employees’ State Insurance, Income-tax, Customs Duty, Excise Duty, Goods and Services tax, Cess and other material statutory dues applicable to it to the appropriate authorities.
(vii) (b) There were no undisputed amounts payable in respect of Provident Fund, Employees’ State Insurance, Income-tax,Customs Duty, Excise Duty, Goods and Services tax, Cessand other material statutory dues in arrears as at March 31, 2021 for a period of more than six months from the date they became payable.
(vii) (c) Details of dues of Income-tax, Service Tax, Excise Duty and Sales tax / Value Added Tax which have not been deposited as on March 31, 2021 on account of disputes are given below
40

Name of Statute Nature of Dues Forum where Period to which the Amount involved Amount unpaid Dispute is pending amount relates (Rs. in Lakhs) (Rs. in Lakhs)
The Income Tax Commissioner of A.Y. 2011-12 3.01 3.01 Income Tax, Income Tax Appeal
CPC, Income Tax A.Y. 2012-13 0.46 0.46
AO A.Y. 2018-19 453.20 453.20
Deputy F.Y. 2012-2013 20.05 0 Sales Tax Commissioner Appeal, Ernakulam
Deputy F.Y. 2011-2012 1.61 0 Sales Tax Commissioner Appeal, Ernakulam
Joint F.Y. 2013-2014 645.84 633.64 Commissioner -1
Sales Tax Appeal, Ahmedabad
Joint F.Y. 2013-2014 76.43 46.43 Sales Tax Commissioner of Commercial Tax (Appeals) –Bihar
Joint Excise and F.Y. 2015-2016 2.71 2.71 Taxation Sales Tax Commissioner (Appeals) – Faridabad
Assistant F.Y. 2018-2019 7.89 7.26 Sales Tax Commissioner of State Tax-Bihar
Central Excise Act, CESTAT, Mumbai April 2006 –March 8.87 8.87Excise Duty 1944 2014
Finance Act, 1994 The Supreme September 2008 – 10.59 10.59and Service Tax Service tax Court of India March 2011Laws
(viii) The Company has not taken any loans or borrowings from financial institutions, banks and government or has not issued any debentures. Hence reporting under clause 3(viii) of the Order is not applicable to the Company.
(ix) The Company has not raised moneys by way of initial public offer or further public offer (including debt instruments) or term loans and hence reporting under clause 3(ix) of the Order is not applicable.
(x) To the best of our knowledge and according to the information and explanations given to us, no fraud by the Company and no material fraud on the Company by its officers or employees has been noticed or reported during the year.
(xi) In our opinion and according to the information and explanations given to us, the Company has paid/ provided managerial remuneration in accordance with the requisite approvals mandated by the provisions of Section 197 reared with Schedule V to the Companies Act, 2013.
(xii) The Company is not a Nidhi Company and hence reporting under clause (xii) of the Order is not applicable.(xiii) In our opinion and according to the information and explanations given to us, the Company is in compliance with Section
177 and 188 of the Companies Act, 2013, where applicable, for all transactions with the related parties and the details of related party transactions have been disclosed in the standalone financial statements as required by the applicable Indian Accounting Standard.
(xiv) During the year the Company has not made any preferential allotment or private placement of shares or fully or partly convertible debentures and hence reporting under clause 3(xiv) of the Order is not applicable to the Company.
(xv) In our opinion and according to the information and explanations given to us, during the year the Company has not entered into any non-cash transactions with its directors or directors of its holding, subsidiary or associate company or persons connected with them and hence provisions of section 192 of the Companies Act, 2013 are not applicable.
(xvi) The Company is not required to be registered under section 45-IAof the Reserve Bank of India Act, 1934
For DELOITTE HASKINS & SELLS Chartered Accountants
(Firm's Registration No. 117365W)
Ketan Vora Partner
Place: Mumbai (Membership No. 100459) Date: 25June 2021 UDIN: 21100459AAAAKX5184
41
Central Sales Tax Act, 1956 and Sales Tax/ Value Added Tax Act of various states


Standalone Balance Sheet as at March 31, 2021
As at As atParticulars Note No. March 31, 2021 March 31, 2020
A. ASSETS 1 Non-current assets (a) Property, plant and equipment 2a 21,851.61 21,853.31 (b) Capital work-in-progress 421.50 1,290.40 (c) Right of use assets 2b 49,960.19 48,146.53 (d) Intangible assets 2c 391.08 490.15 (e) Intangible assets under development 32.87 13.01 (f) Financial assets (I) Investments in Subsidiary and Joint Venture 3 504.26 504.26 (ii) Other financial assets 5 3,722.17 3,914.31 (g) Deferred tax assets (Net) 24 1,593.88 1,096.58 (h) Non-current tax assets 271.91 200.69 (i) Other non-current assets 6 294.23 280.47 Total non - current assets 79,043.70 77,789.71 2 Current assets (a) Inventories 7 28,446.12 31,999.92 (b) Financial assets (I) Investments 3 39,236.92 34,046.00 (ii) Trade receivables 8 2,248.60 809.46 (iii) Cash and cash equivalents 9a 2,176.98 1,004.79 (iv) Bank Balances other than (iii) above 9b 6,160.74 38.89 (v) Loans 4 336.23 335.76 (vi) Other financial assets 5 1,311.21 712.55 (c) Other current assets 6 2,225.33 3,886.38 Total current assets 82,142.13 72,833.75 Total assets (1+2) 161,185.83 150,623.46 B EQUITY AND LIABILITIES 1 Equity (a) Equity share capital 10 13,276.71 13,276.71 (b) Other equity 11 67,187.86 64,725.06 Total equity 80,464.57 78,001.77 2 Non-current liabilities (a) Financial Liabilities (i) Lease Liabilities 29 48,864.61 45,729.14 Total non - current liabilities 48,864.61 45,729.14 3 Current liabilities (a) Financial liabilities (i) Trade payables Total Outstanding dues of Micro Enterprises and Small Enterprises 14 173.65 88.99 Total Outstanding dues to other than Micro Enterprises and Small Enterprises 14 20,077.97 15,375.13 (ii) Lease liabilities 29 7,684.98 7,913.91 (iii) Other financial liabilities 12 1,445.47 1,859.76 (b) Other Current liabilities 15 1,974.37 1,416.31 (c) Provisions 13 66.20 238.45 (d) Current tax liabilities (Net) 434.01 - Total current liabilities 31,856.65 26,892.55 Total equity and liabilities (1+2+3) 161,185.83 150,623.46 See accompanying notes from 1 to 37 forming part of the standalone financial statements
In terms of our report attached. For and on behalf of the Board of Directors
F Metro Brands Limited or Deloitte Haskins & SellsChartered Accountants Sd/- Sd/-Ketan Vora Rafique A.Malik Farah Malik Bhanji Partner Chairman Managing Director & Chief Executive Officer DIN:00521563 DIN:00530676 Sd/- Sd/-
P Kaushal Parekh Tarannum Bhanpurwala lace: Mumbai
Date : June 25, 2021 Chief Financial Officer Company Secretary
₹ in Lakhs
43

For the year ended For the year ended Particulars Note No.
March 31, 20 1 March 31, 2020
2
I Revenue from operations 16 78,874.45 120,963.49
II Other Income 17 7,854.34 2,539.40
III Total Income (I + II) 86,728.79 123,502.89
IV Expenses
(a) Purchases 18 31,627.38 51,800.07
(b) Changes in inventories of stock in trade 19 3,553.80 1,073.61
(c) Employee benefits expense 20 9,717.39 11,313.65
(d) Depreciation and Amortisation expense 2a, 2b & 2c 12,120.89 11,993.13
(e) Finance cost 21 4,302.97 3,868.62
(f) Other expenses 22 16,292.56 22,745.52
Total Expenses (IV) 77,614.99 102,794.60
V Profit before tax (III-IV) 9,113.80 20,708.29
VI Tax expense
(1) Current tax 23 2,358.66 5,363.68
(2) Deferred tax 24 (497.30) 156.74
Total tax expense 1,861.36 5,520.42
VII Profit after tax for the year (V-Vl) 7,252.44 15,187.87
VIII Other comprehensive income 189.12 43.77
(i) Items that will not be reclassified to profit or loss
- Gain/(Loss) on Remeasurements of the defined benefit plans 155.29 (4.02)
- Income tax relating to items that will not be reclassified to profit or loss (39.09) 1.01
(ii) Items that will be reclassified to profit or loss
- Gain arising on fair valuation of quoted investments in bonds 72.92 46.78
- Income tax relating to items that will be reclassified to profit or loss - -
IX Total comprehensive income for the year (VII + VIII) 7,441.56 15,231.64
Earnings per equity share (of ₹ 5 each)
Basic 31 2.73 5.72
Diluted 31 2.73 5.72
See accompanying notes from 1 to 37 forming part of the standalone financial statements
In terms of our report attached. For and on behalf of the Board of Directors
F Metro Brands Limited or Deloitte Haskins & SellsChartered Accountants Sd/- Sd/-Ketan Vora Rafique A.Malik Farah Malik Bhanji Partner Chairman Managing Director & Chief Executive Officer DIN:00521563 DIN:00530676 Sd/- Sd/-
P Kaushal Parekh Tarannum Bhanpurwala lace: Mumbai
Date : June 25, 2021 Chief Financial Officer Company Secretary
Standalone Statement of Profit and Loss for the year ended March 31, 2021
44
₹ in Lakhs

For the year ended For the year ended Particulars March 31, 20 1 March 31, 20202
Cash flow from operating activities
Profit before tax for the year 9,113.80 20,708.29
Adjustments for:
Depreciation and Amortisation expense 12,120.89 11,993.13
Interest Expense 4,302.97 3,868.62
Rent Concession on account of COVID - 19 (5,188.39) -
Net unrealised exchange loss 0.13 13.06
Loss on Sale / Discard of Property Plant & Equipment (net) 258.03 253.39
Dividend income from Current Investments in Mutual Funds (52.02) (462.29)
Net Gain arising on Investments designated as FVTPL (1,832.11) (1,287.98)
Interest Income (543.50) (417.37)
Allowance for doubtful Trade receivables, advances and deposits 76.93 -
Liabilities no longer required, written back (88.26) (265.46)
Advances written off 70.35 91.16
Operating profit before working capital changes 18,238.82 34,494.55
Movement in working capital:
(Increase) / Decrease in Trade Receivable (1,426.34) 120.51
(Increase) in other financial assets (172.36) (950.35)
Decrease in other current assets 1,686.76 700.52
Decrease in Inventories 3,553.81 1,073.61
(Increase) in other non-current assets (103.05) (112.32)
Increase / (Decrease) in trade and other payables 4,163.10 (2,471.26)
Increase / (Decrease) in Other current liabilites 558.78 (127.68)
(Decrease) / Increase in Other financial liabilites (33.23) 169.79
(Decrease) / Increase in Provisions (16.96) 0.51
8,210.51 (1,596.67)
Cash generated from operations 26,449.33 32,897.88
Less: income taxes paid (2,035.66) (5,708.03)
Net cash generated from operating activities 24,413.67 27,189.85
Cash flows from investment activities
Capital Expenditure on Property, Plant & Equipment including Capital Advances (2,502.59) (4,270.77)
Proceeds from Sale / Discard of Property Plant & Equipment 35.44 21.00
Interest Received 205.38 137.21
Bank Balances (including Non Current) not considered as Cash and Cash equivalents (6,112.48) (18.31)
Purchase of Current Investments (48,438.17) (36,663.66)
Redemption of Current Investments 45,152.28 24,229.37
Dividend Income from Mutual Funds 52.02 462.29
Net cash used in investment activities (11,608.12) (16,102.87)
Cash flow from financing activities
Payment of lease liabilities (6,654.59) (11,196.44)
Final and Interim Dividends including Dividend Tax paid (4,978.77) -
Net cash flow from Financing activities (11,633.36) (11,196.44)
Net increase/(decrease) in cash and cash equivalents 1,172.19 (109.46)
Cash and cash equivalents at the beginning [Refer Note 9a] 1,004.79 1,114.25
Cash and cash equivalents at the end of the year [Refer Note 9a] 2,176.98 1,004.79
See accompanying notes from 1 to 37 forming part of the standalone financial statements
In terms of our report attached. For and on behalf of the Board of Directors
F Metro Brands Limited or Deloitte Haskins & SellsChartered Accountants Sd/- Sd/-Ketan Vora Rafique A.Malik Farah Malik Bhanji Partner Chairman Managing Director & Chief Executive Officer DIN:00521563 DIN:00530676 Sd/- Sd/-
P Kaushal Parekh Tarannum Bhanpurwala lace: Mumbai
Date : June 25, 2021 Chief Financial Officer Company Secretary
Standalone Statement of cash flow for the year ended March 31, 2021
45
₹ in Lakhs

Standalone Statement of changes in equity for the year ended March 31, 2021
₹ in LakhsA. Equity share capital
Year ended Year endedParticulars
March 31, 2021 March 31, 2020
Balance as at beginning of the year 13,276.71 13,276.71
Changes in Equity Share Capital during the year - -
Balance as the end of the year 13,276.71 13,276.71
B. Other Equity
Reserves and Surplus
Securities General Employee stock Retained Other Particulars premium reserve options earnings comprehensive Total outstanding income reserve (net of taxes)
Balance as at March 31, 2019 77.53 - 2.85 53,169.06 (71.40) 53,178.04
As at April 1, 2019 77.53 - 2.85 53,169.06 (71.40) 53,178.04
Impact on account of adoption of IND AS 116 (refer Note no.29) - - - (3,684.62) - (3,684.62)
Restated balance as at April 1, 2019 77.53 - 2.85 49,484.44 (71.40) 49,493.42
Profit for the year - - - 15,187.87 - 15,187.87
Other comprehensive income (net of income tax) - - - - 43.77 43.77
Total comprehensive income for the year - - - 15,187.87 43.77 15,231.64
Balance as at March 31, 2020 77.53 - 2.85 64,672.31 (27.63) 64,725.06
Profit for the year - - - 7,252.44 - 7,252.44
Other comprehensive income (net of income tax) - - - - 189.12 189.12
Total comprehensive income for the year - - - 7,252.44 189.12 7,441.56
Final Dividend - - - (3,625.21) - (3,625.21)
Dividend Distribution Tax on Final Dividend - - - (357.80) - (357.80)
Interim Dividend - - - (995.75) - (995.75)
Transfer from ESOP outstanding reserve - 2.85 (2.85) - - - to General reserve
Balance as at March 31, 2021 77.53 - 2.85 66,945.99 161.49 67,187.86
See accompanying notes from 1 to 37 forming part of the standalone financial statements
In terms of our report attached. For and on behalf of the Board of Directors
F Metro Brands Limited or Deloitte Haskins & SellsChartered Accountants Sd/- Sd/-Ketan Vora Rafique A.Malik Farah Malik Bhanji Partner Chairman Managing Director & Chief Executive Officer DIN:00521563 DIN:00530676 Sd/- Sd/-
P Kaushal Parekh Tarannum Bhanpurwala lace: Mumbai
Date : June 25, 2021 Chief Financial Officer Company Secretary
₹ in Lakhs
46

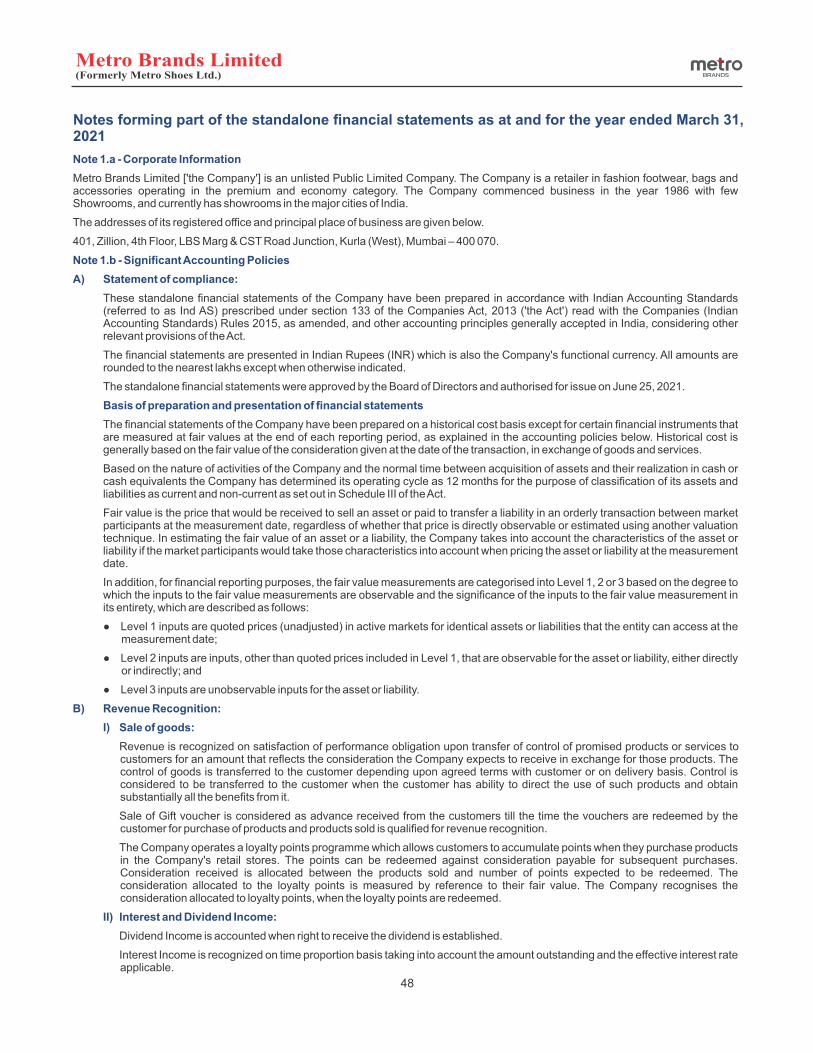
Notes forming part of the standalone financial statements as at and for the year ended March 31, 2021
Note 1.a - Corporate Information
Metro Brands Limited ['the Company'] is an unlisted Public Limited Company. The Company is a retailer in fashion footwear, bags and accessories operating in the premium and economy category. The Company commenced business in the year 1986 with few Showrooms, and currently has showrooms in the major cities of India.
The addresses of its registered office and principal place of business are given below.
401, Zillion, 4th Floor, LBS Marg & CST Road Junction, Kurla (West), Mumbai – 400 070.
Note 1.b - Significant Accounting Policies
A) Statement of compliance:
These standalone financial statements of the Company have been prepared in accordance with Indian Accounting Standards (referred to as Ind AS) prescribed under section 133 of the Companies Act, 2013 ('the Act') read with the Companies (Indian Accounting Standards) Rules 2015, as amended, and other accounting principles generally accepted in India, considering other relevant provisions of the Act.
The financial statements are presented in Indian Rupees (INR) which is also the Company's functional currency. All amounts are rounded to the nearest lakhs except when otherwise indicated.
The standalone financial statements were approved by the Board of Directors and authorised for issue on June 25, 2021.
Basis of preparation and presentation of financial statements
The financial statements of the Company have been prepared on a historical cost basis except for certain financial instruments that are measured at fair values at the end of each reporting period, as explained in the accounting policies below. Historical cost is generally based on the fair value of the consideration given at the date of the transaction, in exchange of goods and services.
Based on the nature of activities of the Company and the normal time between acquisition of assets and their realization in cash or cash equivalents the Company has determined its operating cycle as 12 months for the purpose of classification of its assets and liabilities as current and non-current as set out in Schedule III of the Act.
Fair value is the price that would be received to sell an asset or paid to transfer a liability in an orderly transaction between market participants at the measurement date, regardless of whether that price is directly observable or estimated using another valuation technique. In estimating the fair value of an asset or a liability, the Company takes into account the characteristics of the asset or liability if the market participants would take those characteristics into account when pricing the asset or liability at the measurement date.
In addition, for financial reporting purposes, the fair value measurements are categorised into Level 1, 2 or 3 based on the degree to which the inputs to the fair value measurements are observable and the significance of the inputs to the fair value measurement in its entirety, which are described as follows:
● Level 1 inputs are quoted prices (unadjusted) in active markets for identical assets or liabilities that the entity can access at the measurement date;
● Level 2 inputs are inputs, other than quoted prices included in Level 1, that are observable for the asset or liability, either directly or indirectly; and
● Level 3 inputs are unobservable inputs for the asset or liability.
B) Revenue Recognition:
I) Sale of goods:
Revenue is recognized on satisfaction of performance obligation upon transfer of control of promised products or services to customers for an amount that reflects the consideration the Company expects to receive in exchange for those products. The control of goods is transferred to the customer depending upon agreed terms with customer or on delivery basis. Control is considered to be transferred to the customer when the customer has ability to direct the use of such products and obtain substantially all the benefits from it.
Sale of Gift voucher is considered as advance received from the customers till the time the vouchers are redeemed by the customer for purchase of products and products sold is qualified for revenue recognition.
The Company operates a loyalty points programme which allows customers to accumulate points when they purchase products in the Company's retail stores. The points can be redeemed against consideration payable for subsequent purchases. Consideration received is allocated between the products sold and number of points expected to be redeemed. The consideration allocated to the loyalty points is measured by reference to their fair value. The Company recognises the consideration allocated to loyalty points, when the loyalty points are redeemed.
II) Interest and Dividend Income:
Dividend Income is accounted when right to receive the dividend is established.
Interest Income is recognized on time proportion basis taking into account the amount outstanding and the effective interest rate applicable.
48

C) Property, plant and equipment and intangible assets:
Property, plant and equipment:
Property, plant and equipment are carried at cost less accumulated depreciation / amortisation and impairment losses, if any. The cost of property, plant and equipment comprises its purchase price net of any trade discounts and rebates, any import duties and other taxes (other than those subsequently recoverable from the tax authorities), any directly attributable expenditure on making the asset ready for its intended use, other incidental expenses and interest on borrowings attributable to acquisition of qualifying property, plant and equipment up to the date the asset is ready for its intended use. Subsequent expenditure on property, plant and equipment after its purchase / completion is capitalised only if such expenditure results in an increase in the future benefits from such asset beyond its previously assessed standard of performance.
Property, plant and equipment retired from active use and held for sale are stated at the lower of their net book value and net realisable value and are disclosed separately. Any expected loss is recognised immediately in the Statement of Profit and Loss. Losses arising from the retirement of, and gains or losses arising from disposal of property, plant and equipment which are carried at cost are recognised in the Statement of Profit and Loss.
Depreciation:
Depreciation is calculated on Straight Line method over the estimated useful life of all assets. These lives are in accordance with Schedule II to the Companies Act, 2013, other than the following asset:
● Leasehold improvements are amortised on straight line basis over the period of lease or useful life (not exceeding 10 years), whichever is lower.
Intangible Assets:
Intangible Assets with finite useful lives acquired separately are carried at cost less accumulated amortisation and accumulated impairment losses, if any. Amortisation is recognised on straight line basis over their estimated useful lives. The estimated useful lives and amortisation method are reviewed at the end of each reporting period, with the effects of any changes in estimate being accounted for on a prospective basis. Intangible assets with indefinite useful lives that acquired separately are carried at cost less accumulated impairment loss.
Intangible assets are amortised over their estimated useful life as follows:-
● Trademark – 10 years
● Copy Rights – 10 years
● Computer Software – 5 years
● Commercial Rights - 10 years
Capital work in progress:
Projects under which tangible property, plant and equipment are not yet ready for their intended use are carried at cost, comprising direct cost, related incidental expenses and attributable interest.
Intangible Assets under development:
Expenditure on intangible assets under development eligible for capitalisation are carried as Intangible assets under development where such assets are not yet ready for their intended use.
D) Impairment of assets:
At the end of each reporting period, the Company reviews the carrying amounts of its tangible assets to determine whether there is any indication that those assets have suffered an impairment loss. If any such indication exists, the recoverable amount of the asset is estimated in order to determine the extent of the impairment loss (if any). When it is not possible to estimate the recoverable amount of an individual asset, the Company estimates the recoverable amount of the cash generating unit to which the asset belongs.
Recoverable amount is higher of fair value less cost of disposal and value in use. In assessing the value in use, the estimated future cash flows are discounted at their present value using the pre-tax discount rate that reflects current market assessment of time value of money and the risks specific to assets for which the estimates of future cash flows have not been adjusted.
If the recoverable amount of an asset (or cash-generating unit) is estimated to be less than its carrying amount, the carrying amount of the asset (or cash-generating unit) is reduced to its recoverable amount. An impairment loss is recognised immediately in the Statement of Profit or Loss.
When an impairment loss subsequently reverses, the carrying amount of the asset (or a cash generating unit) is increased to the revised estimate of its recoverable amount, so that the increased carrying amount does not exceed the carrying amount that would have been determined had no impairment loss been recognised for the asset or cash generating unit in prior years. A reversal of an impairment loss is recognised immediately in the Statement of Profit or Loss.
E) Inventories:
Inventories are valued at the lower of cost and net realisable value. Cost is determined on moving weighted average cost basis. Net realisable value represents the estimated selling price for inventories less all estimated costs of completion and costs necessary to make the sale.
49
Notes forming part of the standalone financial statements as at and for the year ended March 31, 2021

F) Taxes on Income:
Income Tax expense represents the sum of the current tax and deferred tax.
Current Tax:
Current tax is the tax payable on the taxable profit for the year. Taxable profit differs from 'profit before tax' as reported in the Statement of Profit and Loss because of items of income or expense that are taxable or deductible in other years and items that are never taxable or deductible. The Company's current tax is calculated using tax rates that have been enacted or substantively enacted by the end of the reporting period, in accordance with The Income Tax Act, 1961.
Deferred Tax:
Deferred tax assets and liabilities are recognized for the future tax consequences of temporary differences between the carrying values of assets and liabilities and their respective tax bases. Deferred tax assets are recognized to the extent that it is probable that future taxable income will be available against which the deductible temporary differences could be utilized.
The carrying amount of deferred tax assets is reviewed at the end of each reporting period and reduced to the extent that it is no longer probable that sufficient taxable profits will be available to allow all or part of the asset to be recovered.
Deferred tax liabilities and assets are measured at the tax rates that are expected to apply in the period in which the liability is settled or the asset is realised, based on the tax rates (and tax laws) that have been enacted or substantively enacted by the end of the reporting period.
The measurement of deferred tax liabilities and assets reflects the tax consequences that would follow from the manner in which the Company expects, at the end of the reporting period, to recover or settle the carrying amount of its assets and liabilities.
G) Employee Benefits:
Short-term employee benefits:
The undiscounted amount of short-term employee benefits expected to be paid in exchange of the services rendered by employees are recognised during the year when the employees render the service. These benefits include performance incentive and compensated absences which are expected to occur within twelve months after the end of the period in which the employee renders the related service.
In case of non-accumulating compensated absences, the cost of short-term compensated absences is accounted when the absences occur.
Long-term employee benefits:
I) Defined Contribution Plan:
The Provident Fund is a defined contribution scheme. The eligible employees of the Company are entitled to receive post-employment benefits in respect of provident fund, in which both employees and the Company make monthly contributions at a specified percentage of the employees' eligible salary. The Company's contribution is recognised as an expense in the Statement of Profit and Loss during the period in which the employee renders the related service.
II) Defined Benefit Plan:
The Company has Defined Benefit Plan in the form of Gratuity.
Gratuity fund is recognised by the Income-tax authorities and administered through an Insurance fund. Liability for Defined Benefit Plans is provided on the basis of valuations, as at the Balance Sheet date, carried out by an independent actuary.
The defined benefit obligation is calculated annually by independent actuary using the projected unit credit method. The present value of the defined benefit obligation is determined by discounting the estimated future cash outflows using discount rate (interest rates of government bonds) that have terms to maturity approximating to the terms of the Gratuity.
Remeasurement gains and losses arising from experience adjustments and changes in actuarial assumptions are recognised in the period in which they occur, directly in other comprehensive income.
They are included in 'other comprehensive income (net of taxes)' in the statement of changes in equity and in the balance sheet.
Net interest is calculated by applying the discount rate to the net defined benefit liability or asset.
H) Foreign Currencies:
i) Initial Recognition
Foreign currency transactions are recorded in the reporting currency, by applying to the foreign currency amount the exchange rate between the reporting currency and the foreign currency at the date of the transaction.
ii) Conversion
Foreign currency monetary items are translated using the closing exchange rate as on Balance Sheet date. Non-monetary items which are carried in terms of historical cost denominated in a foreign currency are reported using the exchange rate at the date of the transaction.
50
Notes forming part of the standalone financial statements as at and for the year ended March 31, 2021

Financial Instruments:
Financial Assets and Financial liabilities are recognised when a Company becomes party to the contractual provisions of the instruments. Financial assets and financial liabilities are initially measured at fair value. Transaction costs that are directly attributable to the acquisition or issue of financial assets and financial liabilities (other than financial assets and financial liabilities, at fair value through profit or loss) are added to or deducted from the fair value of the financial assets or financial liabilities, as appropriate, on initial recognition. Transaction costs directly attributable to the acquisition of financial assets or financial liabilities at fair value through profit or loss are recognised immediately in the Statement of Profit and Loss.
Financial assets:
(I) Classification:
The classification depends on the entity's business model for managing the financial assets and the contractual terms of the cash flows. The Company classifies its financial assets in the following subsequent measurement categories:
Amortised Cost
Financial Assets that are held for collection of contractual cash flows where those cash flows represent solely payments of principal and interest are measured at amortised cost. A gain or loss on a financial asset that is subsequently measured at amortised cost is recognised in the Statement of Profit and Loss when the asset is derecognised or impaired. Interest income from these financial assets is included in other income using the effective interest rate method.
Fair Value Through Other Comprehensive Income (FVOCI)
Financial Assets (including debt instruments) are subsequently measured at fair value through other comprehensive income when the asset is held within a business model with an objective that is achieved by collecting contractual cash flows and selling financial assets and the terms of the instrument give rise to cash flows that represent solely payments of principal and interest thereon. Movements in the carrying amount of such assets are taken through Other Comprehensive Income (OCI). When the financial asset is derecognised, the cumulative gain or loss previously recognised in OCI is not reclassified from equity to profit or loss. Interest income from these financial assets is included in other income using the effective interest rate method.
Fair Value Through Profit or Loss (FVTPL)
Assets that do not meet the criteria for amortised cost or FVOCI are measured at FVTPL. A gain or loss on a financial asset that is subsequently measured at fair value through profit or loss is recognised in profit or loss in the period in which it arises. Interest income from these financial assets is included in other income.
iii) Exchange Differences
Exchange differences arising on the settlement of monetary items or on remeasurement of monetary items at rates different from those at which they were initially recorded during the year, or reported in previous financial statements, are recognised as income or as expenses in the year in which they arise and disclosed as a net amount in the financial statements.
I) Employees Stock Option Plan (ESOP):
In respect of Employee Stock Options, the Company measures the compensation cost using the fair value on grant date. The compensation cost, if any, is amortised on a straight-line basis over the vesting period of the options, based on the Company's estimate of equity instruments that will eventually vest.
J) Provisions, Contingent Liabilities and Contingent Assets
(I) Provisions
Provisions are recognised when the Company has a present legal or constructive obligation as a result of past events; it is probable that an outflow of resources will be required to settle the obligation; and the amount can be reliably estimated. If the effect of the time value of money is material, provisions are discounted using a current pre-tax rate that reflects, when appropriate, the risks specific to the liability. When discounting is used, the increase in the provision due to the passage of time is recognised as a finance cost.
Provision for warranty:
The estimated liability for product warranties is recorded when products are sold. These estimates are established using historical information on the nature, frequency and average cost of warranty claims and management estimates regarding possible future incidence based on corrective actions on product failures. The timing of outflows will vary as and when warranty claim will arise.
(ii) Contingent Liabilities
Contingent liabilities are disclosed when there is:
● A possible obligation arising from past events, the existence of which will be confirmed only by the occurrence or non-occurrence of one or more uncertain future events not wholly within the control of the Company; or
● A present obligation that arises from past events where it is either not probable that an outflow of resources will be required to settle or reliable estimate of the amount cannot be made.
K) Financial assets and financial liabilities:
51
Notes forming part of the standalone financial statements as at and for the year ended March 31, 2021

(ii) Impairment of Financial Assets:
The Company assesses on a forward looking basis the expected credit losses associated with its assets carried at amortised cost and debt instruments at FVOCI. For trade receivables, loans and advances given, the Company measure the loss allowance at an amount equal to lifetime expected credit losses. This expected credit loss allowance is computed based on historical credit loss experience and adjusted for forward looking information. The computation also takes into consideration whether there has been a significant increase in credit risk.
(iii) Derecognition of Financial Assets:
A financial asset is derecognised only when:
● the Company has transferred the contractual rights to receive cash flows of the financial asset; or
● retains the contractual rights to receive the cash flows of the financial asset, but assumes a contractual obligation to pay the cash flows to one or more recipients.
Where the entity has transferred an asset, the Company evaluates whether it has transferred substantially all risks and rewards of ownership of the financial asset. In such cases, the financial asset is derecognised. Where the entity has not transferred substantially all risks and rewards of ownership of the financial asset, the financial asset is not derecognised. Where the entity has neither transferred a financial asset nor retains substantially all risks and rewards of ownership of the financial asset, the financial asset is derecognised if the Company has not retained control of the financial asset. Where the Company retains control of the financial asset, the asset is continued to be recognised to the extent of continuing involvement in the financial asset.
Financial liabilities:
Financial liabilities are subsequently measured at amortised cost using the effective interest method.
Derecognition of financial liabilities:
The Company derecognises financial liabilities when, and only when the Company's obligations are discharged, cancelled or have expired. An exchange between the lender of debt instrument with substantially different terms is accounted for as an extinguishment of the original financial liability and the recognition of a new financial liability. Similarly, a substantial modification of the term of an existing liability (whether or not attributable to the financial difficulty of the debtor) is accounted for as an extinguishment of the original financial liability and the recognition of a new financial liability. The difference between the carrying amount of the financial liability derecognised and the consideration paid and payable is recognised in the Statement of Profit or Loss.
L) Leases:
The Company has adopted Ind AS 116-Leases effective 1st April, 2019, using the modified retrospective method. The Company has applied the standard to its leases with the cumulative impact recognised on the date of initial application (1st April, 2019). Accordingly, previous period information has not been restated.
The Company's lease asset classes primarily consist of leases for showroom premise. The Company assesses whether a contract is or contains a lease, at inception of a contract. A contract is, or contains, a lease if the contract conveys the right to control the use of an identified asset for a period of time in exchange for consideration. To assess whether a contract conveys the right to control the use of an identified asset, the Company assesses whether:
i) the contract involves the use of an identified asset
ii) the Company has substantially all of the economic benefits from use of the asset through the period of the lease and
iii) the Company has the right to direct the use of the asset.
At the date of commencement of the lease, the Company recognises a right-of-use asset (“ROU”) and a corresponding lease liability for all lease arrangements in which it is a lessee, except for leases with a term of twelve months or less (short-term leases) and leases of low value assets.
The right-of-use assets are initially recognised at cost, which comprises the initial amount of the lease liability adjusted for any lease payments made at or prior to the commencement date of the lease plus any initial direct costs less any lease incentives. They are subsequently measured at cost less accumulated depreciation and impairment losses, if any. Right-of-use assets are depreciated from the commencement date on a straight-line basis over the lease term.
The lease liability is initially measured at the present value of the future lease payments. The lease payments are discounted using the interest rate implicit in the lease or, if not readily determinable, using the incremental borrowing rates. The lease liability is subsequently remeasured by increasing the carrying amount to reflect interest on the lease liability, reducing the carrying amount to reflect the lease payments made.
A lease liability is remeasured upon the occurrence of certain events such as a change in the lease term or a change in an index or rate used to determine lease payments. The remeasurement normally also adjusts the leased assets.
Practical expedient for rent concession due to COVID-19
The group has elected to apply the practical expedient of not assessing the rent concessions as a lease modification, as per MCA notification dated 24th July 2020 on IND- AS 116 for rent concessions which are granted due to COVID-19 pandemic.
52
Notes forming part of the standalone financial statements as at and for the year ended March 31, 2021

M) Earnings per Share:
Basic earnings per share is computed by dividing the profit / (loss) after tax attributable to equity shareholders by the weighted average number of equity shares outstanding during the period. Diluted earnings per share is computed by dividing the profit / (loss) after tax as adjusted for dividend, interest and other charges to expense or income relating to the dilutive potential equity shares, by the weighted average number of equity shares considered for deriving basic earnings per share and the weighted average number of equity shares which could have been issued on the conversion of all dilutive potential equity shares.
N) Cash flow statement:
Cash flows are reported using the indirect method, whereby profit / (loss) before tax is adjusted for the effects of transactions of non-cash nature and any deferrals or accruals of past or future cash receipts or payments. The cash flows from operating, investing and financing activities of the Company are segregated based on the available information.
O) Cash and cash equivalents
Cash comprises cash on hand and demand deposits with banks. Cash equivalents are short- term balances (with an original maturity of three months or less from the date of acquisitions), highly liquid investments that are readily convertible into known amounts of cash and which are subject to insignificant risk of changes in value.
P) Segment Reporting
Operating segments are reported in a manner consistent with the internal reporting provided to the chief operating decision-maker. The chief operating decision-maker, is responsible for allocating resources and assessing performance of the operating segments and makes strategic decisions (Refer Note 28)
Note 1.c - Critical Accounting Estimates and Judgements
Preparing the financial statements under Ind AS requires management to take decisions and make estimates and assumptions that may impact the value of revenues, costs, assets and liabilities and the related disclosures concerning the items involved as well as contingent assets and liabilities at the balance sheet date. Estimates and judgements are continually evaluated and are based on historical experience and other factors, including expectations of future events that are believed to be reasonable under the circumstances.
The estimates and underlying assumptions are reviewed on an ongoing basis. Revision to the estimates and underlying assumptions are reviewed on an ongoing basis. Revision to accounting estimates are recognised in the period in which the estimate is revised if the revision affects only that period, or in the period of revision and future periods if the revision affects both current and future periods.
The following are the areas involving critical estimates and judgements as at the end of the reporting period that may have a significant risk of causing a material adjustment to the carrying amount of assets and liabilities:
● Estimation of Revenue arising from Loyalty points [Refer Note 1.b(B)(i)]
● Estimation of useful life of Property, Plant and Equipment [Refer Note 1.b(c)]
● Estimation of Defined Benefit Obligation [Refer Note 1.b(G)(II)]
● Fair value measurements and valuation process [Refer Note 1.b (K)(i)]
● Impairment of Financial Assets [Refer Note 1.b(K)(ii)]
Estimation of uncertainties relating to the global health pandemic from COVID-19:
The Company has evaluated the likely impact of the COVID-19 on the overall business of the Company on account of outbreak of the second wave of the COVID-19. The Company as at the date of the approval of these financials, has used various available sources of information to analyse the carrying amount of its financial assets and exposures.
The impact of COVID-19 pandemic on the overall economic environment being uncertain may affect the underlying assumptions and estimates used to prepare the Company's financial statements, which may differ from that considered as at the date of approval of these financial statements. The Company will continue to closely monitor any material changes to future economic conditions. The Company has resumed its business activities by reopening its retail stores on a gradual basis in line with the guidelines issued by the respective State Government authorities.
53
Notes forming part of the standalone financial statements as at and for the year ended March 31, 2021

Particulars Buildings Leasehold Furniture Machinery Motor Computers Total Improvements and and Vehicles (Showrooms Fittings Equipment and Office) (Refer Foot Note)
I. Cost
Balance as at March 31, 2019 11,122.29 12,198.87 3,066.67 2,556.85 404.73 935.01 30,284.42
Additions - 2,087.67 615.46 586.51 - 205.56 3,495.20
Disposals - (1,120.30) (184.96) (147.75) - (64.23) (1,517.24)
Balance as at March 31, 2020 11,122.29 13,166.24 3,497.17 2,995.61 404.73 1,076.34 32,262.38
Additions - 1,704.18 814.02 384.47 29.37 87.39 3,019.43
Disposals - (735.42) (114.15) (110.07) - (10.38) (970.02)
Balance as at March 31, 2021 11,122.29 14,135.00 4,197.04 3,270.01 434.10 1,153.35 34,311.79
II. Accumulated depreciation
Balance as at March 31, 2019 734.45 5,088.66 1,126.16 970.33 105.03 571.77 8,596.40
Depreciation expense for the year 238.08 1,952.27 334.99 317.39 48.08 164.71 3,055.52
Eliminated on disposal of assets / write off - (932.82) (139.49) (110.23) - (60.31) (1,242.85)
Balance as at March 31, 2020 972.53 6,108.11 1,321.66 1,177.49 153.11 676.17 10,409.07
Depreciation expense for the year 238.08 1,540.10 390.26 349.16 49.09 160.97 2,727.66
Eliminated on disposal of assets / write off - (510.68) (75.97) (80.44) - (9.46) (676.55)
Balance as at March 31, 2021 1,210.61 7,137.53 1,635.95 1,446.21 202.20 827.68 12,460.18
Net carrying amount (I-II)
Balance as at March 31, 2021 9,911.68 6,997.47 2,561.09 1,823.80 231.90 325.67 21,851.61
Balance as at March 31, 2020 10,149.76 7,058.13 2,175.51 1,818.12 251.62 400.17 21,853.31
Particulars Right of use assets Total
I. Cost
Balance as at April 1, 2019 37,605.90 37,605.90
Additions 20,412.13 20,412.13
Deletion (1,084.55) (1,084.55)
Balance as at March 31, 2020 56,933.48 56,933.48
Additions 13,117.02 13,117.02
Deletion (2,049.64) (2,049.64)
Balance as at March 31, 2021 68,000.86 68,000.86
II. Accumulated amortisation
Balance as at April 1, 2019 - -
Amortization expense for the year 8,786.95 8,786.95
Balance as at March 31, 2020 8,786.95 8,786.95
Amortization expense for the year 9,253.72 9,253.72
Balance as at March 31, 2021 18,040.67 18,040.67
Net carrying amount (I-II)
Balance as at March 31, 2021 49,960.19 49,960.19
Balance as at March 31, 2020 48,146.53 48,146.53
Notes forming part of the standalone financial statements for the year ended March 31, 2021
2a. Property, Plant and Equipment:
2b. Right of use assets ₹ in Lakhs
54
₹ in Lakhs

Notes forming part of the standalone financial statements for the year ended March 31, 2021
2c. Intangible Assets (Represents other than Internally generated intangible assets) :
Particulars Copyrights Trademarks Computer Total Software
I. Cost
Balance as at March 31, 2019 26.00 230.67 746.85 1,003.52
Additions - - 145.87 145.87
Disposals - - (0.18) (0.18)
Balance as at March 31, 2020 26.00 230.67 892.54 1,149.21
Additions - - 40.43 40.43
Balance as at March 31, 2021 26.00 230.67 932.97 1,189.64
II. Accumulated amortisation
Balance as at March 31, 2019 26.00 138.17 344.41 508.58
Amortization expense for the year - 10.29 140.37 150.66
Eliminated on disposal of assets / write off - (0.18) (0.18)
Balance as at March 31, 2020 26.00 148.46 484.60 659.06
Amortization expense for the year - 10.29 129.21 139.50
Balance as at March 31, 2021 26.00 158.75 613.81 798.56
Net carrying amount (I-II)
Balance as at March 31, 2021 - 71.92 319.16 391.08
Balance as at March 31, 2020 - 82.21 407.94 490.15
3. Investments for the year ended March 31, 2021
A. Investments carried at cost
Unquoted Investments (at cost) - fully paid up
In equity instrument of Subsidiary
Equity shares of ₹ 10/- each in Metmill Footwear Private Limited. 637,500.00 - 12.75 637,500.00 - 12.75
In Equity instrument of Joint Venture
Equity shares of ₹ 10/- each in M.V.Shoe Care Private Limited 6,860,000.00 - 491.51 6,860,000.00 - 491.51
B.Investments carried at FVOCI
Quoted Investments
Investments in Bonds
7.38% PFC Tax Free Bonds 22/11/2027 of ₹ 10,00,000 each 50.00 575.35 - 50.00 547.35 -
7.35% NHAI Tax Free Bonds 2015 Series IIA of ₹ 1,000 each 14,285.00 172.61 - 14,285.00 160.23 -
8.46% IIFCL Tax Free Bonds (SERIES VIB) 30/08/2028 of ₹ 10,00,000 each 50.00 617.95 - 50.00 585.40 -
Investments in Mutual Funds
C.Investments carried at FVTPL
Unquoted Investments
Face Value of ₹ 10.00 each
NIPPON India Income Fund - Direct Growth Plan - Growth Option (Formerly Reliance Income Fund - Direct Growth Plan - Growth Option) 1,756,138.73 1,325.23 - 2,169,246.36 1,537.90 -
HDFC Gilt Fund - Direct Plan - Growth Option 3,078,537.21 1,378.20 - 3,078,537.21 1,293.41 -
Edelweiss Arbitrage Fund - Direct Plan-Dividend - Payout - - - 23,564,173.40 2,547.00 -
ICICI Prudential Equity Arbitrage Fund - Direct plan - Dividend - - - 17,797,540.50 2,593.14 -
Contd.
As at March 31, 2021
55
As at March 31, 2020
₹ in Lakhs
₹ in Lakhs
Particulars

Franklin India Ultra Short Bond Fund Super Institutional - Plan Direct - - - 15,857,659.90 4,385.20 -
Franklin India Liquid Fund-Super Institutional Plan - Direct - - - 22,378.19 667.62 -
Kotak Equity Arbitrage Fund-Direct Plan -Fortnight Dividend - - - 10,624,578.23 2,503.26 -
Nippon Arbitrage Fund- Direct Plan Dividend Plan Dividend Payout(Formerly Reliance Arbitrage Fund- Direct Plan Dividend Payout) - - - 8,545,813.33 1,125.55 -
Kotak Banking and PSU Debt Fund Direct Growth 4,931,736.46 2,541.01 - 4,931,736.46 2,349.81 -
Franklin India Savings Fund Retail Option - Direct - - - 2,854,190.40 1,082.11 -
ICICI Prudential Ultra Short Term Fund Direct Plan Growth 13,350,590.83 3,054.25 - 14,248,446.54 3,059.63 -
Aditya Birla Sunlife Money Manager Fund - Growth - Direct Plan - - - 993,156.61 2,690.69 -
AXIS Banking and PSU Debt Fund - Direct Growth 25,427.47 533.41 - - - -
AXIS Arbitrage Fund - Direct Growth 10,020,092.66 1,547.37 - - - -
Edelweiss Arbitrage Fund - Direct Plan Growth 16,845,074.98 2,652.64 - - - -
ICICI Prudential Equity Arbitrage Fund - Direct Plan Growth 9,532,102.62 2,673.96 - - - -
KOTAK Equity Arbitrage Fund- Direct Plan Growth 8,506,443.00 2,575.84 - - - -
L&T Arbitage Opportunities Direct Plan - Growth 8,628,040.43 1,344.59 - - - -
HDFC Ultra Short Term Fund - Direct Growth 27,404,265.81 3,271.90 - - - -
Face Value of ₹ 100.00 each
Aditya Birla Sunlife Income Plus - Growth - Direct Plan 1,590,562.15 1,643.52 - 1,590,562.15 1,510.33 -
Aditya Birla Sunlife Savings Fund - Growth - Direct Plan 283,731.80 1,211.07 - 125,232.37 501.97 -
Aditya Birla Sunlife Banking and PSY Debt Fund - Growth - Direct Plan 863,506.52 2,501.75 - 187,991.83 501.87 -
ICICI Prudential Savings Fund - Direct Plan 485,296.47 2,036.73 - - -
Face Value of ₹ 1,000.00 each
Aditya Birla Sun Life Liquid Fund - Growth - Direct Plan - - - 440,082.46 1,406.32 -
Kotak Money Market Fund -Direct Plan - Growth 37,509.70 1,306.76 - 37,509.70 1,242.73 -
AXIS Liquid Fund - Direct Growth 4,589.23 104.85 - 32,349.95 713.10 -
HDFC Money Market Fund - Direct Plan 51,030.84 2,283.08 - - -
Invesco India Liquid Fund - Direct Plan Growth 25,337.38 716.05 - - - -
TRUSTMF Banking and PSU Debt Fund - Direct Plan 99,995.00 1,001.68 - - -
Quoted Investments
Bharat Bond ETF 30/04/2030 of ₹ 1000 each 100,000.00 1,131.19 - 100,000.00 1,041.38 -
Bharat Bond ETF - April 2025 of ₹ 1000 each 99,995.00 1,035.93 - - -
Total (Aggregate amount of unquoted investments) 35,703.89 504.26 31,711.64 504.26
Total (Aggregate amount of quoted investments) 3,533.03 - 2,334.36 -
Total 39,236.92 504.26 34,046.00 504.26
Notes forming part of the standalone financial statements for the year ended March 31, 2021
21
56
As at March 31, 2021 As at March 31, 2020
₹ in Lakhs

(i) Advances to
(i) Vendors 861.38 - 861.38 547.14 - 547.14
Less: Allowance for doubtful Advances (69.13) - (69.13) - -
792.25 - 792.25 547.14 - 547.14
(ii) Related party-Metmill Footwear Private Limited, Subsidiary, a Private Limited Company in which a Director of the Company is a Director. (Refer Note 27) - - - 1,595.60 - 1,595.60
(ii) Capital advances - 6.77 6.77 - 96.06 96.06
(iii) Balances with government authorities :
(i) Goods and Services tax/Value Added tax credit receivable 1,156.48 2.28 1,158.76 1,463.43 2.28 1,465.71
(iv) Prepayments 171.06 3.59 174.65 190.97 1.06 192.03
(v) Prepaid Rent 44.88 230.74 275.62 27.33 127.28 154.61
(vi) Others (Receivables from Showroom Managers, Retail Agent etc.) 76.83 - 76.83 61.91 - 61.91
Less: Allowance for doubtful receivables (16.17) - (16.17) - - -
60.66 - 60.66 61.91 - 61.91
(vii) Amounts paid under protest [Sales tax ₹ 50.85 Lakhs (March 31, 2020- - 50.85 50.85 - 53.79 53.79 Sales tax ₹ 53.79 Lakhs )]
Total 2,225.33 294.23 2,519.56 3,886.38 280.47 4,166.85
Loans to related party (Subsidiary)
Metmill Footwear Private Limited (given for working
capital repayable on demand) (Refer Note 27) 148.34 - 148.34 148.34 - 148.34
Loans to employees 19.44 - 19.44 27.13 - 27.13
Loans to Selling agents, Retail agents, Supervisors and others 168.45 - 168.45 160.29 - 160.29
Total 336.23 - 336.23 335.76 - 335.76
4. Loans (Unsecured, considered good)
Total TotalTotal
As at March 31, 2021 As at March 31, 2020
₹ in Lakhs
Notes forming part of the standalone financial statements for the year ended March 31, 2021
57
5. Other financial assets
Security Deposits
(i) Others 1,201.65 3,695.45 4,897.10 656.45 3,878.21 4,534.66
Less: Allowance for doubtful deposits (15.62) - (15.62) (11.20) (11.20)
1,186.03 3,695.45 4,881.48 645.25 3,878.21 4,523.46
Bank Deposit with more than 12 months maturity from the Balance Sheet date - 26.72 26.72 - 36.10 36.10
Insurance Claim Receivable 6.79 - 6.79 12.14 - 12.14
Interest accrued on deposits with banks, loans and investments (Refer Note 27) 118.39 - 118.39 55.16 - 55.16
Total 1,311.21 3,722.17 5,033.38 712.55 3,914.31 4,626.86
6. Other assets
Total Total
Total Total
₹ in Lakhs
As at March 31, 2021 As at March 31, 2020
As at March 31, 2021 As at March 31, 2020
₹ in Lakhs
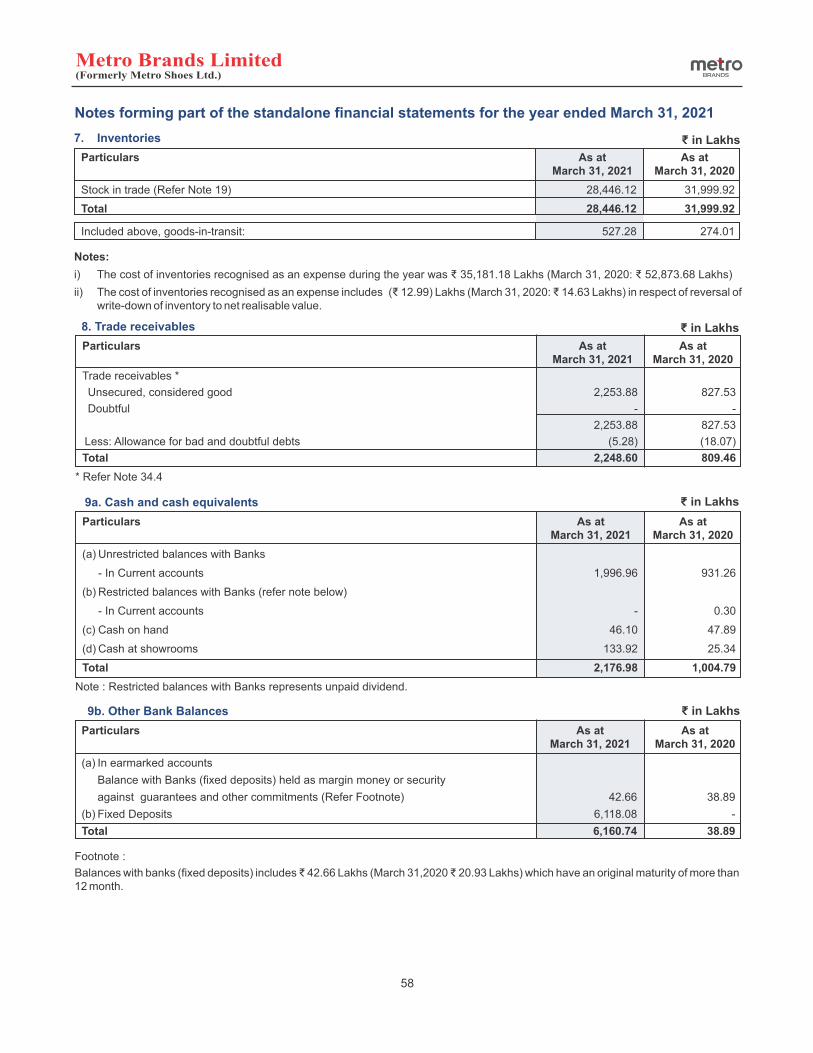
9b. Other Bank Balances
Particulars As at As at March 31, 2021 March 31, 2020
(a) In earmarked accounts
Balance with Banks (fixed deposits) held as margin money or security
against guarantees and other commitments (Refer Footnote) 42.66 38.89
(b) Fixed Deposits 6,118.08 -
Total 6,160.74 38.89
Footnote :
Balances with banks (fixed deposits) includes ₹ 42.66 Lakhs (March 31,2020 ₹ 20.93 Lakhs) which have an original maturity of more than 12 month.
8. Trade receivables
Particulars As at As at March 31, 2021 March 31, 2020
Trade receivables *
Unsecured, considered good 2,253.88 827.53
Doubtful - -
2,253.88 827.53
Less: Allowance for bad and doubtful debts (5.28) (18.07)
Total 2,248.60 809.46
* Refer Note 34.4
Notes forming part of the standalone financial statements for the year ended March 31, 2021
58
9a. Cash and cash equivalents
Particulars As at As at March 31, 2021 March 31, 2020
(a) Unrestricted balances with Banks
- In Current accounts 1,996.96 931.26
(b) Restricted balances with Banks (refer note below)
- In Current accounts - 0.30
(c) Cash on hand 46.10 47.89
(d) Cash at showrooms 133.92 25.34
Total 2,176.98 1,004.79
Note : Restricted balances with Banks represents unpaid dividend.
₹ in Lakhs
₹ in Lakhs
₹ in Lakhs
7. Inventories
Particulars As at As at March 31, 2021 March 31, 2020
Stock in trade (Refer Note 19) 28,446.12 31,999.92
Total 28,446.12 31,999.92
Included above, goods-in-transit: 527.28 274.01
Notes:
i) The cost of inventories recognised as an expense during the year was ₹ 35,181.18 Lakhs (March 31, 2020: ₹ 52,873.68 Lakhs)
ii) The cost of inventories recognised as an expense includes (₹ 12.99) Lakhs (March 31, 2020: ₹ 14.63 Lakhs) in respect of reversal of write-down of inventory to net realisable value.
₹ in Lakhs

10 Equity Share Capital ₹ in Lakhs
Particulars As at As at March 31, 2021 March 31, 2020
Number of Share Capital Number of Share Capital Shares ₹ in Lakhs Shares ₹ in Lakhs
Authorised:
Equity shares of ₹ 5/- each (FY 2019-20 ₹ 10/- each) 300,000,000 15,000.00 150,000,000 15,000.00
Issued, Subscribed and Fully Paid-up:
Equity shares of Rs of ₹ 5/- each (FY 2019-20 ₹ 10/- each) 265,534,290 13,276.71 132,767,145 13,276.71
Total 13,276.71 13,276.71
10.1 Reconciliation of the number of shares and amount outstanding at the beginning and at the end of the reporting period ₹ in Lakhs
Particulars As at As at March 31, 2021 March 31, 2020
Number of Share Capital Number of Share Capital Shares ₹ in Lakhs Shares ₹ in Lakhs
Equity Share Capital
Balance as at beginning of the year (Equity shares of Rs of ₹ 5/- each (FY 2019-20 ₹ 10/- each) 132,767,145 13,276.71 132,767,145 13,276.71
Equity shares arising on shares split from ₹ 10/- to ₹ 5 per share 132,767,145 - - -
Balance as at the end of the year 265,534,290 13,276.71 132,767,145 13,276.71
Note : The equity shares of the Company, during the year, have been sub-divided from existing face value of ₹ 10/- per equity share to face value of ₹ 5/- per equity share.
10.2 Details of shares held by each shareholder holding more than 5% shares:
Particulars As at As at March 31, 2021 March 31, 2020
Number of % holding Number of % holding Shares held Shares held
Farah Malik Bhanji* 167,150,520 62.95% 83,575,260 62.95%
Rakesh Jhunjhunwala** 39,153,600 14.75% 19,576,800 14.76%
Rafique A. Malik*** 18,576,000 7.00% 9,288,000 6.98%
*Includes shares held by Farah Malik Bhanji
(a) As Trustee for the benefit of Rafique Malik Family Trust 79,027,920 39,513,960
(b) As Trustee for the benefit of Aziza Malik Family Trust 80,184,600 40,092,300
**Includes shares held by Rakesh Jhunjhunwala
(a) As Trustee for the benefit of Aryaman Jhunjhunwala Discretionary Trust 13,051,206 6,525,603
(b) As Trustee for the benefit of Aryavir Jhunjhunwala Discretionary Trust 13,051,206 6,525,603
(c) As Trustee for the benefit of Nishtha Jhunjhunwala Discretionary Trust 13,051,188 6,525,594
***Includes shares held by Rafique A. Malik
(a) As Trustee for the benefit of Zarah Malik Family Trust 3,969,000 1,984,500
(b) As Trustee for the benefit of Farah Malik Family Trust 3,969,000 1,984,500
(c) As Trustee for the benefit of Zia Malik Family Trust 3,969,000 1,984,500
(d) As Trustee for the benefit of Sabina Malik Family Trust 3,969,000 1,984,500
Note : The equity shares of the Company, during the year, have been sub-divided from existing face value of ₹ 10/- per equity share to face value of ₹ 5/- per equity share.
10.3 Employees Stock Option Scheme
85,500 Equity Shares of the face value ₹ 5 each (March 31, 2020 - 54,900 Equity Shares of the face value ₹ 10 each) are reserved under Employee Stock Option Plan of the Company [Refer Note 32].
Notes forming part of the standalone financial statements for the year ended March 31, 2021
59

Particulars
Current Non- Current Total Current Non-Current Total
Security Deposit - Franchisee 130.00 - 130.00 95.25 - 95.25
Security Deposit - Related party 0.99 - 0.99 0.99 - 0.99
Retention Money Payable (Selling Agents, Supervisors, City and Regional Managers and Others) 713.54 - 713.54 781.22 - 781.22
Payable on acquisition of Property, Plant & Equipment 600.94 - 600.94 982.00 - 982.00
Unpaid Dividend - - - 0.30 - 0.30
Total 1,445.47 - 1,445.47 1,859.76 - 1,859.76
11 Other equity ₹ in Lakhs
Reserves and Surplus
Securities General Employee Retained Other Total premium reserve stock earnings compreh- options ensive outstanding income reserve (net of taxes)
Balance as at March 31, 2019 77.53 - 2.85 53,169.06 (71.40) 53,178.04
As at April 1, 2019 77.53 - 2.85 53,169.06 (71.40) 53,178.04
Impact on account of adoption of IND AS 116 (refer Note no.29) - - - (3,684.62) - (3,684.62)
Restated balance as at April 1, 2019 77.53 - 2.85 49,484.44 (71.40) 49,493.42
Profit for the year - - - 15,187.87 - 15,187.87
Other comprehensive income(net of income tax) - - - - 43.77 43.77
Total comprehensive income for the year - - - 15,187.87 43.77 15,231.64
Balance as at March 31, 2020 77.53 - 2.85 64,672.31 (27.63) 64,725.06
Profit for the year - - - 7,252.44 - 7,252.44
Other comprehensive income(net of income tax) - - - - 189.12 189.12
Total comprehensive income for the year - - - 7,252.44 189.12 7,441.56
Final Dividend - - - (3,625.21) - (3,625.21)
Dividend Distribution Tax on Final Dividend - - - (357.80) - (357.80)
Interim Dividend - - - (995.75) - (995.75)
Transfer from ESOP outstanding reserve to General reserve - 2.85 (2.85) - - -
Balance as at March 31, 2021 77.53 2.85 - 66,945.99 161.49 67,187.86
Securities Premium:
Securites Premium is created when shares are issued at premium . The Company can use this reserve in accordance with the provisions of the Act.
General Reserve:
General Reserve is created out of profits of the Company. The reserve is created in accordance with the provisions of the Act.
Employees Stock Options Outstanding Account:
The above reserve relates to stock options granted by the Company to its employees under its employee stock option plan.
Other Comprehensive Income:
Other comprehensive income represent change in the value of investments accounted through FVOCI.
As at March 31, 2021 As at March 31, 2020
₹ in Lakhs12. Other financial liabilities
Notes forming part of the standalone financial statements for the year ended March 31, 2021
60
10.4 Rights, preference and restriction attached to equity shares:
The Company is having only one class of equity shares having par value of ₹ 5/- each (P.Y. ₹ 10/- each). Each holder of equity share is entitled to one vote per share. The Board of Director’s of Company have proposed final dividend of ₹ 1.125 per equity share of ₹ 5/- each (P.Y.₹ 3/- per equity share of ₹ 10/- each) for financial year 2020-2021 totaling to ₹ 2,987.26 Lakhs (P.Y.₹ 3,983.01 Lakhs). The dividend proposed by the Board of Directors is subject to the approval of the shareholders in the ensuing Annual General Meeting, except in case of interim dividend.
In the event of liquidation of the Company, the holders of the equity shares will be entitled to receive remaining assets of the Company, after the distribution of all preferential amounts if any. The distribution will be in proportion to the number of equity shares held by the shareholders.
Particulars
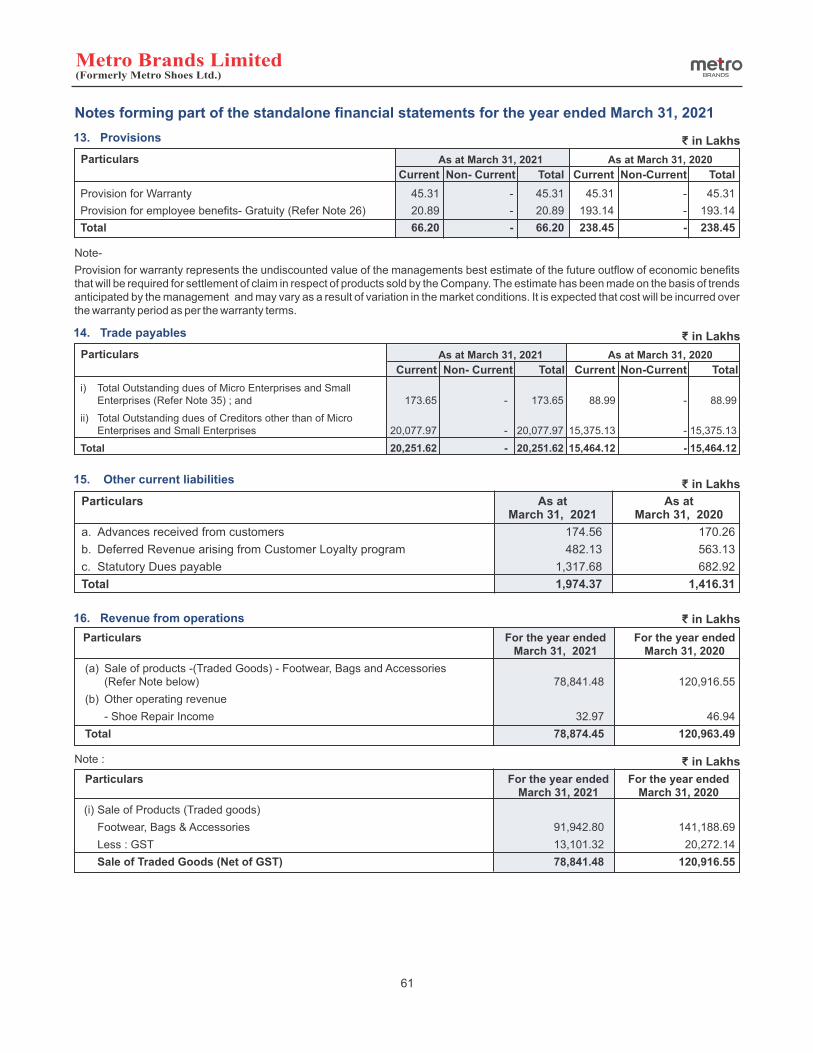
Particulars
Current Non- Current Total Current Non-Current Total
i) Total Outstanding dues of Micro Enterprises and Small Enterprises (Refer Note 35) ; and 173.65 - 173.65 88.99 - 88.99
ii) Total Outstanding dues of Creditors other than of Micro Enterprises and Small Enterprises 20,077.97 - 20,077.97 15,375.13 - 15,375.13
Total 20,251.62 - 20,251.62 15,464.12 - 15,464.12
Particulars
Current Non- Current Total Current Non-Current Total
Provision for Warranty 45.31 - 45.31 45.31 - 45.31
Provision for employee benefits- Gratuity (Refer Note 26) 20.89 - 20.89 193.14 - 193.14
Total 66.20 - 66.20 238.45 - 238.45
Note-
Provision for warranty represents the undiscounted value of the managements best estimate of the future outflow of economic benefits that will be required for settlement of claim in respect of products sold by the Company. The estimate has been made on the basis of trends anticipated by the management and may vary as a result of variation in the market conditions. It is expected that cost will be incurred over the warranty period as per the warranty terms.
As at March 31, 2021 As at March 31, 2020
₹ in Lakhs13. Provisions
Notes forming part of the standalone financial statements for the year ended March 31, 2021
As at March 31, 2021 As at March 31, 2020
₹ in Lakhs14. Trade payables
₹ in Lakhs15. Other current liabilities
Particulars As at As at March 31, 2021 March 31, 2020
a. Advances received from customers 174.56 170.26
b. Deferred Revenue arising from Customer Loyalty program 482.13 563.13
c. Statutory Dues payable 1,317.68 682.92
Total 1,974.37 1,416.31
Particulars For the year ended For the year ended March 31, 2021 March 31, 2020
(a) Sale of products -(Traded Goods) - Footwear, Bags and Accessories (Refer Note below) 78,841.48 120,916.55
(b) Other operating revenue
- Shoe Repair Income 32.97 46.94
Total 78,874.45 120,963.49
Note :
Particulars For the year ended For the year ended March 31, 2021 March 31, 2020
(i) Sale of Products (Traded goods)
Footwear, Bags & Accessories 91,942.80 141,188.69
Less : GST 13,101.32 20,272.14
Sale of Traded Goods (Net of GST) 78,841.48 120,916.55
16. Revenue from operations ₹ in Lakhs
61
₹ in Lakhs
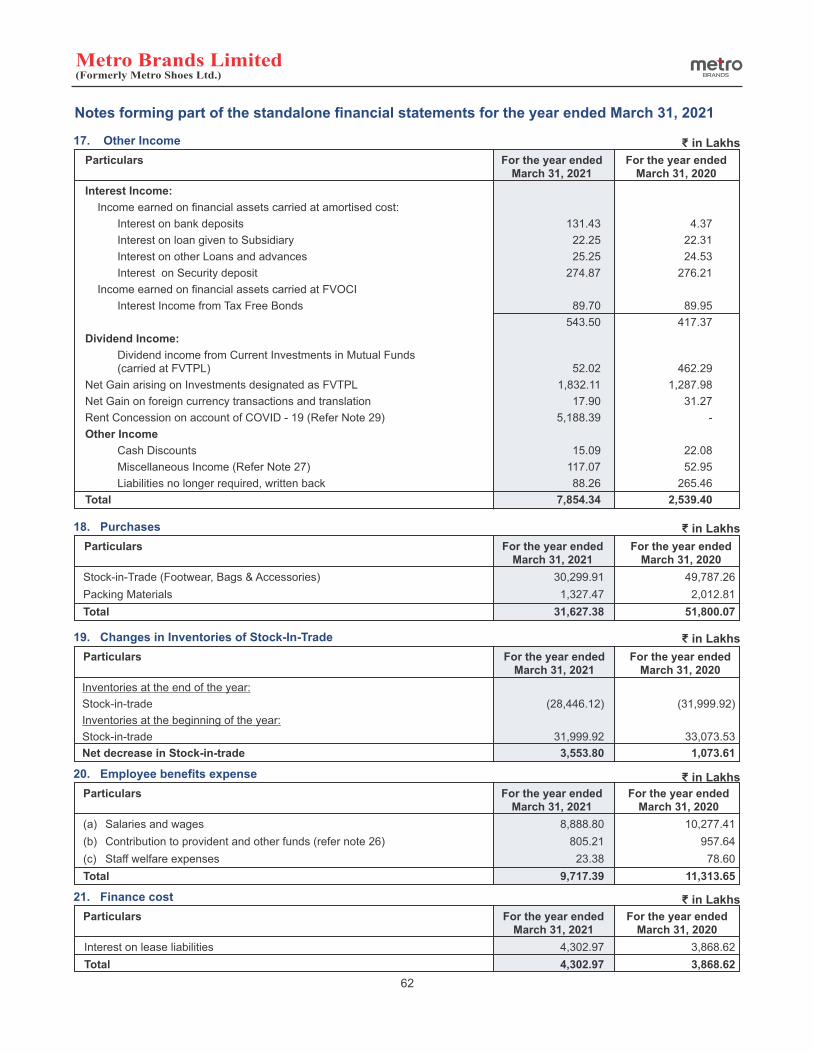
Notes forming part of the standalone financial statements for the year ended March 31, 2021
Particulars For the year ended For the year ended March 31, 2021 March 31, 2020
Interest Income:
Income earned on financial assets carried at amortised cost:
Interest on bank deposits 131.43 4.37
Interest on loan given to Subsidiary 22.25 22.31
Interest on other Loans and advances 25.25 24.53
Interest on Security deposit 274.87 276.21
Income earned on financial assets carried at FVOCI
Interest Income from Tax Free Bonds 89.70 89.95
543.50 417.37
Dividend Income:
Dividend income from Current Investments in Mutual Funds (carried at FVTPL) 52.02 462.29
Net Gain arising on Investments designated as FVTPL 1,832.11 1,287.98
Net Gain on foreign currency transactions and translation 17.90 31.27
Rent Concession on account of COVID - 19 (Refer Note 29) 5,188.39 -
Other Income
Cash Discounts 15.09 22.08
Miscellaneous Income (Refer Note 27) 117.07 52.95
Liabilities no longer required, written back 88.26 265.46
Total 7,854.34 2,539.40
17. Other Income ₹ in Lakhs
Particulars For the year ended For the year ended March 31, 2021 March 31, 2020
Stock-in-Trade (Footwear, Bags & Accessories) 30,299.91 49,787.26
Packing Materials 1,327.47 2,012.81
Total 31,627.38 51,800.07
18. Purchases ₹ in Lakhs
Particulars For the year ended For the year ended March 31, 2021 March 31, 2020
Inventories at the end of the year:
Stock-in-trade (28,446.12) (31,999.92)
Inventories at the beginning of the year:
Stock-in-trade 31,999.92 33,073.53
Net decrease in Stock-in-trade 3,553.80 1,073.61
19. Changes in Inventories of Stock-In-Trade ₹ in Lakhs
Particulars For the year ended For the year ended March 31, 2021 March 31, 2020
(a) Salaries and wages 8,888.80 10,277.41
(b) Contribution to provident and other funds (refer note 26) 805.21 957.64
(c) Staff welfare expenses 23.38 78.60
Total 9,717.39 11,313.65
20. Employee benefits expense ₹ in Lakhs
Particulars For the year ended For the year ended March 31, 2021 March 31, 2020
Interest on lease liabilities 4,302.97 3,868.62
Total 4,302.97 3,868.62
21. Finance cost ₹ in Lakhs
62

Notes forming part of the standalone financial statements for the year ended March 31, 2021
Particulars For the year ended For the year ended March 31, 2021 March 31, 2020
Power and fuel 1,464.09 2,004.32
Rent [Refer note 29] 2,378.00 3,336.00
Rates and taxes 166.15 218.30
Insurance 111.78 102.09
Repairs and maintenance - Machinery and Equipment 71.36 79.84
Repairs and maintenance - Others 492.41 904.53
Advertisement & Sales promotion 1,602.65 4,454.23
Commission on sales 4,558.62 4,651.18
Commission on Credit Card Sales 375.05 730.90
Freight Charges 1,166.00 1,095.79
Maintenance & Other Charges - Showrooms [Refer Note 29] 1,660.04 2,033.60
Shoe Repair Expenses 66.76 101.88
Communication 166.65 196.73
Travelling and conveyance 119.43 618.46
Donations 1.00 5.00
Legal and professional 254.14 556.78
Payments to auditors (Refer Note 21.1) 33.00 43.40
Loss on Sale/ discard of Property, plant and equipment (net) 258.03 253.39
Corporate Social Responsibility (Refer Note 32) 406.37 184.77
Allowance for doubtful trade receivables, advances and deposits 76.93 -
Interest on delayed payment of taxes and others 114.20 16.56
Advances written off 70.35 91.17
Miscellaneous Expenses 679.55 1,066.60
Total 16,292.56 22,745.52
22. Other expenses ₹ in Lakhs
Particulars For the year ended For the year ended March 31, 2021 March 31, 2020
To statutory auditor
(i) For Audit 20.00 20.00
(ii) For Taxation Matters 2.50 2.50
(iii) For Consolidation 0.50 0.50
(iv) For Other Services 10.00 20.40
Total 33.00 43.40
22.1 Payment to auditors: ₹ in Lakhs
Particulars For the year ended For the year ended March 31, 2021 March 31, 2020
Current tax:
In respect of current year 2,428.36 5,288.96
In respect of prior year (69.70) 74.72
2,358.66 5,363.68
Deferred tax:
In respect of current year origination and reversal of temporary differences (497.30) 156.74
Total 1,861.36 5,520.42
23. Current Tax and deferred tax (a) Income tax recognised in Statement of Profit and Loss ₹ in Lakhs
63

Particulars F or the year ended March 31, 2020
Opening On Ind Recognised in the Recognised in Closing Balance AS Statement of Other Balance opening Profit and Loss Comprehensive Income
Tax effect of items constituting deferred tax asset/(liabilities)
Property, plant and equipment (233.84) - 254.84 - 21.00
Allowance for doubtful trade receivables, advances and deposits 10.29 - (2.88) - 7.41
Fair valuation on investments (523.35) - (97.60) - (620.95)
Deferred Tax on Ind AS 116 -Leases - 1,979.15 (305.21) - 1,673.94
Others 21.07 - (5.89) - 15.18
Net deferred tax asset/(liabilities) (725.83) 1,979.15 (156.74) - 1,096.58
Notes forming part of the standalone financial statements for the year ended March 31, 2021
Particulars For the year ended For the year ended March 31, 2021 March 31, 2020
Current tax :
Remeasurement of defined benefit obligations (39.09) 1.01
Total (39.09) 1.01
Bifurcation of income tax recognised in other comprehensive income into:
-Items that will not be reclassified to profit and loss (39.09) 1.01
Total (39.09) 1.01
(b) Income tax recognised in other comprehensive income ₹ in Lakhs
Particulars For the year ended For the year ended March 31, 2021 March 31, 2020
Profit before tax 9,113.80 20,708.29
Income tax expense calculated at 25.17% 2,293.94 5,212.28
Impact of tax rate change - 350.56
Effect of income that is exempt from taxation (535.23) (198.50)
Effect of expenses that are non-deductible in determining taxable profit 341.78 165.45
Effect of deduction (169.43) (84.09)
Tax of prior years (69.70) 74.72
Income tax expense recognised in Statement of Profit and Loss 1,861.36 5,520.42
(c) Reconciliation of income tax expense and the accounting profit multiplied by Company's domestic tax rate:
₹ in Lakhs
Particulars F or the year ended March 31, 2021
Opening On Ind Recognised in the Recognised in Closing Balance AS Statement of Other Balance opening Profit and Loss Comprehensive Income
Tax effect of items constituting deferred tax asset/(liabilities)
Property, plant and equipment 21.00 - 83.35 - 104.35
Allowance for doubtful trade receivables, advances and deposits 7.41 - 19.32 - 26.73
Fair valuation on investments (620.95) - 163.63 - (457.32)
Deferred Tax on Ind AS 116 -Leases 1,673.94 - 246.18 - 1,920.12
Others 15.18 - (15.18) - -
Net deferred tax asset/(liabilities) 1,096.58 - 497.30 - 1,593.88
24. Deferred tax ₹ in Lakhs
64

CESTAT, Mumbai
The Supreme Court of India
Deputy Commissioner Appeal, Ernakulam
Deputy Commissioner Appeal, Ernakulam
Joint Commissioner -1 Appeal, Ahmedabad
Joint Commissioner of Commercial Tax (Appeals) - Bihar
Joint Excise and Taxation Commissioner (Appeals) - Faridabad
Special Commissioner Sales Tax, Large Taxpayer Unit, Corporate Div. Circle, West Bangal
Assistant Commissioner of State Tax- Bihar
Special Commissioner Sales Tax, Large Taxpayer Unit, Corporate Div. Circle, West Bangal
Income Tax Officer - TDS (As at March 31, 2019: The Bombay High Court)
Income Tax Officer - TDS (As at March 31, 2019: The Bombay High Court)
Income Tax Officer - TDS (As at March 31, 2019: The Bombay High Court)
Income Tax Officer - TDS (As at March 31, 2019: The Bombay High Court)
Commissioner of Income Tax, Appeal
CPC - Income Tax
Income Tax - E Assessment Center, Delhi
(i) Contingent Liabilities
(a) Claims not acknowledged as debts
Service Tax
(b) Guarantee given to bank on behalf of Metmill Footwear Pvt. Ltd.(Subsidiary company)
Loan utilized against above Guarantee given
(c) Other money for which the company is contingently liable
ii) Commitments
a) Estimated amount of contracts remaining to be executed on capital account (net of advances paid) and not provided
8.87
10.59
20.05
1.61
645.84
76.43
2.71
-
7.89
-
-
-
-
-
3.01
0.46
453.20
2,500.00
NIL
20.50
114.18
₹ in Lakhs
Notes forming part of the standalone financial statements for the year ended March 31, 2021
25 . Contingent Liabilities and commitments (to the extent not provided for)
As at March 31, 2020
As at March 31, 2021
8.87
10.59
20.05
1.61
645.84
76.43
2.71
5.49
-
1.21
1.22
8.07
12.46
13.61
4.55
-
-
2,500.00
1011.76
20.50
1,043.51
Apr'2006 - Mar'2014
Sept'2008 - Mar'2011
F.Y. 2012-2013
F.Y. 2011-2012
F.Y. 2013-2014
F.Y. 2013-2014
F.Y. 2015-2016
F.Y. 2017-2018
F.Y. 2018-2019
F.Y. 2017-2018
A.Y. 2009-10
A.Y. 2010-11
A.Y. 2011-12
A.Y. 2012-13
A.Y. 2011-12
A.Y. 2012-13
A.Y. 2018-19
Future ultimate outflow of resources embodying economic benefits in respect of matters stated under Note 25(i)(a) and (c ) depends on the final outcome of judgements / decisions on the matters involved.
26 Employee Benefits:
Defined - Contribution Plans
The Company offers its employees defined contribution plan in the form of provident fund & ESIC. Both the employees and the Company pay pre determined contributions into the Provident Fund & ESIC. The contributions are normally based on a certain proportion of the employee's salary. The Company recognised Provident Fund ₹ 511.90 Lakhs (Previous year ₹ 603.24 Lakhs) & ESIC ₹ 130.67 Lakhs (Previous year ₹ 184.19 Lakhs)in the Statement of Profit and Loss.
Defined Benefit Plans- Gratuity
The Company has an obligation towards gratuity, a funded defined benefit retirement plan covering eligible employees. The plan provides for lump sum payment to vested employees at retirement, death while in employment or on termination of the
Central Excise
Sales Tax
Income Tax
65

employment of an amount equivalent to 15 days salary, payable for each completed year of service or part thereof in excess of six months in terms of gratuity scheme of the Company or as per the Payment of the Gratuity Act, whichever is higher. Vesting occurs upon completion of five years of service.
There is no cap on the amount of gratuity paid to an eligible employee at retirement, death while in employment or on termination of the employment.
a) The principal actuarial risks to which the Company is exposed are investment risk, interest rate risk, longevity risk and salary risk
Investment risk The probability or likelihood of occurrence of losses relative to the expected return on any particular investment.
Interest risk The plan exposes the Company to the risk of fall in interest rates. A fall in interest rates will result in an increase in the ultimate cost of providing the above benefit and will thus result in an increase in the value of the liability.
Longevity risk The Company has used certain mortality and attrition assumptions in the valuation of the liability. An increase in the life expectancy / longevity of plan participants will increase the plan's liability and vice versa.
Salary Risk The present value of the defined benefit plan is calculated with the assumption of salary increase rate of plan participants in future. Deviation in the rate of increase of salary in future for plan participants from the rate of increase in salary used to determine the present value of obligation will have a bearing on the plan’s liability.
Gratuity Year ended Year ended March 31, 2021 March 31, 2020
I. Expense recognized in the Statement of Profit and Loss for the year ended March 31
1. Current Service Cost 173.01 180.96
2. Interest Cost on the net defined benefit liability /(asset) (net) 10.03 14.55
Total 183.04 195.51
II. Included in other comprehensive income
1. Return on plan assets, excluding amount recognised in net interest expense (109.58) 42.69
2. Actuarial losses on account of :
- change in demographic assumptions 5.47 4.25
- change in financial assumptions 21.38 (53.43)
- experience variance (72.56) 10.51
(155.29) 4.02
III. Net Asset/ (Liability) recognized in the Balance Sheet
1. Present Value of Defined Benefit Obligation 1,736.21 1,617.19
2. Fair value of plan assets 1,715.32 1,424.05
3. Net (liability) as at end of the year (20.89) (193.14)
IV. Change in the obligation during the year
1. Present Value of Defined Benefit Obligation at the beginning of the year 1,617.19 1,534.83
2. Expenses recognised in profit and loss Account
- Current Service Cost 173.01 180.96
- Interest Cost 84.03 115.36
3. Remeasurement gains/(losses)
- change in demographic assumptions 5.47 4.25
- change in financial assumptions 21.38 (53.43)
- experience variance (i.e. Actual experience vs assumptions) (72.56) 10.51
4. Benefit Payments (92.31) (175.29)
5. Present Value of Defined Benefit Obligation at the end of the year 1,736.21 1,617.19
V. Change in Fair Value of Assets during the year
1. Plan assets at the beginning of the year 1,424.05 1,341.22
2. Investment Income 74.00 100.81
₹ in Lakhsb) Details of Defined Benefit Plan of the Company (As per Actuarial Valuation)
Notes forming part of the standalone financial statements for the year ended March 31, 2021
66

Year ended Year ended Gratuity March 31, 2021 March 31, 2020 3 Recognised in other comprehensive income
Remeasurement gains /(losses)
- Actual return on plan assets in excess of the expected Return 109.58 (42.69)
4. Contribution by employer 200.00 200.00
5. Benefits paid (92.31) (175.29)
6. Fair value of Plan assets at the end of the year 1,715.32 1,424.05
VI. The major categories of plan assets of the fair value of the total plan assets
- Government of India Securities (Central & State) 622.23 476.42
- High quality corporate bonds (Including public sector bonds) 488.01 210.05
- Equity shares, Equity mutual funds and ETF 166.99 302.04
- Cash (Including liquid mutual funds) 42.03 40.59
- Others 396.06 394.96
Total 1,715.32 1,424.05
VII. Actuarial assumptions
1. Discount Rate [HO] 6.40% 6.55%
Discount Rate [Sales Staff] 4.80% 5.20%
2. Expected rate of return on plan assets 8.00% 8.00%
3. Salary Escalation Rate [HO] 8.50% 5% for first year and 8.5% thereafter
Salary Escalation Rate [Sales Staff] 8.50% 5% for first year and 8.5% thereafter
4. Attrition Rate [HO] 8.89% 8.89%
Attrition Rate [Sales Staff] 31.49% 33.42%
5. In-service Mortality IALM 2012-14 IALM 2012-14
c) Significant actuarial assumptions for the determination of the defined benefit obligation are discount rate, expected salary increase, attrition and mortality. The sensitivity analysis below have been determined based on reasonable possible changes of the assumptions occurring at the end of the reporting period, while holding all other assumptions constant. The results of sensitivity analysis is as follows:
Particulars Year ended Year ended March 31, 2021 March 31, 2020
Discount Rate (-/ + 1%) - Decrease by 1% 133.86 127.59 - Increase by 1% (118.17) (112.26) Salary growth Rate (-/ + 1%) - Decrease by 1% (116.85) (111.67) - Increase by 1% 129.63 124.32 Attrition Rate (-/ + 50% of the attrition rate) - Decrease by 50% 157.72 148.52 - Increase by 50% (87.82) (84.34) Mortality Rate (-/ + 10% of mortality rate) - Decrease by 10% 0.51 0.44 - Increase by 10% (0.51) (0.44)
The sensitivity analysis presented above may not be representative of the actual change in the defined obligation as it is unlikely that the change in assumptions would occur in isolation of one another as some of the assumptions may be correlated.
d) Expected contribution for the next year: The Company expects to contribute ₹ 194.67 Lakhs in respect of the gratuity plans during the next financial year ending March 31, 2022.
e) Expected future benefits payable:
₹ in Lakhsb) Details of Defined Benefit Plan of the Company (As per Actuarial Valuation)
Notes forming part of the standalone financial statements for the year ended March 31, 2021
67
₹ in Lakhs
Maturity Profile of Defined Benefit Obligation As at As at March 31, 2021 March 31, 2020 1 year 206.48 198.48 2 to 5 years 751.89 690.90 6 to 10 years 660.82 619.99 More than 10 years 1,370.60 1,371.80
₹ in Lakhs

Notes forming part of the standalone financial statements for the year ended March 31, 2021
27 Related party disclosures as required by IND AS-24 "Related Party disclosures" are given below:
List of Related Parties :
I. Names of Related Party and description of relationship:
a. Party where control exists - Subsidiary Company : M/s. Metmill Footwear Private Limited
b. Joint Venture : M/s. M.V. Shoe Care Private Limited
c. Other Related Parties with whom transactions have taken place during the year:
i. Key Management Personnel (KMP) : Mr. Rafique Malik – Chairman (having significant influence)
Mrs. Farah Malik Bhanji – Managing Director and Chief Executive Officer
Mrs. Aziza Malik –Whole Time Director (having significant influence) (From 1st April, 2020 to 25th November,2020)
Mr. Kaushal Parekh - Chief Financial Officer (From 26th November, 2020 to 31st March,2021)
Ms. Tarannum Bhanpurwala - Company Secretary (From 26th November, 2020 to 31st March,2021)
Mr. J.J. Desai - Company Secretary & Chief Financial Officer (From 1st April, 2020 to 25th November,2020)
Mr. Subhash Malik (From 1st April, 2020 to 25th November,2020)
Mr. Rakesh Jhunjhunwala (From 1st April, 2020 to 24th March,2021)
Mr. Utpal Sheth
Ms. Aruna Advani
Mr. Manoj Kumar Maheshwari
Mr. Arvind Kumar Singhal
Mr. Karan Singh (From 1st April, 2020 to 24th March,2021)
Mr. Vikas Khemani
Mr. Mohammed Iqbal hasanally Dossani (From 26th November, 2020 to 31st March,2021)
Mr. Srikanth Velamakanni (From 25th March, 2021 to 31st March,2021)
ii. Relatives of Key Management Personnel : Mrs. Sabina Malik Hadi
Ms. Zarah Rafique Malik
Mrs. Zia Malik Lalji
Ms. Alisha R. Malik
Mrs. Rukshana Kurbanali Javeri
Mrs. Mumtaz Jaffer
Mr. Suleiman Sadruddin Bhanji
68
iii. Enterprise in which KMP/ Relatives of KMP are able to control / : Design Matrix Interiors LLP
exercise significant influence Design Matrix Associated Private Limited
Allium Property LLP
M/s Metro Shoes
Aziza Malik Family Trust
Rafique Malik Family Trust
Zia Malik Family Trust
Zarah Malik Family Trust
Sabina Malik Family Trust
Farah Malik Family Trust

2019-20 - 4.62 - - -
Remuneration #
Rafique Malik 2020-21 - - - 673.40 -
2019-20 - - - 605.49 -
Farah Malik Bhanji 2020-21 - - - 280.64 -
2019-20 - - - 256.25 -
Aziza Malik 2020-21 - - - 93.94 -
2019-20 - - - 184.38 -
Aziza Malik 2020-21 - - - - 105.99
2019-20 - - - - - -
J.J. Desai 2020-21 - - - 71.52 -
2019-20 - - - 259.65 -
Subhash Malik 2020-21 - - - 15.07 -
2019-20 - - - 27.06 -
Kaushal Parekh 2020-21 - - - 57.57 -
2019-20 - - - - -
Mohammed Iqbal 2020-21 - - - 11.68 -hasanally Dossani 2019-20 - - - - -
Tarannum Bhanpurwala 2020-21 - - - 2.39 -
2019-20 - - - - -
Alisha R. Malik 2020-21 - - - - 46.99
2019-20 - - - - 44.76
Directors' Sitting Fees
Ms. Aruna Advani 2020-21 - - - 2.60 -
2019-20 - - - 2.60 -
Mr. Manoj Kumar Maheshwari 2020-21 - - - 2.60 -
2019-20 - - - 2.10 -
Mr. Arvind Kumar Singhal 2020-21 - - - 1.80 -
2019-20 - - - 1.50 -
Mr. Karan Singh 2020-21 - - - 0.90 -
2019-20 - - - 1.20 -
Mr. Srikanth Velamakanni 2020-21 - - - 0.30 -
2019-20 - - - - -
Mr. Vikas Khemani 2020-21 - - - 0.30 -
2019-20 - - - - -
II. Related Party Transactions during the year:
Particulars
Compensation in respect of concession agreements for showrooms - Rent
Rafique Malik 2020-21 - - - 53.52 -
2019-20 - - - 82.48 -
Aziza Malik 2020-21 - - - 115.57 -
2019-20 - - - 206.53 -
Commission in respect of retail agency agreements for showroom
Metro Shoes 2020-21 - 77.55 - - -
2019-20 - 199.92 - - -
Compensation received in respect of rent for office
Metro Shoes 2020-21 - 3.96 - - -
Notes forming part of the standalone financial statements for the year ended March 31, 2021
YearYear Subsidiaries Enterprise in which KMP/ Relatives of KMP are able to
control / exercisesignificant influence
KeyManagement
Personnel
Relatives of Key
ManagementPersonnel
₹ in Lakhs
JointVentures
69
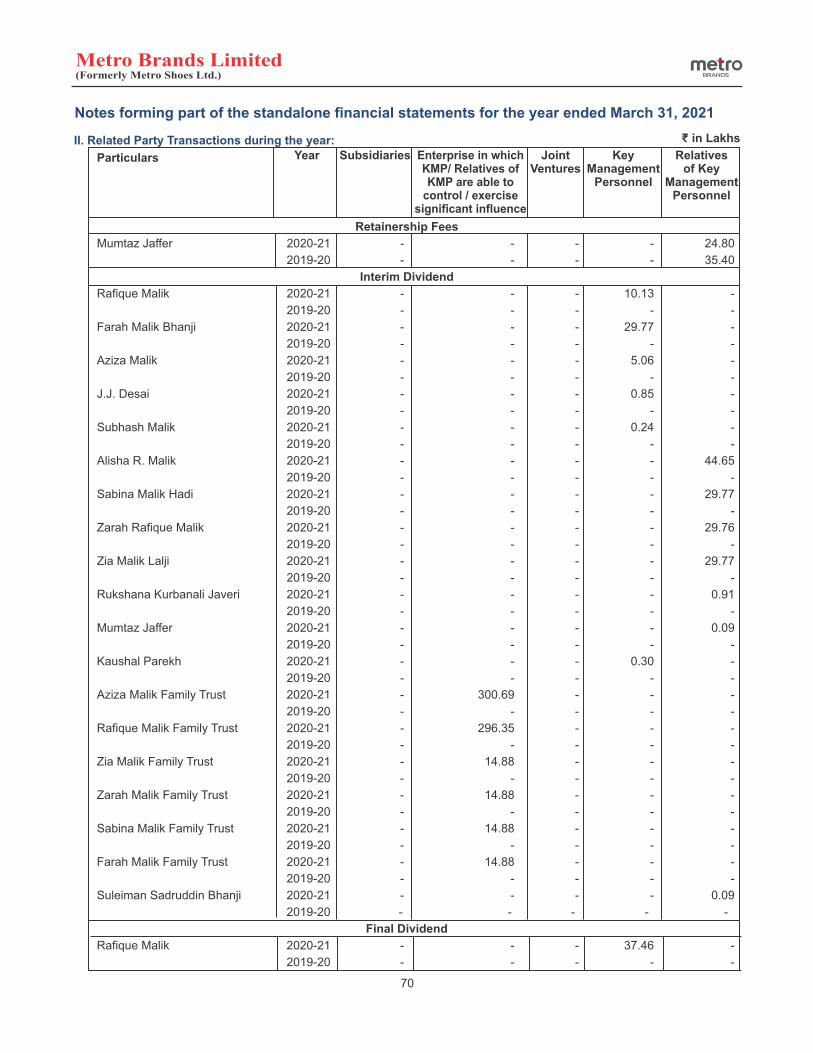
II. Related Party Transactions during the year:
Particulars
Retainership Fees
Mumtaz Jaffer 2020-21 - - - - 24.80
2019-20 - - - - 35.40
Interim Dividend
Rafique Malik 2020-21 - - - 10.13 -
2019-20 - - - - -
Farah Malik Bhanji 2020-21 - - - 29.77 -
2019-20 - - - - -
Aziza Malik 2020-21 - - - 5.06 -
2019-20 - - - - -
J.J. Desai 2020-21 - - - 0.85 -
2019-20 - - - - -
Subhash Malik 2020-21 - - - 0.24 -
2019-20 - - - - -
Alisha R. Malik 2020-21 - - - - 44.65
2019-20 - - - - -
Sabina Malik Hadi 2020-21 - - - - 29.77
2019-20 - - - - -
Zarah Rafique Malik 2020-21 - - - - 29.76
2019-20 - - - - -
Zia Malik Lalji 2020-21 - - - - 29.77
2019-20 - - - - -
Rukshana Kurbanali Javeri 2020-21 - - - - 0.91
2019-20 - - - - -
Mumtaz Jaffer 2020-21 - - - - 0.09
2019-20 - - - - -
Kaushal Parekh 2020-21 - - - 0.30 -
2019-20 - - - - -
Aziza Malik Family Trust 2020-21 - 300.69 - - -
2019-20 - - - - -
Rafique Malik Family Trust 2020-21 - 296.35 - - -
2019-20 - - - - -
Zia Malik Family Trust 2020-21 - 14.88 - - -
2019-20 - - - - -
Zarah Malik Family Trust 2020-21 - 14.88 - - -
2019-20 - - - - -
Sabina Malik Family Trust 2020-21 - 14.88 - - -
2019-20 - - - - -
Farah Malik Family Trust 2020-21 - 14.88 - - -
2019-20 - - - - -
Suleiman Sadruddin Bhanji 2020-21 - - - - 0.09
2019-20 - - - - -
Final Dividend
Rafique Malik 2020-21 - - - 37.46 -
2019-20 - - - - -
Notes forming part of the standalone financial statements for the year ended March 31, 2021
Year Subsidiaries Enterprise in which KMP/ Relatives of KMP are able to
control / exercisesignificant influence
KeyManagement
Personnel
Relatives of Key
ManagementPersonnel
₹ in Lakhs
JointVentures
70

II. Related Party Transactions during the year:
Particulars
Farah Malik Bhanji 2020-21 - - - 110.14 -
2019-20 - - - - -
Aziza Malik 2020-21 - - - 18.73 -
2019-20 - - - - -
J.J. Desai 2020-21 - - - 3.15 -
2019-20 - - - - -
Subhash Malik 2020-21 - - - 0.09 -
2019-20 - - - - -
Kaushal Parekh 2020-21 - - - 1.12 -
2019-20 - - - - -
Alisha R. Malik 2020-21 - - - - 165.21
2019-20 - - - - -
Sabina Malik Hadi 2020-21 - - - - 90.59
2019-20 - - - - -
Zarah Rafique Malik 2020-21 - - - - 90.59
2019-20 - - - - -
Zia Malik Lalji 2020-21 - - - - 90.59
2019-20 - - - - -
Rukshana Kurbanali Javeri 2020-21 - - - - 2.89
2019-20 - - - - -
Mumtaz Jaffer 2020-21 - - - - 0.34
2019-20 - - - - -
Aziza Malik Family Trust 2020-21 - 1,112.56 - - -
2019-20 - - - - -
Rafique Malik Family Trust 2020-21 - 1,096.51 - - -
2019-20 - - - - -
Zia Malik Family Trust 2020-21 - 55.07 - - -
2019-20 - - - - -
Zarah Malik Family Trust 2020-21 - 55.07 - - -
2019-20 - - - - -
Sabina Malik Family Trust 2020-21 - 55.07 - - -
2019-20 - - - - -
Farah Malik Family Trust 2020-21 - 55.07 - - -
2019-20 - - - - -
Suleiman Sadruddin Bhanji 2020-21 - - - - 0.34
2019-20 - - - - -
Professional Fees (capital cost)
Design Matrix Interiors LLP 2020-21 - 124.28 - - -
2019-20 - 302.24 - - -
Professional Fees
Design Matrix Associated 2020-21 - 25.00 - - -
Private Limited 2019-20 - - - - -
Notes forming part of the standalone financial statements for the year ended March 31, 2021
Year Subsidiaries Enterprise in which KMP/ Relatives of KMP are able to
control / exercisesignificant influence
KeyManagement
Personnel
Relatives of Key
ManagementPersonnel
₹ in Lakhs
JointVentures
71
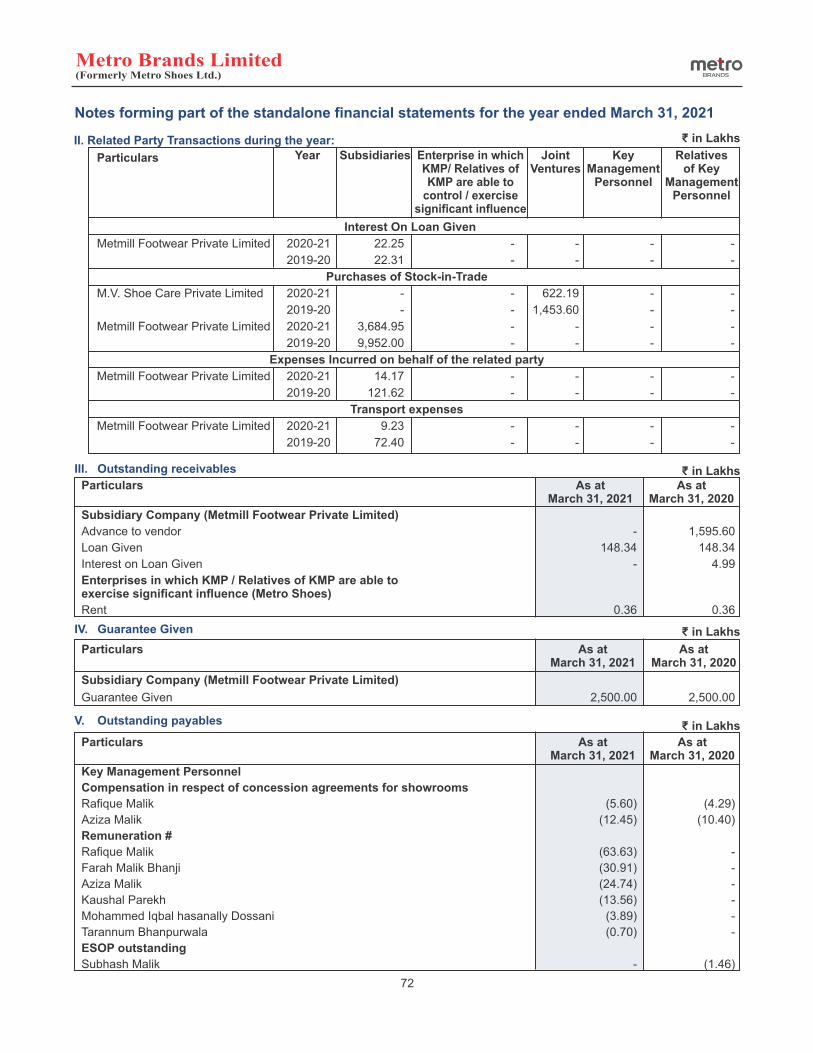
Particulars As at As at March 31, 2021 March 31, 2020
Key Management Personnel
Compensation in respect of concession agreements for showrooms
Rafique Malik (5.60) (4.29)
Aziza Malik (12.45) (10.40)
Remuneration #
Rafique Malik (63.63) -
Farah Malik Bhanji (30.91) -
Aziza Malik (24.74) -
Kaushal Parekh (13.56) -
Mohammed Iqbal hasanally Dossani (3.89) -
Tarannum Bhanpurwala (0.70) -
ESOP outstanding
Subhash Malik - (1.46)
II. Related Party Transactions during the year:
Particulars
Interest On Loan Given
Metmill Footwear Private Limited 2020-21 22.25 - - - -
2019-20 22.31 - - - -
Purchases of Stock-in-Trade
M.V. Shoe Care Private Limited 2020-21 - - 622.19 - -
2019-20 - - 1,453.60 - -
Metmill Footwear Private Limited 2020-21 3,684.95 - - - -
2019-20 9,952.00 - - - -
Expenses Incurred on behalf of the related party
Metmill Footwear Private Limited 2020-21 14.17 - - - -
2019-20 121.62 - - - -
Transport expenses
Metmill Footwear Private Limited 2020-21 9.23 - - - -
2019-20 72.40 - - - -
Notes forming part of the standalone financial statements for the year ended March 31, 2021
Year Subsidiaries Enterprise in which KMP/ Relatives of KMP are able to
control / exercisesignificant influence
KeyManagement
Personnel
Relatives of Key
ManagementPersonnel
₹ in Lakhs
JointVentures
III. Outstanding receivables ₹ in Lakhs Particulars As at As at March 31, 2021 March 31, 2020
Subsidiary Company (Metmill Footwear Private Limited)
Advance to vendor - 1,595.60
Loan Given 148.34 148.34
Interest on Loan Given - 4.99
Enterprises in which KMP / Relatives of KMP are able to exercise significant influence (Metro Shoes)
Rent 0.36 0.36
IV. Guarantee Given ₹ in Lakhs
Particulars As at As at March 31, 2021 March 31, 2020
Subsidiary Company (Metmill Footwear Private Limited)
Guarantee Given 2,500.00 2,500.00
V. Outstanding payables ₹ in Lakhs
72

Particulars As at As at March 31, 2021 March 31, 2020
Relatives of Key Management Personnel
Retainership Fees
Mumtaz Jaffer - (2.83)
Remuneration #
Alisha Malik (6.83) -
Enterprise in which KMP/ Relatives of KMP are able to control / exercise significant influence
Commission in respect of retail agency agreements for showroom
Metro Shoes (14.64) (15.81)
Security Deposit for Compensation in respect of rent for office
Metro Shoes (0.99) (0.99)
Professional Fees (capital cost)
Design Matrix Interiors LLP (21.60) (28.76)
Joint Venture
Purchases of Stock-in-trade (653.33) (643.83)
Subsidiary
Purchases of Stock-in-trade (446.36) (1,094.31)
V. Outstanding payables
Particulars As at As at March 31, 2021 March 31, 2020
Balance at the beginning of the year 48,146.53 37,605.90
Additions during the year 13,117.02 20,412.13
Deletions during the year (2,049.64) (1,084.55)
Amortisation during the year (9,253.72) (8,786.95)
Balance at the end of the year 49,960.19 48,146.53
Notes forming part of the standalone financial statements for the year ended March 31, 2021
# excludes provision for gratuity which is determined on the basis of actuarial valuation done on overall basis for the Company
Notes:
1) No amount has been written off/ provided for or written back in respect of amounts receivable from or payable to the related parties.
2) The company has provided loan to its subsidiary for working capital purposes. This loan is unsecured.
28 The Company's only business being trading of fashion footwear, bags and accessories operating in the premium and economy category and manufacturing of shoe care and foot care products, the disclosure of segment - wise information is not applicable under Ind AS 108 - 'Operating Segments'. Further, there is no geographical segment to be reported since all the operations are undertaken in India.
29 Leases
Right to Use Asset
₹ in Lakhs
73
₹ in Lakhs
Particulars As at As at March 31, 2021 March 31, 2022
Balance at the beginning of the year 53,643.05 41,989.26
Additions during the year 12,913.18 20,218.08
Deletions during the year (2,466.63) (1,236.47)
Interest during the year 4,302.97 3,868.62
Lease payment during the year (6,654.59) (11,196.44)
Reduction in lease liability - Practical Expedient (5,188.39) -
Balance at the end of the year 56,549.59 53,643.05
Lease Liabilities ₹ in Lakhs

Particulars As at As at March 31, 2021 March 31, 2020
Less than 1 year 11,814.08 11,969.80
1 - 5 Year 38,879.08 37,195.59
More than 5 years 26,673.68 24,453.22
Total undiscounted lease liabilities at the end of the year 77,366.84 73,618.61
Particulars As at As at March 31, 2021 March 31, 2020
Interest expense on lease liabilities 4,302.97 3,868.62
Amortisation of ROU 9,253.72 8,786.95
Expenses relating to short term leases/Variable lease payments 2,378.00 3,336.00
Total 15,934.69 15,991.57
Particulars As at As at March 31, 2021 March 31, 2020
Total Cash outflow for Leases 6,654.59 11,196.44
Notes forming part of the standalone financial statements for the year ended March 31, 2021
Maturity analysis - contractual undiscounted cash flow
Lease Liabilities included in Financial statement at the end of the year 56,549.59 53,643.05
Current 7,684.98 7,913.91
Non- Current 48,864.61 45,729.14
Amounts Recognised in Statement of P & L
Amounts Recognised in Statement of Cash Flows Amounts Recognised in Statement of Cash Flows
a) The Company has adopted Ind AS 116 effective April 1, 2019, using the modified retrospective method and has taken the cumulative adjustment to retained earnings, on the date of initial application. Consequently, the Company recorded the lease liability at the present value of the remaining lease payments discounted at the incremental borrowing rate as on the date of transition and the Right of Use (ROU) asset at its carrying amount as if the standard had been applied since the commencement date of the lease, but discounted at the lessee’s incremental borrowing rate at the date of initial application. Accordingly, previous period information has not been restated.
The following is the summary of practical expedients elected on initial application by the Company:
i. Applied a single discount rate to a portfolio of leases of similar assets in similar economic environment with a similar end date.
ii. Excluded the initial direct costs from the measurement of the Right of Use asset at the date of initial application.
iii. Applied the practical expedient by not reassessing whether a contract is, or contains, a lease at the date of initial application. Instead applied the standards only to contracts that were previously identified as leases under Ind AS 17.
iv. Used hindsight in determining the lease term where the contract contained options to extend or terminate the lease
In the statement of profit and loss for the previous year, operating lease expenses which were recognised as other expenses in previous periods were recognised as amortisation expense for the Right of Use asset and finance cost for interest accrued on lease liability. The weighted average incremental borrowing rate applied to lease liabilities as at April 1, 2019 is 7.9%.
b) The Company incurred ₹ 2,378.00 lakhs (Previous year ₹ 3,336.00 lakhs) for the year ended March 31, 2021 towards expenses relating to short-term leases and leases of low-value assets. The total cash outflow for leases is ₹ 6,654.59 lakhs (Previous year ₹ 11,196.44 lakhs) for the year ended March 31, 2021, excluding cash outflow of short-term leases and leases of low-value assets. Interest on lease liabilities is ₹ 4,302.97 lakhs (Previous year ₹ 3,868.62 lakhs) for the year ended March 31,2021.
c) The Company’s leases mainly comprise of showroom premises and warehouse premises.
30 The Company reviews the estimated useful lives of property, plant and equipment at the end of each reporting year. Based on such review, the Company had estimated the useful life of leasehold improvements to be the period of lease or 10 years whichever is lower. As a result of the change in estimate, the amortisation expense charged to the Statement of Profit and Loss in the previous year was higher by ₹ 659.79 lakhs.
74

Particulars 2020-21 2019-20
Profit after tax as per Statement of Profit and Loss attributable to equity share holders (₹ in Lakhs) 7,252.44 15,187.87
Weighted average number of Equity Shares:
- Basic 265,534,290 265,534,290
Add: Effect of Potential Equity Shares on employees stock options outstanding 79,202 96,566
- Diluted 265,613,492 265,613,492
Earnings per Share (in ₹)
- Basic 2.73 5.72
- Diluted 2.73 5.72
Notes forming part of the standalone financial statements for the year ended March 31, 2021
31 Basic and Diluted Earnings per Share is calculated as under: ₹ in Lakhs
Note : The equity shares of the Company, during the year, have been sub-divided from existing face value of ₹ 10/- per equity share to face value of ₹ 5/- per equity share.
32 Employee Stock Option Plan 2008 (ESOP – 2008):
The Company had granted stock options (options) to its eligible employees in terms of Employees Stock Option plan 2008 (ESOP 2008) of the company as approved by the shareholders in the 31st Annual General Meeting held on 11th September, 2008.
a) The particulars of the Options distributed under ESOP 2008 are as follows:
Particulars ESOP
Eligibility A permanent employee or a director of the Company (including of subsidiaries in India or out of India or of a holding company of the company) but excluding (a) an employee who is a promoter or belongs to the promoter group; (b) a director who either by himself or through his relatives or through any body corporate, directly holds more than 10% of the outstanding equity shares of the Company.
Plan Tenure Tenure of the plan is 11 years, i.e. September 15, 2009 to September 14, 2020 or as determined by the Board / Compensation Committee from time to time. Any stock option which remains ungranted after closing date would automatically be lapsed.
Vesting period for options granted The Company originally authorized 15,000 options for issue to eligible employees. In December, 2008, the same were increased to 45,000 options consequent to issue of bonus shares in the ratio 2:1
On 24th August, 2009, the Company granted 25,875 options to fourteen eligible employees. The vesting schedule for the options granted was 40% on September 15, 2009, 20% on September 15, 2010, 20% on September 15, 2011, and 20% on September 15, 2012.
Further, on September 15, 2011 the Company granted 4,500 options to four eligible employees. The vesting schedule for the options granted in 2011 was 40% on September 15, 2012, 20% on September 15, 2013, 20% on September 15, 2014 and 20% on September 15, 2015.
In November, 2012, outstanding options increased by 26,270 options consequent to issue of bonus shares in the ratio 2:1
Further, on February 1, 2014 the Company granted 11,250 options to three eligible employees. The vesting schedule for the options granted in 2014 was 40% on February 1, 2016, 20% on February 1, 2017, 20% on February 1, 2018 and 20% on February 1, 2019.
Further, on April 1, 2014 the Company granted 3,375 options to one eligible employee. The vesting schedule for the options granted in 2014 was 40% on April 1, 2015, 20% on April 1, 2016, 20% on April 1, 2017 and 20% on April 1, 2018.
During the financial year 2018-19, some of the option holders exercised their options on various dates and in total were alloted 37,695 shares. Further, during the financial year 2018-19, in total 62,120 bonus options were issued in the ratio of 8:1.
75
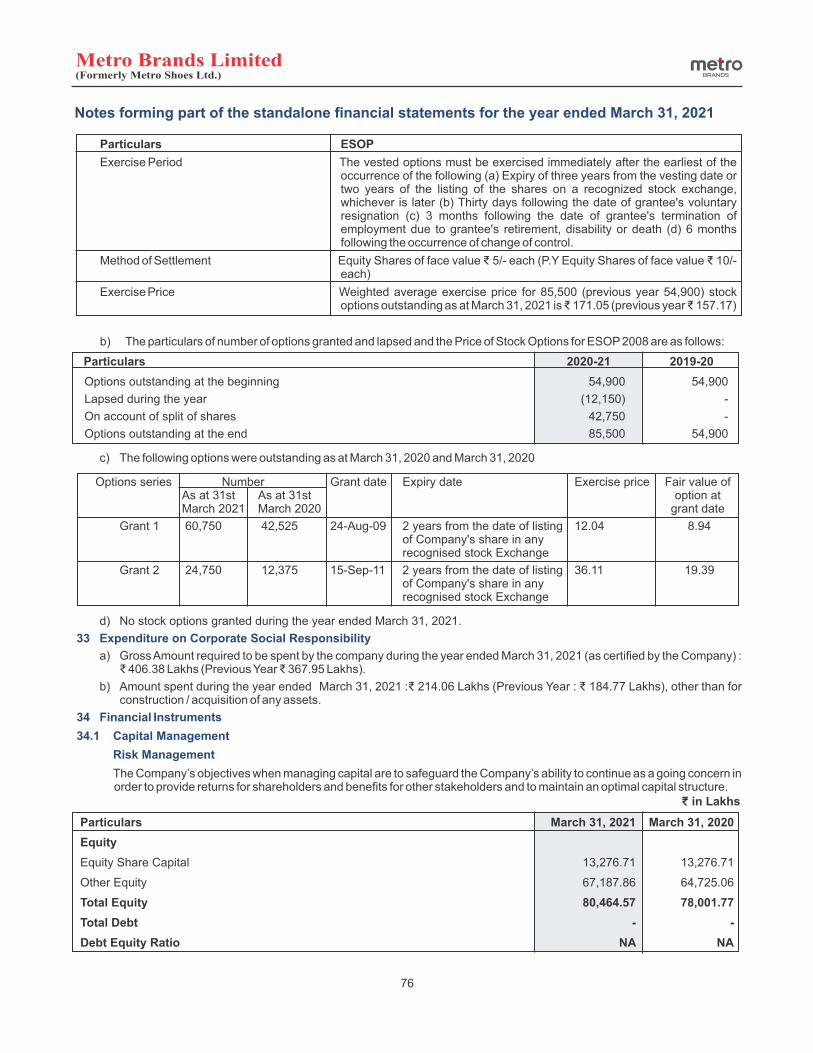
Notes forming part of the standalone financial statements for the year ended March 31, 2021
Particulars ESOP
Exercise Period The vested options must be exercised immediately after the earliest of the occurrence of the following (a) Expiry of three years from the vesting date or two years of the listing of the shares on a recognized stock exchange, whichever is later (b) Thirty days following the date of grantee's voluntary resignation (c) 3 months following the date of grantee's termination of employment due to grantee's retirement, disability or death (d) 6 months following the occurrence of change of control.
Method of Settlement E quity Shares of face value ₹ 5/- each (P.Y Equity Shares of face value ₹ 10/- each)
Exercise Price W eighted average exercise price for 85,500 (previous year 54,900) stock options outstanding as at March 31, 2021 is ₹ 171.05 (previous year ₹ 157.17)
b) The particulars of number of options granted and lapsed and the Price of Stock Options for ESOP 2008 are as follows:
Particulars 2020-21 2019-20
Options outstanding at the beginning 54,900 54,900
Lapsed during the year (12,150) -
On account of split of shares 42,750 -
Options outstanding at the end 85,500 54,900
c) The following options were outstanding as at March 31, 2020 and March 31, 2020
Options series Number Grant date Expiry date Exercise price Fair value of As at 31st As at 31st option at
March 2021 March 2020 grant date
Grant 1 60,750 42,525 24-Aug-09 2 years from the date of listing 12.04 8.94 of Company's share in any recognised stock Exchange
Grant 2 24,750 12,375 15-Sep-11 2 years from the date of listing 36.11 19.39 of Company's share in any recognised stock Exchange
d) No stock options granted during the year ended March 31, 2021.
33 Expenditure on Corporate Social Responsibility
a) Gross Amount required to be spent by the company during the year ended March 31, 2021 (as certified by the Company) : ₹ 406.38 Lakhs (Previous Year ₹ 367.95 Lakhs).
b) Amount spent during the year ended March 31, 2021 :₹ 214.06 Lakhs (Previous Year : ₹ 184.77 Lakhs), other than for construction / acquisition of any assets.
34 Financial Instruments
34.1 Capital Management
Risk Management
The Company’s objectives when managing capital are to safeguard the Company’s ability to continue as a going concern in order to provide returns for shareholders and benefits for other stakeholders and to maintain an optimal capital structure.
76
₹ in Lakhs
Particulars March 31, 2021 March 31, 2020
Equity
Equity Share Capital 13,276.71 13,276.71
Other Equity 67,187.86 64,725.06
Total Equity 80,464.57 78,001.77
Total Debt - -
Debt Equity Ratio NA NA

Particulars Hierarchy level March 31, 2021 March 31, 2020
Financial Assets
Measured at fair value through profit or loss
- Investments in mutual funds Level 2 35,703.89 31,711.64
- Investments in Bonds Level 1 2,167.12 1,041.38
Measured at amortised cost
- Trade receivables # Level 2 2,248.60 809.46
- Cash and cash equivalents # Level 2 2,176.98 1,004.79
- Other Bank balances # Level 2 6,160.74 38.89
- Loans # Level 2 336.23 335.76
- Other financial assets # Level 2 5,033.38 4,688.77
Measured at fair value through Other Comprehensive Income
- Investments in Bonds Level 1 1,365.91 1,292.98
Financial Liabilities
Measured at amortised cost
- Trade payables # Level 2 20,251.62 15,464.12
- Other financial liabilities # Level 2 1,445.47 1,859.76
- Lease Liabilities # Level 2 56,549.59 53,643.05
# The Company considers that the carrying amount of financial assets and financial liabilities recognised in the financial statements approximates their fair value.
34.3 Fair Value measurements
Fair valuation techniques and inputs used
(i) Fair Value Hierarchy
This section explains the judgements and estimates made in determining the fair values of the financial instruments that are (a) recognised and measured at fair value and (b) measured at amortised cost and for which fair values are disclosed in the financial statements. To provide an indication about the reliability of the inputs used in determining fair value, the Company has classified its financial instruments into the three levels prescribed under the accounting standard.
Level 1 inputs are quoted prices (unadjusted) in active markets for identical assets or liabilities that the entity can access at the measurement date. A quoted market price in an active market provides the most reliable evidence of fair value and is used without adjustment to measure fair value whenever available, with limited exceptions.
Level 2 inputs are inputs other than quoted market prices included within Level 1 that are observable for the asset or liability, either directly or indirectly.
Level 2 inputs include:
— quoted prices for similar assets or liabilities in active markets
— quoted prices for identical or similar assets or liabilities in markets that are not active
— inputs other than quoted prices that are observable for the asset or liability, for example
— interest rates and yield curves observable at commonly quoted intervals
— implied volatilities
— credit spreads
— inputs that are derived principally from or corroborated by observable market data by correlation or other means (‘market – corroborated inputs’)
Level 3 inputs are unobservable inputs for the asset or liability. Unobservable inputs are used to measure fair value to the extent that relevant observable inputs are not available, thereby allowing for situations in which there is little, if any, market activity for the asset or liability at the measurement date. An entity develops unobservable inputs using the best information available in the circumstances, which might include the entity’s own data, taking into account all information about market participant assumptions that is reasonably available.
Notes forming part of the standalone financial statements for the year ended March 31, 2021
34.2 Categories of financial instruments
Financial Assets and Financial Liabilities classified under Level 1 & Level 2 hierarchy ₹ in Lakhs
77

Notes forming part of the standalone financial statements for the year ended March 31, 2021
21 20
31,711.64
2334.36
34.4 Financial Risk Management
The Company’s activities expose it to variety of financial risks: credit risk, liquidity risk and market risk. In order to manage aforementioned risks, the Company operates a risk management policy and a program that performs close monitoring of and responding to each risk factors.
A] CREDIT RISK
i) Credit Risk Management:
Credit risk is the risk of the financial loss that the counterparty will default on its contractual obligation. The credit risk for the Company primarily arises from the credit exposures to trade receivables (mainly institutional customers), deposits with landlords for store properties taken on leases , cash and cash equivalents, deposits with banks and other receivables.
ii) Trade and other receivables:
The Company’s retail business is predominantly on cash and carry basis. The Company sells goods on credit basis to institutional parties. The credit risk on such collections is minimal considering that such sales are only 6.77% of the total sales. The average credit period for institutional parties is 30 days. No interest is charged on trade receivables on payment received even after the credit period. The Company has adopted a policy of dealing with only credit worthy counterparties in case of institutional customers and the credit risk exposure for institutional customers is managed by the Company by credit worthiness checks. As at 31st March, 2021, the company had 6 customers (as at 31st March, 2020 : 5 customers) that accounted for approximately 85% (as at 31st March, 2020 : 66%) of the trade receivables. The Company also carries credit risk on lease deposits with landlords for store properties taken on lease, for which agreements are signed and property possessions timely taken for store operations. The risk relating to refunds after store shut down is managed through successful negotiations or appropriate legal actions, where necessary.
The Company’s experience of delinquencies and customer disputes have been minimal.
iii) Cash and cash equivalents and deposits with banks:
Credit risk on Cash and Cash Equivalents is limited as the Company generally invests in deposits with banks with high credit ratings assigned by international and domestic credit rating agencies.
B] LIQUIDITY RISK
1) Liquidity Risk Management
Ultimate responsibility for liquidity risk management rests with the board of directors, which has established an appropriate liquidity risk management framework for the management of the company’s short, medium and long-term funding and liquidity management requirements. The Company manages liquidity risk by maintaining adequate reserves, banking facilities by continuously monitoring forecast and actual cash flows and by matching the maturity profiles of financial assets and liabilities.
2) Maturity of financial liabilities
The table below analyse the Company’s financial liabilities into relevant maturity based on their remaining contractual maturities of all non-derivative financial liabilities. The amounts disclosed in the table are the contractual undiscounted cash flows. Balance equal their carrying balances as the impact of discounting is not significant.
78
(₹ in Lakhs)
35,703.94
3,533.02
Financial assets measured at fair value

Notes forming part of the standalone financial statements for the year ended March 31, 2021
₹ in Lakhs
Contractual maturities of Less than Between Between More than Carryingfinancial liabilities 1 year 1 and 3 years 3 and 5 years 5 years amounts
As at March 31, 2020
Non- derivative financial liabilities
Non interest bearing:
Trade Payables 15,464.12 - - - 15,464.12
Lease liabilities 11,969.80 20,859.14 16,336.45 24,453.22 73,618.61
Others 1,859.76 - - - 1,859.76
As at March 31, 2021
Non- derivative financial liabilities
Non interest bearing:
Trade Payables 20,251.62 20,251.62
Lease liabilities 11,814.08 21,399.17 17,479.92 26,673.68 77,366.85
Others 1,445.47 1,445.47
The Group has access to following financing facilities which were undrawn as at the end of the reporting periods mentioned.
Undrawn financing facilities March 31, 2021 March 31, 2020
Secured working capital facilities
Amount Used - -
Amount Unused 2,000.00 2,000.00
Total 2,000.00 2,000.00
The above facility has been secured by a charge on Company’s book debts, inventory, receivables, cash flows, and all current assets including cash-in-hand.
C] MARKET RISK
Market risk is the risk that the fair value of future cash flows of a financial instrument will fluctuate because of changes in market prices. Market risk comprises three types of risk: Currency risk, interest risk and other price risk. The objective of market risk management is to manage and control market risk exposures within acceptable parameters, while optimising the return.
1) Product Price risk
Product price increases which are not in line with the levels of customers discretionary spends, may affect the sales volumes. In such a scenario, the risk is managed by offering judicious discounts to customers to sustain volumes. Company negotiates with its vendors for purchase price rebates such that the rebates substantially absorb the product discounts offered to the retail customers. This helps company protect itself from significant product margin losses.
2) Interest risk
The Company is not exposed to interest rate risk through the borrowing activities. The Company does not enter into financial instrument transactions for trading or speculative purposes or to manage interest rate exposure.
3) Currency risk
The Company’s significant transactions are in Indian rupees and therefore there is minimal foreign currency risk.
The Company’s exposure to foreign currency risk at the end of the reporting period expressed in ₹ in Lakhs, is as follows
Particulars March 31, 2021 March 31, 2020
₹ in Lakhs USD($) in Lakhs ₹ in Lakhs USD($) in Lakhs
Trade Payables 11.09 0.15 4.15 0.06
Sensitivity:
The sensitivity of profit or loss to changes in the exchange rates arises mainly from foreign currency denominated financial instruments.
₹ in Lakhs
79

Particulars March 31, 2021 March 31, 2020
The principal amount remaining unpaid to any supplier at the end of the year 173.47 88.99
Interest due remaining unpaid to any supplier at the end of the year 0.18 -
The amount of interest paid by the buyer in terms of section 16 of the MSMED Act, 2006, along with the amount of the payment made to the supplier beyond the appointed day during the year 1.33 25.98
The amount of interest accrued and remaining unpaid at the end of each accounting year 0.18 -
The amount of further interest remaining due and payable even in the succeeding years, until such date when the interest dues above are actually paid to the small enterprises, for the purpose of disallowance of a deductible expenditure under section 23 of the MSMED Act, 2006 - -
Note : Dues to Micro and Small Enterprises have been determined to the extent such parties have been identified on the basis of information collected by the Management. This has been relied upon by the auditors
36 COVID-19 impact
The outbreak of corona virus (COVID-19) pandemic globally and in India is causing significant disturbance and slowdown of economic activity.The Company’s operations and revenue during the year were impacted due to COVID-19.The Company has made detailed assessment of the recoverability and carrying values of its assets comprising property, plant and equipment, right of use assets, inventories, receivables and other current assets as at the period end and on the basis of evaluation, has concluded that no material adjustments are required in the financial results. Given the uncertainties associated with nature, condition and duration of COVID-19, the impact assessment on the Company's financial statements will be continuously made and provided for as required. The impact of COVID-19 on the standalone financial statements may differ from that estimated as at the date of approval of these standalone financial statements owing to the nature and duration of COVID-19.
37 The figures for the corresponding previous year have been regrouped/reclassfied wherever necessary, to make them comparable.
For and on behalf of the Board of Directors
Metro Brands Limited Sd/- Sd/- Rafique A.Malik Farah Malik Bhanji Chairman Managing Director & Chief Executive Officer DIN:00521563 DIN:00530676 Sd/- Sd/-
P Kaushal Parekh Tarannum Bhanpurwala lace: Mumbai
Date : June 25, 2021 Chief Financial Officer Company Secretary
Notes forming part of the standalone financial statements for the year ended March 31, 2021
Particulars March 31, 2021 March 31, 2020
USD sensitivity
₹/USD -Increase by 1% # (0.11) (0.04)
₹/USD -Decrease by 1% # 0.11 0.04
# Holding all other variables constant
35 Details of dues to micro and small enterprises as defined under the MSMED Act, 2006
₹ in Lakhs
₹ in Lakhs
80


INDEPENDENT AUDITOR'S REPORTTo The Members of Metro Brands Limited (formerly known as Metro Shoes Limited)
Report on the Audit of the Consolidated Financial Statements
Opinion
We have audited the accompanying consolidated financial statements of Metro Brands Limited (formerly known as Metro shoes Limited ) ("the Parent") and its subsidiary, (the Parent and its subsidiary together referred to as "the Group") which includes the Group's share of profit in its joint venture, which comprise the Consolidated Balance Sheet as at March 31, 2021, and the Consolidated Statement of Profit and Loss (including Other Comprehensive Income), the Consolidated Statement of Cash Flows and the Consolidated Statement of Changes in Equity for the year then ended, and a summary of significant accounting policies and other explanatory information (hereinafter referred to as "the consolidated financial statements").
In our opinion and to the best of our information and according to the explanations given to us, and based on the consideration of reports of other auditors on separate financial statements of the subsidiary and joint venture referred to in the Other Matters section below, the aforesaid consolidated financial statements give the information required by the Companies Act, 2013 ("the Act") in the manner so required and give a true and fair view in conformity with the Indian Accounting Standards prescribed under section 133 of the Act read with the Companies (Indian Accounting Standards) Rules, 2015, as amended ('Ind AS')], and other accounting principles generally accepted in India, of the consolidated state of affairs of the Group as at March 31, 2021, and their consolidated profit, their consolidated total comprehensive income, their consolidated cash flows and their consolidated changes in equity for the year ended on that date.
Basis for Opinion
We conducted our audit of the consolidated financial statements in accordance with the Standards on Auditing specified under section 143 (10) of the Act (Sas). Our responsibilities under those Standards are further described in the Auditor's Responsibility for the Audit of the Consolidated Financial Statements section of our report. We are independent of the Group and joint venture in accordance with the Code of Ethics issued by the Institute of Chartered Accountants of India (ICAI) together with the ethical requirements that are relevant to our audit of the consolidated financial statements under the provisions of the Act and the Rules made thereunder, and we have fulfilled our other ethical responsibilities in accordance with these requirements and the ICAI's Code of Ethics. We believe that the audit evidence obtained by us and the audit evidence obtained by other auditors in terms of their reports referred to in the Other Matters section below, is sufficient and appropriate to provide a basis for our audit opinion on the consolidated financial statements.
Information Other than the Financial Statements and Auditor's Report Thereon
● The Parent's Board of Directors is responsible for the other information. The other information comprises the information included in the Director's report, but does not include the consolidated financial statements, standalone financial statements and our auditor's report thereon.
● Our opinion on the consolidated financial statements does not cover the other information and we do not express any form of assurance conclusion thereon.
● In connection with our audit of the consolidated financial statements, our responsibility is to read the other information, compare with the financial statements of the subsidiary and joint venture audited by the other auditors, to the extent it relates to these entities and, in doing so, place reliance on the work of the other auditors and consider whether the other information is materially inconsistent with the consolidated financial statements or our knowledge obtained during the course of our audit or otherwise appears to be materially misstated. Other information so far as it relates to the subsidiary and joint venture is traced from their financial statements audited by the other auditors.
● If based on the work we have performed, we conclude that there is a material misstatement of this other information, we are required to report that fact. We have nothing to report in this regard.
Management's Responsibility for the Consolidated Financial Statements
The Parent's Board of Directors is responsible for the matters stated in section 134(5) of the Act with respect to the preparation of these consolidated financial statements that give a true and fair view of the consolidated financial position, consolidated financial performance including other comprehensive income, consolidated cash flows and consolidated changes in equity of the Group including its joint venture in accordance with the Ind AS and other accounting principles generally accepted in India. The respective Board of Directors of the companies included in the Group and of its joint venture are responsible for maintenance of adequate accounting records in accordance with the provisions of the Act for safeguarding the assets of the Group and its joint venture and for preventing and detecting frauds and other irregularities; selection and application of appropriate accounting policies; making judgments and estimates that are reasonable and prudent; and design, implementation and maintenance of adequate internal financial controls, that were operating effectively for ensuring the accuracy and completeness of the accounting records, relevant to the preparation and presentation of the financial statements that give a true and fair view and are free from material misstatement, whether due to fraud or error, which have been used for the purpose of preparation of the consolidated financial statements by the Directors of the Parent Company, as aforesaid.
In preparing the consolidated financial statements, the respective Board of Directors of the companies included in the Group and of its joint venture are responsible for assessing the ability of the respective entities to continue as a going concern, disclosing, as
82

applicable, matters related to going concern and using the going concern basis of accounting unless the respective Board of Directors either intends to liquidate their respective entities or to cease operations, or has no realistic alternative but to do so.
The respective Board of Directors of the companies included in the Group and of its joint venture are also responsible for overseeing the financial reporting process of the Group and of its joint venture.
Auditor's Responsibility for the Audit of the Consolidated Financial Statements
Our objectives are to obtain reasonable assurance about whether the consolidated financial statements as a whole are free from material misstatement, whether due to fraud or error and to issue an auditor's report that includes our opinion. Reasonable assurance is a high level of assurance but is not a guarantee that an audit conducted in accordance with SAs will always detect a material misstatement when it exists. Misstatements can arise from fraud or error and are considered material if, individually or in the aggregate, they could reasonably be expected to influence the economic decisions of users taken on the basis of these consolidated financial statements.
As part of an audit in accordance with SAs, we exercise professional judgment and maintain professional skepticism throughout the audit. We also:
● Identify and assess the risks of material misstatement of the consolidated financial statements, whether due to fraud or error, design and perform audit procedures responsive to those risks, and obtain audit evidence that is sufficient and appropriate to provide a basis for our opinion. The risk of not detecting a material misstatement resulting from fraud is higher than for one resulting from error, as fraud may involve collusion, forgery, intentional omissions, misrepresentations, or the override of internal control.
● Obtain an understanding of internal financial control relevant to the audit in order to design audit procedures that are appropriate in the circumstances. Under section 143(3)(I) of the Act, we are also responsible for expressing our opinion on whether the Parent Company has adequate internal financial controls system in place and the operating effectiveness of such controls.
● Evaluate the appropriateness of accounting policies used and the reasonableness of accounting estimates and related disclosures made by the management.
● Conclude on the appropriateness of management's use of the going concern basis of accounting and, based on the audit evidence obtained, whether a material uncertainty exists related to events or conditions that may cast significant doubt on the ability of the Group and its joint venture to continue as a going concern. If we conclude that a material uncertainty exists, we are required to draw attention in our auditor's report to the related disclosures in the consolidated financial statements or, if such disclosures are inadequate, to modify our opinion. Our conclusions are based on the audit evidence obtained up to the date of our auditor's report. However, future events or conditions may cause the Group and its a joint venture to cease to continue as a going concern.
● Evaluate the overall presentation, structure and content of the consolidated financial statements, including the disclosures, and whether the consolidated financial statements represent the underlying transactions and events in a manner that achieves fair presentation.
● Obtain sufficient appropriate audit evidence regarding the financial information of the entities or business activities within the Group and its joint venture to express an opinion on the consolidated financial statements. We are responsible for the direction, supervision and performance of the audit of the financial statements of such entities or business activities included in the consolidated financial statements of which we are the independent auditors. For the other entities or business activities included in the consolidated financial statements, which have been audited by the other auditors, such other auditors remain responsible for the direction, supervision and performance of the audits carried out by them. We remain solely responsible for our audit opinion.
Materiality is the magnitude of misstatements in the consolidated financial statements that, individually or in aggregate, makes it probable that the economic decisions of a reasonably knowledgeable user of the consolidated financial statements may be influenced. We consider quantitative materiality and qualitative factors in (i) planning the scope of our audit work and in evaluating the results of our work; and (ii) to evaluate the effect of any identified misstatements in the consolidated financial statements.
We communicate with those charged with governance of the Parent Company and such other entities included in the consolidated financial statements of which we are the independent auditors regarding, among other matters, the planned scope and timing of the audit and significant audit findings, including any significant deficiencies in internal control that we identify during our audit.
We also provide those charged with governance with a statement that we have complied with relevant ethical requirements regarding independence, and to communicate with them all relationships and other matters that may reasonably be thought to bear on our independence, and where applicable, related safeguards.
Other Matters
(a) We did not audit the financial statements of the subsidiary, whose financial statements reflect total assets of Rs.5,233.96 lakhs as at March 31, 2021 and total revenues of Rs.4,825.40 lakhs for the year ended on that date, as considered in the respective standalone financial statements of the companies included in the Group. The consolidated financial statements also include the Group's share of net loss of Rs. 59.79 lakhs for the year ended March 31, 2021, as considered in the consolidated financial statements, in respect of joint venture, whose financial statements have not been audited by us. These financial statements have been audited by other auditors whose reports have been furnished to us by the Management and our opinion on the consolidated financial statements, in so far as it relates to the amounts and disclosures
83

included in respect of the subsidiary and joint venture and our report in terms of subsection (3) of Section 143 of the Act, in so far as it relates to the aforesaid subsidiary, and joint venture is based solely on the reports of the other auditors.
Our opinion on the consolidated financial statements above and our report on Other Legal and Regulatory Requirements below, is not modified in respect of the above matters with respect to our reliance on the work done and the reports of the other auditors.
Report on Other Legal and Regulatory Requirements
As required by Section 143(3) of the Act, based on our audit and on the consideration of the reports of other auditors on the separate financial statements of the subsidiary and joint venture referred to in the Other Matters section above we report, to the extent applicable that:
a) We have sought and obtained all the information and explanations which to the best of our knowledge and belief were necessary for the purposes of our audit of the aforesaid consolidated financial statements.
b) In our opinion, proper books of account as required by law relating to preparation of the aforesaid consolidated financial statements have been kept so far as it appears from our examination of those books, returns and the reports of the other auditors.
c) The Consolidated Balance Sheet, the Consolidated Statement of Profit and Loss including Other Comprehensive Income, the Consolidated Statement of Cash Flows and the Consolidated Statement of Changes in Equity dealt with by this Report are in agreement with the relevant books of account maintained for the purpose of preparation of the consolidated financial statements.
d) In our opinion, the aforesaid consolidated financial statements comply with the Ind AS specified under Section 133 of the Act.
e) On the basis of the written representations received from the directors of the Parent Company as on March 31, 2021 taken on record by the Board of Directors of the Company and the reports of the statutory auditors of subsidiary company and joint venture company incorporated in India, none of the directors of the Group company and joint venture company incorporated in India is disqualified as on March 31, 2021 from being appointed as a director in terms of Section 164 (2) of the Act.
f) With respect to the adequacy of the internal financial controls over financial reporting and the operating effectiveness of such controls, refer to our separate Report in "Annexure A" which is based on the auditors' reports of the Parent company, subsidiary company and joint venture company incorporated in India. Our report expresses an unmodified opinion on the adequacy and operating effectiveness of internal financial controls over financial reporting of those companies.
g) With respect to the other matters to be included in the Auditor's Report in accordance with the requirements of section 197(16) of the Act, as amended, in our opinion and to the best of our information and according to the explanations given to us, the remuneration paid by the Parent Company to its directors during the year is in accordance with the provisions of section 197 of the Act.
h) With respect to the other matters to be included in the Auditor's Report in accordance with Rule 11 of the Companies (Audit and Auditors) Rules, 2014, as amended in our opinion and to the best of our information and according to the explanations given to us:
i) The consolidated financial statements disclose the impact of pending litigations on the consolidated financial position of the Group and joint venture. Refer Note 26 to the consolidated Financial statements;
ii) the Group and its joint venture did not have any material foreseeable losses on long-term contracts including derivative contracts.
iii) There were no amounts which were required to be transferred, to the Investor Education and Protection Fund by the Parent, its subsidiary company and joint venture company incorporated in India.
For DELOITTE HASKINS & SELLSChartered Accountants
(Firm's Registration No. 117365W)
Ketan Vora Place: Mumbai (Partner)Date: June 25, 2021 (Membership No. 100459)
UDIN : 21100459AAAAKY3869
84

ANNEXURE “A” TO THE INDEPENDENT AUDITOR'S REPORT
In conjunction with our audit of the consolidated Ind AS financial statements of the Company as of and for the year ended March 31, 2021, we have audited the internal financial controls over financial reporting of Metro Brands Limited (formerly known as Metro Shoes Limited) (hereinafter referred to as “Parent”) and its subsidiary company and joint venture company, which are companies incorporated in India, as of that date.
Management's Responsibility for Internal Financial Controls
The respective Board of Directors of the Parent, its subsidiary company and joint venture company, which are companies incorporated in India, are responsible for establishing and maintaining internal financial controls based on the internal control over financial reporting criteria established by the respective Companies considering the essential components of internal control stated in the Guidance Note on Audit of Internal Financial Controls Over Financial Reporting issued by the Institute of Chartered Accountants of India (ICAI). These responsibilities include the design, implementation and maintenance of adequate internal financial controls that were operating effectively for ensuring the orderly and efficient conduct of its business, including adherence to the respective company's policies, the safeguarding of its assets, the prevention and detection of frauds and errors, the accuracy and completeness of the accounting records, and the timely preparation of reliable financial information, as required under the Companies Act, 2013.
Auditor's Responsibility
Our responsibility is to express an opinion on the internal financial controls over financial reporting of theParent, its subsidiary company andits joint venture company, which are companies incorporated in India, based on our audit. We conducted our audit in accordance with the Guidance Note on Audit of Internal Financial Controls Over Financial Reporting (the “Guidance Note”) issued by the Institute of Chartered Accountants of India and the Standards on Auditing, prescribed under Section 143(10) of the Companies Act, 2013, to the extent applicable to an audit of internal financial controls. Those Standards and the Guidance Note require that we comply with ethical requirements and plan and perform the audit to obtain reasonable assurance about whether adequate internal financial controls over financial reporting was established and maintained and if such controls operated effectively in all material respects.
Our audit involves performing procedures to obtain audit evidence about the adequacy of the internal financial controls system over financial reporting and their operating effectiveness. Our audit of internal financial controls over financial reporting included obtaining an understanding of internal financial controls over financial reporting, assessing the risk that a material weakness exists, and testing and evaluating the design and operating effectiveness of internal control based on the assessed risk. The procedures selected depend on the auditor's judgement, including the assessment of the risks of material misstatement of the financial statements, whether due to fraud or error.
We believe that the audit evidence we have obtained and the audit evidence obtained by theother auditors of the subsidiary company andjoint venture company, which are companies incorporated in India, in terms of their reports referred to in the Other Matters paragraph below, is sufficient and appropriate to provide a basis for our audit opinion on theinternal financial controls system over financial reporting of the Parent, its subsidiary company and its joint venture company, which are companies incorporated in India.
Meaning of Internal Financial Controls Over Financial Reporting
A company's internal financial control over financial reporting is a process designed to provide reasonable assurance regarding the reliability of financial reporting and the preparation of financial statements for external purposes in accordance with generally accepted accounting principles. A company's internal financial control over financial reporting includes those policies and procedures that (1) pertain to the maintenance of records that, in reasonable detail, accurately and fairly reflect the transactions and dispositions of the assets of the company; (2) provide reasonable assurance that transactions are recorded as necessary to permit preparation of financial statements in accordance with generally accepted accounting principles, and that receipts and expenditures of the company are being made only in accordance with authorizations of management and directors of the company; and (3) provide reasonable assurance regarding prevention or timely detection of unauthorized acquisition, use, or disposition of the company's assets that could have a material effect on the financial statements.
Inherent Limitations of Internal Financial Controls Over Financial Reporting
Because of the inherent limitations of internal financial controls over financial reporting, including the possibility of collusion or improper management override of controls, material misstatements due to error or fraud may occur and not be detected. Also,
(Referred to in paragraph 1(f) under 'Report on Other Legal and Regulatory Requirements' section of our report of even date)
Report on the Internal Financial Controls Over Financial Reporting under Clause (i) of Sub-section 3 of Section 143 of the Companies Act, 2013 ("the Act")
85

projections of any evaluation of the internal financial controls over financial reporting to future periods are subject to the risk that the internal financial control over financial reporting may become inadequate because of changes in conditions, or that the degree of compliance with the policies or procedures may deteriorate.
Opinion
Inour opinion to the best of our information and according to the explanations given to us and based on the consideration of the reports of the other auditors referred to in the Other Matters paragraph below, the Parent, its subsidiary company and joint venture company, which are companies incorporated in India, have, in all material respects, an adequate internal financial controls system over financial reporting and such internal financial controls over financial reporting were operating effectively as at March 31, 2021, based on the criteria for internal financial control over financial reporting established by the respective companies considering the essential components of internal control stated in the Guidance Note on Audit of Internal Financial Controls Over Financial Reporting issued by the Institute of Chartered Accountants of India.
Other Matters
Our aforesaid report under Section 143(3)(i) of the Act on the adequacy and operating effectiveness of the internal financial controls over financial reporting insofar as it relates to subsidiary company and joint venture company, which are companies incorporated in India, is based solely on the corresponding reports of the auditors of such companies incorporated in India.
Our opinion is not modified in respect of the above matters.
For DELOITTE HASKINS & SELLSChartered Accountants
(Firm's Registration No. 117365W)
Ketan Vora Place: Mumbai (Partner)Date: June 25, 2021 (Membership No. 100459)
UDIN : 20100459AAAAMD8321
86


As at As atParticulars Note No. March 31, 2021 March 31, 2020A ASSETS 1 Non-current assets (a) Property, plant and equipment 2a 22,001.75 22,059.49 (b) Capital work-in-progress 421.50 1,290.40 (c) Right of use assets 2b 49,960.19 48,249.45 (d) Intangible assets 2c 396.40 495.34 (e) Intangible assets under development 32.87 13.01 (f) Investment in Joint Venture 3 729.98 789.22 (g) Financial assets (i) Other financial assets 5 4,328.54 3,922.11 (h) Deferred tax assets (Net) 25 1,666.58 1,238.93 (i) Non-current tax assets 311.47 236.10 (j) Other non-current assets 6 294.23 280.47 Total non - current assets 80,143.51 78,574.52 2 Current assets (a) Inventories 7 28,975.47 37,613.09 (b) Financial assets (i) Investments 3 39,236.92 34,046.00 (ii) Trade receivables 8 5,055.12 7,012.76 (iii) Cash and cash equivalents 9a 2,631.67 1,049.53 (iv) Bank Balances other than (iii) above 9b 6,160.74 38.89 (v) Loans 4 187.88 191.47 (vi) Other financial assets 5 1,311.21 707.56 (c) Other current assets 6 2,231.07 2,508.33 Total current assets 85,790.08 83,167.64 Total assets (1+2) 165,933.59 161,742.16 B EQUITY AND LIABILITIES 1 Equity (a) Equity share capital 10 13,276.71 13,276.71 (b) Other equity 11 69,480.56 67,452.15 Equity attributable to the owners of the Company 82,757.27 80,728.86 Non-Controlling Interests 1,986.18 2,346.66 Total equity 84,743.45 83,075.52 2 Non-current liabilities (a) Financial liabilities (i) Lease liabilities 30 48,864.61 45,803.12 (b) Provisions 14 63.46 55.68 Total non - current liabilities 48,928.07 45,858.80 3 Current liabilities (a) Financial liabilities (i) Borrowings 12 140.56 1,152.32 (ii) Trade payables Total Outstanding dues of Micro Enterprises and Small Enterprises 15 220.49 174.17 Total Outstanding dues of other than Micro Enterprises and Small Enterprises 15 20,244.39 19,971.84 (iii) Lease liabilities 30 7,684.98 7,953.80 (iv) Other financial liabilities 13 1,445.47 1,865.33 (b) Other Current liabilities 16 2,008.51 1,442.10 (c) Provisions 14 83.66 248.28 (e) Current tax liabilities (Net) 434.01 - Total current liabilities 32,262.07 32,807.84 Total equity and liabilities (1+2+3) 165,933.59 161,742.16 See accompanying notes from 1 to forming part of the onsolidated financial statements40 C
In terms of our report attached. For and on behalf of the Board of Directors
F Metro Brands Limited or Deloitte Haskins & SellsChartered Accountants Sd/- Sd/-Ketan Vora Rafique A.Malik Farah Malik Bhanji Partner Chairman Managing Director & Chief Executive Officer DIN:00521563 DIN:00530676 Sd/- Sd/-
P Kaushal Parekh Tarannum Bhanpurwala lace: Mumbai
Date : June 25, 2021 Chief Financial Officer Company Secretary
Consolidated Balance Sheet as at March 31, 2021 ₹ in Lakhs
88

Consolidated Statement of Profit and Loss for the year ended March 31, 2021
For the year ended For the year ended Particulars Note No. March 31, 20 1 March 31, 2020 2
I Revenue from operations 17 80,005.67 128,516.26 II Other Income 18 7,848.14 2,590.62 III Total Income (I + II) 87,853.81 131,106.88 IV Expenses (a) Purchases 19 27,410.17 58,217.93 (b) Changes in inventories of stock in trade 20 8,637.62 (1,151.59) (c) Employee benefits expense 21 10,260.21 12,675.69 (d) Finance Costs 22 4,365.46 3,954.84 (e) Depreciation and Amortisation expense 2a,2b &2c 12,184.42 12,060.51 (f) Other expenses 23 16,545.37 23,507.72 Total Expenses (IV) 79,403.25 109,265.10 V Profit before tax and before share of profit of a Joint Venture (III-IV) 8,450.56 21,841.78 VI Tax expense (a) Current tax 24 2,354.65 5,705.37 (b) Deferred tax 25 (425.95) 163.51 Total tax expense 1,928.70 5,868.88 VII Profit after tax for the year and before share of profit of a Joint Venture (V-Vl) 6,521.86 15,972.90 VIII Share of profit of a Joint Venture (59.79) 84.60 IX Profit after tax for the year (VII+VIII) 6,462.07 16,057.50 X Other comprehensive income 184.61 64.12 (a) (I) Items that will not be reclassified to profit or loss - Gain on Remeasurements of the defined benefit plans (i) Group 148.52 17.21 (ii) Share in Joint Venture 0.56 (1.17) (a) (ii) Income tax relating to items that will not be reclassified to profit or loss (37.39) 1.30 (b) (I) Items that will be reclassified to profit or loss -Gain arising on fair valuation of quoted investments in bonds 72.92 46.78 (b) (ii) Income tax relating to items that will be reclassified to profit or loss - - XI Total comprehensive income for the year (IX+X) 6,646.68 16,121.62 Profit for the year attributable to: - Owners of the Company 6,820.06 15,672.82 - Non-controlling interests (357.99) 384.68 6,462.07 16,057.50 Other comprehensive income for the year attributable to: - Owners of the Company 187.10 53.72 - Non-controlling interests (2.49) 10.40 184.61 64.12 Total comprehensive income for the year attributable to: - Owners of the Company 7,007.16 15,726.54 - Non-controlling interests (360.48) 395.08 6,646.68 16,121.62 Earning per equity share (of ₹ 5 each): Basic 32 2.43 6.05 Diluted 32 2.43 6.05 See accompanying notes from 1 to 40 forming part of the consolidated financial statements
In terms of our report attached. For and on behalf of the Board of Directors
F Metro Brands Limited or Deloitte Haskins & SellsChartered Accountants Sd/- Sd/-Ketan Vora Rafique A.Malik Farah Malik Bhanji Partner Chairman Managing Director & Chief Executive Officer DIN:00521563 DIN:00530676 Sd/- Sd/-
P Kaushal Parekh Tarannum Bhanpurwala lace: Mumbai
Date : June 25, 2021 Chief Financial Officer Company Secretary
₹ in Lakhs
89

For the year ended For the year ended Particulars March 31, 20 1 March 31, 2020 2 Cash flow from Operating Activities Profit before tax for the year 8,450.56 21,841.78 Adjustments for: Finance Cost 62.49 77.37 Depreciation and Amortisation expense 12,184.42 12,060.51 Interest Expense 4,302.97 3,877.47 Rent Concession on account of COVID - 19 (5,188.39) - Net unrealised exchange loss/(gain) 0.13 22.11 Loss on Sale / Discard of Property Plant & Equipment (net) 258.03 253.39 Dividend income from Current Investments in Mutual Funds (52.02) (462.29) Net Gain arising on Investments designated as FVTPL (1,832.11) (1,287.98) Interest Income (530.78) (397.21) Allowance for doubtful Trade receivables, advances and deposits 76.93 - Liabilities no longer required, written back (88.26) (265.46) Advances and other balances written off 70.35 101.58 Net Gain on derecognition of financial liability at amortized cost (10.94) - Operating profit before working capital changes 17,703.38 35,821.27 Movement in working capital: Decrease/(Increase) in Trade Receivable 1,970.42 (1,921.63) (Increase) in other financial assets (351.17) (951.85) Decrease in other current assets 491.75 897.36 Decrease/(Increase) in Inventories 8,637.61 (1,151.59) (Increase) in other non-current assets (103.06) (105.55) (Decrease)/Increase in trade and other payables (305.49) 734.89 Increase/(Decrease) in Other current liabilites 567.13 (119.88) (Decrease)/Increase in Other financial liabilites (38.80) 172.16 (Decrease)/Increase in Provisions (8.32) 15.90 10,860.09 (2,430.19) Cash generated from Operations 28,563.47 33,391.08 Less: Income taxes paid (2,035.81) (6,082.67) Net cash generated from Operating Activities 26,527.66 27,308.41 Cash flows from Investing Activities Capital Expenditure on Property, Plant & Equipment including Capital Advances (2,510.21) (4,420.54) Proceeds from Sale / Discard of Property, Plant & Equipment 35.44 21.00 Interest Received 187.69 122.04 Bank Balances (including Non Current) not considered as Cash and Cash equivalents (6,716.96) (12.04) Purchase of Current Investments (48,438.17) (36,663.66) Redemption of Current Investments 45,152.28 24,229.38 Dividend Income from Mutual Funds 52.02 462.29 Net cash used in Investing Activities (12,237.91) (16,261.53) Cash flow from Financing Activities Proceeds from issue of ESOP shares (including Securities Premium) - - Proceeds/(Repayments) from borrowings (1,011.76) 165.91 Payment of Lease Liabilities (6,654.59) (11,238.51) Finance Cost (62.49) (77.37) Final and Interim Dividends including Dividend Tax paid (4,978.77) - Net cash flow from Financing Activities (12,707.61) (11,149.97) Net Increase/(decrease) in cash and cash equivalents 1,582.14 (103.09)
Cash and cash equivalents at the beginning [Refer Note 9a] 1,049.53 1,152.62 Cash and cash equivalents at the end of the year [Refer Note 9a] 2,631.67 1,049.53
See accompanying notes from 1 to 40 forming part of the Consolidated financial statements
In terms of our report attached. For and on behalf of the Board of Directors
F Metro Brands Limited or Deloitte Haskins & SellsChartered Accountants Sd/- Sd/-Ketan Vora Rafique A.Malik Farah Malik Bhanji Partner Chairman Managing Director & Chief Executive Officer DIN:00521563 DIN:00530676 Sd/- Sd/-
P Kaushal Parekh Tarannum Bhanpurwala lace: Mumbai
Date : June 25, 2021 Chief Financial Officer Company Secretary
Consolidated Statement of cash flow for the year ended March 31, 2021 ₹ in Lakhs
90

₹ in
La
kh
s
91
₹ in
La
kh
s
Bala
nce a
s a
t M
arc
h 3
1,
2019
77
.53
2
9.0
0
-
2
.85
5
5,3
77
.64
(
73
.30
) 5
5,4
13
.72
1
,95
4.9
3
57
,36
8.6
5
Impact
on a
ccount
of
adoptio
n o
f IN
D
AS
116 (
Refe
r N
ote
30)
-
-
-
-
(3
,68
8.1
1)
-
(3
,68
8.1
1)
(3
.35
) (
3,6
91
.46
)
Resta
ted
Ba
lan
ce a
s a
t A
pri
l 1,2
019
77
.53
2
9.0
0
-
2
.85
5
1,6
89
.53
(
73
.30
) 5
1,7
25
.61
1
,95
1.5
8
53
,67
7.1
9
Pro
fit for
the y
ear
-
-
-
-
15
,67
2.8
2
-
15
,67
2.8
2
38
4.6
8
16
,05
7.5
0
Oth
er
com
pre
hensi
ve in
com
e
(net of in
com
e t
ax)
-
-
-
-
-
64
.12
5
3.7
2
10
.40
6
4.1
2
To
tal co
mp
reh
en
siv
e i
nco
me f
or
the y
ear
-
-
-
-
15
,67
2.8
2
64
.12
1
5,7
26
.54
3
95
.08
1
6,1
21
.62
Bala
nce a
s a
t M
arc
h 3
1,
2020
77
.53
2
9.0
0
-
2
.85
6
7,3
62
.35
(
9.1
8)
67
,45
2.1
5
2,3
46
.66
6
9,7
98
.81
Pro
fit for
the y
ear
-
-
-
-
6,8
20
.07
-
6,8
20
.07
(
35
7.9
9)
6,4
62
.08
Oth
er
com
pre
hensi
ve in
com
e
(net of in
com
e t
ax)
-
-
-
-
2
.49
1
84
.61
1
87
.10
(
2.4
9)
18
4.6
1
To
tal co
mp
reh
en
siv
e i
nco
me f
or
the y
ear
-
-
-
-
6,8
22
.56
1
84
.61
7
,00
7.1
7
(3
60
.48
) 6
,64
6.6
9
Inte
rim
Div
idend
-
-
-
-
(9
95
.75
) -
(9
95
.75
) -
(9
95
.75
)
Fin
al D
ivid
end
-
-
-
-
(3
,62
5.2
1)
-
(3
,62
5.2
1)
-
(3,6
25
.21
)
Div
idend D
istr
ibutio
n T
ax
on F
inal D
ivid
end
-
-
-
-
(3
57
.80
) -
(3
57
.80
) -
(3
57
.80
)
Tra
nsf
er
from
ES
OP
outs
tandin
g r
ese
rve
to G
enera
l rese
rve
-
-
2.8
5
(2
.85
) -
-
-
-
-
Bala
nce a
s a
t M
arc
h 3
1,
2021
77
.53
2
9.0
0
2.8
5
-
6
9,2
06
.15
1
75
.43
6
9,4
80
.56
1
,98
6.1
8
71
,46
6.7
4
Co
nso
lid
ate
d S
tate
men
t o
f ch
an
ges in
eq
uit
y f
or
the y
ear
en
ded
Marc
h 3
1, 2021
A.
Eq
uit
y s
hare
cap
ital
P
art
icu
lars
Y
ea
r e
nd
ed
Ma
rch
31
, 2
02
1
Ye
ar
en
de
d M
arc
h 3
1, 2
02
0
B
ala
nce
as
at
begin
nin
g o
f th
e y
ear
13
,27
6.7
1
13
,27
6.7
1
C
hanges
in e
quity
share
capita
l during t
he y
ea
r -
-
B
ala
nce a
s a
t th
e e
nd
of
the y
ear
13
,27
6.7
1
13
,27
6.7
1
B. O
ther
Eq
uit
y
See a
ccom
pa
nyi
ng n
ote
s fr
om
1 t
o 4
0 f
orm
ing p
art
of
the
co
nso
lida
ted
fin
an
cia
l sta
tem
en
ts
In term
s of our
report
att
ach
ed.
Fo
r a
nd
on
be
ha
lf o
f th
e B
oa
rd o
f D
ire
cto
rs
F
Me
tro
Bra
nd
s L
imit
ed
or
Delo
itte
Haskin
s &
Sell
sC
hart
ere
d A
ccounta
nts
S
d/-
S
d/-
Keta
n V
ora
Ra
fiqu
e A
.Ma
lik
Fa
rah
Ma
lik B
ha
nji
Part
ner
Ch
air
ma
n
Ma
na
gin
g D
ire
cto
r &
Ch
ief
Ex
ec
uti
ve
Offi
ce
r
D
IN:0
05
21
56
3D
IN:0
05
30
67
6
Sd
/-
Sd
/-
P
Ka
ush
al P
are
kh
Tara
nn
um
Bh
an
pu
rwa
la
lace
: M
um
ba
i
Date
: J
une 2
5,
2021
Ch
ief
Fin
an
cia
l O
ffic
er
Co
mp
an
y S
ec
reta
ry
Secu
riti
es
pre
miu
m
Cap
ital
reserv
e
Gen
era
l
reserv
e
Em
plo
yee
sto
ck
op
tio
ns
ou
tsta
nd
ing
acco
un
t
Reta
ined
earn
ing
s
Oth
er
Co
mp
reh
en
siv
e
Inco
me
(net
of
taxes)
Att
rib
uta
ble
to t
he
ow
ners
of
the C
om
pan
y
No
n
Co
ntr
ollin
g
Inte
rest
To
tal
Part
icu
lars
Reserv
es a
nd
Su
rplu
s


1.a Corporate Information
Metro Brands Limited ['the Company'] and its subsidiary company (together referred to as 'the Group') and the Joint Venture (JV) are engaged in trading of fashion footwear, bags and accessories operating in the premium and economy category and manufacturing of shoe care and foot care products.
The address of the Company's registered office and principal place of business are given below.
401, Zillion, 4th Floor, LBS Marg & CST Road Junction, Kurla (West), Mumbai – 400070.
1.b Significant Accounting Policies
A) Statement of compliance :
The Consolidated Financial Statements of the Group have been prepared in accordance with Indian Accounting Standards (referred to as Ind AS) prescribed under section 133 of the Companies Act, 2013 ('the Act') read with the Companies (Indian Accounting Standards) Rules 2015, as amended, and other accounting principles generally accepted in India, considering other relevant provisions of the Act.
The financial statements are presented in Indian Rupees (INR) which is also the Group's functional currency. All amounts are rounded to the nearest lakhs except when otherwise indicated.
The Consolidated Financial Statements were approved by the Board of Directors on June25, 2021.
Basis of preparation and presentation of financial statements
The financial statements of the Group have been prepared on a historical cost basis except for certain financial instruments that are measured at fair values at the end of each reporting period, as explained in the accounting policies below. Historical cost is generally based on the fair value of the consideration given at the date of the transaction, in exchange of goods and services.
Based on the nature of activities of the Group and the normal time between acquisition of assets and their realisation in cash or cash equivalents the Group has determined its operating cycle as 12 months for the purpose of classification of its assets and liabilities as current and non-current as set out in Schedule III of the Act.
Fair value is the price that would be received to sell an asset or paid to transfer a liability in an orderly transaction between market participants at the measurement date, regardless of whether that price is directly observable or estimated using another valuation technique. In estimating the fair value of an asset or a liability, the Grouptakes into account the characteristics of the asset or liability if the market participants would take those characteristics into account when pricing the asset or liability at the measurement date.
In addition, for financial reporting purposes, the fair value measurements are categorised into Level 1, 2 or 3 based on the degree to which the inputs to the fair value measurements are observable and the significance of the inputs to the fair value measurement in its entirety, which are described as follows:
● Level 1 inputs are quoted prices (unadjusted) in active markets for identical assets or liabilities that the entity can access at the measurement date;
● Level 2 inputs are inputs, other than quoted prices included in Level 1, that are observable for the asset or liability, either directly or indirectly; and
● Level 3 inputs are unobservable inputs for the asset or liability.
Basis of consolidation :
Subsidiary :
Subsidiary is an entity over which the Group has control. The Group controls an entity when it is exposed or has right to variable return from its involvement with the entity, and has the ability to affect those returns through its power (that is, existing rights that give it the current ability to direct the relevant activities) over the entity. The Group re-assesses whether or not it controls the entity, in case the underlying facts and circumstances indicate that there are changes to above mentioned parameters that determine the existence of control. Subsidiary is fully consolidated from the date on which control is transferred to the Group, and is de-consolidated from the date that control ceases. Non-controlling interests is the equity in a subsidiary not attributable to a parent and presented separately from the Group's equity. Non-controlling interests consist of the amount at the date of the business combination and its share of changes in equity since that date. Profit or loss and other comprehensive income are attributed to the controlling and non-controlling interests in proportion to their ownership interests, even if this results in the non-controlling interests having a deficit balance. However, in case where there are binding contractual arrangements that determine the attribution of the earnings, the attribution specified by such arrangement is considered.
Joint Venture :
The Company's investment in a joint venture is accounted for by the Equity Method. On acquisition of the investment in Joint venture, the excess of the Company's share of the net fair values of the Joint venture's identifiable assets and liabilities over the cost of the investment is recognised directly in equity as Capital Reserve. The carrying amount is increased or decreased to recognize the Company's share of profit or loss and other comprehensive income of the joint venture after the date of acquisition. Distributions received from the joint venture reduce the carrying amount of the investment. The carrying amount of the investment is tested for impairment at each reporting date.
Notes forming part of the Consolidated financial statements as at and for the year ended March 31, 2021
93

The unrealised gains/losses resulting from transactions with joint venture are eliminated against the investment to the extent of the Group's interest in the investee. However unrealised losses are eliminated only to the extent that there is no evidence of impairment.
B) Principles of consolidation :
The Consolidated Financial Statements relate to the Group and its Joint Venture. The Consolidated Financial Statements have been prepared on the following basis:
i. The financial statements of the subsidiary company and JV used in the consolidation are drawn up to the same reporting date as that of the Company i.e. March 31, 2021.
ii. The financial statements of the Company and its subsidiary company have been combined on a line-by-line basis by adding together like items of assets, liabilities, income and expenses, after eliminating intra-group balances, intra-group transactions and resulting unrealised profits or losses (net of deferred tax), unless cost cannot be recovered.
iii. The excess of cost to the Group of its investment in the subsidiary company over its share of equity of the subsidiary company, at the dates on which the investments in the subsidiary company were made are made/acquired, is recognised in the financial statement as 'Goodwill' being an asset in the Consolidated Financial Statements. Similarly, where the share of equity in the subsidiary company as on the dates of investment/acquisition is in excess of cost of theinvestment of the Group, it is recognised as 'Capital Reserve' and shown under the head 'Other Equity' in the Consolidated Financial Statements.
C) Revenue Recognition:
I) Sale of goods:
Revenue is recognized on satisfaction of performance obligation upon transfer of control of promised products or services to customers for an amount that reflects the consideration the Group expects to receive in exchange for those products.The control of goods is transferred to the customer depending upon agreed terms with customer or on delivery basis. Control is considered to be transferred to the customer when the customer has ability to direct the use of such products and obtain substantially all the benefits from it.
Sale of Gift voucher is considered as advance received from the customers till the time the vouchers are redeemed by the customer for the purchase of products and products sold is qualified for revenue recognition.
The Group operates a loyalty points programme which allows customers to accumulate points when they purchase products in the Group's retail stores. The points can be redeemed against consideration payable for subsequent purchases. Consideration received is allocated between the products sold and number of points expected to be redeemed. The consideration allocated to the loyalty points is measured by reference to their fair value. The Group recognises the consideration allocated to loyalty points, when the loyalty points are redeemed.
II) Interest and Dividend Income:
Dividend Income is accounted when right to receive the dividend is established.
Interest Income is recognized on time proportion basis taking into account the amount outstanding and the effective interest rate applicable.
D) Property, plant and equipment and intangible assets:
Property, plant and equipment:
Property, plant and equipment are carried at cost less accumulated depreciation / amortisation and impairment losses, if any. The cost of property, plant and equipment comprises its purchase price net of any trade discounts and rebates, any import duties and other taxes (other than those subsequently recoverable from the tax authorities), any directly attributable expenditure on making the asset ready for its intended use, other incidental expenses and interest on borrowings attributable to acquisition of qualifying property, plant and equipment up to the date the asset is ready for its intended use. Subsequent expenditure on property, plant and equipment after its purchase / completion is capitalised only if such expenditure results in an increase in the future benefits from such asset beyond its previously assessed standard of performance.
Property, plant and equipment retired from active use and held for sale are stated at the lower of their net book value and net realisable value and are disclosed separately. Any expected loss is recognised immediately in the Statement of Profit and Loss. Losses arising from the retirement of, and gains or losses arising from disposal of property, plant and equipment which are carried at cost are recognised in the Statement of Profit and Loss.
Depreciation:
Depreciation is calculated on Straight Line method over the estimated useful life of all assets. These lives are in accordance with Schedule II to the Companies Act, 2013, other than the following asset:
● Leasehold improvements are amortised on straight line basis over the period of lease or useful life (not exceeding 10 years), whichever is lower.
Intangible Assets:
Intangible Assets with finite useful lives acquired separately are carried at cost less accumulated amortisation and accumulated impairment losses, if any. Amortisation is recognised on straight line basis over their estimated useful lives. The
94
Notes to the Consolidated financial statements as at and for the year ended March 2131, 20

estimated useful lives and amortisation method are reviewed at the end of each reporting period, with the effects of any changes in estimate being accounted for on a prospective basis. Intangible assets with indefinite useful lives that acquired separately are carried at cost less accumulated impairment loss.
Intangible assets are amortised over their estimated useful life as follows:-
● Trademark – 10 years
● Copy Rights – 10 years
● Computer Software – 5 years
● Commercial Rights - 10 years
Capital work in progress:
Projects under which tangible property, plant and equipment are not yet ready for their intended use are carried at cost, comprising direct cost, related incidental expenses and attributable interest.
Intangible Assets under development:
Expenditure on intangible assets under development eligible for capitalisation are carried as Intangible assets under development where such assets are not yet ready for their intended use.
E) Impairment of assets:
At the end of each reporting period, the Group reviews the carrying amounts of its tangible assets to determine whether there is any indication that those assets have suffered an impairment loss. If any such indication exists, the recoverable amount of the asset is estimated in order to determine the extent of the impairment loss (if any).When it is not possible to estimate the recoverable amount of an individual asset, the Group estimates the recoverable amount of the cash generating unit to which the asset belongs.
Recoverable amount is higher of fair value less cost of disposal and value in use. In assessing the value in use, the estimated future cash flows are discounted at their present value using the pre-tax discount rate that reflects current market assessment of time value of money and the risks specific to assets for which the estimates of future cash flows have not been adjusted.
If the recoverable amount of an asset (or cash-generating unit) is estimated to be less than its carrying amount, the carrying amount of the asset (or cash-generating unit) is reduced to its recoverable amount. An impairment loss is recognised immediately in the Statement of Profit or Loss.
When an impairment loss subsequently reverses, the carrying amount of the asset (or a cash generating unit) is increased to the revised estimate of its recoverable amount, so that the increased carrying amount does not exceed the carrying amount that would have been determined had no impairment loss been recognised for the assetor cash generating unit in prior years. A reversal of an impairment loss is recognised immediately in the Statement of Profit or Loss.
F) Inventories:
Inventories are valued at the lower of cost and net realisable value. Cost is determined on moving weighted average cost basis. Net realisable value represents the estimated selling price for inventories less all estimated costs of completion and costs necessary to make the sale.
Subsidiary:
The inventory has been valued as per the First in First out method.
Joint Venture:
1) Raw materials
These are valued at cost. Cost includes purchase price, freight inwards and other costs incurred in bringing the inventories to their present location and condition excluding taxes which are subsequently recoverable from the concerned revenue authorities such as Goods and service tax (GST). Costs of purchased inventory are determined after deducting rebates and discounts. Cost of raw material is determined on first in first out basis (FIFO).
2) Stock-in trade
These are valued at lower of cost and net realisable value. Cost includes purchase price, freight inwards and other costs incurred in bringing the inventories to their present location and condition excluding taxes which are subsequently recoverable from the concerned revenue authorities such as Goods and service tax (GST). Costs of purchased inventory are determined after deducting rebates and discounts. Cost of stock-in trade is determined on first in first out basis (FIFO).
3) Manufactured finished goods
These are valued at lower of cost and net realisable value. Cost includes cost of raw material, cost of conversion such as overheads and other costs incurred in bringing such inventories to its present location and condition based on actual level of production. Costs of manufactured finished goods determined on first in first out basis (FIFO).
95
Notes to the Consolidated financial statements as at and for the year ended March 2131, 20

Net realizable value is the estimated selling price in the ordinary course of business, less estimated costs of completion and the estimated costs necessary to make the sale. The comparison of cost and net realizable value is made on item by item basis.
Devaluation on inventories is considered on the basis of management's best estimate of demand and expected turnover of the inventories.
G) Taxes on Income:
Income Tax expense represents the sum of the current tax and deferred tax.
Current Tax
Current tax is the tax payable on the taxable profit for the year. Taxable profit differs from 'profit before tax' as reported in the Statement of Profit and Loss because of items of income or expense that are taxable or deductible in other years and items that are never taxable or deductible. The Group's current tax is calculated using tax rates that have been enacted or substantively enacted by the end of the reporting period, in accordance with the Income Tax Act, 1961.
Deferred Tax:
Deferred tax assets and liabilities are recognized for the future tax consequences of temporary differences between the carrying values of assets and liabilities and their respective tax bases. Deferred tax assets are recognized to the extent that it is probable that future taxable income will be available against which the deductible temporary differences could be utilized.
The carrying amount of deferred tax assets is reviewed at the end of each reporting period and reduced to the extent that it is no longer probable that sufficient taxable profits will be available to allow all or part of the asset to be recovered.
Deferred tax liabilities and assets are measured at the tax rates that are expected to apply in the period in which the liability is settled or the asset is realised, based on the tax rates (and tax laws) that have been enacted or substantively enacted by the end of the reporting period.
The measurement of deferred tax liabilities and assets reflects the tax consequences that would follow from the manner in which the Group expects, at the end of the reporting period, to recover or settle the carrying amount of its assets and liabilities.
H) Employee Benefits:
Short-term employee benefits:
The undiscounted amount of short-term employee benefits expected to be paid in exchange of the services rendered by employees are recognised during the year when the employees render the service. These benefits include performance incentive and compensated absences which are expected to occur within twelve months after the end of the period in which the employee renders the related service.
In case of non-accumulating compensated absences, the cost of short-term compensated absences is accounted when the absences occur.
Long-term employee benefits:
i) Defined Contribution Plan:
The Provident Fund is a defined contribution scheme. The eligible employees of the Group are entitled to receive post-employment benefits in respect of provident fund, in which both employees and the Group make monthly contributions at a specified percentage of the employees' eligible salary. The Group's contribution is recognised as an expense in the Statement of Profit and Loss during the period in which the employee renders the related service.
II) Defined Benefit Plan:
The Group has Defined Benefit Plan in the form of Gratuity.
Gratuity fund is recognised by the Income-tax authorities and administered through an Insurance fund. Liability for Defined Benefit Plans is provided on the basis of valuations, as at the Balance Sheet date, carried out by an independent actuary.
The defined benefit obligation is calculated annually by independent actuary using the projected unit credit method. The present value of the defined benefit obligation is determined by discounting the estimated future cash outflows using discount rate (interest rates of government bonds) that have terms to maturity approximating to the terms of the Gratuity.
Remeasurement gains and losses arising from experience adjustments and changes in actuarial assumptions are recognised in the period in which they occur, directly in other comprehensive income. They are included in 'Other Comprehensive Income' (net of taxes) in the statement of changes in equity and in the balance sheet.
Net interest is calculated by applying the discount rate to the net defined benefit liability or asset.
I) Foreign Currencies:
i) Initial Recognition
Foreign currency transactions are recorded in the reporting currency, by applying to the foreign currency amount the exchange rate between the reporting currency and the foreign currency at the date of the transaction.
96
Notes to the Consolidated financial statements as at and for the year ended March 2131, 20

ii) Conversion
Foreign currency monetary items are translated using the closing exchange rate as on Balance Sheet date. Non-monetary items which are carried in terms of historical cost denominated in a foreign currency are reported using the exchange rate at the date of the transaction.
iii) Exchange Differences
Exchange differences arising on the settlement of monetary items or on remeasurement of monetary items at rates different from those at which they were initially recorded during the year, or reported in previous financial statements, are recognised as income or as expenses in the year in which they arise and disclosed as a net amount in the financial statements.
J) Employees Stock Option Plan (ESOP):
In respect of Employee Stock Options, the Group measures the compensation cost using the fair value on grant date. The compensation cost, if any, is amortised on a straight-line basis over the vesting period of the options, based on the Company's estimate of equity instruments that will eventually vest.
K) Provisions, Contingent Liabilities and Contingent Assets
(I) Provisions
Provisions are recognised when the Group has a present legal or constructive obligation as a result of past events; it is probable that an outflow of resources will be required to settle the obligation; and the amount can be reliably estimated. If the effect of the time value of money is material, provisions are discounted using a current pre-tax rate that reflects, when appropriate, the risks specific to the liability. When discounting is used, the increase in the provision due to the passage of time is recognised as a finance cost.
Provision for warranty:
The estimated liability for product warranties is recorded when products are sold. These estimates are established using historical information on the nature, frequency and average cost of warranty claims and management estimates regarding possible future incidence based on corrective actions on product failures. The timing of outflows will vary as and when warranty claim will arise.
(ii) Contingent Liabilities
Contingent liabilities are disclosed when there is:
● A possible obligation arising from past events, the existence of which will be confirmed only by the occurrence or non-occurrence of one or more uncertain future events not wholly within the control of the Group; or
● A present obligation that arises from past events where it is either not probable that an outflow of resources will be required to settle or reliable estimate of the amount cannot be made.
L) Financial assets and financial liabilities:
Financial Instruments:
Financial Assets and Financial liabilities are recognised when a Group becomes party to the contractual provisions of the instruments. Financial assets and financial liabilities are initially measured at fair value. Transaction costs that are directly attributable to the acquisition or issue of financial assets and financial liabilities(other than financial assets and financial liabilities, at fair value through profit or loss) are added to or deducted from the fair value of the financial assets or financial liabilities, as appropriate, on initial recognition. Transaction costs directly attributable to the acquisition of financial assets or financial liabilities at fair value through profit or loss are recognised immediately in the Statement of Profit and Loss.
Financial assets:
(i) Classification:
The classification depends on the entity's business model for managing the financial assets and the contractual terms of the cash flows.The Group classifies its financial assets in the following subsequent measurement categories:
Amortised Cost
Financial Assets that are held for collection of contractual cash flows where those cash flows represent solely payments of principal and interest are measured at amortised cost. A gain or loss on a financial asset that is subsequently measured at amortised cost is recognised in the Statement of Profit and Loss when the asset is derecognised or impaired. Interest income from these financial assets is included in other income using the effective interest rate method.
Fair Value Through Other Comprehensive Income (FVOCI)
Financial Assets (including debt instruments) are subsequently measured at fair value through other comprehensive income when the asset is held within a business model with an objective that is achieved by collecting contractual cash flows and selling financial assets and the terms of the instrument give rise to cash flows that represent solely payments of principal and interest thereon. Movements in the carrying amount of such assets are taken through Other Comprehensive Income (OCI). When the financial asset is derecognised, the cumulative gain or loss previously recognised in OCI is not reclassified from equity to profit or loss. Interest income from these financial assets is included in other income using the effective interest rate method.
97
Notes to the Consolidated financial statements as at and for the year ended March 2131, 20
98
Fair Value Through Profit or Loss (FVTPL)
Assets that do not meet the criteria for amortised cost or FVOCI are measured at FVTPL. A gain or loss on a financial asset that is subsequently measured at fair value through profit or loss is recognised in profit or loss in the period in which it arises. Interest income from these financial assets is included in other income.
(ii) Impairment of Financial Assets:
The Group assesses on a forward looking basis the expected credit losses associated with its assets carried at amortised cost and debt instruments at FVOCI. For trade receivables, loans and advances given, the Group measure the loss allowance at an amount equal to lifetime expected credit losses. This expected credit loss allowance is computed based on historical credit loss experience and adjusted for forward looking information. The computation also takes into consideration whether there has been a significant increase in credit risk.
(iii) Derecognition of Financial Assets:
A financial asset is derecognised only when:
● the Group has transferred the contractual rights to receive cash flows of the financial asset; or
● retains the contractual rights to receive the cash flows of the financial asset, but assumes a contractual obligation to pay the cash flows to one or more recipients.
Where the entity has transferred an asset, the Group evaluates whether it has transferred substantially all risks and rewards of ownership of the financial asset. In such cases, the financial asset is derecognised. Where the entity has not transferred substantially all risks and rewards of ownership of the financial asset, the financial asset is not derecognised. Where the entity has neither transferred a financial asset nor retains substantially all risks and rewards of ownership of the financial asset, the financial asset is derecognised if the Group has not retained control of the financial asset. Where the Group retains control of the financial asset, the asset is continued to be recognised to the extent of continuing involvement in the financial asset.
Financial liabilities:
Financial liabilities are subsequently measured at amortised cost using the effective interest method.
Derecognition of financial liabilities:
The Group derecognises financial liabilities when, and only when the Group's obligation are discharged, cancelled or have expired. An exchange between the lender of debt instrument with substantially different terms is accounted for as an extinguishment of the original financial liability and the recognition of a new financial liability. Similarly, a substantial modification of the term of an existing liability (whether or not attributable to the financial difficulty of the debtor) is accounted for as an extinguishment of the original financial liability and the recognition of a new financial liability. The difference between the carrying amount of the financial liability derecognised and the consideration paid and payable is recognised in the Statement of Profit or Loss.
M) Leases:
The Group has adopted Ind AS 116-Leases effective1st April, 2019, using the modified retrospective method.The Group has applied the standard to its leases withthe cumulative impact recognised on the date of initialapplication (1st April, 2019). Accordingly, previous periodinformation has not been restated.
The Group's lease asset classes primarily consist of leases for Showroom Premise. The Group assesses whether a contract is or contains a lease, at inception of a contract. A contract is, or contains, a lease if the contract conveys the right to control the use of an identified asset for a period of time in exchange for consideration. To assess whether a contract conveys the right to control the use of an identified asset, the Group assesses whether:
i) the contract involves the use of an identified asset
ii) the Group has substantially all of the economic benefits from use of the asset through the period of the lease and
iii) the Group has the right to direct the use of the asset.
At the date of commencement of the lease, the Group recognises a right-of-use asset (“ROU”) and a corresponding lease liability for all lease arrangements in which it is a lessee, except for leases with a term of twelve months or less (short-term leases) and leases of low value assets.
The right-of-use assets are initially recognised at cost, which comprises the initial amount of the lease liability adjusted for any lease payments made at or prior to the commencement date of the lease plus any initial direct costs less any lease incentives. They are subsequently measured at cost less accumulated depreciation and impairment losses, if any. Right-of-use assets are depreciated from the commencement date on a straight-line basis over the lease term.
The lease liability is initially measured at the present value of the future lease payments. The lease payments are discounted using the interest rate implicit in the lease or, if not readily determinable, using the incremental borrowing rates. The lease liability is subsequently remeasured by increasing the carrying amount to reflect interest on the lease liability, reducing the carrying amount to reflect the lease payments made.
A lease liability is remeasured upon the occurrence of certain events such as a change in the lease term or a change in an index or rate used to determine lease payments. The remeasurement normally also adjusts the leased assets.
Notes to the Consolidated financial statements as at and for the year ended March 2131, 20

99
Practical expedient for rent concession due to COVID-19
The Group has elected to apply the practical expedient of not assessing the rent concessions as a lease modification, as per MCA notification dated 24th July 2020 on IND- AS 116 for rent concessions which are granted due to COVID-19 pandemic.
N) Earnings per Share:
Basic earnings per share is computed by dividing the profit / (loss) after tax attributable to equity shareholders by the weighted average number of equity shares outstanding during the period. Diluted earnings per share is computed by dividing the profit / (loss) after tax as adjusted for dividend, interest and other charges to expense or income relating to the dilutive potential equity shares, by the weighted average number of equity shares considered for deriving basic earnings per share and the weighted average number of equity shares which could have been issued on the conversion of all dilutive potential equity shares.
O) Cash flow statement:
Cash flows are reported using the indirect method, whereby profit / (loss) before tax is adjusted for the effects of transactions of non-cash nature and any deferrals or accruals of past or future cash receipts or payments. The cash flows from operating, investing and financing activities of the Group are segregated based on the available information.
P) Cash and cash equivalents:
Cash comprises cash on hand and demand deposits with banks. Cash equivalents are short- term balances (with an original maturity of three months or less from the date of acquisitions), highly liquid investments that are readily convertible into known amounts of cash and which are subject to insignificant risk of changes in value.
Q) Segment Reporting
Operating segments are reported in a manner consistent with the internal reporting provided to the chief operating decision-maker.The chief operating decision-maker, is responsible for allocating resources and assessing performance of the operating segments and makes strategic decisions (Refer Note 29)
Note 1.c - Critical Accounting Estimates and Judgements
Preparing the financial statements under Ind AS requires management to take decisions and make estimates and assumptions that may impact the value of revenues, costs, assets and liabilities and the related disclosures concerning the items involved as well as contingent assets and liabilities at the balance sheet date. Estimates and judgements are continually evaluated and are based on historical experience and other factors, including expectations of future events that are believed to be reasonable under the circumstances.
The estimates and underlying assumptions are reviewed on an ongoing basis. Revision to the estimates and underlying assumptions are reviewed on an ongoing basis. Revision to accounting estimates are recognised in the period in which the estimate is revised if the revision affects only that period, or in the period of revision and future periods if the revision affects both current and future periods.
The following are the areas involving critical estimates and judgements as at the end of the reporting period that may have a significant risk of causing a material adjustment to the carrying amount of assets and liabilities:
● Estimation of Revenue arising from Loyalty points [Refer Note 1.b(C)(I)]
● Estimation of useful life of Property, Plant and Equipment [Refer Note 1.b(D)]
● Estimation of Defined Benefit Obligation [Refer Note 1.b(H)(II)]
● Fair value measurements and valuation process. 1.b(L)(I)]
● Impairment of Financial Assets [Refer Note 1.b(L)(II)]
Estimation of uncertainties relating to the global health pandemic from COVID-19:
The Group has evaluated the likely impact of the COVID-19 on the overall business of the Group on account of outbreak of the second wave of COVID-19. The Group as at the date of the approval of these financials, has used various available sources of information to analyse the carrying amount of its financial assets and exposures.
The impact of COVID-19 pandemic on the overall economic environment being uncertain may affect the underlying assumptions and estimates used to prepare the Group’s financial statements, which may differ from that considered as at the date of approval of these financial statements. The Group will continue to closely monitor any material changes to future economic conditions. The Group has resumed its business activities by reopening its retail stores on a gradual basis in line with the guidelines issued by the respective State Government authorities.
Notes to the Consolidated financial statements as at and for the year ended March 2131, 20

₹ in Lakhs
Particulars Buildings Leasehold Furniture Machinery Motor Computers Total Improvements and and Vehicles (Showrooms Fittings Equipment and Office)
I. Cost
Balance as at March 31, 2019 11,122.29 12,216.61 3,132.13 2,602.18 442.61 964.41 30,480.23
Additions - 2,107.53 700.90 607.81 - 222.87 3,639.11
Disposals - (1,120.30) (184.96) (147.75) - (64.23) (1,517.24)
Balance as at March 31, 2020 11,122.29 13,203.84 3,648.07 3,062.24 442.61 1,123.05 32,602.10
Additions - 1,704.18 817.67 384.47 29.37 88.68 3,024.37
Disposals (735.42) (114.15) (110.07) - (10.38) (970.02)
Balance as at March 31, 2021 11,122.29 14,172.60 4,351.59 3,336.64 471.98 1,201.35 34,656.45
II. Accumulated depreciation
Balance as at March 31, 2019 734.45 5,097.78 1,151.58 992.76 128.34 593.89 8,698.80
Depreciation expense for the year (Refer Note 30) 238.08 1,956.14 344.33 325.71 50.94 171.46 3,086.66
Eliminated on disposal of assets/write off - (932.82) (139.49) (110.23) - (60.31) (1,242.85)
Balance as at March 31, 2020 972.53 6,121.10 1,356.42 1,208.24 179.28 705.04 10,542.61
Depreciation expense for the year (Refer Note 30) 238.08 1,564.68 405.99 359.34 51.95 168.60 2,788.64
Eliminated on disposal of assets/write off - (510.68) (75.97) (80.44) - (9.46) (676.55)
Balance as at March 31, 2021 1,210.61 7,175.10 1,686.44 1,487.14 231.23 864.18 12,654.70
Net carrying amount (I-II)
Balance as at March 31, 2021 9,911.68 6,997.50 2,665.15 1,849.50 240.75 337.17 22,001.75
Balance as at March 31, 2020 10,149.76 7,082.74 2,291.65 1,854.00 263.33 418.01 22,059.49
Particulars As at March 31, 2021 As at March 31, 2020
I. Cost
Balance as at April 1, 2019 37,658.83 37,658.83
Additions 20,496.63 20,496.63
Deletion (1,084.55) (1,084.55)
Balance as at March 31, 2020 57,070.91 57,070.91
Additions 13,117.02 13,117.02
Deletion (2,049.64) (2,049.64)
Impairment (102.92) (102.92)
Balance as at March 31, 2021 68,035.37 68,035.37
II. Accumulated amortisation
Balance as at April 1, 2019 - -
Amortisation expense for the year 8,821.46 8,821.46
Balance as at March 31, 2020 8,821.46 8,821.46
Amortization expense for the year 9,253.72 9,253.72
Balance as at March 31, 2021 18,075.18 18,075.18
Net carrying amount (I-II)
Balance as at March 31, 2021 49,960.19 49,960.19
Balance as at March 31, 2020 48,249.45 48,249.45
Notes forming part of the consolidated financial statements for the year ended March 31, 2021 2a. Property, Plant and Equipment:
2b. Right of use assets ₹ in Lakhs
100

Notes forming part of Consolidated financial statements as at and for the year ended Mar 31 2021
101
Disposals - - - (0.18) (0.18)
Balance as at March 31, 2020 26.00 41.00 231.88 902.85 1,201.73
Additions 43.13 43.13
Balance as at March 31, 2021 26.00 41.00 231.88 945.98 1,244.86
II. Accumulated amortisation
Balance as at March 31, 2019 26.00 41.00 138.74 348.44 554.18
Amortization expense for the year - - 10.41 141.98 152.39
Eliminated on disposal of assets / write off - - - (0.17) (0.17)
Balance as at March 31, 2020 26.00 41.00 149.15 490.25 706.40
Amortization expense for the year 10.41 131.65 142.06
Balance as at March 31, 2021 26.00 41.00 159.56 621.90 848.46
Net carrying amount (I-II)
Balance as at March 31, 2021 - - 72.32 324.08 396.40
Balance as at March 31, 2020 - - 82.73 412.60 495.33
Particulars Copyrights Commercial Trademarks Computer Total Rights Software
I. Cost
Balance as at March 31, 2019 26.00 41.00 231.88 751.31 1,050.19
Additions - - - 151.72 151.72
2c. Intangible Assets (Represents other than internally generated intangible assets) : ₹ in Lakhs
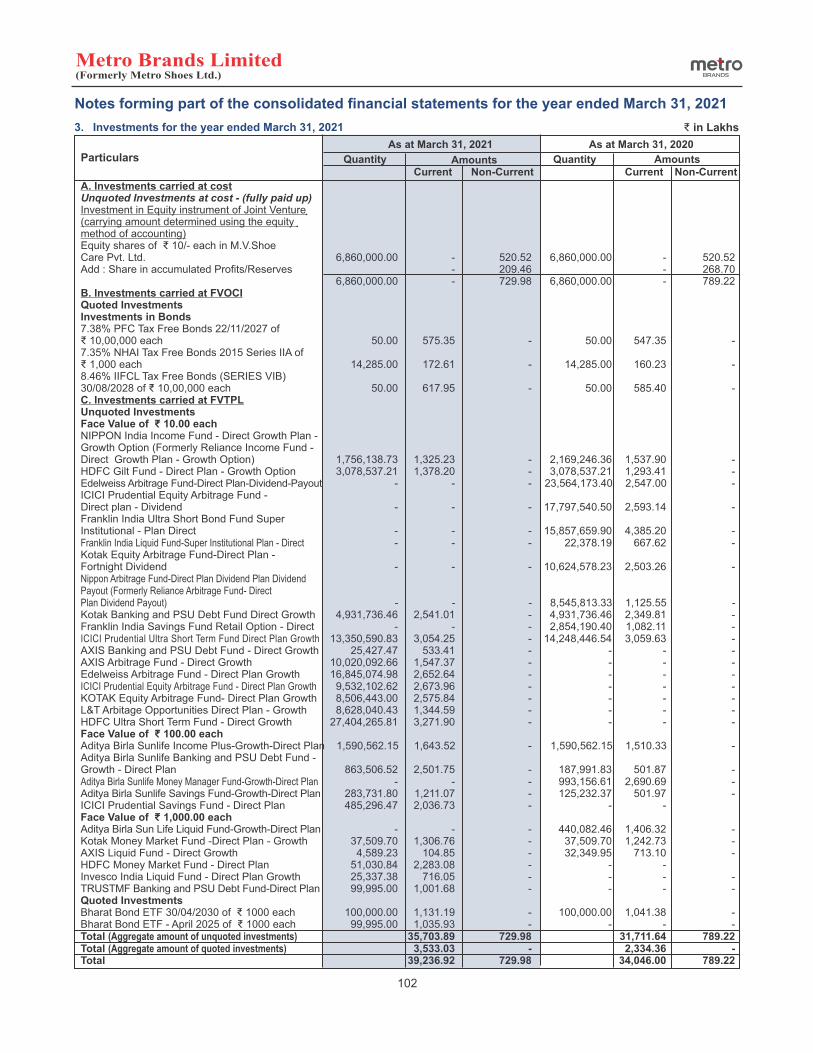
Notes forming part of the consolidated financial statements for the year ended March 31, 2021
3. Investments for the year ended March 31, 2021
Particulars
A. Investments carried at cost Unquoted Investments at cost - (fully paid up) Investment in Equity instrument of Joint Venture(carrying amount determined using the equity method of accounting) Equity shares of ₹ 10/- each in M.V.Shoe Care Pvt. Ltd. 6,860,000.00 - 520.52 6,860,000.00 - 520.52 Add : Share in accumulated Profits/Reserves - 209.46 - 268.70 6,860,000.00 - 729.98 6,860,000.00 - 789.22 B. Investments carried at FVOCI Quoted Investments Investments in Bonds 7.38% PFC Tax Free Bonds 22/11/2027 of ₹ 10,00,000 each 50.00 575.35 - 50.00 547.35 - 7.35% NHAI Tax Free Bonds 2015 Series IIA of ₹ 1,000 each 14,285.00 172.61 - 14,285.00 160.23 - 8.46% IIFCL Tax Free Bonds (SERIES VIB) 30/08/2028 of ₹ 10,00,000 each 50.00 617.95 - 50.00 585.40 - C. Investments carried at FVTPL Unquoted Investments Face Value of ₹ 10.00 each NIPPON India Income Fund - Direct Growth Plan - Growth Option (Formerly Reliance Income Fund - Direct Growth Plan - Growth Option) 1,756,138.73 1,325.23 - 2,169,246.36 1,537.90 - HDFC Gilt Fund - Direct Plan - Growth Option 3,078,537.21 1,378.20 - 3,078,537.21 1,293.41 - Edelweiss Arbitrage Fund-Direct Plan-Dividend-Payout - - - 23,564,173.40 2,547.00 - ICICI Prudential Equity Arbitrage Fund - Direct plan - Dividend - - - 17,797,540.50 2,593.14 - Franklin India Ultra Short Bond Fund Super Institutional - Plan Direct - - - 15,857,659.90 4,385.20 - Franklin India Liquid Fund-Super Institutional Plan - Direct - - - 22,378.19 667.62 - Kotak Equity Arbitrage Fund-Direct Plan -Fortnight Dividend - - - 10,624,578.23 2,503.26 - Nippon Arbitrage Fund-Direct Plan Dividend Plan Dividend Payout (Formerly Reliance Arbitrage Fund- Direct Plan Dividend Payout) - - - 8,545,813.33 1,125.55 - Kotak Banking and PSU Debt Fund Direct Growth 4,931,736.46 2,541.01 - 4,931,736.46 2,349.81 - Franklin India Savings Fund Retail Option - Direct - - - 2,854,190.40 1,082.11 - ICICI Prudential Ultra Short Term Fund Direct Plan Growth 13,350,590.83 3,054.25 - 14,248,446.54 3,059.63 - AXIS Banking and PSU Debt Fund - Direct Growth 25,427.47 533.41 - - - - AXIS Arbitrage Fund - Direct Growth 10,020,092.66 1,547.37 - - - - Edelweiss Arbitrage Fund - Direct Plan Growth 16,845,074.98 2,652.64 - - - - ICICI Prudential Equity Arbitrage Fund - Direct Plan Growth 9,532,102.62 2,673.96 - - - - KOTAK Equity Arbitrage Fund- Direct Plan Growth 8,506,443.00 2,575.84 - - - - L&T Arbitage Opportunities Direct Plan - Growth 8,628,040.43 1,344.59 - - - - HDFC Ultra Short Term Fund - Direct Growth 27,404,265.81 3,271.90 - - - -Face Value of ₹ 100.00 each Aditya Birla Sunlife Income Plus-Growth-Direct Plan 1,590,562.15 1,643.52 - 1,590,562.15 1,510.33 - Aditya Birla Sunlife Banking and PSU Debt Fund - Growth - Direct Plan 863,506.52 2,501.75 - 187,991.83 501.87 - Aditya Birla Sunlife Money Manager Fund-Growth-Direct Plan - - - 993,156.61 2,690.69 - Aditya Birla Sunlife Savings Fund-Growth-Direct Plan 283,731.80 1,211.07 - 125,232.37 501.97 - ICICI Prudential Savings Fund - Direct Plan 485,296.47 2,036.73 - - -Face Value of ₹ 1,000.00 each Aditya Birla Sun Life Liquid Fund-Growth-Direct Plan - - - 440,082.46 1,406.32 - Kotak Money Market Fund -Direct Plan - Growth 37,509.70 1,306.76 - 37,509.70 1,242.73 - AXIS Liquid Fund - Direct Growth 4,589.23 104.85 - 32,349.95 713.10 - HDFC Money Market Fund - Direct Plan 51,030.84 2,283.08 - - - Invesco India Liquid Fund - Direct Plan Growth 25,337.38 716.05 - - - - TRUSTMF Banking and PSU Debt Fund-Direct Plan 99,995.00 1,001.68 - - - - Quoted Investments Bharat Bond ETF 30/04/2030 of ₹ 1000 each 100,000.00 1,131.19 - 100,000.00 1,041.38 - Bharat Bond ETF - April 2025 of ₹ 1000 each 99,995.00 1,035.93 - - - - Total (Aggregate amount of unquoted investments) 35,703.89 729.98 31,711.64 789.22 Total (Aggregate amount of quoted investments) 3,533.03 - 2,334.36 - Total 39,236.92 729.98 34,046.00 789.22
As at March 31, 2021 As at March 31, 2020
102
₹ in Lakhs

Particulars
Current Non- Current Total Current Non-Current Total
Loans to employees 19.43 - 19.43 31.18 - 31.18
Loans to Selling agents, Retail agents, Supervisors and others 168.45 - 168.45 160.29 - 160.29
Total 187.88 - 187.88 191.47 - 191.47
₹ in Lakhs4. Loans (Unsecured, considered good)
Particulars
Current Non- Current Total Current Non-Current Total
Security Deposits
(i) Others 1,201.65 3,697.33 4,898.98 656.45 3,886.01 4,542.46
Less: Allowance for doubtful deposits (15.62) - (15.62) (11.20) - (11.20)
1,186.03 3,697.33 4,883.36 645.25 3,886.01 4,531.26
Bank Deposit with more than 12 months maturity from the Balance Sheet date - 631.21 631.21 - 36.10 36.10
Insurance Claim Receivable 6.79 - 6.79 12.14 - 12.14
Interest accrued on deposits with banks, loans and investments 118.39 - 118.39 50.17 - 50.17
Total 1,311.21 4,328.54 5,639.75 707.56 3,922.11 4,629.67
₹ in Lakhs5. Other financial assets
Notes forming part of the consolidated financial statements for the year ended March 31, 2021
Particulars
Current Non- Current Total Current Non-Current Total
(i) Advances to Vendors 865.89 - 865.89 547.14 - 547.14
Less: Allowance for doubtful advances (69.13) (69.13) - - -
796.76 - 796.76 547.14 - 547.14
(ii) Capital advances - 6.77 6.77 - 96.06 96.06
(iii) Balances with government authorities :
(i) Goods and Services tax/Value Added tax credit 1,156.48 2.28 1,158.76 1,676.14 2.28 1,678.42
receivable
(iv) Prepayments 172.29 3.59 175.88 195.82 1.06 196.88
(v) Prepaid Rent 44.88 230.74 275.62 27.33 127.28 154.61
(vi) Others (Receivables from Showroom Managers, Retail Agents etc.) 76.83 - 76.83 61.91 - 61.91
Less: Allowance for doubtful receivables (16.17) (16.17) - - -
60.66 - 60.66 61.91 - 61.91
(vii) Amounts paid under protest - 50.85 50.85 - 53.79 53.79
[Sales tax ` 50.85 Lakhs (March 31, 2020- Sales tax ` 53.79 Lakhs )]
Total 2,231.07 294.23 2,525.30 2,508.33 280.47 2,788.81
As at March 31, 2021 As at March 31, 2020
₹ in Lakhs6. Other assets
103
As at March 31, 2021 As at March 31, 2020
As at March 31, 2021 As at March 31, 2020
Particulars As at As at March 31, 2021 March 31, 2020
Stock in trade (Refer Note 20) 28,975.47 37,613.09
Total 28,975.47 37,613.09
Included above, goods-in-transit: 527.04 273.36
Notes:
I) The cost of inventories recognised as an expense during the year was ₹ 36,047.80 Lakhs (March 31, 2020: ₹ 57,066.34 Lakhs)
ii) The cost of inventories recognised as an expense includes (₹ 12.99) Lakhs (March 31, 2020: ₹ 14.63 Lakhs) in respect of reversal of write-down of inventory to net realisable value.
₹ in Lakhs 7. Inventories

Particulars As at As at March 31, 2021 March 31, 2020
(a) Unrestricted balances with Banks
- In Current accounts 2,450.60 948.01
- In Fixed Deposit - 26.01
(b) Restricted balances with Banks (Refer Note below)
- In Current accounts - 0.30
(c) Cash on hand 47.15 49.87
(d) Cash at showrooms 133.92 25.34
Total 2,631.67 1,049.53
Notes forming part of the consolidated financial statements for the year ended March 31, 2021
9a. Cash and cash equivalents ₹ in Lakhs
Particulars As at As at March 31, 2021 March 31, 2020
(a) In earmarked accounts
Balance with Banks (fixed deposits) held as margin money or security
against guarantees and other commitments (Refer Footnote) 42.66 38.89
(b) Fixed Deposits 6,118.08 -
Total 6,160.74 38.89
Note: Balances with banks (fixed deposits) includes ₹ 42.66 Lakhs (March 31,2020 ₹ 20.93 Lakhs) which have an original maturity of more than 12 month.
9b. Other Bank Balances ₹ in Lakhs
10. Equity Share Capital ₹ in Lakhs
Particulars As at As at March 31, 2021 March 31, 2020
Number of Share Capital Number of Share Capital Shares (₹ in Lakhs) Shares (₹ in Lakhs)
Authorised:
Equity shares of ₹ 5/- each (FY 2019-20 ₹ 10/- each) 300,000,000 15,000.00 150,000,000 15,000.00
Issued, Subscribed and Fully Paid-up:
Equity shares of Rs of ₹ 5/- each (FY 2019-20 ₹ 10/- each) 265,534,290 13,276.71 132,767,145 13,276.71
Total 13,276.71 13,276.71
10.1 Reconciliation of the number of shares and amount outstanding at the beginning and at the end of the reporting period ₹ in Lakhs
Particulars As at As at March 31, 2021 March 31, 2020
Number of Share Capital Number of Share Capital Shares (₹ in Lakhs) Shares (₹ in Lakhs)
Equity Share Capital Equity Share Capital Balance as at beginning of the year (Equity shares of Rs of ₹ 5/- each (FY 2019-20 ₹ 10/- each) 132,767,145 13,276.71 2,767,145 13,276.71 Equity shares arising on shares split from ₹10 to ₹5 per share 132,767,145 - - - Balance as at the end of the year 265,534,290 13,276.71 132,767,145 13,276.71
Note : The equity shares of the Company, during the year, been sub-divided from existing face value of ₹ 10/- per equity share to face value of ₹ 5/- per equity share.
Particulars As at As at March 31, 2021 March 31, 2020 Trade receivables* Unsecured, considered good 5,060.40 7,030.83 Doubtful - - 5,060.40 7,030.83 Less: Allowance for doubtful debts (5.28) (18.07) Total 5,055.12 7,012.76
8. Trade receivables ₹ in Lakhs
* Refer Note 37.4 (A) (ii)
Notes- Restricted balances with banks represent unpaid dividend
104
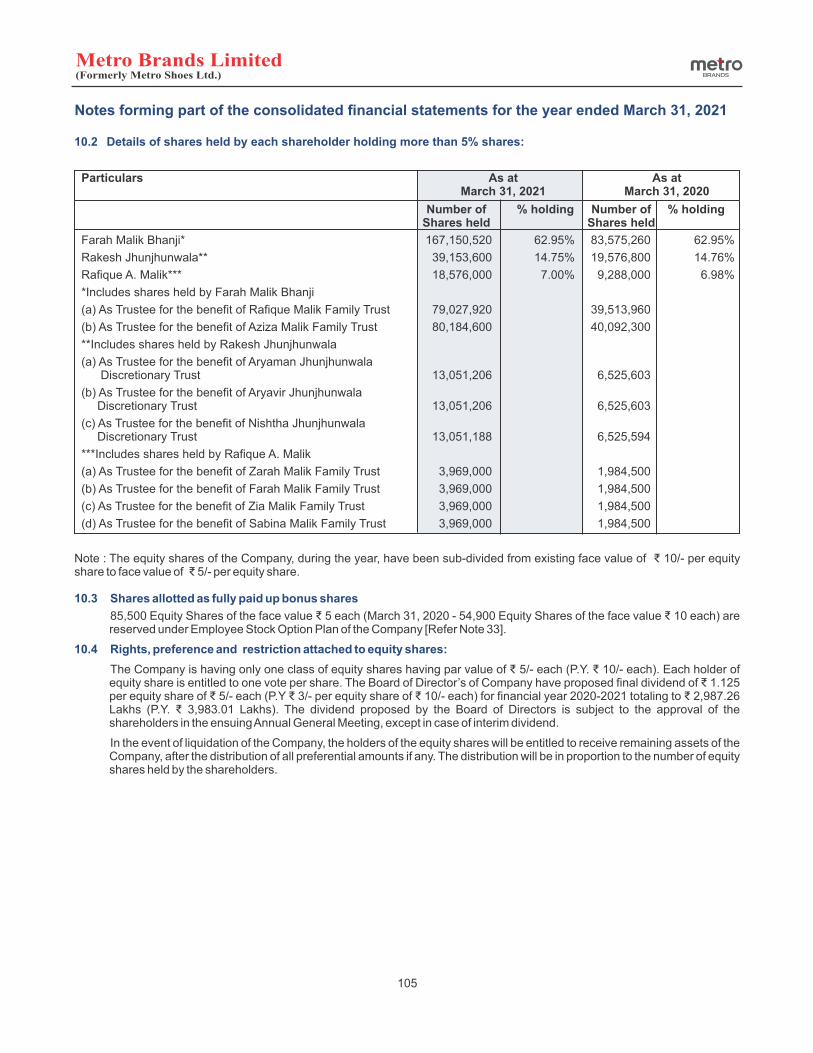
Notes forming part of the consolidated financial statements for the year ended March 31, 2021
10.2 Details of shares held by each shareholder holding more than 5% shares:
Particulars As at As at March 31, 2021 March 31, 2020
Number of % holding Number of % holding Shares held Shares held
Farah Malik Bhanji* 167,150,520 62.95% 83,575,260 62.95%
Rakesh Jhunjhunwala** 39,153,600 14.75% 19,576,800 14.76%
Rafique A. Malik*** 18,576,000 7.00% 9,288,000 6.98%
*Includes shares held by Farah Malik Bhanji
(a) As Trustee for the benefit of Rafique Malik Family Trust 79,027,920 39,513,960
(b) As Trustee for the benefit of Aziza Malik Family Trust 80,184,600 40,092,300
**Includes shares held by Rakesh Jhunjhunwala
(a) As Trustee for the benefit of Aryaman Jhunjhunwala Discretionary Trust 13,051,206 6,525,603
(b) As Trustee for the benefit of Aryavir Jhunjhunwala Discretionary Trust 13,051,206 6,525,603
(c) As Trustee for the benefit of Nishtha Jhunjhunwala Discretionary Trust 13,051,188 6,525,594
***Includes shares held by Rafique A. Malik
(a) As Trustee for the benefit of Zarah Malik Family Trust 3,969,000 1,984,500
(b) As Trustee for the benefit of Farah Malik Family Trust 3,969,000 1,984,500
(c) As Trustee for the benefit of Zia Malik Family Trust 3,969,000 1,984,500
(d) As Trustee for the benefit of Sabina Malik Family Trust 3,969,000 1,984,500
Note : The equity shares of the Company, during the year, have been sub-divided from existing face value of ₹ 10/- per equity share to face value of ₹ 5/- per equity share.
10.3 Shares allotted as fully paid up bonus shares
85,500 Equity Shares of the face value ₹ 5 each (March 31, 2020 - 54,900 Equity Shares of the face value ₹ 10 each) are reserved under Employee Stock Option Plan of the Company [Refer Note 33].
10.4 Rights, preference and restriction attached to equity shares:
The Company is having only one class of equity shares having par value of ₹ 5/- each (P.Y. ₹ 10/- each). Each holder of equity share is entitled to one vote per share. The Board of Director’s of Company have proposed final dividend of ₹ 1.125 per equity share of ₹ 5/- each (P.Y ₹ 3/- per equity share of ₹ 10/- each) for financial year 2020-2021 totaling to ₹ 2,987.26 Lakhs (P.Y. ₹ 3,983.01 Lakhs). The dividend proposed by the Board of Directors is subject to the approval of the shareholders in the ensuing Annual General Meeting, except in case of interim dividend.
In the event of liquidation of the Company, the holders of the equity shares will be entitled to receive remaining assets of the Company, after the distribution of all preferential amounts if any. The distribution will be in proportion to the number of equity shares held by the shareholders.
105

106
Bala
nce a
s a
t M
arc
h 3
1, 2019
77.5
3
29.0
0
0.0
0
2.8
5
55,3
77.6
4
(7
3.3
0)
55
,41
3.7
2
1,9
54
.93
5
7,3
68
.65
Impact
on a
cco
unt of adoptio
n o
f IN
D
AS
116 (
Refe
r N
ote
30)
-
-
-
-
(3,6
88.1
1)
-
(
3,6
88
.11
) (3
.35
) (
3,6
91
.46
)
Resta
ted
Bala
nce a
s a
t A
pri
l 1,2
019
77.5
3
29.0
0
-
2
.85
51,6
89.5
3
(7
3.3
0)
51
,72
5.6
1
1,9
51
.58
5
3,6
77
.19
Pro
fit for
the y
ear
-
-
-
-
15,6
72.8
2
-
1
5,6
72
.82
3
84
.68
1
6,0
57
.50
Oth
er
com
pre
hensi
ve in
com
e (
net of in
com
e tax)
-
-
-
-
-
64
.12
5
3.7
2
10
.40
6
4.1
2
To
tal co
mp
reh
en
siv
e in
co
me f
or
the y
ear
-
-
-
-
15,6
72.8
2
64
.12
1
5,7
26
.54
3
95
.08
1
6,1
21
.62
Bala
nce a
s a
t M
arc
h 3
1, 2020
77.5
3
29.0
0
0.0
0
2.8
5
67,3
62.3
4
(9
.18
) 6
7,4
52
.15
2
,34
6.6
6
69
,79
8.8
1
Pro
fit for
the y
ear
6,8
20.0
7
-
6
,82
0.0
7
(3
57
.99
) 6
,46
2.0
8
Oth
er
com
pre
hensi
ve in
com
e
(net of in
com
e tax)
-
- -
- 2
.49
18
4.6
1
18
7.1
0
(2
.49
) 1
84
.61
To
tal co
mp
reh
en
siv
e in
co
me f
or
the y
ear
-
-
-
-
6,8
22.5
6
18
4.6
1
7,0
07
.17
(
36
0.4
8)
6,6
46
.69
Inte
rim
Div
idend
-
-
-
-
(995.7
5)
-
(
99
5.7
5)
-
(
99
5.7
5)
Fin
al D
ivid
end
-
-
-
-
(3
,625.2
1)
-
(
3,6
25
.21
) -
(3,6
25
.21
)
Div
idend D
istr
ibutio
n T
ax
on F
inal D
ivid
end
-
-
-
-
(357.8
0)
-
(
35
7.8
0)
-
(
35
7.8
0)
Tra
nsf
er
from
ES
OP
outs
tandin
g r
ese
rve
to G
enera
l rese
rve
-
-
2.8
5
(2.8
5)
-
-
-
-
-
Bala
nce a
s a
t M
arc
h 3
1, 2021
77.5
3
29.0
0
2.8
5
-
69,2
06.1
4
17
5.4
3
69
,48
0.5
6
1,9
86
.18
7
1,4
66
.74
No
tes f
orm
ing
part
of
the c
on
so
lid
ate
d f
inan
cia
l sta
tem
en
ts f
or
the y
ear
en
ded
Marc
h 3
1, 2021
11.
Oth
er
Eq
uit
y
₹ i
n L
ak
hs
Secu
riti
es
pre
miu
m
Cap
ital
reserv
e
Gen
era
l
reserv
e
Em
plo
yee
sto
ck o
pti
on
s
ou
tsta
nd
ing
acco
un
t
Reta
ined
earn
ing
s
Oth
er
Co
mp
reh
en
siv
e
Inco
me
(Net
of
Taxes)
Att
rib
uta
ble
to t
he
ow
ners
of
the C
om
pan
y
No
n
Co
ntr
ollin
g
Inte
rest
To
tal
Reserv
es a
nd
Su
rplu
s
Part
icu
lars
Descri
pti
on
of
Natu
re a
nd
Pu
rpo
se o
f R
eserv
es
Secu
riti
es P
rem
ium
:
Secu
ritie
s P
rem
ium
is c
reate
d w
hen s
hare
s are
issu
ed
at
pre
miu
m .
Th
e C
om
pa
ny
can
use
th
is r
ese
rve
in a
cco
rda
nce
with
th
e p
rovi
sio
ns
of th
e A
ct.
Gen
era
l R
eserv
e:
Genera
l Rese
rves
is c
reate
d o
ut
of
pro
fits
of
the C
om
pa
ny.
Th
e r
ese
rve
is c
rea
ted
in a
cco
rda
nce
with
th
e p
rovi
sio
ns
of
the
Act
.
Em
plo
yees S
toc
k O
pti
on
s O
uts
tan
din
g A
cco
un
t:
The a
bove
rese
rve r
ela
tes
to s
tock
optio
ns
gra
nte
d b
y th
e C
om
pa
ny
to it
s e
mp
loye
es
un
de
r its
em
plo
yee
sto
ck o
ptio
n p
lan
.
Oth
er
Co
mp
reh
en
siv
e I
nco
me:
Oth
er
Com
pre
he
nsi
ve I
nco
me r
epre
sent
change in
th
e v
alu
e o
f in
vest
me
nts
acc
ou
nte
d t
hro
ug
h F
VO
CI.

Particulars
Current Non- Current Total Current Non-Current Total
Security Deposit - Franchisee 130.00 - 130.00 95.25 - 95.25
Security Deposit - Metro Shoes 0.99 - 0.99 0.99 - 0.99
Retention Money Payable (Selling Agent, Supervisors, City and Regional Managers and Others) 713.54 - 713.54 781.22 - 781.22
Payable on acquisition of Property, Plant & Equipment 600.94 - 600.94 982.00 - 982.00
Current maturities of long-term debt - - - 5.57 5.57
Unpaid Dividend - - 0.30 - 0.30
Total 1,445.47 - 1,445.47 1,865.33 - 1,865.34
Particulars
Current Non- Current Total Current Non-Current Total
Cash Credit from bank - Secured - - - 1,011.76 - 1,011.76
(Secured By Book Debts, Hypothecation of Inventories, and all other current assets both present and future of the subsidiary company. Further secured by the corporate guarantee of holding Company and the personal guarantee of Directors of the subsidiary Company)
Loans and advances from other parties 140.56 - 140.56 140.56 - 140.56
Total 140.56 - 140.56 1,152.32 - 1,152.32
As at March 31, 2021 As at March 31, 2020
₹ in Lakhs12. Borrowings
As at March 31, 2021 As at March 31, 2020
₹ in Lakhs13. Other financial liabilities
Particulars
Current Non- Current Total Current Non-Current Total
Provision for Warranty 45.31 - 45.31 45.31 - 45.31
Provision for employee benefits-
Gratuity (Refer Note 27) 38.35 63.46 101.81 202.97 55.69 258.66
Total 83.66 63.46 147.12 248.28 55.69 303.97
As at March 31, 2021 As at March 31, 2020
₹ in Lakhs14. Provisions
Note:
Provision for warranty represent the undiscounted value of the management's best estimate of the future outflow of economic benefits that will be required for settlement of claim in respect of products sold by the Group. The estimate has been made on the basis of trends anticipated by the management and may vary as a result of variation in the market conditions. It is expected that cost will be incurred over the warranty period as per the warranty terms.
Particulars
Current Non- Current Total Current Non-Current Total
i) Total Outstanding dues of Micro Enterprises and Small Enterprises (Refer Note 38) : and 220.49 - 220.49 174.17 - 174.17
ii) Total Outstanding dues of Creditors other than of Micro Enterprises and Small Enterprises 20,244.39 - 20,244.39 19,971.84 - 19,971.84
Total 20,464.88 - 20,464.88 20,146.01 - 20,146.01
As at March 31, 2021 As at March 31, 2020
₹ in Lakhs15. Trade payables
Notes forming part of the consolidated financial statements for the year ended March 31, 2021
107

Particulars As at As at March 31, 2021 March 31, 2020
a. Advances received from customers 174.78 170.26
b. Deferred revenue arising from customer loyalty program 482.13 563.13
c. Statutory dues payable 1,351.60 708.71
Total 2,008.51 1,442.10
₹ in Lakhs16. Other current liabilities
Particulars For the year ended For the year ended March 31, 2021 March 31, 2020
(a) Sale of products (Traded Goods) - Footwear, Bags and Accessories 79,901.29 128,067.72
(b) Other operating revenue
- Shoe Repair Income 32.97 46.94
- Sale of Service ( Commission & Expense Recoveries) 71.41 401.60
Total 80,005.67 128,516.26
17. Revenue from operations ₹ in Lakhs
Particulars For the year ended For the year ended March 31, 2021 March 31, 2020
Interest Income:
Income earned on financial assets carried at amortised cost:
Interest on bank deposits 136.92 6.52
Interest on other Loans and advances 25.25 24.53
Interest on Security deposit 274.87 276.21
Interest on Income Tax Refund 0.01 -
Interest on Sales tax Refund 4.03 -
Income earned on financial assets carried at FVOCI
Interest Income from Tax Free Bonds 89.70 89.95
530.78 397.21
Dividend Income:
Dividend income from Current Investments in Mutual Funds (carried at FVTPL) 52.02 462.29
Net Gain arising on Investments designated as FVTPL 1,832.11 1,287.98
Net Gain on foreign currency transactions and translation 24.42 16.74
Rent Concession on account of COVID - 19 (Refer Note 30) 5,188.39 -
Other Income:
Cash Discounts 15.09 22.08
Miscellaneous Income (Refer Note 28) 117.07 52.95
Liabilities no longer required, written back 88.26 265.46
Sales tax refund - 85.91
Total 7,848.14 2,590.62
18. Other Income ₹ in Lakhs
Particulars For the year ended For the year ended March 31, 2021 March 31, 2020
Stock-in-Trade (Footwear, Bags & Accessories) 26,061.85 56,098.92
Packing Materials 1,348.32 2,119.01
Total 27,410.17 58,217.93
19. Purchases ₹ in Lakhs
108
Notes forming part of the consolidated financial statements for the year ended March 31, 2021

Particulars For the year ended For the year ended March 31, 2021 March 31, 2020
(a) Salaries and wages 9,390.64 11,513.39
(b) Contribution to provident and other funds (Refer Note 27 ) 841.37 1,054.75
(c) Staff welfare expenses 28.20 107.55
Total 10,260.21 12,675.69
Particulars For the year ended For the year ended March 31, 2021 March 31, 2020
IInventories at the end of the year:
Stock-in-trade (28,975.47) (37,613.09)
Inventories at the beginning of the year:
Stock-in-trade 37,613.09 36,461.50
Net Decrease/(Increase) in Stock-in-trade 8,637.62 (1,151.59)
20. Changes in Inventories of Stock-In-Trade ₹ in Lakhs
21. Employee benefits expense ₹ in Lakhs
Particulars For the year ended For the year ended March 31, 2021 March 31, 2020
Interest Expenses 62.49 77.37
Interest on Lease liabilities 4,302.97 3,877.47
Total 4,365.46 3,954.84
22. Finance Cost ₹ in Lakhs
Particulars For the year ended For the year ended March 31, 2021 March 31, 2020
Power and fuel 1,468.08 2,016.85
Rent (Refer Note 30) 2,405.75 3,339.14
Rates and taxes 166.18 218.33
Insurance 119.75 107.74
Repairs and maintenance - Machinery and Equipment 71.36 79.84
Repairs and maintenance - Others 500.64 923.85
Advertisement & Sales promotion 1,607.95 4,797.63
Commission on sales 4,595.33 4,660.63
Commission on Credit Card Sales 375.05 730.90
Freight Charges 1,252.66 1,313.25
Maintenance & Other Charges - Showrooms 1,662.12 2,037.87
Shoe Repair Expenses 74.88 102.11
Communication 168.08 199.02
Donations 1.00 5.00
Travelling and conveyance 134.94 663.13
Legal and professional fees (Refer Note 23.2) 262.24 577.84
Payments to auditors (Refer Note 23.1) 9.00 43.40
Loss on Sale/ discard of Property, plant and equipment (net) 258.03 253.39
Corporate Social Responsibility (Refer Note 34) 432.87 216.77
Allowance for doubtful trade receivables, advances and deposits 76.93 -
Advances and other balances written off 70.35 101.59
Sales Tax Assesment dues 3.01 10.04
Interest on delayed payments of taxes and others 115.92 18.09
Miscellaneous Expenses 683.25 1,091.31
Total 16,545.37 23,507.72
23. Other expenses ₹ in Lakhs
109
Notes forming part of the consolidated financial statements for the year ended March 31, 2021

Particulars For the year ended For the year ended March 31, 2021 March 31, 2020
To statutory auditor
(i) For Audit 20.00 20.00
(ii) For Taxation Matters 2.50 2.50
(iii) For Consolidation 0.50 0.50
(iv) For Other Services 10.00 20.40
Total 33.00 43.40
23.1 Payments to auditors: ₹ in Lakhs
23.2 Legal & Professional of current year includes ₹ 6 Lakhs paid to the auditor of the subsidiary (previous Year ₹ 6 Lakhs)
Particulars For the year ended For the year ended March 31, 2021 March 31, 2020
Current tax:
In respect of current year 2,428.36 5,621.83
In respect of prior year (73.71) 83.54
2,354.65 5,705.37
Deferred tax:
In respect of current year origination and reversal of temporary differences (425.95) 163.51
Total 1,928.70 5,868.88
24. Current Tax and deferred tax
(a) Income tax recognised in Statement of Profit and Loss ₹ in Lakhs
(b) Income tax recognised in other comprehensive income
Particulars For the year ended For the year ended March 31, 2021 March 31, 2020
Current tax:
Remeasurement of defined benefit obligations (37.39) 1.30
Total (37.39) 1.30
Bifurcation of income tax recognised in other comprehensive income into:
-Items that will not be reclassified to profit and loss (37.39) 1.30
Total (37.39) 1.30
₹ in Lakhs
(c) Reconciliation of income tax expense and the accounting profit multiplied by Company's domestic tax rate:
Particulars For the year ended For the year ended March 31, 2021 March 31, 2020
Profit before tax 8,450.56 21,841.78
Income tax expense at 25.17% 2,127.01 5,497.58
Impact of tax rate change - 352.01
Effect of income that is exempt from taxation (535.23) (198.50)
Effect of expenses that are non-deductible in determining taxable profit 341.77 178.96
Effect of deduction 68.86 (44.71)
Tax of prior years (73.71) 83.54
Income tax expense recognised in Statement of Profit and Loss 1,928.69 5,868.88
₹ in Lakhs
110
Notes forming part of the consolidated financial statements for the year ended March 31, 2021

Particulars For the year ended For the year ended March 31, 2021 March 31, 2020
Deferred tax assets 1,666.58 1,238.90
1,666.58 1,238.90
25. Deferred tax
The following is the analysis of deferred tax assets/(liabilities) presented in the balance sheet: ₹ in Lakhs
(a) Holding Company ₹ in Lakhs
Tax effect of items constituting deferred tax assets/(liabilities)
Property, plant and equipment 21.00 83.35 104.35 (233.84) - 254.84 21.00
Allowance for doubtful trade receivables, advances and deposits 7.41 19.32 26.73 10.29 - (2.88) 7.41
Fair valuation on investments (620.95) 163.63 (457.32) (523.35) - (97.60) (620.95)
Unrealised profits on unsold inventories 135.47 (96.04) 39.43 140.78 - (5.31) 135.47
Others 15.18 (15.18) 0.00 21.07 - (5.89) 15.18
Deferred Tax on IND AS 116-Leases 1,673.94 246.18 1,920.12 - 1,979.15 (305.21) 1,673.94
Net deferred tax asset/(liabilities) 1,232.05 401.26 1,633.31 (585.05) 1,979.15 (162.05) 1,232.05
Particulars For the year ended March 31, 2021 For the year ended March 31, 2020
Opening Balance
On Ind AS
opening
Recognised in the
Statement of Profit
and Loss
ClosingBalance
Opening Balance
Recognised in the
Statement of Profit
and Loss
ClosingBalance
₹ in Lakhs
Tax effect of items constituting deferred tax assets/(liabilities)
Property, plant and equipment 4.11 8.78 12.89 5.51 - (1.40) 4.11
Deferred Tax on IND AS 116-Leases 2.75 (2.75) - - 2.81 (0.05) 2.75
Ind AS 119 and others including OCI - 20.37 20.37 - - - -
Net deferred tax asset/(liabilities) 6.86 26.40 33.26 5.51 2.81 (1.45) 6.86
Particulars For the year ended March 31, 2021 For the year ended March 31, 2020
Opening Balance
On Ind AS
opening
Recognised in the
Statement of Profit
and Loss
ClosingBalance
Opening Balance
Recognised in the
Statement of Profit
and Loss
ClosingBalance
(b) Subsidiary
111
Notes forming part of the consolidated financial statements for the year ended March 31, 2021

112
CESTAT, Mumbai
The Supreme Court of India
Deputy Commissioner Appeal, Ernakulam
Deputy Commissioner Appeal, Ernakulam
Joint Commissioner -1 Appeal, Ahmedabad
Joint Commissioner of Commercial Tax (Appeals) - Bihar
Joint Excise and Taxation Commissioner (Appeals) - Faridabad
Special Commissioner Sales Tax, Large Taxpayer Unit, Corporate Div. Circle, West Bangal
Special Commissioner Sales Tax, Large Taxpayer Unit, Corporate Div. Circle, West Bangal
Joint Commissioner of Commercial Tax, Mumbai
The Bombay High Court
The Bombay High Court
The Bombay High Court
The Bombay High Court
Commissioner of Income Tax, Appeal
CPC - Income Tax
Income Tax E- assesment Centre, Delhi
(i) Contingent Liabilities
(a) Claims not acknowledged as debts
Service Tax
(b) Other money for which the Group is contingently liable
ii) Commitments
a) Estimated amount of contracts remaining to be executed on capital account (net of advances paid) and not provided
8.87
10.59
20.05
1.61
645.84
76.43
2.71
-
7.89
-
-
-
-
-
3.01
0.46
453.20
20.50
114.18
₹ in Lakhs
Notes forming part of the consolidated financial statements for the year ended March 31, 2021
26. Contingent Liabilities and commitments (to the extent not provided for)
As at March 31, 2020
As at March 31, 2021
8.87
10.59
20.05
1.61
645.84
76.43
2.71
5.49
1.21
-
1.22
8.07
12.46
13.61
4.55
-
-
20.50
1,043.51
Apr'2006 - Mar'2014
Sept'2008 - Mar'2011
F.Y. 2012-2013
F.Y. 2011-2012
F.Y. 2013-2014
F.Y. 2013-2014
F.Y. 2015-2016
F.Y. 2017-2018
F.Y. 2017-2018
F.Y. 2013-2014
A.Y. 2009-10
A.Y. 2010-11
A.Y. 2011-12
A.Y. 2012-13
A.Y. 2011-12
A.Y. 2012-13
A.Y.2018-19 9
Future ultimate outflow of resources embodying economic benefits in respect of matters stated under Note 26(i)(a) and (b) depends on the final outcome of judgements / decisions on the matters involved.
26 Employee Benefits:
Defined - Contribution Plans
The Group offers its employees defined contribution plan in the form of provident fund. Both the employees and the Group pay pre determined contributions into the Provident Fund. The contributions are normally based on a certain proportion of the employee's salary. The Group recognised Provident Fund ₹ 530.63 Lakhs & (Previous year ₹ 639.00 Lakhs) & E.S.I.C ₹ 139.79 Lakhs & (Previous year ₹ 226.46 Lakhs) in the Statement of Profit and Loss.
Defined Benefit Plans- Gratuity
A For the Company
"The Company has an obligation towards gratuity, a funded defined benefit retirement plan covering eligible employees. The plan provides for lump sum payment to vested employees at retirement, death while in employment or on termination of the employment of an amount equivalent to 15 days salary, payable for each completed year of service or part thereof in excess of six months in terms of gratuity scheme of the Company or as per the Payment of the Gratuity Act, whichever is higher. Vesting occurs upon completion of five years of service. There is no cap on the amount of gratuity paid to an eligible employee at retirement, or death while in emplyement or on termination of the employement.
Central Excise
Sales Tax
Income Tax

a) The principal actuarial risks to which the Company is exposed are investment risk, interest rate risk, longevity risk and salary risk
Investment risk The probability or likelihood of occurrence of losses relative to the expected return on any particular investment.
Interest risk The plan exposes the Company to the risk of fall in interest rates. A fall in interest rates will result in an increase in the ultimate cost of providing the above benefit and will thus result in an increase in the value of the liability.
Longevity risk The Company has used certain mortality and attrition assumptions in the valuation of the liability. An increase in the life expectancy / longevity of plan participants will increase the plan's liability and vice versa.
Salary Risk The present value of the defined benefit plan is calculated with the assumption of salary increase rate of plan participants in future. Deviation in the rate of increase of salary in future for plan participants from the rate of increase in salary used to determine the present value of obligation will have a bearing on the plan’s liability.
113
Notes forming part of the consolidated financial statements for the year ended March 31, 2021
Gratuity Year ended Year ended March 31, 2021 March 31, 2020
I. Expense recognized in the Statement of Profit and Loss
1. Current Service Cost 173.01 180.96
2. Interest Cost on the net defined benefit liability /(asset) (net) 10.03 14.55
Total 183.04 195.51
II. Included in other comprehensive income
1. Return on plan assets, excluding amount recognised in net interest expense (109.58) 42.69
2. Actuarial losses on account of :
- change in demographic assumptions 5.47 4.25
- change in financial assumptions 21.38 (53.43)
- experience variance (72.56) 10.51
(155.29) 4.02
III. Net Asset/ (Liability) recognized in the Balance Sheet
1. Present Value of Defined Benefit Obligation 1,736.21 1,617.19
2. Fair value of plan assets 1,715.32 1,424.05
3. Net (liability) as at end of the year (20.89) (193.14)
IV. Change in the obligation during the year
1. Present Value of Defined Benefit Obligation at the beginning of the year 1,617.19 1,534.83
2. Expenses recognised in profit and loss Account
- Current Service Cost 173.01 180.96
- Interest Cost 84.03 115.36
3. Remeasurement gains/(losses)
- change in demographic assumptions 5.47 4.25
- change in financial assumptions 21.38 (53.43)
- experience variance (i.e. Actual experience vs assumptions) (72.56) 10.51
4. Benefit Payments (92.31) (175.29)
5. Present Value of Defined Benefit Obligation at the end of the year 1,736.21 1,617.19
V. Change in Fair Value of Assets during the year
1. Plan assets at the beginning of the year 1,424.05 1,341.22
2. Investment Income 74.00 100.81
3 Recognised in other comprehensive income
Remeasurement gains /(losses)
- Actual return on plan assets in excess of the expected Return 109.58 (42.69)
4. Contribution by employer 200.00 200.00
5. Benefits paid (92.31) (175.29)
6. Fair value of Plan assets at the end of the year 1,715.32 1,424.05
₹ in Lakhsb) Details of Defined Benefit Plan of the Company (As per Actuarial Valuation)
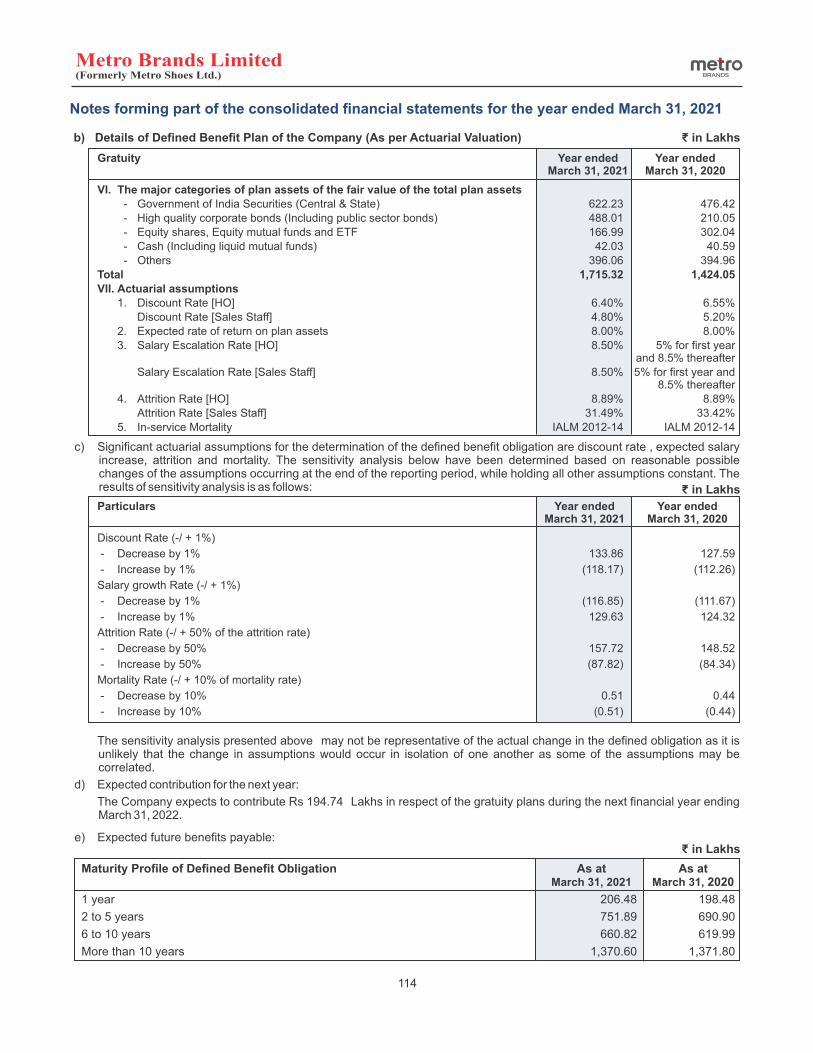
Gratuity Year ended Year ended March 31, 2021 March 31, 2020
VI. The major categories of plan assets of the fair value of the total plan assets
- Government of India Securities (Central & State) 622.23 476.42
- High quality corporate bonds (Including public sector bonds) 488.01 210.05
- Equity shares, Equity mutual funds and ETF 166.99 302.04
- Cash (Including liquid mutual funds) 42.03 40.59
- Others 396.06 394.96
Total 1,715.32 1,424.05
VII. Actuarial assumptions
1. Discount Rate [HO] 6.40% 6.55%
Discount Rate [Sales Staff] 4.80% 5.20%
2. Expected rate of return on plan assets 8.00% 8.00%
3. Salary Escalation Rate [HO] 8.50% 5% for first year and 8.5% thereafter
Salary Escalation Rate [Sales Staff] 8.50% 5% for first year and 8.5% thereafter
4. Attrition Rate [HO] 8.89% 8.89%
Attrition Rate [Sales Staff] 31.49% 33.42%
5. In-service Mortality IALM 2012-14 IALM 2012-14
c) Significant actuarial assumptions for the determination of the defined benefit obligation are discount rate , expected salary increase, attrition and mortality. The sensitivity analysis below have been determined based on reasonable possible changes of the assumptions occurring at the end of the reporting period, while holding all other assumptions constant. The results of sensitivity analysis is as follows:
Particulars Year ended Year ended March 31, 2021 March 31, 2020
Discount Rate (-/ + 1%)
- Decrease by 1% 133.86 127.59
- Increase by 1% (118.17) (112.26)
Salary growth Rate (-/ + 1%)
- Decrease by 1% (116.85) (111.67)
- Increase by 1% 129.63 124.32
Attrition Rate (-/ + 50% of the attrition rate)
- Decrease by 50% 157.72 148.52
- Increase by 50% (87.82) (84.34)
Mortality Rate (-/ + 10% of mortality rate)
- Decrease by 10% 0.51 0.44
- Increase by 10% (0.51) (0.44)
The sensitivity analysis presented above may not be representative of the actual change in the defined obligation as it is unlikely that the change in assumptions would occur in isolation of one another as some of the assumptions may be correlated.
d) Expected contribution for the next year:
The Company expects to contribute Rs 194.74 Lakhs in respect of the gratuity plans during the next financial year ending March 31, 2022.
₹ in Lakhsb) Details of Defined Benefit Plan of the Company (As per Actuarial Valuation)
e) Expected future benefits payable: ₹ in Lakhs
Maturity Profile of Defined Benefit Obligation As at As at March 31, 2021 March 31, 2020
1 year 206.48 198.48
2 to 5 years 751.89 690.90
6 to 10 years 660.82 619.99
More than 10 years 1,370.60 1,371.80
114
₹ in Lakhs
Notes forming part of the consolidated financial statements for the year ended March 31, 2021
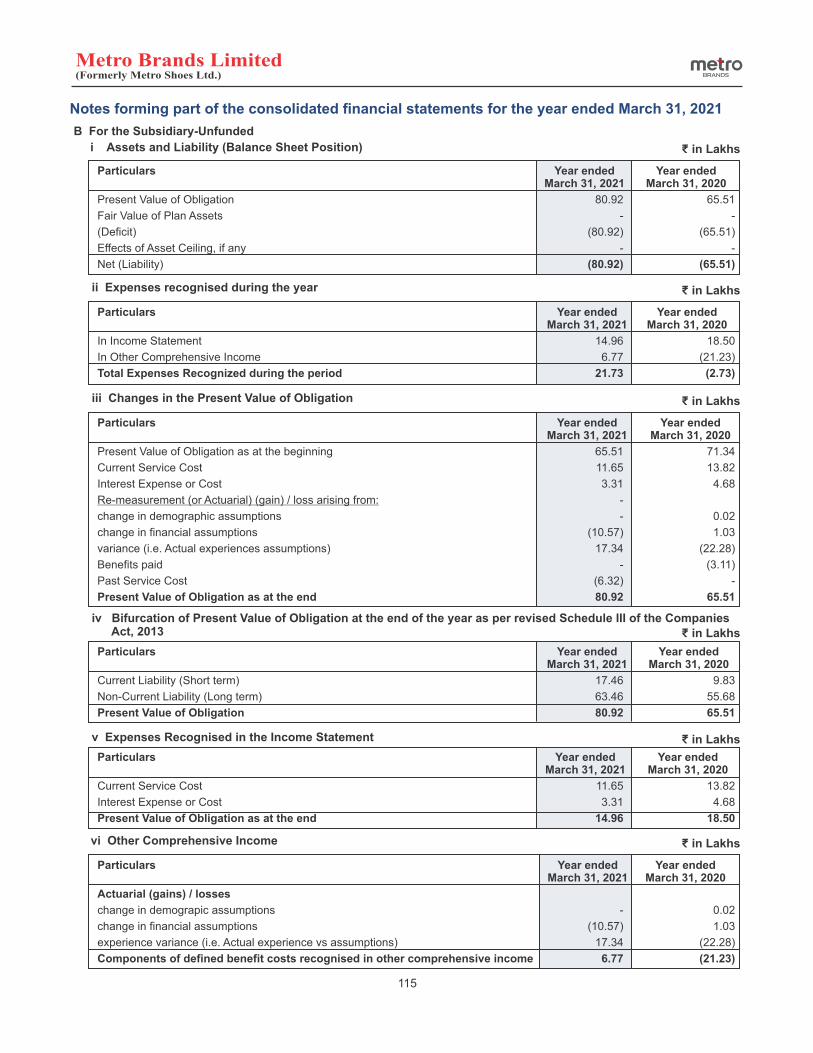
Particulars Year ended Year ended March 31, 2021 March 31, 2020
Present Value of Obligation 80.92 65.51
Fair Value of Plan Assets - -
(Deficit) (80.92) (65.51)
Effects of Asset Ceiling, if any - -
Net (Liability) (80.92) (65.51)
₹ in Lakhs
B For the Subsidiary-Unfunded
i Assets and Liability (Balance Sheet Position)
Particulars Year ended Year ended March 31, 2021 March 31, 2020
In Income Statement 14.96 18.50
In Other Comprehensive Income 6.77 (21.23)
Total Expenses Recognized during the period 21.73 (2.73)
₹ in Lakhsii Expenses recognised during the year
Particulars Year ended Year ended March 31, 2021 March 31, 2020
Present Value of Obligation as at the beginning 65.51 71.34
Current Service Cost 11.65 13.82
Interest Expense or Cost 3.31 4.68
Re-measurement (or Actuarial) (gain) / loss arising from: -
change in demographic assumptions - 0.02
change in financial assumptions (10.57) 1.03
variance (i.e. Actual experiences assumptions) 17.34 (22.28)
Benefits paid - (3.11)
Past Service Cost (6.32) -
Present Value of Obligation as at the end 80.92 65.51
₹ in Lakhsiii Changes in the Present Value of Obligation
Particulars Year ended Year ended March 31, 2021 March 31, 2020
Current Liability (Short term) 17.46 9.83
Non-Current Liability (Long term) 63.46 55.68
Present Value of Obligation 80.92 65.51
₹ in Lakhs
iv Bifurcation of Present Value of Obligation at the end of the year as per revised Schedule III of the Companies Act, 2013
Particulars Year ended Year ended March 31, 2021 March 31, 2020
Current Service Cost 11.65 13.82
Interest Expense or Cost 3.31 4.68
Present Value of Obligation as at the end 14.96 18.50
₹ in Lakhsv Expenses Recognised in the Income Statement
115
Notes forming part of the consolidated financial statements for the year ended March 31, 2021
Particulars Year ended Year ended March 31, 2021 March 31, 2020
Actuarial (gains) / losses
change in demograpic assumptions - 0.02
change in financial assumptions (10.57) 1.03
experience variance (i.e. Actual experience vs assumptions) 17.34 (22.28)
Components of defined benefit costs recognised in other comprehensive income 6.77 (21.23)
₹ in Lakhsvi Other Comprehensive Income

Particulars Year ended Year ended March 31, 2021 March 31, 2020
Discount rate (per annum)
Salary growth rate (per annum)
The discount rate indicated above reflects the estimated timing and currency of benefit payments. It is based on the yields / rates available on applicable bonds as on the current valuation date.
viii The principal demographic assumptions used in the valuation are shown in the table below:
₹ in Lakhs
vii The principal financial assumptions used in the valuation are shown in the table below:
For H.O. - 6.40% p.a. and For Sales Staff
- 4.35% p.a.
For H.O. - 6.35% p.a. and
For Sales Staff - 5.05% p.a.
For H.O. 0% p.a for first year and
thereafter8.5% p.a. and For Sales Staff 0% p.a. for first
year and thereafter 5% p.a
For H.O. 0% p.a for first year and
thereafter 10% p.a. and for sales staff
0% p.a. for first year and
thereafter 5% p.a
Particulars Year ended Year ended March 31, 2021 March 31, 2020
Mortality rate (% of IALM 06-08) 100% 100%
Normal retirement age 60 Years 60 Years
Attrition / Withdrawal rates, based on Category: (per annum)
H.O. years 8.82% 8.82%
Sales Staff years 43.04% 43.04%
Attrition rate indicated above represents the Company's best estimate of employee turnover in future (other than on account of retirement, death or disablement) determined considering various factors such as nature of business, retention policy, industry factors, past experience, etc.
ix Sensitivity Analysis
Significant Actuarial Assumptions for the determination of the defined benefit obligation are discount trade, expected salary increase and employee turnover. The sensitivity analysis below, have been determined based on reasonably possible changes of the assumptions occurring at end of the reporting period , while holding all other assumptions constant. The result of Sensitivity analysis is given below:
Particulars Year ended Year ended March 31, 2021 March 31, 2020
Defined Benefit Obligation (Base) 80.92 65.51
116
Notes forming part of the consolidated financial statements for the year ended March 31, 2021
Particulars Year ended Year ended March 31, 2021 March 31, 2020
Discount Rate (- / + 1%)
-Decrease by 1 % 5.50 5.90
-Increase by 1 % (4.86) (5.04)
Salary Growth Rate (- / + 1%)
-Decrease by 1 % (3.96) (4.59)
-Increase by 1 % 4.21 5.11
Attrition Rate (- / + 50% of attrition rates)
-Decrease by 1 % 5.02 10.55
-Increase by 1 % (3.32) (6.09)
Mortality Rate (- / + 10% of mortality rates)
-Decrease by 1 % 0.01 0.01
-Increase by 1 % (0.01) (0.01)
₹ in Lakhs
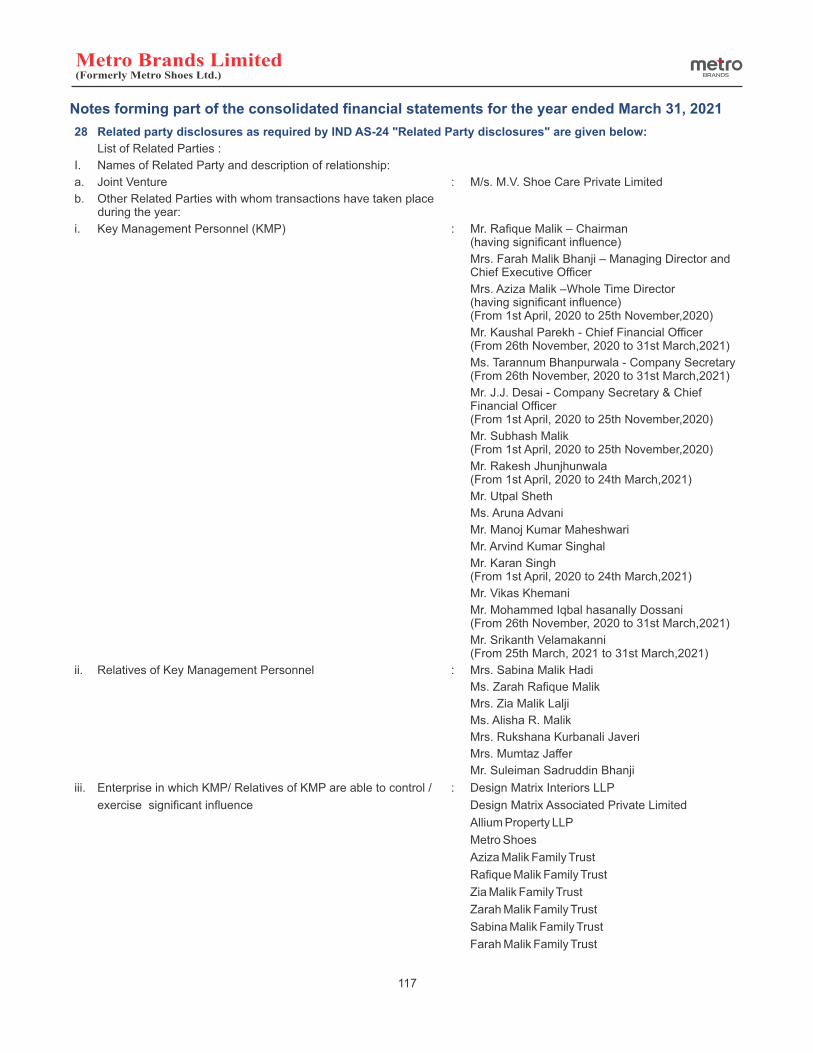
117
Notes forming part of the consolidated financial statements for the year ended March 31, 2021
28 Related party disclosures as required by IND AS-24 "Related Party disclosures" are given below:
List of Related Parties :
I. Names of Related Party and description of relationship:
a. Joint Venture : M/s. M.V. Shoe Care Private Limited
b. Other Related Parties with whom transactions have taken place during the year:
i. Key Management Personnel (KMP) : Mr. Rafique Malik – Chairman (having significant influence)
Mrs. Farah Malik Bhanji – Managing Director and Chief Executive Officer
Mrs. Aziza Malik –Whole Time Director (having significant influence) (From 1st April, 2020 to 25th November,2020)
Mr. Kaushal Parekh - Chief Financial Officer (From 26th November, 2020 to 31st March,2021)
Ms. Tarannum Bhanpurwala - Company Secretary (From 26th November, 2020 to 31st March,2021)
Mr. J.J. Desai - Company Secretary & Chief Financial Officer (From 1st April, 2020 to 25th November,2020)
Mr. Subhash Malik (From 1st April, 2020 to 25th November,2020)
Mr. Rakesh Jhunjhunwala (From 1st April, 2020 to 24th March,2021)
Mr. Utpal Sheth
Ms. Aruna Advani
Mr. Manoj Kumar Maheshwari
Mr. Arvind Kumar Singhal
Mr. Karan Singh (From 1st April, 2020 to 24th March,2021)
Mr. Vikas Khemani
Mr. Mohammed Iqbal hasanally Dossani (From 26th November, 2020 to 31st March,2021)
Mr. Srikanth Velamakanni (From 25th March, 2021 to 31st March,2021)
ii. Relatives of Key Management Personnel : Mrs. Sabina Malik Hadi
Ms. Zarah Rafique Malik
Mrs. Zia Malik Lalji
Ms. Alisha R. Malik
Mrs. Rukshana Kurbanali Javeri
Mrs. Mumtaz Jaffer
Mr. Suleiman Sadruddin Bhanji
iii. Enterprise in which KMP/ Relatives of KMP are able to control / : Design Matrix Interiors LLP
exercise significant influence Design Matrix Associated Private Limited
Allium Property LLP
Metro Shoes
Aziza Malik Family Trust
Rafique Malik Family Trust
Zia Malik Family Trust
Zarah Malik Family Trust
Sabina Malik Family Trust
Farah Malik Family Trust

Year Subsidiaries Enterprise in which KMP/ Relatives of KMP are able to
control / exercisesignificant influence
KeyManagement
Personnel
Relatives of Key
ManagementPersonnel
₹ in Lakhs
JointVentures
118
Notes forming part of the consolidated financial statements for the year ended March 31, 2021
II. Related Party Transactions during the year:
Particulars
Compensation in respect of concession agreements for showrooms - Rent
Rafique Malik 2020-21 - - - 53.52 -
2019-20 - - - 82.48 -
Aziza Malik 2020-21 - - - 115.57 -
2019-20 - - - 206.53 -
Commission in respect of retail agency agreements for showroom
Metro Shoes 2020-21 77.55 - - -
2019-20 199.92 - -
Compensation received in respect of rent for office
Metro Shoes 2020-21 - 3.96 - - -
2019-20 - 4.62 - - -
Remuneration #
Rafique Malik 2020-21 - - - 673.40 -
2019-20 - - - 605.49 -
Farah Malik Bhanji 2020-21 - - - 280.64 -
2019-20 - - - 256.25 -
Aziza Malik 2020-21 - - - 93.94 -
2019-20 - - - 184.38 -
Aziza Malik 2020-21 - - - - 105.99
2019-20 - - - - -
J.J. Desai 2020-21 - - - 71.52 -
2019-20 - - - 259.65 -
Subhash Malik 2020-21 - - - 15.07 -
2019-20 - - - 27.06 -
Kaushal Parekh 2020-21 - - - 57.57 -
2019-20 - - - - -
Mohammed Iqbal 2020-21 - - - 11.68 -
hasanally Dossani 2019-20 - - - - -
Tarannum Bhanpurwala 2020-21 - - - 2.39 -
2019-20 - - - - -
Alisha R. Malik 2020-21 - - - - 46.99
2019-20 - - - - 44.76
Directors' Sitting Fees
Ms. Aruna Advani 2020-21 - - - 2.60 -
2019-20 - - - 2.60 -
Mr. Manoj Kumar Maheshwari 2020-21 - - - 2.60 -
2019-20 - - - 2.10 -
Mr. Arvind Kumar Singhal 2020-21 - - - 1.80 -
2019-20 - - - 1.50 -
Mr. Karan Singh 2020-21 - - - 0.90 -
2019-20 - - - 1.20 -
Mr. Srikanth Velamakanni 2020-21 - - - 0.30 -
2019-20 - - - - -
Mr. Vikas Khemani 2020-21 - - 0.30 -
2019-20 - - - -

II. Related Party Transactions during the year:
Particulars
Retainership Fees
Mumtaz Jaffer 2020-21 - - - - 24.80
2019-20 - - - - 35.40
Interim Dividend
Rafique Malik 2020-21 - - - 10.13 -
2019-20 - - - - -
Farah Malik Bhanji 2020-21 - - - 29.77 -
2019-20 - - - - -
Aziza Malik 2020-21 - - - 5.06 -
2019-20 - - - - -
J.J. Desai 2020-21 - - - 0.85 -
2019-20 - - - - -
Subhash Malik 2020-21 - - - 0.24 -
2019-20 - - - - -
Alisha R. Malik 2020-21 - - - - 44.65
2019-20 - - - - -
Sabina Malik Hadi 2020-21 - - - - 29.77
2019-20 - - - - -
Zarah Rafique Malik 2020-21 - - - - 29.76
2019-20 - - - - -
Zia Malik Lalji 2020-21 - - - - 29.77
2019-20 - - - - -
Rukshana Kurbanali Javeri 2020-21 - - - - 0.91
2019-20 - - - - -
Mumtaz Jaffer 2020-21 - - - - 0.09
2019-20 - - - - -
Kaushal Parekh 2020-21 - - - 0.30 -
2019-20 - - - - -
Aziza Malik Family Trust 2020-21 - 300.69 - - -
2019-20 - - - - -
Rafique Malik Family Trust 2020-21 - 296.35 - - -
2019-20 - - - - -
Zia Malik Family Trust 2020-21 - 14.88 - - -
2019-20 - - - - -
Zarah Malik Family Trust 2020-21 - 14.88 - - -
2019-20 - - - - -
Sabina Malik Family Trust 2020-21 - 14.88 - - -
2019-20 - - - - -
Farah Malik Family Trust 2020-21 - 14.88 - - -
2019-20 - - - - -
Suleiman Sadruddin Bhanji 2020-21 - - - - 0.09
2019-20 - - - - -
Year Subsidiaries Enterprise in which KMP/ Relatives of KMP are able to
control / exercisesignificant influence
KeyManagement
Personnel
Relatives of Key
ManagementPersonnel
₹ in Lakhs
JointVentures
119
Notes forming part of the consolidated financial statements for the year ended March 31, 2021

II. Related Party Transactions during the year:
Particulars
Final Dividend
Rafique Malik 2020-21 - - - 37.46 -
2019-20 - - - - -
Farah Malik Bhanji 2020-21 - - - 110.14 -
2019-20 - - - - -
Aziza Malik 2020-21 - - - 18.73 -
2019-20 - - - - -
J.J. Desai 2020-21 - - - 3.15 -
2019-20 - - - - -
Subhash Malik 2020-21 - - - 0.09 -
2019-20 - - - - -
Kaushal Parekh 2020-21 - - - 1.12 -
2019-20 - - - - -
Alisha R. Malik 2020-21 - - - - 165.21
2019-20 - - - - -
Sabina Malik Hadi 2020-21 - - - - 90.59
2019-20 - - - - -
Zarah Rafique Malik 2020-21 - - - - 90.59
2019-20 - - - - -
Zia Malik Lalji 2020-21 - - - - 90.59
2019-20 - - - - -
Rukshana Kurbanali Javeri 2020-21 - - - - 2.89
2019-20 - - - - -
Mumtaz Jaffer 2020-21 - - - - 0.34
2019-20 - - - - -
Aziza Malik Family Trust 2020-21 - 1,112.56 - - -
2019-20 - - - - -
Rafique Malik Family Trust 2020-21 - 1,096.51 - - -
2019-20 - - - - -
Zia Malik Family Trust 2020-21 - 55.07 - - -
2019-20 - - - - -
Zarah Malik Family Trust 2020-21 - 55.07 - - -
2019-20 - - - - -
Sabina Malik Family Trust 2020-21 - 55.07 - - -
2019-20 - - - - -
Farah Malik Family Trust 2020-21 - 55.07 - - -
2019-20 - - - - -
Suleiman Sadruddin Bhanji 2020-21 - - - - 0.34
2019-20 - - - - -
Professional Fees (capital cost)
Design Matrix Interiors LLP 2020-21 - 124.28 - - -
2019-20 - 302.24 - - -
Year Subsidiaries Enterprise in which KMP/ Relatives of KMP are able to
control / exercisesignificant influence
KeyManagement
Personnel
Relatives of Key
ManagementPersonnel
₹ in Lakhs
JointVentures
120
Notes forming part of the consolidated financial statements for the year ended March 31, 2021

IV. Outstanding payables
Particulars As at As at March 31, 2021 March 31, 2020
Key Management Personnel
Compensation in respect of concession agreements for showrooms
Rafique Malik (5.60) (4.29)
Aziza Malik (12.45) (10.40)
Remuneration #
Rafique Malik (63.63) -
Farah Malik Bhanji (30.91) -
Aziza Malik (24.74) -
Kaushal Parekh (13.56) -
Mohammed Iqbal hasanally Dossani (3.89) -
Tarannum Bhanpurwala (0.70) -
ESOP outstanding
Subhash Malik - (1.46)
Relatives of Key Management Personnel
Remuneration #
Alisha Malik (6.83) -
Retainership Fees
Mumtaz Jaffer - (2.83)
Enterprise in which KMP/ Relatives of KMP are able to control / exercise significant influence
Commission in respect of retail agency agreements for showroom
Metro Shoes (14.64) (15.81)
Security Deposit for Compensation in respect of rent for office
Metro Shoes (0.99) (0.99)
Professional Fees (capital cost)
Design Matrix Interiors LLP (21.60) (28.76)
Joint Venture
Purchases of Stock-in-trade (653.33) (643.83)
II. Related Party Transactions during the year:
Particulars
Professional Fees
Design Matrix Associated 2020-21 - 25.00 - - -
Private Limited 2019-20 - - - - -
Purchases of Stock-in-Trade
M.V. Shoe Care Private Limited 2020-21 - - 622.19 - -
2019-20 - - 1,453.60 - -
Year Subsidiaries Enterprise in which KMP/ Relatives of KMP are able to
control / exercisesignificant influence
KeyManagement
Personnel
Relatives of Key
ManagementPersonnel
₹ in Lakhs
JointVentures
III. Outstanding receivables ₹ in Lakhs
Particulars As at As at March 31, 2021 March 31, 2020
Enterprises in which KMP / Relatives of KMP are able to exercise significant influence (Metro Shoes)
Security Deposit 0.36 0.36
₹ in Lakhs
121
Notes forming part of the consolidated financial statements for the year ended March 31, 2021

# excludes provision for gratuity which is determined on the basis of actuarial valuation done on overall basis for the Company
Note: No amount has been written off/ provided for or written back in respect of amounts receivable from or payable to the related parties.
29 The Group's only business being trading of fashion footwear, bags and accessories operating in the premium and economy category and manufacturing of shoe care and foot care products, the disclosure of segment-wise information is not applicable under Ind AS 108- 'Operating Segments'. Further, there is no geographical segment to be reported since all the operations are undertaken in India.
30 Leases
Right of use Assets
122
Notes forming part of the consolidated financial statements for the year ended March 31, 2021
Particulars As at As at March 31, 2021 March 31, 2020
Balance at the beginning of the year 48,249.45 37,658.83
Additions during the year 13,117.02 20,496.63
Deletions during the year (2,152.56) (1,084.55)
Amortisation during the year (9,253.72) (8,821.46)
Balance at the end of the year 49,960.19 48,249.45
₹ in Lakhs
Lease Liabilities ₹ in Lakhs
Particulars As at As at March 31, 2021 March 31, 2020
Balance at the beginning of the year 53,756.92 42,051.85
Additions during the year 12,913.18 20,302.58
Deletions during the year (2,580.50) (1,236.47)
Interest during the year 4,302.97 3,877.47
Lease payment during the year (6,654.59) -
Reduction in lease liability - Practical Expedient application (5,188.39) -
Balance at the end of the year 56,549.59 53,756.92
Particulars As at As at March 31, 2021 March 31, 2020
Less than 1 year 11,814.08 12,018.94
1 - 5 Year 38,879.08 37,270.68
More than 5 years 26,673.68 24,453.22
Total undiscounted lease liabilities at the end of th year 77,366.84 73,742.84
Particulars As at As at March 31, 2021 March 31, 2020
Interest expense on lease liabilities 4,302.97 3,877.47
Amortisation of ROU 9,253.72 8,821.45
Expenses relating to short term leases/Variable lease payments 2,416.69 3,339.14
Impairment Loss booked during the current year 102.93 -
Derecognition of Lease Liability during the current year (113.87) -
Total 15,962.44 16,038.06
Maturity analysis - contractual undiscounted cash flow
Lease Liabilities included in Financial statement as at the end of the year 56,549.59 53,756.92
Current 7,684.98 7,953.80
Non- Current 48,864.61 45,803.12
Amounts Recognised in Statement of P & L
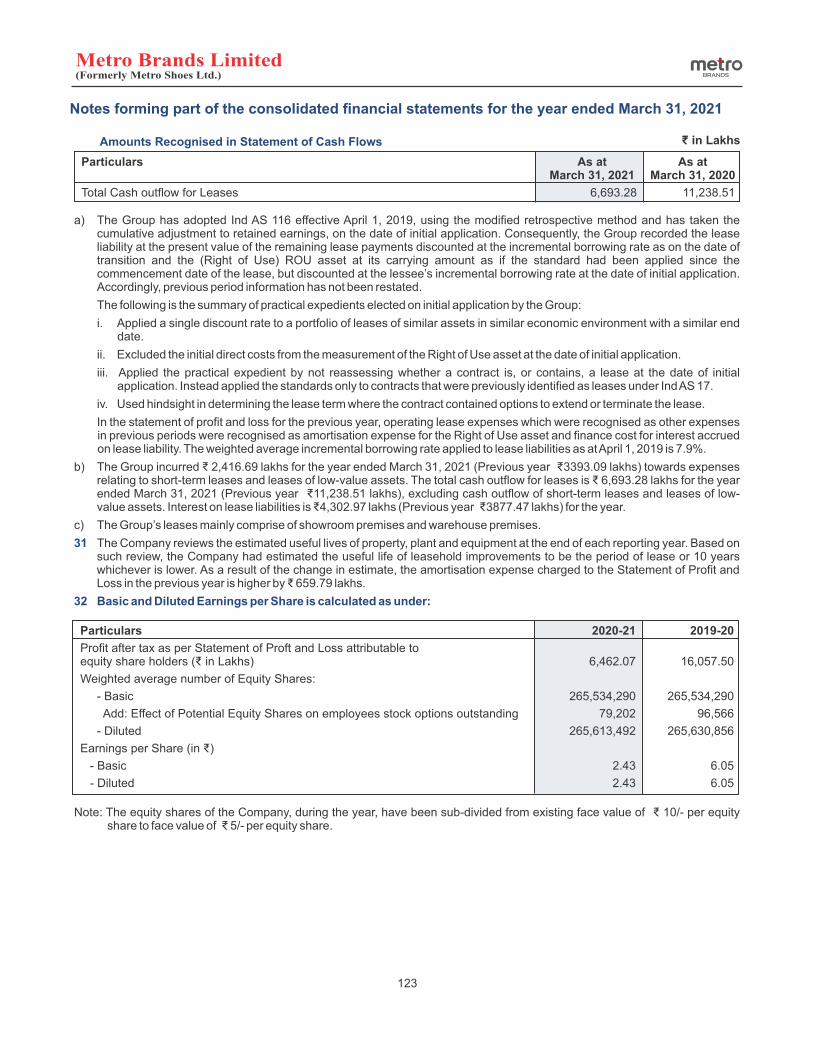
Particulars 2020-21 2019-20
Profit after tax as per Statement of Proft and Loss attributable to equity share holders (₹ in Lakhs) 6,462.07 16,057.50
Weighted average number of Equity Shares:
- Basic 265,534,290 265,534,290
Add: Effect of Potential Equity Shares on employees stock options outstanding 79,202 96,566
- Diluted 265,613,492 265,630,856
Earnings per Share (in ₹)
- Basic 2.43 6.05
- Diluted 2.43 6.05
Amounts Recognised in Statement of Cash Flows
Particulars As at As at March 31, 2021 March 31, 2020
Total Cash outflow for Leases 6,693.28 11,238.51
₹ in Lakhs
a) The Group has adopted Ind AS 116 effective April 1, 2019, using the modified retrospective method and has taken the cumulative adjustment to retained earnings, on the date of initial application. Consequently, the Group recorded the lease liability at the present value of the remaining lease payments discounted at the incremental borrowing rate as on the date of transition and the (Right of Use) ROU asset at its carrying amount as if the standard had been applied since the commencement date of the lease, but discounted at the lessee’s incremental borrowing rate at the date of initial application. Accordingly, previous period information has not been restated.
The following is the summary of practical expedients elected on initial application by the Group:
i. Applied a single discount rate to a portfolio of leases of similar assets in similar economic environment with a similar end date.
ii. Excluded the initial direct costs from the measurement of the Right of Use asset at the date of initial application.
iii. Applied the practical expedient by not reassessing whether a contract is, or contains, a lease at the date of initial application. Instead applied the standards only to contracts that were previously identified as leases under Ind AS 17.
iv. Used hindsight in determining the lease term where the contract contained options to extend or terminate the lease.
In the statement of profit and loss for the previous year, operating lease expenses which were recognised as other expenses in previous periods were recognised as amortisation expense for the Right of Use asset and finance cost for interest accrued on lease liability. The weighted average incremental borrowing rate applied to lease liabilities as at April 1, 2019 is 7.9%.
b) The Group incurred ₹ 2,416.69 lakhs for the year ended March 31, 2021 (Previous year ₹3393.09 lakhs) towards expenses relating to short-term leases and leases of low-value assets. The total cash outflow for leases is ₹ 6,693.28 lakhs for the year ended March 31, 2021 (Previous year ₹11,238.51 lakhs), excluding cash outflow of short-term leases and leases of low-value assets. Interest on lease liabilities is ₹4,302.97 lakhs (Previous year ₹3877.47 lakhs) for the year.
c) The Group’s leases mainly comprise of showroom premises and warehouse premises.
31 The Company reviews the estimated useful lives of property, plant and equipment at the end of each reporting year. Based on such review, the Company had estimated the useful life of leasehold improvements to be the period of lease or 10 years whichever is lower. As a result of the change in estimate, the amortisation expense charged to the Statement of Profit and Loss in the previous year is higher by ₹ 659.79 lakhs.
32 Basic and Diluted Earnings per Share is calculated as under:
123
Notes forming part of the consolidated financial statements for the year ended March 31, 2021
Note: The equity shares of the Company, during the year, have been sub-divided from existing face value of ₹ 10/- per equity share to face value of ₹ 5/- per equity share.
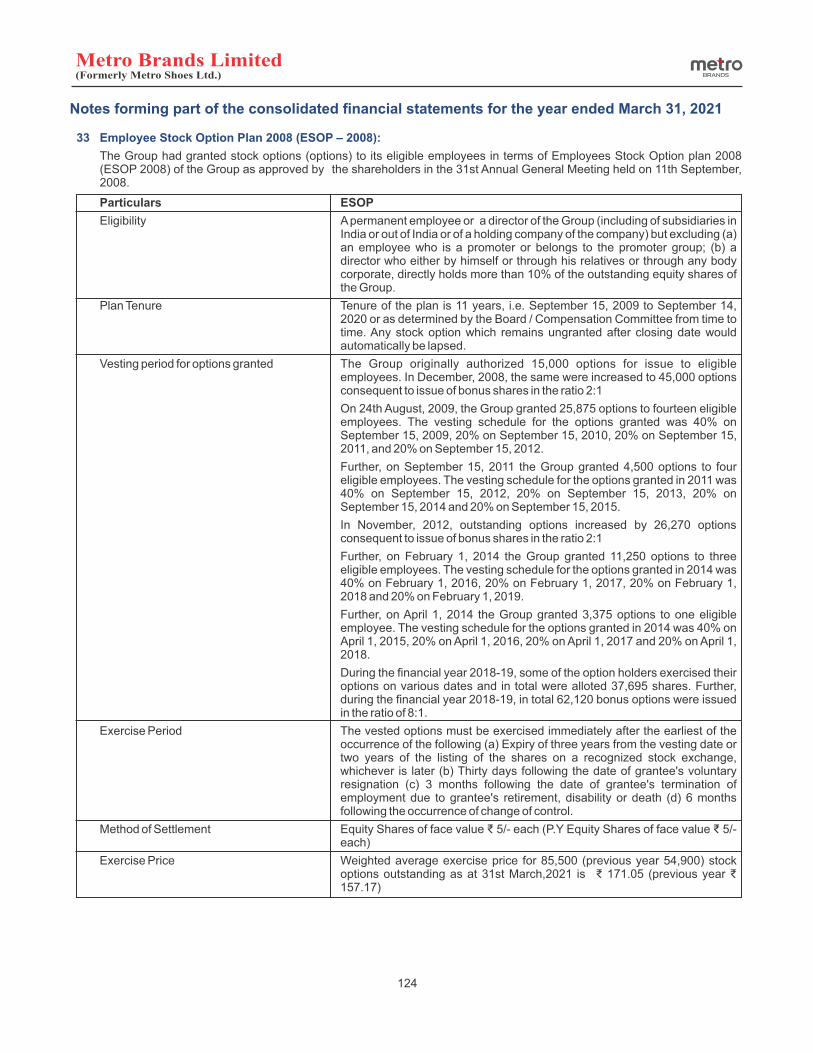
33 Employee Stock Option Plan 2008 (ESOP – 2008):
The Group had granted stock options (options) to its eligible employees in terms of Employees Stock Option plan 2008 (ESOP 2008) of the Group as approved by the shareholders in the 31st Annual General Meeting held on 11th September, 2008.
Particulars ESOP
Eligibility A permanent employee or a director of the Group (including of subsidiaries in India or out of India or of a holding company of the company) but excluding (a) an employee who is a promoter or belongs to the promoter group; (b) a director who either by himself or through his relatives or through any body corporate, directly holds more than 10% of the outstanding equity shares of the Group.
Plan Tenure Tenure of the plan is 11 years, i.e. September 15, 2009 to September 14, 2020 or as determined by the Board / Compensation Committee from time to time. Any stock option which remains ungranted after closing date would automatically be lapsed.
Vesting period for options granted The Group originally authorized 15,000 options for issue to eligible employees. In December, 2008, the same were increased to 45,000 options consequent to issue of bonus shares in the ratio 2:1
On 24th August, 2009, the Group granted 25,875 options to fourteen eligible employees. The vesting schedule for the options granted was 40% on September 15, 2009, 20% on September 15, 2010, 20% on September 15, 2011, and 20% on September 15, 2012.
Further, on September 15, 2011 the Group granted 4,500 options to four eligible employees. The vesting schedule for the options granted in 2011 was 40% on September 15, 2012, 20% on September 15, 2013, 20% on September 15, 2014 and 20% on September 15, 2015.
In November, 2012, outstanding options increased by 26,270 options consequent to issue of bonus shares in the ratio 2:1
Further, on February 1, 2014 the Group granted 11,250 options to three eligible employees. The vesting schedule for the options granted in 2014 was 40% on February 1, 2016, 20% on February 1, 2017, 20% on February 1, 2018 and 20% on February 1, 2019.
Further, on April 1, 2014 the Group granted 3,375 options to one eligible employee. The vesting schedule for the options granted in 2014 was 40% on April 1, 2015, 20% on April 1, 2016, 20% on April 1, 2017 and 20% on April 1, 2018.
During the financial year 2018-19, some of the option holders exercised their options on various dates and in total were alloted 37,695 shares. Further, during the financial year 2018-19, in total 62,120 bonus options were issued in the ratio of 8:1.
Exercise Period The vested options must be exercised immediately after the earliest of the occurrence of the following (a) Expiry of three years from the vesting date or two years of the listing of the shares on a recognized stock exchange, whichever is later (b) Thirty days following the date of grantee's voluntary resignation (c) 3 months following the date of grantee's termination of employment due to grantee's retirement, disability or death (d) 6 months following the occurrence of change of control.
Method of Settlement E quity Shares of face value ₹ 5/- each (P.Y Equity Shares of face value ₹ 5/- each)
Exercise Price W eighted average exercise price for 85,500 (previous year 54,900) stock options outstanding as at 31st March,2021 is ₹ 171.05 (previous year ₹ 157.17)
124
Notes forming part of the consolidated financial statements for the year ended March 31, 2021
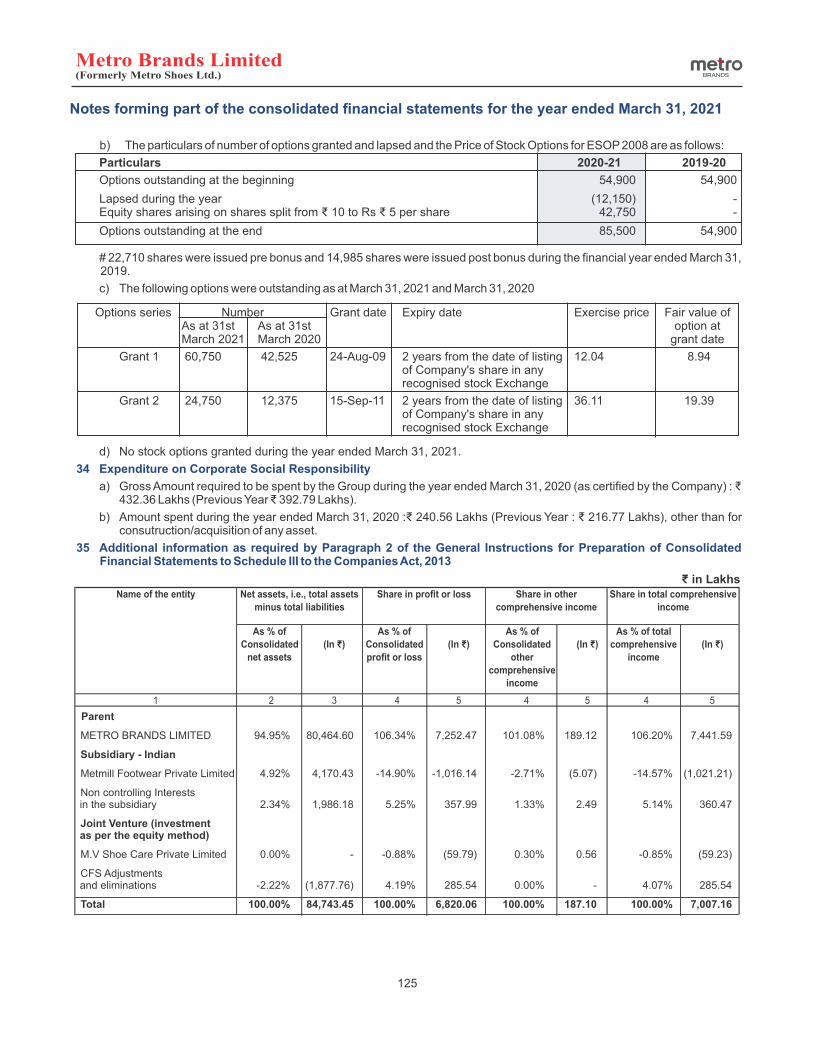
b) The particulars of number of options granted and lapsed and the Price of Stock Options for ESOP 2008 are as follows:
Particulars 2020-21 2019-20
Options outstanding at the beginning 54,900 54,900
Lapsed during the year (12,150) - Equity shares arising on shares split from ₹ 10 to Rs ₹ 5 per share 42,750 -
Options outstanding at the end 85,500 54,900
# 22,710 shares were issued pre bonus and 14,985 shares were issued post bonus during the financial year ended March 31,
2019.
c) The following options were outstanding as at March 31, 2021 and March 31, 2020
Options series Number Grant date Expiry date Exercise price Fair value of As at 31st As at 31st option at
March 2021 March 2020 grant date
Grant 1 60,750 42,525 24-Aug-09 2 years from the date of listing 12.04 8.94 of Company's share in any recognised stock Exchange
Grant 2 24,750 12,375 15-Sep-11 2 years from the date of listing 36.11 19.39 of Company's share in any recognised stock Exchange
d) No stock options granted during the year ended March 31, 2021.
34 Expenditure on Corporate Social Responsibility
a) Gross Amount required to be spent by the Group during the year ended March 31, 2020 (as certified by the Company) : ₹ 432.36 Lakhs (Previous Year ₹ 392.79 Lakhs).
b) Amount spent during the year ended March 31, 2020 :₹ 240.56 Lakhs (Previous Year : ₹ 216.77 Lakhs), other than for consutruction/acquisition of any asset.
35 Additional information as required by Paragraph 2 of the General Instructions for Preparation of Consolidated Financial Statements to Schedule III to the Companies Act, 2013
Parent
METRO BRANDS LIMITED 94.95% 80,464.60 106.34% 7,252.47 101.08% 189.12 106.20% 7,441.59
Subsidiary - Indian
Metmill Footwear Private Limited 4.92% 4,170.43 -14.90% -1,016.14 -2.71% (5.07) -14.57% (1,021.21)
Non controlling Interests in the subsidiary 2.34% 1,986.18 5.25% 357.99 1.33% 2.49 5.14% 360.47
Joint Venture (investment as per the equity method)
M.V Shoe Care Private Limited 0.00% - -0.88% (59.79) 0.30% 0.56 -0.85% (59.23)
CFS Adjustments and eliminations -2.22% (1,877.76) 4.19% 285.54 0.00% - 4.07% 285.54
Total 100.00% 84,743.45 100.00% 6,820.06 100.00% 187.10 100.00% 7,007.16
125
₹ in Lakhs
Notes forming part of the consolidated financial statements for the year ended March 31, 2021
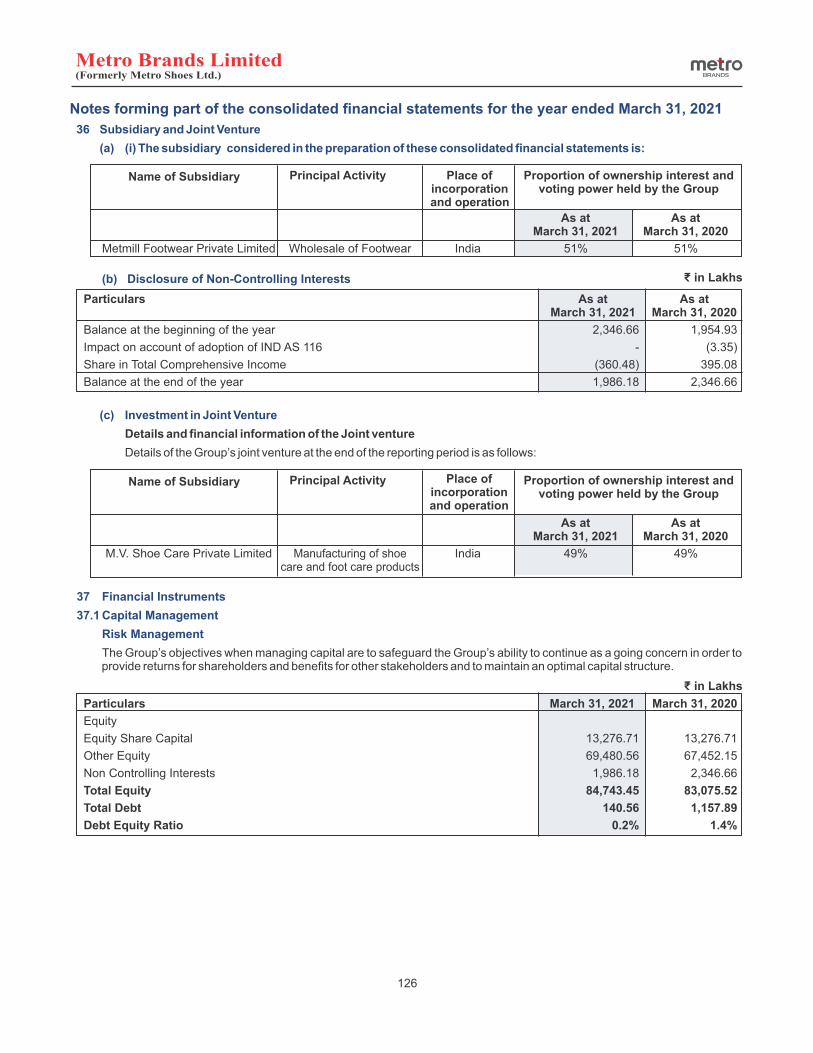
36 Subsidiary and Joint Venture
(a) (i) The subsidiary considered in the preparation of these consolidated financial statements is:
As at March 31, 2021
As at March 31, 2020
Name of Subsidiary
Metmill Footwear Private Limited Wholesale of Footwear India 51% 51%
(b) Disclosure of Non-Controlling Interests
Particulars As at As at March 31, 2021 March 31, 2020
Balance at the beginning of the year 2,346.66 1,954.93
Impact on account of adoption of IND AS 116 - (3.35)
Share in Total Comprehensive Income (360.48) 395.08
Balance at the end of the year 1,986.18 2,346.66
₹ in Lakhs
(c) Investment in Joint Venture
Details and financial information of the Joint venture
Details of the Group’s joint venture at the end of the reporting period is as follows:
As at March 31, 2021
As at March 31, 2020
Name of Subsidiary
M.V. Shoe Care Private Limited Manufacturing of shoe care and foot care products
India 49% 49%
37 Financial Instruments
37.1 Capital Management
Risk Management
The Group’s objectives when managing capital are to safeguard the Group’s ability to continue as a going concern in order to provide returns for shareholders and benefits for other stakeholders and to maintain an optimal capital structure.
Particulars March 31, 2021 March 31, 2020
Equity
Equity Share Capital 13,276.71 13,276.71
Other Equity 69,480.56 67,452.15
Non Controlling Interests 1,986.18 2,346.66
Total Equity 84,743.45 83,075.52
Total Debt 140.56 1,157.89
Debt Equity Ratio 0.2% 1.4%
₹ in Lakhs
126
Place ofincorporationand operation
Notes forming part of the consolidated financial statements for the year ended March 31, 2021

37.2 Categories of financial instruments
Financial Assets and Financial Liabilities classified under Level 1 and Level 2 hierarchy
Particulars Hierarchy Level March 31, 2021 March 31, 2020
Financial Assets
Measured at fair value through profit or loss
- Investments in mutual funds Level 2 35,703.89 31,711.64
- Investments in Bonds Level 1 2,167.12 1,041.38
Measured at amortised cost
- Trade receivables # Level 2 5,055.12 7,012.76
- Cash and cash equivalents # Level 2 2,631.67 1,049.53
- Other Bank balances # Level 2 6,160.74 38.89
- Loans # Level 2 187.88 191.47
- Other financial assets # Level 2 5,639.75 4,629.67
Measured at fair value through Other Comprehensive Income
- Investments in Bonds Level 1 1,365.91 1,292.98
Financial Liabilities
Measured at amortised cost
- Trade payables # Level 2 20,464.88 20,146.01
- Borrowings # Level 2 140.56 1,152.32
- Other financial liabilities # Level 2 1,445.47 1,865.33
- Lease Liabilities # Level 2 56,549.60 53,756.92
# The Group considers that the carrying amount of financial assets and financial liabilities recognised in the financial statements approximates their fair value.
37.3 Fair Value measurements
Fair valuation techniques and inputs used
(i) Fair Value Hierarchy
This section explains the judgements and estimates made in determining the fair values of the financial instruments that are (a) recognised and measured at fair value and (b) measured at amortised cost and for which fair values are disclosed in the financial statements. To provide an indication about the reliability of the inputs used in determining fair value, the Group has classified its financial instruments into the three levels prescribed under the accounting standard.
Level 1 inputs are quoted prices (unadjusted) in active markets for identical assets or liabilities that the entity can access at the measurement date. A quoted market price in an active market provides the most reliable evidence of fair value and is used without adjustment to measure fair value whenever available, with limited exceptions.
Level 2 inputs are inputs other than quoted market prices included within Level 1 that are observable for the asset or liability, either directly or indirectly.
Level 2 inputs include:
— quoted prices for similar assets or liabilities in active markets
— quoted prices for identical or similar assets or liabilities in markets that are not active
— inputs other than quoted prices that are observable for the asset or liability, for example
— interest rates and yield curves observable at commonly quoted intervals
— implied volatilities
— credit spreads
— inputs that are derived principally from or corroborated by observable market data by correlation or other means (‘market – corroborated inputs’)
Level 3 inputs are unobservable inputs for the asset or liability. Unobservable inputs are used to measure fair value to the extent that relevant observable inputs are not available, thereby allowing for situations in which there is little, if any, market activity for the asset or liability at the measurement date. An entity develops unobservable inputs using the best information available in the circumstances, which might include the entity’s own data, taking into account all information about market participant assumptions that is reasonably available.
₹ in Lakhs
127
Notes forming part of the consolidated financial statements for the year ended March 31, 2021

Financial assets
March 31, 2021 March 31, 2020
Investments in Mutual funds 35,703.89 31,711.64 Level 2
Net assets value
(NAV) declared
by the respective
asset
management
companies
NA NA
Investments in bonds 3,533.02
2,334.36
Level 1Active market
determinedNA NA
Relationship of
unobservable inputs to Fair Value
Fair value as at
(` in Lakhs) Fair value
hierarchy
Valuation
technique(s)
and key input(s)
Significant
unobservable
input(s)
37.4 Financial Risk Management
The Group’s activities expose it to variety of financial risks: credit risk, liquidity risk and market risk. In order to manage aforementioned risks, the Group operates a risk management policy and a program that performs close monitoring of and responding to each risk factors.
A] CREDIT RISK
i) Credit Risk Management:
Credit risk is the risk of the financial loss that the counterparty will default on its contractual obligation. The credit risk for the Group primarily arises from the credit exposures to trade receivables (mainly institutional customers), deposits with landlords for store properties taken on leases , cash and cash equivalents, deposits with banks and other receivables.
ii) Trade and other receivables:
The Group’s retail business is predominantly on cash and carry basis. The Group sells goods on credit basis to institutional parties. The credit risk on such collections is minimal considering that such sales are only 6.77% of the total sales. The average credit period for institutional parties is 30 days. No interest is charged on trade receivables on payment received even after the credit period. The Group has adopted a policy of dealing with only credit worthy counterparties in case of institutional customers and the credit risk exposure for institutional customers is managed by the Group by credit worthiness checks. As at 31st March,2021, the Group had 6 customers (as at 31st March, 2020 : 5 customers) that accounted for approximately 81% (as at 31st March, 2020 : 81%) of the trade receivables. The Group also carries credit risk on lease deposits with landlords for store properties taken on lease, for which agreements are signed and property possessions timely taken for store operations. The risk relating to refunds after store shut down is managed through successful negotiations or appropriate legal actions, where necessary.
The Group’s experience of delinquencies and customer disputes have been minimal.
iii) Cash and cash equivalents and deposits with banks:
Credit risk on Cash and Cash Equivalents is limited as the Group generally invests in deposits with banks with high credit ratings assigned by international and domestic credit rating agencies.
B] LIQUIDITY RISK
1) Liquidity Risk Management
Ultimate responsibility for liquidity risk management rests with the board of directors, which has established an appropriate liquidity risk management framework for the management of the Group’s short, medium and long-term funding and liquidity management requirements. The Group manages liquidity risk by maintaining adequate reserves, banking facilities by continuously monitoring forecast and actual cash flows and by matching the maturity profiles of financial assets and liabilities.
2) Maturity of financial liabilities
The table below analyse the Group’s financial liabilities in to relevant maturity based on their remaining contractual maturities of all non-derivative financial liabilities.The amounts disclosed in the table are the contractual undiscounted cash flows. Balance equal their carrying balances as the impact of discounting is not significant.
128
Financial Assets measured at Fair value
Notes forming part of the consolidated financial statements for the year ended March 31, 2021

₹ in Lakhs
Contractual maturities of financial liabilities Less than Between Between More than Carrying 1 year 1 and 3 years 3 and 5 years 5 years amounts
As at March 31, 2020
Non- derivative financial liabilities
Non interest bearing:
Trade Payables 20,146.01 - - - 20,146.01
Lease Liabilities 12,018.94 20,914.62 16,356.06 24,453.22 73,742.84
Others 1,865.33 - - - 1,865.33
Interest bearing:
Borrowings 1,152.32 - - - 1,152.32
As at 31st March, 2021
Non- derivative financial liabilities
Non interest bearing:
Trade Payables 20,464.88 - - - 20,464.88
Lease Liabilities 11,814.08 21,399.17 17,479.92 26,673.67 77,366.84
Others 1,445.47 - - - 1,445.47
Interest bearing:
Borrowings 140.56 - - - 140.56
The Group has access to follwing financing facilities which were undrawn as at the end of the reporting periods mentioned.
Undrawn financing facilities March 31 , 2021 March 31 , 2020
Amount Used - 1,011.76
Amount Unused* 3,500.00 2,488.24
Total 3,500.00 3,500.00
Letter of Credit (Unfunded)
Amount used 174.14 149.01
Amount unused 825.86 850.99
Total 1,000.00 1,000.00
*Of the above Rs.2000 Lakhs has been secured by a charge on Company’s book debts, inventory, receivables, cash flows, and all current assets including cash-in-hand.
C] MARKET RISK
Market risk is the risk that the fair value of future cash flows of a financial instrument will fluctuate because of changes in market prices. Market risk comprises three types of risk: Currency risk, interest risk and other price risk. The objective of market risk management is to manage and control market risk exposures within acceptable parameters, while optimising the return.
1) Product Price risk
Product price increases which are not in line with the levels of customers discretionary spends, may affect the sales volumes. In such a scenario, the risk is managed by offering judicious discounts to customers to sustain volumes. Group negotiates with its vendors for purchase price rebates such that the rebates substantially absorb the product discounts offered to the retail customers. This helps Group protect itself from significant product margin losses.
2) Interest risk
The Group is exposed to interest rate risk primarily due to borrowings havings floating interest rates. The Group uses available working capital limits for availing short term working capital demand loans with interest rates negotiated from time to time so that the Group has an effective mix of fixed and variable rate borrowings. The Group does not enter into financial instrument transactions for trading or speculative purposes or to manage interest rate exposure. Interest rate sensitivity analysis shows that an increase / decrease of fifty basis points in floating interest rates would result in decrease / increase in Group's profit before tax by approximately Rs. 2.34 Lakhs (2019: Rs. 3.29 Lakhs).
Particulars March 31, 2021 March 31, 2020
Interest on Secured Working capital limit 35.62 55.33
Interest Rate 7.60% 8.40%
Interest amount per 50 basis point fluctuation 2.34 3.29
129
Notes forming part of the consolidated financial statements for the year ended March 31, 2021
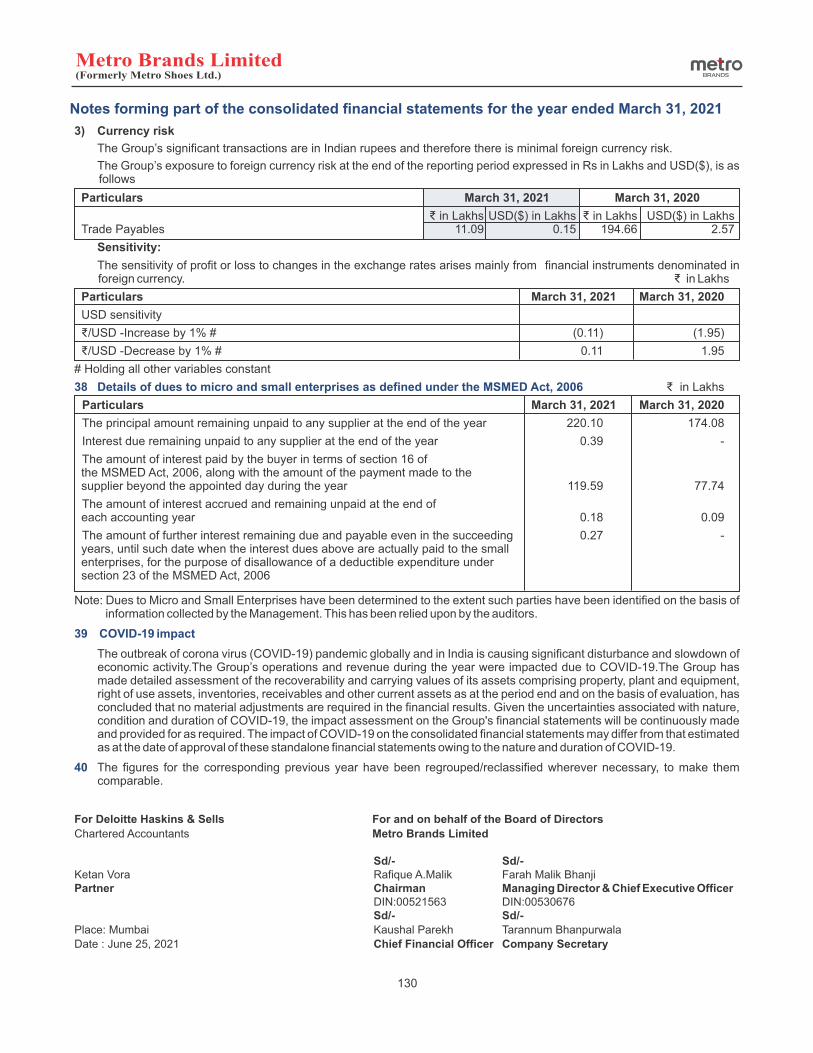
The sensitivity of profit or loss to changes in the exchange rates arises mainly from financial instruments denominated in foreign currency. ₹ in Lakhs
Particulars March 31, 2021 March 31, 2020
USD sensitivity
₹/USD -Increase by 1% # (0.11) (1.95)
₹/USD -Decrease by 1% # 0.11 1.95
# Holding all other variables constant
38 Details of dues to micro and small enterprises as defined under the MSMED Act, 2006 ₹ in Lakhs
Particulars March 31, 2021 March 31, 2020
The principal amount remaining unpaid to any supplier at the end of the year 220.10 174.08
Interest due remaining unpaid to any supplier at the end of the year 0.39 -
The amount of interest paid by the buyer in terms of section 16 of the MSMED Act, 2006, along with the amount of the payment made to the supplier beyond the appointed day during the year 119.59 77.74
The amount of interest accrued and remaining unpaid at the end of each accounting year 0.18 0.09
The amount of further interest remaining due and payable even in the succeeding 0.27 - years, until such date when the interest dues above are actually paid to the small enterprises, for the purpose of disallowance of a deductible expenditure under section 23 of the MSMED Act, 2006
Note: Dues to Micro and Small Enterprises have been determined to the extent such parties have been identified on the basis of information collected by the Management. This has been relied upon by the auditors.
39 COVID-19 impact
The outbreak of corona virus (COVID-19) pandemic globally and in India is causing significant disturbance and slowdown of economic activity.The Group’s operations and revenue during the year were impacted due to COVID-19.The Group has made detailed assessment of the recoverability and carrying values of its assets comprising property, plant and equipment, right of use assets, inventories, receivables and other current assets as at the period end and on the basis of evaluation, has concluded that no material adjustments are required in the financial results. Given the uncertainties associated with nature, condition and duration of COVID-19, the impact assessment on the Group's financial statements will be continuously made and provided for as required. The impact of COVID-19 on the consolidated financial statements may differ from that estimated as at the date of approval of these standalone financial statements owing to the nature and duration of COVID-19.
40 The figures for the corresponding previous year have been regrouped/reclassified wherever necessary, to make them comparable.
3) Currency risk
The Group’s significant transactions are in Indian rupees and therefore there is minimal foreign currency risk.
The Group’s exposure to foreign currency risk at the end of the reporting period expressed in Rs in Lakhs and USD($), is as follows
Particulars March 31, 2021 March 31, 2020
₹ in Lakhs USD($) in Lakhs ₹ in Lakhs USD($) in Lakhs Trade Payables 11.09 0.15 194.66 2.57
Sensitivity:
130
Notes forming part of the consolidated financial statements for the year ended March 31, 2021
F or Deloitte Haskins & Sells For and on behalf of the Board of Directors
Chartered Accountants Metro Brands Limited Sd/- Sd/-Ketan Vora Rafique A.Malik Farah Malik Bhanji Partner Chairman Managing Director & Chief Executive Officer DIN:00521563 DIN:00530676 Sd/- Sd/-
P Kaushal Parekh Tarannum Bhanpurwala lace: Mumbai
Date : June 25, 2021 Chief Financial Officer Company Secretary