Measure What Matters: The Trick to Selecting Marketing Metrics
Upload
truongcongCategory
view
217download
0
Metrics Masters
When it comes to managing a services business few topics generate as much interest ndash and controversy ndash as the topic of Metrics Whether the question is what to measure or how to measure it it can be challenging to reach consensus within a single team environment much less at departmental and organizational levels
Metrics Masters is a compilation of 3 whitepapers from some of the PS industryrsquos most respected experts
Metrics That Matter - by Thomas Lah Executive Director TPSA
Killer KPIs - by Jeanne Urich Managing Director Service Performance Insight
Implementing Practical Metrics for Breakthrough Professional and Consulting Services Results - by Randy Mysliviec President RMT Consulting
Each of these papers offers a unique perspective on measuring your services business but together they provide a comprehensive roadmap that you can use to begin better measuring evaluating and improving your services delivery and profitability
Metrics that Matter Measuring Professional Services Business - by Thomas E Lah author of Mastering Professional Services
There are easily over fifty meaningful metrics a management team could use to assess their professional services business The issue is determining what specific metrics provide the greatest insight Unfortunately revenue and profitability are not the beginning and ending of your measurement process These two metrics provide very limited insight into the strengths and weaknesses of your PS business In this article we will introduce a practical framework managers can use when selecting the appropriate metrics for their PS organization Future articles will discuss types of metrics in more detail and discuss the process of defining and deploying a metric strategy
What Metrics
When it comes to the professional services business managers will quickly agree on a short list of metrics that are ldquomust havesrdquo Yes you need to understand the utilization rate of your consultants Revenue and bookings are obviously critical to track Then what Load costs Project Margins Employee turnover rate The debate begins Table 1 Ten Professional Services Metrics provides ten metrics for a professional service organization that I have pulled from the appendix of my book ldquoBuilding Professional Services The Sirensrsquo Song I can articulate the specific value of each one of these metrics I can explain how each metric provides specific business insight Despite this I have yet to meet with a Professional Services organization that has all ten of these metrics at their finger tips I am learning that metrics are a ldquopremiumrdquo activity for most service organizations ldquoYes it would be nice to have all this data and insight but we donrsquot have the staff time or systems to generate lots of metricsrdquo Resources are tight You do not want to add metrics for the sake of having one more number to review You want to carefully add metrics that bring true strategic insight and help you improve the state of your business You want to add metrics that matter How do you do this In the well-received book ldquoThe Balanced Scorecardrdquo David P and Norton and Robert S Kaplan introduce the concept that ldquoexisting performance measurement approaches primarily relying on financial accounting measures are becoming obsoleterdquo Norton and Kaplan are convinced that metrics that focus simply on financial performance ldquohinder an organizationrsquos ability to create future economic valuerdquo Furthermore they state ldquothe
Metrics Masters wwwopenaircom
success of organizations cannot be motivated or measured by financial metrics alonerdquo I believe their warning is particularly relevant for human capital intensive businesses In a Professional Services business future quarterly revenues and profits are a direct reflection of how your employees and consultants will execute their jobs over the next three months Do they have the right skills Are they motivated Are they building deep relationships with your customers Last quarters revenue and profit numbers will provide little insight into answering these telling questions To help companies accept the reality that there is more to a healthy business than profit and loss numbers Kaplan and Norton engineered a balanced scorecard that has four distinct categories companies where companies should track data
1 Financial ROI revenue growth revenue mix 2 Customer Customer satisfaction account share 3 Internal Quality control time-to-market operational efficiency 4 Learning and Growth Employee satisfaction training skills development
Broadening the areas companies should track with discipline is a significant step in the right direction However creating additional categories does not help a management team determine what specific metrics they should focus on There is still this issue of priority ldquoRemember I donrsquot have a lot of extra staff cycles Which metrics will tell me the mostrdquo To begin addressing this challenge I want to define the concept of metric perspectives
Table 1 Ten Professional Services Metrics
Metric Definition
Backlog The total value of contract commitments yet to be executed (Total Backlog = Previous Fiscal Years Commitments + Latest Fiscal Years Sales - Latest Fiscal Years Revenue)
Bill Rate Average billable rate achieved by class of consultant
Gross Margin () The gross profit generated per dollar of service delivered (Gross Margin = Total Services Revenue - Cost of Services Delivered (COS)) traditionally called ldquocost of goods soldrdquo (COGS)
Hit Ratio The competitive success rate of the company in the markets it chooses to compete in Does not include single-sourced bids
Load Costs Total business costs that are not directly related to the cost of delivering services
Profit per Project The profit generated by a specific project (Project Profits = Total Project Revenue - COS - Sales Costs)
Rate Realization The amount of revenue actually earned as a percentage of potential revenue represented by the list prices
Sales Costs The total costs for the selling efforts of each line of business Total Sales Costs includes salaries expense accounts and commissions for sales management sales people and sales support
Total Services Revenue
Measurement of the different types of revenue should be listed separately by Consulting Solutions and 3rd Party Pass-through
Utilization Rate Measures the organizations ability to maximize its billable resources
Metric Perspectives Every metric provides a certain perspective on your business In other words different metrics tell you different things about your business Some metrics tell you there is a problem today Some metrics give you a heads up that there will be a problem down the road Also metrics naturally have different scopes Total services revenue indicates how the overall business is doing but provides little insight on how individual consultants are doing
Metrics Masters wwwopenaircom
Individual utilization metrics provides insight on individual performance and the overall health of the business Continuing this logic there are at least five unique metric perspectives you can consider
1 Functional Perspective What business function does this metric help evaluate Your sales organization Your delivery teams Service Marketing
2 Economic Perspective Almost every internal company initiative has one of two objectives improve operational efficiency or create future revenue (economic value) Does the metric track improvements in operational efficiency or assess the economic value of the business
3 Timeframe Perspective Just like economic data is the metric a leading or lagging indicator of how the business is performing Does the metric indicate you currently have a real problem or does the metric warn that soon you will have a problem if the current trend continues
4 Scope Perspective Does the metric measure the performance of specific individuals specific projects or the entire business unit
5 Stakeholder Perspective Does this metric provide insight on how your external stakeholders view you External stakeholders would include customers and partners
In Table 2 Metric Perspectives these five distinct perspectives are applied to the ten metrics defined in Table 1 The table shows what perspectives are satisfied by each metric For example Backlog is a leading indicator If Backlog drops below a certain threshold the business could be moving in the wrong direction Yes revenue targets may be met for this quarter However two or three quarters out may be a problem if backlog is not improved Backlog can be used to evaluate the service delivery and operations functions Backlog is not an appropriate metric to effectively evaluate the Services Engineering (Development) function Now that these five distinct perspectives have been defined they can be applied to help create an effective metrics portfolio
Table 2 Metric Perspectives
Functional Perspective Timeframe Perspective
Economic Perspective
Scope Perspective Stakeholder Perspective
Metric Service Sales
Deli- very
Service Mktg
Service Engrng
Service Ops
Lead- ing
Lag- ging
Effi- ciency
Value Staff Project Business Internal External
Backlog Y Y Y Y Y Y
Bill Rate Y Y Y Y Y Y Y Y
Gross Margin ()
Y Y Y Y Y Y Y Y Y
Hit Ratio Y Y Y Y Y Y Y Y
Load Costs Y Y Y Y Y
Profit per Project
Y Y Y Y Y Y Y
Rate Realization
Y Y Y Y Y Y Y Y
Sales Cost Y Y Y Y Y
Total Services Revenue
Y Y Y Y Y Y Y Y
Utilization Rate
Y Y Y Y Y Y Y Y Y Y
Metric Perspectives Graph We are still working to answer the question What tight set of metrics should I be using to evaluate my
Metrics Masters wwwopenaircom
professional services business Remember the smaller the list the better By using the concept of metric perspectives we can create a truly balanced metrics portfolio The objective is to identify a set of metrics that minimizes any perspective blind spots For example you would not want to pick ten metrics to manage your service business mdash only to realize that not one of them is a leading indicator of how your business is doing Figure 1 Metrics Perspective Graph Introduction shows the metrics perspective graph This graph allows you to map metrics to determine if there are any obvious perspective blind spots Figure 1 shows there are four distinct zones that metrics can be mapped into
ZONE 0 Lagging Economic Value Metrics in Zone 0 represent how the business has actually performed Metrics in this zone are the ones ultimately used to evaluate a management team and include Total Service Revenues and Profitability
ZONE 1 Lagging Efficiency Metrics in Zone 1 indicate you have a serious and immediate problem in the way you are running the PS business If operational efficiencies are not improved Revenues and Profits will suffer
ZONE 2 Leading Efficiency Metrics in Zone 2 provide early warning that you may have efficiency issues Poor performance on these metrics does not mean revenue and profits (Zone 0) will be immediately impacted However these metrics are a pointer to areas that if not addressed could impact future financial performance
ZONE 3 Leading Economic Value Metrics in Zone 3 provide insight on how the business will be doing in the future Are you creating economic value that will generate future revenues and profits Or are you whittling down your intellectual and human capital in order to pay todayrsquos bills
Figure 1 Metrics Perspective Graph Introduction Finally we need to map scope and stakeholder perspective onto the picture Figure 2 Completed Metrics Perspective Graph adds these two perspectives We have added three rings that represent the scope of the metric Metrics that only measure the overall business are placed in the outer ring Metrics that assess the health of projects are placed in them middle ring Metrics that can evaluate down to the staff level are placed close to the center of the graph Stakeholder perspective will be shown by the color used when placing the metric on the graph Metrics colored in RED have an internal perspective mdash the metric is important to you and your superiors Metrics colored in GREEN have an external perspective mdash your customers or partners care about your performance in this area Great we now have this pretty graph We need to put it into action
Metrics Masters wwwopenaircom
Figure 2 Completed Metrics Perspective Graph Using the Metrics Perspective Graph Let us start using the graph by mapping an industry standard metric that almost every service business uses utilization As a metric consultant utilization provides the following perspectives into your service business
Functional Perspective Utilization is used to evaluate the service delivery function Economic Perspective Utilization evaluates the efficiency of your service organization Time Frame Perspective Utilization is a lagging metric When utilization goes down you have a problem
now After the low utilization report comes in you canrsquot recapture those lost billable hours Like airplane seats and hotel rooms you cannot inventory consulting capacity
Scope Perspective Utilization is used to evaluate the performance of individual employees This data can then be used to evaluate the health of projects and eventually the overall business In other words utilization is a metric that can provide insight on all levels of your PS business
Stakeholder Perspective Utilization is an internal viewpoint Your customers and partners are not concerned about your utilization rates
With this perspective information Figure 3 Mapping Utilization maps utilization onto the metrics perspective graph The good news about utilization is that it covers the lower quadrant of the graph nicely It is a metric that hits the center bullrsquos-eye of ldquostaffrdquo This means the metric can provide insight on individual employees specific projects or the overall business However if you only used utilization to measure your services business you would have several blind spots
Functional Blind Spots Not specifically evaluating sales marketing or services engineering Economic Blind Spots Not evaluating the return on investments you are making into the business Not
understanding the economic potential of your service portfolio Yes you may be utilized today but what about six months from now
Time Frame Blind Spots You have no leading indicators that will warn the business may be heading south
Stakeholder Blind Spots You have no indication how customers and partners feel about the services you are delivering
Metrics Masters wwwopenaircom
Figure 3 Mapping Utilization Only using one metric is a simplified example to demonstrate how blind spots can exist Now lets map the top ten metrics we called out in Table 1 Table 3 Metrics Reference Codes provides a two letter code for each metric
Table 3 Metric Reference Codes
Metric Code
Backlog BL
Bill Rate BR
Gross Margin () GM
Hit Ratio HR
Load Costs LC
Profit per Project PP
Rate Realization RR
Sales Cost SC
Total Services Revenue
TR
Utilization Rate UR
Figure 4 Ten Service Metrics maps these metrics onto the perspective graph Remember the closer to the center the metric lands the greater potential scope it has Being close to the bullrsquos-eye is a good thing
Metrics Masters wwwopenaircom
Figure 4 Ten Service Metrics A majority of the PS organizations I have worked with do not have all ten of these metrics at their finger tips Even if they did have these ten traditional metrics in place there are still weak spots
1 There is not one metric that provides an external perspective How do customers view the business How do critical partners feel about your skills and ability to deliver None of these metrics provide insight on how the external world views your business
2 70 of these metrics are lagging They provide little insight on what direction the service business is moving positive or negative Yes you may have made money this quarter but are you headed in the right direction Hit rates sales costs and backlog do provide leading information mdash so you are not totally blind However you have no leading indicators on the health of the service portfolio or the skills of your staff
3 No leading metrics to evaluate the health of projects Project profitability tells you after the fact how it went Are your projects on track now Are you getting better at managing your projects
Hopefully the power of this graph is becoming apparent By considering the concept of metric perspectives you have much greater insight into what metrics provide what insight Mapping these perspectives onto a picture makes the assessment more visual and intuitive If you mapped the metrics you currently use to manage your PS business onto this graph what would the picture look like I am guessing you see the following reality
Very few (if any) leading metrics Limited insight on the cost and effectiveness of your service sales activities You may track revenues
and bookings but not hit rates sales costs per rep or sales cost per project type Very little insight into overall operational efficiency Are you getting faster better cheaper in the way
you deliver your service portfolio No hard metrics to evaluate the specific activities of service development and service marketing
These blind spot should be addressed Once again I am not advocating you track thirty PS metrics I am advocating you track at least ten to twelve metrics that minimize the types of blind spots I have listed above Key Messages
Metrics Masters wwwopenaircom
You canrsquot manage what you donrsquot measuremdashevery senior manager will agree to this truism Even though we all agree to it we have a tough time living it
Metrics are a premium activity It takes money and staff to generate data PS organizations want to apply finite resources to the right activities
Management teams must make a conscious decision to focus on a tight set of metrics that will provide the most strategic insight into the business
To accomplish this objective managers can use the concept of metric perspectives to assess and prioritize what metrics they will use
At a bare minimum a balanced metrics portfolio contains leading indicators on the health of the business
Zone 0 Metrics
Now that we have reviewed the framework letrsquos take a deeper dive into Zone 0 As previously defined Zone 0 metrics provide lagging information about the economic health of the professional service business In other words metrics in this zone tell you how you how much money you just made--not how much you will make Also this zone does not provide specific insight into the operational efficiency of your organization Are we doing things faster better cheaper Zone 0 is not very helpful answering these questions Having said all this the metrics that live in Zone 0 are critical to the continued employment of the management team
If targets in this Zone 0 are consistently missed the management team will eventually be replaced That why this Zone is always a focal point
Example Metrics Specifically which metrics in this critical zone impact employment longevity There are ten metrics that live in Zone 0 Table 4 Zone 0 Metrics lists these ten metrics and defines them
Priorities In the first column of Table 4 I have documented the three natural priority levels that exist within these ten metrics
Priority 1 Total Service Revenues Operating Profit Gross Margin These are the metrics that EVERY service organization tracks When these three go soft executives need answers
Priority 2 Bill Rate Rate Realization Labor Multiplier These metrics are the next wave most likely to be tracked by management They provide immediate insight into how profitable you will be for the quarter
Priority 3 Revenue per Practice Profit per Practice Solution Revenue Solution Margin These are Zone 0 metrics that many service organizations do not take the time to calculate Nevertheless they provide immediate insight into the profitability of specific service lines and provide greater insight into where profitability problems may exist
Table 4 Zone 0 Metrics
Metric Description Code
1 Total Services Revenue Measurement of the different types of revenue should be listed separately by Consulting Solutions and 3rd party pass-through
TR
1 Operating Profit The profit generated by operations also known as Operating Margin (Operating Profits = total services revenue - cost of services (COS) delivered - total operating expenses)
OP
1 Gross Margin () The gross profit generated per dollar of service delivered (Gross Margin = total services revenue - COS) traditionally called cost of goods sold (COGS)
GM
2 Bill Rate Average billable rate achieved by class of consultant BR
2 Rate Realization The amount of revenue actually earned as a percentage of potential revenue represented by list prices
RR
Metrics Masters wwwopenaircom
2 Labor Multiplier The average factor by which billable personnel can be charged over and above their fully loaded costs A Labor Multiplier of 10 indicates a breakeven point (Fully Loaded Costs = direct salary + direct fringe benefits + overhead + GampA + margin)
LM
3 Revenue per Practice Total services revenues incurred by specific consulting practice RPP
3 Profit per Practice The profit generated by practice operation also known as Operating Margin (Operating Profits = total services revenue - COS - total operating expenses)
PPP
3 Solution Revenue Total services revenues incurred from a specific solution SR
3 Solution Margin Average margin experienced when delivering a specific solution SM
Table 5 Zone 0 Metrics Perspectives provides additional data on what these ten metrics can be used to manage Figure 5 Zone 0 Metrics Graph maps these ten metrics onto the metrics perspective graph
Table 5 Zone 0 Metrics Perspectives
Metric Sales
Deli- very
Mktg Dev Ops Staff Project Busi- ness
Inter- nal
Exter- nal
1 Total Services Revenue Y Y Y Y Y Y
1 Operating Profit
1 Gross Margin () Y Y Y Y Y Y Y Y
2 Bill Rate Y Y Y Y Y Y
2 Rate Realization Y Y Y Y Y Y
2 Labor Multiplier Y Y
3 Revenue per Practice Y Y Y Y Y Y
3 Profit per Practice Y Y Y Y Y Y
3 Solution Revenue Y Y Y Y Y
3 Solution Margin Y Y Y Y Y Y
Figure 5 Zone 0 Metrics Perspective Graph
Metrics Masters wwwopenaircom
Deficiencies Hopefully by looking at Figure 3 the deficiencies of Zone 0 metrics becomes apparent There is a natural tendency for the PS management team to fixate itself on Zone 0 metrics This is understandable If revenues and profits are falling jobs are at stake But if a management team only tracks metrics in Zone 0 they have a seriously flawed metric strategy These ten metrics will not provide insights in the following areas
Future Economic Value Yes we just had a good quarter But what will future profits look like Zone 0 metrics dont help me here
Operational Efficiencies Revenues and profits do indicate if we are managing the business well or not However they do not provide much insight where operational challenges may exist Margins were off Why Were sales costs too high Did we simply scope the projects poorly Zone 0 comes up empty when asking these questions
External Perspective Last but not least the ten metrics in Zone 0 are all important to managers They are not important to customers Does a customer really care if margins and profits were down No If you are trying to determine how customers feel about you Zone 0 does not help
Targets The most frequent request I receive from management teams is to provide guidance for the following Zone 0 metrics
Gross Margin How much margin should are professional service business be throwing off
Operating Profit What operating profit is reasonable and sustainable for a PS business
Bill Rate Hey are our bill rates too high (like our sales people keep telling us)
Rate Realization What rate should we be expecting from our consultants 65 75 100
Over the past three years I have found the specific targets for these four metrics vary widely from organization to organization practice to practice and industry to industry Gross margins in PS are ranging from 10 to 45 Operating profits are ranging from -20 to 20 Realization rates are typically ranging from 50 to 90 The spectrums are WIDE Having said this I do see some pattern recognition
First of all actual gross margins are consistently lower than target gross margins The most common target I see for gross margin is 40 The actual gross margins in PS are much closer to 25 Operating profit targets are typically set between 12 - 15 Actuals are hovering around 10 I base these observations on the few companies that will publicly report the gross margins and profits of their professional service business and the various companies I have had the privilege to work with directly
My experiences lead me to the following conclusion There are no universal targets that make sense for Zone 0 metrics Target margins and profits should be driven by the specific business model for your professional service organization NOT some mythical standard that in reality does not exist For more information on target business models for professional service organizations please refer to the previously published article The Professional Services Business Model - Fighting the 4020 Myth
Key Messages
When creating a metrics portfolio is important to consider what the metrics are telling you The objective is to identify a set of metrics that minimizes any perspective blind spots
Zone 0 metrics provide lagging information about the economic health of the professional service business
Metrics Masters wwwopenaircom
If targets in Zone 0 are consistently missed the management team will eventually be replaced
Zone 0 metrics do not provide insights into critical areas such as future economic performance operational inefficiencies or customer satisfaction
In the industry Zone zero metrics are all over the map There is a wide spectrum of results for these metrics Industry dynamics organizational maturity and service type all impact what a professional service organization can achieve in Zone 0 Universal targets for these metrics does not make sense
Zone 1 Metrics
Per the earlier definition Zone 1 metrics provide important insights on the operational efficiencies of your PS business However these insights are lagging in naturemdashnot predictive
If targets in Zone 1 are consistently below industry expectations PS revenues and profits will continue to disappoint
Example Metrics There are at least eight metrics that can logically be placed in Zone 1 Table 6 Zone 1 Metrics lists these eight metrics and defines them
Priorities In the first column of Table 6 I have documented the three priority levels for these eight metrics These assigned priorities are most likely the opposite priorities most PS managers would assign to these metrics Let me defend my prioritization
Priority 1 Profit per Project Project Overrun Costs Cost of Services Delivered Delivery Labor Costs All of these metrics inform the management team how much cost is actually involved in delivering their services When project profitability decreases and project overruns increase overall PS profitability (Zone 0 metric) will soon be impacted If delivery labor costs are increasing profitability will be impacted In other words the management team must understand the true and total costs required to deliver the service portfolio These costs need to be monitored and aggressively managed If not the natural tendency is for project costs to become bloated and margins to erode
Priority 2 Load Costs Delivery Overhead Costs These metrics are the next area management can track to identify potential efficiency improvements These metrics provide insight into how much overhead the PS organization is carrying to support project delivery The healthiest project margins will have difficulty covering unnecessary and inflated overhead costs
Priority 3 Utilization and Cash Flow The fact Utilization is placed as a third priority is no doubt controversial Every PS leader demands that consultant utilization be tracked and accounted for I agree utilization is a very insightful metric If consultants are only being utilized 50 - 60 of the time the business is inefficient and over resourced However utilization is one of the most abused metrics available to the management staff If you tell PS staff you will be tracking utilization they will be utilizedmdashtrust me The question remains how beneficial the utilization was Tracking real project costs and overruns will provide more immediate and potentially more accurate insights into the efficiencies of your business
Even if deals are being won and top line revenue is growing you may not be delivering your services portfolio at an optimized level Zone 1 metrics help answer a very pertinent business question ldquoHow efficient are we as a Professional Services Organizationrdquo
Metrics Masters wwwopenaircom
Table 6 Zone 1 Metrics
Metric Definition Calculation Code
1 Profit per Project
The profit generated by a specific project
Project Profits = Total Project Revenue - COS - Sales Costs
PP
1 Cost of Services
Delivered
The fully loaded direct and indirect costs of billable services Includes the expenses of any managers that are more than 50 billable
Costs of Services Delivered = Delivery Labor Costs + Deliver Overhead Costs
Cost of Services Delivered Total Services Revenue
COS
1 Delivery Labor Costs The direct costs of billable services Includes the labor costs of any managers that are more than 50 billable
Delivery Labor Costs Total Services Revenue
DLC
1 Project Overruns The accuracy with which project costs are forecasted
Total project costs incurred total estimated project costs
POR
2 Delivery Overhead
Costs
The fully loaded indirect costs of billable services Includes the related expenses of any managers that are more than 50 billable
Delivery Overhead Costs = fringe benefits + travel + delivery - unit management costs + all other related costs with full-timeconsultants hourly employees or independents
Delivery Overhead Costs Total Services Revenue
DOC
2 Load Costs Total business costs that are not directly related to the cost of delivering services
LC
3 Utilization Rate Measures the organizations ability to maximize its billable resources
Total of hours billed of working hours in a year (varies by geography) x of billable hours
UR
3 Cash Flow The amount of cash generated (or absorbed if negative) by the organization
Cash Flow from operations Total Services Revenue
CF
Table 7 Zone 1 Metrics Perspectives provides additional data on what these eight metrics can be used to manage Figure 6 Zone 1 Metrics Graph maps these eight metrics onto the metrics perspective graph
Table 7 Zone 1 Metrics Perspectives
Metric Sales Deli- very
Mktg Dev Invest- ment
Staff Project Busi- ness
Inter- nal
Exter- nal
Profit per Project Y Y Y Y Y
Cost of Services Delivered
Y Y Y Y Y
Delivery Labor Costs Y Y Y Y Y
Project Overrun Y Y Y Y Y Y
Delivery Overhead Costs Y Y Y
Load Costs Y Y
Utilization Rate Y Y Y Y Y Y
Metrics Masters wwwopenaircom
Cash Flow Y Y
Figure 6 Zone 1 Metrics Perspective Graph
Deficiencies Zone 1 metrics have two significant deficiencies First of all the metrics are indeed lagging in nature Soaring delivery costs or project overruns tell you there is a problem after it has occurred Secondly these metrics are very internally focused As a PS manager YOU care about utilization rates and delivery load costs Your clients do not
Targets In the previous article on Zone 0 metrics I discussed the fact that best practice targets for many of these metrics are a slippery slope to stand on However there are some reasonable guidelines for two of the Zone 1 metrics
Utilization PS organizations have a tendency to target very high utilization rates I believe this bias comes from the heritage of traditional professional service organizations such as law firms and accounting firms In these environments employees are often expected to bill over forty hours a week to client accounts I believe PS activity within a product company is a very different environment I have yet to review a PS organization that was sustaining 100 billable utilization I do see PS organizations that report 100+ utilization rates However these rates track non-billable activity such as pre-sales calls For billable utilization activity I believe there is a natural strike zone that sits between 60 and 85 billable utilization Less than 60 and the PS organization cannot financially support itself Greater than 85 and no time is left for ongoing staff development
Project Overruns Project overruns occur It is a fact of life when you are delivering complex technology centered solutions The question is the order of magnitude On an ongoing basis project overruns should average 10 - 25 If your project costs consistently exceed 25 of the initial estimation your ability to estimate effort is seriously in question If you are bidding projects at a fixed price your ability to be profitable is clearly in jeopardy
Key Messages
Metrics Masters wwwopenaircom
When creating a metrics portfolio is important to consider what the metrics are telling you The objective is to identify a set of metrics that minimizes any perspective blind spots
Zone 1 metrics provide lagging information concerning the operational efficiency of the professional service business
If targets in Zone 1 are below industry expectations the PS business will find it difficult to effectively compete in the marketplace Revenues and profits will eventually be compromised
Zone 1 metrics such as utilization and project overruns costs can and should be benchmarked against industry standards
Zone 2 Metrics
Lets begin the transition to leading metrics by visiting Zone 2 Per the earlier definition Zone 2 metrics provide leading insights into the operational efficiency of your PS business
If Zone 2 metrics begin declining operational efficiency will begin suffering If operational efficiency drops reduced margins and profits are sure to follow
Example Metrics There are at least ten metrics that can logically be placed in Zone 2 Table 8 Zone 2 Metrics lists these ten metrics and defines them
Priorities In the first column of Table 8 each Zone 2 metric is rated by priority level
Priority 1 Bid and Proposal Costs ndash This metric is a little tricky Even though it is a cost metric and fundamentally speaks to efficiency it can speak to so much more We are winning more business However if bid costs are going up something is changing Are we simply getting sloppy in our bid approach Are new competitors entering our space Or are we chasing business we simply should not be chasing Review those bid costs now before your revenues reflect the fact the sales folks were chasing the wrong business Channel Mix ndash How efficiently are we using all of our sales channel options Are the old partners getting any better at selling the new services Does everything still get sold through the most expensive channel option we have ndash direct sales staff Act to improve the channel mix now before you are forced to reduce direct sales staff later G amp A ndash Are GampA costs creeping up This often happens in service businesses If GampA continues to climb as a percentage of total revenues you are probably spending money to mask other fundamental issues in the business Take a look at creeping GampA costs now before the CFO hands you required budget cuts Project Completion Ratio ndash Yes you track project profitability after the fact But how about the large projects in play right now Are the teams meeting commitments on time Also this is the first metric we have spoken of that has an external perspective as well In other words your customers care how you do here Are you delivering on your commitments to them Track project milestones now before you realize chunks of revenue will be delayed next quarter
Priority 2 Research and Development Costs ndash How much money does PS spend to manage intellectual property and improve delivery methodologies If this number is becoming too large profits suffer If this number becomes too small you struggle to increase the value you bring to customers Track how much money is invested in solution development and improvement now before your solution
Metrics Masters wwwopenaircom
portfolio becomes stale and unmarketable Total Operating Expenses ndash Many PS organizations are not disciplined in their tracking of Sales Costs vs Marketing Costs GampA etc To offset this common deficiency it is recommended that the management team tracks the total amount of money spent to support the business If PS margins are flat and total operating expenses are growing there is a problem Understand total operating expenses now before there are not enough margin dollars to support them Training Costs and Training Days ndash Like RampD Costs the concern on Training is centered more around under-investment Catch severe declines in training investments now before consultants embarrass your brand six months from now
Priority 3 Alliance and Partner Costs ndash Partners are a critical component to the delivery of most ldquosolutionsrdquo How much money are you investing in identifying qualifying and enabling these critical partners Are you wasteful or under-investing Spend money certifying your delivery partners today before they tank a critical engagement tomorrow Collateral Costs ndash How much does PS spend on marketing materials If it is the largest portion of your service marketing budget you have a problemmdashtrust me Reduce marketing material costs now before you wish you did
These Zone 2 metrics provide wonderful perspectives into your business Once again no executive will be fired because RampD costs were too low or Project Completion ratios have slipped by 10 However that same executive could be subjected to a very unpleasant business review four quarters down the road when a poorly differentiated service portfolio and poor project execution has created significant slips in revenues and profits
Table 8 Zone 2 Metrics
Metric Definition Calculation Code
1 Bid amp Proposal Cost
Total dollars spent on submitting a bid including dollars spent on bid qualification financial analysis alliancepartner selection feasibility analysis proposal submittal and best and final offer (BAFO)
Total dollars spent for submitting bids divided by total contract value of bids submitted
BPC
1 Channel Mix Percentage of sales revenues that occur through each potential sales channel
CM
1 General and
Administrative Expenses (GampA)
The general expenses not captured in COS Sales Marketing or RampD
GampA Expenses = Total Expenses - Training Costs + Management Costs + other administrative costs
GampA Expenses divided by Total Services Revenue
GampA
1 Project Completion Ratio Measures the degree of completion against project milestones
Number of milestones accomplished on schedule divided by total milestones targeted
PCR
2 Research amp Development
Costs
Degree of investment made to enhance the firms tools products and methodologies
Total RampD Costs = Infrastructure + Sales Tools + Delivery Tools
RampD Costs divided by Total Services Revenue
RampD
2 Total Operating
Expenses
The sum of all non-delivery operating expenses Total Operating Expenses divided by
Total Services Revenue TOE
Metrics Masters wwwopenaircom
Total Operating Expenses = GampA Costs + Sales Costs + Marketing Costs + RampD Costs
2 Training Costs
The total cost of training Training expenses include curriculum design and development instruction costs and facilities costs
Training Expenses divided by Total Services Revenue
TC
2 Training Days Average number of working days spent in training
Number of employee working days spent training divided by total number of employee working days
TD
3 Alliances amp Partnering
Costs
The amount of dollars spent on alliance and partner programs by line of business
Alliance amp Partnering costs divided by Total Services Revenue
APC
3 Seminars amp Collateral
Material Costs
The amount of dollars spent on prospect andor client seminars and marketing collateral
Seminars amp Collateral Costs divided by Total Services Revenue
COL
Table 9 Zone 2 Metrics Perspectives provides additional data on what these ten metrics can be used to manage Figure 7 Zone 2 Metrics Graph maps these metrics onto the metrics perspective graph
Table 9 Zone 2 Metric Perspectives
Metric Sales Leading Lagging Efficiency Investment Staff Project Business Internal External
Bid amp Proposal Cost Y Y Y Y Y Y
Channel Mix Y Y Y Y Y
GampA Expenses Y Y Y Y
Project Completion Ratio
Y Y Y Y Y Y Y
R amp D Costs Y Y Y Y
Total Operating Expenses
Y Y Y Y
Training Costs Y Y Y Y
Training Days Y Y Y Y Y
AlliancePartnering Costs
Y Y Y
Seminar amp Collateral Material Costs
Y Y Y Y
Metrics Masters wwwopenaircom
Figure 7 Zone 2 Metrics Perspective Graph
Zone 3 Metrics
Finally our long journey through Professional Services business metrics comes to a close as we enter Zone 3 The metrics in this zone provide the greatest insight into the future economic health of a PS business Revenues and profits normally determine whether managers are paid bonuses for the quarter The metrics in Zone 3 are early indicators on how bonuses will be paid four quarters from now
If Zone 3 metrics begin declining your PS business is in decline It is only a matter of time before revenues and profits will suffer
Example Metrics Table 10 Zone 3 Metrics lists ten metrics that provide a leading economic assessment of the PS business
Priorities In the first column of Table 10 each Zone 3 metric is rated by priority level
Priority 1 Account Expansion ndash This metric tracks how much follow-on business a Professional Services team gets after the first engagement If this dollar value is increasing per account PS is doing a better job of delivering establishing credibility and identifying new opportunities If this metric is declining customers are not impressed with your services or staff Account expansion in existing customers is typically an easier task than securing new accounts Backlog ndash First backlog slips A decline in recognized revenues is not far behind Ideally your quarter starts with at least 75 of the service work identified and booked For most project-based services a backlog below 50 of the target revenue for the quarter is a difficult hole to climb out of Hit Ratio ndash This metric tells you how successful your sales proposals are If your hit ratio is improving your positioning and value proposition are most likely improving Also your employees are becoming more effective at selling the solution A declining hit ratio is an early indicator that a solution is growing stale of competitors have created a more compelling value proposition New Client Ratio ndash How much business is coming from new customers This metric provides the mirror
Metrics Masters wwwopenaircom
insight that ldquoaccount expansionrdquo does If ALL of your revenue is coming from the existing client base you are not effectively selling or marketing the portfolio to new prospects
Priority 2 Customer Value ndash Customer Value Customer Loyalty Customer Satisfaction All related metrics The bottom line How do customers feel about the services you are delivering A downward trend here provides an early warning signal that all is not well Delivery Tools ndash This metric is closely related to RampD spend The difference is that here you want to measure how much as been invested in tangible infrastructure that facilitates the delivery of service offerings If this percentage is flat or declining you may be under investing in the tools that differentiate your services This scrimping will not show up this quarter but can bite you later in the year Sales Yield ndash How effective is your selling process If sales yields are increasing your solution selling skills are improving or your solution positioning is more compelling Either way the economic value of your PS business is increasing Solution Portfolio Maturity ndash This is the concept of measuring your ability to deliver a particular service consistently If service maturity is increasing your ability to improve margins increases Your ability to improve margins is a great indicator of the economic health of the business
Priority 3 Skills Gaps ndash Do you have the skills you need to deliver your services When you first start a PS business this gap may be significant The goal is to shrink it If the gap is not improving or widening you will eventually pay a very real price in margins and revenues Turnover Rate ndash Last but not least What is your overall turnover rate in the PS business A key consultant can leave today and the quarter is not lost Your top ten consultants leave over the next six months and revenues may be impacted A spike in turnover rates can be an early warning sign that the business is not on track
Zone 3 metrics provide the greatest insight into the true health of your Professional Service organization Ironically these are the metrics that are least likely to show up on a monthly PS dashboard
Table 10 Zone 3 Metrics
Metric Definition Calculation Code
1 Account Expansion The ability of a vendor to expand its account penetration and its volume of business within existing accounts
Add on revenue divided by dollar value of original proposal
AE
1 Backlog The total value of contract commitments yet to be executed
Total Backlog = Previous Fiscal Years Commitments + Latest Fiscal Years Sales - Latest Fiscal Years Revenue
BL
1 Hit Ratio
The competitive success rate of the company in the markets it chooses to compete in Does not include single-sourced bids
Revenue from proposals won divided by possible revenue from proposals submitted
HR
1 New Client Ratio
Measures a vendors ability to win new accounts and develop new business
New Client Ratio = new clients divided by total clients
Total dollar value of new client accounts divided by total dollar value of all client accounts
NCR
2 Customer Value
Measures how satisfied the customer is with the services delivered Identifies how customers receive value from the service offering
Perceived Business Benefit of Service Offerings - Cost of Service Offering
Benefit ultimately represents the sum
CV
Metrics Masters wwwopenaircom
total of expected cost savings andor increased revenues
2 Delivery Tools
The amount of RampD investment in Delivery Tools
Delivery Tools = automated methodology tools + project management + online skills inventoryresource + time scheduler + automated labor voucher + real-time conferencing + workgroup sharing + knowledge database
Delivery Tools divided by Total Services Revenue
DT
2 Sales Yield The sales productivity of the company (Target values or sales quota versus actuals are encouraged)
Sales dollar valuedivided by number of direct or full-time equivalent sales people
SY
2 Solution Portfolio
Maturity The average maturity rating for target solutions
Average of number of completed sales and delivery tools for a solutiondivided by total number of sales and delivery tools to be created
SPM
3 Skills Gaps
Measures the gap between the skills required to deliver target services and the skills available within the delivery staff
SG
3 Turnover Rate
A measure of attrition An example of a Former Employee is a person who was on the personnel roster at the start of the previous fiscal year and was no longer on the personnel roster at the start of the current year
Number of Former Employees (annualized) divided by total number of employees (annualized)
TR
Table 11 Zone 3 Metrics Perspectives provides additional data on what these ten metrics can be used to manage Figure 8 Zone 3 Metrics Graph maps these metrics onto the metrics perspective graph
Table 11 Zone 3 Metric Perspectives
Metric Delivery Mktg Dev Ops Leading Lagging Efficiency Economic
Value Staff Project Business Internal External
Account Expansion
Y Y Y Y Y Y Y
Backlog Y Y Y Y Y Y
Hit Ratio Y Y Y Y Y Y
New Client Ratio
Y Y Y Y Y Y
Customer Value
Y Y Y Y Y Y Y Y Y
Delivery Tools
Y Y Y Y Y Y Y
Sales Yield Y Y Y Y Y Y
Solution Portfolio Maturity
Y Y Y Y Y Y
Skills Gaps Y Y Y Y Y Y Y
Turnover Rate
Y Y Y Y Y Y Y Y
Metrics Masters wwwopenaircom
Figure 8 Zone 3 Metrics Perspective Graph
Summary We hope you have found this article on Professional Services business metrics to be valuable to your business Remember Professional Services is a human capital intensive business Scaling or contracting a human capital intensive business can be much more challenging than scaling or contracting manufacturing capacity On-boarding people takes time Off-boarding takes even longer Improving skills and human efficiency takes patience and understanding Services that are centered on complex technologies have the added challenge of scaling human resources that are competent in both hard (technical) and soft (consultative) skills In all this complexity I donrsquot see how a modern professional service business improves without insightful data I hope this metrics framework provides you an approach to acquire that insightful data
Key Messages
When creating a metrics portfolio it is important to consider what the metrics are telling you The objective is to identify a set of metrics that minimizes any perspective blind spots
Professional Services Management teams have a tendency to focus on metrics that provide lagging information concerning the health of the Professional Services function
Zone 2 metrics provide leading information concerning the operational efficiency of the Professional Services business
Zone 3 metrics are leading indicators of the future economic health of the Professional Services business
If Zone 2 and 3 metrics are in decline future financial targets are at risk
About the Author
Thomas E Lah is the Executive Director of The Technology Professional Services Association (TPSA) author of Mastering Professional Services and Building Professional Services A Sirens Song and currently consults with companies to establish or improve their professional services organizations Thomas is actively engaged with The Ohio State University hosting an executive education program focused on frameworks and strategies to successfully build professional services at product-centric companies
Metrics Masters wwwopenaircom
He received an undergraduate degree in Information Systems and holds an MBA from the Fisher College of Business at The Ohio State University
Killer KPIs for Professional Services - by Jeanne Urich Managing Director Service Performance Insight
Which Key Performance Indicators are the ldquogotta measuresrdquo to run your Professional Services organization
Which KPIrsquos drive success and contribute to the bottom line
In this article you will learn
The growing role Services revenue plays in overall financial performance Which KPIrsquos are essential and what they mean Typical Key Performance targets Tips to improve your financial performance
As the technology market has matured there has been a dramatic shift in overall revenue and margin contribution derived from Services According to a recent Association of Support Professionals survey of the Top 100 publicly traded software companies Services (PS and maintenance) now represent from 50 to 80 of overall revenue Service margins have also dramatically improved propelled primarily by healthy support margins (exceeding 80) Service margin contribution is now 45 to 80 of total Service revenue Seemingly overnight Services have become quite respectable sources of revenue and margin
Maintenance and Services Ratios2006 Produced by the Association of Support Professionals ndash wwwasponlinecom Annual survey of 100 publicly traded Software companies
Half of the companies reported total Service revenue (Maintenance and PS) greater than 50 of total revenue
Eight companies reported total Service revenues greater than 75 of total Eleven companies (primarily shrink-wrap software) reported total Service revenues less than 20 of
total revenue Maintenance represents greater than 40 of overall revenue and produces a whopping 83 median
margin Professional Services revenue represents from 4 to 45 of total revenue
Metrics Masters wwwopenaircom
Professional Services reported a median 21 margin PS margins vary widely from negative to +46
What are the essential Key Performance Indicators
With the growing contribution and significance of Services to the bottom line itrsquos never been more important to effectively monitor measure and manage your Services business But with over 150 KPIrsquos available where do you start
Running a Professional Services business is very complex ndash and itrsquos a game which must be won with ldquosingles and doublesrdquo not homeruns so it is imperative to know which KPIrsquos are ldquoessentialrdquo ones you must continually measure and ones that are ldquonice to haverdquo but not essential The challenge for all Services executives is how to balance Customers Employees Partners and Operations The excellent Service leader spends 50 of her time with Customers Partners and the Product Sales organization and 50 with employees and operations The challenge is to continually capture new business while ensuring projects are delivered with quality to provide consultants the tools they need to deliver and grow their skills while effectively running operations and ensuring revenue and cost are in alignment
Revenue ndash starts with Service bookings which convert to ldquocleanrdquo backlog once all required contracts Professional Services Agreements and Statements of Work have been completed signed and approved Resources are then applied to work the Service backlog Billings occur based on the contract terms - time and material fixed price milestone deliverables etc Your ability to recognize revenue will be determined by your firmrsquos accounting practices Sarbanes Oxley has imposed a complex set of rules so make sure you understand contract obligations up front to avoid revenue recognition problems later
Gross Margin ndash Margin must be measured at several different levels Most organizations use subcontractors for Service delivery Subcontractors not only provide a lower cost variable workforce but can also provide a rich source of margin For systems integrators hardware and software pass-through revenue and margin must be closely monitored And finally since Professional Services is based on applying highly skilled professionals to deliver project revenue the most important measure of all is your labor margin Subcontractor margin hardware and software pass through margin and direct labor margin create gross margin For even the best-run Professional Services organizations who command high bill rates and utilization it is difficult to consistently sustain a Services gross margin over 50
Metrics Masters wwwopenaircom
Regional Margin - Most Service organizations measure regional and line-of-business profit and loss in addition to the global Professional Services P amp L Depending on your companyrsquos accounting practices corporate overhead costs may be apportioned to the region or line of business or kept in a ldquoCorporaterdquo overhead cost center
For example if your company requires a 20 PS contribution margin and your corporate overhead is 20 you will need regions to produce a 40 margin
Service margins are typically lower in EMEA than in the US due to the increased cost of Fringe Benefits ndash employee overhead costs for health and benefits range from 22 to 25 in the US but may be as high as 40 in EMEA plus an expensive car allowance in many countries Vacations and company holidays - in EMEA typically 4 weeks vacation and 12 or more holidays compared to 2 weeks vacation and 10 company holidays in the US This extra ldquonon-billablerdquo time is offset somewhat by an expectation of higher billable utilization
Contribution Margin - The true differentiator for Professional Service profitability is how the practice manages ldquobelow the linerdquo costs Professional Services organizations typically produce a Global Service Contribution Margin between 10 and 40 Typical Corporate expenses (as a of total PS Revenue) include
General and Administrative (5 to 10) ndash includes PS corporate management and fringe benefits facilities non-billable travel IT telecom etc
Sales (6 to 20) ndash includes all direct sales headcount and fringe + non-billable business development travel amp expense commissions incentives sales training
PS Engineering amp PMO (2 to 5) ndash includes all PS Engineering amp PMO headcount fringe amp expense Labs tools delivery training project reviews
Marketing (3 to 5) ndash includes all Service Marketing headcount amp expense Web PR advertising tradeshows sales training customer satisfaction survey references and Service packaging
Most PS organizations under-invest in PS Engineering and Service Marketing and over-invest in non-billable management overhead and non-billable travel Sales expense is typically hidden in the regional PampL and represented as ldquonon-billablerdquo time for key managers and Solution Architects As a PS firm grows and matures investments in dedicated Service Engineering Marketing and Sales can pay huge dividends by making Service delivery more repeatable and efficient and Service sales more effective
Customer Satisfaction ndash for Product Companies one of the primary ldquoraison drsquoetresrdquo for a Professional Services business is to produce reference customers This is an extremely important measurement area yet one that is often overlooked Unless you have a very large Professional Services business typical Customer Satisfaction ldquoloyaltyrdquo surveys are not granular enough to showcase delivery problems So no matter how small your organization you should create a project dashboard and continually monitor project health I recommend at least quarterly reviews of all projects with defined criteria for RED AMBER and GREEN plus on-going knowledge sharing to continue to improve the practice and your methodology
Workforce Plan ndash the lowest common denominator is the health of your Service Delivery organization Billable headcount represent your brand and reputation as well as your Service Delivery capability and revenue potential From practice inception you should quote tiered bill rates by skill level and of course you must measure your employeersquos utilization ndash both billable and non-billable I always recommend creating an organizational view showing profit and loss by person You will probably find 80 of your revenue and profit is produced by 20 of your workforce so it is imperative to know who your revenue producers are and ensure they are recognized and rewarded
Resource ldquoownershiprdquo ndash an interesting dilemma arises when regions or practices ldquoownrdquo the fully loaded cost of consultants There is a built-in disincentive to share resources Methods to overcome ldquoresource hoardingrdquo include central resource management or ldquocost andor revenuerdquo sharing for loaned consultants
Utilization - there are many different ways to calculate utilization In the US the standard definition is based on 2080 available work hours per year ndash this translates to 260 available work days per year Most standard utilization measurements subtract company holidays (10 in the US and 12 or more in EMEA) The standard ldquoavailablerdquo starting hour calculation in the US is 2000 while in EMEA the standard ldquoavailablerdquo days are typically
Metrics Masters wwwopenaircom
240 Primary differences in utilization definitions emanate from the varying treatment of ldquonon-billablerdquo hours for internal projects customer satisfaction issues or business development (in the numerator) and whether non-billable personal time off is excluded from the denominator
Regardless of your specific utilization formula it is important to develop a ldquostandardrdquo utilization definition and to publicize and consistently measure it throughout the organization
Standard KPI Definitions
What are typical KPI targets
As technology Professional Services comes of age standard measurement targets are emerging based on the type of Professional Services delivered ndash software implementation customization and integration hardware and network installation and configuration management and business process consulting etc The targets for Software implementation consulting differ from Business and Management Consulting More commoditized Services command lower bill rates and require higher utilization rates Significant factors impacting profitability include the quality and maturity of the product geographic differences complexity of Service skill level required level of risk etc
ldquoYour mileage may varyrdquo depending on the charter and mission of your organization If your mission is to ldquoCreate Referenceable customersrdquo at any cost then you may not run your Services organization as a profit center If your mission is to ldquoSupport Sales and drive Product Revenuerdquo then you may run your organization on the low end of billable utilization and revenue per person and accentuate metrics around bidwin ratio capture rate and cost of sales Measurements for smaller startup organizations should accentuate ldquobuilding client referencesrdquo rather than Service profit While targets for larger more mature Service organizations should accentuate the highest possible Service revenues and margins
If you are running a Software Professional Services organization within a Product company the following metrics may be right for you
Metrics Masters wwwopenaircom
Professional Services is a ldquogame of nickels and dimesrdquo the following chart illustrates how small improvements can produce Big Results If you made just a 10 improvement in 4 or 5 of your Key Performance Measurements due to leverage and the cumulative effect of your improvements ndash you could improve both revenue and margin over 50
Letrsquos take a look at how small improvements can impact the bottom line
Metrics Masters wwwopenaircom
Revenue ndash the big revenue accelerators are increased sales productivity and improved bill rates With utilization you need to run your organization at a target billable utilization say 75 to cover your costs and produce margin but you may find that over utilization has the unintended negative consequence of negatively impacting customer satisfaction and attrition In the Revenue Quadrant the best accelerators are to improve your Sales Productivity ndash through better deal qualification better marketing better references better training and proposals If you improve your Sales Productivity you may also find your bill rates improve Billing rates are market sensitive but you can dramatically improve your realized bill rates through better estimating better project delivery better references and project quality Hourly bill rates almost always produce a higher margin than daily rates An interesting phenomenon is that a given increase in either utilization or bill rate has similar bottom-line impact The corollary is you cannot make a Services margin if you cannot charge at least double the fully loaded cost of your consultants or if your average billable utilization falls below 50
Margin ndash the best way to improve margin is to lower your costs and to make more margin on every facet of your business Curiously one of the easiest and best ways to improve margin is to increase the percentage of revenue delivered through subcontractors and ensure you make at least 40 margin on their work However be careful I have found the proper mix of direct to subcontract labor is about 30 subcontractors to 70 direct labor If you over-use subcontractors you may compromise delivery quality and put your client relationships and knowledge capture at risk You might be surprised how many practices do not adequately mark-up their subcontractors or bind them to the firmrsquos contract terms You donrsquot want to be in a situation where you are paying your contractors on a time and materials basis but charging your customers on a milestone basis
The other key margin lever is to reduce non-billable overhead and run a lean business I recommend zealously measuring and publicizing non-rebillable travel and expense If you are spending a fortune in travel for business development this is a clear indication you need to improve your marketing lead generation and deal qualification Improving your sales capture rates and sales productivity is a much lower cost alternative than chasing every deal that moves because your pipeline is weak
I like to set a ldquonon-billablerdquo expense target per person say $2500 per quarter This target may be too low for your business development staff but it is a good number for the overall regional organization and incents your team to carefully monitor telecom charges and those sneaky free meals Normally you should have very limited non-billable travel expense for your technical consulting staff
Customer Satisfaction ndash no matter the size of your organization you MUST keep a master Project Dashboard and have a mechanism for impartially tracking project quality Key metrics here are proposed vs actual hours per task milestone or deliverable Catch problems early ndash an overrun early in a project is a clear indication to reset expectations execute a change order or change the project manager Failed projects ruin your reputation and can have a devastating impact on profitability
Another key indicator of the health of your client base is the length of your payment cycle also called Days Sales Outstanding Most companies operate on a Net 30 day from billing payment schedule but slow payment is rampant in Professional Services A 10 improvement in DSO produces a 4 improvement in your cash flow
Finally the best way to improve Sales Productivity and Project Margins is to sell more projects to your product customers Just a 1 improvement in Services attached to product sales can produce big gains in revenue and lower the cost of sales Invest in Services Sales Compensation to incent your Product Sales force to include Services with every deal
Workforce Plan ndash One of the greatest financial levers you have is Retention Attrition is incredibly expensive On average it takes almost a year to recruit hire and ramp a productive new consultant ndash VERY EXPENSIVE This means you must be scrupulous with your hiring programs and invest in training to shorten that ramp time Your most important lever is to ensure your most productive (and most senior) consultants stay with your firm Create a compensation plan that incents them to develop new business new employees or infrastructure Treat them as your crown jewels not billable objects and find ways to reduce their travel burn
Metrics Masters wwwopenaircom
The other significant workforce lever is again reducing overhead I recommend a minimum 10 to 1 employee to management ratio Pay careful attention to your headquarters spend Designate an ldquoEnablementrdquo manager to create the internal curriculum employee training plan and orchestrate all internal training You will be amazed at how much further your training $$$ go with careful planning and central management
In summary there are innumerable levers for improved financial performance ndash pick 3 to 5 key metrics to improve each year and watch the money grow
About the Author
Jeanne Urich Service Performance Insight Managing Director is a management consultant specializing in Service organization improvement and transformation for small to large technology companies Her focus areas include Vision and Strategy Finance and Operations Human Capital Alignment Service Operations and Service Sales and Marketing She has been a corporate officer and leader of the Worldwide Service organizations of Vignette Blue Martini and Clarify responsible for leading the growth of their Professional Services Education Account Management and Alliances organizations She has a Bachelorrsquos Degree in Math and Computer Science from Vanderbilt University She serves on the Advisory Board of wwwpsvillagecom a preeminent on-line community for Services executives and is a Contributing Author of Tips from the Trenches the Collective Wisdom of Over 100 Professional Service Leaders She is also co-author of the ground-breaking new 2008 benchmark ldquoThe New Professional Service Maturity Modelrdquo Learn more at wwwspiresearchcom
Contact Jeanne at jeanneurichspiresearchcom or by phone at (650)342-4690
Implementing Practical Metrics for Breakthrough Professional and Consulting Services Results mdash by Randy Mysliviec President RTM Consulting
Introduction
Within the technology industry much has been written about Professional and Consulting Services operators Topics include Killer KPIs various ways to measure utilization and gross margin benchmarks and more mdash all metrics that are related to the needs of a Professional Services Organization (PSO) Receiving scant attention from the industry in the area of metrics and governance is the question of
How do you actually implement the metrics and make them work as intended
In this article we will examine the how of effectively implementing metrics and governance systems The applicability and design of cross-functional metrics will also be addressed since this is a critical aspect of designing metrics that can work effectively
Questions which will be addressed include
When designing metrics what operational considerations should I make Whats lacking in our approach today to KPIs and other metrics
Who should be involved in the metric setting and implementation process
How do I design the right kind of supporting incentives and compensation in support of my target metrics
Metrics Masters wwwopenaircom
How do I define metrics of each cross-functional organization to create incentives for collaboration
What does effective governance really mean and how do I operationalize it as part of a process
Can I measure what I want in an automated fashion with a good tool or will I have to measure everything manually
How do I know if the metrics I have selected will work Do our metrics create real incentives for cross-functional collaboration mdash or are our
organizations doomed to needless contention as a result of conflicting goals Are the metrics practical mdash or will it cost more money and take more time to measure than the
data is worth Will the metrics produce valuable information mdash or am I tracking something for the sake of
tracking it How will I use the data Are the metrics producing the intended result If not why not
How to Recognize Failing Metrics
My intention is not to create a new dictionary of terms for the PSO In describing how to use practical metrics to produce breakthrough results I am hoping to start by cutting through the confusion of terms and definitions that cloud our simple intent to develop a metrics mechanism to drive real and substantial progress Metrics KPIs measures stats and other terms are used either synonymously or independently In this article I will use the terms
Metric to describe something I want to measure
Goal to describe the result I am looking for
What you call these things is certainly less important than what you are measuring and the result you are looking for
Too many companies start the metrics development process with only a financial result in mind I certainly agree that the financial result is in the end the metric that matters to companies most however a singular focus on financials does not allow for proper consideration being given to the various tradeoffs of managing the entire PS ecosystem In other words there are other aspects of the operation that must be considered that may negatively impact financials while simultaneously increasing the odds for success
Below are real-life examples of ineffective metrics in play
1 Our finance team insists on the following primary measures For PS mdash higher gross margins while simultaneously asking the Sales team to dramatically grow revenues and cut back on related services marketing expenses The results have been consistent The Sales team defaults to giving away or selling services below market value to make more sales and our lack of investment in services marketing means we have insufficient investment to differentiate our services train Sales people and Consultants and position our services properly in the market Each year our gross margins suffer and in each succeeding year the cycle repeats itself until someone is fired
2 We spent millions getting a new time-keeping system in place to track where everyones time is going We monitor the employees to ensure that their timecards are submitted on time and we are proud of the fact that we can account for every hour of time spent at the end of each month Unfortunately we still have low utilization And sales people still think we dont support them enough What are we doing wrong
3 We measure our defect density for code development and we are very proud to report that less than 01 of our code has defects upon delivery to a customer Unfortunately we have low customer satisfaction and our average new customer has more than two dozen Severity 1 outages over the first
Metrics Masters wwwopenaircom
30-60 days that keep them from effectively getting any value from our system We really need to look into our field support quality
Do any of these sound familiar Each example demonstrates where metrics have been developed for cross-functional organizations without consideration for a cross-functional result In each case the particular company in question continued to produce the same inadequate result each year expecting mdash for some reason mdash that next year more pressure focus or both would produce a different result I have many more examples I could share but these should set the stage well for support of this article The issue in each case is simply poor metrics design lack of practical application of the metrics and failure to take the right corrective action to produce a different and more desirable result
A New Paradigm for How to Measure Success
Where do we begin in our efforts to find a better way to measure success By focusing on the interdependencies of the teams responsible for serving the customer and the most practical means of achieving your desired goals Elements of the new paradigm for metrics management include
1 Establishing a clear and agreed view of cross-functional dependencies to produce the desired financial result (achievement of goals)
2 Designing cross-functional metrics to ensure collaborative energies are placed where they are most needed
3 Designing metrics which are practical and measurable (preferably via automation from known sources of the data)
4 Making the metrics visible to everyone in the organization (real transparency of information) again via automated methods (eg a PSA tool excel spreadsheet etc)
5 Having decisive governance procedures to ensure corrective action is being taken while you still have time to affect the outcome
6 Aligning compensation with achievement of cross-functional goals
What is new about the new paradigm While each of the six elements is designed to work in a harmonious fashion the elements of cross-functional emphasis and practicality really separate what I believe are yesterdayrsquos metrics from those of successful PSOs of the future
Using the real life examples I described earlier lets examine each
In the first example PS set out to keep utilization high while insisting that the Sales team sells at the highest possible rates The Sales team under pressure to make an aggressive revenue goal wants to get lots of deals by selling on price while avoiding the extra work and time that goes into selling value And due to a lack of marketing investment the market was pre-conditioned to perceive the services as commodities as there was little substantive evidence to assign unique value to the services To meet its overall objectives the company should have linked the PS sales and marketing goals using common metrics that encourage the same result Sales and PS each should have had primary metrics for revenue and gross margins A better common view of necessary services marketing investment should have been established that investment should then be built into the gross margin or profit goals The services marketing function should have the gross margin and revenue metric as well to ensure their approach to differentiation of the service is validated by real market acceptance This approach also encourages the cross-functional teams to consider overall utilization which impacts gross margin and therefore provides incentive to the team to optimize utilization as opposed to simply trying to maximize utilization
Metrics Masters wwwopenaircom
In the second example the company did the right thing to effectively govern time entry and reporting What they failed to do was put at least as much focus on what the data was telling them Monitoring and analyzing the non-billable time buckets is essential to high utilization The data told them too much time was being spent on innocuous activities like staff time or business development without a real understanding of what value if any those activities were contributing to the desired result The governance processes of the company related to managing non-billable time was nearly non-existent yet non-billable time accounted for more than 40 of their total labor cost
In the third example defect density was used as a primary indicator of quality While measuring the number of code defects may be a good starting indicator of quality it is of little value if even a small number of defects cause customer outages particularly long outages A primary metric of quality might be customer experienced defects (with severity levels) in the first 90 days and the time the company takes to eliminate the defects I am not suggesting that quality metrics are not important early in the development process however the customer experience must be at the top of the priority list for the development team and all other functions involved with designing and delivering a solution to the customer
The Goal Setting and Metrics Development Process
Building your metrics and processes to achieve consistently high performance requires senior management commitment to the need for cross-functional goal setting and metrics development Without such a commitment even the best of intentions will produce sub-optimized results and frustration on behalf of all involved
Here are the recommended steps for developing your metrics and governance process
1 A good place to start is with the end goal(s) in mind Goal setting processes certainly vary by company so whatever your process is the key to success is strong collaboration Set goals that recognize the interdependencies of the cross-functional teams responsible for the result Figure A illustrates some of the interdependencies to consider
Metrics Masters wwwopenaircom
In the typically annual goal setting process these cross-functional organizations should consider these types of interdependencies to set goals that are mutually supportive realistic and practical For example in setting a revenue goal one must consider pricing to the customer size of the deal capacity to deliver competition maturity of the services (do I have beta or production customers yet) and so on The revenue goal would then be based on Marketing andor Sales forecasts of opportunity or expected yield and balanced with delivery capabilities
2 Next develop your cross-functional metrics Of primary concern here is to develop metrics that provide sufficient incentive for each departmental team to contribute to the broader organizational goals It is also important to measure those things which can be measured by practical means and preferably automated to minimize human error and time delays for critical management information Figure B illustrates some cross-functional metrics For clarity these are metrics (what I am measuring) not goals (the result I am expecting)
The examples shown above may not be the right ones for your situation As simple as it may seem many organizations do not have nor are they committed to achieving this level of organizational alignment on metrics It is okay for each organization to have some metrics and goals that are dissimilar provided they are not conflicting (eg asking the organizations to accomplish things that create undesirable behavior) Too many organizations rely on the good teamwork theme to overcome poorly designed goals and metrics While good teamwork is essential in any multi-personfunction operation aligning incentives is a sound structural way of encouraging good teamwork in a disciplined fashion
In the Figure B example the synergies are clear
Sales need to sell lots of deals PS needs to deliver the revenue
Metrics Masters wwwopenaircom
Sales needs to help drive utilization amp $ rates PS needs to manage resources and costs
Sales needs to sell deals that are realistic PS needs to deliver as promised with quality
Similar contrasts could be drawn between Marketing and Sales or other combinations of the three functions mentioned
3 Develop effective governance methods Determine how information will be disseminated evaluated and acted upon as needed One common inhibitor I see in many companies is the failure to make ALL information transparent to the cross-functional teams Organizational protectionism is alive and well in the corporate world and unfortunately keeps many companies from achieving high levels of performance due to inaction where corrective action is needed Some simple guidelines that can help with this process
o Gain senior level commitment to the principle of transparent information dissemination o Set up a corporate dashboard to display cross-functional metrics to the cross-functional teams o Establish an oversight entity made up of cross-functional management to review progress
discuss issues and prioritize corrective actions
Another key element of governance is the process of tying appropriate compensation elements to the achievement of specific cross-functional goals This is a very important and under-utilized tool in ensuring proper incentives are in place to support overall organizational needs and expectations
Making Governance Processes Work
Perhaps the most difficult aspect of making governance work is achieving a true team-based approach to change and performance management If you have done the right job of setting collaborative goals establishing meaningful metrics and tying in appropriate compensation incentives will go a long way in bridging departmental walls by creating natural incentives to break down these barriers
Data based management is also a very effective tool since data is hard to argue with Using industry best practices for root cause analysis then focuses on the issues and not people or personalities although some of the data may point exactly in that direction in some cases Make sure that any evaluation and analysis is conducted by cross-functional teams using the interdependencies established in the goal setting process as a baseline (reminder) of important tradeoffs
Summary
Implementing practical metrics for breakthrough results like most other business activities comes down to innovation creativity process and discipline good team work and effective execution Perhaps the most powerful aspect of the methods I have described in this article is that if the process is followed you will gain the benefit of aligning motivations and expectations of people in a highly competitive world I believe such an approach is always a formula for success
About the Author
Randy Mysliviec leads RTM Consulting providing high impact advisory services for technology companies professional and consulting service businesses RTM Consulting provides strategic and operational advice helping technology companies increase revenues grow profits and deliver best-in-class solutions by leveraging professional and consulting services more effectively Acknowledged by industry sources as an expert in Global Resource Management (GRM) Randy helps multi-national companies with the complex challenge of operating professional services teams serving the global market
Metrics Masters wwwopenaircom
Prior to establishing RTM Consulting Randy was SVP Consulting and Professional Services for Convergys successfully managing and growing a multi-hundred million dollar business with 1600 employees in 31 countries across six continents Randy began his career with 18 years at IBM serving in a variety of sales marketing and general management roles Randy was also President and CEO of a successful start up services firm in the Carolinas He is a founding member of the Technology Professional Services Association (TPSA) and served as a member of the TPSA Advisory Board Randy is also an active and contributing member of PSVillage
Randy can be reached at randyrtmconsultingnet or 513-236-5585
Metrics Masters wwwopenaircom
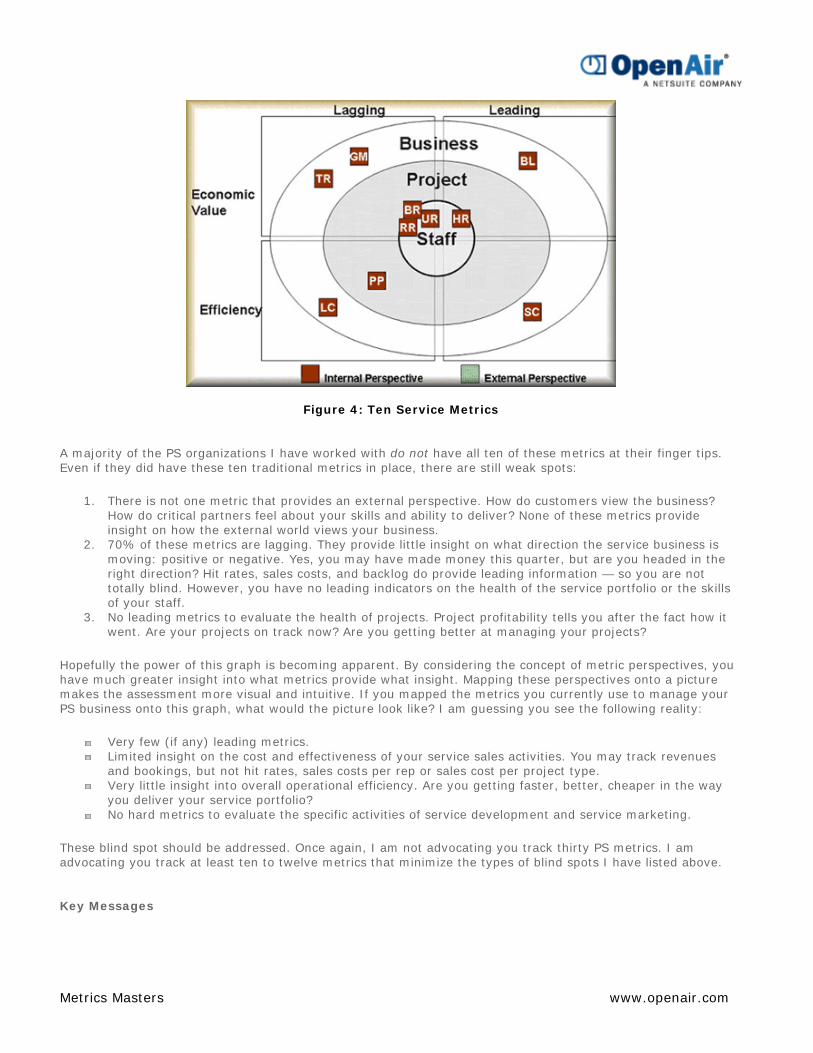
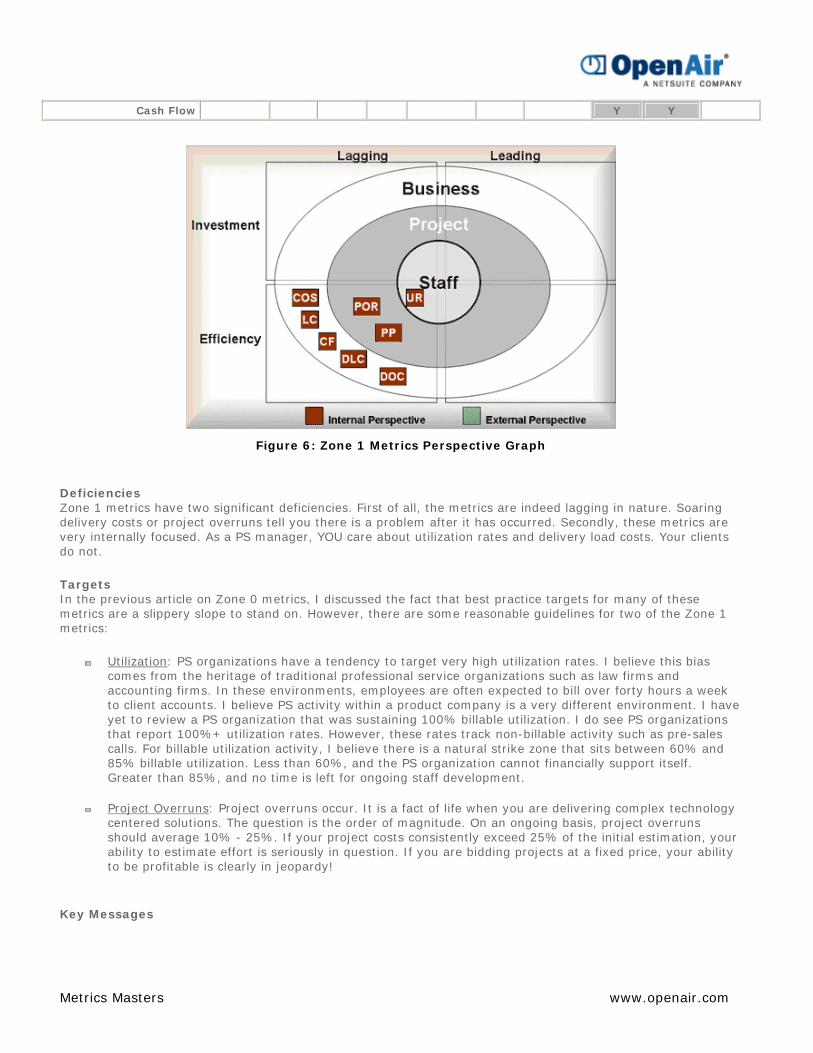
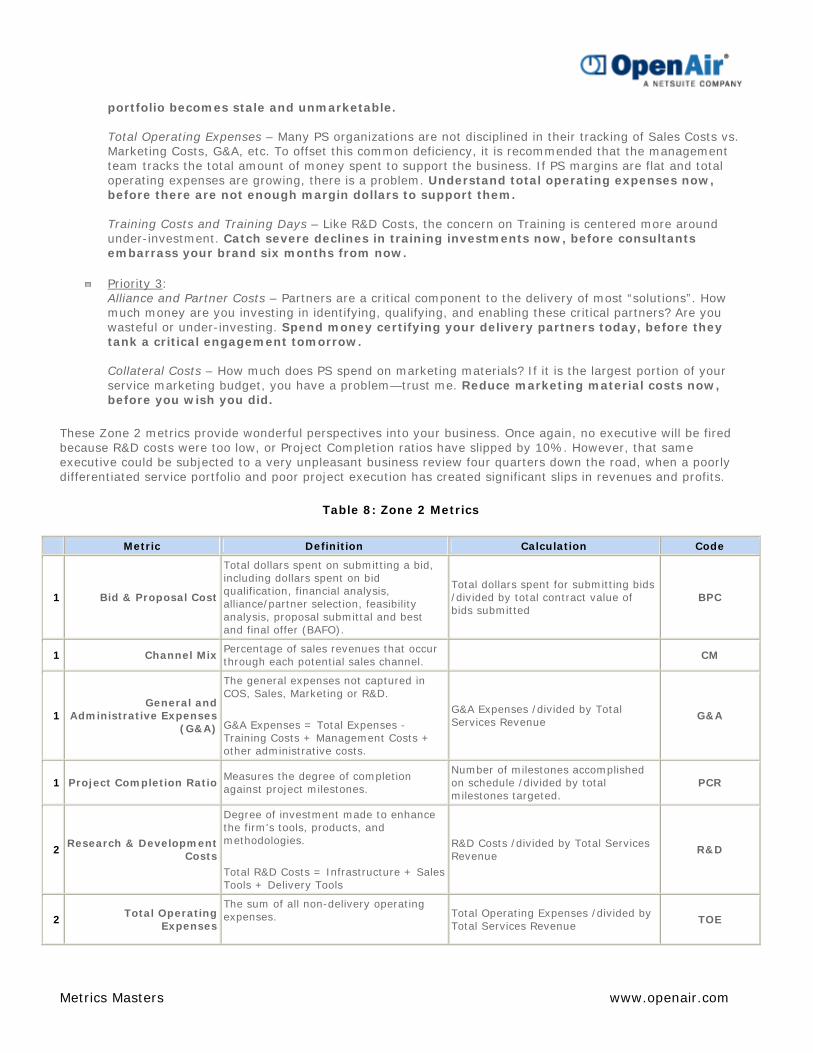
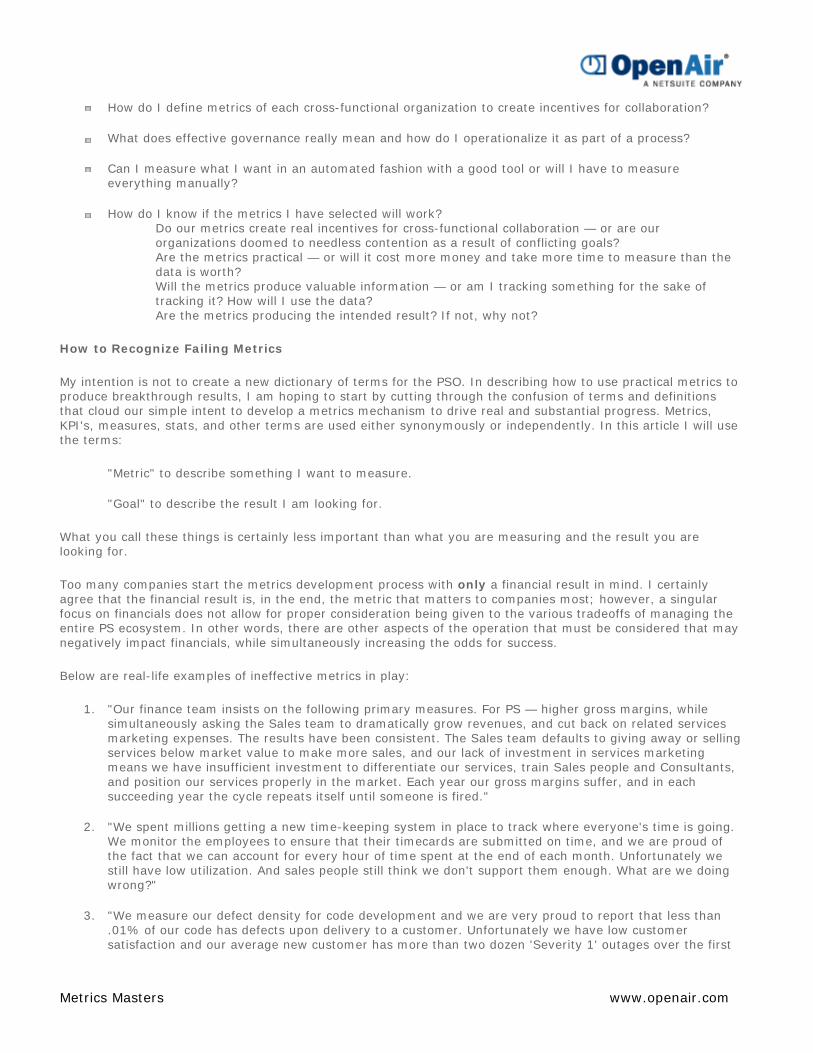
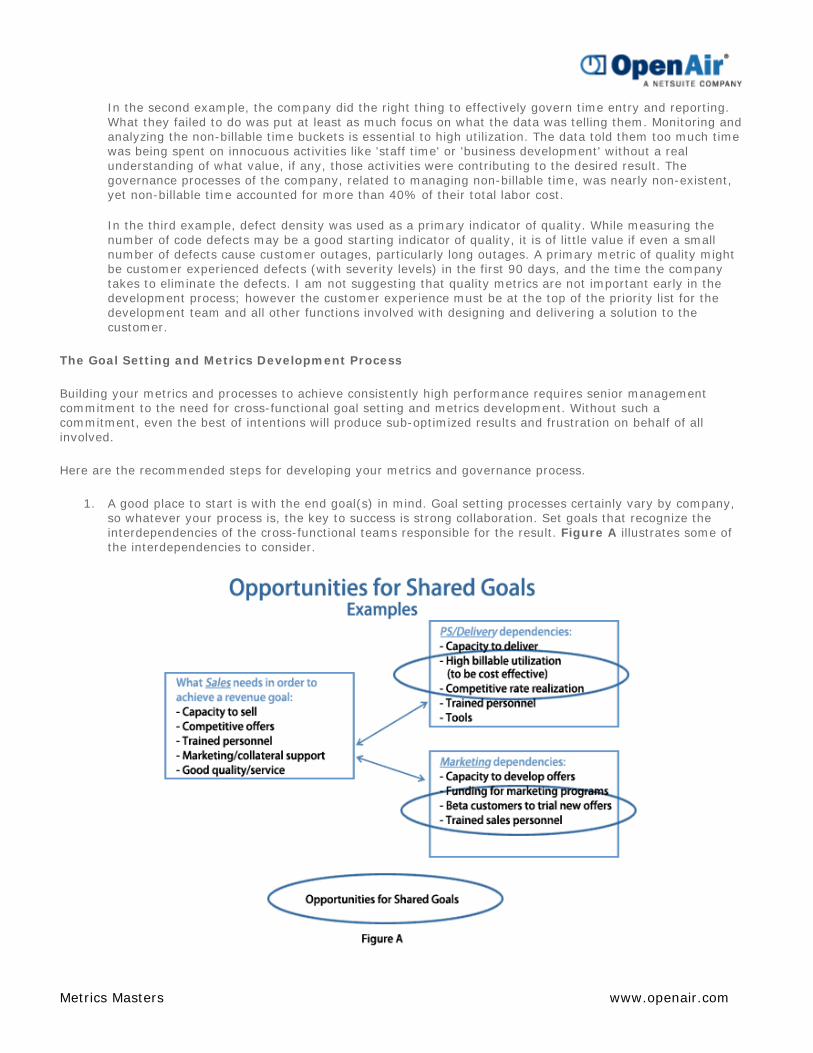


![Measure for measure: metrics and marketers in the NHS · 2019-12-17 · [2] The Chartered Institute of Marketing Measure for measure: metrics and marketers in the NHS [3] executive](https://static.fdocuments.in/doc/165x107/5f080d027e708231d42015b1/measure-for-measure-metrics-and-marketers-in-the-nhs-2019-12-17-2-the-chartered.jpg)