Metrics for agile requirements definition and management
133
Metrics for agile requirements definition and management Nina Jussilainen Final Thesis YTI degree programme 2013
Transcript of Metrics for agile requirements definition and management

Metrics for agile requirements definition and management
Nina Jussilainen
Final Thesis
YTI degree programme
2013

Abstract
Author(s) Nina Jussilainen
Degree programme Master’s Degree Programme in Information Systems Management
Thesis title Metrics for agile requirements definition and management
Pages and appendix pages 113 + 5
“You Can't Manage What You Don't Measure” (Origin unknown) was the starting point for this research. The goal of this research was to define metrics to support and monitor the requirements defi-nition and management in the Alusta P2P Invoice automation and Procurement product de-velopment in the target organization. The research was conducted as a constructive research including document analysis, inter-views and facilitated workshop and it was done during June 2016-December 2016. Theory around agile software development, agile requirements definition and management and metrics was gathered to support the construct. First the research defined the requirements definition and management process for the target organization to mirror the metrics against it. The most important measure found during the research was whether the feature is validated with users and enhanced accordingly before implementation or not. With this metric or gate keeper it would be possible to use the customer acceptance as the key measure and in-crease the validated learning about customers as lean movement suggests. Minimum mar-ketable feature sets could be validated with users too. In the target organization it would be important to deploy the new design process well in use. To monitor the success, completing the steps on feature level could be measured to view the trend of improvement and it’s impact to the feature quality and efficiency. Enhancing the data analytics of the service production data would improve both the RDM process and the product quality and cost-efficiency. Through following the feature quality, it would be possible to explore and find the lean, waste-less way to do the discovery of the requirements via comparing the used RDM techniques and completed process phases to the quality of the outcome of the feature. Defining the RDM specific objectives against the current KPI’s could help to achieve better results with them. Evaluating business value and measuring organizational learning were left as areas of future research.
Keywords Requirement, Requirements definition, Requirements management, Agile, Metrics, measur-ing

Tiivistelmä
Tekijä(t) Nina Jussilainen
Koulutusohjelma Tietojärjestelmäosaamisen koulutusohjelma
Opinnäytetyön otsikko Ketterän vaatimusmäärittelyn ja -hallinnan mittaaminen
Sivu- ja liitesivumäärä 113 + 5
“Et voi johtaa sitä mitä et mittaa” (Alkuperä tuntematon) oli tämän tutkimuksen lähtökohta. Tutkimuksen tavoite oli määritellä mittareita tukemaan ja tarkkailemaan vaatimusmäärittelyä ja vaatimusten hallingaa Alusta P2P Laskuautomaation ja Hankintojen hallinnan tuotekehityksessä kohdeorganisaatiossa. Tutkimus on konstruktiivinen ja se on toteutetttu dokumenttianalyysien, haastattelujen ja fasilitoidun työpajan avulla. Tutkimus on tehty Kesäkuun 2016 ja Joulukuun 2016 välillä. Teoriaa konstruktia tukemaan on kerätty ketterän sovelluskehityksen, ketterän vaatimusmäärittelyn ja vaatimusten hallinnan ja mittareiden alueelta. Aluksi tutkimus määritti vaatimusmäärittelyn ja -hallinnan prosessin kohdeyritykselle, jotta mittareita olisi helppo peilata sitä vasten. Tärkein tutkimuksen aikana löydetty mittari on onko toiminto vahvistettu käyttäjien kanssa ja tarvittavat korjaukset tehty ennen kehittämisen aloitusta. Tällä mittarilla tai portinvartijalla voidaan saavutaa asiakashyväksyntä tärkeimpänä mittarina ja lisätä leanin ehdottamaa vahvistettua asiakkaista oppimista. Pienimmät markkinotavat toimintokokonaisuudet (Minimum marketable feature) voitaisiin myös vahvistaa käyttäjien kanssa. Kohdeorganisaatiossa tärkeä kehityskohde olisi jalkauttaa uusi prosessi hyvin. Prosessin vaiheiden toteutumista voitaisiin seurata toimintokokonaisuuksien tasolla ja seurata kehitysvaiheiden suoritustason vaikutusta toimintojen laatuun ja tekemisen tehokkuuteen. Palvelun käyttödatan analysoinnin kehittäminen parantaisis vaatimuusmäärityksen ja vaatimsuten hallinnan prosessia ja tuotteen laatua ja tekemisen tehokkutta. Toimintokokoonaisuuksien laadun seuraamisen avulla olisi mahdollista etsiä ja löytää lean, hukaton tapa tehdä vaatimusten löytämisvaihetta vertaamalla käytettyjä vaatimusmäärittelyn ja -hallinnan tekniikoita saavutettuun tuloksen laatuun. Vaatimusmäärittelyn ja hallinnan päämäärät voitaisiin määrittää tarkemmin nykyisiä KPI:tä vastaan ja näin saavuttaa mittareiden parempi laatu. Liiketoiminnan tuottaman arvon määrittäminen ja organisatorisen oppimisen mittaaminen on jätetty jatkotutkimuksen aiheiksi.
Asiasanat vaatimukset, vaatimusmäärittely, vaatimustenhallinta, ketterät menetelmät, mittarit, mittaus

Contents
1 Introduction ................................................................................................................... 1
1.1 Subject and goal ................................................................................................... 1
1.2 Research problem ................................................................................................. 2
1.3 Target Organization .............................................................................................. 2
1.4 Limitations/exclusions ........................................................................................... 5
1.5 Approach and Methods ......................................................................................... 5
1.5.1 Constructive research ................................................................................ 5
1.5.2 Interview .................................................................................................... 7
1.5.3 Document analysis ..................................................................................... 8
1.5.4 Observation ................................................................................................ 8
1.5.5 Group discussion – falicitated workshop .................................................... 9
2 Measuring the agile requirements definition and management in the enterprise
software development ...................................................................................................... 12
2.1 Agile software development in an enterprise ....................................................... 12
2.1.1 Knowledge management .......................................................................... 13
2.1.2 Web user needs ....................................................................................... 14
2.1.3 Application Lifecycle Management (ALM) ................................................ 15
2.1.4 Agile ......................................................................................................... 17
2.1.5 Scaled Agile Framework (SaFe) ............................................................... 21
2.1.6 DevOps .................................................................................................... 22
2.1.7 Trust-Ownership model ............................................................................ 24
2.1.8 Processes ................................................................................................ 26
Generic Agile model .............................................................................................................. 27
The lean product process ...................................................................................................... 29
Build-Measure-Learn loop .................................................................................................... 29
Iterative development approach .......................................................................................... 31
Double diamond design process ........................................................................................... 32
Analysis with agile mindset ................................................................................................... 34
2.1.9 Value ........................................................................................................ 36
Goals and objectives ............................................................................................................. 36
Return on investment (ROI) .................................................................................................. 37
Cost of bugs ........................................................................................................................... 37
Attractiveness ....................................................................................................................... 40
2.2 Agile requirements definition and management................................................... 41
2.2.1 Agile requirements definition and management process .......................... 43
2.2.2 Requirements definition process .............................................................. 44
Need/Problem ....................................................................................................................... 46

Solution/Design ..................................................................................................................... 46
Feasibility of a systems request ............................................................................................ 48
Definition of Ready ............................................................................................................... 49
Hypothesis-driven development ........................................................................................... 50
2.2.3 Requirements management phases ......................................................... 51
2.3 Metrics ................................................................................................................ 54
2.3.1 Qualities of the metrics ............................................................................. 56
2.3.2 “What you measure is what you’ll get” ...................................................... 58
2.3.3 Examples of metrics and their impact ....................................................... 59
2.3.4 Successfull metrics .................................................................................. 62
2.3.5 Enterprise balanced score card ................................................................ 66
2.3.6 Lean portfolio metrics ............................................................................... 66
2.3.7 Business value ......................................................................................... 67
Value velocity ........................................................................................................................ 68
Purpose alignment model ..................................................................................................... 68
Agility Index ........................................................................................................................... 70
2.3.8 Customer satisfaction ............................................................................... 71
Usability testing .................................................................................................................... 73
Surveys .................................................................................................................................. 73
Net promoter score .............................................................................................................. 73
Kano analysis ......................................................................................................................... 74
A/B testing ............................................................................................................................ 75
Data analytics ........................................................................................................................ 76
2.3.9 Employee engagement and satisfaction ................................................... 76
3 Agile requirements management in Basware P2P development ................................. 79
3.1 Company strategy ............................................................................................... 79
3.2 Alusta development model .................................................................................. 80
Feature development lifecycle ............................................................................................. 80
Alusta P2P Requirements Management model .................................................................... 81
Program/Project management ............................................................................................. 82
Design drivers ........................................................................................................................ 82
Double diamond design process ........................................................................................... 83
3.3 Current metrics ................................................................................................... 83
3.3.1 Interview over current metrics .................................................................. 83
3.3.2 Document analysis over current metrics ................................................... 84
3.4 Management interview over current situation ...................................................... 84
3.5 Workshop for recognizing valuable metrics ......................................................... 86
3.5.1 Beginning ................................................................................................. 86

3.5.2 Clarification .............................................................................................. 88
3.5.3 Planning the solutions .............................................................................. 92
3.5.4 Preparing to act ........................................................................................ 93
3.5.5 Closing ..................................................................................................... 93
3.6 Conclusions ........................................................................................................ 94
Requirements definition and management process ............................................................ 94
Current KPI’s ......................................................................................................................... 98
Metrics .................................................................................................................................. 99
4 Results and Discussion ............................................................................................. 106
4.1 Conclusions ...................................................................................................... 107
4.2 Development suggestions ................................................................................. 108
4.3 Suggestions for additional research .................................................................. 110
4.4 Reliability and ethicalness ................................................................................. 110
4.5 Evaluation of the final thesis process and own learning .................................... 111
References .................................................................................................................... 114
Appendices .................................................................................................................... 121
Appendix 1. Summary of the key concepts ................................................................ 121
Appendix 2. Interview questions ................................................................................ 124
Appendix 3. Quick survey questions in the workshop ................................................ 125
Appendix4: Business Model Canvas ......................................................................... 125
Appendix 5. Lean Canvas ......................................................................................... 126
Table of figures .............................................................................................................. 126

1
1 Introduction
This research dives into the agile requirements definition and management from the met-
rics point of view in context of scaled agile software development of enterprise application.
Goal is to find metrics to support the managing and monitoring the requirements definition
and management in the target organization.
Literature around agile software development, agile requirements management and met-
rics is gathered to support the construct of this research.
Empirical part of this research consists of studying the current state of the requirements
management and used metrics in the target organization and exploring the beneficial met-
rics with help of literature, facilitated workshop and discussions.
The output of this study is the justified suggestion for the metrics to the agile requirements
management in the target company.
1.1 Subject and goal
The original research question “What to measure of agile requirements management and
why?”, was originally raised in the target organization with the old saying “You Can't Man-
age What You Don't Measure” (Origin unknown).
Subject is currently important to the target organization since there are no metrics in use
for requirements management at the moment, existing metrics only measure the applica-
tion lifecycle management process from the software development life cycle point of view.
Also the new Double diamond design model has been introduced to the organization and
brings some new details to the RDM process.
Subject is broad and multi-dimensional. It covers both Agile methods, requirements defini-
tion and management and metrics to be orchestrated in a challenging environment where
the international software is developed for all customers in an enterprise environment,
with the challenge of large scale, multi-project, multi-site and multi-culture.
In this research, I aim to recognize the possible valuable metrics for agile requirements
definition and management in the target organization and justification for them. I also aim
to point out the pitfalls that should be avoided when building the metrics.

2
The goal of this research is to understand agile, requirements management and metrics
better, mirror them in to the context of the target organization and in the end, define the
valuable metrics for agile requirements management in the target organization, if any fea-
sible metrics can be found. The possible metrics should help the target organization to
follow the development of the measured functions and find the ways to improve the quality
and efficiency of both, the quality of the product and ways of working. Metrics also help
the organization to follow the trends of the functions.
1.2 Research problem
In this research the area of agile software development and agile requirements manage-
ment is explored with a research question “Measuring the agile requirements definition
and management in the enterprise software development – what to measure and why?”.
The research aims to find an answer to following questions:
- Why should we measure the agile requirements management?
- What should we measure of the agile requirements management?
- What answers can the measurements give?
- How do we analyze the results and why?
- How do the results end up into concrete actions for improvement?
To view the metrics in the context, the scaled agile software development of enterprise
application is defined based on the available theory including the definitions for Agile,
Lean, Enterprise, Requirement and Agile Requirements Definition and Management.
To understand the soul of metrics and agile metrics, they are described with their benefits
and dangers.
1.3 Target Organization
This research is done for Finnish company called Basware (Basware webpages. 2016a.)
that was founded in 1985 and now provides networked purchase-to-pay solutions, e-
invoicing and innovative financing services for companies to simplify and streamline their
key financial processes, strengthen control, reduce costs and boost cash flows.
Basware (2015.) has over 1 million organizations using Basware’s solutions in over 100
countries connected via the open and global Basware Commerce Network.

3
From the largest enterprise to the smallest supplier Basware helps companies unlock new
efficiencies and gain greater visibility and control over their business. They offer packaged
solutions for SMBs, and tailored solutions for enterprises. (Basware.2016d.)
According to Basware Strategy (Basware. 2015.) cloud revenue growth is Basware’s pri-
mary objective and where long term value in our business will be created. This is to be
achieved among other things by simplifying operations and improving underlying profitabil-
ity.
Basware (2016) offers solutions for following areas (Figure 1-1):
- NETWORK - e-invoicing solutions & operator between buyers & suppliers.
- PURCHASE TO PAY - Invoice automation, Procurement, Travel and Expense
software.
- FINANCING SERVICES - New value added innovations – Basware pay, Basware
discount and Basware advance
Figure 1-1 Basware Product areas (Basware, 2016)
Basware Purchase-to-Pay business area consists of the following product areas: Ac-
counts Payable automation, Procurement, Travel & Expense management and Analytics
(Figure 1-2):

4
Figure 1-2 Basware Purchase-to-Pay suite (Basware. 2016)
This research is focused to the Purchase-to-Pay business area product development and
requirements management in AP automation and Procurement areas.
AP automation is a feature-rich and configurable Accounts Payable solution to
automate the most demanding global processes. AP automation is totally paperless, in-
cludes advanced invoice approval automation, reviewing and approving invoices also on
mobile devices and forecasting to manage working capital and cash flow. With AP auto-
mation it is possible also automate matching of invoices, purchase orders and payment
plans. (Basware. 2016c.)
e-Procurement is for increasing spend under management, realizing significant cost
savings, and increasing supplier value. e-Procurement enables consumer-style shopping
experience with one-click catalog purchasing, flexible free-text forms to manage services
procurement and capture input, configurable workflows for increased compliance and con-
trol and constant access from mobile and tablet devices. e-Procurement also provides
actionable spend and procurement analytics with data visualization. (Basware.2016c.)
Basware Purchase-to-Pay service is developed by several project teams that are scat-
tered in Espoo, Tampere and Pori in Finland and Chandigarh in India. Multi-team, multi-
site, multi time-zones, multi-cultures create a complex environment for software develop-
ment.

5
Service itself is available all over the world. It has been localized to several languages and
follows regional settings for data formatting. The document detail fields and workflow pro-
cesses can be configured up to certain extent. New parts of the product follow responsive
design.
Product development is driven by legislation and business rules, UX guidelines to reach
the best user experience and need for consistency through the parts of the product, lega-
cy backend and cloud architecture and continuous delivery in SaaS.
1.4 Limitations/exclusions
This research is focused to product development and agile requirements definition and
management of the Purchase-to-Pay business area AP automation and Procurement de-
velopment in the target organization. Product deployment and customer support are ex-
cluded from this research.
Validation of the result of the construct is excluded from this research. This research only
provides the construct of the metrics suggested for the target organization.
1.5 Approach and Methods
This research is qualitative. Ojasalo (2014) states that qualitative methods have been
used in scientific research when researching the subject that is not familiar beforehand
and that is wanted to be understood better. When using qualitative method, the goal is to
gather lots of information from the narrow subject and that way understand the phenome-
non better and holistically. Baseline for qualitative research is describing real life. Re-
searcher is usually very close to the target and often even takes part to their work. Re-
searcher makes his own justifiable interpretations about the phenomenon. Justifications
support the reader to make conclusions about the reliability of the research. (Ojasalo.
2014)
In ‘Insightful-Traditional’ model the base of the knowledge is separated from the methods
and the results. It includes summaries and citations from the source materials, but in addi-
tion to that also the own thoughts of the writer. (Ojasalo and others, 2014, p. 35)
1.5.1 Constructive research
Constructive research method was selected since there is a need to research the existing
theoretical information and combine it with the new empirical knowledge gathered from

6
the target organization. Ojasalo and others (2015, p. 65) suggests constructive research
for that kind of a case. They also state that constructive research is a good technique
when creating something concrete like a plan, metrics or a model. The goal of this re-
search is to create metrics.
According to Ojasalo and others (2014, p. 65) constructive research aims to practical
problem solving by creating a new structure that is evaluated against the benefits it pro-
vides to the practical work. According to them, constructive research aims at providing
theoretically argumented solution to a practical challenge but it also aims at bringing new
information to scientific community. These goals are valid for the research in question.
In constructive research it is important that the practical challenge and the solution are
linked to the theoretical information. It is also important to proof that the solution works, in
the best case even outside of the target organization. It is not always easy to proof that
the solution works in action. (Ojasalo and others, 2014, p. 65).
According to Kasanen, E., Lukka, K. and Siitonen A. (Ojasalo and others, 2014, p. 67)
constructive research process consists of following stages:
1. Finding a meaningful question
2. Acquiring deep theoretical and practical knowledge about the target of the re-
search and development
3. Composing the solutions
4. Testing the functionality of the solution and indicating the validity of the construc-
tion
5. Showing the solutions connections to the theory and showing the novelty value of
the solution
6. Examining the width of the solution in the field of application
This research concentrates to the three first stages of this constructive research process.
Documenting the phases is important in the constructive research. In addition to that the
method’s that has been used have to be reasoned always. Implementation challenge
must be clearly stated and written and the goals of the research must be clearly ex-
plained. In the end of constructive research, the alternative solutions must be introduced,
evaluated and the selected solution must be justified understandably. Developed solution
can be evaluated in practice meaning in the organization or in the market. There are three
different levels of market tests to test the solution made by the structure. In practice the

7
functionality of the solution may be evaluated also later on. (Ojasalo and others, 2014, p.
67-68)
Constructive research does not disqualify any method so various methods may be used.
Observation, group discussions, survey and interview are typical methods used in this
approach. In addition to the previous, co-operation is important. Usually it is relevant to
know well the needs of the future users. In those cases it is profitable to take some of the
future users along to the development process at the early phase. For example brain-
storming or group conversations can be hold with the users at the different phases of the
process. (Ojasalo and others, 2014, p. 68)
In constructive research the researcher or the developer is always also a change agent,
whose role is to influence strongly in the environment in question. In addition to the role of
a change agent, the researcher or developer may act as a support person for the learning
process and a contributor for the learning as on action research. (Ojasalo and others,
2014, p. 68)
1.5.2 Interview
Interview was selected as a method, since the research target is not very well known and
the interview enables gathering material that opens new aspects to the subject (Ojasalo
and others, 2014, p. 106). They also state that the mission of an interview may be clarify-
ing the issue or get deeper understanding about the issue. Interview was used to find out
the current metrics in use in the target organization and for evaluating the management
vision and opinion over requirements definition and management and metrics to figure the
focus for the theoretical part of the research.
According to Kananen (2015, p. 143) interview is beneficial especially when deep and
broad information is needed. He states that interview is a good tool when researching a
phenomenon tied to present time. He also describes the interview as a very flexible tool
where the researcher can guide the user to understand the questions better or add new
questions to the interview if it feels appropriate. He describes that disadvantages of an
interview are slowness, costs and possibility of the interviewer to affect to the interviewee
by guiding the interviewee, selecting the subjects under discussion and select subjective-
ly.
In this research both non-structured and half-structured interviews (Kananen 2015) are
used for gathering the background information and getting to know the current state of the

8
requirements management and metrics in the organization. Both requirements manage-
ment and metrics themes were discussed in the interviews. In the interview about the cur-
rent metrics the Quality Assurance Director and Operations and Development Director
were interviewed, since they were the experts of the current metrics.
For the analysis of the atmosphere about requirements management, development meth-
ods and metrics both Senior Vice President of the organization unit and Directors of Prod-
uct management, R&D, Quality Assurance, User Experience and Operations and Devel-
opment in Purchase to Pay Business area organization were interviewed. In addition to
those the Senior Manager of Requirements Management in the other organization unit
was interviewed for light internal benchmarking point of view.
Interviews were conducted one-to-one. Most of the interviews were conducted face-to-
face, but few of them on-line through Skype call due to the long distance between the par-
ties and taking into account that interviewees were already familiar to the interviewer.
Results of both interviews were recorded by writing the discussion down during the inter-
view. Even if the amount of the interviewees was not high, the managerial interview was
transcribed by summarizing (Kananen, 2015, p. 163) and segmenting and coding (Kanan-
en, 2015, p. 163). The coded contents were then compared to the theory and each other
to analyze the results in the organization context and in global context.
1.5.3 Document analysis
Document analysis is used for drawing conclusions especially from verbal, symbolic or
communicative material that has been converted into written format, like interviews, www
pages, articles form the magazines, memos from ideation meetings, diaries, photos, draw-
ings, speeches, discussions, reports and other written material (Ojasalo and others, 2014,
p. 136). In this research document analysis technique has been used for analyzing the
interview results, reports over current metrics and the material provided in the workshop.
1.5.4 Observation
The researcher has been employed by the target organization for 16 years, closely with
the requirements management for 5 years. Researcher aims to objectively observe the
target organization continuously while performing her daily work.
Participative observation where observer participates into the functions of the target under
research in the role of the employee or customer is used. In participative observation, the

9
observer influences as little as possible to the activities and the interaction is led by the
terms of target itself. (Ojasalo and others, 2014, p. 116)
Observation is done unstructured since as much information as possible and in as large
scale as possible is wanted to be gathered. Theory related to the phenomenon is utilized
and the assumptions of possible impacts to the phenomenon under research are derived.
(Ojasalo and others, 2014. P. 116)
According to Ojasalo and others (2014, p. 116) the goals for observation needs to be de-
fined and the accuracy for the observation needs to be set. In this research the goal of the
observation is to build the bridge between the theory and the daily work by observing the
daily work. The researcher participates in the daily work as normally, but also finds new
research paths through the work.
1.5.5 Group discussion – falicitated workshop
Group discussion was selected for ideation with all stakeholders and for sharing the
knowledge and developing the new knowledge. In creative problem solving process the
ideation and evaluation are separate actions. Evaluation kills ideation and motivation to
produce new viewpoints. Characteristic for the process is that the most conventional ideas
are usually raised first. The ideas squeezed after the conventional ideas are gone through
are most probably new ideas. From the aspect of delivering creative solutions it is im-
portant to recognize and approve that quantity creates quality. (Ojasalo and others. 2014.
p. 158)
Higgins (Ojasalo and others, 2014, p. 159) introduces the process for creative problem
solving:
1. Identifying the problem or possibilities for improvement
2. Recognizing the related facts and opinions
3. Setting goals and visioning
4. Producing the approach and ideas
5. Evaluating the ideas and selecting the solution
6. Getting approval and implementing
Nowadays, in the word becoming faster and faster more complex, all experts in the organ-
ization, in addition to managers, should be taken along into the creative process of gener-
ating ideas. This requires some inspiration and activation, encouragement and creativity
which can easily be achieved in facilitated workshop. (Kantojärvi. 2012. p. 11)

10
Kantojärvi (2012. p. 11) introduces facilitation as a neutral guiding of the group process.
The job of a facilitator is to help and encourage the team to work without taking part into
the contents of the discussion. He plans the group work process and picks the most suita-
ble tools for it and makes sure that the capacity of the whole team is efficiently exploited,
to meet the goals set for the event.
Kantojärvi (2012. p. 29-30) describes the creative problem solving process as the struc-
ture for a facilitated workshop as follows:
1. Beginning
2. Clarification
3. Planning the solutions
4. Preparing to act
5. Closing
She describes the steps like this:
In the beginning, it is important to create secure atmosphere, so that everyone feels com-
fortable attending. The beginning helps the attendees to tune in the creative thinking and
comprehensive presence. The beginning sets the focus: why am I here, what is going to
happen and how, what are the roles of the actors and the rules of the game and what is
the meaning and the goal for the event.
Clarification phase consists of defining the challenge, gathering the knowledge and speci-
fying the problem. The phase clarifies where we start from and what the focus is for the
event. In this phase it is possible to create understanding over the focus defined in the
starting phase and go through possible concerns related to that. In this phase it is also
possible to figure out what do we already know about the subject and how the problem
was tried to solve before. In this phase questions around the subject are surveyed and the
question describing the core problem is selected.
Planning the solutions phase consist of throwing ideas and the development. In this phase
ideas are generated and if possible try to tear away from conventional thinking to enable
the creative thoughts. When ideas are found, they are selected and refined further to solu-
tions. Solutions are analyzed and mirrored to the original question.
Preparing to act phase is about the concrete actions. Deploying the solution is planned
and plan for to possible change resistance is prepared.

11
In closing phase the success of the workshop is evaluated, by questioning how were the
goals and expectations met. Plan over next steps is done and the workshop is ended with
good spirit.

12
2 Measuring the agile requirements definition and management in
the enterprise software development
Defining and managing requirements is a tight share of the software development. The
nature of both requirements and development changes with the agility and continuous
delivery. The target organization utilizes agile methods in the software development,
works in the large-scale and produces enterprise software. Requirements management
has been agile for a while in the target organization, but there is room to improve. The
double diamond design model has just recently been introduced to the organization as the
basis for the requirement discovery and solution validation. The research aims to find the
answer to how to set the metrics against the requirements definition and management.
This chapter aims to enlighten the requirements definition and management and metrics
in scaled agile enterprise software development.
2.1 Agile software development in an enterprise
“Change is the only constant” (Origin unknown)
To keep up with the changing world and priorities, it is important to be agile in software
development nowadays. Splitting the work in small junks and prioritizing them flexibly al-
lows the company to change directions according to the business needs.
Agile Software Development is an umbrella term for a set of methods and practices based
on the values and principles expressed in the Agile Manifesto. Solutions evolve through
collaboration between self-organizing, cross-functional teams utilizing the appropriate
practices for their context. (Agile Alliance. 2015c.)
Datta (2007, p.15) states that enterprise software systems usually support business pro-
cesses. He says that they need to response to changing user needs, they are bound by
business and technical constraints and their soundness of design and implementation is
of material interest to different groups of stakeholders. In addition to the previous Datta
says that one feature that is beginning more common to these systems is that they are
used world-wide, by several nationalities and in many cultures.
Datta (2007, p.16) also emphasizes that an enterprise application is usually a confluence
of many business processes that are bound by different business rules, don’t usually in-
volve any complex mathematical operations of data but deals with very large amounts of
data and their storage, display and simple manipulation. He also mentions that the users

13
of systems are different then the developers and users and developers are different from
those who commission the building of the software and these stakeholders need strong
communication with each other.
2.1.1 Knowledge management
Software development is knowledge work, where discussion and communication are the
keys to success. Knowledge management (KM) is a business process that formalizes the
management and use of an enterprise’s intellectual assets. KM promotes a collaborative
and integrative approach to the creation, capture, organization, access and use of infor-
mation assets, including the tacit, uncaptured knowledge of people. (Gartner, 2016)
The terms information and knowledge are often used interchangeably. The Knowledge
hierarchy consists of levels of data, information, knowledge and wisdom (Figure 2-1).
Figure 2-1 Knowledge hierarchy (Skyrme, 2011)
Skyrme (2011) gives examples of the differences between the levels are:
- Data: 03772 41565 83385 10157
- Information (interpretation): Heathrow weather station; visibility 15 km, sky com-
pletely cloudy; wind direction north west, speed 85 kts; temperature 15.7 degrees
C.
- Knowledge (understanding): my experience says this will cause severe flight de-
lays.

14
- Wisdom (insight): I shall book a train before other passengers realise the implica-
tions.
There is a clear distinction between the lower two levels and the top two. The bottom two
are embodied in objects, e.g. documents and databases, while the higher levels are in
people's heads. This is also the distinction between explicit and tacit knowledge. (Skyrme,
2011)
This is important to keep in mind with software development. Too often people just ask for
a link to a data in a system to be read. More effective way to transfer and cultivate the
knowledge would be to discuss the thing through and then use the system only for data
storaging purposes, not to transfer data. The same goes with sending the emails to big
audience, it usually ends up as data transfer instead of knowledge or wisdom being creat-
ed.
2.1.2 Web user needs
When building a product, the features themselves are not the only thing that matters, but
the non-functional aspects like uptime, usability, performance and quality are important
too. Olsen (2015, p. 45) summarizes all the important aspects of a web application com-
paring the needs of web user to the Maslow’s hierarchy of need where in both the lower
level needs need to be met before higher-level needs matter. In Olsen’s web user needs
hierarchy, the most important needs to fulfill are uptime, page load time and absence of
bugs. If those are missing the dissatisfaction is decreasing (Figure 2-2). Only after those
needs are met, the feature set and UX design matters and increases satisfaction. The left
side of the figure shows the needs from the customer’s perspective and the right side from
the perspective of the service provider.

15
Figure 2-2 Olsen’s hierarchy of web user needs (Olsen, 2015, p.45 )
This is an important fact to keep in mind when defining and managing the requirements.
Very often the features themselves are required fast, but every now and then the basic
needs tend to be forgotten.
2.1.3 Application Lifecycle Management (ALM)
Every application has a lifecycle. Application’s lifecycle includes the entire time during
which an organization is spending money on this asset, from the initial idea to the end of
the application’s life, even if it often is commonly equated with the software development
lifecycle (SDLC). (Chappell. 2008)
Chappell (2008) states that ALM can be divided into three distinct areas: governance,
development, and operations (Figure 2-3), starting with an idea and ending when the ap-
plication reaches end of life and is removed from service.

16
Figure 2-3 Three aspects of ALM (Chappell. 2008)
Chappell describes the ALM areas as follows:
- Governance: The purpose of governance is to make sure the application always
provides what the business needs. Governance is the only thing that extends
throughout the entire ALM time span. In many ways, it’s the most important aspect
of ALM. Get it wrong, and you won’t come close to maximizing the application’s
business value.
- Development: Once the business case is approved, the software development
lifecycle begins. If the SDLC parts of the Development line shown in the figure was
expanded, a modern process would probably show software development as a se-
ries of iterations. Each iteration would contain some requirements definition, some
design, some development, and some testing. While equating ALM with the soft-
ware development process isn’t accurate, development certainly is a fundamental
part of every custom application’s lifecycle.
- Operations: Every deployed application must be monitored and managed. Opera-
tions begins shortly before an application is deployed, then continues until the ap-
plication is removed from service.
Chappell (2008) explains the Governance in more details (Figure 2-4).

17
Figure 2-4 Governance extends over the entire application lifecycle (Chappell. 2008)
He states that business analysis happens before the development process begins. Once
the business case is approved, application development starts, and governance is now
implemented through project portfolio management. Once the completed application is
deployed, it becomes part of the organization’s portfolio of applications.
He also describes an application is an asset like any other, and so the organization needs
an ongoing understanding of its benefits and costs. Application portfolio management
(APM) provides this, offering a way to avoid duplicating functions across different applica-
tions. APM also provides governance for the deployed application, addressing things such
as when updates and larger revisions make business sense.
It is important to view all these aspects of the application lifecycle, that it is not all about
coding only, but involves the business case and the production too. And the challenge is
to get all these to work smoothly together.
The requirements definition and management should serve both the customer, develop-
ment and the operations.
2.1.4 Agile
Target organization utilizes agile methodologies to be able to deliver fast and change the
direction according to the changes in the business.

18
“Agility is all about nurturing a mindset that enables us to constantly adapt to a rapidly
evolving situation and look for more effective ways to solve a problem.” (Varma. 2015)
Where building products following the ”waterfall” approach, everything needed to be de-
signed in advance, in agile methodology product is broken into smaller pieces that under-
go shorter cycles of requirements definition, design and coding (Olsen, 2015, p. 202).
According to Olsen (2015, p. 202) the benefits of agile development are ability to more
quickly react to market changes or other new information, getting customer feedback
sooner and easier estimation when working in smaller batch sizes. Agile methods also
improve the Return on investment (ROI) since the value delivery starts with the first ship-
pable increment. Sooner the feature is delivered, sooner the customer pays for it (Leff-
ingwell, 2011, p. 17-18).
Still currently, the nature of agile has changed from the early days. Back to the mid-1990’s
agile scrum was all about finding innovative solutions. Team had enough time to first try
some potential breakthrough approaches before reverting back to a safer approach. To-
day many teams start with the safe approach and skip the wild ideas that could lead to
innovative solutions. That is most probably due to the tightened schedules. (Cohn. 2014)
Manifesto for Agile Software Development encourages to value individuals and interac-
tions, working software, customer collaboration and responding to change. (Beck, K.,
Beedle, M., van Bennekum, A., Cockburn, A., Cunningham, W., Fowler, M, Grenning, J.,
Highsmith, J., Hunt, A., Jeffries, R., Kern, J., Marick, B., Martin, R. C., Mellor, S., Schwa-
ber, K., Sutherland, J., Thomas, D.. 2001.)
The Agile manifesto (Beck and others, 2001) provides a set of core principles serving as a
common framework for all agile methods:
- Satisfying the customer with valuable software that is delivered early and continu-
ously is the highest priority
- Changing requirements are welcome, even late in development to gain competitive
advantage
- Primary measure of progress is the working software
- Working software is delivered frequently, shorter timescale is preferred
- Daily co-operation between business people and developers is required
- Way to get the job done is to build the projects around motivated individuals that
are trusted and given the environment and support

19
- Face-to-face conversation is the most efficient and effective way to transfer the in-
formation to and in the development team
- Sustainable development is promoted
- Technical excellence and good design enhances agility
- Simplicity is essential, so it is important to maximize the amount of work NOT done
- Self-organizing teams encourage the best architectures, requirements and designs
- Continuous improvement of the teams working methods is essential
In 2005, a few leading software community leaders came together (some of whom were
the original signatories of the Agile Manifesto in 2001) and created the so-called “Declara-
tion of Interdependence ,” or the DOI, that specifically calls out the notion of “interdepend-
ence” being vital to the success of software development endeavors, which is a rather
broad term that includes customers, stakeholders, teams, and so on. (Varma. 2015.)
Varma (2015) describes following guidelines that this community of project leaders use to
link people, projects, and value and achieve highly successful delivery of results:
- We increase return on investment by making continuous flow of value our focus.
- We deliver reliable results by engaging customers in frequent interactions and
shared ownership.
- We expect uncertainty and manage it through iterations, anticipation, and adapta-
tion.
- We unleash creativity and innovation by recognizing that individuals are the ulti-
mate source of value, and creating an environment where they can make a differ-
ence.
- We boost performance through group accountability for results and shared re-
sponsibility for team effectiveness.
- We improve effectiveness and reliability through situationally specific strategies,
processes and practices.
Varma (2015) also states that among other things, the DOI also lays a strong foundation
for agile project management, specifically by calling out the last value—we could be much
more effective by being dynamically adaptive to the situation and to the needs of the pro-
jects and teams rather than following overly standardized and static processes.
On the other hand, Olsen (2015, p. 278) describes 10 best lean practices for creating suc-
cessful products and they are:
1. Have a point of view but stay open-minded: under conditions of risk and uncertain-
ty, stay objective and evidence-based

20
2. Articulate your hypotheses: share and discuss your hypotheses to make them
even better
3. Prioritize ruthlessly: rank order your backlog and other to-do lists to keep the priori-
ties crystallized
4. Keep your scope small but focused: split large tasks into smaller items to reduce
risk and iterate more quickly to get faster feedback from customers
5. Talk to customers: your customers are the judges of product fit and you’ll learn a
lot from them
6. Test before you build: it is faster and less costly to iterate with design deliverables
than with an actual product, so validate your hypothesis and product-market fit be-
fore building a product
7. Avoid a local maximum: Take a fresh perspective to make further progress from
the best alternative you have figured this far
8. Try out promising tools and techniques: don’t settle for current tools, but try to seek
for better to improve your teams work
9. Ensure your team has the right skills: developing software products requires skills
like product management, user research, interaction design, visual design, copy-
writing, agile development, front-end coding, back-end coding, QA, DevOps and
analytics. Assess where your team is strong and where weak and improve accord-
ingly.
10. Cultivate your team’s collaboration: A product team creating a new feature is like a
basketball team scoring a basket. Strong skills alone don’t make a great product
team, but team members must understand other’s roles and how they need to
work together to achieve their goals. Strong collaboration increases your changes
of building a successful product.
McDonald (2015, Chapter 1) summarizes following things as guiding principles, based on
agile principles, describing desirable characteristics for any initiative:
- You are delivering value when you maximize outcome with minimal output.
- Your team should constantly look for ways to work together to deliver value.
- Shorten the feedback cycle to encourage continuous learning.
- Don’t do anything you don’t absolutely need to do to deliver value.
- It depends.
- Be intentional about your decision making.
- Learn from the past to improve your future.
To once more summarize these agile principles, Declaration of interdependence (DOI)
and lean practices they all in a way or another emphasize:

21
- providing value for customers in interaction with customers
- producing working, reliable software sustainably, where lean emphasizes that it
should be tested before built
- keep the solutions simple, but use fresh perspectives, be creative and innovative
- deliver in short cycles and accept change and uncertainty, where lean emphasizes
prioritization and keeping scope small with small tasks
- empower your teams and encourage them to perform as a team and provide quali-
ty by evolving the knowledge and wisdom via discussion
- improve teams, tools and practices continuously
2.1.5 Scaled Agile Framework (SaFe)
Target organization is so large that could benefit from features of SaFe, but this far the
framework has not been evaluated thoroughly.
Leffingwell draws a very detailed picture of the scaled agile framework (Figure 2-5).
Figure 2-5 Scaled Agile Framework (Scaled Agile. 2010-2016)

22
Lekman (22.3.2014) summarizes SaFe (Scaled Agile. 2010-2016) very nicely ”SaFe con-
centrates on team level (How can these be implemented?), in program level (How can we
make these happen?) and portfolio level (Where should I invest money?). He stresses
that it is not an organization map, but a model for scaling agile and value streams flowing
out from the company. The core of SaFe is Agile Release Train (ART), common schedule
for the whole organization consisting of iterations of 2 weeks that should end up with Po-
tentially Shippable Increment (PSI).”
Agile teams define, build and test user stories in a series of iterations and releases. In
larger enterprises, groups of agile teams work together to build up functionality to com-
plete products, features, architectural components, subsystems and so on. Product owner
for the team is responsible for managing the backlog for the team. (Leffingwell, 2011,
p.33)
Agile Release Train (ART) is used in the development of large scale system development.
The ART provides time-boxed iterations and milestones that are date- and quality-fixed,
and scope varies. The ART results releases or potentially shippable increments (PSIs).
Product Manager or similar defines the features of the system in this level. (Leffingwell,
2011, p.33)
Investment themes drive the investment priorities for the enterprise and the themes
should help to prioritise the work according to business strategy. Investment themes drive
also the portfolio vision, which is then mirrored to future release trains as epic-scale initia-
tives. (p.33)
2.1.6 DevOps
Target organization follows DevOps in their product development to keep the work ongo-
ing, minimize the risks and split the work into more reasonable pieces.
According to Rossberg (2014, Chapter 2) the key concepts of DevOps are continuous
development, continuous integration and continuous operations.
He also crystallizes the heart of the DevOps as:
- working with small changes instead of large releases to minimize risk
- getting rid of manual steps by automating processes and
- having development and test environments that are as close as possible to the
production environment

23
DevOps aims to optimize the time from the development of an application until it’s running
stably in the production environment. He emphasizes that getting ideas rapidly into pro-
duction helps to quickly answering to changes and influences from the market and keep
the business successful. It is not a method on its own; instead, it uses known agile meth-
ods and processes like Kanban and Scrum, that are used for development (mostly Scrum)
and operations (mostly Kanban). (Rossberg, 2014, Chapter 2)
According to Forrester (2015) faster application delivery requires embracing DevOps prac-
tices. Every organization can benefit from these practices; however, each organization
needs to assess its current situation and determine which practices are most immediately
critical and which can be planned for the future.
According to a Forrester’s (2015) in-depth survey with application development and IT
operation professionals point to seven key recommendations for companies to follow
when looking to adopt DevOps practices to improve their results.
1. Streamline, simplify, and automate the delivery pipeline.
2. Expand test automation to improve quality while increasing delivery speed.
3. Use infrastructure as code and cloud technologies to simplify and streamline envi-
ronment provisioning.
4. Reduce technical debt to increase responsiveness and reduce cost.
5. Decouple applications and architectures to simplify delivery activities.
6. Collect and analyze feedback to drive better requirements.
7. Measure business outcomes tied to application releases.
Rapid delivery cycles enable organizations to measure whether what they delivered mat-
tered and to know what they should work on next. Rapid feedback enables organizations
to deliver increasing levels of customer delight while reducing the amount of time, money,
and effort they spend on building things that no one wants or needs. (Forrester. 2015)
When rapid application delivery enables better customer insight, organizations are able to
see a close connection between business strategy, execution, customer experience, and
business results. Organizations try out new ideas, gather feedback, and rapidly refine their
solutions based on customer experiences. This enables organizations to identify and rap-
idly act upon new business opportunities. (Forrester. 2015)

24
2.1.7 Trust-Ownership model
“Now more than ever we need to unleash the talent of individuals, team and organization.“
(Pixton, Gibson & Nickolaisen, 2014, Chapter 1)
From the specialist point of view, this sounds more than good to get all the talent in use
efficiently. In a large organization the amount of people and way of organizing the people
are always a challenge, but should be possible to tackle if wanted.
To build the effective organization it is important to both improve the process perfor-
mance and build a high-performing, improving teams. This requires the leader to take one
step back and let the team to find the answers themselves instead of only following the
orders or plans. (Pixton and others, 2014, Chapter 1)
Pixton and others (2014, Chapter 1) introduces the Trust-Ownership Model (Picture 2-6.)
that explores the interrelationship between the amount of trust that the Leader or organi-
zational process has in the Team and the level of ownership and commitment that the
Team has to the success of the project or business.
Figure 2-6 Trust-Ownership model (Pixton et al, 2014, Chapter 2)
In the model the Team refers to the individuals and the teams that actually do real work to
create customer and business value. This may be a single individual or group of individu-
als doing the work together, but it is not an organizational entity. The Leader in the model
refers to team leads, managers, senior professionals and the business processes and

25
tools they create to control their subordinates’ activities, any person or process that has
organizational power over Team. Everyone or every team needs to own its results and be
trusted. It is old fashioned, inefficient and motivation killer to control and punish. (Pixton et
al, 2014, Chapter 1)
In the model the vertical axes indicate Leadership and business process through trust
versus control. On the Control end team spends time documenting, reporting and asking
permission – wasting time away from creating business value, when the manager wants
everything to be controlled, on the Trust end teams and individuals are able to take ap-
propriate actions owning their work. The horizontal axes indicate Team/individual owner-
ship where left hand is for “I’ll only do what I’m told” and right end for fully commitment
and finding the way to meet the business goal.
In command and control section, team is in fear of failure and lack of trust and the leader
takes full control. In failure section leader trusts the team, but team doesn’t care. In
Conflict there is continuous conflict between team and leader and leader holds the team
back while the team feels ownership and wants to make progress. In Energy and
innovation Leader works in strategic level and has confidence in the team, team
understands business and customer requirements, things get done well and fast and team
is committed to them and delivers rapidly. (Pixton et al, 2014, Chapter 2)
According to Pixton and others (2014, Chapter 2) living in failure or conflict cannot last
long. The teams in conflict get tired of the fight and move back to command and control
and the teams in failure get tired of too high level of control and move back to command
and control. High control environment or culture can limit productivity and revenues.
(Pixton et al, 2014, Chapter 2)
In addition to trust and ownership, integrity is the foundation to enhance the way of
working and get closer to Energy and Innovation. Setting inrealistic goals leads to distrust
and demotivation. In addition to the goals being realistic, the goals of the teams must be
aligned with the business goals of organization. In addtition to that ambiguity and
incertainty needs to be dealt honestly to grow a healthy, high-performing organizaton that
works together to provie value and delight customer. (Pixton et al, 2014, Chapter 2)
Pixton and others (2014, Chapter 2) sees Leadership effectiveness, Trust, Ownership and
Honestly dealing with ambiguity and complexity important areas of good culture.

26
Leadership effectiveness: Good leader explains the goals, encourages to think big, asks
to link the work to goals and keep customer in mind. Good leader guides by asking ques-
tions, not telling the answers. This way the ownership is moved to the team and team
learns on the go. (Pixton et al, 2014, Chapter 1)
In addition a good leader acknowledge difference between opinion and fact, change
according to new information and learn, expect success, accept mistakes, avoid blame,
recognize that plans change, don’t force an aggressive plan, don’t push teams too hard or
they will start game playing against the leader, continously consider risks and plan big, but
take small steps. (Pixton and others, 2014, Chapter 2)
Trust: To succeed, the leaders must trust their teams and overcome the fear of failure to
deliver the maximum value. (Pixton and others, 2014, Chapter 2)
Ownership: Clear ownership helps to move from getting things done to getting the right
things done. It is important part of the ownership to know what to own. Understanding the
alignment leads to making better decisions about the products, processes, features and
functions. (Pixton and others, 2014, Chapter 2)
Honestly dealing with ambiguity and complexity: Pixton and others (2014, Chapter 2)
suggests to embrace ambiguity with using iterative methods like Agile. Ambiguity is faced
with learning and experimenting for better results.If the organization wants to build fully
engaged teams that are committed to business’s success, there is no space for game
playing. Instead both the individuals and organizational processes need to act with
honestly and integrity. Accepting the uncertainty (of schedule, cost etc.) will help to better
understand the unknown of the future. (Pixton and others, 2014, Chapter 2)
2.1.8 Processes
Despite possessing unique characteristics and differentiators, agile methodologies and
frameworks generally share some common traits. These common characteristics are illus-
trated in figure 2-7 in a depiction of a Generic Agile life cycle. (IIBA. 2011. p. 18)

27
Figure 2-7 Generic Agile Life-Cycle (IIBA. 2011. p. 18)
Regardless of the agile methodology used, successful agile projects follow the consistent
planning rhythm or cadence of Strategy, Release, Iteration, Daily and Continuous com-
bined with the notion of frequent and flexible release schedules that allow for high cus-
tomer involvement with rapid feedback and frequent product assessments. (IIBA. 2011.
p.18)
Through the cadence, the requirements for the project are progressively elaborated to an
appropriate level of detail. At each step, stable concepts are captured, context is captured
and learning opportunities are identified. One of the keys to agile is to perform a sufficient
level of analysis at each planning level. Too much analysis up front can result in creation
of documents that are subject to change, require the business user to explain their needs
multiple times, and may not necessary to achieve the goals of the project. Too little analy-
sis up front can result in irresponsible commitments, rework, and lack of focus on custom-
er value. (IIBA. 2011. p.20-21)
Generic Agile model
Paul and others (2014, Chapter 13) introduces the generic agile model (Figure 2-8).

28
Figure 2-8 Generic agile model (Paul and others, 2014, Chapter 13)
Paul and others model begins with the identification of a business need and consists of
following stages:
- Identify options and feasibility: A feasibility study is conducted to determine the op-
tions that the business might pursue in order to address the business need. This
will set out the options available, in particular the costs, benefits, impacts and risks
of each alternative option, and possibly a preferred option.
- Define and agree business requirements: Once a preferred option has been se-
lected, the high-level business requirements need to be defined, from which more
detailed solution requirements can be derived. This stage identifies the scope for
the systems development project by defining a set of high-level features to be de-
livered by the solution. These high-level requirements are also prioritized during
this stage.
- Elaborate solution requirements: The high-level business requirements are ex-
plored and elaborated into more detailed requirements for the solution, using tech-
niques such as storyboards, wire frames and prototyping. An iterative approach is
adopted in order to develop a final, operational prototype. This confirms the func-
tional requirements to be built and deployed in the current release.

29
As Agile development projects typically deliver functionality incrementally, this stage and
the following two stages (engineer solution and deploy solution) will be repeated for each
incremental solution delivery.
- Engineer solution: Once the functionality for the current delivery has been agreed,
a production-ready solution is built that can be deployed into the live environment.
This stage will addresses the non-functional requirements and technical infrastruc-
ture required to turn the operational prototype into a fully fledged, working solution.
- Deploy solution: The tasks necessary to deploy the working solution into the live
operational environment are conducted, including data take-on, data conversion,
preparation of documentation, end-user training, installation of the live environ-
ment and transition to the service delivery team.
- Evaluate solution: Once the solution is ‘live’, typically some period of time after it
has been deployed, an evaluation of the solution is undertaken to determine
whether it has met the business objectives and is working satisfactorily. This re-
view may lead to perfective maintenance to improve aspects such as performance
and usability. Once the final version is deployed, a benefits review will be conduct-
ed to examine whether or not the benefits have been realized and, if not, identify
any further actions required to enable their realization.
The lean product process
The core idea is to maximize customer value while minimizing waste. (Ries, E. 2011.)
Olsen (2015, p.9) describes Lean product process like this:
1. Determine your target customers
2. Identify underserved customer needs
3. Define your value proposition
4. Specify your minimum viable product (MVP) feature set
5. Create your MVP prototype
6. Test your MVP with customers
According to Olsen (2015, p. 201) an important part of product-market-fit is having the
right product at the right time, earlier than your competitors.
Build-Measure-Learn loop
The Build-Measure-Learn loop (Figure 2-9) is an application of the Plan-Do-Study-Act
(PDSA) cycle, originally created by Walter Shewhart and advocated by W. Edwards Dem-

30
ing. The PDSA cycle has been used by organizations for several decades to enable con-
tinuous improvement efforts. The main thing that the Build-Measure-Learn loop adds to
the PDSA is an emphasis on getting through the cycle as quickly as possible in order to
validate assumptions and test hypotheses about solutions, reinforcing the tie between the
activities of a startup and experiments. (McDonald, 2015)
It is important to validate assumptions early on in your project so that you can determine if
you have identified the right solution to the right problem. Asking your stakeholders for
feedback is helpful, but due to the influence of cognitive biases, they can sometimes give
you misleading information. That’s where the Build-Measure-Learn loop comes in. It pro-
vides a way to validate assumptions in conjunction with talking to your stakeholders. It
also encapsulates the overall approach to building and getting feedback, which is a key
aspect of the guiding principle to reflect and adapt. (McDonald, 2015)
Figure 2-9 Build – Measure – Learn feedback loop (Ries. 2011.p.75)
McDonald (2015) explains the lean feedback loop as follows:
Idea: Your stakeholders have a need. You understand that need and you think you’ve
identified a solution that may satisfy that need. In other words, a desired outcome is based
on a bunch of assumptions that you should validate in some way. You need to identify

31
some form or metric based on you overall goal that you can use later on, as a measuring
stick to tell whether you are successful.
Build: You pick a specific solution (or piece of the solution) to deliver. This is an output.
Impact mapping can help you pick the right output. Your goal in delivering this output is
not necessarily the be-all and end-all, it is to understand the impact this output has on
satisfying the need (reaching the desired outcome).
Product: The output of the project
Measure: You’ve delivered this output in isolation so you can see its impact on the out-
come free from any other influences (as much as possible at least)
Data: Observe the impact on the metric you identified
Learn: Examine the data and decide whether the change you delivered made the impact
you wanted. If it did, you may be done. If not, you have to try something else. And you
start the whole cycle all over again by looking at your remaining options and picking the
next one.
Iterative development approach
According to Paul, D., Cadle, J. and Yeates D. (2014, Chapter 13) the itera-
tive development approach is founded upon these fundamental generic principles:
- Evolutionary – Detailed requirements are evolved through a series of iterative
prototyping development stages.
- Empowerment and collaboration – It is a fundamental requirement that the
team, including business staff and IT developers, are empowered to make deci-
sions during the software development and work as a collaborative team.
- Fitness for purpose – The deliverables are required to be fit for purpose rather
than aligned slavishly with a set of defined requirements.
- Testing all the time – Testing is an integral part of the itera-
tive development approach so the software should be tested continuously. Auto-
mated testing tools are very useful in doing this.
- Re-factoring – Iterative development adopts an exploratory approach so any work
may be reversed if it does not add value. This is not perceived as being a mistake
or waste of time but instead as an integral part of the iterative process.

32
- Incremental delivery – The system is likely to be deployed in increments, with
each subsequent increment providing additional functionality or improved perfor-
mance.
- Prioritisation – An approach such as MoSCoW (Must have/Should have/Could
have/Won't have) is used to identify the different levels of priority amongst the fea-
tures to be delivered.
- Timeboxing – The concept of a ‘timebox’ whereby time limit is set, at the outset,
for the development of part of the system. Prioritisation is used to provide some
contingency in the timebox, for example by including features of a lower priority
that may be deferred or dropped if time does not allow.
Double diamond design process
Teams often focus on the delivery of a thing, instead of its business impact. This happens
when we define success by short timeframes, and performance relates to output. We also
tend to rely on our intuition or acumen, without seeking any validation. Even with years of
experience in a domain, intuition can be flawed by our biases. Left unchecked, we define
and pursue solutions before fully understanding the opportunity space. (Schneider, J.
2015.)
Creating successful products requires the skills, expertise and craft of many people.
Engineers, specialists, analysts, strategists, designers, researchers, architects and
marketers work together. We define a desired future state, before executing upon that
vision as one. With such a group of people come diverse personal characteristics –
analytical, creative, strategic, pragmatic. And many approaches to working – structured,
unstructured, empirical, theoretical. We need something that guides us to define adaptive
plans that respond well to new information. A model that helps us to work together to
achieve real outcomes together. (Schneider, J. 2015.)
Double diamond design process (Figure 2-10) maps the divergent and convergent stages
of a design process. Model is created by The British Design Council and it describes
modes of thinking that designers use. Double diamond model seems like a linear process.
It describes significant up-front design, before going on to produce a final solution.
Working this way means that solutions are generally perfected before public release.
That’s because it’s expensive to change a physical product after it has shipped. Another
effect is that a lot of time passes before knowing it’s efficacy in a real market. For software
products or services, we take advantage of the malleable nature of what we create.
Software is easier to change, so we don’t need to perfect the entire solution up front.

33
Instead, we create smaller packages of value for release. Then we respond to what is
learnt in a real market to refine and adapt the architecture of the product. When we do
this, the initial solution informs the future, and our strategy adapts. (Schneider, J. 2015.)
Figure 2-10 Double Diamond model, adjusted for software products and services
(Schneider. 2015)
Schneider (2015) describes the phases of the model as follows:
Understand: First is needed to seek to understand the current condition. This phase is
divergent and exploratory – it’s a search for new questions. Through observation and en-
quiry revealing customer behavior and business drivers. Opportunities are identified for
further consideration.
Define: Synthesizing knowledge into insight. Converging on a vision and defining the first
expression of our plans to occupy a future position. Assessing the viability and impact of
our plans, and determining how to measure success. This initial strategy guides the exe-
cution of a solution, but strategy is never complete. A strategy should adapt when new
discoveries are made. All details of a solution doesn’t need to be defined. Instead, the
focus should be on the desired outcomes or impact to achieve.
Explore: With a vision in place, it’s time to explore the best potential solutions. Knowing
what to achieve, and by exploring and validating options, the best ways to succeed can be
found. This is a divergent and iterative activity. Details and requirements have not been
defined – instead, the right solution is discovered.

34
Create: As confidence in the solution is gained, exploration gives way to engineering to
create and optimize working software. The opportunity here is two-fold. First, a working
solution delivered to market. Second, gathering real market feedback. As a result, under-
standing deepens, and new discoveries influence an ever-changing strategy. Software
engineering is not merely execution of a plan, it also defines strategy.
Understanding the phases of the Double Diamond and how they interrelate is important
(Figure 2-11). It helps decide the right methods and activities for pursuing a problem or
opportunity. (Schneider. 2015)
Figure 2-11 Interrelations of Double diamond design model (Schneider, 2015)
Analysis with agile mindset
McDonald (2015, Chapter 6) describes analysis with agile mindset to happen in four steps
(Figure 2-12):
1. What is the need?
2. What are some possible solutions?
3. What should we do next?
4. What are the details of this part?

35
Figure 2-12 Analysis with agile mindset

36
2.1.9 Value
Robertson & Robertson (2013, p.2) state that optimally valuable product needs to provide
benefit that is in proportion to the cost of the product.
In order for a project to deliver value, they must first be able to identify whether a request
is actually valuable to the organization. Without a clear understanding of business value, it
is possible for the project to deliver something that sounds valuable but is actually not.
(IIBA. 2011. p.73) .
A project creates business value when it delivers anything that contributes to an organiza-
tion’s stated primary goals, for example
- Increasing or protecting revenue
- Reducing or avoiding costs
- Improving service
- Meeting regulatory or social obligations
- Implementing a marketing strategy
- Developing staff
(IIBA. 2011. p.73.) .
Goals and objectives
A goal is a broad, over-arching destination. "We want to achieve 50% market share in two
years," or, "I want to compete in and complete a triathlon within 18 months." It does not
define how you will achieve this market share; it does not describe a strategy to get there
or offer the specific tasks necessary to achieve the strategy. It simply is out there as a
destination or target. (Reh, 2016b)
An objective is a specific, measurable activity you will take to work towards a broader
goal. For example: "As part of our goal to achieve 50% market share in two years, we will
introduce a new product in each market segment every six months." Or, "To achieve my
goal of completing a triathlon, I will engage a running coach to help me improve my cardio
conditioning, pacing and running technique." (Reh, 2016b)
Reh (2016b) also states that the strategy connects objectives with goals and that focus on
the goal as the destination and the objective as the action(s) needed to get to the destina-
tion.

37
Return on investment (ROI)
Beattle (2015) writes that calculating ROI is very simple on paper: ROI = (Gains-
Cost)/Cost. In addition, he reminds that it just has to be remembered, that time is not tak-
en into account in ROI. Still it is important whether the investment pays off in short term or
only after e.g. 30 years.
Beattle reminds that ROI is a historical measure, calculating all the past returns.
Cost of bugs
Bugs are usually something opposite to quality and value. To assess the value or negative
value of the bugs it is important to pay attention to the cost of bugs.
The Systems Sciences Institute at IBM has reported that “the cost to fix an error found
after product release was four to five times as much as one uncovered during design, and
up to 100 times more than one identified in the maintenance phase.” (Leon, 2015a)
Leon (2015b) expresses the amount of the cost of fixing a bug in separate phases of soft-
ware development lifecycle with the monetary figures (Figure 2-13). She states that bug
fix cost is multiplied with 100 if it is fixed on production, instead of fixing it already on re-
quirements phase.
Figure 2-13 Cost of a software bug (Leon, 2015b)
Barry Boehm has ended up with even a cost of 150 times the cost on requirements phase
(Figure 2-14) (Superdeveloper.com, 2009).

38
Figure 2-14 Relative cost of a software bug fix according to Barry Boehm, 2007
(SuperWebDeveloper.com, 2009)
Leon (2015b) defines the cost structure of a bug fix during the software development life
cycle as follows (Figure 2-15)
Figure 2-15 Cost structure of bug fix during the SDLC (Leon, 2015b)
Leon (2015b) explains the accumulation of the cost in different phases:
- In the requirements phase fixing the bug takes only the time to rewrite the re-
quirement.

39
- In coding phase the fixing time varies depending on the complexity, but it is less
than fixing a bug found by someone else.
- In code integration phase time is usually at least twice as much, because the prob-
lem occurs at a higher level and there is more investigation needed to find the
source of the bug.
- In testing phase QA tester needs to reproduce and document the steps, submit a
defect, prioritize it and discuss it through with developer. After the bug is fixed, the
code needs to be integrated, retested and verified as fixed.
- In user acceptance testing phase the acceptance tester needs to communicate
with tester who tries to reproduce the bug and decide whether it is a bug or not. If it
is a bug, it is then reported as a bug and cost is accumulated accordingly. In addi-
tion to integration and re-testing, also the user acceptance test needs to be re-
done.
- In production phase the support is involved and the communication cost between
supplier and customer is added.
Leon (2015a) gives few examples of real cost of the software bug:
1. NASA Mariner 1 spacecraft was launched in 1962, attempting to reach Venus. A
software bug caused the rocket to veer off course and after 290 seconds after
takeoff it had to be destroyed. According to the official report, omission of a hy-
phen in coded computer instructions in the data editing program, resulted in incor-
rect guidance signals being sent to the spacecraft. The cost of aborting the mis-
sion was 18 million back in 1962.
2. Toyota had to recall more than 9 million cars worldwide in 2010 due to the fact that
cars had a software bug that caused a lag in the anti-lock-brake system. Drivers
were not able to use the breaks and few people already died car crashes. Due to
increased incentive campaigns, legal liabilities, and marketing efforts, the recalls
were estimated to cost Toyota as much as $3 billion.
Leon (2015b) states that most of the bugs found in the coding and requirements gathering
phases can be substantially reduced by performing Agile methods, like defining ac-
ceptance criteria, unit testing and doing test-driven development.
Very often the challenge is still hidden behind the schedules and missing quality targets:
The question every developer asks is, “What is the simplest, easiest, and fastest way to
get something done?” The answer could be open to interpretation, but that is because the
long view must be taken into consideration, and that is why software makes use of func-
tions, templates, classes, objects, and design patterns. The work is needed now, but how

40
will it be possible to understand the software in a few months time when no-one is mentally
fresh? How do I share my ideas with other people? How do I take the long view into ac-
count? (Superdeveloper.com, 2009)
Attractiveness
Pokémon Go (stylized as Pokémon GO) is a free-to-play, location-based augmented reality
game developed by Niantic for iOS, Android, and Apple Watch devices. It was initially re-
leased in selected countries in July 2016. In the game, players use a mobile device's GPS
capability to locate, capture, battle, and train virtual creatures, called Pokémon, who ap-
pear on the screen as if they were in the same real-world location as the player. The game
supports in-app purchases for additional in-game items. (Wikipedia. 2016)
Churchville (2016) describes Pokémon Go like it’s simple enough up front to get people
into it, but offers plenty of complex features to players to look into once they are familiar
enough with the app. He continues that the enterprise application also should be complex
enough to meet the business need, but not so complex that it makes users tear their hair
out.
Churchville (2016) also raises up that the social aspect of Pokémon Go is drastically im-
pacting its adoption and use. According to him, possibility to join teams, help each other
out, look for Pokémon together and more, turns the use of the app into a larger social ex-
perience. He also asks that if there would be any way the same kind of social aspect that
there is in Pokemon Go game could be included into an enterprise mobile app. He won-
ders if an enterprise application could also encourage collaboration between team mem-
bers, or reward them for linking up with other users or help facilitate the creation of a team
in the future. He wonders if turning the app into something that people can use together
could turn it from a technological burden to a blockbuster, also for enterprise applications.
DeMers (2016) explains the qualities that there already is in Pokémon Go augmented
reality game and in the future he suggests them to be successful qualities in application
development, and they are
- Augmented reality that is the most important part of the Pokémon Go and there
the players can encounter Pokémon “in the wild,” seeing the animated characters
on their phone screens as they examine their surroundings, and in addition to that,
real physical locations. The augmented reality in Pokémon Go relies on the latest
GPS technology, the mobile practicality of our modern devices, and processing
power capable of layering new elements over our existing world. In the future, app
developers may take this a step even further, even up to the virtual reality (VR),
where entirely new worlds can be created before our eyes.

41
- Gamification as the process of turning something ordinary into a kind of game.
Being a way to get people more involved, more engaged, and more entertained by
specific tasks. In Pokémon Go’s case, walking and visiting cultural landmarks and
traveling new places has become a game, since by walking user can find more
Pokémon and hatch eggs that way and by traveling user can earn rewards and
see new Pokémon this way.
- Unlimited potential, the future of app development will be customizable, ever-
expanding, individualistic, and with practically unlimited potential, all to keep users
interested
- The learning curve, the ideal learning curve is one that is simple for easy entry,
but also rewards users for increasing investment and discovering more complex
mechanics. Users should not get bored with application after a few uses or com-
plexity should not scare away the newbies.
- Microtransactions, using coins (which you can buy with real money) to purchase
helpful items in the game. Pokémon Go made their first priority giving people a
game they love to play and purchasing helpful items is not mandatory but only a
possibility.
- The social element, people talking about and sharing the game with others. In
Pokémon Go user can commit to a team, which builds loyalty and encourages in-
stant bonding between like team members, you can exchange tips, and you can
go Pokémon hunting together with shared “lures” to maximize your mutual experi-
ence. In the future subtle social encouragements like these—instead of or in addi-
tion to traditional social modes, like chat features, are likely to increase.
To stay in time or ahead of it, the attractiveness of the software could be calculated as
part of the service value. Getting people exited or at least not annoyed, with the business
software, provides value in that sense that people recommend service or product to other
people. And that is valuable. Whether the qualities mentioned above fit into the business
world or not, users should be provided something simple and efficient with a little of twist
to make it fun or less boring.
2.2 Agile requirements definition and management
Requirements are what the software product, or hardware product, or service, or whatever
you intend to build, is meant to do and to be. Requirements exist whether you discover them
or not, and whether you write them down or not. Obviously, your product will never be right
unless it conforms to the requirements, so in this way you can think of the requirements as
some kind of natural law, and it is up to you to discover them. (Robertson & Robertson 2013,
p. 1)

42
Since software should exist to solve a business problem, any development project should
start with the problem, not with presumable solution. (Robertson & Robertson 2013, p. 4)
Murphy (2010) explains the Requirements definition and requirements management as
terms that are used to describe the process of eliciting, documenting, analyzing, prioritiz-
ing and agreeing on requirements and then controlling, managing and overseeing chang-
es and risk. IIBA (2015, p. 19) adds validation as a key activity of requirements analysis.
Smart businesses want to do better Requirements Definition (RD) and Requirements
Management (RM) (or as Gartner puts them, RDM) to streamline the whole application life
cycle. According to Murphy, systematic and effective RDM captures software defects ear-
lier in the lifecycle and reduces the overall likelihood that defects will happen. (Murphy,
2010.)
Murphy reminds that it is quite common to look at the application lifecycle management
(ALM) process through only a technology and development lens instead of paying atten-
tion also to the strong RDM. She also states that even if implementing strong RDM prac-
tices needs resource investments, those investments are not near to the costs of weak
RDM. Eliminating requirements discovery will cause both wrong end result and poor quali-
ty passing on in the development life cycle. (Robertson & Robertson 2013, p. 4)
Murphy (2010) says that according to Gartner, 40 % of unplanned downtime is caused by
application failures, where of a large portion is due to poor requirements introduced during
development phase. According to Murphy, the National Institute of Standards and Tech-
nology (NIST) estimates that 70 % of software defects are introduced in the requirements
phase. The later the bugs are found in the lifecycle, more it costs to fix them.
The organization of the requirements and the organization of the team itself are not inde-
pendent things in agile. To optimize the efficiency of defining, building and testing code
that delivers value to the end users the teams organize around the requirements.
(Leffingwell, 2011, p.48) Murphy (2010) names Business Analysts and Software Quality
Managers as the pillars of good RDM, but also reminds that in agile all stakeholders
should be involved in the development of the user story.
Agile requirements management is temporal, interactive and just-in-time. (Leffingwell,
2011, p.16) In agile requirements management process is very iterative, many stakehold-
ers are involved and requirements are presented in form of user stories and tasks. In
Murphy’s (2010) opinion the difference between requirement and user stories is only the

43
structuring, when they both describe a specific condition or capability to achieve an objec-
tive or solve user’s problem.
2.2.1 Agile requirements definition and management process
Best systems or products are simple and streamlined, therefore the Lean Thinking re-
moves waste from the system. Requirements definition and management is also vulnera-
ble for the complexity factor moving the system toward complexity when getting more ma-
ture. Requirements definition in Agile should be considered as its own area of work, not
only through the development team. RDM can utilize the same principles that are used in
Agile software development (figure 2-16). (Moccia, 2012)
Figure 2-16 Agile requirements definition and management (RDM) (Moccia, 2012)
In scrum the software is built incrementally in two- to four-week events, or sprints. In sprint
planning the development team discusses what needs to be developed in a given sprint
based on organizational needs and strategy. Product Owner directs the work items that
are pulled from the product backlog and Scrum Master controls and manages the pro-
cess. Business feeds the product backlog and supports and describes the prioritization of
the sprint. (Moccia, 2012)
Agile requirements definition and management (RDM) is designed for feeding the product
backlog faster than the development team can produce code. The framework enables
both just-in-time requirements definition and building a repository of requirements for fu-
ture use. In both cases the team using scrum is working from the product backlog. The
product backlog needs to be filled for the sprints. The Product Owner needs to define
what needs to be built and with what level of quality. For this to happen, the requirements
cycle follows a Scrum-like process that follows the development cycle but two to three

44
steps ahead. Aim is to get requirements thoroughly vetted, organized and communicated
iteratively, timely and quality-focused. (Moccia, 2012)
First the requirements backlog is identified and filled. Based on the business strategy and
objectives and using requirements planning and prioritization, the requirements team de-
cides what needs to be defined and built. The requirements team plans its sprints, per-
forms the work and reviews the outputs. If the expectations are met with outputs, they are
moved to the product backlog. (Moccia, 2012)
Decomposition in RDM is the process by which the product backlog items are communi-
cated and refined in collaboration with the development team. In Scrum this is called
grooming the backlog, where the development teams are brought into the requirements
phase to refine the product backlog in a culture of collaboration. The decomposition is
also a way to pick up where things left off, when there is any larger gap in time between
definition of requirements and development. (Moccia, 2012)
The value of agile development that fosters continuous improvement, time-boxed devel-
opment cycle and more quickly delivering value to the end users will be driven to a large
extent by the quality and clarity of requirements that feed the development process. (Moc-
cia, 2012)
2.2.2 Requirements definition process
Murphy (2010) describes the requirements definition process as follows (Figure 2-17):
In elicitation phase, Business Analyst gathers the requirements and delivers them to the
backlog to be assessed. She says that usually requirements elicitation practices include
JAD (joint application development) techniques like interviews, questionnaires, user ob-
servation, workshops, brainstorming, use cases, role-playing and prototyping.
In elaboration phase more depth is added to the meaning of the requirements. Epics are
broken down into user stories, tasks or technical details. Methods used by business ana-
lyst in elaboration phase are developing use cases in rich text, creating flow diagrams,
class models, GUI mockups and assigning business rules. Murphy suggests that elabora-
tion phase can also help with addressing known risk factors and establishing or validating
the system architecture.
In validation phase it is verified that requirements are complete and testable. In this
phase the developers and testers should check the “fit criterion” associated with the user

45
story. Techniques used in this phase are discussions, simulations and face-to-face meet-
ings.
Acceptance phase is the final stage in the requirements definition lifecycle. Acceptance
is done only when the requirements have been verified and accepted by all the stakehold-
ers. In this phase the baseline for the requirements are created and requirements are al-
located to releases and iteration and this is where the technical development can start and
test planning begin.
Figure 2-17 Requirements definition lifecycle. (Murphy. 2010)
Requirements activity is about understanding a business problem and providing a solution
for it, not only writing a requirements document. The requirements do not have to be writ-
ten, but they have to become known to the builders. (Robertson & Robertson 2013, p. 1
and 5)
Murphy (2010) states that requirements may be captured either in simple text format or
visualized with pictures, business process flow or simulations, depending on organiza-
tion’s development method. She suggests to visualize the requirements only when it pro-
vides clarity or helps to save time, but not when visualization would end up as too com-
plex diagram or would only be a waste of time. She suggests that visualization could be
done e.g. based on requirement type or risk level of the requirement. According to Mur-
phy, visualization is a useful tool to help business to communicate better with IT.

46
Need/Problem
Real art of requirements discovery is discovering the real problem (Robertson & Robert-
son, 2013, p. 1). Datta (2007, p. 38) puts it this way: it is hardest to discover the user’s
real needs from the twaddle of wishes, nice-to-have features and fantasies.
Don Reinertsen emphasizes that customers usually describe the desired solution instead
of the real need. This is where requirements management usually fails, providing the
solution customer wanted instead of fulfilling the real need. He describes a story where
customer wanted a lightweight suitcase that was easy to carry, but when they got one,
they still were not satisfied, but bought the ones with wheels from the competitor.
(Leffingwell, 2011, Preface)
Don Reinertsen states also that focusing only to the user may lead to missing the non-
functional requirements, since the needs has to be balanced with technical decision mak-
ers, end users, system operators and financial decision makers and the needs of distribu-
tors, regulators, manufacturing and field service has to be understood. (Leffingwell, 2011,
Preface) In agile the non-functional elements of the user story are captured as “fit criteri-
on” for the story, where traditional requirements normally brakes the requirement into
functional and non-functional blocks. Usability, reliability, performance and supportability
are common non-functional requirements. (Murphy, 2010)
Separating consideration of need from solution allows your team to identify multiple poten-
tial solutions and have options to pick from when it’s time to determine the specific solu-
tion that you will deliver. Having those options increases the chance that your team will
effectively deliver a solution that meets the needs of your stakeholders while keeping with-
in constraints such as time and budget. (McDonald, K. 2015.)
“When designing a system and writing requirements, it is just as important to figure out
what should not be in the system as what should be included. It may be easy to add more,
but simplicity by definition means having less.“(Tung, 2014)
Solution/Design
Antoine de Saint Exupéry has said “perfection is reached not when there is nothing left to
add, but when there is nothing left to take away”. (Tung, 2014)
Laakso (2006) explains already 10 years ago why we should first pay attention to user
stories and use cases, instead of jumping straightly to the solution.

47
“Part of the functional requirements are set according to what kind of a UI solution
we are able to define for the user. For example, if without an UI we try to define fea-
tures for a system where user can book appointments for a barber or hairstylist, the
first thing that comes into mind would be a search (and search page), where the
customer could search for free appointment times according to the date, the name of
the barber or hair stylist and for example by the operation in question.
Then again, if we produce the UI according to user stories or use cases we might
find a better solution to support the user, providing for example a timetable calendar
view and show all appointments for every barber and hair stylist side by side per
day. In this solution, we don’t need any separate search functionality, but create cal-
endar views and let user change the date from the calendar. These are separate
functionalities than the original search page.”
It is important to recognize that business analysts are also responsible for the definition of
design, at some level, in an initiative. The level of responsibility for design varies based on
the perspective within which a business analyst is working. Requirements are focused on
the need; designs are focused on the solution. The distinction between requirements and
designs is not always clear. The same techniques are used to elicit, model, and analyze
both. A requirement leads to a design which in turn may drive the discovery and analysis
of more requirements. The shift in focus is often subtle. The classification as a require-
ment or a design may become less significant as the business analyst's work progresses
to a greater understanding of and eventual fulfillment of the need. (IIBA.2015. p. 19)
Business analysis can be complex and recursive. A requirement (or set of requirements)
may be used to define a design. That design may then be used to elicit additional re-
quirements that are used to define more detailed designs. The business analyst may hand
off requirements and designs to other stakeholders who may further elaborate on the de-
signs. Whether it is the business analyst or some other role that completes the designs,
the business analyst often reviews the final designs to ensure that they align with the re-
quirements. (IIBA. 2015. p. 19)
The following figure (Figure 2-18) provides some basic examples of how information may
be viewed as either a requirement or a design.

48
Figure 2-18 Requirements and design cycle (IIBA. 2015. p. 20)
Design occurs during delivery as your team figures out how to technically satisfy the user
stories given your chosen technology and architectural constraints. That activity is inter-
woven with development and testing as your team will have some initial discussions about
design but then revise that understanding as they learn through experience. (McDonald.
2015)
As a result, calling design out as a separate activity doesn’t add any value to the process
and leads to pointless arguments about whether a particular item is in discovery, design,
or delivery, whereas having an explicit split between discovery (getting ready for an itera-
tion) and delivery (delivering it) is a much clearer delineation. (McDonald. 2015)
Robertson & Robertson (2013, 4) reminds that there is a challenge with iteratively ask
users to accept the features, because it is hard to know when users are satisfied with
them or only exhausted by the process.
Feasibility of a systems request
Shelly et al. (2011, p. 63-66) explains a feasibility study that a systems request must pass
to see whether is it worthwhile to proceed further. According to them feasibility study has
four areas: operational feasibility, technical feasibility, economic feasibility and schedule
feasibility.

49
With operational feasibility Shelly (2011, p. 64) means that the system should be used
effectively after it is developed. Technical feasibility points to the technical resources
needed to develop, purchase install or operate the system. Economic feasibility looking for
projected benefits of the system should cover the estimated costs or more. The benefits
may be either tangible like saving the time or money or intangible like enhancing job satis-
faction through the user-friendliness or enhancing the company’s image. Schedule feasi-
bility refers to a project being implemented in an acceptable time frame.
Definition of Ready
Agile Alliance (2015a) describes the term ”Definition of Ready” as explicit and visible crite-
tria that a user story must meet prior to be accepted into the upcoming iteration, similarly
as the ”Definition of Done” is for the completed items. They describe the decrease the
amount of costly back-and-forth discussion or rework and possibility for the team to ”push-
back” as the benefits of using the ”Definition of Ready”.
Kronfält (2008) adds that before the stories have reached the readiness state, the stories
do not exist and will not be considered for sprint planning to save time.
Kronfält (2008) suggests definition of ready to include following facts:
- a user story exists, pointing out the actor, describing the feature and the purpose
for it
- the formulation of the story is general enough so that the team has the flexibility to
deliver it in increments
- The story is small enough to fit inside a sprint
- Each story has its own unique priority in relation to other stories in the product
backlog, to ensure that most important things are implemented first
- The story has a description of how it can be tested or demoed, giving the reader a
good sense of when story is completed
- The story has been estimated
Agile Alliance (2015) shows Definition of Ready as a station on Scrum on the Subway
map to agile practices (Figure 2-19)

50
Figure 2-19 Subway Map to Agile Practices (Agile Alliance, 2015b)
Hypothesis-driven development
O’Reilly (2013) guides us to challenge the concept of having fixed requirements for a
product or service. He states that when you are in an exploratory, complex and uncertain
phase you need hypotheses more than fixed requirements. He also guides us to aim to
utilize the full potential, experience and competency of cross-functional multi-disciplined
team by encouraging all the members of development team to think and share insights on
the problem and potential solutions.
O’Reilly (2013) explains how the traditional user story framework is focused on capturing
requirements for what we want to build and for whom, to enable the user to receive a spe-
cific benefit from the system.
As A…. <role>
I Want… <goal/desire>
So That… <receive benefit>
He compares the tradition user story framework to the Behaviour Driven Development
(BDD) and Feature Injection that aims to improve the original framework by supporting
communication and collaboration between developers, tester and non-technical partici-
pants in a software project.

51
In Order To… <receive benefit>
As A… <role>
I Want… <goal/desire>
And finally states that when viewing work as an experiment, the traditional story frame-
work is insufficient. According to him, the indications or signals that indicate that hypothe-
sis is correct need to be stated before testing so that the corrupting the interpretation of
the results is minimized.
According to O’Reilly, a user story structure to support Hypothesis-Driven Development
would be
We believe <this capability>
Will result in <this outcome>
We will have confidence to proceed when <we see a measurable signal>
He gives an example of Hypothesis-Driven Development user story:
Business Story
We Believe That increasing the size of hotel images on the booking page
Will Result In improved customer engagement and conversion
We Will Have Confidence To Proceed When we see a 5% increase in customers
who review hotel images who then proceed to book in 48 hours.
O’Reilly reminds that in agile software development we define working software as the
primary measure of progress. He also states that by combining Continuous Delivery and
Hypothesis-Driven Development it is possible to define working software and validated
learning as the primary measures of progress. He also reminds that ideally we should not
say we are done until we have measured the value of what is being delivered – in other
words, gathered data to validate our hypothesis.
O’Reilly suggests performing the A/B Testing to test hypothesis and measure the change
in customer behavior. Alternatively, he suggests to use customer surveys, paper proto-
types, user and/or guerilla testing.
2.2.3 Requirements management phases
Murphy (2010) says that when requirements are defined and captured, they need to be
managed actively and correctly. She says that this is important especially in agile, where

52
user stories and requirements need to be defined, estimated, re-estimated developed and
tested in a short period of time.
According to Murphy (2010), successful RM consists of
- prioritizing and assigning resources to highest priority and highest-risk require-
ments
- baselining the requirements by setting measurable success standards/tresholds
for all requirements to keep all stakeholders on the same page
- tracking changes to compare current with pre-defined
According to Murphy (2010) the main role of requirements management is to control and
manage the impact of changes to defined operational need. She mentions following phas-
es of requirements management (Figure 2-20):
- Prioritization: With prioritization the hierarchy for the requirements is set. Require-
ments should be prioritized against customer need and business risk.
- Relative importance: Establishing the relative importance of functionalities is about
adding objectivity to the application lifecycle by collaborating between business and IT
for finding the agreement about delivering the greatest product value at the lowest
cost.
- Traceability: Traceability shows the associations that exists between requirements and
other entities in the lifecycle which allows a business analyst to manage scope creep
and verify all requirements have been met.
- Change management: Change is a requirement alteration, addition or deletion.
Change can be needed almost anytime and from several reasons like missed func-
tionality, new defects found, incomplete understanding, politics, marketplace changes
or legislation changes. Murphy states that main role of requirements management is to
control and manage the impact of changes to defined operational need and give the
visibility for the stakeholders into the alterations.
- Status tracking: Status tracking is enabled by traceability. Linking the requirements
and other assets gives the business the better idea of the true quality of the applica-
tion and ability to go alive. Murphy also states that, comparing the number of require-
ment changes to baseline, and tracking how many defects are associated with re-
quirements, shows the business analyst how accurate requirements were in the first
place. Too many changes or defects are an indication that the requirement may be in-
accurate—the sooner this is identified the better.

53
Figure 2-20 Requirements management phases (Murphy. 2010)
In agile development, when splitting features into implementable stories, it should be con-
sidered which set of the stories provide value for the users. In agile continuous develop-
ment it is important to keep stories small to fit in iterations, but when releasing to the cus-
tomers it has to be taken care that the feature is whole and usable with the minimum
scope. Minimal marketable feature (MMF) a chunk of functionality that delivers a subset of
the customer’s requirements, and that is capable of returning value to the customer when
released as an independent entity (IIBA, 2015. p.105).
Prioritization is a process used to determine the relative importance of business analysis
information. The importance may be based on value, risk, difficulty of implementation, or
other criteria. These priorities are used to determine which business analysis information
should be targeted for further analysis, which requirements should be implemented first,
or how much time or detail should be allocated to the requirements. There are many ap-
proaches to prioritization. Prioritization can be classified for example into: Grouping, Rank-
ing, Time boxing/Budgeting, and Negotiation (Figure 2-21). (IIBA. 2015. p. 310)

54
Figure 2-21 Approaches to prioritization (IIBA. 2015. p. 310)
When choosing a prioritization approach, business analysts consider the audience, their
needs, and their opinions on the value a requirement or business analysis information
brings to a stakeholder's respective area. Business analysts revisit priorities and utilize
different approaches when changes occur in the business environment, to the stakehold-
ers, and to the business analysis information (IIBA. 2015. p. 310)
2.3 Metrics
W. Edwards Deming, the famous quality management expert, has offered: "Without data,
you are just another person with an opinion." (Reh, 2016b) And who can tell which opinion
is better than others?
Metrics and key performance indicators measure the performance of solutions, solution
components, and other matters of interest to stakeholders. (IIBA, 2015, p. 297)
A metric is a quantifiable level of an indicator that an organization uses to measure pro-
gress. An indicator identifies a specific numerical measurement that represents the de-
gree of progress toward achieving a goal, objective, output, activity, or further input.

55
A key performance indicator (KPI) is one that measures progress towards a strategic
goal or objective. Reporting is the process of informing stakeholders of metrics or indica-
tors in specified formats and at specified intervals. (IIBA, 2015, p. 297)
Key Performance Indicators (KPIs) are metrics that measure performance in relation to
desired outcomes. All KPIs are metrics, but not all metrics are KPIs. KPIs facilitate the
execution of strategic plans by translating desired outcomes into quantifiable targets,
measure the success of an organization rather than just tracking activities that have hap-
pened in the past, are designed to help organizations achieve targets, so they must be
actionable and are strategic, therefore they measure multiple facets of performance, in-
cluding financial, non-financial, historical and directional. KPIs encompass more than hard
numbers. Directional KPIs track ongoing improvements. For instance, a survey designed
to measure customer satisfaction provides more indepth information than simply tracking
customer service calls. Although this information is subjective in nature, organizations can
quantify the data for the purpose of tracking and analysis. (Warwick. 2013)
Metrics and reporting are key components of monitoring and evaluation. Monitoring is a
continuous process of data collection used to determine how well a solution has been
implemented as compared to the expected results. Evaluation is the systematic and ob-
jective assessment of a solution both to determine its status and effectiveness in meeting
objectives over time and to identify ways to improve the solution to better meet objectives.
The top priorities of a monitoring and evaluation system are the intended goals and effects
of a solution, as well as inputs, activities, and outputs. (IIBA, 2015, p. 297)
McDonald (2015, Chapter 3) says that good metrics are a powerful way to describe what
you want to accomplish with an IT project and know how close you are to getting there,
driving needed behavior change along the way. He also reminds that different types of
metrics are appropriate for different situations. Daskalantanakis states that metrics are
only the means to an end and the ultimate goal of improvement comes through measure-
ment analysis and feedback (Datta, 2007, p. 45).
Datta (2007, p. 38-39) says that metrics in software are used not merely to measure, but
also to guide. He also explains that they are wanted for monitoring, feedback and decision
making. Datta (2007, p. 19) also reminds that further decisions are made in combination
of observation and perception, facts and hunches, objectivity and subjectivity.

56
Reh (2016b) states that businesses rely on metrics to measure performance over time
and monitoring progress towards achieving key goals. He separates Financial metrics
away from non-financial metrics and defines those as follows:
Financial metrics are drawn from accounting measures help management, shareholders
and key stakeholders assess an organization's overall financial health at a point in time as
well as monitor the improvement or decline in health over a period of time. Typical finan-
cial metrics are
- liquidity ratios
- financial leverage ratios
- asset efficiency ratios
- profitability ratios
Non-financial metrics focus on other process, service or quality measurements important
to monitoring the organization's health and success. Typical non-financial metrics are
- Measures of customer satisfaction measures, including net promoter score
- Measures of employee engagement or satisfaction
- Quality metrics
- Measures of learning and developments
Reh (2016b) points out that often metrics are collected and displayed in a format called a
scorecard. The scorecard consists of those metrics agreed upon by management as the
most important leading and lagging indicators of business performance. This scorecard is
used by a firm's functional managers to identify areas to improve and to evaluate the ef-
fectiveness of prior investments and changes. Ideally, management teams prefer to identi-
fy metrics that foreshadow positive changes in financial results at some point in the future.
These leading indicators help management teams fine tune programs and investments to
ensure ongoing strengthening of the metric. (Reh, 2016b)
2.3.1 Qualities of the metrics
Despite the metrics, good individuals and teams will often do what is correct for the
customer and the business, but well-intentioned teams will eventually be worn down by
poorly targeted metrics and conform to the bad measures until management changes the
direction with better metrics. (Pixton and others, 2014, Chapter 9)
Croll and Yoskovitz (McDonald, 2015, Chapter 3) describe five areas to consider when
identifying the metrics to IT projects: Quality versus Quantity, Vanity versus Actionable,
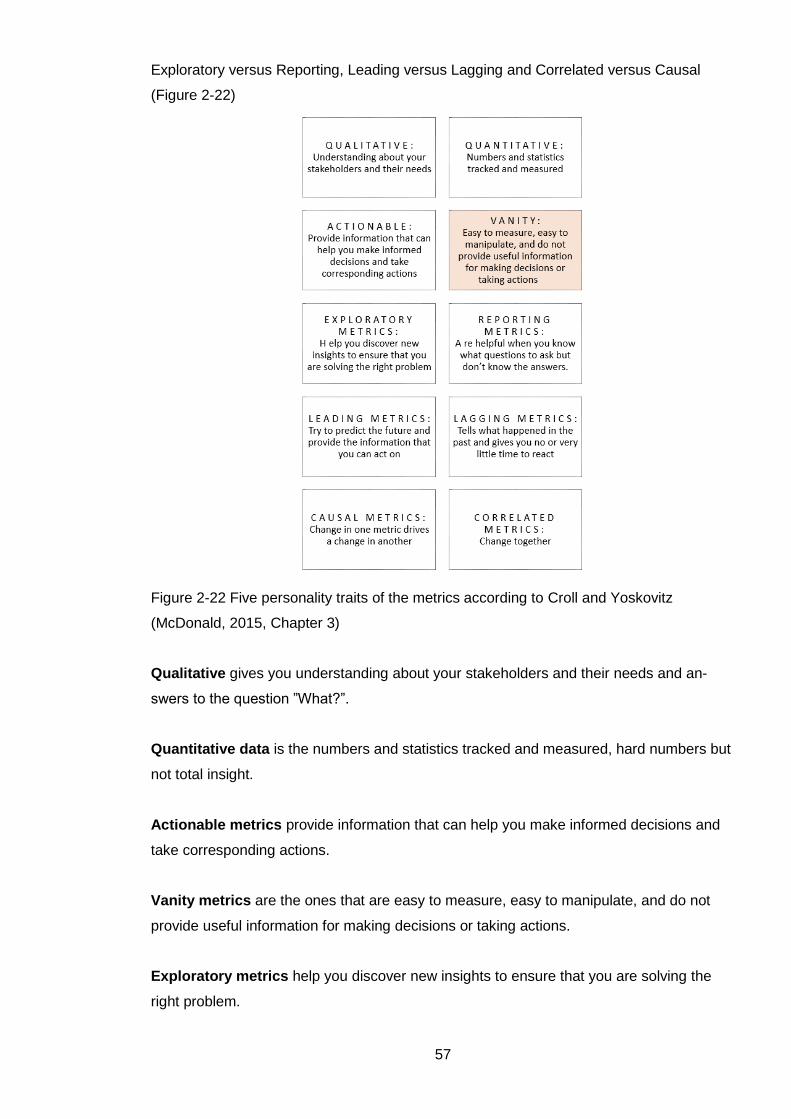
57
Exploratory versus Reporting, Leading versus Lagging and Correlated versus Causal
(Figure 2-22)
Figure 2-22 Five personality traits of the metrics according to Croll and Yoskovitz
(McDonald, 2015, Chapter 3)
Qualitative gives you understanding about your stakeholders and their needs and an-
swers to the question ”What?”.
Quantitative data is the numbers and statistics tracked and measured, hard numbers but
not total insight.
Actionable metrics provide information that can help you make informed decisions and
take corresponding actions.
Vanity metrics are the ones that are easy to measure, easy to manipulate, and do not
provide useful information for making decisions or taking actions.
Exploratory metrics help you discover new insights to ensure that you are solving the
right problem.

58
Reporting metrics are helpful when you know what questions to ask but don’t know the
answers. An example of a reporting metric is velocity.
Leading metrics try to predict the future and provide the information that you can act on.
Lagging metrics tells what happened in the past and gives you no or very little time to
react.
Correlated metrics change together and with causal metrics change in one metric drives a
change in another. Identifying a correlation can help you identify causation. Finding even
a partial causal relationship between metrics can help to identify a successful outcome.
2.3.2 “What you measure is what you’ll get”
Ariely (2010) states that by measuring only what is easy, you only maximize what is easy,
but no more. He explains the case where the CEO usually is measured by stock value,
which may lead to only raising the value even short-sighted, when the attention should be
put to the real drivers of sustainable success, like amount of jobs created by the firm, sat-
isfaction of both the customers and employees, the level of trust in the company and
brand.
Eckel (2011) describes getting what you measure via the example about the schools in
the U.S., where they measure test scores which leads to the fact that students learn how
to take tests rather than learning how to think and be creative, which would be needed in
real life more than the skill of taking the tests. He also states that deciding what to meas-
ure equals to setting your goal, both are about predetermining what is going to be im-
portant.
Also Bozarth (2014) warns about falling into easy measures and vanity metrics. She gives
an example about getting only what you measure: when grading the employee by the
number of the tickets closed, they only concentrate to closing the tickets and may do it
even ruthlessly.
Data and the organization of it into performance metrics and scorecards is a critically im-
portant task in today's organization. Nonetheless, managers are cautioned to remember
that, "what gets measured gets done." Choose your metrics and measurements carefully.
(Reh, 2016b)

59
According to Datta, the biggest mistake about metrics is trying to evaluate teams and indi-
viduals with them. Instead that, the metrics should be used for guiding us in making deci-
sions and better understand situations. (Datta, 2007, p. 67)
Pixton and others (2014, chapter 9) point out that metrics are likely to be gamed when
they are used to comparing the efficiency of the teams or to place blame. They explain
that people try to avoid the blame by any means, which leads the fact that instead of
gaining the improvement, effort is put to the gaming and the improvement is lost. Also if
teams or individuals believe that the metrics will be used against them, it is very likely that
the data will be adjusted to make the results look good in the eyes of the business. (Pixton
and others, 2014, chapter 9)
2.3.3 Examples of metrics and their impact
Pixton and others (2014, chapter 9) suggest to use customer acceptance as the key
measure instead of internal development metrics. They also state that many project
failures arise from measuring the process rather than the results or the outcomes.
They give an example of using following the plan as a worst measure can be made,
because then there is no space for improvement during the implementation, but the only
important thing is to stick to the plan.
Pixton and others (2014, Chapter 9) gives following examples of the metrics, their
possible impact and suggestions for better metrics:
1. Challenge: quality suffering from growing technical debt
Suggested measure: how much of the code submitted to the library was covered
by automated testing scripts
To be noticed: they captured the data and, without announcing anything specific
to the teams, started displaying the results on a wall that was visible to the entire
team. over the next three months—and without ever formally announcing an
initiative to improve automated test coverage—unit test coverage increased
dramatically and the problems with product integration evaporated.
It was interesting to recognize that the team members obviously knew that they
were cutting corners but, until the metrics made their compromises visible, their
motivation to deliver on schedule was stronger than their motivation to deliver
validated quality. By creating and publishing the measure, the leaders clearly

60
demonstrated that they valued validated quality and the team modified its behavior
accordingly. The leaders wanted to achieve improved quality and they found a
metric to hit that goal.
2. Challenge: problems with code stability
Suggested measure: team decided to measure the number of check-ins per day
To be noticed: Over time, the team got into the habit of checking the code in
several times a week. The code was then integrated and tested more frequently.
As the code became more stable, they stopped measuring check-ins.
3. Challenge: Stage-Gate process for product development and they assessed
product quality just prior to product launch
Consequences: They ended up with difficult discussions about how many of the
known remaining defects they should let loose on their customers
Suggested measure: how often they completed a cycle without any known
defects
Reasoning: This would align with a goal of avoiding the delivery of any known
defects to their customers (which never seemed to make the customers happy or
satisfied with their products)—a much better measure of customer value.
To be noticed: In parallel with this useless activity (and unknown to the
executive), the product teams spent time looking for and getting to the root causes
on what created the problems. They then attacked these and measured those
results. This measure, as compared to the meaningless metric, was highly useful
to the teams and reinforced their ownership of product quality and the customer
experience. Focusing on this metric delivered an ongoing improvement trend that
was largely ignored by the customer support executive.
4. Using velocity measures to assess and project progress
Consequences: Management was misusing the measurement by rewarding or
punishing the team based on delivered velocity. This led to the fact that the team
adjusted both the delivered value and causing their delivery velocity to be always
exactly on target, making the whole measure pointless when the team was not
able to assess their progress and improvement.
Suggested measure: actual unadjusted velocity
To be noticed: It was pointed out that this required significant work that did not
add any value.

61
5. Using detailed “causal” analysis and categorization of every defect that they
fixed in development.
Consequences: To ensure that the analysis was done, the problem management
system did not allow the defect to be closed until all the 20 or so questions had
been answered. The time and cost to the individual developers to fill in the difficult
questionnaire were so high that many admitted to randomly selecting causes and
characteristics (gaming the metric). In fact, the items at the top of the list of causes
were the ones most often chosen (it took less effort to select from the top than to
scroll down the list).
Suggested measure: provide more useful insight much more easily with a brief
discussion between the developers as part of their retrospectives.
To be noticed: The goal of this exercise was to give insight into weaknesses in
the product, but it was totally ineffective.
6. Measuring effectiveness of the teams by the amount of code
Consequences: amount would rise as the highest priority over e.g. quality.
Suggested measure: use unit test escapes to measure the productivity instead
Reasoning: doesn’t straightly tell the level of the productivity, but helps to keep
the quality high and therefore have a big effect on overall productivity, due to the
cost of the fix on the unit testing phase is clearly lower compared to a fix in later
phase
7. Measuring programmers by schedule
Consequences: result in poorly targeted code with low quality, that is costly to
maintain and decreases revenues.
Suggested measure: measure by created business value instead
8. Measuring that team follows the process
Consequences: to gaming, meaning getting around the measurement, can result
in products that no customer wants to use, even if the implementation process was
followed.
Suggested measure: Focusing on meeting customer and business needs
9. Measuring the effectiveness of testing by the number of defects found by a
set of independent testers
Consequences: In this situation, testers are actually rewarded when they are given
poor-quality product to test. They can then generate a large number of “found”

62
defects that have the same underlying cause. By finding a large number of
defects, they prove their value!
Suggested measure: measure the growth in testing successes rather than
defects found
To be noticed: Binging the development and test teams together to enables
effective collaboration to deliver quality. In this arrangement, the testers sit next to
and work with individual developers—even during unit test phases—and
communicate face-to-face. Morale is higher and the whole team is working
together to deliver increased business value.
10. Measuring unit success independently for each division with the intent to
motivate teams to deliver increasing value
Consequences: The nasty side effect of that measure lead the business units to
compete against each other, often even in front of the customer, and the units
ended up with no motivation to help each other to deliver the best end-to-end,
totally integrated solutions.
Suggested measure: reward schemes were modified to cover larger
organizational elements until they were eventually based on the performance of
the whole company.
To be noticed: This not only removed the motivation for competition with internal
teams and individuals, but also sent a strong signal that collaboration to deliver
business value to the customer was the highest priority
In addition to the previous, Pixton and others suggests to keep in mind that reporting
should not end up as the waste on the teams lap, but the manager could for example take
part to the daily meetings or follow the teams dasboard for following the status or then
gather the data to be reported himself. This should both remove waste and create trust.
They also remind to be aware of statistical noice on minor variations in the reports and
encurages managers to trust teams on those situations, instead of wasting time to big
investigations, when the matter is only statistical noise.
2.3.4 Successfull metrics
To succeed in measuring, the project should be committed to the metrics, not vice versa
(Datta, 2007, p. 72-76). Datta also guides that in metrics-driven development, it should be
clarified what is wanted from the metrics before doing anything with metrics.
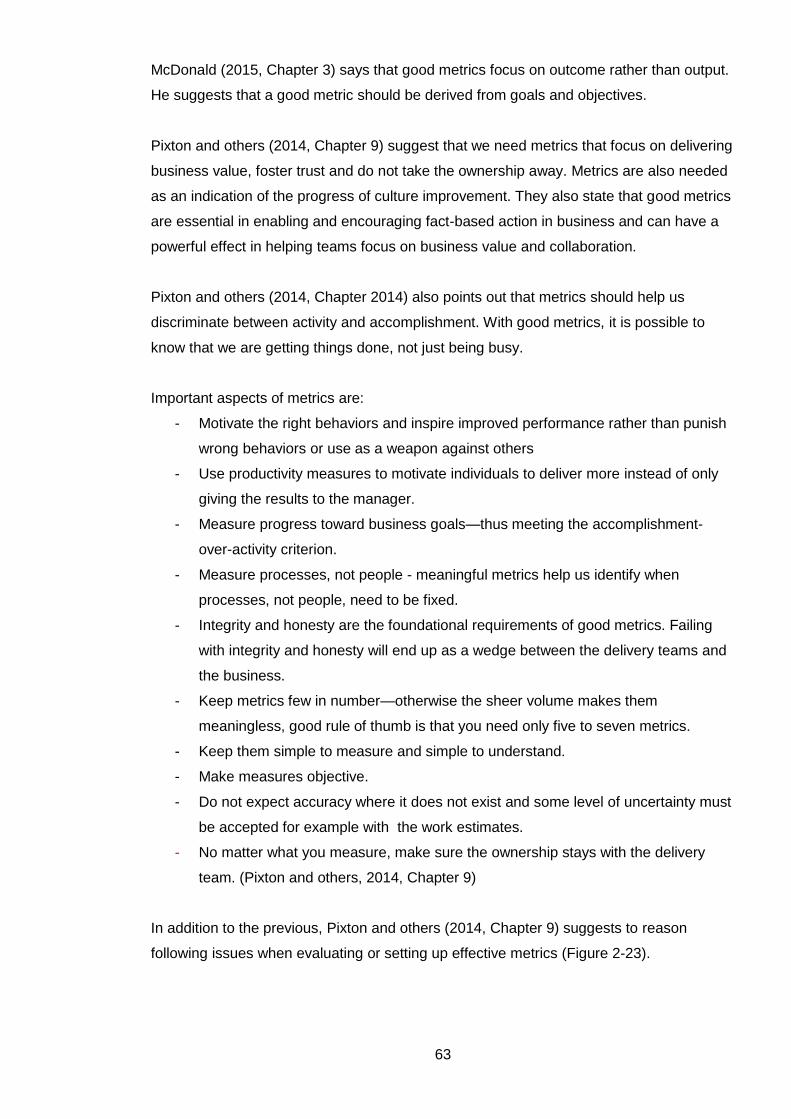
63
McDonald (2015, Chapter 3) says that good metrics focus on outcome rather than output.
He suggests that a good metric should be derived from goals and objectives.
Pixton and others (2014, Chapter 9) suggest that we need metrics that focus on delivering
business value, foster trust and do not take the ownership away. Metrics are also needed
as an indication of the progress of culture improvement. They also state that good metrics
are essential in enabling and encouraging fact-based action in business and can have a
powerful effect in helping teams focus on business value and collaboration.
Pixton and others (2014, Chapter 2014) also points out that metrics should help us
discriminate between activity and accomplishment. With good metrics, it is possible to
know that we are getting things done, not just being busy.
Important aspects of metrics are:
- Motivate the right behaviors and inspire improved performance rather than punish
wrong behaviors or use as a weapon against others
- Use productivity measures to motivate individuals to deliver more instead of only
giving the results to the manager.
- Measure progress toward business goals—thus meeting the accomplishment-
over-activity criterion.
- Measure processes, not people - meaningful metrics help us identify when
processes, not people, need to be fixed.
- Integrity and honesty are the foundational requirements of good metrics. Failing
with integrity and honesty will end up as a wedge between the delivery teams and
the business.
- Keep metrics few in number—otherwise the sheer volume makes them
meaningless, good rule of thumb is that you need only five to seven metrics.
- Keep them simple to measure and simple to understand.
- Make measures objective.
- Do not expect accuracy where it does not exist and some level of uncertainty must
be accepted for example with the work estimates.
- No matter what you measure, make sure the ownership stays with the delivery
team. (Pixton and others, 2014, Chapter 9)
In addition to the previous, Pixton and others (2014, Chapter 9) suggests to reason
following issues when evaluating or setting up effective metrics (Figure 2-23).

64
Figure 2-23 Things to evaluate when setting up effective metrics (Pixton and others, 2014,
Chapter 9)
1. What are we trying to achieve?
- What decisions needs to be made, what questions need to be answered?
- Beware of vanity metrics, things should never be measured just because it is
easy and possible.
- To keep the focus, the most important issues should be selected to be
measured for improvement and when they are improved, next important issues
should be selected to be measured instead.
2. Is the metric useful to the team?
- Metrics are most powerful when the teams choose those that will benefit them
the most.
- Team should also decide whether there are any current metrics that do not
serve them anymore.
3. How long will the metric remain useful?
- The metrics that are no longer useful should not be used anymore. Once the
goal or the metric has been achieved, dropping the metric should be
considered unless it is motivational over the long term.
4. What is the cycle time for action?
- Cycle time of the metrics should be used to evaluate the effectiveness of the
measure. The shorter the cycle the better.
- Waterfall report vs. daily automated test code coverage with action cycle time
was a single day
5. Are the candidate measures actually aligned with the business needs?
- It is essential to honestly assess whether improvements in the metric will
actually lead to the delivery of increased business value.
6. What is the true cost of collecting and analyzing the data?

65
- It should always be ensured that the cost of collecting the metric is significantly
less than the value that it can deliver.
- As the data collection can be expensive, so can the analysis.
7. What are the side effects of using this measure?
- Look out for negative or unexpected side effects. Consider how teams and
individuals are likely to respond in both the short and the long term.
- Consider the scope of a metric to ensure that it doesn’t create suboptimal
behavior.
8. How could metrics be misused and damage our focus on value delivery?
- With all metrics there is a potential for misuse.
- Ideally collect the data automatically, so that there is no possibility for anyone
to enhance the data.
- Possibilities for gaming and green shift, where the tendency of the outlook and
status to get better as they are reported higher up the organization, should be
noticed and taken in account and their impact should be minimized
”The most effective measures are strongly aligned to outcomes such as business and
customer results. No amount of internal measures can disguise actual customer
satisfaction or real business results. Results or outcome-based measures cannot be
gamed.” (Pixton and others, 2014, Chapter 9)
Pixton and others suggest to base the metrics on learning. They encourage that every
problem is an opportunity for improvement and every failure is an opportunity to learn a
better solution. They also remind that innovations can be developed learning what
customers really want.
The lean movement has been preaching waste reduction for many years. Instead of
measuring the creation of value by our ability to produce tangible high-quality artifacts,
startups measure value by validated learning about customers. This approach clashes
with classic product management and product development. The detailed specification
documents that PMs demand go stale too quickly to keep up with a fast-learning team.
Massive data warehousing reports used in product dev do what warehouses do well, store
data. They don’t promote learning, because people learn best when presented with a
small number of actionable metrics. And engineers who build heavyweight architectures
may design a technical triumph, but lack the agility to adapt when the goal of the system
changes radically. (Ries. 2010)

66
Croll and Yoskovitch (2013) introduce the concept of the One Metric That Matters
(OMTM) meaning that at any given time, there’s one metric you should care about above
all else. They say that communicating this focus to your employees, investors, and even
the media will really help you concentrate your efforts. They emphasize that OMTM is not
meaning that there should only be one metric you care about.
2.3.5 Enterprise balanced score card
Scaled Agile (2010-2016b.) introduces also the enterprise balanced scorecard as a set of
portfolio metrics (Figure 2-25). The measures to be mapped to executive dashboard are
efficiency, value delivery, quality and agility.
Figure 2-24 Enterprise balanced scorecard (Scaled agile. 2010-2016b)
Popularity of this approach has been declining over time in favor of the Lean Portfolio Met-
rics. (Scaled Agile. 2010-2016b.)
2.3.6 Lean portfolio metrics
Scaled Agile (2010-2016b.) introduces the lean portfolio metrics as the simplest set to
measure the transformation to agile (Figure 2-24). The metrics aim to measure employee
engagement, customer satisfaction, productivity, agility, time to market, quality and part-
ner health.

67
Figure 2-25 Lean portfolio metrics (Scaled agile. 2010-2016b)
Lean portfolio metrics expands the scorecard metrics to the partner health and employee
satisfaction. These metrics measure the total portfolio success.
2.3.7 Business value
Shore (2006) states that productivity is defined as ”amount of output per unit of time” or
”Output/Time”. He states that velocity is not a metric for measuring productivity, but only
hours worked and estimate accuracy. Shore suggest measuring revenue, return on in-
vestment or some other number that reflects to business value. Shore continues that
measuring value-based productivity requires the whole team to focus on releasing quickly,
acknowledging the importance of product vision and understanding how users will really
benefit from the software.
In the other hand Van Cauwenberghe (30.12.2009) raises a question that ”How do you
estimate the Business Value of User Stories?” And answers that “You don’t.” He states
that already the question is wrong, that we should ask that “How do we find the User Sto-
ries that deliver the Business Values?” Also Thomas, a reader of his blog, commented the
post by an opinion of a colleague, that from the lean perspective User Stories Business
Value Estimation ==waste+waste(inventory +over processing) and Thomas himself sug-
gests only to decide what is the most important stuff that we want to see running. (Van

68
Cauwenberghe, 30.12.2009) So it is good to keep in mind that evaluating the value should
not grow too big effort that it ends up as waste.
In addition Ariola, W. and Dunlop, C., 2014 has stated that “We mustn’t accept that the
trend toward accelerating the development process will magically improve software quali-
ty, but we should expect the opposite. And if we are going to mitigate risk in today’s envi-
ronment, we need to reengineer the software development process in a way that consid-
ers business risk to be one of the metrics, along with the other traditional results of our
automated testing and Continuous Integration systems.“ (Parasoft, 2015)
Value velocity
Later Shore (2007) critizises his previous thoughts about measuring the value. He states
that the problem with measuring business value is separating out the effects of the team's
work from all of the other things going on in the organization. Although this is usually a
strength of the metric, sometimes the team's contribution gets lost in the noise. He sug-
gests that rather than trying to measure the business value after the delivery, you should
to get the business experts to estimate the business value beforehand as relative value
velocity.
With the value velocity Shore (2007) still reminds that stories don’t always have value of
their own, but require multiple stories to create one feature with recognizable value.
Therefore it might be feasible to estimate and score the features instead of stories.
He also states that some type of stories don’t provide value in traditional way. It is hard to
evaluate value of fixing a nasty crash bug, value of the entire software or value of fit and
finish, meaning adjusting color schemes and making sure all the pixels line up neatly. He
puts it nicely that “One fit and finish story may not have value, but there is often value in
having a polished presentation.”
He also reminds to keep in mind the vulnerability of value velocity against the gaming.
Purpose alignment model
Purpose alignment model can be used to assess ideas in the context of customer and
business value (Figure 2-26). From agile perspective the model aids in making
prioritization decisions and focusing investment on those features or capabilities that are
of greates value to the organization. To rate activities, processes, products or capabilities
in two dimensions and then recommend the best actions to take to improve them based
on those ratings. First dimension is whether or not the activity creates market
differentiation the second is whether or not the activity is critical for the continued
functioning of the organization. (IIBA. 2011. p. 79)

69
Figure 2-26 Purpose alignment model (IIBA. 2011. p. 79)
IIBA (2011. p. 80) explains the use of quadrants as follows:
- Differentiating quadrant - Features, products or services that both serve to dif-
ferentiate the organization in the marketplace and are critical to the functioning
of the company are part of the differentiating quadrant. These are the things in
which the organization should be prepared to invest to offer something that is
distinct from competitor offerings.
- Parity quadrant - Things which are mission critical, but not maket differentiat-
ing, fall into the parity quadrant. That means that it is usually sufficient to be
operating on par with other firms in your industry.
- Partner quadrant - Activities that may have unique value to customers but
which are not critical to the functioning of the organization fall into the partner
quadrant. Even though theses activities are important to customers or other
stakeholders the organization doesn’t need to perform them to survive.
- Who cares? Quadrant Finally activities which are neither mission-critical or
help to differentiata the organization in the marketplace fall into the who cares
quadrant. As these activities do not add customer value, and the organization
can function withouth performing them, they are prime candidates to be elimi-
nated and the resources reallocated to support more useful work.
Model is designed for use by for-profit organizations that face competition in the market-
place and it provides guidance on whether something should be an area of strategic con-

70
cern but does not provide any guidance on what strategies or decisions might be the cor-
rect ones. This model is simple and easy to use in a facilitated collaborative environment.
It can be applied all the way up and down the investment decision process, from strategic
investment down to an individual feature in a system. It is fast and entire backlog can be
analyzed in less than an hour. Disadvantage is that the model assumes positive intent in
the business strategy and does not incorporate ”spoiler” behavior by corporations.
(IIBA.2011. p. 80)
Agility Index
Evidence-Based Management for Software Organizations introduces the Agility Index for
measuring the value of your investment in Agile processes, tools, training and coaching.
They say that traditional metrics might give the insight into improvements of operational
efficiency but the real conversation is about the value created for your organization by the
improved processes. (EBMgt. 2016)
Financial success and stakeholder satisfaction are a great way to start thinking in terms of
the value delivered by your teams. Numbers tracking ITs ability to deliver this value fre-
quently and of high quality are leading indicators of this success. Current Value met-
rics show how your strengths generate business value. Time-to-market and Ability to In-
novate metrics measure your organizations ability to sustain its value in the future.
The Agility Index™ enables you to measure the improvement in business outcomes and
track the return of your investment. (EBMgt. 2016)
Agility index evaluates product cost ratio, employee satisfaction, customer satisfaction,
revenue per employee, total defects, release frequency, release stabilization, cycle time,
installed version index, usage index and innovation rate (Figure 2-28). (EBMgt. 2016)

71
Figure 2-27 Agility index
Despite of the marketing speech that is given about the Agility index, they list interestingly
together the important areas of the value and quality.
2.3.8 Customer satisfaction
Olsen (2015, p. 229) explains that customer research techniques for a new product differ
before and after launch. Olsen introduces a framework that his colleague Cristian Rohrer
has created for research methods. Simplified version of that framework is shown on figure
2-29.
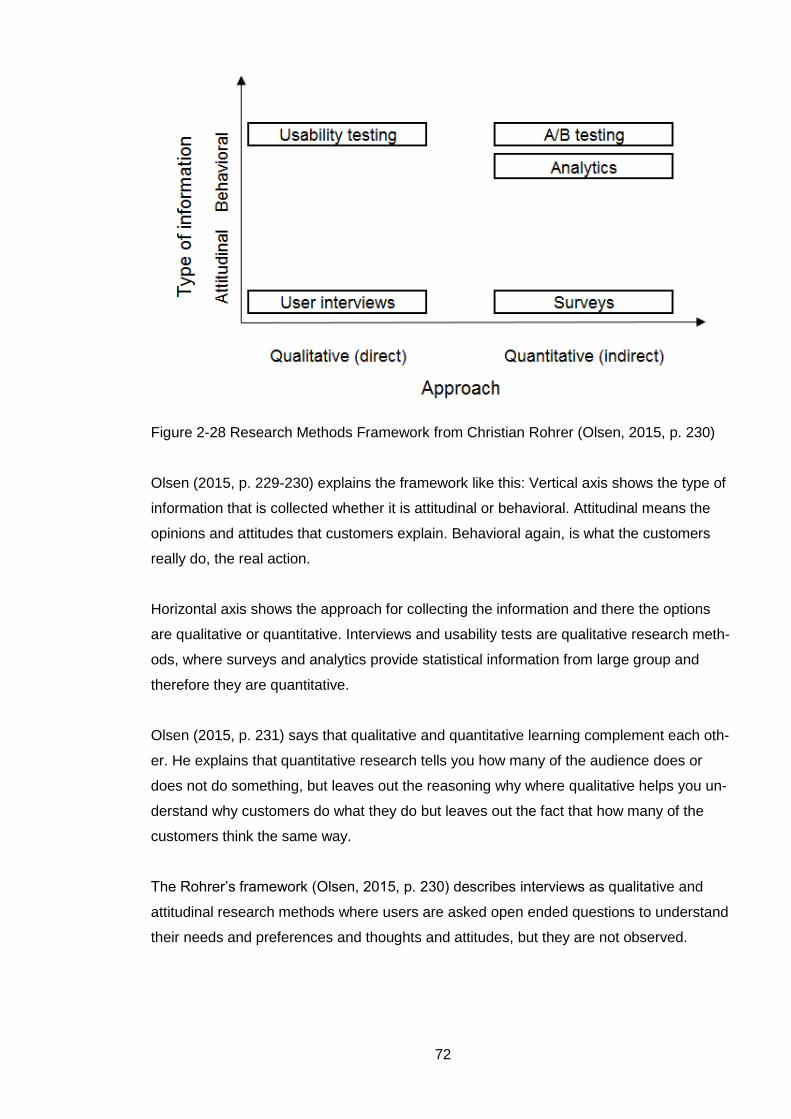
72
Figure 2-28 Research Methods Framework from Christian Rohrer (Olsen, 2015, p. 230)
Olsen (2015, p. 229-230) explains the framework like this: Vertical axis shows the type of
information that is collected whether it is attitudinal or behavioral. Attitudinal means the
opinions and attitudes that customers explain. Behavioral again, is what the customers
really do, the real action.
Horizontal axis shows the approach for collecting the information and there the options
are qualitative or quantitative. Interviews and usability tests are qualitative research meth-
ods, where surveys and analytics provide statistical information from large group and
therefore they are quantitative.
Olsen (2015, p. 231) says that qualitative and quantitative learning complement each oth-
er. He explains that quantitative research tells you how many of the audience does or
does not do something, but leaves out the reasoning why where qualitative helps you un-
derstand why customers do what they do but leaves out the fact that how many of the
customers think the same way.
The Rohrer’s framework (Olsen, 2015, p. 230) describes interviews as qualitative and
attitudinal research methods where users are asked open ended questions to understand
their needs and preferences and thoughts and attitudes, but they are not observed.

73
Usability testing
The Rohrer’s framework (Olsen, 2015, p. 232) suggests usability testing for gathering
qualitative and behavioral information about users.
Surveys
The Rohrer’s framework (Olsen, 2015, p. 232-233) describe surveys as quantitative and
attitudinal research method. Olsen says that surveys are a good tool when you want to
ask simple questions about user’s attitudes, importance, and satisfaction, how they feel
about the product or brand or how they see your product compared to the competitors. He
mentions that using surveys asking same questions at periodic interval helps to identify
trend over time. He also states that the danger of using surveys is that surveys very often
are misused if they are not well designed. If users have too little information about the
product under survey, they cannot give true answers. Another danger is that user’s opin-
ions often don’t end up matching behavior and therefore in some cases a smoke test
might give more reliable answers to the same question than a survey. Also the survey
results may differ a lot depending on the wording used in survey, so you must pay atten-
tion to how you set up the questions.
Pixton and others remind that to get realistic answers it is beneficial to use anonymous
survey instead of asking people in person. (2014, Chapter 9)
Net promoter score
Olsen (2015, p. 233) mentions that Net Promoter Score is the one of the most widely used
survey-based metrics. According to him the Net Promoter Score is based on the result of
the question “How likely are you to recommend [product x] to a friend or a colleague?”.
Scale of likelihood is from 0 to 10, where o is “not all likely” and 10 is for “extremely likely”.
Answers are scaled as follows: 9 or 10 are called promoters, 7 and 8 are called passives
and from 0 to 6 are called detractors. To calculate the Net Promoter Score take the per-
centage of promoters and subtract the percentage of detractors. The score can range
from -100 to 100. Olsen (2015, p. 234) describes Net Promoter Score as attitudinal meas-
ure of customer satisfaction with your product and also as a proxy indicator of product-
market fit.
The Rohrer’s framework (Olsen, 2015, p. 235) leaves analytics and A/B testing as the
quantitative and behavioral research method. Olsen (2015, p. 235) explains that analytics
gives you the real picture of what user’s do and you may reach statistically significant
conclusions.

74
Kano analysis
Kano analysis helps agile team understand which product characteristics or qualities will
prove to be a significant differentiator in the marketplace and help to drive customer
satisfaction. It assists in identifying features that will have the greates impact on customer
satisfaction, either because they are exceptionally important or because their absence will
cause intense dissatisfaction. This helps the team determine which features are the most
important to implement before releasing a product to market. (IIBA. 2011. p. 74)
Kano analysis rates product charachteristics on two axes, Extent to which the feature is
implemented in the product and Level of customer satisfaction that will result from any
given implementation level. Resulting graph is plotted on 2x2 matrix. Based on the
resulting profile, the product characteristic should fall into one of three categories:
Treshold, Performance or Exitement. Analysis can be used to try and identify
characterisics that will give the product a unique position in the marketplace (IIBA. 2011.
p. 74)
IIBA (2011. p. 74) describes the categories as follows:
- Treshold characteristics - Those absolutely necessary for stakeholders to
consider adopting a product. Absence will cause intense dissatisfaction but as
they represent minimun acceptance criteria their presence will not increase
customer satisfaction beyond certain low level.
- Performance characteristics - Those for which increases in the delivery of the
characteristic produce a fairly linear increase in (75)satisfaction. They
represent the features that ustomers expect to see in a product (speed, ease of
use etc).
- Excitement characteristics - Those that significangly exceed customer
expectations or represent things that the customer did not recognize were
possible. Their presence will dramatically increase customer satisfaction over
time.
According to IIBA (2011. p. 74) customer should be surveyed over the feature both
functional and dysfunctional with questions
- Functional: how do you feel if this feature or charactheristics is present in the
product?
- Dysfunctional: how do you feel if this feature or characterisic is absent in the
product?

75
And possible answers to each question form are
- I like it that way
- I expect it to be that way
- I am neutral
- I can live with it that way
- I dislike it that way
Determining the category is based on mapping the answers to both forms of the question
to the grid in the figure 2-27. The top row represents the answers to the dysfunctional form
of the question and the left column represents the answers to the functional form of the
question. (IIBA. 2011. p. 74)
Figure 2-29 Kano analysis (IIBA. 2011. p. 74)
The approach is most applicable for consumer products of goods that will be resold, as it
focuses on identifying the requirements that will encourage widespread use or adoption of
a product. The categorization of a particular characterisic tends to shift over time, as
customers grow to expect features or characteristics to be present in a product. Eciters
eventually become a standard expectation and treshold characteistic. (IIBA. 2011. p. 74)
A/B testing
A/B testing (also known as split testing or bucket testing) is a method of comparing two
versions of a webpage or app against each other to determine which one performs better.
AB testing is essentially an experiment where two or more variants of a page are shown to

76
users at random, and statistical analysis is used to determine which variation performs
better for a given conversion goal. (Optimizely, 2016)
Data analytics
Analytics is the discovery, interpretation, and communication of meaningful patterns in
data. Especially valuable in areas rich with recorded information, analytics relies on the
simultaneous application of statistics, computer programming and operations research to
quantify performance. Analytics often favors data visualization to communicate insight.
(Wikipedia. 2016b.)
When setting up the data analytics, you should
- define the questions where you want answers (e.g. buying pattern, navigation pat-
tern, customer service history, matching of similar patterns, profiling customers in-
to behavior patterns)
- find answers to ‘what must be true questions’ like what must be true to get the in-
formation or what must be true to use the gathered information
- break big uncertain things into pieces and eliminate uncertainties in small phases
- take care that the data needed is in consumable form
- find an analyzing tool to do profiling and predicting
(Pixton et al, 2014, Chapter 1)
Efficient data analysis could help to improve both requirements definition and manage-
ment, if the results answered to correct questions and were provided automatically regular
basis and as trends. A specialist being in charge of the data analysis would be a treasure
for Product Owners.
2.3.9 Employee engagement and satisfaction
Leaders need early indications for modifying their course. Improving the ways of working
and moving to the Energy and Innovation can be followed by measuring Leadership
effectiveness in enabling the change, Trust, Ownership, Business alignment and purpose
and Honestly dealing with ambiguity and complexity. (Pixton and others, 2014, Chapter 9)
Pixton and others (2014, Chapter 9) suggests to survey the workers within the
organization and ask them to rate those five characteristics in their environment. They
suggest to use the Net Promoter Score for measurements, if it only feels comfortable,
since it will be enough to give the working-level view to the situation.

77
According to Pixton and others (2014, Chapter 9), running a collaborative sticky note
session with the team is another method to measure the progress to the green. In this
session the team is asked what would make them more effective. Power of this session is
that it will point out the areas that need work.
To measure the culture improvement Pixton and others (2014, Chapter 9) suggests to
measure the following areas:
1. Leadership Effectiveness Metrics: Pixton and others (2014, Chapter 9) states that the
most critical factor in building a powerful culture is the effectiveness of our leaders.
They raise the Net Promoter Score (NPS) as the most useful measure of leadership
effectiveness in promoting a new culture or approach. In leadership NPS teams could
be asked how much value there is in a new approach (e.g. by asking whether they
would recommend their leader’s approach to their peers). This gives the insight into
progress in building and understanding the value of the approach. In addition to
identifying the action areas, carrying out a survey demonstrates that leaders are
engaged. According to Pixton and others, IBM measured its progress on both mindset
and deployment when promoted the use of Agile across the company.
2. Trust: Measuring the amount of trust needed or the felt level of trust is difficult to
assess. Simply asking teams what would make them more productive and then
looking to see where “increasing trust” appears in the list can give a good idea of what
the team believes it needs. NPS is a good tool for gathering the results anonymously.
(Pixton and others, 2014, Chapter 9)
3. Ownership: Assessing the level of ownership of the business commitments is also
challenging. Best way to do it is to look at the behaviors or the team by finding out do
the teams make their own commitments, do they meet their commitments, do they
track and manage their own progress, do they understand the business pressures and
the needs of the business, do they understand the unique value proposition of their
project and business goal. . (Pixton and others, 2014, Chapter 9)
4. Honestly dealing with ambiguity and complexity: Dealing Honestly with Ambiguity is
one of the most important and yet challenging measures, because of our personal and
organizational quest for certainty. The easiest way to get the team’s view over this is
to use the NPS with a question like: On a scale of 1 to 10, how well do you feel we
deal honestly with ambiguity?. In addition it is worth to revisit the ideology, whether it is
required to follow a plan or is it allowed to change the plans on go, is uncertainty

78
included in estimations, are people in charge of implementation involved in making
commitments.

79
3 Agile requirements management in Basware P2P development
This chapter introduces the current software development model and the requirements
management practices in the target organization. It also describes the results of manage-
rial interviews about requirements management and measuring, investigation over current
state of the metrics and the facilitated workshop that was held among the Product owners,
Product managers and Project managers to find the proper metrics.
3.1 Company strategy
In summary company strategy (Basware. 2016.) defines the future goals like this:
Basware’s vision of the significant growth potential in the markets it operates in and
Basware’s ability to capture that opportunity is unchanged.
Cloud revenue growth is Basware’s primary objective and where long term value in our
business will be created. Cloud revenues are comprised of revenues from SaaS, other
subscriptions, network transactions and financing services.
An additional set of actions to boost future growth, simplify our operations and improve
our productivity have been identified. These actions will mainly be targeted at:
- Continuing to strengthen sales and marketing to drive cloud revenue growth
- Focusing on Customer Success by further improving customer satisfaction and
experience
- Continuing to grow and monetize the network and data assets with financing and
other value added services, focusing on product development and partnerships
- Increasing productivity by simplifying our operations and increasing scalability
- Evolving our culture and way of working to focus more on performance
As before, organic growth is the key focus and this will be supported by a disciplined ac-
quisition strategy.
Simplifying Basware’s operations begins with rationalizing its targets. For the period from
2017 to 2020, Basware will focus on three key metrics aimed at boosting cloud revenues:
- Cloud revenues to increase by more than 20% CAGR on an organic basis
- Annual net sales greater than EUR 220 million
- Recurring revenue approximately 80% of net sales
At the same time Basware will continue to improve underlying profitability (excluding
growth related investments) over the period.

80
3.2 Alusta development model
The organization development model consists of agile product management, program
planning, project planning, feature based development and releasing supported with gov-
ernance, tools and support (Figure 3-1).
Figure 3-1 Basware Alusta development model
Feature development lifecycle
Feature development lifecycle describes the feature development process in the organiza-
tion (Figure 3-2). The process describes how the features go through the implementation
process with few gates described on the way.
Figure 3-2 Feature development lifecycle
Alusta development is based on release train approach (Figure 3-3). In this ap-
proach, release schedules are fixed and scope is flexible. Each team develops features
continuously staring the next one when the previous one is finished. In practice, each
team has several features ongoing at the same time.

81
Figure 3-3 Alusta monthly release train
Each release has a specific timeframe called "integration window". If a feature is finished
during that window, it is to be released in that corresponding release.
Alusta P2P Requirements Management model
Alusta requirements management model uses the following functional requirement hierar-
chy (Figure 3-4) where the Business feature level refers to theme, Epic user story to Epic
that are split to user stories that can contain additional artifacts.
Figure 3-4 Basware Functional requirement hierarchy

82
The Business feature is not assigned to any release, but is an umbrella item for the rest of
the items.
Program/Project management
Program release schedule, release specific constraints and resourcing allocation between
projects / teams are managed at the program level.
Release cycle for the projects is one month.
Projects manage their own backlog priorities according to roadmap priorities.
Kanban technique for managing a software development process in Toyota's "just-in-time"
(JIT) method is used for backlog management and work assignment. Jira is used as a tool
for backlog management.
Design drivers
Following design drivers has been defined to guide the product development work (Figure
3-5).
Figure 3-5 Design drivers (Basware. 2016)
Utilizing these design drivers is not measured at the moment. Heuristic evaluation could
be considered to be conducted during the solution design and validation.

83
Double diamond design process
The target organization has recently internally introduced the double diamond design pro-
cess (Figure 3-6) tailored to the organizations needs to be followed in the design work. It
has several levels, depending on the scope and importance of the area in question.
Figure 3-6 Design process – light weight (Basware, Mika Röykkee, 2016)
The design process aims at validating the solutions well before implementation to save
time in implementation phase.
3.3 Current metrics
Current metrics used for Basware P2P development were collected via interviewing the
responsible persons over current metrics and after that performing a document analysis
for the reports of current metrics.
3.3.1 Interview over current metrics
Open face-to-face interview with subject of “Process and KPI metrics” was held in Espoo
on 17.5.2016. Director, Operations and development, P2P Product, Management Marko
Malmberg and Director, Quality Assurance Ala-Huikku were interviewed, since they were
responsible over current measures.
Interviewees stated that current metrics follow productivity and quality in high level. This
far the measures have concentrated on the R&D part of the process, starting from tech-
nical design.
It was discussed that what could be the interesting measures for requirements manage-
ment, and the expressed ideas were

84
- Lead time for the whole process (specification, technical design, implementation)
- Potential waste of specifying too early
- Minimun scope and how it is fulfilled and how much the scope changed during the
way
The question was raised whether we should investigate the metrics to follow the quality
and challenges per epic. During the discussion, another question was raised, whether the
requirement was the same as the specification.
It was mentioned that the ALM tool Jira is handy for metrics, since it enables the creation
of the reports in hours.
During this interview, the sources where to find the current reports and metrics were intro-
duced, and they are analyzed in the next chapter.
3.3.2 Document analysis over current metrics
Document analysis over current metrics shows that current metrics measure product qual-
ity and schedule through the amount and categories of bugs on both product, project and
program level, releases through content, risk, priorities, categories, timing, deployment
model and team, roadmap through priorities and themes and velocity through story points
of project and investment categories. Alusta KPI’s are tied to the amount of internal and
customer bugs.
Also the gates of the feature development process are measured or audited so that cer-
tain phases cannot be completed without certain information filled, like the approval phase
cannot be completed, unless the documentation is also ready.
3.4 Management interview over current situation
Vice President P2P Product Management, Sami Peltonen, Vice President P2P R&D, Jari
Antikainen, Director, Quality Assurance Ala-Huikku, Director, Operations and develop-
ment, P2P Product Management Marko Malmberg, SVP Purchase to Pay Business Area
Ilari Nurmi and Senior Manager, Requirements Management, NBA Product Management
were interviewed during 14.-21.6.2016. Interviews were held face-to-face or online. Inter-
views were done one-to-one. Inteviews were held half-structured. The questions were
sent beforehand (Appendix2), but additional questions were asked during the interviews,
according to the journey of the discussion.

85
The goal of the interviews was to survey the managerial vision over both requirements
management and possible metrics for requirements management. Also current develop-
ment methods and possible future vision for the development methods were discussed. In
addition, possible other tips for the survey were asked.
In the interviews when discussing about what is important in requirements management,
all phases of the requirements definition and management were mentioned. Defining
business need, business priority and the problem to be solved were raised. Concern that
customer doesn’t always know what he wants and therefore we should be careful with
defining the problem was also raised. Also the facts that proper solutions for the problems
should be defined, non-functional requirements taken into account and design should be
done according to the requirements came up. In work planning, prioritizing according to
business priorities was mentioned. The requirements should be clear, small and imple-
mentable for development. Quality is wanted from both requirements and the product.
Accountability was raised as an important issue and the need for traceability. These an-
swers followed the roles of the persons in question and together they build very solid gen-
eral view over the requirements definition and management.
For the metrics interviewees suggested things like quality, bug backlog, usage of the fea-
tures, testability, amount of iteration after release, ROI or how much money we get per
feature, where do we invest/where we think we invest, Net Promoter Score for customer
satisfaction, process metrics for creativity or documenting the requirements, time and size
of the requirements, correctness of the requirements, team responsibility, following the
accuracy of decision making, pre-studies with users, usability of the product and fullfill-
ment of non-functional requirements.
The themes for metrics were: changes after release, cost effectiveness, customer satis-
faction, investment, process, quality of the procuct/service, quality of the requirements,
responsibilities, usability, usage of the provided features and user research. From which
the quality of the product and the quality of the requirements were mentioned most often.
Interesting thing here is that many of these suggested metrics were not raised high in the
discussion what is important in the requirements management, but it must be due to the
fact that it is hard to separate the role of requirements away from the whole development
process.

86
In the interview, it was pointed out that any method needs some adjusting in the organiza-
tion. There is aim to grow more lean in years to come. SaFe has not been thoroughly ex-
amined yet and there are no plans to study it further in the near future. In the other hand,
there is no reason why good practices from SaFe could not be taken into use, if they are
proven good.
Other tips that came up in the interview were P2P product vision and product strategy,
specification process, success crtieria, service design, optimizing piloting and go-to-
market that and optimizing the big and scattered group of people to work together.
3.5 Workshop for recognizing valuable metrics
Group discussion or rather a facilitated workshop with the requirements management
stakeholders was arranged. The invitation was sent to all Product Owners, Product Man-
agers and Project Managers in P2P Invoice automation and Purchase product areas. In
addition to that, the directors interviewed earlier were invited. Also few main Architects
and Lead software engineer and Project Manager from UI were invited. Eventually, no
architects, few directors and few Product Owners could not attend the workshop, but to-
gether 17 participants joined the session.
The goal of the workshop was both to get all the stakeholders to discuss and gather ideas
for common good and create deeper knowledge around the area and to share and deploy
the information.
3.5.1 Beginning
People were welcomed and at the same time the information about people from Tampere
being late due to a train being stopped, arrived. The decision was made to wait them for a
while, but then to start if they have not arrived.
With half of the people, the agenda for the day was gone through and the idea of the day,
to go through few facilitated exercises was introduced.
People in this workshop knew each other beforehand. Still as a starter, safe environment
and focus for the issue under workshop was created by the facilitation technique called
Cocktail party (Kantojärvi, 2012, p. 195), where the attendees first had to draw the en-
trance ticket for the party. The ticked had to contain the attendees nick name or second
name, answer to the question how the person arrived to the workshop and answer to the
question “Why am I here/what are my expectations for today?”.

87
After the tickets were drawn, people started ‘the party’, meaning mingling around and dis-
cussing with each other about the information on the entrance ticket. This way the at-
tendees got to know each other a little bit better still and set their thoughts to the subject
of the day by discussing together about the expectations for the day. After the party the
tickets were collected to the wall (Figure 3-7).
Figure 3-7 Cocktail party entrance tickets from the workshop
People that arrived from Tampere did the same exercise and then after that, the new party
was kept with the carousel idea (Kantojärvi, 2012, p. 178), where the attendees were put
in two rings face to face for discussion and the pair was changed by moving the ring after
the discussions, three times during the exercise.
After both cocktail parties, the attendees were asked about the expectations for the day,
and the following list was collected (Figure 3-8):
- unify
- improve
- money
- discussion – share
- concretic actions
- possible issues (identify)

88
Figure 3-8 Expectations defined for the workshop
3.5.2 Clarification
Clarification phase was started straightly with an exercise with predefined question “What
is important in requirements definition and management” to collect a common understand-
ing around the issue and set the basis for the further exercises of the day.
Exercise was done using method me-we-us (Kantojärvi, 2012, p. 54). First attendees
listed their ideas alone to the paper. Then they discussed the ideas through with a pair
and picked together 3-5 most important topics and wrote them to the post-it stickers. After
all pairs were finished, the stickers were brought to the board and introduced to other at-
tendees.
After that, attendees grouped the stickers together (Kantojärvi, 2012, p. 84) and following
groups of importance were formed:
- customer need (Figure3-9)
- business justification
- vision
- who
- internal process
- external communication and
- design drivers

89
Figure 3-9 Customer need exercise board with stickers and votes
After the groups were formed, attendees voted about the importance of the areas by 5
votes per pair (Kantojärvi, 2012, p. 190-192). Attendees were allowed to distribute votes
together how they liked, if they wanted they could put 5 votes to one subject or one vote to
5 separate subjects or anything in between, as long as they used 5 votes.
After that there was another round of voting for the subjects about how attendees feel
'what we do well alredy' they had to mark with heart ( ) and 'where we still need to im-
prove' they had to mark with (Z). This voting was done by personal votes, where every
attendee was given 3 hearts and 3 Z:s to use in voting. It was also agreed that they didn’t
have to use all 3 hearts and Z’s, but maximum to use was 3 of each.
After voting, the areas to work forward were selected. It was decided to pick the ones
where we should improve. The selected areas were Vision, Internal process and External
communication (Figure 3-10).

90
Figure 3-10 Voting results of the importance, what is done well and what to improve
Voting results explanations:
V = votes for importance
(heart) = we do well already
Z = we should improve
Before a lunch break there was a short exercise where people were forced to take an op-
posite point of view to the same issue to turn on the creativity (Kantojärvi, 2012, p. 152,
154). Next question was: “What could we leave out from our RDM?”. Attendees were
asked to write at least one thing to a sticker around the subject. It was argued that this
was a tough question, but everyone still answered. The answers contained everything
from “last-minute changes requested by customers” to “too detailed specs --> more itera-
tive discussion” and from “bad ROI requirements” to “overthinking (when we have solution
already)”.
These results were read to the audience, but left unstructured to the flip board being
available to be used as background information for next exercises. Thinking from the op-
posite direction raised interesting ideas to investigate further when developing the internal
process.
After the lunch, one more exercise was held. The three selected areas for improvement
were selected to be workshopped for further ideas for improvement with the question
“How to improve the selected areas?”.

91
Selected improvement areas were: Vision, Internal process and External communications.
Productivity, picked from the strategy, was added as a bonus subject by the facilitator.
The exercise was held with a World café method (Kantojärvi, 2012, p. 178), where people
were split into four groups. One group per subject. The name of the subject was written
into a flip chart and one group took one flip chart to start with. Idea was to discuss in the
group collect ideas to improve certain subject and write ideas to the board. After certain
period of time groups changed flip charts so that one member of the original group stayed
with the old board and explained the previous discussion results to the new group of peo-
ple. The rest of the group moved to the next flip chart. The next subject was discussed
through with new people and the new ideas were collected to the board. Groups were
changed still 3 times, so that all people could visit all boards, while always someone that
had not stayed with the board and explained the contents to the next group stayed with
the board.
After the round of ideation, groups were asked to pick 3-5 most important things from their
boards. Results of this round were following:
VISION
- Create S2P Product vision collaboratively across all silos (prod mgmt. facilitates)
- Vision should be discussed, challenged and defended
- How vision links to everything else and how it is implemented
- Is a living thing NOW - 2020 – 2030
INTERNAL PROCESS
- Rapid prototyping
- validating new concepts/features fast with customers without any investment in
development (=coding)
- More focus
- fewer parallel things --> more efficiency
- Feature KPI's
EXTERNAL COMMS
- Best practices
- default settings
- new feature visibility and training for end users
- feedback to specifications (customer, consultant)

92
PRODUCTIVITY/EFFICIENCY *bonus item
- focus on less items
- knowledge base usage in support
- issue --> 2. resolving issue --> 3. Resolution --> 4. Re -use
- Do things simple --> MVP
The results were introduced and explained team by team to the whole audience.
3.5.3 Planning the solutions
Planning the solutions phase consist of throwing ideas and the development. In this phase
ideas are generated and if possible try to tear away from conventional thinking to enable
the creative thoughts. When ideas are found, they are selected and refined further to solu-
tions. Solutions are analyzed and mirrored to the original question.
The last exercise for the day was about the metrics, with the me-we-us method using only
me and us parts. First a small introduction to the basics of metrics was given showing the
vulnerability of the metrics via gaming and the importance of measuring only something
that brings you value. During the presentation and short while after that, attendees listed
their own ideas what to measure around the requirements definition and management in
the target organization to the stickers.
After ideation, the stickers were gathered to the flip boards and introduced to everyone.
The result of the ideation was like this:
1. Measure how many % of our system is actually used (per feature) per tenant
2. Transaction done by feature (if possible) e.g. # invoices matched with service PO
3. "Count of the number of bugs per item delivered
4. Can we get it lower by having more discussions + other actions"
5. Clarify how customers value our features
6. How to measure we have/had to implement the feature x? Is / was it really neces-
sary/worth it?
7. Value based further metrics (value velocity, value/release, value realization (value
according to usage metrics))
8. Define and start using FEATURE VALUE SCORE for prioritizing development
items
9. Define FEATURE KPI's as part of design phase and follow them up to ensure suc-
cess

93
10. Calculate RELEASE VALUE from FEATURE VALUE SCORES
11. How to measure outcome/customer value per feature
12. Ratio of discussions about requirements /items delivered
The final exercise was to throw ideas in groups what would be the goal per metric, how
the metric could be gamed and how the metrics should be built. Since the time for the last
exercise was short, attendees were split to three groups where one group discussed one
board through.
3.5.4 Preparing to act
Preparing to act phase should have been concrete actions, but this phase was left out
from the workshop and was discussed further with the Operations and Development man-
ager afterwards.
3.5.5 Closing
Closing part ended up to be very fast, since time was run out. People were still asked to
fill a short questionnaire (See Appendix 3) around the subject of the day and then the day
was ended with thanks and goodbyes.
Figure 3-11 Workshop final survey

94
The results of the survey (Figure 3-11) shows that the opinions differ a lot from each oth-
er, but in average the opinions are in middle level, that means that things are quite ok or
neutral. There were 13 respondents in this survey.
3.6 Conclusions
Based on the interviews, document analysis, discussions and workshops and in the light
of the literature, what to measure?
This high level value stream draws a picture of the symbiosis between the customer, sup-
plier organization and the product/service (Figure3-12).
Figure 3-12 High level value stream
Basically the value is given to the customer when providing them benefit, quality, uptime
and user experience. Still while providing one product/service to all customers, the
amount of backlog items grows very high and it is hard to prioritize them in single line.
Requirements definition and management process
It was said in the interview and document analysis of the current metrics, that the gates of
the feature development process are measured or audited. This process could easily be
widened to contain more detailed starting point than ‘New’.

95
To visualize the beginning of the process the chart describing the work that is done in the
requirements definition and management phase (Figure 3-13). The current feature devel-
opment process is shown in the process under the Delivery and Implementation sections.
Figure 3-13 Requirements definition and management in target organization
The chart shows the three themes of the big everyday themes in requirements manage-
ment: Discovery, Delivery and Backlog management.
Backlog management part is ongoing all the time. In the target organization Kanban is
used for backlog management and items are pulled by the team to the implementation.
Backlog management includes following the roadmap with the priorities, assigning the
work to the project teams, prioritizing user stories, enhancements, technical items and
bugs for implementation and planning the releases so that something valuable is released
every month.
This research, along with the currently in the target organization introduced Double dia-
mond design model, clarifies the dimensions of the discovery part.
The important part in discovery phase is the Elicitation (Murphy, 2010), where require-
ments are gathered and studied with users. The most important thing during the Elicitation
is that output from that phase is a clearly defined problem or problems where the future
process of product development seeks the solution for. The biggest mistake that could be
done during the product development is to solve wrong problem. Customers do not usual-
ly know how to describe the need, but they very often describe the solution that they want.

96
Elicitation phase contains already defining the problems as epics or high level user stories
to the backlog and may contain also some preliminary solution ideas related to the stories.
In elaboration phase more depth is added to the meaning of the requirements. This is
also a phase for ideation where people should put the creative gear on and try to figure
possible solutions to the problem. More user research can be done in this phase too if it is
needed to widen the knowledge around the theme and the data analyzed to support the
solution creation. There is still a possibility to end up with poor solution that for example
solves only part of the original problem or totally different problem than what the real need
was. Solutions can therefore be validated with users to help to select the best solution and
find the enhancement ideas for the solution. A/B testing could be a helpful tool here. At
any suitable phase of elaboration, the feasibility study (Shelly et al., 2011, p. 63-66) for the
solutions should be done, the feasibilities of the solutions should be considered from both
operational, technical, economical and schedule point of view and the most feasible solu-
tion should be selected to be implemented. Of course, the emphasis to the separate fea-
sibility areas could be weighted differently if it is seen appropriate for the feature or theme.
If some feature area is mentioned to be a market differentiator or an excitement feature it
should be weighed from that point of view.
At the same go the selected solution should be described, acceptance criteria refined and
work items split into the suitable size of work grouped together so that the output creates
value for the users when released (MVP, MMF). Also risks can be evaluated at this phase.
In validation phase it should be verified that requirements are complete and testable. In
this phase the developers and testers should agree about the acceptance criteria of the
user story. This can be done with discussions, simulations and face-to-face meetings.
(Murphy, 2010) In this phase the solution could be validated with end users to assure the
quality of the solution.
Then it is time for acceptance, the decision has to be made that the solution is well
enough validated and user stories are ready for implementation. Agile method for this gate
decision that could be used is Definition of Ready (Agile Alliance, 2015a).
In agile development it is important to keep in mind that even if the requirement is validat-
ed and accepted in the requirements definition phase, the changes are welcome in the
development phase too. The goal is to develop usable product, not according to the plan
or specifications.

97
While drawing the process for the agile requirements definition and management, the list
describing the most important guidelines, tools and methods for the persons doing the
requirements definition and management was gathered to clarify the points of possible
measurement (Figure 3-14).
Figure 3-14 Tasks related to requirements definition and management
During the process and task definition, qualities like objectivity, facilitation, discussion and
creativity were found as good qualities for people attending to requirements definition and
management activities.
Separating Requirements cycle more clearly away from the Development cycle (Moccia,
2012) could clarify the daily work when shortening the backlog sizes. This could mean in
practice keeping the requirements in the requirement backlog (e.g. with tag of Tar-
get=Future), out from the product backlog until the problem and targeted quality level has
been defined. This would then need validation in practice whether it would bring any help
or only make things more complicated. The requirement phase could still be done in Kan-
ban mode without sprint as the rest of the backlog management.

98
Current KPI’s
Current metrics measure mainly product and release quality and schedule and the feature
development process. It was said in the interviews that requirements definition and man-
agement are not consciously measured, but when taking a closer look, the requirements
definition and management is part of any measured area. Quality and accuracy of the
requirements has straight effect to the amount of the bugs, contents of the releases,
roadmap to follow the timetable and the velocity of the teams.
Existing KPI goals could be supported by setting the objectives against requirements defi-
nition and management. Suggested objectives are gathered into the Figure 3-15.
Area Way to improve Metric/objective
Quality/Amount of bugs Paying attention to avoiding
bugs in the first place, discuss-
ing the implementable stories
more thoroughly through with the
team
Feasibility study for feature
or theme has been done on
discovery phase, specifica-
tion has been completed in
a discussion with a pro-
grammer, demo has been
given.
Quality/Amount of bugs Being more precise with the ac-
ceptance criteria, writing meas-
urable criteria, and challenge
them well together with the team
Measurable acceptance
criteria where the measura-
ble targets are set
Quality/Amount of bugs Being more strict with approvals
– not approving the features to
be merged with known bugs
Count of bugs per feature
Quality/Amount of bugs Prioritizing the bugs to be fixed
in the next release or closing
them as ‘not to be fixed’ to gain
the quality or stop bugs wasting
time for prioritization
Do not let bugs stay open
over 3-5 releases
Quality/Amount of bugs Reviewing tests for automation
or taking part to the planning
could help to decrease the
amount of bugs
Review has to be done be-
fore feature is accepted
Releases Avoid pushing the feature into a
release, if it is not mature
Count of bugs per feature –
root cause analysis

99
enough
Roadmap Try to keep constant pace with
the work, adjust the resources to
the roadmap, not the schedule
WIP
Velocity Paying more attention to the
contents and size of require-
ments should help the team to
keep the velocity up
Size of user stories
Figure 3-15 RDM objectives for the KPI’s
According to both literature, management interviews and the workshop, measuring the
productivity via ROI or business risk or created business value could be added to the cur-
rent KPI metrics to stress the value of the business view. It is just not so easy to define the
costs versus return or the value of output, especially when delivering agile software itera-
tions to several customers with different needs. Sometimes you even may need intuition
to define the possible value. It should be further validated whether value velocity, purpose
alignment model, kano analysis, agility index or something else could be helpful tool for
that. With defining the value, one should at least be careful that evaluating the value
should not grow too big effort that it ends up as waste.
The first step closer to the value definition could be to define per feature what level of
quality and market differentiator effect is wanted per feature and adjust the solutions to
that level.
Metrics
Theory of the metrics guides to set the goal for the measurement and measure only what
you want to achieve and also motivate the right behaviors with metrics. It guides to be
aware of vanity metrics and recognize the possibility of gaming with certain kind of met-
rics. It tells to use the most important metrics until they are not valid anymore and then
find new ones.
Driven from the business strategy the future goals are to achieve cloud revenue, simplify
operations and improve productivity, by for example focusing on Customer Success by
further improving customer satisfaction and experience and evolving our culture and way
of working to focus more on performance.

100
In the interviews, the management mentioned both product quality and requirements qual-
ity as the most important parts of the requirements definition, cost-effectiveness and priori-
tization according to business need were also raised high.
In the workshop customer need, business justification, and vision were raised as the most
important areas of requirements definition and management.
Figure 3-16 illustrates the similarities between the business strategy, management inter-
views and the workshop results.
Figure 3-16 Important in business and requirements definition and management
In the interviews the management suggested cost-effectiveness, customer satisfaction,
investment, quality of the service and quality of the requirements to be measured.
The suggested metrics gathered in the workshop were related to feature quality, feature
value, prioritization, release value and feature usage.
Both results look at the same issues, but from the different angle (Figure 3-17). Manage-
ment concentrates into higher level issues where the workshop results go to the more
detailed level. Both of them emphasize the cost-effectiveness or creating value, service
quality in general, in release or in feature level and prioritization and investment.

101
Figure 3-17 Internal suggestions for the metrics
Cost-effectiveness and high level quality are not only requirement related metrics, but
related to whole ALM. The goals for them should be defined in the organization level. But
with both you should be careful what to count in and what to leave out. And to keep in
mind the abstractness of the value. They could consist for example of the following things:
- Cost-effectiveness=value+quality-costs compared to usage
- Value=rationalization of the process and need for manual work compared to usage
- Quality=attractiveness+uptime+performance-bugs
- Costs= discovery effort+delivery effort+bugs+production cost (maintenance, re-
lease deployments, hardware/cloud investments) + support requests (recording,
solving, prioritizing)
Both literature, interviews and workshop promotes the idea to follow the quality of the
product by feature or theme. The quality related data could include the problem definition
and the summary of rest of the phases performed during the discovery phase or explana-
tions why they were not done, results of data analysis, amount and coverage of the unit
tests, reported bugs and their status, open suggestions and enhancements and analytics
over feature usage. Comparing the results of the product quality (amount of bugs and en-
hancements) to what happened in discovery phase, could help the organization to recog-
nize the most efficient ways to push the features from the design to the production while
providing the true value to the customers. Following all figures on the feature or theme
level would allow the target organization to put the customer feedback into perspective
with the level of theme or feature readiness and existing future plans.

102
Viewing all the bugs through the theme or feature could expose the quality of the product
area more closely and help to analyze the them as larger entities.
From the requirements definition and management point of view, following the RDM pro-
cess efficiently could be a key to improvement and raise both the quality of requirements,
the quality of the feature and the quality of releases. Target organization has just clarified
the internal process of the discovery phase. If target organization wants to enhance the
quality of the requirements definition and management process and ensure that the pro-
cess is followed, they could start measuring whether the most important steps are accom-
plished during the way or not. Or the opposite, which actions the organization wants to get
rid of, they could be counted too with expecting 0 result. This should be easy measure
through the Jira to add a check box to the feature level item to be filled before items flow
to the implementation or at the acceptance phase latest. The check box is of course al-
ways easy to just mark without accomplishing the task, but the level of trust in the organi-
zation should be so high that there should not be any need for that kind of gaming. Lies
are in this case easily tracked anyway.
Following table (Figure 3-18) lists the process steps that would be important to complete
in way or another to achieve the feature quality through the RDM process.
Phase Step
Problem definition Business model canvas/Lean canvas
Problem definition Personas
Problem definition User research
Problem definition Data analysis
Solution creation Following design drivers
Solution creation Level of innovation (compared to the set goal)
Solution creation Use of prototype
Solution validation User test
Solution validation A/B testing
Solution validation Feasibility study
Work planning MMF
Work planning Item sizes
Delivery Acceptance criteria completed together with the
team/programmer and tester, demos, retrospectives
Product quality Amount and frequency of performed usability tests
and/or solution evaluations

103
Product quality Regular data analysis and monitoring
Product quality Suggestions and bugs per feature or theme
Figure 3-18 RDM process quality steps
In problem definition phase it could be recorded whether business model canvas (Appen-
dix 4.) or Lean canvas (appendix 5.) for the feature or theme exists. Existence of business
model canvas draws the vision over e.g. value propositions, customer segments, cost
structure and revenue streams and acts as the input to further phases. One sign about
problem being defined could be the lean canvas.
To emphasize the usage of personas in requirements definition, we could record where
personas are used.
To emphasize the importance of user research the level of user research performed could
be recorded to the feature metrics.
One important thing to pay attention to is the data analysis. Data analysis should be im-
proved and streamlined to better support the RDM. By dedicating time and resources to
data analysis, to figure what is wanted out from the data and automating the reports as far
as possible would give big benefit for the requirements management assuring that the
analysis happen efficiently and making the data collection and grouping fast. To measure
the amount and frequency of data analysis a simple metric would be to see whether it is
analyzed or not, but more important achievement would be to see what the results of the
analysis can tell and where they only raise more questions.
In solution creation, interesting things to follow would be whether the design drivers have
been used in solution creation, what is the level of innovation of the feature or feature set
or what kind of a prototype has been used for user testing.
In solution validation, it would be interesting to know has the user test been done, has a
real user evaluated solution before implementation and was the user test done with A/B
testing. Getting the fast feedback is an important part of agile requirements definition and
management. To define a metric for that could be related to the fact that how easily the
users can be reached for giving the feedback. This would require a streamlined process
options for different level of feedback gathering. User groups, utilizing usertesting.com,
few continuous connections to ask to could be options for the feedback loops.

104
Interesting thing from the quality point of view is to follow whether the feasibility study has
been performed successfully, from both technical, economical, schedule and operational
point of view. Perhaps something like current Feature Analysis that is in use, could be
expanded to cover the other areas too.
If it only would be possible to measure already at solution selection phase, that the best,
most feasible solution was selected, that meter would be the best to take in use. In crea-
tive iterative and time-boxed work the decisions are not always simple and easy to draw.
Especially with the legacy enterprise software where dependencies go everywhere. At this
stage the best measure is learning by doing. Recognize the decisions that worked and
repeat those while trying to get even better.
When planning the work priorities and item sizes it is important to keep the concept of
minimum marketable feature in mind and plan the released features so that whatever is
released, it serves end users even if more features would be built on the top of the feature
in the future. This can only be measured in collaboration with users, gathering feedback
from the usability and value.
Something to keep in mind when prioritizing bugs, it may be hard to see the value of a
small bug fix but with certain kind of small fixes it is the bigger mass that makes the differ-
ence if for example fixing the group of small UI bugs provides a polished façade that
makes the service look professional. Customers will not be excited about that, but they
sure will notice if the polished look is not there.
Prioritization and assigning the work according to the highest priorities and biggest risks
first, building the software in small increments to get fast feedback and fit the work into the
monthly releases cycle and the ability to adapt to the changed priorities are also important
parts of work planning. These areas are in good shape in the target organization.
In the delivery process the most important part is that Product Owner and implementation
team share the same vision and goal for the feature. Demo is a good tool to ensure the
shared understanding and a great way for the both Product Owner and the team to look
the service from the position of the user. That could be something to record and follow as
a quantity too. Setting the amount of needed fixes after the demo should be as low as
possible as a metric, could easily be gamed so that demo always ends up with status “no
fixes needed” where the reason for the demo is to find and fix what is needed. Therefore
measuring only whether the demo happened or not, could tell enough. Also there may be
several demos during the development cycle, where the first one might contain only a

105
rough version of the feature and therefore the quality should not be measured. Instead it
would be a good goal for the first demo to find all or as many as possible missing ac-
ceptance criteria, but it is hard to imagine how to define a metric for that. There the shared
responsibility with Product Owner and the developer should already do the work. In the
last demo then the goal is to approve the feature. There the metric could be whether it
was possible to approve the feature or not. And if not, what was it due to, the misunder-
standing on requirements or a bug in implementation. Then the root cause could help to
improve the work in the future. But here is a big chance that the analysis ends up as a
vanity metric. Therefore quantity of demos during the way could be the best one to raise
the discussion. Only testing this metric in action could tell whether it is worth of following.
Target organization is planning to measure customer satisfaction with NPS. In addition to
that, it would be good to get more detailed lower level regular feedback for the improve-
ments. This is done feature by feature in the development cycle, but it would be good to
get the feedback independently away from the design and development to gain the view
of fresh eyes. This could be gathered by independent usability tests e.g. during product
quality process and in the beginning measured by the amount and frequency of performed
usability tests and/or solution evaluations could be measured similar to the amount and
frequency of performance tests run. Usability test results could then be gathered as feed-
back to the feature or theme.
In the other hand, Pixton and others (2014, chapter 9) suggested to use customer ac-
ceptance as the key measure instead of internal development metrics. They also state
that many project failures arise from measuring the process rather than the results or the
outcomes. In this light the only suggested metric would be whether the problem and se-
lected solution are validated succesfully with real users before implementation.
And lean movement startups again measure value by validated learning about customers,
instead of measuring the creation of value by our ability to produce tangible high-quality
artifacts. (Ries. 2010) Measuring whether the problems and solutions are validated with
users would fit here too.
For the future, it might be worth of looking at organizational learning and how to grow bet-
ter by more efficient knowledge management and metrics for organizational learning.

106
4 Results and Discussion
The original research question was “Measuring the agile requirements definition and
management in the enterprise software development – what to measure and why?”. This
research has defined the context for agile requirements definition and management by
describing agile software development, requirements definition and management and
drawn a picture over the metrics.
The research both suggests the metrics to take into use with requirements definition and
management, but also clarified the process in the target organization. In addition to the
metrics and the process figure, the research has initiated interesting discussions in the
target organization and kicked the knowledge off to be evolved in the target organization.
It was asked that why should we measure the agile requirements management. The very
first answer to that question from a manager in the target organization was “You Can't
Manage What You Don't Measure” (Origin unknown). The theory confirms that fact, but in
addition advises to be careful with how to set the metrics against what you want to
achieve avoiding the possibility for wrong results. Requirements definition and manage-
ment is fundamental part of software development. By getting requirements wrong the
software doesn’t provide benefit to the customers. By creating poor solutions or selecting
the wrong solution may cause loss of benefit. By prioritizing or splitting the items
wrong the benefit is lost again. Since the requirements definition and management is very
essential, it should be done well and efficiently. Therefore it is wise to look at it with met-
rics also.
Another question was that what should we measure of the agile requirements manage-
ment. The short answer to this question is that what ever we want to achieve. If we want-
ed to achieve productivity we should set the objectives so that they lead us there.
It was asked also that what answers can the measurements give. Measurements give us
the answers that we ask when setting up the metrics. There one needs to be careful to
take the qualities of the metrics into account, since e.g. quantitative metrics cannot give
you qualitative answers and vice versa, lagging metrics can’t help you to change the di-
rection on the go, if the results are gathered only after the project and a vanity metric can
lead you to the wrong direction, so actionable metrics that provide information that can
help you make informed decisions and take corresponding actions are the helpful ones.

107
It was asked that how do we analyze the results and why. This question goes to the same
category as the previous. Analyzing the results should be planned when the metric is set.
The possibilities for gaming or other misuse of the metric should be considered at the
same time when defining the metric itself.
And how do the results end up into concrete actions for improvement? Only by nominating
a responsible person to deploy the needed changes and follow the trends to figure has the
change happened or not and encourage the Product owners to improve the ways of work-
ing further.
4.1 Conclusions
The literature guides to measure the most important things first. To validate the require-
ments, both the real problem and the good solution against that, validating solutions with
users were found as the most important things to improve at the moment. It was suggest-
ed by Pixton and others (2014, chapter 9) that customer acceptance should be used as
the key measure instead of internal development metrics. In addition the lean movement
startups measure value by validated learning about customers (Ries. 2010). This can be
measured with gathering the level and way of user validation done per feature. This can
then be compared to the overall quality of the released feature and then evaluate the effi-
ciency of the levels and ways of user validations compared to the outcome of the feature,
amount of bugs, suggestions and enhancement requests for the feature. The big
achievement from validating solutions with users should also be the team and Product
Owner learning from the users, that is hard to measure in quantity.
To support the efficiency of defining and validating the solutions, the feature quality target
could be set beforehand to define the level of desired level of quality, meaning the targets
for the attractiveness and importance of the feature. Both the solution definition and tech-
nical quality could then be adjusted to the set level and measured whether the target was
met or not.
Another important area of improvement is evaluating the MMF set, so that the released
feature set answers to the user’s need and no important dimension should not be left out
so that user experience or performing the needed action suffers. That could also be eval-
uated with the user test and via decent problem definition, recorded to the feature level
and compared to the feedback about the feature.

108
In the target organization it would be important to deploy the new design process well in
use. To monitor the success, completing the steps on feature level could be measured to
view the trend of improvement and it’s impact to the feature quality and efficiency. The
phases to measure are introduced in the Figure 3-17.
Following feature quality and feature value were raised high. Through that measure it
would be possible to not only follow the total quality of the feature, but also explore and
find the lean way to do the discovery of the requirements via comparing the used RDM
techniques and completed process phases to the quality of the outcome of the feature.
Enhancing the data analytics of the service production data would improve both the RDM
process and the product quality and cost-efficiency. Automated reports and trends ex-
plaining the most important and the most current areas of service usage would both ac-
celerate the requirements definition and management process and help to prioritize better.
Dedicated resource to raise the level, accuracy and use of the data analytics could be
recommendable. Pixton et al (2014, Chapter 1) recommended to base the data analytics
by defining the questions where you want answers from the data.
Requirements definition and management is a seamless and important part of software
development, therefore most metrics cover the whole software development, not only the
RDM. Anyhow separate objectives for RDM are recommended to be set against the exist-
ing common KPIs. Figure 3-15 shows the recommended RDM objectives for the KPI’s.
4.2 Development suggestions
The metrics defined in this research should be validated and figured whether they help to
achieve the defined goals or not, whether they are vulnerable for gaming or other misuse
and whether the cost for gathering and analyzing the results is feasible.
To measure feature quality, a decent way to collect all the data most efficiently by the fea-
ture should be defined. For example taking Epics in Jira in this feature use, would support
this way of working and provide some of the metrics by default. Current development
modes should only be slightly changed to follow the idea. Using Jira epics would support
requirements definition and management in other senses too, since that way it would be
easier to find an old item and view the feature as whole, checking the duplicate items and
analyze the bugs and suggestions per feature.

109
More streamlined process options for different level of feedback gathering are needed to
ensure getting the fast feedback for iterations. User groups, utilizing usertesting.com, few
continuous connections to ask to could be options for the feedback loops.
The RDM process should be deployed efficiently to gain the just-in-time quality. It would
be beneficial for the big picture if all Product Owners shared the same basic view about
RDM process steps and especially goals and encourage them to figure together how to
improve the work. Building a single service would need certain basic elements to be fol-
lowed by everyone building the service to achieve service consistency. The final survey of
the workshop also raised a concern that the common terminology is not used within the
Product Owners, Product Managers and Project Managers. It would be beneficial to de-
fine the core vocabulary to ensure that people talk about same things when building the
ways of working.
It could be beneficial to consider
- managing requirement backlog separately from product/team backlog to gain the
benefit of not handling both ready and discovery phase items in the same pile.
Consider also taking Definition of Ready in use
- giving Product owner responsibility over his own team backlog to increase efficien-
cy and motivation
- moving to hypothesis-driven development to work the need first and ensure that
the solution follows the problem and avoid going solution first.
Use metrics to motivate and encourage people to perform better. Let the teams define the
metrics that would benefit them to improve. Product Owners should be encouraged to
develop the RDM process and metrics further together with the Product Managers.
To emphasize the responsibility of the team, moving the solution definition responsibility
closer to the development team could help to mitigate the quality issues and help with
productivity. It could be beneficial if the target organization would use the implementation
teams more in the solution creation phase too. More feasible and innovative solutions
could be found when creating ideas together first. It could even be worth of trying to get
people from the marketing and support organization or from the operations team to join
the creative workshop for certain bigger themes to both get to know the people better,
create the communication link and understand the challenges in the other side of the
fence.

110
It might also be worth of considering to follow employee satisfaction in team level, by
measuring leadership effectiveness, trust and ownership to enhance the empowerment
and motivation could be considered too.
When the RDM process is well in use, it is important to take another round of facilitated
workshop to define the next metrics for the RDM and keep improving!
4.3 Suggestions for additional research
To keep improving, the target organization could do additional research around the follow-
ing subjects:
- Evaluate the proper way to estimate business value, cost-effectiveness and all the
angles of the quality.
- Evaluate the SaFe, whether any useful patterns for scaled work could be utilized
from that framework.
- Study the knowledge management and organizational learning further, and figure
how to gain more advantage out of them.
4.4 Reliability and ethicalness
References are wide, target organization current state has been investigated thoroughly
and wide audience of stakeholders were involved into the process of generating ideas for
the future metrics.
The researcher has tried to be as objective as possible with the research, even if working
in the target organization. Still the interests of the researcher have guided the path and
most probably influenced to the research result so that the point of view covers the whole
software development process, but concentrates to the importance of the discovery part.
This research is linked to the present time and therefore the results may be unique, since
the ways of working develops all the time, phase of the lifecycle of the service changes,
so does the methods for working and organizations learn and changes continuously and
processes mature on the go. Knowledge evolves and therefore ties this research to the
current time.
The results of this research may not fit for other organization units in Basware or other
product development organizations, unless they use very similar interpretations of the
same methodologies in the same scale and structure as the organization part under the

111
research. The results may though give other organizations helpful ideas to utilize in their
own environment.
The research has defined the suggested metrics for the target organization and therefore
met its goal.
4.5 Evaluation of the final thesis process and own learning
The research question was very current, since the organization is aiming at improving
productivity and the research shows how to strengthen the whole development cycle with
strong requirements definition and management. Looking the requirements management
from the metrics point of view added an interesting angle to the research and encouraged
the target organization to discuss and be inspired of that angle too. The final thesis pro-
cess is shown on Figure 4-1.
Figure 4-1 Final thesis process
In addition to very basic theories some very interesting new sources of information were
found from both books and articles. Practical knowledge was gained both trough the daily
work and the interviews, document analysis and discussions in the target organization. It
was interesting to prove the power of knowledge evolving through the discussions.
The question was also broad, which allowed to look the subject from several angles. The
amount of the literature around this broad subject was huge. During the research, it was
challenging to keep the focus and strike lots of interesting material out. Just when it felt

112
that now everything is picked, always a new clue was found that led to an interesting arti-
cle and/or book. This was a very challenging part. Especially when it felt that the wheel
was continuous, read theory, write about the empirical part and/or have a discussion, get
a new idea to be checked from the theory, write about empirical part… It felt that there is
no end to the information flow.
Research met its’ targets to found the answers to the questions, even if everything did not
go as planned. First the approach was changed (Figure 4-2), since the workshop was
found to serve the purpose better in the target organization than a survey.
Figure 4-2 Changed research plan
With the workshop the creativity of the whole organization was taken in use and at the
same go the information was deployed. The workshop could only be arranged quite late
phase of the research and the luck was a little against with the workshop when an acci-
dent on local trains delayed the starting of the workshop. Despite all that the workshop
encouraged the organization to discuss the subject openly and creatively and lots of new
knowledge was generated.
Composing the solutions was challenging, since the RDM is a seamless part of the soft-
ware development and there are no unambiguous measures available for iterative work
that emphasizes even the late change over sticking to the plans. The business strategy,
management interviews and the facilitated workshop gave good advice for composition.
In addition to the definition of the metrics, the RDM process picture for the target organiza-
tion was drawn to make the process tangible and easier to share and describe and possi-
ble to set the metrics against to. It is delightful if the picture of Requirements definition and
management in target organization (Figure3-12) will help people to develop the process
further from here.

113
Testing and validating the metrics in action was scoped out due to limited schedule.
Theory knitted together this way may help other organizations to familiarize themselves
with the subject and set their minds into the metrics and agile requirements definition and
management. Other organizations may help the discussion over the RDM metrics helpful
if considering the measurements themselves, although the metrics are only in the basic
level and to keep in mind that they are not evaluated in action yet.
The research has taught the researcher a lot from both surveying the literature, exploring
the target organization and the subjects themselves. Getting to understand the power of
the document analysis has been very helpful during this journey. Learning how to run a
facilitated workshop was also fascinating. It has also been a privilege to see the
knowledge growing during the discussions and the workshop around the subject. There-
fore the final conclusion is: read, discuss and share your thoughts to let them grow even
better. Measure only to support your goals and do it to motivate and encourage for im-
provement.

114
References
Agile Alliance, 2015a, GLOSSARY, Definition of Ready, Legible at:
https://www.agilealliance.org/glossary/definition-of-ready/ Read 14.11.2016
Agile Alliance. 2015b. Subway Map to Agile Practices. Legible at:
https://www.agilealliance.org/agile101/subway-map-to-agile-practices/ Read 14.11.2016
Agile Alliance. 2015c. Agile 101 Legible at: https://www.agilealliance.org/agile101/ Read
20.11.2016
Ariely, D. 2010. Column: You Are What You Measure. Legible at:
https://hbr.org/2010/06/column-you-are-what-you-measure Read 10.10.2016
Basware. 2016. Basware 2016-2018 strategy. External presentation. Read 16.11.2016
Basware web pages. 2016a. Company milestones and acquisitions. Legible at
http://www.basware.com/about-us/history-and-milestones . Read 5.7.2016.
Basware web pages. 2016b. Basware Corporate Factsheet. Legible at
http://www.basware.com/knowledge-center/basware-corporate-fact-sheet . Read
6.7.2016.
Basware web pages. 2015. Basware’s strategy for 2016-2018. Legible at
http://investors.basware.com/en/strategy . Read 5.7.2016.
Basware web pages. 2016c. Drive growth with networked Purchase-To-Pay. Downloaded
at http://www.basware.com/download/file/13329 . Read 6.7.2016.
Basware web pages. 2016d. Financial solutions to simplify and streamline your buying
and selling. Legible at http://www.basware.com/solutions . Read 7.7.2016
Beattle, S. 2015. FYI On ROI: A Guide To Calculating Return On Investment. Legible at:
http://www.investopedia.com/articles/basics/10/guide-to-calculating-roi.asp Read 12.
11.2016
Beck, K., Beedle, M., van Bennekum, A., Cockburn, A., Cunningham, W., Fowler, M.,
Grenning, J., Highsmith, J., Hunt, A., Jeffries, R., Kern, J., Marick, B., Martin, R.C., Mellor,

115
S., Schwaber, K., Sutherland, J. & Thomas, D. 2011. Manifesto for Agile Software Devel-
opment. Legible at http://agilemanifesto.org/. Read 27.6.2016.
Bozarth, J. 2014. Nuts and Bolts: What You Measure Is What You Get. Legible at:
http://www.learningsolutionsmag.com/articles/1482/nuts-and-bolts-what-you-measure-is-
what-you-get Read 10.10.2016.
Chappell, D. 2008. What is application lifecycle management? Legible at:
https://web.archive.org/web/20141207012857/http://www.microsoft.com/global/application
plat-
form/en/us/RenderingAssets/Whitepapers/What%20is%20Application%20Lifecycle%20M
anagement.pdf Read 21.10.2016
Churchville, F. 2016. Can enterprise app developers learn from Pokémon Go? Legible at:
http://searchsoa.techtarget.com/blog/SOA-Talk/Can-enterprise-app-developers-learn-
from-Pokemon-Go Read 8.10.1016
Croll, A., Yoskovitch, B. 2013. One metric that matters. Lean analytics. Use data to build a
better startup faster. Legible at: http://leananalyticsbook.com/one-metric-that-matters/
Read 15.11.2016
Cohn, M. 2014. My Primary Criticism of Scrum. Legible at
http://www.mountaingoatsoftware.com/blog/my-primary-criticism-of-scrum. Read
12.9.2016.
DeMers, J. 2016. How Will Pokémon Go Affect The Future Of App Development? Legible
at: http://www.huffingtonpost.com/jayson-demers/how-will-pokemon-go-affect-the-future-
of-app-development_b_11004744.html Read 8.10.2016
Datta, Subhajit. 2007. Metrics-driven Enterprise Software Development: Effectively Meet-
ings Evolving Business Needs. J. Ross publishing. Florida.
Dictionary.com. 2016. Metrics. Legible at: http://www.dictionary.com/browse/metric Read
6.12.2016.
Eckel, B. 2011. You Get What You Measure. Legible at http://www.reinventing-
business.com/2011/08/you-get-what-you-measure.html Read 10.10.2016

116
EBMgt. Evidence-Based Management for Software Organizations. 2016. Agility Index
Snapshot. Legible at:http://www.ebmgt.org/Solutions/Agility-Index-Snapshot
Read.16.11.2016.
Forrester Consulting Commissioned By Microsoft. 2015. DevOps Best Practices The Path
To Better Application Delivery Results. Legible at:
http://download.microsoft.com/download/E/5/2/E5201612-E6CF-49B5-9ADB-
AED8487AC0A9/Microsoft%20DevOps%20TLP.PDF Read 18.10.2016
Gartner. 2016. IT Glossary. Legible at: http://www.gartner.com/it-glossary/km-knowledge-
management/ Read 21.11.2016
IIBA, International institute of Business Analysis. 2011. Agile Extension to the BABOK
Guide. November 2011 Draft for Public Review. Legible at:
https://issuu.com/orangelc/docs/the_agile_extension_to_the_babok___ Read 20.11.2016
IIBA, International Institute of Business Analysis, 2015, BABOK v3, A guide to the busi-
ness analysis body of knowledge. Legible at: http://www.babokonline.org/ Read
20.11.2016
Kananen, J. 2015. Opinnäytetyön kirjoittajan opas: Näin kirjoitat opinnäytetyön tai pro
gradun alusta loppuun. Jyväskylän ammattikorkeakoulu. Jyväskylä.
Kantojärvi, P. 2012. Fasilitointi luo uutta – Menesty ryhmän vetäjänä. Talentum. Liettua.
Kavis, M. 2014. Architecting the Cloud: Design Decisions for Cloud Computing Service
Models (SaaS, PaaS, and IaaS). John Wiley & Sons. Legible at http://ezproxy.haaga-
helia.fi:2188/book/web-development/9781118826461 Read 13.8.2016.
Kronfält, R. 2008, Ready-ready: the Definition of Ready for User Stories going into sprint
planning, Legible at: http://scrumftw.blogspot.fi/2008/10/ready-ready-definition-of-ready-
for.html, Read 14.11.2016
Laakso,S.A., 2006, Käyttöliittymälähtöinen vaatimusmäärittely, Systeemityö 2/2006,
Legible at: https://www.cs.helsinki.fi/u/salaakso/papers/SYTYKE-Kalilahtoinen-
vaatimusmaarittely.pdf Read 12.11.2016

117
Lean Enterprise Institute, Inc. 2000-2016. What is lean? Legible at:
http://www.lean.org/whatslean/. Read 6.12.2016.
Leffingwell, D. 2011. Agile Software Requirements. Lean Requirements Practises for
Teams, Programs and the Enterprise. Pearson Education, Inc.. Boston.Legible at:
http://www.scaledagileframework.com/ Read 10.10.2016
Leon, J. 2015a. The True Cost of a Software Bug: Part One. Legible at:
http://blog.celerity.com/the-true-cost-of-a-software-bug Read 12.11.2016
Leon, J. 2015b. Bug Cost Implications at Each Phase of the SDLC: Part Two. Legible at:
http://blog.celerity.com/the-cost-implications-of Read 12.11.2016
McDonald, K. 2015. Beyond Requirements: Analysis with an Agile Mindset. Addison-
Wesley Professional. Legible at: http://ezproxy.haaga-helia.fi:2188/book/software-
engineering-and-development/agile-development/9780133039863 Read 12.9.2016.
Moccia, J. 2012. Agile Requirements Definition and Management. Legible at:
https://www.scrumalliance.org/community/articles/2012/february/agile-requirements-
definition-and-management#sthash.YUKFtKrt.dpuf Read 12.9.2016
Moilanen T., Ojasalo K. & Ritalahti J.. 2014. Kehittämistyön menetelmät. Uudenlaista
osaamista liiketoimintaan. Sanoma Pro Oy. Helsinki.
Murphy, G.. 2010. Better Requirements Definition Management is Better for Business.
Legible at http://www.methodsandtools.com/archive/archive.php?id=107 Read 6.9.2016.
Olsen, D. 2015. The lean product playbook. John Wiley & Sons inc. New Jersey.
Optimizely. 2016. Optimization glossary. Legible at: https://www.optimizely.com/ab-
testing/ Read 26.11.2016
O’Reilly, B. 2013. How to implement hypothesis-driven development. Legible at
https://barryoreilly.com/2013/10/21/how-to-implement-hypothesis-driven-development/
Read 18.10.2016
Parasoft, 2015, What Do Software Defects Really Cost? The $2.3 Billion Bug, Legible at:
https://blog.parasoft.com/cost-of-software-defects Read 12.11.2016

118
Paul, D., Cadle, J. and Yeates D. Business Analysis - Third edition. 2014. Legible at:
http://ezproxy.haaga-helia.fi:2188/book/software-engineering-and-development/software-
requirements/9781780172774 Read 1.11.2016
Peterme. 2013. The Double Diamond Model of Product Definition and Design. Legible at
http://www.peterme.com/2013/09/26/the-double-diamond-model-of-product-definition-and-
design/ Read 18.10.2016.
Peterson, D. 2109-2015. What is Kanban? Legible at: http://kanbanblog.com/explained/
Read 6.12.2016.
Pixton, P., Gibson, P. & Nickolaisen, N. Pearson Education. 2014. The Agile Culture,
Leading through trust and ownership. New Jersey.
Reh, J. 2016a. Metrics - Business Management Term Definition. Legible at: Read
19.11.2016
Reh, J. 2016b. Understanding Goals and Objectives in Business. Legible at:
https://www.thebalance.com/objective-s-2275176 Read 21.11.2016
Ries, Eric. 2010. For Startups, How Much Process Is Too Much? Legible at:
https://hbr.org/2010/02/how-much-process-is-too-much Read 30.5.2016.
Ries, E. 2011. The Lean Startup. Crown Publishing Group. New York.
Robertson, S. & Robertson, J. 2013. Mastering the requirements process, Getting re-
quirements right. Pearson education, Inc.
(Robertson & Robertson, 2013, s.xxx)
Rossberg, J. 2014. Beginning Application Lifecycle Management. Legible at:
http://ezproxy.haaga-helia.fi:2188/book/quality-management/9781430258131 Read
21.10.2016
Scaled Agile. 2010-2016a. SaFe 4.0 for Lean Software and Systems Engineering. Legible
at: http://www.scaledagileframework.com/ Read: 18.11.2016

119
Scaled Agile. 2010-2016b. Portfolio metrics. Legible at:
http://www.scaledagileframework.com/metrics/#PF6. Read 28.11.2016.
Schneider, J. 2015. The Double Diamond: Strategy + Execution of the Right Solution.
Legible at: https://www.thoughtworks.com/insights/blog/double-diamond Read
18.10.2016.
Shelly, Gary B. & Rosenblatt, Harry J. 2011. Systems Analysis and Design. Course Tech-
nology. Cengage Learning.
Shore, J. 2006. The Productivity Metric. Legible at: http://www.jamesshore.com/Blog/The-
Productivity-Metric.html Read 14.11.2016
Shore, J., 2007, Value Velocity: A Better Productivity Metric?,
http://www.jamesshore.com/Blog/Value-Velocity-A-Better-Productivity-Metric.html
Simms, C. 2010. Estimating Business Value. Legible at:
https://www.infoq.com/news/2010/01/Estimating-Business-Value Read 14.11.2016
Search Software Quality. 2009. Systems development life cycle (SDLC). Legible at:
http://searchsoftwarequality.techtarget.com/definition/systems-development-life-cycle
Read 20.11.2016.
Skyrme, D. 2011. Types of Knowledge. Legible at:
http://www.skyrme.com/kmbasics/ktypes.htm Read 21.11.2016.
Tung, S. 2014. Keep it simple, Smarty!. Legible at http://onespring.net/user-
experience/keep-it-simple-smarty/ Read 8.9.2016.
Van Cauwenberghe, P. 30.12.2009. Thinking for a Change. Treppenwitz in public. How do
you estimate the Business Value of User Stories? You don’t. Legible at:
http://blog.nayima.be/2009/12/30/how-do-you-estimate-the-business-value-of-user-stories/
Read 15.11.2016
Varma, T. 2015. Agile Product Development: How to Design Innovative Products Th at
Create Customer Value. Legible at: http://ezproxy.haaga-helia.fi:2188/book/software-
engineering-and-development/agile-development/9781484210673 Read 19.11.2016

120
Warwick, L. 2013. The Differences Between KPI & Metric . Legible at:
http://www.ehow.com/print/info_8722269_difference-between-kpi-process-metric.html
Read 16.11.2016.
Wikipedia. 2016a. Pokemon Go. Legible at:
https://en.wikipedia.org/wiki/Pok%C3%A9mon_Go Read 8.10.2016.
Wikipedia. 2016c. Analytics. Legible at: https://en.wikipedia.org/wiki/Analytics Read
29.11.2016
Wikipedia. 2016c. Business Model Canvas. Legible at:
https://en.wikipedia.org/wiki/Business_Model_Canvas#/media/File:Business_Model_Canv
as.png Read 29.11.2016
Wikipedia. 2016d. Agile software development. Legible at:
https://en.wikipedia.org/wiki/Agile_software_development Read 29.11.2016
Wikipedia. 2016e. DevOps. Legible at: https://en.wikipedia.org/wiki/DevOps Read
29.11.2016
Wikipedia. 2016f. Facilitation. Legible at: https://en.wikipedia.org/wiki/Facilitation Read
30.11.2016

121
Appendices
Appendix 1. Summary of the key concepts
Actionable metrics Provides information that can help you make informed
decisions and take corresponding actions. (Croll and
Yoskovitz, McDonald, 2015, Chapter 3)
Agile Nurturing a mindset that enables us to constantly adapt
to a rapidly evolving situation and look for more effective
ways to solve a problem (Varma. 2015)
Agile Software Development Agile software development describes a set of principles
for software development under which requirements and
solutions evolve through the collaborative effort of self-
organizing cross-functional teams. (Wikipedia. 2016d.)
Application lifecycle
management (ALM)
Application’s lifecycle includes the entire time during
which an organization is spending money on this asset,
from the initial idea to the end of the application’s life,
even if it often is commonly equated with the software
development lifecycle (SDLC). Chappell (2008)
Asset Efficiency Ratios Gauges how effectively management is using the assets
of the firm to drive revenues and profits. These
measures are evaluated over time to assess improve-
ment or deterioration in asset utilization. (Reh. 2016a)
DevOps DevOps (a clipped compound of development and oper-
ations) is a culture, movement or practice that empha-
sizes the collaboration and communication of both soft-
ware developers and other information-technology (IT)
professionals while automating the process of software
delivery and infrastructure changes. (Wikipedia. 2016e.)
Exploratory metrics Helps you discover new insights to ensure that you are
solving the right problem. (Croll and Yoskovitz, McDon-
ald, 2015, Chapter 3)
Facilitation Facilitation is any activity that makes tasks for others
easy, or tasks that are assisted. In business and organi-
zational settings facilitation is used to ensure the design-
ing and running of successful meetings and workshops.
(Wikipedia. 2016f.)
Financial Leverage Ratios Help businesses understand the impact of debt on their

122
overall financial structure. These ratios help
shareholders and stakeholders assess financial risk.
(Reh. 2016a)
Financial metrics Are drawn from accounting measures help management,
shareholders and key stakeholders assess an organiza-
tion's overall financial health at a point in time as well as
monitor the improvement or decline in health over a pe-
riod of time. (Reh. 2016a)
Kanban Technique for managing a software development pro-
cess in a highly efficient way. Kanban underpins Toyo-
ta's "just-in-time" (JIT) production system. (Peterson.
2109-2015.)
Lagging metrics Tells what happened in the past and gives you no or
very little time to react. (Croll and Yoskovitz, McDonald,
2015, Chapter 3)
Leading metrics Tries to predict the future and provide the information
that you can act on. (Croll and Yoskovitz, McDonald,
2015, Chapter 3)
Lean Maximizing customer value while minimizing waste.
(Lean Enterprise Institute, Inc. 2000-2016.)
Liquidity Ratios Help businesses monitor their ability to fund operations
and pay bills. These metrics are watched closely to en-
sure the firm can meet its short-term obligations. (Reh.
2016a)
Metrics A standard for measuring or evaluating something,
especially one that uses figures or statistics: new metrics
for gauging an organization’s diversity. (Dictionary.com.
2016)
MoSCoW Prioritization A method to prioritize stories (or other elements) in in-
cremental and iterative approaches. MoSCoW (must
have, should have, could have, won’t have) provides a
way to reach a common understanding on relative im-
portance of delivering a story or other piece of value in
the product. (IIBA, 2015)
Non-financial metrics Focus on other process, service or quality measure-
ments important to monitoring the organization's health
and success. (Reh. 2016a)

123
Outcome The change in the organization and changes in the be-
havior of stakeholders as a result of an IT project. You
don’t know what the outcome of your IT project is until
you deliver something—the output—and observe how
that output impacts the organization and your stakehold-
ers. (McDonald. 2015)
Output Anything that your team delivers as part of your IT pro-
ject. This includes software, documentation, processes,
and other things that tend to be measured in order to
gauge how the project is going. (McDonald. 2015)
Personas Fictional characters or archetypes that exemplify the way
that typical users interact with a product. (IIBA, 2015)
Profitability Ratios Assess the effectiveness of management in driving earn-
ings from the capital invested in the firm. These numbers
are critically important to investors and shareholders.
(Reh. 2016a.)
Qualitative metrics Gives you understanding about your stakeholders and
their needs and answers to the question ”What?”. (Croll
and Yoskovitz, McDonald, 2015, Chapter 3)
Quantitative data Is the numbers and statistics tracked and measured,
hard numbers but not total insight. (Croll and Yoskovitz,
McDonald, 2015, Chapter 3)
Reporting metrics Are helpful when you know what questions to ask but
don’t know the answers. An example of a reporting met-
ric is velocity. (Croll and Yoskovitz, McDonald, 2015,
Chapter 3)
Requirement Requirements are what the software product, of hard-
ware product, or service, or whatever you intend to build,
is meant to do and to be. Requirements exist whether
you discover them or not, and whether you write them
down or not. (Robertson & Robertson 2013, p. 1)
Requirements definition The process of eliciting, documenting, analyzing, priori-
tizing and agreeing on requirements. (Murphy. 2010.)
Requirements Management Controlling, managing and overseeing changes and risk.
(Murphy. 2010.)
Software development
lifecycle (SDLC)
The systems development life cycle (SDLC) is a concep-
tual model used in project management that describes

124
the stages involved in an information system develop-
ment project, from an initial feasibility study through
maintenance of the completed application. (Search
Software Quality. 2009.)
Trust-Ownership model A model that explores the interrelationship between the
amount of trust that the Leader or organizational process
has in the Team and the level of ownership and com-
mitment that the Team has to the success of the project
or business. (Pixton and others. 2014. Chapter 1.)
Vanity metrics Are the ones that are easy to measure, easy to manipu-
late, and do not provide useful information for making
decisions or taking actions. (Croll and Yoskovitz,
McDonald, 2015, Chapter 3)
Appendix 2. Interview questions
Hi,
Here are the questions for the interview. My research question is ‘Measuring the agile
requirements management – what to measure and why?’
I would like to hear your point of view to these following questions:
1) From your point of view, what is most important in requirements manage-
ment?
2) What would you want to be measured from requirements management and
for what purpose would you use the results?
3) Which methods and/or frameworks should we follow in requirements man-
agement now or in the future?
4) Any other tips for me what else should I take into account in this research?
Best regards,
-nina

125
Appendix 3. Quick survey questions in the workshop
Appendix4: Business Model Canvas
(Wikipedia. 2016c.)

126
Appendix 5. Lean Canvas
Ash Maurya (Varma. 2015. Chapter3.)
Table of figures
Figure 1-1 Basware Product areas (Basware, 2016) .......................................................... 3
Figure 1-2 Basware Purchase-to-Pay suite (Basware. 2016) ............................................. 4
Figure 2-1 Knowledge hierarchy (Skyrme, 2011) ............................................................. 13
Figure 2-2 Olsen’s hierarchy of web user needs (Olsen, 2015, p.45 ) .............................. 15
Figure 2-3 Three aspects of ALM (Chappell. 2008) .......................................................... 16
Figure 2-4 Governance extends over the entire application lifecycle (Chappell. 2008) ..... 17
Figure 2-5 Scaled Agile Framework (Scaled Agile. 2010-2016) ....................................... 21
Figure 2-6 Trust-Ownership model (Pixton et al, 2014, Chapter 2) .................................. 24
Figure 2-7 Generic Agile Life-Cycle (IIBA. 2011. p. 18) .................................................... 27
Figure 2-8 Generic agile model (Paul and others, 2014, Chapter 13)............................... 28
Figure 2-9 Build – Measure – Learn feedback loop (Ries. 2011.p.75) .............................. 30
Figure 2-10 Double Diamond model, adjusted for software products and services
(Schneider. 2015) ............................................................................................................ 33
Figure 2-11 Interrelations of Double diamond design model (Schneider, 2015) ............... 34
Figure 2-12 Analysis with agile mindset ........................................................................... 35
Figure 2-13 Cost of a software bug (Leon, 2015b) ........................................................... 37
Figure 2-14 Relative cost of a software bug fix according to Barry Boehm, 2007
(SuperWebDeveloper.com, 2009) .................................................................................... 38
Figure 2-15 Cost structure of bug fix during the SDLC (Leon, 2015b) .............................. 38

127
Figure 2-16 Agile requirements definition and management (RDM) (Moccia, 2012) ......... 43
Figure 2-17 Requirements definition lifecycle. (Murphy. 2010) ......................................... 45
Figure 2-18 Requirements and design cycle (IIBA. 2015. p. 20) ...................................... 48
Figure 2-19 Subway Map to Agile Practices (Agile Alliance, 2015b) ................................ 50
Figure 2-20 Requirements management phases (Murphy. 2010) .................................... 53
Figure 2-21 Approaches to prioritization (IIBA. 2015. p. 310) ........................................... 54
Figure 2-22 Five personality traits of the metrics according to Croll and Yoskovitz
(McDonald, 2015, Chapter 3) ........................................................................................... 57
Figure 2-23 Things to evaluate when setting up effective metrics (Pixton and others, 2014,
Chapter 9)........................................................................................................................ 64
Figure 2-24 Enterprise balanced scorecard (Scaled agile. 2010-2016b) .......................... 66
Figure 2-25 Lean portfolio metrics (Scaled agile. 2010-2016b) ........................................ 67
Figure 2-26 Purpose alignment model (IIBA. 2011. p. 79) ................................................ 69
Figure 2-27 Agility index .................................................................................................. 71
Figure 2-28 Research Methods Framework from Christian Rohrer (Olsen, 2015, p. 230) 72
Figure 2-29 Kano analysis (IIBA. 2011. p. 74) .................................................................. 75
Figure 3-1 Basware Alusta development model ............................................................... 80
Figure 3-2 Feature development lifecycle ........................................................................ 80
Figure 3-3 Alusta monthly release train ............................................................................ 81
Figure 3-4 Basware Functional requirement hierarchy ..................................................... 81
Figure 3-5 Design drivers (Basware. 2016) ...................................................................... 82
Figure 3-6 Design process – light weight (Basware, Mika Röykkee, 2016) ...................... 83
Figure 3-7 Cocktail party entrance tickets from the workshop .......................................... 87
Figure 3-8 Expectations defined for the workshop ........................................................... 88
Figure 3-9 Customer need exercise board with stickers and votes .................................. 89
Figure 3-10 Voting results of the importance, what is done well and what to improve ...... 90
Figure 3-11 Workshop final survey .................................................................................. 93
Figure 3-12 High level value stream................................................................................. 94
Figure 3-13 Requirements definition and management in target organization .................. 95
Figure 3-14 Tasks related to requirements definition and management ........................... 97
Figure 3-15 RDM objectives for the KPI’s ........................................................................ 99
Figure 3-16 Important in business and requirements definition and management .......... 100
Figure 3-17 Internal suggestions for the metrics ............................................................ 101
Figure 3-18 RDM process quality steps ......................................................................... 103
Figure 4-1 Final thesis process ...................................................................................... 111
Figure 4-2 Changed research plan ................................................................................ 112


![Agile Metrics That Matter[1]](https://static.fdocuments.in/doc/165x107/55cf9b91550346d033a68ed5/agile-metrics-that-matter1.jpg)