Methods ofAppraisal ofQuality of Basic Data for … · Methods ofAppraisal ofQuality of Basic Data...
76
I ! POPULATION STUDIES, No. 23 Manuals on methods of estimating population MANUAL II Methods of Appraisal of Quality of Basic Data for Population Estimates UNITED NATIONS Department of Economic and Social Affairs Population Branch New York, 1955
Transcript of Methods ofAppraisal ofQuality of Basic Data for … · Methods ofAppraisal ofQuality of Basic Data...

I!~
POPULATION STUDIES, No. 23
Manuals on methods of estimating population
MANUAL II
Methods of Appraisal of Quality of
Basic Data for Population Estimates
UNITED NATIONS
Department of Economic and Social Affairs
Population Branch
New York, 1955

The previous reports prepared by the Population Branch of the Bureau of Social Affairs are listed below:
ST jSOA jSeries A. POPULATION STUDIES
Reports on interrelationships between populationgrowth and economic and social changes
No. 17. Determinants and consequences of populationtrends
No. 20. Population growth and the standard of livingin under-developed countries
Reports on fertility and mortality
No. 13. Foetal, infant and early childhood mortality.Vol. 1. The statistics
No. 13/Add.l Vol. 2. Biological, social and economicfactors
No. 22. Patterns of human mortality
Reports on migration
No.5. Problems of migration statisticsNo. 11. Sex and age of international migrants: sta
tistics for 1918-1947
Reports on population estimates
No.3. World population trends, 1920-1947No. 10. Methods of estimating population:
Manual I: Methods of estimating total population for current dates
No. 16. The population of Central America (inc.Mexico), 1950-1980
No. 21. The population of South America, 1950-1980
Reports on methods of population statistics andanalysis
:No.4. Population census methodsNo.6. Fertility' data in population censusesNo.7. Methods of using census statistics for the
calculation of life tables and other demographic measures. With application to thepopulation of Brazil, by Giorgio Mortara
No. 8. Data on urban and rural population in recentcensuses
No.9. Application of international standards to census data on the economically active population
No. 18 Training in techniques of demographic analysis
Reports on the population of Trust Territories
No. 1. The population of Western SamoaNo.2. The population of TanganyikaNo. 14. Additional information on the population of
TanganyikaNo. 15. The population of Ruanda-Urundi
Demographic Dictionary
No. 19. Multilingual demographic dictionary-Provisional edition
No. 1. December 1951No.2. October 1952
ST /SOA /Series N. POPULATION BULLETIN
No.3. October 1953No.4. December 1954
ST/SOA/Series A/23
October 1955
UNITED NATIONS PUBLICATION
sales No.: 56. XIII. 2
Price: $U.S. 2.00(or equivalent in other currencies)

FOREWORD
This is the second of a series of manuals on methods of estimating populationwhich the Population Branch of the United Nations Bureau of Social Affairs hasundertaken to prepare in accordance with a recommendation of the PopulationCommission (EjCN.9j88, paragraph 2S(C). The first manual in this series dealtwith methods of estimating a country's total population for current dates.
The present manual is concerned with procedures for appraising the accuracyof census enumerations of the total population and sex and age groups, and ofstatistics of births, deaths and migration. These are the principal types of statisticsused in the preparation of both current population estimates and future populationprojections. An appraisal of their quality, leading to necessary corrections, is anessential step in making reliable estimates and projections, and in determiningthe limits of confidence in the estimates which can be made.
The primary purpose of these manuals is to assist Governments in improvingthe quality of official population estimates. In addition, it is expected that they willbe useful as material for national and international training courses and universityteaching in the field of demographic methods, and as reference works for individualtechnicians engaged in demographic research.
The present manual was prepared with the co-operation of Dr. Abram J. Jaffeof Columbia University, Bureau of Applied Social Research.
iii


TABLE OF CONTENTS
Page
INTRODUCTION
The need for appraisal of demographic statistics. . . . . . . . . . . . . . . . . . . . 1Purpose of this manual. . . . . . . . . . . . . . . . . . . . . . . . . . . . . . . . . . . . . . . . . . 1Types of testing procedures. . . . . . . . . . . . . . . . . . . . . . . . . . . . . . . . . . . . . . 2Nature of illustrative examples ···················· 3Organization of this manual. . . . . . . . . . . . . . . . . . . . . . . . . . . . . . . . . . . . . . 3
CHAPTER I
The accuracy of census totals
A. INTRODUCTION ................................................• 4Factors affecting the completeness of a census count. . . . . . . . . . . . . . . . . . 4
B. ApPRAISING THE HEAD COUNT OF A SINGLE CENSUS. . . . . . . . . . . . . . . . . . 5Review of census procedures and performance. . . . . . . . . . . . . . . . . . . . . . 5Relating the census count to non-census counts. . . . . . . . . . . . . . . . . . . . . . 5Relating the census counts for various areas to known characteristics of
the areas. . . . . . . . . . . . . . . . . . . . . . . . . . . . . . . . . . . . . . . . . . . . . . . . . . . . . 7Comparing the head and household counts. . . . . . . . . . . . . . . . . . . . . . . . . . 7Comparison of urban and rural areas. . . . . . . . . . . . . . . . . . . . . . . . . . . . . . 7Comparison of political subdivisions. . . . . . . . . . . . . . . . . . . . . . . . . . . . . . . 8Comparison of results of different tests. . . . . . . . . . . . . . . . . . ... . . . . . . . . 9
C. CONSISTENCY OF TOTALS AT SUCCESSIVE CENSUSES. . . . . . . . . . . . . . . . . . . . 9Analysing the rate of change between two census dates. . . . . . . . . . . . . . . . 9Comparing rates of change during intervals between three or more
censuses 10Population totals for 'Subdivisions of a country. . . . . . . . . . . . . . . . . . . . . . 10Comparing successive censuses. . . . . . . . . . . . . . . . . . . . . . . . . . . . . . . . . . . . 10Comparing population changes with social and economic conditions. . . . 11
D. CONSISTENCY OF CENSUS TOTALS WITH VITAL STATISTICS AND MIGRATION
STATISTICS
The balancing equation. . . . . . . . . . . . . . . . . . . . . . . . . . . . . . . . . . . . . . . . . . 12Definition and limitations ···.··············· 12Treatment of migration. . . . . . . . . . . . . . . . . . . . . . . . . . . . . . . . . . . . . . . . . . 13Examples of the use of the balancing equation. . . . . . . . . . . . . . . . . . . . . . 13
E. DIRECT CHECKS ON THE ACCURACY OF CENSUS TOTALS. . . . . . . . . . . . . . . . 15Timing of a direct check. . . . . . . . . . . . . . . . . . . . . . . . . . . . . . . . . . . . . . . . 15Selection of areas to be re-surveyed. . . . . . . . . . . . . . . . . . . . . . . . . . . . . . 15Comparing census records with lists of names. . . . . . . . . . . . . . . . . . . . . . 16Example of partial re-enumeration in Costa Rica. . . . . . . . . . . . . . . . . . . . 16Example of the post-enumeration survey in the United States. . . . . . . . . . 16Sample verification of the census count in India. . . . . . . . . . . . . . . . . . . . 17
v

'FT
CHAPTER II
The completeness of vital statisticsPage
A. INTRODUCTION 18Effects of errors in vital statistics on population estimates. . . . . . . . . . . . 18Coverage 18Time and place of occurrence ······················· 18Characteristics recorded on the certificates. . . . . . . . . . . . . . . . . . . . . . . . . . 19Factors affecting the completeness of birth registration. . . . . . . . . . . . . . . . 19Factors affecting death registration. . . . . . . . . . . . . . . . . . . . . . . . . . . . . . . . 20Relative completeness of birth and death registration. . . . . . . . . . . . . . . . . . 20
B. INTERNAL CONSISTENCY OF VITAL STATISTICS. . . . . . . . . . . . • . . . . . . . . . . . 20Numbers of reported births, deaths and infant deaths. . . . . . . . . . . . . . . . 20Levels of rates. . . . . . . . . . . . . . . . . . . . . . . . . . . . . . . . . . . . . . . . . . . . . . . . . . 21Birth rates ·.·························· 21Consistency of crude birth rates with age structure. . . . . . . . . . . . . 22Death rates. . . . . . . . . . . . . . . . . . . . . . . . . . . . . . . . . . . . . . . . . . . . . . . . . . . . . 22Infant mortality rates -. . . . . . . . . . . . . . . . . . . . . . . . 22Trends in crude rates. . . . . . . . . . . . . . . . . . . . . . . . . . . . . . . . . . . . . . . . . . . . 23Patterns of death rates, by age and sex. . . . . . . . . . . . . . . . . . . . . . . . . . . . 23
C. THE USE OF BALANCING EQUATIONS. . . . . . . . . . . . . . . . . . . . . . . . . . . . . . . . 24Appraisal of death statistics by means of balancing equations. . . . . . . . . . 25Appraisal of birth statistics by means of balancing equations. . . . . . . . . . Z7Application to the subdivisions of a country. . . . . . . . . . . . . . . . . . . . . . . . 28
D. DIRECT CHECKS ON COMPLETENESS OF VITAL STATISTICS REGISTRATION. . 29Birth registration test in Puerto Rico, 1950. . . . . . . . . . . . . . . . . . . . . . . . 30
CHAPTER III
The accuracy of age and sex statistics
A. EVALUATION OF CENSUS RESULTS CLASSIFIED BY SEX ONLY, OR BY SEXAND BROAD AGE GROUPS. . . . . . . . . . . . . . . . . . . . . . . . . . . . . . . . . . . . . . . . . . 31
B. EXAMINATION OF DETAILED AGE CLASSIFICATIONS OF THE POPULATIONAT A SINGLE CENSUS DATE. . . . . . . . . . . . . . . . . . . . . . . . . . . . . . . . . . 33Inspection of the data. . . . . . . . . . . . . . . . . . . . . . . . . . . . . . . . . . . . . . . . . . . . 33Comparison of data with an expected configuration. . . . . . .. 36Analysis of ratios computed from the data. . . . . . . . . . . . . . . . . . . . . . . . . 39Measurement of age-accuracy by means of an index. . . . . . . . . . . . . . . . . . 40
C. EXAMINATION OF DETAILED AGE STATISTICS FROM TWO OR MORE CENSUSES 43
Computation of survival rates from age 5 and over to age 15 and over. . . 49Use of the balancing equation , . . 49
D. EVALUATION OF THE ACCURACY OF STATISTICS OF DEATHS BY SEX ANDAGE GROUPS . . . . . . . . . . . . . . . . . . . . . . . . . . . . . . . . . . . . . . . . . . . . . . . . . . . . 53
E. DIRECT CHECKS 53
CHAPTER IV
Adequacy of migration statistics
A. ADEQUACY OF INTERNATIONAL MIGRATION STATISTICS. . . . . . . . . . . . . . . . 55Use of the balancing equation. . . . . . . . . . . . . . . . . . . . . . . . . . . . . . . . . . . . . 55
vi

! "
International comparison .Direct checks .
B. ADEQUACY OF STATISTICS ON INTERNAL MIGRATION .
Continuous population registers .Census statistks relating to internal migration .Tests of data on place of birth .Tests of data on place of residence at a previous date .Direct checks .
Page
5657
575757575858
ApPENDIX A
The Haitian census of 1918/19
Appraising the church estimates. . . . . . . . . . . . . . . . . . . . . . . . . . . . . . . . . . . . . . . 59Comparing the church estimate and the 1918/19 census count with the 1950 61
census count. . . . . . . . . . . . . . . . . . . . . . . . . . . . . . . . . . . . . . . . . . . . . . . . . . ....Comparison of rate of growth with that of other countries. . . . . . . . . . . . . . . . . 61Estimation of 1920 population from 1950 census data. . . . . . . . . . . . . . . . . . . . . 61
ApPENDIX B
The reliability of census data for Libya
ApPENDIX C
The censuses of Honduras
63
The consistency of the census totals. . . . . . . . . . . . . . . . . . . . . . . . . . . . . . . . . . . . 65Consistency of census results with vital statistics. . . . . . . . . . . . . . . . . . . . . . . . 66
FIGURES
Map. Puerto Rico. Municipalities with given rates of population increase,1940-1950 : .
Figure 1. Population of Turkey, 1945, by sex, by single years of age and5-year age groups, according to census .
Figure 2. Population of Turkey, 1945, by sex and 5-year age groups.Comparison of census figures with a stable population .
Figure 3. Ten-year survival rates for male and female cohorts computedfrom Egyptian census data for 1937 and 1947 .
Figure 4. Ten-year survival rates for males and females computed fromcensuses of Honduras, the Philippines, Portugal and Turkey .
Figure A1. Annual population estimates, 1900-1944, for Haiti and depart-ments, and census results, 1918/19 and 1950 .
vii
viii
34
38
46
48
60

PUERTO RICO
SELECTED MUNICIPALITIES WITH GIVEN RATES01= POPULATION CJ.:IANGE 1940-1950
.-30'ATLANTIC OCEAN 1"10'
CARIBBEAN
1"00'
MAP NO. 765 UNITED NATIONSJANUARY 1956
0 5 10 15 20 as InerNIe oF 2~ or mo..w-MILES
Incre_ of 1St; to I~0 5 10 15 20 asKILOMETRES Ina.... oF I•• than 5:( or d.creueMajor highways
Umit of municipelity
Sen Juan metropolitan ....

'r
INTRODUCTION
The need for appraisal of demographic statistics
Population statistics, like all other statistics, whetherthey are obtained by enumeration, registration, or othermeans, are affected by errors. The errors may be largeor small, depending on the obstacles to accurate recording which are present in the area concerned, the methodsused in compiling the data, and the relative efficiencywith which the methods are applied. The importance ofthe errors, given their magnitude, depends on the usesto which the data are put. Some applications are valideven if the statistics are subject to large errors; otheruses require more accurate data. When dealing with anygiven problem, it is important to know whether the dataare accurate enough to provide a significant answer.
Until quite recent times, Governments paid little attention to an appraisal of the accuracy of demographicstatistics. It is now becoming widely recognized that aneffective statistical programme in this as well as otherfields involves not only the compilation of the neededstatistics but also an adequate 'measurement of theirreliability. Hence, efforts have been made recently invarious countries to ascertain the probable extent oferrors in the statistics being obtained. This practicehowever, has so far been mainly confined to those coun~tries where statistical activities have been most fullydeveloped. The need for investigation of the quality ofthe data collected is at least as great in the countrieswhere little work in this direction has so far been done.
In connexion with population estimates, the evaluation of the census or registration statistics on which theestimates are based has a double importance. In the firstplace, an investigation of the accuracy of the base datais a prerequisite to any attempt at determining the reliability of the estimates. Errors of estimation result bothfrom inaccuracies in the basic population statistics andfr0!U errors in the assumptions involved in deriving theestimates (for example, In the assumed populationchanges between the date of the latest statistics and thedate to which the estimate applies) ; and both sourcesof error must be taken into account if the degree ofconfidence that may be placed in the estimate is to beknown. Second, where an investigation of reliability ofthe base data has revealed errors, the direction andmagnitude of which can be estimated, it is possible tomake compensating adjustments, as the estimates ofpopulation are prepared, and thus to avoid a compounding of errors. In some instances, where difficulties areinvolved in the publication of adjusted census or registration statistics, estimates of population may, nevertheless, be made which are more reliable than the publishedofficial base statistics themselves. An adequate programme of investigating the accuracy of basic populationstatistics is therefore indispensable for the work ofmaking good population estimates.
1
Purpose of this manual
The purpose of this manual is to describe certainmethods for appraising the accuracy of those types ofstatistics which are most commonly used as a basis forcurrent population estimates and future population projections, namely, census figures on total population andon age groups, registration data on births and deaths,and statistics of migration. It is assumed that at leastone census has been taken in the country concerned andthat the results have been compiled, The statisticians ofthe country are faced with the problem of determiningthe accuracy of the census and other population' data,but are not in a position to re-enumerate the wholepopulation or repeat any major part of the census undertaking. With respect to the statistics of births, deathsand migration, the same assumption is made. The procedures used by the country for collecting these data areestablished, and the statisticians desire to appraise theiraccuracy in conjunction with the census results.'
Procedures for appraising the accuracy of certainpopulation data have been described in various UnitedNations publications. With reference to vital statistics,such procedures are discussed in the Handbook of VitalStatistics.2 In The Population of TanganyikaS there isan appendix on the problem of population statistics andin Problems of Migration Statistics/' there is a "Noteon the relationship between excess of arrivals over departures and net migration". A few publications havebeen concerned exclusively with appraisal procedures as,for example, "Accuracy Tests for Census Age Distributions Tabulated in Five-year and Ten-year Groups","~ro~edures that have be~n de~cribed in these other publications are referred to In this manual and only in rareinstances are reproduced in summary form. In usingthis manual, therefore, it is desirable to have availablefor reference those publications mentioned above. As thismanual is intended to supplement in certain respects thepreceding manual on methods of estimating total popu-
1 For information on the procedures of census enumerationand the collection of vital and migration statistics, see thefollowing United Nations publications: Population censusmethods, document ST /SOA/Ser.A, Population Studies, No.4, 1949; Handbook of population census methods, documentST/STAT/Ser.F, Studies and Methods, No.5, 1954; Handbook of vital statistics method, document ST /STAT/Ser.F/7, in press, 1955; Principles fora vital statistics system, document ST/STAT/Ser.M, No. 19, 1953; Informe final del primerSeminario Inieramericano de Reaistro Civil, Santiaga de Chile,1954, document ST/STAT /Ser.M/23, 1955; Problems of migration statistics, document ST/SOA/Ser.A, Population Studies,No.5, 1949.
2 Op, cit., especially chapter XIV.8 United Nations, Population Studies, No.2, 1949.4 United Nations, Population Studies, No.5, 1949.Ii Population Bulletin of the United Nations No.2, October
1952. ~

lation," study of the latter will in some instances makeclearer the meaning or purpose of some of the procedures described here.. T~e n~ture and quality of the demographic data existmg m different countries vary greatly. Population censuses have been taken with varying frequency andavailable series of birth and death statistics contain different kinds of detail. Migration across national boundari.es may be relatively important or 1}.0t. Consequently,different methods have to be employed in different situations for the appraisal of the accuracy of statistics. Ithas not been possible in the present manual to considerall the possible situations in which it may be desired totest the existing statistics. Nor has it been possible toconsider all the detailed tests to which every conceivablekind of data on the subjects covered here can be submitted. The methods presented here may, therefore, notalwa!s b.e directly applicable to a specific problem;modifications must be worked out by the statisticians inthe country to suit their particular requirements.
The best appraisal of a country's statistics can be~ade only if all available statistics, published or unpubhshed, are at hand and if various other information concerning a country's economic and social conditions isalso utilized. It has not been possible in the preparationof this manual to consider in every detail all the possibleinformation which, in a given country, can be utilizedfor an appraisal of its demographic data.
The results of the tests described in this manual areof various kinds. Sometimes, a test will reveal only thatstatistics are either "probably reasonably accurate" or"suspect"; if they are "suspect", further intensive investigation is required before a definite judgement can bemade. Other tests will not only indicate that errors arepresent, but also lead to an estimate of the direction andprobable extent of the error. In the latter case, it isdesirable to adjust or correct the faulty statistics and torevise the estimates based on them. The description ofprocedures to be used in the revision of estimates, however, is outside the scope of this manual.
Types of testing procedures
Whether one is dealing with census data, vital statistics, or records of migration, the same basic types oftesting procedures are applicable. This similarity resultsfrom the fact that demographic phenomena are interrelated both among themselves and with other social andeconomic phenomena. Some of these relationships aredirect and necessary. For example, the increase in population during a given interval is precisely determined bythe numbers of births and deaths, and the migratorymovements, occurring in that interval. Other relationships are less precise and less definite. For example, insome countries, an economic depression is likely toresult in a declining, and prosperity in a rising, birthrate, but the exact amount by which the birth rate willchange cannot be inferred even from detailed knowledgeof the economic situation.
The basic types of possible testing procedures can besummarized as follows:
6 United Nations, Manuals on methods of estimating population. Manual I: Methods of Estimating Total Population forCurrent Dates, document STjSOAjSer.A, Population Studies,No. 10, 1952.
2
(a) Comparison of observed data with a theoreticallyexpected configuration;
(b) Comparison of data observed in one country withthose observed elsewhere;
(c) Comparison with similar data obtained for nondemographic purposes;
(d) Balancing equation of directly interrelated data;and
(e) Direct checks (re-enumeration of samples of thepopulation et cetera).
The first two types of tests are similar The demograp~i.c changes observed in some other c~untry whereconditions are presumably similar can sometimes besubstituted for a theoretically expected configuration.When the ,!bserved data are compared with those whichare theoretically expected, the two sets of figures willalways be found to differ, whether by a large or a smallamount. The essence of the test then rests on the answerto the question: Can the difference between the observedand expected values readily be explained by historicaleve?ts or cu:rent conditions in the country, the data ofwhich are being tested? If not, then it must be concludedthat the observed data are "suspect" and may be inerror. ~urther investigation may yield an explanationof the difference, or it may furnish clear indications thatt~e "suspect" d~ta are indee.d in error. Very often thiskind of.method IS to be apph~d merely as a preliminarystep, to suggest along what lines further testing shouldbe undertaken.
In many countries, other data are available which canbe compared with the demographic statistics. For example, young men may be registered for the purposesof military recr!1itment. Estimates ?f the whole or partsof the population are often obtained from tax lists,voters' registers, school statistics, housing censuses etcetera. If such estimates differ from the population census data, the question arises whether there is a satisfactory explanation for the difference. This is the essenceof the third type of tests.. "Balancing equations" can be applied to test the con
sistency ?f the increase in population shown by twoenumerations at different dates with the increase shownby statisti.cs of the various' elements of populationchange-births, deaths, and migration-during the interval. If all the data were accurate the two measuresof ~ncrease (or decrease) should evidently be balanced.ASide from population totals, the test can also be appliedto sex and age groups and other categories of populationthat are. identifiable in ~he statistics. Furthermore, byr~arrangmg and re-~efimng the components of this equation, separa.te appraisals can be made regarding the accuracy of birth, death and migration statistics.
Direct ch~cks involve a field investigation, such as ar~-enumeratlon of a population sample, or a recount ofbirths. The advantage of a direct check consists in thefact that the individual persons enumerated or the individual events registered, can be identified 'so that notonly the consistency of totals, but the specific errors ofomission or double-counting come to light.
It will be noted that the first four types of testingprocedures only give an indication of relative accuracyas it appears from the comparison of two sets of dat~both of which are subject to error. If several testing~rocedures are applied, or if there is a strong presumption that one set of data used in the comparison is highly

T $
accurate, the evidence so secured can have considerableweight, amounting to a practical certainty. In otherinstances, the comparison may reveal little more thanthat at least one, if not both, sets of data are in error.
Nature of illustrative examples
Wherever possible, specific examples are includedshowing how various tests can be applied to the statistical data of certain countries. For the most part, thedata for these examples have been drawn from theUnited Nations Demographic Yearbook. It is importantto note that only a fraction of the data and knowledgewhich must be available in each country was actuallyused in working out these examples. Many more data,some of them not published anywhere, exist in thesecountries. In addition, the statistician's knowledge of thecountry, its people and their economic and social condition, and of the operations of the census and vitalstatistics system, is relevant to an appraisal of the demographic statistics. Hence, the examples presented hereshould be regarded merely as illustrations of methodsand the results should not be taken as definitive evaluations of the quality of the particular data employed.
Organization of this manual
The procedures are presented in four chapters withsupplementary illustrations in three appendices. Each ofthe fou~ chapters is. concerned with methods of testingas applied to a .pa,rtIcu1ar ,kmd of statistics, namely census totals, statistics of births and deaths statistics ofpopulation by age and sex, and statistics 'of migration.The five baSIC types of tests are presented in so far asapplicable, in each of these chapters. In each case theproblem of testing is considered both on the assumptionthat there has been only one census and that there havebeen t,:"o or more censuse~ if! the past. The applicationof te~t!n.g methods to stat~stIcs of a country's politicalsubdivisions, such as provmces, departments, counties,
municipalities, cities et cetera, as well as to statisticsfor the entire country, is considered wherever possible.
The first chapter, on the accuracy of census totals, isconcerned with testing only the accuracy of the "headcount", that is to say the total number of personsenumerated, without reference to the characteristics ofthe population. In the second chapter, emphasis is placedon methods for evaluating the completeness of the registtation of births and deaths. The procedures describedin those two chapters are carried into further detail inthe third. chapter, which deals with the accuracy of ageand sex reporting, a subject of considerable importancein making population estimates and in analysing mortality, fertility, economic activities of the people et cetera.The last chapter, on the adequacy of migration statistics, is mainly concerned with statistics of internationalmigration, but some attention is also given to internalpopulation movements.
Three appendices are included to show how varioustests, de~cribed separately in the several chapters, canbe combmed and brought to bear on a particular problem of appraisal. Appendix A and appendix C deal withcen.sus statistics of Haiti and Honduras, respectively.It IS emphaSIzed that the calculations presented therehav.e been r;nade without detailed study of the sourcesof mf~rmatlOn or the conditions existing in these twocountnes; the results are therefore only illustrative andfar from a definitive appraisal. The purpose is only toshow how several methods can be combined in an attempt at appraising a particular set of data. Appendix Breproduces some tests which were applied by C LPan7 to the Libyan censuses of 1931 and 1936 i~ a~effort to appraise their accuracy. It is not expected thatany other country will have exactly the same problemsas t~ese three, nor is it expected that the tests can beapplied in o~her countries in exactly the same manner.The adaptatlOn of these tests to meet the unique condition.s ~f.any specific country must be worked out by thestatistrcians of the country concerned.
7 Reproduced ~rom Chia-lin Pan, "The Population of Libya"population Studies, Vol. III, No.1, June 1949. '
3

CHAPTER I. THE ACCURACY OF CENSUS TOTALS
A. Intreduction
The degree of accuracy in a count of the total numberof people in a country is a function of the accuracy withwhich the entire census operation was conducted. The.head count may be either more or less accurate thanthe enumeration of some of the parts, such as age ormarital-status groups, but if all the census rroceduresare of poor quality and the characteristics 0 the population have not been accurately determined there is littlelikelihood that the head count will be correct. Indeed,one of the ways of appraising the quality of the headcount consists of analysing the accuracy of data onvarious characteristics of the population. This analysismay not only reveal evidence of inaccurate classificationof the individuals enumerated, which is likely to be associated with a faulty head count, but also may reveal atendency to omit certain categories of the population,which of course has a direct effect on the accuracy of thetotal count.!
Proper evaluation of the head count requires consideration not only of the census figures for componentsof the population and other information bearing on thequality of the work, but also of any collateral vital statistics, migration statistics, and other relevant data, andthe reliability of these collateral data. Ideally all the materials should be examined, and evaluated simultaneously, but in practice this is impossible. In this manualthe ways of analysing the different items are taken upseparately.
FACTORS AFFECTING THE COMPLETENESS OF ACENSUS COUNT
The factors which contribute to the completeness of acensus count will be but briefly mentioned here. Thesefactors have already been considered in greater detailin other publications dealing with census procedures.'The main function served in reviewing them here is tohelp direct the analyses of the accuracy of census details.For example, s.ocial customs sometimes o:pera~e again.streporting certain segments of the population m certaincountries; accordingly, if it is known that a!U0~g a ce~tain population group the custom of not talking m pubhcabout baby boys is prevalent, then special attention canbe directed toward evaluating the completenessof censusenumeration of male children among that group.
It is assumed that administrative and technical procedures at the central census office have been arranged aswell as possible so that clerical errors or other mista~~sin handling the census returns are reduced to a rmmmum. The factors affecting the completeness of the census count can then be listed as follows:
. 1 For the analysis of age and sex classifications as clues tothe accuracy of the head count, see chapter Ill.
2 See: United Nations, Population Census Methqds, Population Studies, No.4; and Handbook of Populatton CensusMethods.
4
1. Obtaining full public co-operation. Sometimes thegeneral public may not fully comprehend the significanceof a census because of ignorance resulting from illiteracy,lack of communication facilities et cetera. In the pastin some areas censuses have been connected with taxation, military service, rationing, or other benefits orobligations; where the public believe that such a connexion exists it is difficult to obtain their full and unbiased co-operation. Superstition and various social customs sometimes are important; if it is believedthat "badluck" will follow if one gives out personal informationabout the members of his family, there will be troublein obtaining such information. In some cases enumerators may have to be recruited from an educated classwhich does not enjoy the full confidenceof less educatedsegments of the population.
In general, but not always, this type of problem ismost acute in the case of poor and illiterate populations,among those groups sometimes characterized as "underdeveloped".
2. Problems of geography. In an area which is difficult of access because of geographical barriers such asmountains, swamps, deserts, bodies of water et cetera,and where the road and transportation system is inadequate, considerable trouble will be had in locating thepopulation. Often, where such geographical conditionsare found, there is also an absence of adequate maps,which complicates the problem.
3. House identification. The intent of every census isto relate the population to specific areas; this involvesbeing able to identify the dwelling or other place whereeach person is to be counted. Furthermore, it is necessary to identify dwellings so that coverage can be assured ; the enumerator must know that he has or has notas yet enumerated a given person. Among some populations, such identification is difficult for various reasons: there are houses which lack exact addresses, .persons who dwell on boats or barges, nomads or seminomads who have mobile dwellings, or persons whohave no fixed place of residence.
4. Obtaining good enumerators. If there are feweducated and literate people in a given area, it may bedifficult to obtain enough persons qualified to do a goodjob of enumeration. Sometimes also, even when thereare enough qualified people in an area, it may be difficultto recruit them for census work. There may also nothave been enough opportunity to provide enumeratorswith the necessary training to enable them to interpretthe census instructions correctly.
Other problems affecting the accuracy of census enumerations may be mentioned. Some such problems arepeculiar to one country only. It is useful, before appraising the accuracy of the census results, to review all theproblems which may have been encountered and toconsider what defects in the enumeration may have resulted. Special efforts should be made to appraise the

completeness of the census counts in those areas oramong those population groups which are know~ to besubject to conditions unfavourable for census taking.
B. Appraising the head count of a single census
The problem considered in this section ?f the chapter is that of evaluating the accuracy of a single censuswithout reference to demographic data other than. thoseof the census itself. This step should be t~ken in theappraisal of any census. If the data.of a prevtous cen~us,records on births deaths and migration, or detailedstatistics on popuiation characteristics also eJ;Cist, thisstep is only a part of a more extensive analysis. If theresults of this one census, without detailed breakdownby population. characteristics, are t?e only demograp~icdata available methods of appraisal are of necessityconfined to th~se described in this section, unless directchecks, considered in section E of this chapter, canbe undertaken.
Even in the case of those censuses which yield noother statistics than the head count, the results are invariably available for various political subdivisions ofthe country. In many cases, but not invariably, information is also available on the numbers of households (orfamilies) enumerated. The enumeration procedures aregenerally conducted on a househol~ ~asi~ (that is tosay the information for all persons living m one household is grouped together on ~he census schedule and ~hehousehold is separately identified), Procedures for usmgthe figures for subdivisio~s of ~he country ~d the information on households, tf available, for helping to appraise the total head count, are accordingly introducedhere.
In the circumstances stated above, only a direct checksuch as described in section E below, can give a definitemeasure of the extent of error in the head count. However without a direct check, the following four testsmay'show whether or not an error of considerable importance is probably present, and in some cases mayyield an estimate of the amount of errors.
(1) Review of the enumeration procedures and information on the quality of performance.
(2) Comparing the census figures with any availabledata from non-demographic sources which relate to thenumbers of the population or parts thereof.
(3) Relating the population distribution as revealedby the census findings to known characteristics of thesubdivisions.
(4) Comparing the head and household counts.Additional tests, some of which are described subse
quently. in the prese':lt section, are also recommended,depending upon the CIrcumstances of the case.
REVIEW OF CENSUS PROCEDURES AND PERFORMANCE
With respect to the first test, there is little that canbe said other than that all the factors involved in thecensus undertaking which may bear on the accuracy ofresults should be examined. Such an examination mayvery well be regarded as an integral part of the censuswork rather than as a separate testing procedure. Theenumerators' maps should be checked to see whetherthe entire country was covered, and the returns shouldbe checked to see whether every known city, town, village and hamlet was included. Available reports of the
5
census supervisors for different areas should be searchedfor observation on the quality of the personnel engaged and of their performance. The completed schcdules for each area should be scanned for an impressionof the degree of care taken in filling them, and of theextent to which the instructions appear to have beenunderstood and followed.
The prescribed census procedures themselves shouldbe studied with attention to the possibilities of errorwhich may be inherent in them. For example,. if it isfound that in some or all areas the enumeration wasmade by convoking the population of each village, themembers of each tribe et cetera, at an appointed timeand place instead of visiting their dwellings individually,the possibility of a substantial error may be envisaged.If the enumeration was conducted over a very longperiod of time, errors may be expected as a result ofpopulation flux during the interval.
An example of the us~ of some of the .methods described above, together with others, to verify the probable extent of omissions is found in the Brazilian censusof 1940. Persons connected with government and business organizations were required to report any knowncase of census omission on a special questionnaire; inone area, postmasters were required to identify personsin their respective districts who had not been reportedat the census' students were offered rewards for information on p~rsons not enumerated; local judicial authorities were asked to express their opinion on theprobable efficiency with which enumeration was carriedout in their respective areas, Direct checks were alsoemployed. By comparing the information obtained fromthese several sources, it was estimated that about 1.7.per cent of the population of the country had not beenenumerated, this percentage varying greatly from areato area, depending on whether population was dense orscattered and whether transportation was easy or difficult.8
RELATING THE CENSUS COUNT TO NON-CENSUS COUNTS
Often, some estimate of population can be obtainedfrom such sources as police records, church records, taxlists, counts of persons eligible for military service,school attendance et cetera. Information relevant topopulation, or to households, farms et cetera, may alsobe obtained from censuses of housing and agriculture.In some cases such information may purport to be totalcounts of the popUlation living in each area; in otherinstances the information may relate only to selectedpopulation segments or other relevant data which canbe converted into estimates of the total population.sThese figures are then compared with the census countsfor the whole country and each region. Where there isrelatively "close" agreement the presumption is that bothcounts are reasonably correct; at least such agreementdoes not prove that the census count is incorrect. Ifthere is considerable disagreement, it is necessary tocheck further in an effort to appraise the two counts.
8 International Statistical Conference, Washington, D.C.,1947. Note on the Completeness of the 1940 Brasilian Population Census, by Jose Carneiro Felippe and Octavio Alexanderde Moraes.
• Methods of deriving population estimates from non-censalstatistics have been described in the preceding manual in thisseries Manual I: Methods of Estimating Total Population forCurr,'nt Dates, Population Studies, No. 10, especially chapterIII.
J

Of course, even when both counts are in agreement,the evidence is not conclusive that the census count iscorrect. Both counts may be incorrect by the sameamount, as for example, by the omission of the population living in some remote area. Further checks, including the conducting of sample re-enumerations, arenecessary in order to provide positive proof of thedegree of inclusiveness in the census. If the non-censuscounts and estimates are believed to be nearly accurate,however, the comparison yields at least an approximateestimate of the error in the census figure for the areaconcerned. Also, if there is reason to believe, for example, that the non-census figure is below the truenumber, and if the census figure is still lower, the inference can be drawn that the census figure is too lowby at least the amount of the difference.
The application of this test, that is to say, comparingcensus results with non-census estimates-is illustratedwith data for Haiti, Northern Rhodesia and SouthernRhodesia in table 1 below. A census was taken inHaiti in 1918/19; its results are compared with theestimates derived from church membership data for thesame period. The census count of 1,631,000 populationis 30 per cent below the non-census estimate of 2,121,000.Among the several regions of the country the differencesbetween the two counts are quite variable. In theArtibonite the two figures are very close; in the North,however, the non-census estimate is about 71 per centgreater than the census count. In order to evaluatethese data each set of counts has to be explored atconsiderable length and other evidence introduced. Thisproblem is illustrated at further length in appendix A.
The data for Northern Rhodesia show much closeragreement than those for Haiti. Here the census count of1 837 000 is 9 per cent greater than the non-censusc~unt'of 1,674,000derived from tax registers. In four of
Table 1
CoMPARISON OF CENSUS COUNTS AND NON-CENSAL POPULATIONESTIMATES, FOR SELECTED AREAS
(numbers in thousands)
Difference
Censu, NOJl-ce,,,al Per Clmtco.... t e,timate N..mber of cen,,,,
Area and date (a) (b) (a)-(b) count
Haiti,1918/19 1,631 2,121 -490 -30West ............ 671 780 -109 -16North ........... 256 437 -181 -71Artibonite ....... 241 255 -14 -6South ........... 385 541 -156 -41Northwest ....... 78 108 - 30 -39
Northern Rhodesia,1,674 +163 +91950 1,837
Barotse ......... 278 268 + 10 +4Central 176 175 + 1 a.........Eastern ......... 376 322 t 54 +14Northern ........ 410 338 72 +18Southern ........ 212 204 + 8 +4Western ........ 385 367 + 18 +5
Southern Rhodesia,1,631 -12 -11948 1,619
Salisbury .•.....• 408 436 -28 -7Gwelo ........... 366 334 + 32 +9Victoria ......... 284 298 -14 -5Bulawayo ........ 313 335 - 22 -7Umtali .......... 248 228 +20 +8
aDifference negligible.
6
the six regions the differences are 5 per cent or less,and may be considered almost negligible for many practical purposes. In two of the regions, the Eastern andNorthern, the differences are quite substantial. Part ofthe difference between the census and non-census countsmay be due to the fact that the census count is basedon a sample and therefore has some sampling variance ;sampling variance, however, does not account for all ofthe differences between the two sets of counts.
Detailed pursuance of this problem is not within thescope of this manual. It can be pointed out, however,that the procedures for obtaining non-census counts suchas those of Northern Rhodesia can lead to some error.Generally, these procedures consist in obtaining figureson the numbers of taxable heads of households, collectedfrom every village by visiting officials, with subsidiaryestimates and adjustments to make estimates of totalpopulation. The figures on taxpayers may be incompleteor out of date and the estimates of their dependants,mostly women and children, may be quite inaccurate.Actually, in the present instance, the two counts for adultmales are quite close, the totals differing by less than2 per cent. For women and children, however, the noncensus counts are about 12 per cent below the censuscounts; it is quite possible that most of this differenceis due to error in the non-census figures. Furthermore,non-census figures for some villages were out of date,having been kept without change since the time of thelast visit," In short, there are sufficient discrepancieswithin the non-census count to disqualify it as a positive check on the census count. It can be concludedonly that in four of the regions the agreement is quitegood, and in two regions there is much less agreement.It must be concluded, however, that the results of thetwo counts in Northern Rhodesia substantiate each othermuch more closely than they do in the case of Haiti.
In Southern Rhodesia the agreement between thecensus and non-census counts appears somewhat betterthan in Northern Rhodesia. In none of the regions isthere exact agreement. The maximum difference, however, is only 9 per cent; in some regions the census countis higher and in others the non-census count is higher.As in the case of Northern Rhodesia, the census countis based on a sample and hence has some samplingvariance; the non-census counts also are in error tosome degree,"
Practically speaking, the agreement between thecensus and non-census counts is probably about as closeas can be expected.
The observations on these three countries can besummarized as follows:
1. For Southern Rhodesia, the comparison with thenon-eensal estimates gives support to an inference thatthe census count is not subject to great error.
2. For Northern Rhodesia, the result of the test isless conclusive, but it does not suggest a large error inthe census figures.
II Report on the 1950 Demographic Sample Survey of theAfrican population of Northern Rhodesia, Central AfricanStatistical Office, Salisbury, Southern Rhodesia, April 1952,pp. 10 and 11.
e Report on the Demographic Survey of the African Population of Southern Rhodesia, Central African Statistical Office,Salisbury, Southern Rhodesia.

I r'"tX .
3. For Haiti, the magnitude of the differen~e callsfor detailed investigation of sources of erro~ in ~thsets of figures; pending the result of.such an investigation the possibility of a major error In the census countmust be admitted.
RELATING THE CENSUS COUNTS FOR VARIOUS AREAS TOKNOWN CHARACTERISTICS OF THE AREAS
Generally the statistical agencies of eve~ coun~ryhave intimate knowledge about the geographical, SOCial,and economic characteristics of the country's subdivisions. Such knowledge is sometimes quantitative andperhaps very often of a qualitative nature. In eitherevent such details provide clues as to the possible popuhtion of the various parts of a country. Such knowledge does not in itself prove that the census count IS
correct or deficient, but it serves as a backgroundagainst which to appraise the census count. For example, many countries have detailed land use mapsand/or maps showing the agricultural areas or comprehensive aerial photographs. Such maps or photographs can never prove how tnany people should havebeen enumerated in each segment of the country, butthey can suggest whether there may be many more, ormany fewer people than the census counted. In thisconnexion use of density figures (population per squarekilometre, for example) according to land use in thevarious subdivisions of the country tnay be the mostilluminating procedure. For example, an area devotedto coffee production is likely to have a lower population density than one devoted to sugar cane or tobacco,since coffee requires perhaps only one-third as muchlabour per unit of land; an area devoted to cattleraising should be more sparsely settled than one devoted to dairying.
This type of appraisal can be illustrated with datafor Puerto Rico. A group of municipalities were selectedin which sugar-cane raising was very important; theywere all located on coastal plains. The average densityshown by the census in these municipalities was 470persons per square mile; the range in density was from341 to 706 persons. Another group of municipalitieslocated in the mountains, in which coffee raising wasvery important, had an average density of 332 personsper square mile. The range in density among thesemunicipalities was from 200 to 483 persons per squaremile. Clearly, the two types of regions have differenttypical population densities, but for some of the sugarareas the census shows no higher density than forcertain coffee areas. If it were desired to chec~ thecensus counts, this comparison would suggest payingspecial attention to those sugar municipalities whichreported low population densities, and perhaps thosecoffee municipalities which reported very high densities.
Other information can be brought to bear in accordance with the known conditions of the country.Perhaps a given part of a country contains extensivepublic lands which are largely closed to settlement;few people should be enumerated as living there. Theresults of censuses of agriculture, industry, or housing,if available, are likely to be especially useful. All suchtypes of information cannot be listed here; the statisticians in each country can seek the information appropriate to their purpose.
COMPARING THE HEAD AND HOUSEHOLD COUNTS
Comparison of these two counts is done most easilyby computing the numbers of persons per ho?sehol~.Several such measures are available: (a) the arithmeticaverage number of persons per household; (b) themedian number of persons per household; (c) households classified by number of members, such as oneperson households, two-person households et cetera.For the sake of simplicity the tests illustrated beloware based on the arithmetic average number of personsper household (or family).
COMPARISON OF URBAN AND RURAL AREAS
This test involves calculating the average numberof persons per household for urban and rural areas,not necessarily by political subdivisions. In most countries the censuses classify the population as urban andrural; hence it is possible to tabulate the census resultsso as to obtain counts of the numbers of persons livingin each type of area, and the numbers of householdsin each type. Such data without reference to politicalsubdivisions will be used in these illustrations.
As a general rule, the average size of household inrural areas should be larger than in urban areas. Theabsence of such a relationship constitutes a warningthat the census count may be deficient and that aninvestigation of the reasons for the observed differencesis required. This type of test can be illustrated withthe following data for Puerto Rico and Costa Rica.(The choice of these illustrations, of course, does notimply that the census figures for these countries arethought to be particularly unreliable.)
Pet'slms />I!t' household
Puerto Rico (1950)
Total country 5.07Metropolitan areas (containing central cities
of 50,000 population and over)........... 4.69Central cities 4.55Population living outside central cities.... 5.16
Cities of 25,000 to 49,000 population. . . . . . . . 4.40Cities of 10,000 to 24,000 population. 4.56Small cities and rural areas............... 5.35
Costa Rica (1950)
Total country 5.59San Jose metropolitan area................ 5.40
San Jose city........................... 5.31Population living outside San Jose city.. 5.72
Other cities 5.26Rural areas 5.74
It will be noted that in both of these countries the~umber o~ persons per household shown by the censusIS larger in rural areas than in the cities. Within theurban areas of these countries there seems to be littleif any, relationship between city size and number of~rsons per household. In some countries the averagesize of household may become progressively smalleras the size of the city increases; this condition, howeveris not as commonly found as the urban-rural differencementioned above. As regards the figures for PuertoRico and Costa Rica, the conclusion from this test isthat it has produced no evidence of a possible errorwhich would require investigation.
7

COMPARISON OF POLITICAL SUBDIVISIONS
This test consists of calculating the number of persons per household by urban and rural areas, for thevarious subdivisions of a country. If the average sizeof household is very unusual in anyone area-eithervery large or very small-it serves as an indicationthat there may be errors in the census count whichought to be investigated further. This test can be illustrated with da,a for Costa Rica as follows:
Persons per household, 1950
Province Total Urban Rural
Total country .............. 5.59 5.33 5.74San Jose ...................... 5.58 5.40 5.80Alajuela •••••••••••••••••••• o. 5.80 5.30 5.94Cartage ......... ............. 5.86 5.54 5.98Heredia ...................... 5.79 5.57 5.91Guanacaste .................... 6.31 5.69 6.42Puntarenas .................... 5.34 5.21 5.39Limon ........................ 3.98 4.08 3.94
Examination of these data on average size of household reveals some variation among the provinces, andshows that the province of Limon has the smallesthouseholds. Furthermore, within each province therural area has the larger average size household, withthe exception of Limon. Indeed, within the urban areasthere is comparatively little variation among the provinces, excluding Limon; the maximum variation is lessthan one-half a person (compare Guanacaste and Puntarenas). Within the rural areas the variation is somewhat higher than among the urban areas, the maximumvariation, excluding Limon, being about one person(again, compare Guanacaste and Puntarenas). Limonappears so unusual by this test as to raise the possibilitythat there was an undercount of population there andfurther investigation seems called for. The possibilityto be investigated is that many persons were not countedin the census although their households were enumerated. Actually, as the following analysis shows, otherplausible explanations can be found for the Limonfigures.
Further analysis can be based on data relating tocharacteristics of the population as shown by the census.
Although the evaluation of such data is to be taken upin a later chapter, it seems convenient to introducehere, for illustration, the use of figures such as thoseassembled in table 2, on this page. Inspection of lines2 to 4 inclusive reveals that Limon has an unusuallyhigh percentage of one-person households, 18.3 percent as compared with 4.8 per cent in the total country.This could have occurred if, in some households, thewives had been omitted from the census count.
Hence, the next step is to examine the sex composition. Limon has an excess of males of all ages (line 6), incomparison with the total country; only Puntarenashas a larger proportion of males. Turning to the population aged 1:; and over (line 7), it is noted again thatLimon has a larger proportion of males than the countryas a whole.
This high percentage of men might be a further indication that many women were missed. Accordingly, marital status composition can be studied; if many wiveshad been missed then there ought to be a preponderanceof married men in this province. Among the marriedpopulation, however, there is but a very slight preponderance of men (line 9). In this respect Limon differsbut very little from the entire country. Among thesingle population there is a very large excess of men(line 8) ; in Limon 63.3 per cent of the single population are men as compared with but 52.5 per cent in thetotal country. Only Puntarenas has a somewhat higherproportion of single men. These figures do not supportthe hypothesis that wives were omitted from the censusin Limon in any unusually large numbers.
Might an unusually large number of children havebeen omitted from the census count in Limon? In line 5is presented the number of children under 5 years ofage per 100 women aged 15 to 44 years inclusive. Ifthe great majority of the women in the province wereincluded, but if a large number of children were omitted,this ratio ought to be relatively small in Limon. In fact,however, this ratio is exactly the same for Limon as forthe total country (line 5). Hence, the presumption isthat unusually large numbers of children were notomitted from the census count in this province.
Table 2
SELECTED POPULATION CHARACTERISTICS FOR COSTA RICA, BY PROVINCES, 1950
EntireLine No. country San lose Alajuela Cartago Heredia Guanacaste Puntarenas Lim6n
1. Population (in thousands) .......... 800.9 281.8 148.9 100.7 51.8 88.2 88.2 41.42. Number of households (in
17.2thousands) ........................ 143.2 50.5 25.7 8.9 14.0 16.5 10.43. Number of households containing
only one person (in thousands) ..... 6.9 1.9 0.8 0.6 0.3 0.5 0.9 1.94. One-person households as percentage
3.8 3.3 5.5of all households ................... 4.8 3.0 3.6 3.4 18.35. Children under 5 years per 100
65women aged 15-44................. 74 81 79 68 89 80 74Percentage of males:
6. In total population................. 49.9 47.9 49.9 50.5 48.9 51.2 53.7 53.07. In population aged 15 and over ..... 49.3 46.4 49.1 49.7 47.9 51.3 55.5 54.38. In single population aged 15 and over 52.5 47.3 51.9 53.3 49.3 55.2 65.3 63.39. In married population aged 15
49.9 49.5 49.7 49.9 49.6 50.8and over" ......................... 50.0 50.9
• Including consensually married persons.
8

Per ce"t per a""um
7 Geometric rate of increase, per annum.
0.961.18
2.031.021.68
-0.93-0.90-0.53-0.17+0.42+0.79+0.92
Average a""ual rateof increase"
Barbados .Leeward Islands .Bahamas ················ .Turks and Caicos Islands .Windward Islands .Guadeloupe .Trinidad and Tobago .
Area Dates
i\ngola 1940/1950110zambique 1940/1950South Africa, excl.~uropeans 1946/1951
Bechuanaland 1936/1946Swaziland 1936/1946
In some of the territories, population decreases wereregistered while in others the increases were only moderate. The decreases, or low rates of increase, mayhave been caused by the great influenza epidemic following the First World War, which took a heavy tollof liv~s in this region. The epidemic may have affectedsome Islands more than others. Differences in populationgrowth may also have arisen through migration, bothbetween these islands, and from these islands to otherregions. However that may be, the average rate ofpopulation change did not exceed one per cent (plusor minus) per annum in any territory except Martiniquewhere an exceedingly high rate of growth was observed:How could this be? Did Martinique completely escape!he influe~z,!- epidemic? Wa.s there a large immigrationinto Martinique? If there IS no such explanation theconclusion must be either that the 1910 census of Martinique was incomplete or that the 1921 figure wasinflated.
In some cases it may not be helpful to compare therate of population growth in the country in question withthat of other countries. It may be that conditions areso unusual as to preclude any useful comparison. Or itmay be that no census figures are available for othercountries with approximately similar social and economicconditions. Even so, it is possible to set probable upperand lower limits for the average annual rate of increase.
If the country's population changes only throughnatural increase, it is very unlikely to have an average
Although the average annual rate of population increasein Angola is lower than that in any of the other areaswith which it is compared, its rate is not so extremelydifferent as to lead to suspicion of the census counts. Theresult of the comparison is compatible with an accuratecensus both in Angola and in the other areas.
A second illustration is provided by data for Martinique and other island territories in the lesser Antilles.The population of Martinique, according to censuses,increased from 1910 to 1921 at an annual geometricrate of 2.66 per cent. Such a rate of population growthis high but is known to have occurred in some areas.Population changes during the same period in otherislands of the region were as follows, according tocensuses of 1911 and 1921:
similar social and economic conditions should havefairly similar rates of population growth.
This procedure can be illustrated with data for Angolaand neighbouring areas:
C. Consistency of totals at successive censuses
When the total population of a country is known forseveral successive censuses, better estimates of the probable accuracy of each census, including the most recentone, are possible than if data were available for onlyone census.
The guiding principle to be followed in comparingthe results from two or more successive censuses, is thatpopulation changes normally proceed in an orderlymanner. This is to say that in the absence of unusualevents the rate of increase for the whole country andfor each of its parts, can be expected to change onlygradually in successive inter-censal periods, and to folIowa fairly constant trend. When such an orderly pattern is not observed, the deviations should be explainablein terms of known events, such as the curtailment ofimmigration, the presence of famine, or any other event.Deviations from the pattern which cannot be so explained constitute a warning of possible errors; and thepresumption of error is greatly strengthened if the results of other tests, however inconclusive in themselves,are found to point in the same direction.
ANALYSING THE RATE OF CHANGE BETWEEN TWOCENSUS DATES
When the total population of a country is known fortwo successive census dates a test which can be appliedconsists of comparing the observed rate of change withthe rates of change observed in other countries. Forthis purpose comparisons should be made with suchother countries as seem to have approximately comparable demographic, social and economic conditions.Actually, of course, no two countries have identicalconditions; nevertheless, countries which have fairly
COMPARISON OF RESULTS OF DIFFERENT TESTS
As the examples given above imply, the results of thetypes of tests described in the present section are oftennot sufficient in themselves to prove that the censuscount is either correct or in error, or to give an estimateof the amount of error. For the most part, they serveas indicators of possible errors that deserve investigation by means of more rigorous checks. It is often possible, however, to get more definite indications by comparing the results of different tests of the type described.For example, if a review of the census methods and evidence on the quality of performance gives rise to a suspicion that the results for a given administrative areamay have been inaccurate, and if a comparison withnon-census data or an analysis of the household figuressuggests a possible deficiency in the count for the samearea, the inference to be drawn from the two tests combined is far more positive than the result of either testconsidered alone.
In summary, the small average size of household inthe province of Limon seems consistent with a censuscount, as complete there as in the remainder of CostaRica. Further checks can be made, of course, not onlyby re-enumerating the province or a sample of it, butalso by investigating other aspects of its social, economicand ethnological structure, factors which could not beincluded in this brief example.
9

annual rate of growth exceeding 3 per cent. This wouldbe the result of a high birth rate (say 40 or more per1,000) and a very low death rate (say 10 or less). Onthe other hand, it is only in unusual circumstances thatthe population would be likely to decline without heavyemigration. In fact, nearly all observed rates of naturalincrease in the various countries of the world in modemtimes have been in the range from zero to 3 per cent.If, in any given country, the rate of population changeapproaches or exceeds these limits without large-scaleimmigration or emigration, the question must be raisedas to whether there is some explanation for such anunusual rate, or whether the census counts were in error.
An illustration can be found in data for Honduras.According to the census counts of 1926 and 1930, thepopulation increased 5.8 per cent per year. Such a ratecould not have been attained by the excess of birthsover deaths. Only an extraordinary immigration intothe country could have caused it. If there was no suchimmigration, it is clear that the census figures are erratic. Possibly the earlier census was incomplete andthe later one complete, or the first was correct and thesecond unduly inflated, or more likely, both were inerror. The inconsistencies in census data for Hondurasare treated in more detail in appendix C.
With some information, however approximate, regarding the conditions of mortality and fertility in thecountry, the limits of the rate of growth may be definedmore closely. For example, if there is reason to believe,even without reliable vital statistics, that the birth rateis normally at least 30 per 1,000 (corresponding tomoderately high fertility) and that the death rate doesnot normally exceed 20 per 1,000 (corresponding tofairly good control of major infectious diseases), then,in 'the absence of large-scale emigration, any averagerate of growth below one per cent per annum shownby the censuses gives a strong presumption of error.
COMPARING RATES OF CHANGE DURING INTERVALSBETWEEN THREE OR MORE CENSUSES
If population counts are available for three or moresuccessive censuses it becomes possible to make a moreaccurate evaluation by comparing the successive ratesof growth. Again, the same principle is followed, namely,that the pattern of population growth should be regularexcept in so far as it can be shown that changes in thecircumstances may have led to departures from thepattern.
An example of this test is afforded by Guatemalancensus figures. The average annual rates of increasewere as follows:
1880 to 1893.............................. 0.841893 to 1921.............................. 1.361921 to 1940.............................. 2.671940 to 1950 -1.63
The rate of increase in the period 1921 to 1940 wasimprobably high in comparison with the earlier period;furthermore, it approaches the upper limit of about 3per cent per year, which was previously noted. Finally,the census counts show a decrease in population in thenext decade, 1940 to 1950. The latter also seems improbable, since, as was mentioned previously, declines areunusual. These .observations strongly suggest that thecensus count of 1940 was exaggerated; or, which is lessprobable, that both the 1921 and 1950 counts, and per-
10
haps also the 1893 enumeration, were grossly deficient.No evidence is available to show that there were suchchanges in social and other conditions, or such largemigrations, as could have led to these diverse rates ofchange.
As a further check, the average annual rate of changefor the period 1921 to 1950 can be calculated. This rateis 1.16 per cent. The fact that it is below the rate for1893 to 1921 is difficult to explain except on the hypothesis that the census figures for 1893, 1921, or 1950, aswell as 1940, are in error (some exaggeration in 1921,or some deficiency in 1893, 1950, or both).
Another example of this test is afforded by data forthe Indian peninsula (the combined areas of India andPakistan). The average annual rates of increase for theinter-censal periods were as follows:
Per cen'1901 to 1911. 0.651911 to 1921 0.091921 to 1931 1.021931 to 1941. 1.41
Inspection of these rates suggests, at first glance, aserious under-count at the 1921 census. It is known,however, that the Indian peninsula suffered an enormousnumber of deaths as a result of the influenza epidemicfollowing the First World War, and this is a sufficientexplanation for the abnormally low rate of populationincrease during the decade 1911 to 1921.
POPULATION TOTALS FOR SUBDIVISIONS OF A COUNTRY
The type of tests previously described, for analysingthe changes in a nation's total population, can be applied in principle to the analysis of changes in the varioussubdivisions. Here too, we expect to find "orderly" patterns of population change, both within the same subdivision in successive inter-censal periods, and amongdifferent subdivisions in any period. Any dissimilaritiesshould be explainable in terms of known conditions. Asa practical matter it is well known that there is considerable diversity in the rates of population change amongthe various parts of any nation. Accordingly, the problem becomes one of trying to distinguish between changeswhich are explainable in terms other than errors in thestatistics and those which are not. It should be notedthat although these procedures may reveal the presenceof errors and in some cases indicate their order ofmagnitude, they provide no basis for exact estimates ofthe size of the errors. Definite estimates must be madeby other methods, some of which are described in chapters II and III.
COMPARING SUCCESSIVE CENSUSES
With this method alone, final evaluation of onecensus count on the basis of preceding counts cannotordinarily be made until one or more subsequentenumerations are available for purposes of comparativeanalysis. Preliminary analysis can be made, however,without waiting for subsequent counts. Actually, it isa part of normal census procedure, as soon as an areahas been enumerated, to calculate the percentage changein its population since the previous census date andcompare it with the changes in surrounding areas andduring previous inter-censal periods. Any unusual rateof change should be questioned immediately, and if

i'--~--------
38.141.636.6
Per cent increase inpopulation, 1940·1950
Per cent
~ega ~lt.a 15.3Mega. ala 25.2
anati 3.7
In ~ll three o~ th~se municipalities those parts throughwhich the main highway passes grew more rapidly thanth~ ?ther parts. All. three municipalities are in partwlt~l1n the zone of influence of the San Juan metropolitan area; numbers of people travel to work regularly between Manati and the metropolitan area. It canthen be asked why w.ere the differences in populationgrowth so large, and is there a possibility of an under-'
23.934.421.6
Continuing westward along the northern coast thenext thr.ee municipalities and their rates of populationgrowth in the decade 1940 to 1950 are:
ToaBaja:Total .Highway area .Remainder .............................
Dorado:Total .Highway area .Remainder .
Second World War and in part came about whenPuerto Rico achieved self-government and the types andamounts of government services were greatly expanded.
Another factor which was probably important wasthe building of the new highway along the northerncoast during this decade (see map). As a result theSan Juan area became a focal point for a much largervolume of traffic. Furthermore increased employmentopportunities became available in eonnexion with theroad-in its construction and maintenance and in theoperation of roadside garages and refreshment standset cetera. Even more important as a source of employment and population support was the fact that thisnew road made it possible for commercial establishments and factories to be located near the San Juanport, but on the outskirts of the metropolitan area.In the absence of improved transportation some ofthese establishments probably would never have beenopened. Other new roads were put in south of the cityof San Juan-into Rio Piedras, Guaynabo and Bayamon, and eastward into the northern part of Carolina.At present the entire metropolitan area is served byexcellent transportation facilities, much superior tothose available in 1940. Catano, across the harbourfrom. San Juan, ~as excellent ferry service, and nowcontams large resldential areas.
Proceeding westward from metropolitan San Juan,the census figures show that Toa Baja and Doradob?th grew substantially, by 38 and 24 per cent, respectively. Both of these n;unicipa1ities probably benefitedfrom the developments m the San Juan area. Distancesare short enough and transportation" ~acilities goodenough so that a person. n;ay .li,ve near the main highwayin either of these ~u11lclpahtles and have his employment in metropolitan San Juan; from Bayamon toDorado, for example 1S hardly more than fifteen minutesby pri.vate or public automotive transportation, the~otal ~lstance bemg hardly ten miles. That the highwaylS an lmportant. f~cto.r. influencing population growth inthese two .mu11lClpahtles lS suggested by the fact thatthose barrtos through which the main highway passesgrew the most rapidly, as follows: '
COMPARING POPULATION CHANGES WITH SOCIAL ANDECONOMIC CONDITIONS
Procedu~es for eva;luating diyerse rates of change interms of differences in the social and economic conditions in a country can be illustrated with selected census data for Puerto Rico. No attempt is being madehere to evaluate the censuses of 1940 and 1950 for the~ho1~ .island; rather examples of a few selected municlpahtles have been chosen to show how such comparisons can be made and conclusions drawn regarding theprobable completeness of the census counts.
)'he. San Juan. metropoli~an area (see map on pageym) Increased III popu1atlOn by about 62 per centin the decade 1940 to 1950, as compared with a rate ofgrowth of 18.3 per cent for the entire island. Such alarge increase in this area is consistent with the economic and other developments which occurred theresince 1940. These included: (a) about a doubling inthe ~olume of. manufacturing activity (as measured bythe mcrease. m .the number of production workers) ;(b) substantlal Illcreases m commercial and transportation activities, both directly and indirectly related tothe growth of manufacturing; (c) substantial increasesin. g~vernmental a~tivities and numbers of employees;thlS increase was m part related to the needs of the
81950 U.S. Census of Population U.S. Summary, BulletinP.C 1, p. xxviii, Washington, 1953. '
,The rate of increase in the South in the decade 1S$)to 1870, which encompassed the Civil War and theensuing reconstruction period, seems much too low incomparison with the preceding decade. The rate of increase for the period 1870 to 1880 seems abnormallyhigh in comparison with the preceding and followingdecades. The population changes in the remainder ofthe United States seem much smoother, in contrast.The differences are of such magnitude that, even withno other information, it would appear highly probable~hat the enumeration of 1870 in the South was seriouslyincomplete.. Taken toget~er with the knowledge thatcondltlOns III the South III 1870, during the aftermathof the Civil War, were not favourable to accuratecens~s work, the .figures give ~onvincing evidence ofa major error. This under-eountmg was not recognizedas an established fact, however, until after the 1890census had been taken."
TotalRemainder of United
PeriodSouth United States States
1850 to 1860........... 23.2 43.0 35.4
1860 to 1870........ ··· 10.8 29.6 23.0
1870 to 1880........... 34.1 28.0 30.0
1880 to 1890.... ······· 21.2 27.3 25.3
necessary, the areas should be re-enumerated, either on
a complete or sample basis.Let us turn now to an example of how the rates of
change can be analysed for several successive censuses.In the United States there was serious under-countingin the Southern States at the time of· the 1870 census.This deficiency became evident when the percentageincrease in population for the decade 1860 to 1870 wascompared with the changes during the preceding andfollowing decades. The percentage increases in population for the South as compared with the remainder ofthe country were as follows:
11

count in the 1950 census in Vega Alta, and more particularly in Manati? Both areas produce sugar andpineapples, and neither has much manufacturing. Inboth areas there were very significant increases in theproduction of both these crops during the decade.Presumably, then, both areas experienced increases inemployment opportunities and should have grown atabout the same rate. Why they grew at such differentrates, the present analysis does not reveal. Furtherinvestigation, including, consideration of earlier censusdata, the returns for smaller subdivisions of thesemunicipalities, and any available information regardingthe performance of enumerators in this area in both1940 and 1950 is required.
Another municipality which had a relatively high rateof population growth during the decade, was Ponce onthe southern coast. This grew by 20.6 per cent. Thisgrowth seems possible since there was considerablegrowth in manufacturing, and large increases in sugarand coffee production. Furthermore, Ponce is advantageously situated with respect to transportation, havingboth main highways and a seaport.
Guanica, to the west of Ponce, increased in populationby 23.2 per cent during this decade. No reason for suchan increase is readily apparent. This municipality islargely dependent on raising and processing sugar cane;there was but a moderate increase in the volume of suchactivity, however, and not enough to account for thegrowth in population. Further analysis of the possibilitythat either the 1940 or 1950 census counts may havebeen in error, is indicated.
Turning now to municipalities which lost population,or gained but very little, it is found that the majorityare in the interior mountainous areas where the maineconomic activities consist of raising coffee and/or tobacco. This group includes: Maricao, Lares, Adjuntas,Jayuya, Ciales, Morovis, Barranquitas, Comerio andCidra. The development of these activities has not beensufficient to support large population increases; by 1940or earlier these municipalities already had enough peopleto supply all the labour needed for these two crops. Furthermore, these municipalities are all poorly suppliedwith roads. Of this group, Adjuntas is the only onethrough which a main highway passes; however, sincethe area is mountainous the highway is a difficult oneto travel. This lack of transportation, in turn, is probably one of the factors contributing to the lack of population growth and, hence, to the lack of populationgrowth.
There is no apparent explanation for the low rate ofpopulation growth in Yabucoa, in the southeast corner(see map). This municipality's economy is based largelyon sugar and tobacco; the production of both thesecrops increased considerably during the decade. Yabucoais also advantageously situated with respect to highway transportation.
This procedure of examining each municipality in considerable detail and relating the changes in populationsize as shown by the census enumerations to social andeconomic changes can be continued indefinitely. Dataon all the various types of agricultural production, onthe opening of new factories, on the building of newroads and power stations and dams et cetera, togetherwith vital statistics, the tabulations of the census dataon population characteristics, the evidence of the census
12
schedules, and the results of earlier censuses, can allbe introduced into the final evaluation. It is apparent thatthis procedure calls for detailed knowledge of the countryand its parts as well as of the census materials andcognate statistics, if a proper evaluation of the adequacyof census returns is to be made.
It should be understood in making such comparisonsthat internal migration plays an important part in bringing about the differences in rates of population growthin the subdivisions of an area such as Puerto Rico. Theexpansion of economic opportunity in the form of manufacturing, cane-sugar production, coffee raising, dairyfarming, trade et cetera, was uneven in different partsof the island. As job openings appeared in a specificarea,workers and their families migrated into the area, andthe inter-censal rate of population growth increased.Differences in natural increase, the excess of births overdeaths, may also be an important factor, in some circumstances, producing regional variations in the rates ofgrowth within a country, but natural increase is unlikelyto respond so greatly and so quickly to changes in economic opportunity as to produce such large differencesin inter-censal rates of change as are observed in PuertoRico.
D. Consistency of census totals with vital statisticsand migration statistics
THE BALANCING EQUATION
The balancing equation} which is to be considered inthis section, is a procedure which, if properly used, permits a more precise quantitative evaluation of the accuracy of a census count than can usually be made bysuch methods as described in the preceding sections. Thisprocedure, employing vital and migration statistics,brings much more evidence to bear and provides a muchmore definitive and quantitative answer on just howaccurate and complete a given census enumeration probably is. In this section only the completeness of the headcount is considered; in subsequent chapters the accuracyof data on age and sex composition and of the vital andmigration statistics will also be included. However, inpractice a final determination of the completeness andaccuracy of a census count, using the balancing equation,cannot be made until all of the components-populationby age and sex, births, deaths and migration-have beentested.
DEFINITION AND LIMITATIONS
The principle of the balancing equation is essentiallyvery simple. In any interval of time, such as betweentwo censuses, the population of a country can increaseor decrease only as a result of births and deaths andmovements across the country's boundaries. Births andimmigration add to the population, and deaths andemigration subtract from it. Accordingly, if data areavailable from two censuses, and the numbers of births,deaths and in- and out-migrants are known, then theequation must balance exactly, if all the data are perfectly accurate. The equation is very simple:the population at the second census (PI) equals:
the population at the first census (Po)plus the number of births during the inter-censal
period (B)

I_---t'-..------
plus the number of immigrants in the inter-censalperiod (I)
minus the number of deaths during the inter-censalperiod (D)
minus the number of emigrants during the intercensal period (E)
P1 = Po + B + I - D - E
Completely accurate census, vital and migration statistics have never been attained in any country, and neverwill be. Accordingly, this equation never balances outexactly; some unaccounted-for residual always remains.If the residual is large, at least one of the componentscontains a sizeable error, and further investigation hasto be conducted in an effort to determine where theerror lies. Sometimes the major part of the error maybe found in one set of data; generally it is found thatthere are errors of varying size in all of the componentsof the equation. By testing each of the components separately by means of the balancing equation, the approximate size of the error in each of the components can bedetermined.
Even if the residual is small, however, there is nodefinite proof, until all of the components have beenseparately evaluated, that the censuses, vital and migration statistics are correct. This is because of compensating errors. For example, under-registration of birthsmay be compensated for by under-registration of deaths;incompleteness of enumeration at one census may becompensated for by incompleteness a.t the other; incompleteness of census enumeration may be compensated forby under-registration of births or deaths, or by incomplete recording of migrants.
One further caution is required. Compensating errorsmay sometimes be of such a nature that, even afterstudying the various components as thoroughly as possible by means of the balancing equation and finding thatthe data are all in good agreement, it may still not bejustified to conclude that they are all reasonably correctin absolute terms. For example, the application of various tests may make it appear that the birth statisticsar~ consistent with the census enumeration of youngchildren and therefore probably correct, that the migration statistics tally with the census returns on theforeign-born population and thus seem to be correct, andthat the entire equation balances with but a very smallresidual, implying that the death statistics and the censusenumerations were also correct. Yet, the censuses, vitalstatistics and migration data may all fail to cover somepart of the population-for example, persons with nosettled abode, or primitive tribes, possibly not undereffective administration, or the population living in afrontier region which is difficult of access, or an outcastor criminal segment which defies census enumerationand reports none of its activities to the authorities.Generally, however, such groups constitute but a smallproportion of any country's population.
TREATMENT OF MIGRATION
The element of migration in the balancing equationoften presents a difficulty because many countries donot have comprehensive and reliable statistics on theflow of migrants across their borders, and migratorymovements within the country are even less likely to be
adequately recorded. However, even ~hough such. statistics .are lacking or seriously defect~ve, the availablesources of information will be sufficient as a rule toshow whether or not migration has taken place on alarge enough scale to have a significant eff~ct. I~ not,the balancing equation may usefully be applied wlthoutregard to migration.
It is primarily in the case of statistics for ,~ubdivi~io.nsof countries that the lack of adequate migration statisticsinterferes with the use of balancing equations. In mostcountries, the volume of internal movements is so large,at least for the majority of their subdivisions, that inthe absence of a proper measure of it the balancing equation is inapplicable.
EXAMPLES OF THE USE OF THE BALANCING EQUATION
The procedures and examples used in this chapterare dictated both by the purpose and by the nature ofthe available data. The purpose is to evaluate the totalcount of two successive censuses by means of the balancing equation; evaluation of the vital and migrationdata and evaluation by age and sex are reserved forsubsequent chapters. Because the results of the balancingequation in the form used here cannot be interpreteduntil the remaining statistics are also evaluated separately, no definite conclusions can be drawn in theseexamples regarding the accuracy of any particular components. Some tentative inferences can be made, however, in certain cases.
Since migration statistics for all countries are notavailable, examples of the use of the balancing equationare presented for some countries having such data, andfor some not having them. For all of the examplesshown, the equations were computed without migrationstatistics; and for those countries having such data, additional computations were made which included themigration balance.
The specific procedures employed are as follows:( 1) By subtraction of successive census totals the
apparent inter-censal increase is determined. '
(2) The apparent natural increase--or excess ofbirths ?ver deaths-f,?r the inter-censal period is thendet~r11?med on the baSIS of the reported birth and deathstatistics, (Where necessary, adjustments' for a fractionof a year are made.)
(3) Subtraction of the apparent natural increasefrom the apparent inter-censal increase provides a measure of the discrepancy.
For countries with migration statistics, the followingadditional steps are involved:
(4) The migratory balance is computed for the intercensal period by subtracting recorded departures fromrecorded arrivals.
(5) ~his migratory balance is added to the apparentnat!Jral mcrease to determine that population increasewhich can be accounted for by means of available vitaland migration statistics.
(~) T~e residual is obtained by subtracting the figureobtained m step 5, from the apparent inter-censal increase obtained in step 1.
The above steps are illustrated in detail for the following areas:
13
rI
1
2,211,000
1,869,000342,000
17,443,00:>14,464,0002,979,0002,569,000
100,0002,669,000
1. Puerto RicoStep (1) Population according to census of 1 April,
1950 .Population according to census of 1 April,
1940 .Apparent inter-censal increase .
Step (2) Number of births reported in inter-censalperiod . . . . . . . . . . . . . . . . . . . . . . . 830,000
Number of deaths reported in inter-censalperiod ... ,........................... 289,000
Apparent natural increase.............. 541,000Step (3) Apparent inter-censal increase.......... 342,000
Apparent natural increase.............. 541,000Discrepancy -199,000
Step (4) Number of recorded arrivals in inter-censal period........................ 627,000
Number of recorded departures in inter-censal period........................ 808,000
Migratory balance -181,000Step (5) Apparent natural increase.............. 541,000
Migratory balance -181,000Population increase accounted for...... 360,000
Step (6) Apparent inter-censal increase.......... 342,000Population increase accounted for...... 360,000Residual - 18,000
The residual of 18,000, or the amount by which theequation fails to balance, is relatively small in this case,and amounts to only 0.8 per cent of the 1950 populationas recorded in the census enumeration. It should be notedthat some of this residual is explained by the fact thatdeaths to members of the armed forces are excluded fromthe reported death statistics. Hence, the amount of natural increase as recorded in step 2 should be somewhatsmaller than the figure shown. This, in turn, would decrease the size of the "Population increase accountedfor" in step 5, and lead to a smaller residual in step 6.
The residual, expressed as a percentage of the recorded inter-censal increase, amounts to 5.3 per cent.As will be seen from the other examples to be presented,the equation for Puerto Rico balances out fairly wellbetter than in some countries but not as well as in someothers. Without further analysis of the components ofthe balancing equation, and without applying the balancing equation to specific age-sex cohorts, it can beconcluded that the balancing equation gives no evidenceof major errors.
2. ThailandCensuses were conducted in 1937 and 1947. Vital
statistics are available for these years, together with anestimate of the net immigration: The balancing equationfor the period 1937 to 1947 then is:Census count, 1947 ········Census count, 1937 ··········Apparent inter-censal increase ·····Recorded natural increase in inter-censal period ....Migratory balance ···· .. ······Population increase accounted for .Residual (excess of census increase) :
Number .;.................................... 310,000Per cent of inter-censal increase................ 10.4Per cent of 1947 population.................... 1.8
The relatively small residual suggests that the compo-nents of the equation are not subject to very large errors;in anticipation of material to be presented in the chapteron vital statistics, however, it should be pointed out thatthere were actually rather large compensating errors inthe reports of births and deaths. Furthermore, the dataon migratory balance are meagre and' unsatisfying; the
figure of 100,000 presented above for net in-movementis an estimate pieced together from incomplete records.
3. Dominican RepublicCensuses were conducted in 1920, 1935 and 1950. A
complete series of vital statistics covering these 30 yearswas not found; birth records were missing for the years1920 to 1924, 1929, and 1931 to 1934, while death records were missing for the years 1920 to 1923 and 1929to 1934. Data for these missing years were estimated.No statistics on migration were found. The balancingequation for the period 1920 to 1935 is:Census count, 1935................................ 1,479,417Census count, 1920................................ 894,665Apparent inter-censal increase..................... 584,752Recorded natural increase in inter-censal period.... 426,384Discrepancy:
Number 158,368Per cent of inter-censal increase................ 27.1Per cent of 1935 census count.. . . .. . . .. . . . . . . .. .. 10.7
The balancing equation for the period 1935 to 1950 is:Census count, 1950................................ 2,135,872Census count, 1935................................ 1,479,417Apparent inter-censal increase..................... 656,455Recorded natural increase in inter-censal period.... 706,442Discrepancy:
Number ;............................. 49,987Per cent of inter-censal increase - 7.6Per cent of 1950 census count - 2.3
Any migratory balance during either of these two pe-riods was probably small in comparison with the discrepancies. In order to determine whether the discrepanciesare due chiefly to errors in the census.enumerations orthe vital statistics, it is necessary to test the accuracy ofthe latter.4. Fiji Islands
Censuses were taken in 1936 and 1946, and vitalstatistics were reported for the entire decade. Data onmigration, however, were found only for the years1936 to 1938 and 1945. The balancing equation forthis decade is:Census count, 1946 · 259,638Census count, 1936................................. 198,379Apparent inter-censal increase ... '. . . . . . . . . . . . . . . . . . . . 61,259Recorded natural increase in inter-censal period...... 58,578Migratory balance " . . . . . . . . . . . . . . . . . 2,001Population increase accounted for. . . . . . . . . . . . . . . . . . . . 60,585Residual (excess of census increase)
Number 674Per cent of inter-censal increase.................. 1.2Per cent of 1946 census count.................... 0.3
Since complete data on the migratory balance werenot found, it is difficult to determine the probable degreeof accuracy of the statistics. The residual is so small,however, that it does not seem likely that the censusescontained any very large errors. Even with an errorof several thousand in the migratory balance, the equation would still balance out fairly well. To be sure, compensating errors may be present.
5. MexicoAl though a number of censuses have been taken in
Mexiico, the equation will be applied only to the period1940 to 1950. The result is as follows:Census count, 1950 (preliminary figure).......... 25,781,000Census count, 1940 ·.·· 19,654,000Apparent inter-censal increase.................... 6,127,000Recor ded natural increase in inter-censal period.. . . 5,770,323
14

I-.......!...····~~..<· --------
E. Direct checks on the accuracy of census totals
Direct checks consist primarily in re-enumeration ofat least a part of the population, in such a way as toprovide a measure of the numbers of persons who wereomitted from or erroneously included in the censuscount. The list of persons recorded in the re-enumerationis compared with the record of the census, and anydiscrepancies are investigated in order to determinewhether or not the persons concerned should have beenincluded in the census. Some of the ways in which sucha check can be made are described below. The examplespresented here refer to entire countries, but the same
SELECTION OF AREAS TO BE RE-SURVEYED
There is no need to re-enumerate the entire population of the country in order to check the census count.Depending on the precise objective of the check there-enume~ation can be carried out for a selected sa'mpleof the entire country, for one or several special areas ofthe country, or for samples of such special areas. Anycombination of these procedures can also be made.
Re-enumeration of a sample of the entire country isdesirable if the chief objective is to establish somemeasure of the .over-all accuracy of the census count.Scientific sampling techniques make it possible to selecta relatively small sample in such a manner that themost representative results are obtained at smallest cost.A sample of the entire country is also sufficient if thereis no special reason to suspect that the census enumeration may have been particularly inaccurate in somespecial part of the country, or among some specialsegment of its population.
The various tests described in sections A and B ofthis chapter are relevant to determining whether or notthe census results for particular areas should be questioned. By thes~ or other tests, areas may be selectedfor ~e-enumeratlOn. Because of the desirability of conductmg checks as soon after the census as possible itis important that census results should be analysed f;omthis point of view within the shortest possible time.
It should be noted that direct checks conducted inselected areas only, whether on a sample basis or bycomplete re-enumeration, do not provide an accuratemeasure of the accuracy of the census for the entirecountry. In the "suspected" areas, the relative magnitude of errors in the census is likely to be greater than
TIMING OF A DIRECT CHECK
Because of the necessity of name-by-name checking,direct checks are carried out most efficiently directlyafter a census enumeration. The mechanics of checkingthe names obtained by the re-questioning with thenames on the census schedule become quite complicatedand laborious, particularly if people migrate. Ideally,immediately after a small area has been enumeratedas for example one block in a city, or one small villagethe procedures for a direct check should be inauguratedin that area; thus the problem of searching the censusrecords for the persons found in the check enumerationis greatly facilitated. The longer the time allowed tolapse before the check is instituted, the more the problems of identifying persons and deciding who shouldhave been counted is complicated by births and deaths,by changes in address, by changes of name on the partof women marrying et cetera.
procedures are evidently applicable to particular subdivisions of a country, and it may be efficient, in someinstances, to limit their use to those subdivisions inwhich errors are suspected on the basis of other tests.
An important consideration, and one reason why suchchecks have not often been made, is the question ofcost. The cost of a properly planned check, however,can be very modest in comparison with the cost of thecensus itself, and it can greatly enhance the vabt "f thecensus results, either by confirming their accuracy orby providing the basis for a correction.
18,967,00015,921,000
3,046,0002,543,000
357,0005.81.4
_ 122,0005,648,000
6. EgyptAlthough several censuses have been taken in this
country, the balancing equation will be applied only tothe period 1937 to 1947. For this period vital statisticsare available, but no migration data were found. Thebalancing equation is:Census count, 1947 ·······················Census count, 1937 ·······················Apparent inter-censal increase ··············Recorded natural increase in inter_censal period ....
Discrepancy:Number 503,000Per cent of inter-censal increase ········· 16.5Per cent of 1947 population · ·.. 2.7
In the absence of migration data, the balancing equa-tion is incomplete. However, unless there were a netin-migration of some 500,000 persons, the equationwould not balance. For fuller investigation of the datafor this country, it would be necessary to obtain someestimates of the probable volume and direction of migration, and to analyse the vital statistics component ofthe balancing equation separately. Furthermore, thebalancing equation should be applied separately to thevarious age-sex groups as explained in chapter Ill. Itwould then be possible to reach a conclusion as to probable accuracy of the census counts.
Discrepancy:Number .Per cent of inter-censal increase ···········Per cent of 1950 population ········ ......
Recorded migratory balance ·················population increase accounted for ..... ···········
Residual:Nt;mber 479,000Per cent of inter-censa1 increase ·········· 7.8Per cent of 1950 population..................... 1.9
The discrepancy (if migration statistics are not takeninto account) is not very large in proportion to thepopulation. If the recorded migratory balance is includedin the computations, a somewhat larger residual is obtained. Whether or not the migration statistics are accurate, it is very probable that during this period morepersons left the country than entered it. The analysisshown here does not yield any clues as to whether theresidual should be mainly attributed to defects in thevital statistics or to differences in the completeness ofthe two census enumerations. However, further tests ofthe Mexican statistics (to be' presented in a later chapter) suggest that the statistics of births and deaths arefairly accurate, so that probably no very large residualwould have resulted from inaccuracies in the vital sta-
tistics.
15

1,309,000 persons
198,000 persons
in areas not so suspected. A combination of intensivechecks in suspected areas with checks of small samplesfor the remainder of the country is perhaps the mosteffective method of checking over-all accuracy.
COMPARING CENSUS RECORDS WITH LISTS OF NAMES
A method of direct checking which does not requirere-enumeration and which can be undertaken even aftera considerable lapse of time is the matching of censusrecords with other lists of persons who were living inthe area at the time of the census, or with 'Samples fromsuch lists. The kinds of lists that may be used for thispurpose include the names .of pupils enrolled in school,lists of taxpayers, registers of voters et cetera. Thecomparison may be made at any time after the census,even if it is already too late to proceed to a samplere-enumeration. It is important, however, to make everyeffort to ascertain that the persons on such lists actuallylived in the specified area at the time of the census.
This method of checking, though it may be lessexpensive, is normally less satisfactory than reenumeration, for a variety of reasons. It is not alwayspossible to be certain that the persons named on. thelists were actually living in the specified area at thetime. Such lists usually refer only to portions of thepopulation living in the area; for example, persons whowere not on the taxpayers' list are not represented. Theextent of coverage of the list may not always be known;for example, the list of schoolchildren may include onlya part of all the children enrolled in school. A list ofnames generally does not provide any information aboutthe families of these individuals, nor very much information. about their personal characteristics. A reenumeration, on the other hand, attempts to locate allpersons (or a correct sample of all persons) who were10 the area at the time of the census enumeration' inaddition to verification of the head count, it also provides an opportunity to determine whether their personal characteristics (age, occupation et cetera) havebeen correctly reported.
For these reasons, it is generally preferable to checkthe accuracy of a census by sample re-enumerationrather than by reference to existing lists of persons,unless too much time has elapsed to make such reenumeration still useful for the purpose of checking.
EXAMPLE OF PARTIiAL RE-ENUMERATION IN COSTA RICA
At the time of the 1950 Costa Rican census, effortswere made to resurvey those parts of the country wherethe enumeration was deemed suspect, for one reasonor another. Included in this group were those areaswhich lacked good maps, and those for which there wereany doubts as to the quality of the returns. For censuspurposes Costa Rica was divided into 316 districts' apost-enumeration check was made in 135 of these. Thischeck was not carried out uniformly throughout thecountry; the Province of Guanacaste was resurveyed inits entirety whereas in the Province of Cartago only9 of the 39 districts were revisited, and in Lim6n, only2 of the 10 districts.
There were 6,878 persons located in the postenumeration check who had not been recorded at thecensus. These comprised 0.86 per cent of the total population of the country. It was calculated that if the entire
country had been resurveyed the number of omissionswhich would have been uncovered would have amountedto but 2.01 per cent of the total population. This numberwas so small that no efforts were made to revise thecensus count to include an estimate of omitted personsin the country as a whole. Instead the final census countincludes only the 793,997 persons originally enumeratedplus the 6,878 omissions actually discovered in thepost-enumeration check, for a total of 800,875. For allof these people the required data on personal and familycharacteristics were available so that they could be included in the detailed tabulations; it was not necessaryto adjust the tabulations so as to include estimates ofother persons presumably omitted, classified by theircharacteristics.P
EXAMPLE OF THE POST-ENUMERATION SURVEYIN THE UNITED STATES
Following the 1950census, the United States CensusBureau undertook a re-enumeration on a sample basis.This sample was designed to provide an estimate ofthe number of households completely missed, and thenumber of individuals within enumerated householdswho had been missed or enumerated erroneously. Asample of 3,500 small areas representing the entireUnited States was carefully chosen, and re-enumeratedmeticulously by interviewers who were especially selected and given more intensive training than had beenreceived by the average census enumerator. In theseareas the enumerators obtained the addresses of allhouseholds that could be located and the names andcharacteristics of their members. These data werechecked against the original census 'Schedules for those3,500 areas. The post-enumeration check covered atotal of 22,000 households.
The check indicated a net under-enumeration of about1.4 per cent in the original 1950census count. This wasthe net result of erroneous omissions and erroneous in
. elusions, as follows:erroneously omitted, 3,400,000 persons, or 2.3 per cent of the
census counterroneously included, 1,309,000 persons, or 0.9 per cent of the
census countnet error. . . . . . . . . .. 2,091,000 persons, or 1.4 per cent of the
census count
The great majority of those missed were the membersof households that were entirely omitted:
erroneously omitted...................• 3,400,000 persons~n missed households 2,416,000 personsIn enumerated householc.ts............. 984,000 persons
. 9f the persons erroneously included, the great majority should have been enumerated in another enumeration district:
erroneously included .should not have been enumerated
anywhere .should have been enumerated in another
enumeration district............•... 1,111,000 persons
Even this elaborate post-enumeration check howeverprobably failed to obtain a complete estim~te of th~number and proportion of persons missed, since the
8 Costa Rica, Direcci6n General de Estadistica y CensosCenso de Poblaci6n de Costa Rica, San Jose, 1953, pp. 2, 3. '
16

_ .......·I~_···.·.....•.· _--------F
check itself contains some errors. A small-scale fieldcheck was carried out following the post-enumerationcheck, and indicated that the original post-enumerationcheck contained errors which were, in general, in thedirection of underest.imating the number of erroneouslyomitted persons. Some of the errors found in the original post-enumerating check were of the type commonlyfound in any census enumeration. For example, in somecases, it was not possible to locate a person thought tobe living in a given household; in other cases, althoughthe person was located, no interview could be obtained.Infants, who are always under-enumerated in the census, were also under-enumerated in the original postenumeration check, as other data indicated. Althoughthe magnitude of the errors in the check is largely unknown, those errors which could be identified were allin the direction of under-estimating the number of persons erroneously omitted. Altogether, these variouschecks indicate that the estimated net deficiency of 1.4per cent in the original census enumeration is theminimum.10
In short, the United States experience indicates that,as repeated checks are employed, the size of the errorsin the enumeration is progressively reduced, but thatperfection is never attained. Some people are alwaysmissed no matter how carefully a census enumerationis conducted. Since any post-enumeration check surveyis somewhat expensive, it is evident that a point iseventually reached at which additional cost of an additional improvement in accuracy exceeds the value ofthe improvement.
SAMPLE VERIFICATION OF THE CENSUS COUNT IN INDIA
After the Indian census of 1 March 1951, the Government of India "requested all State Governments tocarry out a sample verification of the 1951 Census Countaccording to a scheme framed by the Registrar Gen-
10 United States, Bureau of the Census, 1950 Census of Population, United States Summary, Bulletin P-C 1, pp. xxix, ff.,Washington, 1953.
eral."l1 The re-enumeration of samples of the populationwas carried out by most Indian States, in the majorityof cases during the latter part of the year 1951. Ingeneral, the scheme provided for re-enumeration ofone-tenth of one per cent of occupied houses in everycensus tract, by verification officers specially appointedfrom among qualified civil officials. The purpose of theoperation was to discover, by visits to carefully selectedhouseholds, any cases of "clear omissions", "fictitiousentry", or "erroneous count of visitors and absentees",as well as any evidence of omission of entire householdsin the vicinity of households selected. The selection ofhouseholds was to be made from census lists and had toconform rigidly to specified procedures.
The details of re-enumeration procedures were notuniform in every State. Enumerators were given specialtraining and their attention was directed particularly tothe kinds of census errors which they might be expectedto encounter. In at least one State (Mysore), the verification officers were also informed that the lists givento them, which had been copied from census returns,contained some "ghost" entries, that is to say, entriesof fictitious persons purposely added to the list andmade to look entirely plausible. These "ghosts" wereadded to the lists in order to increase the vigilance ofthe verification officers, and most "ghosts" were indeedrecognized as such when the field visits were completed.
The area in which the verification was carried outcontained 81 per cent of India's population. Within thisarea, clear evidence was found of omissions amountingto 1.3 per cent of the population, and of faulty inclusion?f per~o.ns amounting' to .0.4 per cent of ~h~ population,m addition to vanous mmor errors consisting of omission or double counting of temporary visitors and absentees. As a net result of all these errors, the censuscount appeared to have fallen short of the truth by 1.1per cent ~or all of India (1.0 per cent in rural, and 1.4per cent m urban areas). The percentage varied amongthe several regions.
11 India, Registrar General, Sample Verification of the 1951Census Count (Census of India, Paper No. 1 1953) NewDelhi, 1953, p. 3. ' ,
17
CHAPTER II. THE COMPLETENESS OF VITAL STATISTICS
A. Inrrcduction
The term "vital statistics" is often used to includebirths, deaths, marriages and divorces. For the purposesof population estimates, it is mainly the data on birthsand deaths that are important. Accordingly, in thischapter methods for appraising births and deaths onlywill be considered. Some of the methods to be describedhere are adaptable, however, to tests of the completeness of marriage and divorce reporting.
EFFECTS OF ERRORS IN VITAL STATISTICS ON POPULATIONESTIMATES
There is an important difference between errors invital statistics and errors in census enumerations, asregards their effect on population estimates. The difference can be illustrated by referring to those annualestimates of population for the years following a censuswhich are made by adding to the census total the recorded annual excesses of births over deaths. If thecensus figure is in error-due to under-enumeration,for example-the annual estimates will reflect the sameerror, but the error will be a constant. The whole seriesof estimates will be comparable with the census andthe picture of population growth since the date of thecensus will not be invalidated. Errors in the vital statistics, on the other hand, may have a cumulative effect.For example, if there is an under-registration of birthsevery year, so that the recorded annual natural increaseis too small, the consequent error in the population estimates will grow larger in each successive year. By theend of a ten-year period, both the estimated size of thepopulation and the estimated amount of its growth sincethe census date may be considerably below the truth,even though the amount of error in the birth statisticsfor anyone year is not very great.'
It is also important to note that the methods of collecting vital statistics are essentially different from thoseinvolved in collecting population data by means of acensus. A census is taken at infrequent intervals, generally once in ten years. The data are usually collectedby a staff of enumerators especially selected for thepurpose, who visit the households and obtain the information by direct interview. Vital statistics, on theother hand, are usually recorded continuously by officials who carry this responsibility over a period ofyears; these officials are not ordinarily expected to visitthe people in their areas and make direct inquiries, butonly to receive and record the reports of vital eventswhich, by law, are to be brought to their attention.The fact that vital statistics are collected continuouslyis an advantage in appraising them, since certain testscan be applied which are not possible for a one-timeoperation such as the census. On the other hand, per-
l United Nations, Manuals on methods of estimating population. M'-'..ial I: Methods of Estimating Total Population forCurrent irates, Population Studies No. 10, pp. 38, 39.
18
haps the main problem in obtaining complete reportingof vital events is the fact that some one other than theregistrar must make a positive effort to report theevent.
COVERAGE
In many countries, registration of births and deathsis not compulsory, or is compulsory for only a part ofthe population (for example, for "Europeans" in certain African territories), or for certain areas withinthe country. Obviously, in such cases registration is notcomplete for the entire country even though it may benearly so for those parts of the country or the population to which it applies. If the areas or segments notcovered by registration are relatively small, then it ispossible to estimate how many births and deaths wouldhave been reported if registration were applied to theentire country. Such estimates are sometimes needed ifa balancing equation is made. It is then necessary todistinguish between the terms "completeness" and "coverage" ; the former means the extent to which all birthsand deaths are reported where the registration systemapplies, whereas the latter term means the extent towhich the registration system applies to the entirepopulation.
In some areas there is a system of "voluntary" registration. Such a system results in the registration ofonly a fraction of all births and deaths. There is noknown instance of voluntary registration of vital eventsthat has even remotely approached completeness.
TIME AND PLACE OF OCCURRENCE
When vital statistics are used for making populationestimates, or for the construction of a balancing equation to test the accuracy of demographic data, it isimportant that they should reflect accurately the numbers of births and deaths occurring in a given timeinterval. Many countries tabulate and publish theirvital statistics according to the time of registrationrather than according to the time in which the eventoccurred. Where there is a very short time lag betweentime of occurrence and time of registration the effecton annual totals is negligible; but in some countries alag of two years is not uncommon.s Where the numberof events is changing significantly from year to yearor where an appreciable time elapsed between occurrence and registration, the results may be misleadingas to the number of vital events which actually occurredduring the specified year. This consideration is particularly important in relation to statistics of births;deaths are ordinarily more promptly reported. Therefore, as a first step in the proper appraisal of vital statistics where tabulations are by date of registration
2 See for example, Ricardo, Jimenez J., Comparative Studyof the 1950 Population Census Results and the 1950 PopulationEstimate of Costa Rica, San Jose, Costa Rica, December 1951.

_ .......!_i'i_......._--------
FACTORS AFFECTING THE COMPLETENESS OF BIRTHREGISTRATION
As already pointed out, responsibility for the reporting of vital events rests with the public, usually with
the relatives of new-born infants or deceased persons.Hence more than in a census enumeration, co-operation of the public is decisive in ac~ievin~ .a completerecord of births and deaths. The lmposltion of feesfor the registration of births may tend to discourageregistration. This maybe pa~ticularly important amongpoor people, if the regls~rat10~ fee ~ounts to a s~gnificant proportion of their dally earnmgs. In cou~tnesimposing such fees temporary removal of the reglstration fee in order to encourage registration may resultin a sharp increase in the number of recorded birthsduring the period in which no fees are charged.
Social customs sometimes may lead to non-registration. In areas where a stigma is attached to illegitimatebirths, there may be a deliberate attempt on the partof the mothers to avoid reporting them, or to reportthem as legitimate. ~f the births are reported as legitimate, of course, population estimates and the balancingequation are not affected, but any analyses of maritalfertility will be somewhat in error. In some countriesalso, children of one sex may not be considered quiteas important as those of the other sex, in which casethere may be a tendency to report less completelybirths of the less favoured sex, The fear that boys willbe conscripted for military service may sometimeslead to the non-registration or late registration of
their births.A rural population thinly dispersed over a wide area
may find it physically difficult to reach the registrar'soffice in order to report a birth. The consequenttendency to neglect registration may be aggravated ifthe means of transportation are deficient, if illiteracyis prevalent, if the people see no positive inducementto register the births, and if the births most frequentlyoccur at home without a physician in attendance.
The population living in an urban area or withineasy access to the registrar's office is more likely toregister births. Indeed, registration is probably mostcomplete among urban, literate populations in whichmost of the births occur in a hospital and practicallynone occur without a physician in attendance. It ismuch easier to ensure that a few hospitals or physicianswill report all births than it is to ensure that everyindividual family will report on its own initiative.
Any system of family allowances based on the number of children should increase the completeness ofregistration since the payment of the allowance withrespect to any child can be conditioned upon the registration of the birth. Any requirement that a persongive documentary proof of his age, his parentage, orthat he was born in the country or is a citizen of thecountry for inheritance or other legal purposes will alsoact to improve the completeness of registration.
The rationing of consumers' goods is another factortending towards complete registration. Indeed, it mayeven lead to over-registration. This may be particularly true in those situations where an infant is entitled to as much of the rationed item as an olderperson, or where the rationed item is particularlyneeded by children. For example, sugar may be rationed at so many ,:ni~s per person irrespective of age,or milk ma~ be limited exclusively to children; insuch a case l! may be. advantageous to the family tohave extra births reglstered. If the rationed item isfor the consumption of adults only, as tobacco or
CHARACTERISTICS RECORDED ON THE CERTIFICATES
Almost universally when births are registered thesex of the infant and the age of the mother are recorded,and when deaths are registered the sex and age of thedeceas.ed are noted. Information on-various other personal characteristics is often also contained in birth anddeath records. For the purposes of population estimatesand tests of the accuracy of vital statistics and censuscounts, reliable data on sex and age are of particularimportance.
Sex is probably very rarely mis-stated, either at thecensus or in vital registers. Mis..,statement of sex isperhaps most frequent in the case of birth records, buteven in this case is probably rare. If the ratio of reportednumbers of male and female births is unusual; the reason is probably not so much mis-statement of sex as aless complete reporting for one sex than for the other.
The ages of parents of a new-born child, or the ageat death of a deceased person, may be frequently misstated. Considerations relating to the accuracy of agestatements are presented in chapter Ill. If age misstatements are similar in the vital records and censusenumerations, then the censuses and vital statistics arestill comparable. It is sometimes believed that ages aremore accurately reported in the registration of vitalevents than in censuses. If the frequency and nature ofage mis-statements in vital records differ greatly fromthose at the census, then the two sets of statistics areto that extent inconsistent and caution is necessary ifthey are used jointly.
It is thought that other characteristics, such as occupation, for example, may be returned more correctlyon the census schedule than on the vital certificate.
instead of date of occurrence, the factor of delayedregistration should be examined.
Vital statistics are often tabulated according to theareas in which the events occurred rather than theareas in which the persons concerned were residents.Very often hospitals serve persons living in a wideradius outside the city in which the hospital is located.Many births and dea~hs occu: it?' such hospitale., toresidents of areas outslde the city m which the hospitalis located. On the other hand, when vital statistics areused as materials for population estimates, which areusually on a de jure basis, that is they refer to thepopulation resident in a given area, it is desirable thatthey should reflect the births and deaths to residentsof the areas for which estimates are made. For this purpose, tabulations are required, in which the births anddeaths of non-residents are re-allocated to the areaswhere they reside. The difference between tabulationsby place of occurrence and place of residence is especially important where calculations are being madeseparately for urban and rural areas. In the statisticsfor an entire country, of course, place of occurrence andplace of usual residence will almost always coincide,but the same may not be true of data for component
regions.
19

coffee for example, there may be no incentive to overregister births.
Over-registration may also occur, in some cases, forother reasons; for example, duplicate reporting by theparents through ignorance of the fact that the birthhas already been registered without their participationor re-registration when an 'Original certificate of registration is lost. Normal precautions such as birth registration indexes will minimize such duplicate registration, but in some cases the precaution may not beadequate.
FACTORS AFFECTING DEATH REGISTRATION
Some of the same factors which operate to reducethe completeness of birth registration may also tendtowards incomplete death registration. III particular,among a rural population thinly dispersed over a wide<.•rea, in which there are few doctors available so thatmany of the deaths occur without a physician in attendance, registration is likely to be incomplete. Undersuch circumstances it is comparatively easy to burythe body privately; if the burial has been accompaniedby whatever religious and social ceremonies are <teemedimportant by the people concerned, they may feel noneed to register the death.
The requirement that a death must be registered inorder to obtain a burial permit is a very importantaid to complete death registration, particularly in areaswhere most bodies are attended to by a relativelysmall number of undertakers, and where most burialstake place in but a very few cemeteries. Death registration may be more complete in urban than in ruralareas if for no other reason than that it is likely tobe easier to control burials in urban areas.
In areas where most deaths are attended by a physician, complete registration is likely to be more easilyachieved than elsewhere. From this point of view also,the situation in urban areas is likely to be more conducive to good registration than that in rural areas.At least the causes of death will certainly be reportedmore accurately if a physician is in attendance.
Certain legal factors may be conducive to completeregistration. For instance, inheritance or other legalclaims involving succession or the right of a widowto re-marry may require proof of a death which canbe supplied by a death certificate. The State is alsointerested in deaths in which a crime may be involved.Thus there is some inducement to register deaths inorder to avoid entanglements with the law which mightresult from non-registration.
The rationing of consumers' goods, on the otherhand, may have a tendency to encourage non-registration or delayed registration of deaths. If the familyof the deceased can continue to collect his rations byfailing to report the death, there is obviously someincentive to avoid reporting.
RELATIVE COMPLETENESS OF BIRTH AND DEATHREGISTRATION
For the purposes of population analysis and particularly population estimates, it is highly desirable toknow whether the births or the deaths in a givencountry are more completely reported. If births are
reported more fully than deaths, the computed naturalincrease will be too high, and if the reverse occurs itwill be too low. On the other hand, if both are registered with about the same degree of completeness, therecorded natural increase may not be greatly in erroreven though there is some omission of both birthsand deaths."
In spite of the importance of this question, thestatistical reports of few countries give any indicationas to which of the two events are believed to be reported more fully. An indication to the effect thatboth births and deaths are reported "fairly completely",or that the registration of both events is "markedlydeficient", does not suffice to resolve this question.
B. Internal consistency of vital statistics
Some clues as to the possible degree of completenessof reporting of births and deaths are afforded by examination of the data themselves. The use of the procedures to be described in this section will not, bythemselves, establish the quality of the registration;they may serve, however, to reveal possibilities oferror which deserve further investigation. Proceduresfor measuring the completeness of registration moreexactly will be presented further on in this chapter.
NUMBERS OF REPORTED BIRTHS, DEATHS AND INFANTDEATHS
In some areas, birth rates or death rates cannot becomputed because sufficiently reliable population estimates are not available. Sometimes this is the casefor an entire country; more frequently, it applies to acountry's geographical or civil divisions. Valid comparison can then he made only of the various absolutenumbers of vi~al. events. Even where pop~lation estimates are realistic enough for a computation of validbirth or death rates, a comparison of the mere numbers?f reported .birt.hs and deaths is a very useful first stepIn an examination of the accuracy of the statistics.
In countries where birth registration is known to beaccurate, male births invariably outnumber female birthsby. a sligh~ margin. For biological reasons, the sexr~tI.o of births can vary only within rather narrowlimits. Usually, there are very nearly 105 male birthsfor every 100 female births, though some variation inthis ratio is possible. A ratio lower than 102, or higherthan 107, while not impossible, must be regarded asrather unusual. Any significant deviation from theselimits should be regarded with suspicion. In unusualcircwnstances, a slight deviation from this pattern mightoccur, but if the deviation is at all large it is practicallycertain that the births of one sex are less completelyreported than those of the opposite sex and, very probably, births of both sexes are incompletely reported. If,on the other hand, the ratio of male to female birthshappens to be very near 105 per 100, birth reportingmay still be deficient for both sexes.
Ordinarily, when a population consists of more orless equal numbers of men and women, the deaths ofmales slightly outnumber those of females. The exactratio of male to female deaths depends on a variety of
3 See: United Nations, Population Division, Manual I:Method's of Estimating Total Population for Current Dates,Population Studies, No. 10, chapter VI. .
20

I_---I-<,~...•·•...•• --------
4 The reason for more numerous female deaths in old ageis not a higher female mortality at such ages, but the survivalof larger numbers of women than men up to these ages.
5 The "vital rates" considered here are crude birth rates (livebirths per 1,000 inhabitants per year), crude death rates (deathsper 1,000 inhabitants per year), and infant mortality rates(infants dying at less than- one year of age per 1,000 birthsduring the same year).
BIRTH RATES
Crude birth rates (number of live births per 1,000population) much lower than 15 or higher than 50 haverarely been observed where data were known to be accurate. If the observed rate falls below 15, the completeness of registration is open to question; if it is over 50,the two possibilities should be considered: that therewas over-reporting of births or that the population fig-ure. was understated.
The most probable range of birth rates, given certain economic and social conditions, can be defined morenarrowly. Birth rates in the range between 35 and 45per 1,000 are usually considered as "high", those in therange between 25 and 35 as "moderate", and those between 15 and 25 as "low". These limits should ofcourse, be interpreted somewhat liberally. High ;atesare characteristic of most areas of the world where social customs and relationships for the great majorityof the population have been little affected by the changesassociated with industrialization according to the modern p3;ttern. ~w rates are generally found in thosecountnes which have undergone a profound socialrransformation as a result of urbanization industrialization, a rising level of popular educatio~, and relatedfactors. Moderate rates tend to prevail in areas wherethe types of conditions mentioned are intermediatebetween the two extremes.
Thi~ generalized statement, however, is over-simplified; m each case other factors must be considered indetennining within what range the birth rate should beexpected to fall.
The components of the birth rate, as well as the cruderate for the entire country, should be examined in detail.For. example, almost universally among those countrieshavmg fairly complete birth registration it has beenfound that the birth rate in urban areas 'is lower thanthat in rural areas," Therefore, the rates for the urbanand rural areas of a country should be studied separately.If the rural rate turns out to be lower than the urbanrate (even after allowing for possible differences in agecomposition and marital status by means of standardizing techniques), the completeness of registration inthe rural areas is open to question. In this connexionit will be noted that it is very important that births be
6 United Nations, The De~erminants and Consequences ofpopulatIon Trends, Population Studies, No. 17, especiallychapters 3 and 4.
• 7 For: the .results of stu~ies on the various relationships men-tioned 10.thiS and. succeed10g par~graphs, the reader is referredto the United Nat10ns report menttoned above The Determinantsand Consequences of population Trends, ~specially chapters
3 and 4.
the population.6 Accord.ingly~ the r~tes for a give~country should be exammed 10 the light of the condttions known to exist there, and of the results of researches on the relationships between these conditionsand vital rates. Such 'an examination can indicate veryroughly' the ranges within which the rates should probably be contained, and point the way to a more preciseinvestigation of possible errors if the recorded ratesseem to differ too much from those that are expected.It must be borne in mind in this connexion that erraticrates may be produced by error either in the numbersof births and deaths reported, or in the population figures which form the bases for the rates, or both.
LEVELS OF RATES
Vital rates" are known to be functions of the healthconditions and other social and economic conditions of
factors which cannot be fully considered for the purposeof such a simple comparison. Nevertheless, one shouldexpect that variations in the ratio of male to femaledeaths among a country's administrative divisionsshould tend to conform to a systematic pattern; ifvariations are unsystematict, or if the ratio in someparticular areas deviates greatly from the norm withoutany apparent reason, then the accuracy of death registration is open to suspicion. The comparison of numbersof male and female deaths may also be extended toindividual age groups. As a general rule, more malesthan females die in infancy, childhood, and adolescence,but more females than males diein old age and, at leastin some countries, also during the child bearing age.'Proceeding from one age group to another, one shouldexpect the ratios of male to female deaths to changegradually and never abruptly. Sharp fluctuations in thisratio between one age group and another may indicateeither incomplete recording of deaths of certain sexage groups, or mis-statement of ages of the deceased(see also chapter III).
Among infants, male deaths almost invariably exceedfemale deaths. This is not only because slightly moreboys than girls are born, but because the boys aregenerally subject to a higher rate of mortality. Theexact ratio of male to female infant deaths may vary inaccordance with the circumstances. In countries whereinfant mortality is high, this ratio is usually, thoughnot necessarily, within the range of 110 to 120 maleper 100 female deaths. In countries with low infantmortality, the ratio is often of the order of 130 to 140male per 100 female deaths. These are only roughstandards, but they may help to determine in somecases whether inaccuracy of infant death registrationshould be suspected. Large and unsystematic differences in this ratio among various subdivisions of acountry likewise serve as a warning that registrationmay be inaccurate at least in some areas.
Other numerical relationships can also be utilized.For example, the ratio of infant deaths to the total ofdeaths at all ages usually exhibits a considerable stability, at least so far as the various segments of anyonecountry are concerned. This ratio will be high-of theorder of one in four, or even one in three-in countriesof high fertility and high mortality, and low-aboutone in ten, or lower still-in countries of low fertilityand low mortality but, so far as the various segmentsof 31 country or consecutive years are concerned, theratio should not fluctuate unreasonably. Finally, onemay compare the ratio of all births to all deaths. Thisratio, which has sometimes been used for purposes ofdemographic analysis, can vary rather widely, but mayalso serve to detect irregularities so far as particularareas within a country are concerned.
21
I

tabulated according to the usual place of residence ofthe mother. If many rural women go to urban areas forconfinement, and if their births are credited to the urbanareas, the urban rate may be higher than the ruraleven though nearly all births to rural women have beenregistered.
The birth rates in the various subdivisions of acountry should be examined in detail. After they arestandardized for possible differences in age composition, the rates in the various subdivisions should beconsistent with the social, economic and public healthconditions in the various areas.
The birth rates for important ethnic groups or othercomponents of the population (aborigines, nomads, immigrant groups of distinctive culture and living conditions et cetera) should also be studied in the samemanner.
It is also useful to compare the level of the birthrate with the census statistics on age composition ofthe population. In general, a high birth rate is reflectedby a high percentage of children in the population anda low rate by a low percentage of children, unless therelation is distorted by major migratory movements.
CONSISTENCY OF CRUDE BIRTH RATES WITH
AGE STRUCTURE
It might appear at first thought that the birth ratecould easily be checked directly against the number ofinfants enumerated in the census. Upon closer examination, however, this matter presents considerable complications. Infant enumeration is incomplete in mostcensuses. Furthermore, the number of reported "infants" (that is to say, those aged less than 12 months)can be much affected by slight mis-statements of age.Finally, only in countries having excellent registrationsystems is the rate of infant mortality known exactly.
A useful test, called the "forty per cent test", has beendevised by Wertheim.s As demonstrated by its author,a population of which 40 per cent or more are aged lessthan 15 years is most likely to have a birth rate of atleast 40 per 1,000. The birth rate might be as low as 39,with moderate infant mortality. As is generally known,infant mortality is usually high in populations with veryhigh birth rates. .
This test is applicable where only crude age statisticsare available. Experience has shown that in most countries where the censuses show categories such as"adults" and "children" but not the exact ages of thepopulations, the mean age at which persons begin tobe reported as "adults" is usually in the vicinity of 15years (though, as a rule, slightly lower for females andslightly higher for males). Many such countries have,in fact, birth rates of the order of 40 per 1,()(X), variations around this level are probably reflected-howeverapproximately-by variations in the percentage of persons aged less than 15, at least among population groupswhich are similar in other respects.
DEATH RATES
Crude death rates based on accurate statistics areseldom much less than 8 per 1,000 population, except
S W. F. Wertheim, "La population de I'Indonesie et le test des40%", Population, 1954, No.4, pp. 655-674.
among populations of abnormal age composition. Thisis not to say that a lower rate cannot be correct, butrather that if the rate is lower than 8 and if this factcannot be explained by an abnormality of age structure,the completeness of registration or the accuracy of thepopulation base figures should be investigated.
In areas where the statistics are accurate, death ratesconsiderably in excess of 30 per 1,000 in normal yearsare unusual. Normal death rates as high as 35 per 1,000,or even higher, are possible if fertility is so high thatthe population can be reproduced despite such heavylosses. In years of calamity (for example, famine, epidemic, or mass destruction by war), the death rate may,of course, rise much higher. Except in the case of suchcatastrophes, a recorded death rate in excess of 35 per1,000 suggests that the statistics 'should be examinedfor possible errors.
As in the case of birth rates, the range of expecteddeath rates in a given area can be specified withinnarrower limits when the conditions affecting publichealth in that area are taken into consideration.
One further observation is relevant. High birth ratesoccur in conjunction with either high or low death rates.Low birth rates, on the other hand, are normally foundonly in association with rather low death rates. Hence,if the recorded birth rate is found to be of the order of,say, 15 to 25 per 1,000, the death rate would not normally be expected to be much lower than 10 per 1,000nor higher than perhaps 15 per 1,000. If the recordedbirth rate is low and the death rate either extremelylow or higher than about 15 per 1,000, the accuracy ofthe statistics should be examined.
Tests for the completeness of death reporting aresubstantially similar to those described above for testing. birth re~o~t~ng. The data can be analysed for theva~lOus subdivislOns of a country, or the various population groups, and the rates related to the social, economic and health conditions of these several segments.
In relating the death rates to these other factors it isnecessary to take into consideration the age composition.If. a population contains relatively few older people itWill have a lower death rate, all other factors beingthe same, than a populati0!1 containing relatively manyolder persons. This can be Illustrated by comparing datafor Israel and Norway. The crude death rate in theformer country was 6.4 (in 1951) which might seemsuspiciously low. In Norway (1950) the rate was 9.1.The population of Norway, however, was older thanthat of Israel. It is possible to standardize the Israela~e-sex specific death rates on the Norwegian population so as to find out what the death rate in Israel wouldbe if its population had the same age distribution asthat of Norway. Standardizing in this manner yields adeath rate of 10.3. In short, the difference in the crudedeath rate between these two countries was accountedfor to a considerable extent by differences in agestructure.
INFANT MORTALITY RATES
The level of the infant mortality rate, in general, isrelated to the level of the total death rate. Countrieshaving high general mortality rates also have high ratesof infant mortality. It is impossible, however, to assignany specific value to the infant mortality rate which
22
\
ti

,-.......01_"....#_--------should accompany a given crude death rate. A preliminary appraisal of the infant mortality rate can be madeby considering its level in the light of the social, economic and public health conditions of the country. Ifa rate seems unusual in relation to the known conditions, the accuracy of the vital data can be consideredsuspect.
The infant mortality rate is calculated by relating thenumber of infant deaths, generally under one year ofage, to the number of births. Hence, it is affected bywhatever errors there may be in the registration of boththese events.
In this connexion it is well to note that in some countries infants who do not survive a minimum length oftime, as one day or two days or three days, are notincluded in either the birth or death registration data.The effect of such a procedure is to lower the reportedinfant mortality rate, and make appraisal of it somewhatmore difficult. For example, let us assume that 1,000births are reported of which 100 died in infancy. Theinfant mortality rate is then calculated as 100 (100deaths per 1,000 live births). If there were 20 infantsborn who died during the first day and were not registered, so that 20 should be added to both the numerator and the denominator, the rate becomes 117.6 per1,000. Fortunately, for the purpose of population estimates, this error is of little importance since the additional number of births is almost instantly cancelled bythe same additional number of infant deaths. In aninvestigation of birth rates and infant death rates,however, this circumstance can produce misleadingresults.
The infant mortality rate may also be affected if theage of the infant is not correctly reported. It is possiblethat the deaths of some children who are not quite oneyear old may be reported as deaths above the age ofone year, but it is also possible that some children whohave died after their first birthday may still be reportedas infant deaths. If either of these two errors is morefrequent than the other, the number of infant deaths isaccordingly under-reported or over-reported.
A useful test consists in an examination of numbersof infant deaths by months of age, if such statistics areavailable. Deaths are by far most frequent during thefirst month, and especially the first few days, of life;in subsequent months mortality declines continuously.Ordinarily, one should expect the number of deathsin the first month to exceed significantly the numberin the ensuing five months which again should be substantially larger than the number of deaths between 6and 12 months of age. Beginning with the second month,the progression should be a fairly smooth one.
The sources of error and ambiguity in statisticsrelating to infant mortality, and methods of appraisingthe quality of the data, have been described in anotherpublication."
TRENDS IN CRUDE RATES
It is expected that there will be year-to-year variations in the birth, death and infant mortality rates.Where these yearly variations are very large, however,
9 United Nations. Population Branch, Foetal, Infant andEarly Childhood Mortality. Volume I. The Statistics. ST ISOA/Ser;e~ A/13, New York. 1954.
23
there is reason to suspect the accuracy of. the statistics.In Bolivia, for example, the recorded birth rate rosefrom 14.7 in 1940 to 28.5 in 1941 and has fluctuatedaround 30 per 1,000 ever since; the death rate asrecorded rose from 4.9 in 1940 to 19.4 in 1941 andhas since been within the range of 15 to 20 for mostyears. Such extreme variations normally do not oo-nr ;in this case they are explained by the fact that Boc.viaintroduced compulsory registration in 1940. It can bededuced that there was considerable under-reportingprior to 1941; how complete the reporting has beenfrom 1941 to date has yet to be determined.
Sometimes, however, a rather sharp change in a vitalrate may occur as a result of a major change in therelevant conditions of life. An example is found in thestatistics of Japan. In 1946 the reported crude birthrate was 25.3 and in 1947, 34.3. The Japanese birthrate is known to have fallen during the years of theSecond World War, and in particular during thoseyears when many of the men were in the armed forcesoutside the country. With the termination of the warin 1945 and the repatriation of the armed forces as wellas of many other Japanese men who had been abroad,the birth rate rose rapidly.
Another example is found in the Netherlands, wherethe death rate was 11.8 in 1944, 15.3 in 1945, and 8.5in 1946. In this case, mortality had been rising graduallyduring the years of the Second World War, as livingconditions deteriorated. At the end of 1944 and thebeginning of 1945, the Netherlands were the sceneof military operations which had devastating effects,causing a considerable temporary increase in mortality.By 1946, conditions were again relatively normal andthe death rate returned to its pre-war level.
It should be noted that where the births and deathsare tabulated by year of registration rather than yearof occurrence, large fluctuations in the rates may resultfrom variations in the numbers of delayed registrations.One further point should be noted. The obtaining offairly complete reporting of all births and deaths whichoccur is a slow process. After a compulsory registrationlaw is introduced which applies to all the inhabitants,and even after the necessary administrative mechanismis instituted, several years may be required before satisfactory reporting of all the events is ensured. Asteadily rising trend in crude birth or death rates overa period of. several years is then likely to indicate improvement m coverage rather than a rise in fertility ormortality. io
PATTERNS OF DEATH RATES, BY AGE AND SEX
Another clue as to the possible completeness of registration of deaths is afforded by examination of thepatterns of death rates by age and sex. In those countries in which all the evidence has proven quite conclusively that registration of deaths is virtually complete,there appears an almost standard pattern of rates byage and sex. This typical pattern is illustrated withdata for Sweden (see table 3 below). The essentialpoints to note are as follows:
( 1) The rates for males, in each age group arehigher than those for females; ,
10 See also United Nations, D,mogra/Jhic Year Book, 1952,p. 27.

(2) The rates are quite high in the age group underone year, after which they rapidly decrease to a lowpoint after age 10. From this minimum, the rates riseslowly at first and at the oldest ages increase veryrapidly. Thus there is a steady and smooth progressiondescribing a V-curve.
In reviewing the age-sex pattern of any country, ifdeviations from the above typical pattern are observedthey should be explained in terms of known peculiarities; otherwise errors in the statistics are to be suspected. For example, in some populations the deathrate for women is higher in the reproductive ages thanit is for men in the same age groups, because of unusually high maternal mortality associated with a veryhigh birth rate. In some countries, tuberculosis affects
the survival of adolescents and young adults to such anextent that the death rate rises fairly rapidly until aboutage 20, to remain at a fairly constant level until aboutage 30. Any deviations that are not explainable implyeither that the death reporting (number of deathsand/or age of deaths) is deficient, or that the age dataobtained from the population census (or populationestimates) are in error. Tests for attempting to determine the accuracy of the age data will be shown inchapter II1.
Some of the kinds of deviations from the normalpattern of sex-age specific mortality rates which may befound in the statistics for various countries, are illustrated by the figures for Egypt and the Moslem populations of pre-partition Palestine in table 3.
Table 3
DEATH RATES BY AGE AND SEX, FOR SWEDEN (1948), EGYPT (1937) AND PALESTINE MOSLEMS
(1944)
(Deaths for 1,000 persons in specified age-sex class)
Sweden Egypt Palestine Moslems
Age Males Females Males Females Males Females
All ages ............. 10.0 9.7 29.5 25.0 17.3 16.8Under 1 year ......... 27.4 19.4 257.6 211.2 112.8 108.51 to 4 years .......... 1.5 1.2 85.5 72.7 33.0 38.35 to 9 years .......... 0.7 0.5 8.5 6.7 4.6 3.610 to 14 years ........ 0.6 0.4 5.1 3.9 3.4 2.315 to 19 years ........ 1.3 0.7 5.8 4.2 3.6 2.520 to 24 years ........ 1.8 1.1 8.1 4.5 4.3 4.725 to 29 years ........ 1.7 1.1 8.8 5.4 8.0 7.630 to 34 years ........ 2.0 1.5 10.5 7.3 6.8 5.835 to 39 years ........ 2.4 2.1 10.5 7.2 6.5 6.540 to 44 years ........ 3.2 2.5 13.7 9.6 7.1 4.845 to 49 years ........ 4.9 3.9 14.0 8.2 10.0 5.250 to 54 years ........ 8.0 6.2 21.9 13.9 8.8 5.855 to 59 years ........ 12.2 9.1 22.1 12.5 10.9 9.360 to 64 years ........ 19.1 15.2 37.9 22.1 22.1 13.565 to 69 years ........ 30.8 25.9 45.3 25.3 30.2 24.370 to 74 years ........ 48.7 44.5 76.4 50.5 44.4 37.87S to 79 years ........ 81.1 74.4 103.7 74.780 to 84 years .... ~ ... 136.3 129.5 192.6 144.985 and over.......... 235.8 222.5 566.4 578.175 and over .....•.... 103.9 .119.7
Intensive testing is necessary to determine whetherthe dips. at ages 35 to 39, 45 to 49 and 55 to 59 reflectprimarily errors in the death statistics or in the population figures by age used for computing the rates.
The death rate for all ages in Egypt is about doublethat of Sweden. As in Sweden, the rates for males arehigher than those for females, age for age, except inthe very oldest age group. The rates for males in thesuccessive age groups exhibit no deviations from theexpected steady and smooth progression of a V-curve.In the case of female rates, minor deviations are noted;between the ages of 30 and 65 the progression is notsmooth. Whereas the expected pattern is that of asteadily rising rate, the Egyptian data show:
Age
30 to 34 years35 to 39 years40 to 44 years45 to 49 years50 to S4 years5S to S9 years60 to 64 years
Rate
7.37.29.68.2
13.912.522.1
The data for the Palestine Moslems (table 3 above)reveal greater discrepancies. The male rates are lowerthan those for females at three age groups-l to 4 years,20 to 24 years, and 75 years and over; only the deviationat the 20 to 24 year group might be explainable interms of high maternal mortality. The patterns by age,for both males and females, are much more irregularthan those observed in Egypt. Among both sexes thepatterns between ages 25 and 59 are highly irregular.For example, it is most implausible that women aged45 to 54 years have lower mortality than women aged25 to 29 years, or that men aged 40 to 44 years havelower mortality than men aged 25 to 29 years. Theage-sex rates for this population strongly suggest theneed for intensive investigation into the completeness ofdeath reporting, as well as the accuracy of the populationfigures.
c. The use of balancing equations
The use of balancing equations has been describedin chapter I. It was noted that the balancing equationalone does not permit a final appraisal of anyone of

I_-~-------
Example of Thailand
Age data are available from the censuses of 1937 and1947, and deaths by age for the inter-censal period together with an estimate of the net volume of migrationfor the period, are also available. These data can beused to illustrate the above-described form of the bal-ancing equation as follows:Population 15 years of age and over according to
census of 1947 ············· 10,068,000Population 5 years of age and over according to
census of 1937 ·.··········· 12,027,000Apparent inter-censa1 decrease ············ 1,959,000Number of reported deaths of persons who were
5 years of age and over in 1937......... · .. · .. · 1,530,000Migratory inward balance of persons who were
5 years of age and over in 1937 ·.······ 100,000Total expected decrease (deaths minus immigrants) 1,430,000Apparent inter-censa1 decrease ············ 1,959,000Population decrease accounted for ······ 1,430,000Residual unaccounted for ············· 529,000
The residual amounts to about 5.3 per cent of thepopulation 15 years of age and over in 1947, and 27.0
In some countries it may be known that net migratio.nof both native and foreign-born is very small. In. t~scase it is not necessary to tabulate the data by nativity.The balancing equation can be applied using only thetotal count of persons 5 years of age and over in theearlier census, the number 15 years of age and over inthe following census, and the total number of deathsduring the decade to persons who were 5 years of ageor over at the time of the earlier census.
The number of deaths to persons aged 5 and over atthe time of the earlier census is obtained by addingtogether the deaths at ages 5 and over in the censusyear, those at ages 6 and over in the following year,those at ages 7 and over in the subsequent year, and soforth. A refinement of the calculation is possible if theexact date of the census is taken into account. If thecensus was taken at the beginning of the year, thensome of the persons dying at age 5 in that year wereless than 5 years old at the date of the census. If thecensus was taken near the end of the year, only a smallportion of the deaths of that year could have occurredafter the date of the census.
Great refinement of the computations, however, isunnecessary, unless the statistics are very nearly accurate. Otherwise, the slight modification in the estimated number of deaths which results from a refinementof the calculation can only be negligible as comparedto the probable magnitude of the residual in the balancing equation. For most practical purposes, it is sufficient to utilize death statistics tabulated by 5-year agegroups. It is enough to assume that all deaths occurringat ages 5 to 9 during the first year after the census wastaken were the deaths of persons aged 5 to 9 at thecensus date; for the next year, it may be assumed thatfour-fifths of the deaths in this age group were topersons aged 5 to 9 at the census; two years later threefifths; three years later, two-fifths; and four years lateronly one-fifth. In subsequent years, the deaths of persons aged 5 to 9 are no longer to be considered, but ofthe 10 to 14 year age group all deaths should be takeninto account five years after the census, four-fifths ofthe deaths six years after, and so forth.
ApPRAISAL OF DEATH STATISTICS BY MEANS OF
BALANCING EQUATIONS
It is obvious that the population above a certain ageenumerated at a recent census must have already beenalive at the time when the census previous to it wastaken. This part of the population would have aged bythe number of years which have passed between the twocensus dates and, during the interval, would have beendiminished by a certain number of deaths and otherwisemodified as a result of migration. Births which occurredduring the interval do not affect this segment of thepopulation,
For reasons to be explained in chapter III, the comparison of the two populations is likely to be moreprecise if children under 5 years of age at the earliercensus are not included. Let it be assumed that censuseshave been taken in 1940 and 1950. The balancingequation then becomes:
PI = Po - D + I - EPI = population 15 years of age and over in 1950,
Po = population 5 years of age and over in 1940, D =number of deaths in 10 year period to persons whowere 5 years and over in 1940, I = number of immigrants who were 5 years of age and over in 1940,E = number of emigrants who were 5 years of age andover in 1940.
By setting up the equation in this way, the factor ofbirths is eliminated so that the balancing equation canbe used to appraise the death statistics, the migrationdata, and the census enumerations at ages above thestated limits. Thus a better appraisal of the deathreporting is obtained than could be had if the balancingequation also included births.
It would be preferable also to eliminate the migrationfactor and this is possible for a country in which thecensus and vital statistics are presented separately forthe native population, if it is known that few of thenative-born population emigrate; in such a case theequation becomes:
PI = Po - Dwhere PI, Po and D refer to native-born individuals
only.
the sets of statistics involved, that is, census counts andstatistics of births, deaths and migration.
In ihe present chapter, balancing equations are madefor certain segments of a population, thereby concentrating attention on the errors which arise from inaccuracies in the vital statistics. Again it is to be notedthat anyone such equation, by itself, is insufficient todetermine exactly from which set of statistics the majorpart of the discrepancy originates. Nevertheless, as theterms of the equation are changed, additional evidenceis gathered and the conclusions, which were at firsttentative, may be either confirmed or disproved, atleast to a certain extent. Every such appraisal is relativeonly, and the degree of accuracy of each set of statisticscan in no case be determined with absolute certainty bythese equations alone. Absolute appraisal would bepossible only if at least one set of statistics were knownto be perfectly accurate or its error were known precisely. Even so, balancing equations can often determinewith sufficient assurance whether a given set of statisticsis probably reasonably accurate or not.
25

Example of Portugal
The censuses of 1940 and 1950, together with mortality data and estimates of net migration for the intercensal decade, permit the construction of this versionof the balancing equation for Portugal:
P0!e~ls~~o~f\~lo~~~~ .~~ .~~~. ~~~..~~~~. ~~~~~~i.~~.:~ 5,953,100Population 5 years of age and over according to
census of 1940.................................. 6,890,500Apparent inter-censal decrease..................... 937,400Reported deaths of persons who were 5 years and
over in 1940 ".................. 787,900Migratory outward balance of persons who were
5 years of age and over in 1940................ 64,000
The residual would be less than 3,800 if deaths whichoccurred among men in the armed forces had not beenexcluded from the death statistics employed here. Eventhe residual of 3,800 amounts to only 0.3 per cent ofthe enumerated 1950 population 15 years of age andover.
These results suggest that the death statistics, as wellas the two population censuses and the migration data,are fairly accurate. It is possible, of course, that anunder-reporting of deaths was compensated by faultymigration data. This result could have been producedby an over-count of emigrants or an under-count ofimmigrants. However, since the migratory balance iscomputed from statistics of total civilian arrivals anddepartures (so that no problem of distinguishing between migrants and other travellers, such as visitors, isinvolved), neither of these possible errors is likely tohe important. Puerto Rico is an island, and most ofthe migration occurs by air via the one central airport;it is unlikely that many persons leave from or arrive atthe island without being recorded, and the possibilityof duplication of records in any large number of casesis remote.
With respect to the remaining two elements in thebalancing equation, the census counts and the deathstatistics, the fact that the equation does balance outwith but a very small residual suggests that both theseelements are quite accurate also. This is not provenbeyond doubt, since there could be compensating errorsamong these two sets of data. If the size and directionof any errors in the census were the same at both dates,it follows that the reporting of deaths was quite complete. If the 1950 census was more complete than thatof 1940, it follows that deaths were under-reported bya corresponding amount. This possibility could bechecked in part, by making the same comparisons forthe 1940 and 1930 censuses, and for the 1950 and 1960censuses when the results of the latter become available.If the equation should balance out as well for the othertwo inter-censal periods as it did for the decade 1940to 1950, the evidence would be quite conclusive that thecensuses and death reporting were nearly complete.
per cent of the apparent inter-censal decrease. Thisamount is large enough to suggest that further investigation into the accuracy of the component parts is required.
If the residual were to be attributed to anyone factor,this single factor could have been a greatly excessiveenumeration in 1937, a greatly deficient enumerationin 1947, a large emigration not accounted for, or aconsiderable deficiency in death registration.
Excessive enumeration at one of the censuses does notseem very probable. Census enumerations may havebeen deficient, but there is no obvious reason why the1947 enumeration should have been much less completethan the earlier one. In this connexion, it may be statedthat examination of the census data by age and sex(see chapter III) yields no clues with regard to anymajor irregularity in the census enumeration. Whether,despite the available estimate of an inward migratorybalance, there has in fact been a large emigration, cannotbe decided in the absence of further evidence, but itwould seem unlikely. Therefore-although some ofthese errors may have been present-it is probable thatthe major part of the error should be attributed toincomplete registration of deaths.
One estimate of the completeness of death registrationis arrived at by assuming that the two censuses wereeither complete, or deficient to the same extent, andthat the migration balance is substantially correct. In thisway the total number of deaths which occurred is estimated as the number reported plus the residual; or atotal of 2,059,700, of which 1,530,000, or 74 per centwere reported.
On this basis, the average crude death rate of Thailand for the period 1937-1947 inclusive should be raisedfrom the recorded level of 16.6 to 22.4. This rate iscomparable with an average death rate of 21.0 in Malayaduring 1932-1940, when death registration is believedto have been fairly accurate.
On the assumption that the censuses differed withrespect to completeness of enumeration, other estimatesof the completeness of death registration would be obtained. If it were assumed that there was a larger underenumeration in the 1947 census, the residual attributedto under-registration of deaths would be reduced, andthe conclusion would be that death registration wassomewhat more than 74 per cent complete. On the otherhand, if there were thought to have been a larger amountof under-enumeration in 1937 than in 1947, the residualdue to incomplete death registration would be largerand the estimate of completeness of registration wouldbe less than 74 per cent. By making various assumptionsas to the completeness of the two censuses, based onwhatever information can be obtained on that score, itis possible to arrive at maximum and minimum estimatesof the completeness of death registration.
Example of Puerto RicoThe procedures can also be illustrated with data for
Puerto Rico as follows. Censuses were taken on 1 April,1940, and 1 April, 1950. For the intervening years dataare available on deaths and migrants.Population 15 years of age and over according to
census of 1 April 1950.......................... 1,255,300Population 5 years of age and over according to
census of 1 April 1940.......................... 1,588,900Apparent inter-censal decrease.................... 333,600
Reported deaths of persons who were 5 years andover in 1940 .
Migratory outward balance of persons who were 5years of age and over in 1940 .
Expected decrease (deaths plus emigration) .Apparent inter-censal decrease .Decrease accounted for .Residual ...............................•..••.•.••
26
157,800
172,000329,800333,600329,800
3,800

Expected decrease (deaths plus emigration) ..J\pparent inter-censal decrease .Decrease accounted for ' .Residual ..
851,900937,400851,900
85,500
Population under 5 years of age according to censusof 1947 ···········
Births reported in 5 years preceding census date..•.Deaths reported to children born during these 5 years
2,644,0002,513,000
386,000
In this case the residual amounts to 1.4 per cent ofthe population 15 years of age and over enumeratedin 1950, and 9.1 per cent of the inter-censal decrease.This residual is smaller than that observed in Thailandand greater than that found ia Puerto Rico. Furtherinvestigation of the components parts is required beforeany definitive statement can be made about the completeness of death reporting. Perhaps the migrationdata are in error; perhaps the 1950 census was morenearly complete than the 1940 census; perhaps deathreporting was incomplete.
If it is assumed that the two censuses were equallycomplete and the migration data substantially correct,the residual is accounted for by unreported deaths. Onthese assumptions, the true number of deaths whichoccurred is estimated at 873,400, of which 787,900 orabout 90 per cent, were reported. Other estimates canbe obtained in the same manner as was shown forThailand previously.
ApPRAISAL OF BIRTH STATISTICS BY MEANS OFBALANCING EQUATIONS
~nother form of the balancing equation is particularlysuited to direct attention to an evaluation of birth
.statistics. In this instance, the procedure consists essentially in a comparison of the number of children belowa certain age enumerated at the census with the numberof births during the years immediately preceding thecensus, allowance being made for the deaths and migratory movements by which this child population has beenaffected prior to the census. The balancing equationcan then be stated in the form:
PI=B-D + I-Ewhere PI = number of children enumerated under aspecified age (for example, under 5 years), B ' numberof births reported during an equivalent number ofye~rs prior to the ~ensus, D = number of deaths amongchildren born dunng these years, up to the time of thecensus, I = number of immigrants (children bornduring the specified period), E = number of emigrants(children born during the specified period).
In computing 'the number of deaths which have occurred to children born during the given period, statistics of deaths by age are required. It is of some importance to refine this calculation because deaths arefar more frequent to children in their first year of lifethan in subsequent years. Usually more than two-thirdsof the deaths under one year of age occur during thefirst six months of life, and a disproportionately highpercentage of these deaths occur to children aged lessthan one month. This consideration has a bearing onthe ratio which should be selected in order to estimatethat number of infant deaths which should be attributedto children born in the earliest year included in thecalculation.
Example of Thailand
The above balancing equation can be applied toThailand with the following results:
27
Expected survivors under 5 years of age to be enu-merated in the 1947 census.......••.........•••• 2,127,000
Number actually enumerated...................... 2,644,000Residual ..•......•••.•.••••••.•••••••••••••.•••••• 517,000
This calculation indicates that there was underreporting of births. It is possible, but very unlikely, thatthe census count exaggerated the number of children.In fact, in almost every census, young children areunder-enumerated at least to some extent, and if theThailand census figure for this age group was in error,it almost certainly erred on the low side. It is hardlypossible, on the other hand, that several hundred thousand young children immigrated; some of the residual,but probably only a small part, could be accounted forby migration.
How incomplete might the birth reporting have been?1£ it is assumed that the number of children reportedby the census was correct, and the number of childdeaths was fully reported, one estimate of the completeness of birth reporting can be computed as follows:to the number of births as reported, is added the amountof the residual, giving an estimated total of 3,030,000births, and an estimate of 83 per cent for the completeness of birth registration.
Another estimate can be arrived at in the followingmanner: !he number o~ children under 5 years of agereported m the census IS probably too small, let it beassumed, purely for illustrative purposes th~t 90 percent of the children were enumerated. Then the truenumber of children under 5 living in the country atthe census date would be 2,930,000. With referenceto deaths, the calculations earlier in this section of the~hapter suggested as one possibility that death reportmg was 74 per cent complete. 1£ it is assumed that thesame percentage applies to the deaths of children under5 years of age, the true number of deaths for this agegroup is estimat.edat 521,000 (386,000 divided by 0.74).Adding the estimated number of children to the estimated number of deaths gives 3,451,000 as an estimateof the number of births, which implies that birth registration was 73 per cent complete (2,513,000 dividedby 3,451,000 = 0.73).
On this basis, the average crude birth rate for Thailand for 1942-1946 would be raised from the recorded30.7 to an estimated 42.1. The latter rate is comparablewith that for Malaya during 1947-1951 namely 42.6where birth registration is believed to have been verynearly complete.
This result cannot be taken as a reliable estimate ofthe completeness of. birth reporting. The calculationswere made only to illustrate the methods' better estimates might be obtained by investigating other availableinformati?n bearing on the completeness of the censusef;lumeratlOn and of death registration, or by applyingdirect checks. The probability is very high howeverthat not all children under 5 years of age'were enu~merated in the census of 1947, and that not all deathsto i~fants born in the 5.y:ars preceding the census wereregistered. Therefore It IS not likely that birth regis-

80,90071,0009,900
71,00085,500
4,600
tration was as much as 83 per cent complete-the figurefirst derived.
Example of Puerto RicoFor illustrative purposes, let us use the balancing
equation to test the completeness of registration ofbirths in the year preceding the census date. The calcu-lations are:Population under I year of age according to census
of 1 April 1950 ···········'··········Births reported during preceding 12 months .Deaths reported to children born during this period .Expected surviving children under 1 year of age to be
enumerated in the census ·····················Number actually enumerated ····· ··Residttal .
It should be noted that data on migration are missingfrom this balancing equation. It is known that therewas considerable net outward migration from PuertoRico, but the number of babies born in the period1 April, 1949 to 1 April, 1950 who emigrated beforethe latter date is unknown; it is probably reasonable toassume, however, that this number was very sma.ll andcould have accounted for but a very small portion ofthe residual of 9,900.
There might have been a significant under-reportingof infant deaths. This balancing equation proves nothmgabout the quality of death statistics. However, the results of the balancing equation used earlier for estimating the completeness of death reporting suggestedthat deaths were reported quite completely for thepopulation which was 5 years of age and over in 1940.The presumption is therefore strong that reporting ofinfant deaths was also at least fairly complete.
The above reasoning leads to the conclusion that thecensus enumeration of infants was probably deficient,and that birth registration may very well have beennearly complete. The census deficiency could have takentwo forms: complete omission of some infants fromthe head count and enumeration of some as one yearof age or more. In either case, the result is an understatement of the number of infants. The question becomes: how much under-enumeration was there? If theunder-enumeration were of about the size of the residual, it would follow that birth reporting was verynearly complete. However, if the amount of underenumeration were considerably greater than the residual, it would be clear that a significant proportionof the births had not been registered. The underenumeration of infants under one year of age in PuertoRico in the 1950 census can be estimated, when the1960 census has been taken, by the methods to beexplained in chapter III.
ApPLICATION TO THE SUBDIVISIONS OF A COUNTRY
As has been noted in chapter I, balancing equationsmay be applied to the population of parts of a countryas well as to the population of the entire country. Theusefulness of balancing equations is diminished, however, by the fact that migration between the variousareas of a country is usually important and that satisfactory statistics on internal migration can rarely befound. Hence, in many circumstances, the balancingequations for parts of a country provide insufficient
evidence, particularly on the quality of death statistics.As a matter of fact, in countries where the census figuresand birth and death statistics are supposed to be offairly high quality, such equations are sometimes usedfor the purpose of estimating the balance of migrationrather than detecting errors in the vital and censusstatistics. On the assumption that the errors are negligible, the discrepancies are ascribed to the factor ofmigration.
The limitations of the use of the equation are not sostrict if the census provides data on the population110t only in accordance with the present place of residence, but also with residence at the time of the previouscensus. In that event, the earlier population withineach administrative division can be compared withessentially the same population, at a more recent date,as modified by deaths in the intervening period andby migration beyond the country's national boundaries.Census tabulations of the type mentioned are rare,however. More commonly, censuses provide tabulationsof the population according to place of birth, or according to place of residence at some specified earlier time(but not the date of the last previous census). In thatevent, the exact balance of the population between thetwo census enumerations cannot be established, but thecensus data furnish a certain amount of evidence regarding the direction and volume of migratory movementswithin the country between the two census dates.
The complications relating to internal migration areat a minimum when the balancing equation is used totest the completeness of birth registration for subdivisions of the country, in the same manner as explained above for the whole country. When births inthe year preceding the census enumeration are compared with the number of children under one year ofage enumerated in the census, the conclusion is notnecessarily invalidated because the relatively small migration of infants, during a single year, can be disregarded.P However, this procedure suffers from thedisadvantage that the completeness of infant death registration in the various subdivisions cannot be determined by the balancing-equation methods; unless someindependent information on this score can be obtained,the estimates of variations in completeness of birthregistration from area to area may be subject to considerable error.
The direct checks to be discussed in section D of thischapter are the best means of determining the completeness of vital statistics registration. If the application of direct checks has been limited, because of thecost, to certain parts of the country, it is still possibleto estimate the completeness of birth and infant deathreporting in those areas which were not directly checkedby a procedure analogous to that of the balancing equation. The calculations are shown in table 4 below, witha hypothetical example. It is assumed that direct checkswere made in subdivision A but not in subdivision B;therefore, the problem is to ascertain the probable com-
11 If it can be assumed that death reporting is nearly completein all the subdivisions, it is possible to estimate and make allowance for internal migration. In this way it is possible to computethe completeness of birth reporting by subdivisions using thenumbers of children under 5 years of age enumerated in thecensus, and allowing for internal migration. See, A. J. Jaffe,Handbook of Statistical Methods for Demographers, Washington, United States, Bureau of the Census, 1951, pp. 145-148.
28

Toble 4ING FOR A COUNTRY'S
PROCEDURE FOR EsnMATlNG LIMITS OF COMPLETENES~ OF BIRTH llEPORTSUBDIVISIONS (hypothetical data)
SubliivisiotlA
1. Reported number of births, in year preceding census .2. Correct number of births as revealed by a direct check .3. Reported number of infant deaths ..4. Expected number of survivors at census (uncorrected figures,
item 1 less item 3) ··········5. True number of survivors at census date in subdivision A
(item 2 less item 3) · .. ·.·····6. Children under one year of age enumerated at ce~S?~ .7. Ratio of true number to number enumerated, subdivision A .8. Expected number of children under one year of age at census
date in subdivision B, assuming equal completeness of enumeration in both subdivisions (that is to say, 313 times 1.082)
9. Estimated number of births, subdivision B, assuming infantdeath reporting was complete (item 8 plus item 3) .
10. Estimated completeness of birth registration in subdivision B(item 1 as percentage of item 9) (per cent) .
11012014"
96
10698
1.082
350(no check)
35
315
313
339
374
94
• It is assumed that the direct check revealed this figure to be correct.
pleteness of birth and infant death reporting in subdivision B. It must be emphasized that this procedureonly provides approximate answers, and that a directname-for-name check affords a more accurate appraisalof the vital statistics.
The simple assumption used in table 4 can be varied.For example, on the basis of the calculations for several areas where the direct checks of birth statisticswere carried out, it may be possible to estimate a rangewithin which the correction factor for census underenumeration of children (item 7) in subdivision B isalmost certainly contained. If this range is, say, between1.06 and 1.10, the expected number of children (item 8)falls in the range between 332 and 344. Adding 35(item 3) we obtain the range from 367 to 379, and thecompleteness of birth registration ( item 10) is thenestimated in the range of 92 to 95 per cent.
Furthermore, the results of the checks of infant deathregistration in various areas may provide a basis forestimating its completeness in subdivision B. If it isestimated in this manner, for example, that between80 and 90 per cent of infant deaths in subdivision Bwere registered, there would be, instead of 35, some 39to 44 actual infant deaths, to be added, in item 9, tothe range of 332 to 344 estimated for item 8. Thus theestimated number of births is placed in the range from371 to 388, indicating that birth registration was 90 to94 per cent complete.
D. Direct checks on completeness of vital statisticsregistration
The method of direct checks consists of securing anindependent list of children born, or persons who died,during a particular period and in a particular area, andthen checking name for name with the registrar's filesto determine whether these events were registered. Thesimplest, but not necessarily the most accurate estimateof under-reporting is that proportion of the births ordeaths on the independent list, for which no certificateof registration can be found. The procedures for a goodestimate of the completeness of registration may bemore complicated in some circumstances.
29
Lists of names of births and deaths can be securedfrom a wide variety of sources including church records, names reported in newspapers and other publications, and house-to-house inquiry. These names can becollected from the entire population or from a sample;in the latter event it is important that the sample berepresentative of the entire population living in thearea. Any effort to cover the entire population of acountry in order to determine the number of births anddeaths which have occurred during a specified year, forexample, is very expensive; indeed, its cost may be asgreat as that of a population census. The minimumsample which will provide reliable results is most economical and practical.
So far as births are concerned, the names of infantslisted on the census schedules constitute a valuable basisfor a check on registration.
In many respects these procedures are very similarto those described in chapter I for a direct check of theaccuracy of a census enumeration, but a check on vitalstatistics can be carried on at any time whereas directchecks of the census enumeration are best conductedimmediately after the enumeration is finished.
It is evidently desirable that the independent list beas nearly complete as possible; however, as will be explained" below, it is not essential that the list be perfectly complete in order to obtain good estimates of thecompleteness of registration.
In matching the names on the independent list withthe names of registered births or deaths, the events aretabulated in three categories:
(A) Matched events, that is to say, those recordedon both lists;
(B) Events found on the independent list but notregistered;
(C) Events registered but not found on the independent check list.
In addition, unless the independent check list is knownto be perfectly complete, a fourth category (which weshall designate as category D) must be considered,namely, events not included in either list, which actuallyoccurred and should have been registered.

The sum of A + B represents all events found onthe check list; the sum of A + C all events found inthe register; and the sum of A + B + C + D allevents which in fact occurred. A perfect measure of thecompleteness of registration would be the ratio ofA + C to A + B + C + D.
If the independent list is very nearly complete, veryfew (if any) events should be found in category C andit may be presumed that category D is very small. Thecategories C and D can then be neglected, and the ratioof A to A + B is a good estimate of the completenessof registration.
If a sizeable number of events of both categories Band C is found, it may be presumed that the numberof category D is also substantial. This is the situationwhich is usually to be expected. One estimate of themagnitude of D can be made on the assumption that,in the check list, the probability of inclusion of an eventis the same for registered events as for those whichescaped registration. On this assumption, the ratio ofC to C + D would be the same as the ratio of A toA + B, or of A + B to A + B + C + D. Theratio of A to A + B then still constitutes a good estimate of the completeness of vital registration.
As a rule, however, the probability of omission fromthe check list will be greater for unregistered than forregistered events. The reasons why certain events donot reach the registers are likely to apply also in somedegree to the omissions from the coverage of the houseto-house inquiry or other source of the check list. Theratio of C to C + D will therefore usually be smallerthan the ratio of A to A + B, so that the latter is amaximum estimate of the completeness of registration.The error of the estimate is likely to be the greater, thelarger the numbers of cases in categories Band C. Ifthe probable size of category D is large enough to havea substantial effect on the estimate of the completenessof registration, refined methods are necessary in orderto arrive at a realistic estimate of completeness.P
12 For a description of refined procedures, as applied in atest of the birth and death registers in an area of Bengal,where vital registration is known to be greatly deficient, thereader may refer to C. Chandra Sekar and W. E. Deming,"On a Method of Estimating Births and Death Rates and theExtent of Registration," Journal of the American StatisticalAssociation, Vol. 44, No. 245, March 1949, pp. 101 ff,
BIRTH REGISTRATION TEST IN PUERTO RICO, 1950
The above procedures can be demonstrated with dataobtained in a test of birth registration which was carried out in Puerto Rico. At the time of the 1950 population census special cards were filled out for all infantsenumerated in the census, who had been born duringthe preceding three months. These cards contained thename of the infant, the names of the parents, and suchother information as would be useful for identificationpurposes. The cards were then matched with the records of births registered during the same period. IS
The figures for the municipality of Adjuntas, forexample, are as follows:Infants' cards matched with births registered........... 200Infants' cards for which there were no births registered.. 15
TOTAL 215
The completeness of birth registration was thus estimated at 93 per cent (200 divided by 215).
The results of this test for the entire island of PuertoRico revealed that in the three months preceding thecensus of 1 April 1950, birth registration was about 95per cent complete. The presumption is that birth registration had been approximately as complete for sometime in the past, and would probably continue to beat least as complete in the future. In comparing thisfinding with that obtained by using the balancing equation (as described earlier in this chapter), it is seen thatthe tentative conclusion arrived at by means of the equation are substantia.ted by means of the direct check. Thedirect name-for-name check not only provides a moreprecise appraisal of completeness for the island as awhole, but also permits estimation of completeness ofregistration in each of the 77 municipalities, which isnot at all feasible with the balancing equation.
It should be noted that this type of check can be carried out any time after a census has been taken, so longas the census schedules and the registration certificatesare available.
13 For further information on the steps involved in matchingthe records see Sam Shapiro and Joseph Schachter, "Methodology and Summary Results of the 1950 Birth RegistrationTest in the United States", Estadistica (Journal of the InterAmerican Statistical Institute), December 1952, Vol. 10, No. 37.
30

f"'"1 '..1+_..", ---------
2 See chapter II, section B.
31
information concerning factors tending to produce anerror. However, the application of these tests is advisable even where no a priori suspicion of error exists,since they may bring to light errors that have not been
suspected.A first test consists in the computation of sex ratios
on the basis of the returns for the whole country andeach of its parts. The sex ratio can be expressed as thenumber of males per 100 females, or females per 100males. If broad age categories are also given, the sexratios can usefully be computed separately for each ofthese categories. Computation of the ratio of childrento women is another useful test.
Such ratios, computed for each area, should be compared and evaluated in the light of what is known aboutconditions in various parts of the country. In general, apopulation not much affected by migration has approximately (although hardly ever exactly) equal numbersof males and females. This is to be expected because,as a rule, slightly more males than females are born,2but female mortality is less than that of males; con,sequently, a slight excess of males among children isusually more or less counter-balanced by an excess offemales among adults. Depending on the precise sexratio of births and mortality conditions, the total number of females mayor may not slightly exceed the totalnumber of males.
This situation, however, is often modified in variousways. If the population is very small, the ratio of malesto females is subject to chance variations. Following awar, with many military casualties, the ratio of malesto females in the adult population may be abnormallylow. Large-scale migration can have a great effect onsex ratios. Very often a majority of the migrants areyoung men in search of gainful employment, so that therelative numbers of males are reduced in areas of emi-gration, and increased in areas of immigration. Predominantly female migratory movements also occur, asin the case where many young rural women move totowns where they seek employment as domestic servants.Some knowledge of the types of movements and employment conditions in the country will enable thestatistician to appraise the sex-ratios computed fromthe census data.
The following example, based on Canadian statistics,is given as an illustration of the variations in sex ratioswhich may in fact occur in different parts of a country.In this example, the ratios computed from the censusfigures give no basis for suspecting important errors
in enumeration.At the 1951 census of Canada, 7,089,0CiJ males and
6,921,000 females were enumerated. For every 100 females, there were 102.4 males. Since Canada is an immigration country, the excess of males is not surprising. Among the rural population, the ratio was112.3 males per 100 females; among the urban population, 95.8 males per 100 females. This difference
CHAPTER Ill. THE ACCURACY OF AGE AND SEX STATISTICS
1 See also the discussion of tests 0 f vital statistics registration by reference to sex ratios and age patterns in chapter II.
A. Evaluation of census results classified by sexonly, or by sex and broad age groupS
In some under-developed countries where a greatmajority of the population is illiterate, it is very difficult to obtain even approximately correct statements,in a census, of the ages of the people. In such situations,the census returns are sometimes classified by sex only,or for each sex by such indefinite age groupings as"infants", "children", and "adults". Although it isimpossible to apply to data.of this kind such rigoroustests as are possible where the exact ages in years arerecorded, it is useful to examine the consistency of returns for the two sexes and for whatever broad agecategories are presented. Such an examination mayprovide useful indications of apparent deficiencies in the
head count.Testing procedures of the types described below are
especially approptiate where there is any a priori reasonto suspect-in view of the prevailing customs and attitude of the people or the methods of enumeration employed-that there may have been a tendency towardan error in the count affecting especially persons ofone sex or age category. If this is the case, the resultsof the tests should be interpreted with full regard to such
This chapter is concerned primarily w.it~ method.s oftesting the accuracy of populatlOn statistIcs ~la.ssifiedby age groups. Tests of the accuracy of age statistics ~renecessary not only because such data are of maJ~rimportance for population estima~es and de~o&raphicanalysis, but also because errors m these statIstIcs areoften indicative of deficiencies in the head count of thepopulation, or in the records of the numbers of vitalevents. Statistics classified by age groups may be affected both by errors in the reporting of a~es and byvariations in the completeness of enumeratlOn, or ofrecording of vital events, for the different age groups.Both types of error will be considered here.
The classification by sex is also of fundamental importance in demographic statistics. Sex, unlike age, isseldom reported incorrectly in census enumerations orrecords of vital events. It is therefore not necessaryhere to develop tests for the accuracy of sex reporting.However, statistics classified by sex may be in errorbecause the enumeration, or the recording of events, ismore nearly complete for one sex than for the other.Analysis of statistics by sex, like the tests of age statistics, may therefore be useful in evaluating the reliability of head counts and the completeness of vitalstatistics registration. In this chapter, certain tests applicable to population data classified by sex are presented together with the tests of age statistics. In addition, the methods explained in the preceding chaptersfor testing census and vital statistics for both sexescombined, can be applied to data for each sex sep-
arately.'

7
Children72,23276,19619,5575,319
23,87012,07747,65323,97019,83610,55629,78033,68548,22842,81123,640
422,354141,016
80,18442,26322,44013,66426,91223,91566,54623,04621,30013,17624,10341,33054,37539,63228,459
284,457148,266
U'omen
98869691959694949998
120184
Me.n73,09630,21715,21912,33923,63420,14857,75922,16323,54812,95822,43657,28258,14935,85928,969
219,037142,279
UrblJ"
111111110109109115117117121121164122
Rural
Sex rlJtio(males per 100 females)
DivisionIgala ..Igbira .Kabba .Koton Karifi .Abuja ..Agaie-Lapai .Bida .Kontagora .Kuta ..............•...Zungeru .Jemaa .Ios .Pankshin .Shendam .Southern .Katsina .Zaria .
Niger
Province
Plateau
Zaria
Kabba
Prouinc«
country, the following sex ratios are obtained (malesper 100 females) :
94 in urban places of 100,000 inhabitan~s or .more;96 in urban places of 30,000 to fJ),m inhabitants:96 in urban places of 10,000 to 29,999 inhabitants;99 in urban places of less than 10,000 inhabitants;
110 in rural non-farm areas;117 in rural farm areas.The sex ratio rises regularly in progression from the
most urban to the most intensely rural categories. Analogous ratios for each of the provinces (not presentedhere) show the same systematic sequence, with only afew minor deviations, as, for example, in the case ofNova Scotia, where the sex ratio for urban places with10,000 to 29,999 inhabitants was found to be 97, butthat for urban places with less than 10,000 inhabitantswas only 94. Perhaps some special reason exists toaccount for this deviant observation.
In other countries, conditions may differ greatly fromthose noted in the case of Canada. Where there is apredominantly male migration from rural to urbanareas, the pattern observed in Canada may bealtogether
Conditions in the Yukon Territory and the North reversed. The presence of mining enterprises, or ofWest Territories are special; these are located in high plantations employing seasonal labor, for example, maynorthern latitudes and are very sparsely inhabited, by result in selective migrations reflected in the sex ratios.a largely migrant population. In the remaining provinces Whatever the special conditions of the case may be, ifthe sex ratios show a male excess in rural areas and sex ratios disclose a systematic picture, then there isa male deficit in the cities. In Alberta and British reason to suppose that the two sexes have been enu-Columbia, where the rural excess of males is particu- merated with comparable accuracy. Deviations from thelarly great, the urban deficit of males is almost neg- pattern, which cannot readily be explained, should beligible. The provinces are listed in their geographic singled out for further investigation of the accuracy oforder, from East to West, showing that the rural the returns. If the entire pattern of sex ratios is erraticexcess of males diminishes slightly in the progression there are strong grounds for distrusting the complete-from Newfoundland to Quebec, and then increases con- ness of the enumeration.tinuously towards the West. A similar, but less regu- If the census also provides figures on "adults" andlar pattern of variation appears also in the urban sex "children", various other ratios can be computed, suchratios. This pattern is undoubtedly related to the eco- as ratios of children to adults, children to women,nomic features and demographic history of the country. women to men, and girls to boys. An example of an
A comparison of sex ratios can also be made for analysis of this kind, based on the 1931 census in thecommunities of various size classes. For the entire Northern Provinces of Nigeria, is reproduced below:"
According to the 1931 "census" returns there were 3,497,807 men, 3,898,114 women, and4;037,178 children. The proportion of children was 37.1 per cent. It oscillated between 29.2 percent in Niger Province and 41.5 per cent in Zaria Province. The ratio of women to 100 men was111.4, varying between 92.7 in Plateau Province and 129.5 in Bornu Province. The ratio ofchildren to 100 women was 103.6, varying between 78.4 in Adamawa and 130.2 in Zaria. Largeas these differences between Provinces may seem, the differences between the returns for thevarious Divisions of one and the same Province are in many cases not less startling. I shallquote a few striking examples:'
Wome.. ChildrenChildre.. to toper cent 100 men 100 women
32.0 109.6 90.851.2 139.8 180.334.2 147.4 87.217.0 110.7 37.532.1 113.8 88.721.5 118.6 50.527.7 115.2 71.634.7 103.9 104.030.7 90.4 93.128.8 101.6 80.139.0 107.4 123.625.5 72.1 81.530.0 93.5 88.736.2 110.5 108.029.2 98.2 83.145.6 129.8 148.532.7 104.2 95.1
Newfoundland .Prince Edward Island .Nova Scotia .New Brunswick .Quebec .Ontario .Manitoba .Saskatchewan .Alberta .British Columbia •..................Yukon Territory .North West Territories .
MALES PER 100 FEMALES IN RURAL AND' URBAN AREAS OF THECANADIAN PROVINCES IN 1951
is related to the differences in employment conditionsfor the two sexes in the countryside and in towns.
For the rural and urban populations of the variousprovinces, the ratios are as shown in table 5 below.
Table 5
• See Census of Nigeria, 1931, vol. ii, pp. 33, 52-3. Figures comprise total population.8.From R. R. Kuczynski, Demographic Survey olthe Bntish Colonial Empire, Vol. I, West Africa (1948), p. 608.
32

I'--~"-------
5 An age-cohort is the number of persons surviving fromthe same birth-period. Thus, persons aged 35-39 years in 1940and 45-49 years in 1950 belong to the same "cohort", born in
the 1900-1905 period.
INSPECTION OF THE DATA
Table 6 reproduces the results of the 1945 census ofTurkey, showing the population by sex and single yearsof age. The same data are presented in figure 1. It canbe seen at a glance that unusually large numbers of individuals were reported at ages which are multiplesof 5 and 10, and relatively small numbers at other ages.
Closer inspection of the figures reveals that deficiencies in reported numbers are greatest at ages with finaldigits 1 or 9; this is not surprising in view of the strongattraction exerted by the figures terminating in 0.
cause of ignorance, the returns. may neverthele~s ~epresent a fairly close approximatlOn ~o the true .dtstribution of ages. If ages have been ?eh~eratelY ~Is-.stat~d,there is more likelihood of a bias m the dlstnbutlO
u
towards either overstatement or understatement of age,affecting certain broad age ranges.
Balancing equations, such as thos.e already descri~edwith reference to the total populatlOn, can be apphedseparately to each sex-age cohort." Failure of theseequations to balance may be accounted for by misstatement of ages, by varying completeness of enumeration or by both. It is often impossible to distinguishclearly the effects of these two kinds of error if one testonly has been used. Hence the need to apply severaldifferent tests. Examination of the data from differentpoints of view increases the likelihood of a correct
interpretation.The subject of the present chapter cannot be entirely
detached from the topics dealt with in chapters I and II.Some tests of completeness of enumeration or vital registration presuppose that age statements are fairly accurate. Some tests of age-accuracy, on the other hand, presuppose reasonably complete enumeration or registration. Direct checks of completeness of a census or vitalregisters can be conveniently combined with directchecks on the accuracy of age statements, as well asstatements relating to various other population at-
tributes.Some effects of age errors are most readily apparent
if statistics by single years of age are examined; otherscan best be observed in grouped data, preferably theconventional groups of 5 years. The age distributionshould therefore be tested in both forms. Essentiallythe same principles can be applied to single-year andgrouped data. Complete examination, in either caseinvolves four steps, namely: (1) inspection of the data:(2) c?mpariso~ with an expected configuration, (3)analysis of ratios computed from the data, and (4)
measurement of age-accuracy by means of an index.
The use of these methods will be illustrated by adetailed analysis of the age distribution of the 1945census of Turkey. These data have been selected notonly because errors in the age statements were evidentlyconsiderable, but also because the frequency and magnitude of errors differ greatly for the two sexes. Thetypes of errors present in the Turkish statistics arecommon to most statistics relating to age, though theyare often of much smaller magnitude.
4 The standard definition of age, used in most censuses andvital records, is the number of completed years, that is to say,the exact age, in years, at the last birthday. Local customs inreckoning age sometimes diverge from this definition. In somecases, the question refers to the date of birth instead of theage attained. It is believed by the authorities in many countries that more precise answers are obtained if the questionis put in this form, provided, of course, that date of birth iswell known to a majority of the population; nevertheless,mis-statements of date of birth analogous to mis-statement ofage also occur. The censuses of Brazil require statement ofdate of birth if known and statement of age if birth date is
not known.
B. Examination of detailed age classifications of thepopulation at a single cenSus date
For a proper interpretation of the results of testsapplied to more detailed census statistics on ages of thepopulation, it is important to bear in mind that errors inthese statistics may be produced both by differences inthe relative completeness of enumeration of persons indifferent age groups, and by mis-statement of the agesof those who are enumerated. The factors which maybe responsible for both these types of error, under theconditions which exist in the given country, should alsobe taken into account.
The causes of mis-statement of ages include:Ignorance of age, negligence in reckoning the precise
age, deliberate mis-statement, and misunderstanding ofthe question. 4 If ages have been mis-stated mainly be-
It should be noted that in those censuses in which"adults" and "children" are distinguished without anyprecise definition of the age limits of these categories(as has to be done in some areas of Africa where peopleare often quite unaware of their ages, in years), it veryfrequently happens that females are reported as "adults"at an earlier age than males. Consequently, among thechildren, there would often be a heavy preponderanceof males because adolescent boys aged, say, 15 or 16would be regarded as "children", while adolescentgirls of, say, 13 or 14 years would be regarded as"adults". This results also in an undue preponderanceof females among the population considered as "adults".
• See CellSIIS of Nigeria, 1931, vol. ii, p. 33.b It should be noted, however, that the ratio of children to
women was extraordinarily high in Katsina Division, and thatif the number of women was swelled by counting girls asadults, the ratio of children to women would have been higherstill than shown in the census returns.
The Census Officer made the following comment:One knows of no such conditions in Kabba Province as
would account for the enormous disproportions of non-adultsshown in the Division of Koton Karifi ... and Igbira ... orfor the low figure . . . in Agaie-Lapai Division. of NigerProvince. In jos Division, however, where there 1S a largeimmigrant adult male population to the mining areas, onewould expect to find a lower proportion of adult females
and non-adults.'As a matter of fact all ratios of sex and age derived from
the General Censuses are open to grave doubts, since these"censuses", also in the Northern Provinces, were basedlargely on the tag registers and, as regards women and children, on rough estimates or guesses. In some Divisions,such as Katsina, where a large excess of females (30per cent) was recorded for adults and a large deficiencyof females among children (18 per cent), this anomaly maybe due to the custom of counting even the youngest wives as
adults.b
33

30
20
40
50
10
80
FEMALES
......__...,- ...,- .... 0
MALES
30
0'------.----,.---
70
50
40
20
10
60
Ager----------------------.!'Ir-------------------..,
~~ ~~ ~~ ~~ 0 ~~ ~~ ~~ ~~
Figure 1. POPULATION OF TURKEY, 1945, BY SEX, BY SINGLE YEARS OF AGE AND 5-YEAR AGE GROUPS, ACCORDING TO CENSUS
Marked deficiencies at ages ending in 4 or 6 are likewiseexplained by the considerable attraction of the figureswith terminal digit S. As for ages ending in 2, 3, 7, and8, it can be noted that the "even" figures are somewhatmore attractive (or less repugnant) than the "odd"ones; numbers at ages ending in 2 are somewhat largerthan those at ages ending in 3; numbers at ages endingin 8 are somewhat larger than those at ages endingin 7.
Finally, the forces of attraction of preferred finaldigits (or repulsion of disliked digits) are more markedin the case of females than of males, as can be seenfrom the wider fluctuations in the figures for females.Evidently, the age statements of females are less accurate.
These findings are common to inaccurately reportedages in almost any country. The intensity of attractionand repulsion of certain figures is not always as pronounced as in the present example, nor is the differencebetween male and female age-accuracy always as great.The details of the pattern of age mis-statements varysomewhat from country to country, but the characteristic features are usually the same,"
6 For a study of the relative attractions and repulsions exerted by various figures of age in different countries, the readeris referred to Bachi's article in the Bulletin of the InternationalStat;!tical Institute, Vol. XXXIII, Part IV.
Whereas these effects of age errors are readily apparent, it is usually difficult to interpret accurately theircauses. Probably most age mis-statements result instatements of round figures (for example, persons agedeither 39 or 41 may report their ages as 40), thoughthis is not necessarily always the case (a person agedexactly 40 years may report his age as 41 or 39, orsome other figure). Where ignorance is the main cause,the great majority of mis-stated ages are likely to bereported in round figures. If ages are deliberately misstated, they may often be given at other than roundfigures in order to create an impression of accuratereporting.
The extent of mis-statements cannot be directly inferred from the data. While mis-statements by one yearonly are probably most frequent, it is possible that insome cases the error is considerably larger. At advancedages, mis-statements by several years are probably veryfrequent.
The data show no immediate evidence as to whetherthere are any tendencies, in certain age ranges, foroverstatements of age to be more frequent than understatements, or vice versa. This question is of considerable importance. If errors in both directions are ofnearly the same frequency and magnitude, combinationof the returns into five-year groups, or the application

Table 6
POPULATION OF TURKEY, BY SEX AND SINGLE YEARS OF AGE, ACCORDING TO THE CENSUS OF 1945 (In ·~~s:>r..ds)·
Age Males Females Age Males Females Age Males Females
TOTAL 9,447 9,344
ll-4 .......... 1,287 1,185 35-39.......... 607 578 70-74. ......... 80 133
0.......... 256 219 35.......... 283 373 70.......... 58 1161. ......... 240 217 36.......... 101 61 71.....•.•.. 6 52....••.... 262 249 37.......... 77 42 72.....•.... 7 63.......... 268 258 38.......... 96 74 73.......... 5 44.......... 261 242 39.......... 50 28 74.......... 3 2
5-9.......... 1,348 1,242 40-44.......... 542 558 75-79.......... 30 395.......... 312 292 40.......... 244 409 75.......... 19 306.......... 282 265 41.......... 73 30 76.......... 4 37.......... 253 228 42.......... 90 48 77.......... 3 28.......... 334 313 43.......... 76 39 78.......... 3 39.......... 167 144 44........ " 59 31 79.......... 1 1
10-14.......... 1,285 1,074 45-49.......... 401 378 80-84.......... 29 4610.......... 386 337 45.......... 201 260 80.......... 24 4211 .......... 133 109 46.......... 68 36 81.......... 2 212.......... 341 277 47.......... 47 25 82.......... 2 113.......... 223 181 48.......... 55 40 83 .......... 1 114.......... 201 170 49.......... 30 17 84.......... 1 1
15-19.......... 1,049 931 50-54.......... 283 434 85-89.......... 7.5 9.415.......... 298 267 50.......... 158 350 85.......... 5.4 7.216.......... 198 174 51.......... 36 21 86.......... 0.8 0.917.......... 166 144 52.......... 38 28 87.......... 0.6 0.618.......... 255 259 53.......... 28 19 88.......... 0.5 0.519.......... 132 88 54.......... 22 15 89.......... 0.3 0.3
20-24.......... 789 692 55-59.......... 171 219 90-94.......... 7.2 11.520.......... 271 381 55.......... 78 150 90.......... 6.2 10.421.......... 150 62 56.......... 29 23 91.......... 0.3 0.322.......... 154 113 57.......... 22 15 92.......... 0.3 0.323.......... 123 77 58.......... 27 23 93.......... 0.2 0.224.......... 92 59 59.......... 16 10 94.......... 0.2 0.1
25-29.......... 484 619 60-64.......... 200 349 95-99.......... 2.5 3.625.......... 191 393 60.......... 121 297 95.......... 1.1 1.826.......... 79 59 61.......... 23 14 96.......... 0.3 0.327.......... 65 46 62.......... 23 17 97.......... 0.2 0.228.......... 89 88 63.......... 20 13 98.......... 0.3 0.329.......... 61 33 64.......... 13 8 99.......... 0.7 1.0
30-34.......... 731 700 65-69.......... 99 125 100 and over ... 1.5 2.830.......... 301 471 65.......... 58 94 Unknown 11.3 13.131.......... 103 42 66.......... 13 9 .....32.......... 133 78 67.......... 11 833.......... 107 60 68.......... 10 934.......... 87 48 69.......... 6 4
• Source: Turkey, Central Office of Statistics, Recensemeni general de la population du 21 octobre 1945, Publication no. 286,Vol. no. 65, Ankara, 1950.
-_!",.,--------~
of a rather simple smoothing formula, will suffice toremedy most of their defects. If the mis-statements arehighly tendentious, it is doubtful whether even a complicated graduation formula can eliminate the resultingdistortions in the age distribution.
Figure 1 also shows the 1945 population of Turkeyin five-year groups of ages. The corresponding numbersappear in table 7. Since Turkey has a high birth rate,we should expect its age structure to resemble a pyramid, with each successive layer somewhat smaller thanthe preceding one. Deviations from this pattern in ahigh birth-rate country are possible if there have beenmarked previous changes in the birth rate, large immigration or emigration, or special mortality losses affecting particular age groups (for example, militarycasualties). Turkey has indeed experienced large popu-
3S
lation transfers affecting certain ethnic groups but thetransferred populations probably represented a faircross-section of age groups; hence, no great irregularityin the age distribution is to be expected on this ground.Military casualties during the First World War andsubsequent years must have resulted in some reductionin the number of male survivors aged between 40 andro years in 1945. During both the First World War andthe Second World War, the male population of militaryages was mobilized; the absence of many young menfrom their homes could have resulted in some reductionof the birth rate during both periods and, hence, inreduced numbers of survivors of either sex aged 0-4and 25-29 by 1945.
Figure 1 and table 7 show the following departuresfrom a regular age pyramid.

" Source: Turkey, Central Office of Statistics, Recensementgeneral de fa population du 21 octobre 1945, Publication no. 286,Vo!' no. 65, Ankara, 1950.
Table 7
POPULATION OF TURKEY, 1945, BY SEX AND 5-YEAR GROUPS OFAGE, ACCORDING TO THE CENSUS (In thousands)"
1. Numbers aged 0-4 are indeed smaller than thoseaged 5-9. As it is common, in the censuses of manycountries, that small children are enumerated incompletely, one may at first suspect this to be the resultof a great deficiency in child enumeration. However,as already pointed out, the differences may have beendue partly to mobilization during the Second WorldWar. Possibly both incomplete enumeration and a birthdeficit combined to produce this effect.
2. Fewer persons are reported at ages 25-2'9 thaneither at ages 20-24 or 30-34. A possible explanationis a marked birth deficit (or increased infant and childmortality) during 1915-1920. If this was the case, it isprobable that the relatively small number of childrenaged 0-4 should also be largely accounted for in thesame terms. Closer inspection of the deficit at ages25-29, however, reveals additional peculiarities. Femalesaged 30-34 outnumber not only those aged 25-29, butalso those aged 20-24; in the case of males, this is nottrue. This observation cannot be explained in terms ofa birth deficit, which would affect both sexes alike; itindicates either that the ages of females were misstated differently from those of males, or that manywomen aged 20-29 were not enumerated. It has beenobserved in many censuses that young women tend tounderstate their ages. In the present instance, it is possible that many women in their early 20's reportedtheir ages in the 'teens, and also that some women inthe early 30's reported themselves in the upper 20's.This conclusion is not certain since males may alsohave mis-stated their ages in some unknown fashion.Moreover, there might have been a tendency to omit
Age-group
TOTAL
()...4•••••••••••••••.••••••••5-9 .
10-14 .15-19 .
20-24 .25-29 .30-34 .35-39 .
40-44 .45-49 .
50-54 .55-59 .
60-64 .65~9 .
70-74 .75-79 .
80-84.....••........•.......•85-89 .
90--94 .95 and over .
Unknown .
Males
9,447
1,2871,348
1,2851,049
78948473160754240128317120099803029874
11
Females
9,3441,1851,242
1,074931
692619700578
558378
434219
349125
1333946
9
116
13
36
young women in the census enumerations. The FirstWorld War birth deficits, if any, could also have continued for one or two years after 1920, owing to internal warfare in Turkey affecting the birth cohort20-24 years in 1945. A similar analysis of the agereturns from an earlier or a later census of Turkey,using some of the methods to be discussed later in thischapter, would be very helpful in evaluating the possibility of explaining the irregularities in terms of abirth deficit. Even without reference to another census,a statistician with intimate knowledge of the countryand its people could find the most plausible explanationfor the apparent inconsistencies in the returns.
3. Females aged 50-54, 60-64, 70-74, 80-84, 90-94,and males aged 60-64, appear in each case more numerous than those in the preceding 5-year group. It isaltogether improbable that birth rates could have fluctuated during the entire half-century from 1850 to 1900so as to produce these effects. The alternating excessesand deficiencies in these five-year groups must be attributed to the very powerful attraction exerted byfigures which are multiples of 10; they imply that manyof the people over 50 were quite ignorant of their realages, that the reporting was very negligent, or thatthere was a definite reluctance to report the agesexactly.
COMPARISON OF DATA WITH AN EXPECTEDCONFIGURATION
Nothing is to be gained by a further examination ofthe Turkish data by single years of age because theeffects ·of attractions of particular figures of age areimmediately evident from inspection of the data. However, the statistician examining census age statisticswhich, though possibly inaccurate, are not so erratic asthose of Turkey in 1945, may wish to use additionaltests. For some populations, ages are reported fairlywell with the exception of the advanced ages. In suchinstances, it is advantageous to compare the reportednumbers at individual years of age with those obtainedby some method of graduation or smoothing. For thispurpose, comparison with a 5-year moving averagemay be entirely sufficient. A brief example is given intable 8.
In the case of the Turkish census, more can belearned from a comparison of the returns with an expected pattern of age composition in five-year groups.As has already been mentioned, the Turkish age structure should resemble a pyramid, with the exception ofany effects of war-time birth deficits or military casualties. Such a pyramid can be constructed by computing a stable population! from the L, values" of asuitable life table by applying an appropriate geometricrate of increase. Since great precision is not required,any stable population which fits the data tolerably well
7 A stable population is a population of such age structureas would result if the same rates of mortality and fertilityprevailed over a period of several generations. It differs froma stationary population in that the birth rate and the deathrate may differ, whereas in a stationary population the birthrate equals the death rate. The actual population of a countrywith high birth rates often resembles a stable population fairlyclosely even though mortality has changed in the past.
8 The Lx values in a life table indicate the age compositionof a stationary population that would result from the mortalityrates of the life table and a constant number of births (usually100,000) every year.

!¥".-------~
Table 8
POPULATION OF THE UNITED STATES, 1940, REPORTED IN THECENSUS AT AGES 80 TO 90, COMPARED WITH 5-YEAR MOVING
AVERAGES
Excess (+)or
deficit (-) Excess or
population 5·ye~r of deficit as
rePorted mov'mg reported per~entage of
Age at census averag!. numbers moving average
78........ ·· 65,04579...... ··· . 58,066
so.... ···· .. 53,512 50,189 + 3,323 +6.6
81.......... 38,307 43,245 -4,938 -8.9
82....... ·· . 36,016 36,831 715 -2.2
83...... · .. · 30,324 30,318 + 6 +0.0
84..... ···· . 25,997 25,844 + 153 +0.6
85...... · .. · 20,946 21,232 - 286 -1.3
86...... ··· . 15,938 17,134 -1,196 -7.0
87......... · 12,957 13,481 524 -3.9
88........ · . 9,834 10,610 776 -7.3
89....... · .. 7,728 8,166 438 -5.4
90.......... 6,596 6,162 + 434 +7.0
91........ · . 3,71692........ ·· 2,932
can be used. In the present instance, a good fit wasobtained by applying a 2 per cent annual rate of increaseto the stationary population of the 1936-1938 life tablefor Egypt." This was done by applying successivepowers of 1.025 to the 5L.: values (that is to say, thestationary population in five-year age groups).
Ordinarily, a comparison of a stable with an actualpopulation is made by multiplying the figures ~f thestable population by a constant, namely, the ratio between the totals of the two populations. In the presentinstance, in order to allow for possible birth deficitsresulting in reduced numbers of persons aged 0-4 and25-29, the stable population was multiplied, separatelyfor each sex, by the ratio between the total stable andactual populations for all ages other than 0-4 and 25-29.The results are shown in table 9 and figure 2.
Since the comparison is rough, no importance shouldbe attached to the exact size of the differences betweenthe census data and the stable population figures forany particular age-sex category. Nevertheless, significant observations can be made. There is a considerabledeficit at ages 0-4, which may represent in part theeffect of a decline in the birth rate during 1940-1945.This deficit, however, appears to be larger for malesthan for females. On the other hand, the reported numbers of males appear markedly in excess at ages 10-14.A possible, but not necessarily correct, explanationwould be a tendency to overstate the ages of boysunder 10 and to understate the ages of boys just past15 years of age. At ages 20-24 and 25-29, both sexesshow deficient numbers, but this deficit is differently
9 These assumptions do not necessarily imply that Turkishmortality has at any time been identical with that of Egypt in~936-19.38, nor that the Turkish popula;tion has always beenmcreasmg at 2 per cent per annum. Provided that the birth ratehas been fairly constant, the stable population selected for thisillustration may still provide a good fit if death rates in thepast have been higher (and the rate of population increase con-sequently lower) or vice uersa.
Table 9
POPULATION OF TURKEY, 1945, BY SEX AND 5-YEAR AGE GROUPS. COMPARISON OF CENSUS
FIGURES WITH STABLE POPULATION
(Numbers in thousands)
MalesFemales
StableStable
Census population Ratio Census population Ratio
Age-grouP (1) (2) (1) :(2) (1) (2) (1) :(2)
TotAL 9,435" 10,148 0.93 9,330- 9.772 0.95
0-4........ ····· . 1,287 1,716 0.75 1,185 1,516 0.78
5-9....... ······ . 1,348 1,334 1.01 1,242 1,180 1.05
10-14.............. 1,285 1,160 1.11 1,074 1,052 1.02
15-19.............. 1,049 1,013 1.03 931 937 0.99
20-24........... ·· . 789 886 0.89 692 831 0.83
25-29........ · ..... 484 768 0.63 619 734 0.84
30-34.......... ··· . 731 662 1.10 700 644 1.09
35-39.............. 607 569 1.25 578 561 1.03
40-44...... ······· . 542 485 1.12 558 487 1.15
45-49 ....... ······ . 401 408 0.98 378 421 0.90
50-54.............. 283 337 0.84 434 360 1.21
55-59.............. 171 271 0.63 219 303 0.72
60-64....... ·.···· . 200 209 0.96 349 250 1.40
65-69......... ···· . 99 152 0.65 125 199 0.63
70-74........ ····· . 80 98 0.81 133 144 0.92
75-79 .............. 30 53 0.58 39 90 0.43
80-84...... ······· . 29 21 1.36 46 43 1.07
85 and over....... · 19 7 2.60 'Zl 20 1.34
" Excluding persons of unknown age.
37

~ Excess of census figure
c:J Deficit of census figure
MALES
1,500,000 1,000,000 500,000 o 500,000 1,000,000 1,500,000
Figure 2. POPULATION OF TURKEY, 1945, BY SEX AND 5-YEAR AGE GROUPS. COMPARISON OF CENSUS FIGURES WITH A
STABLE POPULATION
distributed in the two cases. The deficiency in the caseof females is about the same at ages 20-24 as at 25-29.It could be explained as the result of a birth deficitonly if the birth rate were as much depressed in 19201925 as in 1915-1920, which seems very unlikely. Therelative deficits of males aged. 20-24 and 25-29 couldmore plausibly be accounted for by the possible birthdeficit. The observations tend to confirm that eitherthe ages of many young women were mis-stated tendentiously, or many women in the age-range 20-29were omitted from the census count.
The comparison of the census data with the stablepopulation becomes less and less accurate as we proceed to more advanced ages. It is unlikely that thehypotheses of 1936-1938 Egyptian mortality and anannual rate of natural increase of 2 per cent are realistic for the elder cohorts, who lived under the conditions of a more remote past. Nevertheless, the comparison does not lose all meaning. The consistentdeficit of males above age 45 could be attributable tomilitary casualties during the First World War andthe years immediately following. The alternation of
38

excesses and deficits among females aged oyer 40, onthe other hand, shows once more the attraction of agesending in zero.
ANALYSIS OF RATIOS COMPUTED FROM THE DATA
For the examination of the accuracy of age statistics,it is useful to compute sex ratios for each age category,and ratios for each sex separately" between the numbers reported in adjacent age categories. These ratioscan be defined in several ways. In the present context,we shall define the "sex-ratio" as the number of malesper 100 females in the same age class; and the "ageratio" as 100 times the number of persons in a givenage class divided by the arithmetic average of numbersin the two adjoining age categories. Sex-ratios should'ordinarily change only very gradually from .one age toanother, as they are determined mainly by the sex ratioof births and sex differences in mortality at variousages. Age-ratios should ordinarily deviate very littlefrom 100, except at advanced ages or as a result ofmajor fluctuations in past birth rates.'? The variationsin sex-ratios and age-ratios computed from groupedage data, which may occur as a result of age misstatement or for other reasons, have been studied bythe Population Branch of the United Nations.P
HI Migration and military casualties may disturb the normalpatterns of sex-ratios and age-ratios.
Sex-ratios and age-ratios, computed by single yearsof age from the data of the. Turkish census of 1945,are shown in table 10. It will be noted that the sexratios are invariably low at those round ages. uponwhich the reports tend to be concentrated, and high atother ages, the reason for this being more frequentmis-statement of ages of females than of males. Itwould also appear that the enumeration of female infants was less complete than that of male infants, aswitnessed by high sex-ratios at ages 0 and 1. Age-ratiosreflect in a certain way the relative powers of attractionof certain figures of age; up to age 18, these ratiosare very similar for males and females. At ages above20, the attractive force of round figures is usuallyseveral times as great in the case of females as in thatof males. At advanced ages, the reports for males arealmost as erratic as for females.
Ratios of numbers reported at certain digits of agemayor may not reveal any tendencies which existtowards overstatement or understatement of age. Forexample, one may compare, for each age which is amultiple of 10, the numbers of persons reporting the
11 See "Accuracy tests for census age distributions tabulatedin five-year and ten-year groups", United Nations, PopulationBulletin, No.2, October 1952, pp. 59-79. For a study of theeffect of inaccurate age statements on sex ratios, see also LouisHenry, "La masculinite par age dans les recensements", Popu..lotion, 3' annee, no. 1, 1948.
Table 10
SEX-RATIOS AND AGE-RATIOS COMPUTED FROM SINGLE-YEAR AGE DATA OF THE TURKISH CENSUS, 1945'
Aae-ratios Age-ratios Age-ratiosSex- Sex- Sex-
Age ratio Males Females Age ratio Males Females Age ratio Males Females
0 .......... 117 33.......... 178 98 96 66.......... 149 39 181. ......... 111 93 93 34.......... 182 45 22 67.......... 137 90 862.......... 105 103 105 35.......... 76 301 688 68.......... 111 127 1543.......... 104 102 105 36.......... 166 56 29 69.......... 130 16 74.......... 108 90 88 37.......... 182 73 63 70.......... 50 985 24815.......... 107 115 115 38.......... 131 152 209 71. ......... 123 19 86.......... 106 100 102 39.......... 177 42 12 72.......... 120 129 1397.......... 111 82 79 40.......... 60 399 1399 73.......... 139 101 908.......... 107 159 168 41. ......... 239 43 13 74.......... 134 25 149.......... 116 46 44 42 .......... 187 122 140 75.......... 66 563 1049
10.......... 115 258 266 43 .......... 196 102 98 76.......... 116 35 2111.......... 123 37 35 44 .......... 190 42 21 77.......... 134 72 61
Ii
12.......... 123 192 191 45.......... 78 317 773 78.......... 109 166 19313.......... 123 82 81 46.......... 189 55 25 79.......... 114 10 514.......... 118 77 76 47.......... 188 76 65 80.......... 57 1616 3089IS.......... 112 149 155 48 .......... 136 144 191 81.......... 104 13 716.......... 114 85 85 49.......... 170 28 9 82.......... 119 131 12217.......... 115 73 67 50.......... 45 479 1806 83.......... 123 86 8718.......... 99 171 223 51. ......... 170 37 11 84.......... 120 25 1719.......... 150 50 27 52.......... 138 118 137 85.......... 75 671 93720.......... 71 193 508 53.......... 147 94 89 86.......... 93 27 2221.......... 241 70 25 54.......... 142 41 18 87.......... 97 88 8622.......... 137 113 162 55.......... 52 310 781 88.......... 102 114 10923.......... 160 100 90 56.......... 125 57 28 89.......... 96 9 624.......... 156 59 25 57.......... 148 79 65 90.......... 59 2155 326925.......... 49 224 667 58.......... 118 141 186 91.......... 84 9 626.......... 133 62 27 59.......... 169 22 6 92.......... 99 134 12827.......... 140 77 63 60.......... 41 613 2489 93.......... 112 89 8228.......... 101 141 221 61.......... 163 32 9 94.......... 116 24 1429.......... 184 31 12 62 .......... 139 107 122 95.......... 63 546 89230.......... 64 366 1248 63.......... 153 109 104 96.......... 95 37 2731.......... 244 48 15 64.......... 159 33 15 97.......... 113 86 6532.......... 170 126 152 65.......... 62 442 1095 98.......... 81
• The sex-ratio is here defined as the number of males of a given age per 100 females in the same age group j the age-ratio isdefined as the number of persons of a given age group per 100 of the mean of numbers of the two adjoining age groups, of thesame sex.
39

preceding age (terminal digit 9) with t~e ~umb~r reporting the next subsequent age (terminating 10 1),by taking the ratio of those reporting age 9 to thosereporting age 11; of those reporting age 19 to thosereporting 21 et cetera. If it can he presumed that alarge part of age mis-statements are by one year only,then a l:endency to overstate age might result in larger
numbers reported with terminal digit 1 than withterminal digit 9; conversely, a tendency toward understatement might be reflected by a low ratio of numbersat ages ending in 1 to numbers at ages ending in 9. Itmust be understood, however, that these ratios are alsoaffected by various other forms of age errors. From theTurkish data, the following ratios are obtained.
M a Ie s Females
RlJlioof RanD of"umber at "umber at
Precedi"g age (x-I) Followi"g age (x+l) age (x-I) age (x-I)Ages which are to fI."Jmber 10 "umbermultipl;"so qf 10 Number Number lSIage at age
(x) Age reported Age reported (x+l) (x+l)'
10.................. 9 161,884 11 133,109 1.3 1.320................ ,. 19 131,855 21 149,548 0.9 1.430.••...•••..•.•.... 29 61,159 31 103,311 0.6 0.840.................. 39 49,995 41 72,579 0.7 0.950............•..... 49 29,677 51 36,309 0.8 0.860•.•..•.•••..•.•..• 59 16,212 61 23,288 0.7 0.7
• Ratios computed in the same manner as in the case of males.
18 Census of India, 1921, Vol. I, Part I, Report by J. 'F.Marten, Calcutta, 1924, pp. 126-127.
rather than age-accuracy in a wider sense. Since notall age mis-statements result in statements at preferreddigits, and since digit-preference can be present whetheror not age mis-statements have any directional tendencies, a measure of digit-preference should be interpreted with some reservations, The method mentionedabove employed by the United Nations staff is sensitiveto both tendentious mis-statement and digit-preference,but has other defects which will be discussed.
Whipple's index
This index is obtained "by summing the age returnsbetween 23 and 62 years inclusive and finding whatpercentage is borne by the sum of the returns of yearsending with 5 and °to one-fifth of the total sum. Theresult would vary between a minimum of 100, representing 110 concentration at all, and a maximum of 500,if no returns were recorded with any digits other thanthe two mentioned't.P The choice of 23 and 62 as thelimits of the age band to be examined is arbitrary buthas been found most suitable for practical purposes.
For the male and female population of Turkey as ofthe 1945 census, Whipple's index can be computed asfollows (numbers in thousands) :Age Males Females Age Males Females
If high ratios in this case really indicate the prevalence of age understatement, and low ratios indicateoverstatement, it appears that ages were understatedaround age 10 and overstated around ages 30, 40, SOand 60. This interpretation is at best only partly correct. Relatively greater depletion of numbers at age 11than at age 9, for instance, is probably in part a resultof the strong attraction of age 12.
The differences between the ratios obtained for thetwo sexes are noteworthy. The ratio for females ismuch higher than that for males around age 20, an ageat which women may readily be suspected of a desireto appear younger than they are; For ages 30 and 40,the female ratios are only slightly higher than the male,and for ages SO and 60 the ratios for the two sexes areequal. Around ages SO and 60, male and female sensitivities with respect to age may be nearly the same.The computation of sex-ratios and age-ratios for fiveyear age groups constitutes the basis of a method developed by the United Nations staff for examining theaccuracy of age statistics.P It is useful to computeboth ratios and examine them critically, particularlyif there is some difficulty in constructing a stable population or some other expected age distribution withwhich the census data can be reasonably well compared.In the case of the 1945 Turkish census, analysis of thesex-ratios and age-ratios, for five-year groups, wouldyield essentially the same conclusions reached by thecomparison with the stable population.
MEASUREMENT OF AGE-ACCURACY BY MEANS OFAN INDEX
It is of some interest to measure age-accuracy by anindex for comparative purposes to establish, for example, whether the age statistics of one census aremore accurate than those of another, whether there aregreat differences in age-accuracy between the urbanand rural population et cetera. In the following, fourmethods of computing an index will be presented. Eachof these methods has certain advantages and certainshortcomings. In particular, it is to be noted that threeof these methods measure the extent of digit-preference
12 Loc. cit. See also pp. 42·43, infra.
40
23 12324 '" 9225-29 48430-34 73135-39 60740-44 54245-49 40150-54 28355-59 17160 12161.......... 2362.......... 23
Sum, 3,601ages 23-62
Index for males5 X 1.577 _ 2190
3,601 - .
7759
6197005785583784342192971417
3,950
25 19130 30135 28340 24445 20150 15855 7860 121
Sum, 1,577agesmultipleof 5
Index for females5 X 2.703
3,950 = 342.2
393471373409260350150297
2,703

'P tg
Similar computations for the combi~ed population ofTurkish cities with more than 30,000 inhabitants yieldan index of 146.3 for males and 223.3 for females. Forthe total of Turkish provincial and district capitals, theindex is 165.8 for males and 292.8 for females. For theremainder of the country's population, which is mainlyrural, the index amounts to 238.8 for males and 364.6for. females.
For purposes of comparison, the results of similarcomputations for other areas are shown below.
Bengal, 1901: United States:Males ..••......... 7:17.3 1880 .............. 144.8Females ........... 292.3 1890 . ............. 131.3
Russia, 1897 ......... 175.2 1900 . ............. 119.8USSR, 1926 ......... 159.1 1910 ................ 120.9
Brazil, 1940: 1920 .............. 115.7Males ............. 143.3 1930 .............. 115.5
Females 153.1 1940 .............. 109.7...........Poland, 1921 ........ 134.8 Sweden, 1920 ........ 100.4
Whipple's index is a very effective measure of ageaccuracy so far as digit preference is concerned, andhas the advantage that it can he computed very easily.Its main drawback, apart from measuring digit-preference only, is that it measures the preferences foronly two digits, 0 and 5. As the preference for particular digits may be influenced by linguistic and otherhabits, it is probable that the average degree of preference for 0 and 5 varies among different peoplesthough, in general, these are always the most preferreddigits.
Myers' indexH
This index reflects preferences or dislikes for eachof the ten digits, from 0 to 9. To determine such preferences, one might take successive sums of numbersrecorded at ages ending in each of these digits: such asimple method, however, does not suffice since, WIthadvancing terminal digits of age these sums will tendto decrease (for each successive digit, the populationis one year older than for the preceding one). To avoidthis inconvenience, the first step in Myers' method consists in the computation of a "blended" population inwhich ordinarily almost equal sums are to be expectedfor each digit. This being the case, the "blended" totalsfor each of the ten digits should be very nearly 10 percent of their grand total. The deviations of each sumfrom 10 per cent of the grand total are added together,irrespective of whether they are positive or negative,and their sum is Myers' index.
The method of "blending" and the computation ofthe index are illustrated by means of the Turkish datain table 11. First, the sums of numbers at all agesterminating in each digit are computed for ages 10 andover, and for ages 20 and over. By multiplying theformer with the successive coefficients 1, 2, 3 ... 10(for digits 0, 1, 2 ... 9) and the latter with the successive coefficients 9, 8, 7 ... 0 (for digits 0, 1, 2 ...9) and adding the results, the "blended" population
14 This index is explained by R. J, Myers in "Errors andBias in the Reporting of Ages in Census Data", ActuarialSociety of America. Transactions, Vol XLI, 1940, pp. 411-415.
Table 11
ApPUCATION OF MYERS' METHOD TO AGE DATA FOR MALES, ACCORDING TO TURKISH CENSUS OF 1945
(Numbers in thousands)

for each digit is obtained. As was shown by Myers,all these sums should be very nearly equal if ages arereported accurately. In the present example, they arermrkedly unequal and, by adding together, irrespectiveof s.zn, the deviations from 10 per cent of the grandtotal, an index of 39.3 is obtained.
In the case of the Turkish data, positive deviationsappear only at terminal digits 0 and 5; hence, in thisinstance, the advantage of Myers' over Whipple'smethod is not obvious. There are, however, populations for which positive deviations are also found atother age digits, such as 2 or 8, which would be overlooked if Whipple's index only were computed.
Theoretically, Myers' index can vary from 0 to 180.If ages are reported accurately, all "blended" sums arevery nearly equal and deviations from 10 per cent arenegligible, resulting in an index of almost zero. If allages were reported with the same terminal digit (forexample digit 0), then 100 per cent of the "blended"total would be at this digit; the ...bsolute sum of deviations from 10 per cent would then amount to 180. Thefollowing indices, computed for male populations, provide a few examples of the results which may be obtained from actual observations:
Bengal, 1901 62.6Russia, 1897 20.5Brazil, 1940 16.3Australia, 1933 ..................•.........•........ 4.0Sweden, 1939 ...................................•... L2
Bachi's index1/)
Despite their demonstrated practical usefulness, bothMyers' and Whipple's indices have some minor theoretical defects: it is not possible to formulate the precise theoretical conditions under which Whipple's indexwould be exactly 100 and Myers' index exactly zero.An ingenious method, developed by Bachi, avoids thisdefect. Because the computation of Bachi's index issomewhat more laborious than Myers' method, no detailed example is given in this manual.
Bachi's method consists, in principle, in a repetitiveapplication of Whipple's method, to determine the relative preference given to each of the ten terminal digits.If the age range is suitably selected, very nearly 10 percent of all persons within that age range should beexpected at ages with each terminal digit.. For theoretical reasons, as well as to satisfy practical requirements, the average of total numbers in two age rangesmust be related to the number of persons reporting,within these ranges, the ages with a particular terminaldigit. The following relations are then established:
1. The per cent relationship of age reports at ages30, 40, 50, 60, and 70 to the average of all age reportsin the age ranges 25-74 and 26-75;
2. The per cent relationship of age reports at ages31, 41, 51, 61, and 71 to the average of all age reportsin the age ranges 26-75 and 27-76;
3. The per cent relationship of age reports at ages32, 42, 52, 62, and 72 to the average of all age reportsin the age ranges 27-76 and 28-77;
4. The percentage formed by age reports at ages33, 43, 53, and 63, as well as half the numbers at ages
15 koberto Bachi, "Measurement of the tendency to roundoff age returns", Proceedings of the InterIWtional StatisticalCongress, Rome, 1953.
23 and 73, in the average of all age reports in the ageranges 23-72 and 24-73;
5. The percentage formed by age reports at ages34, 44, 54, and 64, as well as half the numbers at ages24 and 74, in the average of all age reports in the ageranges 24-73 and 25-74;
6. The percentage formed by the age reports atages 35, 45, 55, and 65, as well as half the numbers atages 25 and 75, in the average of all age reports inthe age ranges 25-74 and 26-75;
7. The percentage formed by age reports at ages36, 46, 56, and 66, as well as half the numbers at ages26 and 76, in the average of all age reports in the ageranges 26-75 and 27-76;
8. The percentage formed by age reports at ages37, 47, 57, and 67, as well as half the numbers at ages27 and 77, in the average of all age reports in the ageranges 27-76 and 28-77;
9. The percentage of age reports at ages 28, 38, 48,58, and 68 of the average of all age reports in the ageranges 23-72 and 24-73.
10. The percentage of age reports at ages 29, 39, 49,59, and 69 of the average of all age reports in the ageranges 24-73 and 25-74.
Deviations of percentages from 10 per cent can betaken as indices of preference or dislike for each ofthe ten digits. Bachi's index is then obtained by summing only the positive deviations from 10 per cent(the sum of positive deviations is theoretically equalto the sum of negative deviations). It is, therefore, ofthe order of one-half of Myers' index, with a theoretical range from 0 to 90. In practice, almost thesame results are obtained by both these methods.l"
The United Nations Secretariat methodPThis method consists essentially in the computation
of sex-ratios and age-ratios for five-year groups of ages,up to age 70.18 In the case of sex-ratios, successive differences between one age group and the next are noted,and their average is taken, irrespective of sign. In thecase of age-ratios, for either sex, deviations from 100 arenoted and averaged irrespective of sign. Three timesthe average of sex-ratio differences is then added tothe two averages of deviations of age ratios from 100,to compute the index. This procedure is illustrated,with the Turkish data, in table 12.
This method, unlike the ones described above, isapplicable where single-year age data are not available.The resulting index is not very exact and should beregarded as an "order of magnitude" rather than a precise measurement. Various limitations must be bornein mind when applying this method. Exceptions mustbe allowed for in the case of irregularities arising incertain age groups as a result of real disturbances ofthe population trend, due to such factors as war casual-
16 For a description of the method and presentation of resultsobtained, the reader is referred to R. Bachi, "The Tendency toRound off Age Returns: Measurement and Correction", Bulletin of the International Statistical Institute, Vol. XXXIII,Part IV, pp. 195-222.
17 For a full account of this method, the reader is referredto "Accuracy tests for census age distributions tabulated infive-year and ten-year groups", United Nations, PopulationBulletin No.2, October 1952, pp. 59-79.
18 Sex-ratios and age-ratios as defined on p. 22 supra.

Table 12
COMPUTATION OF AGE-ACCURACY INDEX BY THE UNITED NATIONS SECRETARIAT METHOD FROM STATISTICS OF THE
1945 CENSUS OF TURKEY
Analysis ofAnalysis of
Analysis ofage-ratios
age-ratios
sex-ratios (fIIales)(fefllales)
Reported n..mber SuccessiveDeviation Deviation
Age-grouPMales Females Ratios difference Ratios from 100 Ratio frofll 100
Q,.4..•.......•...... 1,286,705 1,184,799 108.6 110.0 + 10.0
5-9........ ······ .. 1,348,446 1,242,281 108.5 - 0.1 104.9 + 4.9
10-14................ 1,284,952 1,074,080 119.6 + 11.1 107.2 + 7.2 98.8 - 1.2
15-19................ 1,048,701 931,461 112.6 - 7.0 lOLl + 1.1 105.5 + 5.5
20-24................ 789,205 691,680 114.1 + 1.5 103.0 + 3.0 89.2 -10.8
25-29...... ········· .484,328 619,069 78.2 -35.9 63.7 -36.3 89.0 -11.0
30-34........ ······· . 731,283 699,657 104.5 +26.3 134.0 +34.0 116.9 + 16.9
35-39....... ········ . 607,377 578,390 105.0 + 0.5 95.4 - 4.6 92.0 - 8.0
40-44...... ········· .542,301 558,000 97.2 - 7.8 107.5 + 7.5 116.6 + 16.6
45-49....... ········ .401,379 378,499 106.0 + 8.8 97.3 - 2.7 76.3 -23.7
50-54................ 282,856 434,107 65.2 -40.8 98.8 - 1.2 145.2 +45.2
55-59................ 171,162 219,398 78.0 + 12.8 70.9 -29.1 56.0 -44.0
60-64.......... ····· . 199,908 349,207 57.2 -20.8 148.2 +48.2 203.0 + 103.0
65-69...... ········· .98,664 124,606 79.2 + 22.0 70.5 -29.5 51.7 -48.3
70-74........ ······· . 80,007 132,964
Total (irrespective of sign)195.4 209.3 344.2
Mean (total divided by 13)15.0 16.1 26.5
Index (3 times mean difference sex-ratios plus mean 87.6deviations of male and female age-ratios.)
ties, temporary birth deficits, or migratory movementsinvolving mainly certain sex-age groups. For smallpopulations, the measurement is also affected by chancefluctuations. The present example, however, illustratesan advantageous use of the method. The populationof Turkey is large enough to permit neglecting anyeffect of chance fluctuations. Moreover, errors in agestatements are sufficiently pronounced to overshadowwhatever real irregularities of age structure may haveexisted.
The United Nations Secretariat method has theadvantage over the methods of Whipple, Myers andBachi that the index which is obtained is affected bydifferential omission of persons in various age groupsfrom the census count and by tendentious age misstatement as well as by digit-preference and is thereforemore truly a reflection of the general accuracy of theage statistics. Also, it provides an indication of accuracy of the data in the form in which they are usedfor most purposes, that is, in age groups rather thansingle years. The methods applied to date by singleyears of age may in some cases show a fairly largeamount of age mis-statement which has little influenceon the grouped data.
c. Examination of detailed age statistics from twoor more censuses
It is often difficult, as the examples presented abovehave shown, to determine whether irregularities revealed by tests of the age returns from a single censusare due mainly to errors in the data or to real peculiarities of the population structure. When the resultsof two or more successive censuses are available, it isoften possible to clear up these uncertainties even with-
out the use of any more elaborate techniques thanwere described in the preceding section. For example,if the age statistics from a 1955 census of Turkey wereat hand, the possibility of explaining certain irregularities in the 1945 data as the results of birth deficitsor war casualties in the periods 1915 to 1925 and 1940to 1945 would be greatly clarified. If the 1955 figuresshould show the same peculiarities in the age groupsten years higher, but not in the same age groups inwhich they appeared in 1945, there would be a strongbasis for concluding that these peculiarities reflectedthe actual facts, rather than errors.
Still more definite information regarding errors canbe obtained where data from two or more censuses atintervals of a few years are available, by using balancing equations or analagous calculations with thedata for particular cohorts-comparing, for example,the numbers reported at ages 10-14 in an earlier censuswith those reported at ages 20-24 in a census tenyears later. Where data from a series of three or morecensuses are available, the returns may be linked inthis manner over the entire series, with very illuminating results. For the purpose of explairiing the techniques, however, it is sufficient to consider examplesof the use of data from two censuses.
For the sake of simplicity in calculations, exampleswill be taken from censuses taken ten years apart. Thebalancing equation can be applied to any period' ofyears, but it is arithmetically easiest when the intervalis either five or ten years.
Not only the accuracy of age reporting, but also thecompleteness of enumeration of particular age andsex groups can be tested by proper use of the balancingequation under certain conditions which will be described below. On the other hand, balancing equation
43

tests, unlike the procedures described in the precedingsection, cannot often be applied to the age statisticsfor component areas of the country, because of the lack,in most cases, of adequate information on internalmigration. For this reason, the methods to be illustratedhere are useful, generally, only for an entire country,unless adequate data on internal migration are available.
In some countries it may be possible to apply thesetests to the various ethnic groups separately, if ageand sex data are tabulated for such groups and if dataare available on immigration and emigration of thesegroups (or if the groups in question are not substantially affected by international migration.)
For the purpose of this analysis, any particular agegroup can be defined as a cohort: boys under 5 yearsof age, women 50 to 54 years, all persons 10 to 19 yearsof age et cetera, at a given census date. If a secondcensus is taken exactly one decade later, the membersof each cohort will be exactly ten years older at thetime of the second census. In the meantime their numbers will be reduced by deaths and they may be increased or reduced by the balance of immigration andemigration. Ordinarily, mortality is the main factor;if the migration balance is negligible, the change innumbers can be used to compute a survival ratio analagous to that of a life table. For example, the Japanesecensus of 1940 reported 3,670,000 women aged 15 to19 and the 1950 census reported 3,354,000 aged 25 to29. The survival rate between 1940 and 1950 for thiscohort was 3,354,000 divided by 3,670,000 or .913 (onthe assumption that the data were accurate and thatnet migration was negligible).
Computed for one cohort only, such a survival rateoften reveals little, if anything, about the accuracy ofthe statistics. However, a patently absurd result maybe obtained, giving clear evidence of error. For example, an increase in the numbers of a cohort, from onecensus to another, is obviously impossible, unless therehas been a substantial amount of immigration. On theother hand, even under conditions of very high mortality, it is unlikely that a cohort aged, say, anywherebetween 5 and 60 years at the beginning, will be reduced by one-half within a decade.
More accurate judgement is possible if the survivalrates are compared for cohorts of each sex at differentages. Survival rates are functions of age-specific deathrates, and, like these, generally conform to more orless the same pattern of variation from age to agewhether mortality is high or low. The rate of survivalincreases after the earliest years of childhood andusually attains its maximum around age 10; thereafterit declines, at first very gradually, but more and morerapidly as advanced ages are attained. Also, at mostor all ages females have a somewhat higher rate ofsurvival than do males of the same ages. If the hypothetical survival rates computed for different cohortsdeviate significantly from this pattern, and if no explanation, such as migration, can be found, inaccuracyin the statistics must be suspected.
Table 13 presents ten-year survival rates for fiveyear cohorts, according to the life tables of three countries.P The purpose of this table is to indicate theapproximate magnitudes and the general patterns ofsurvival rates which should be expected. In passing,we may observe that the survival rate for women aged15 to 19 according to the Japanese life table of 1947was 0.935, slightly higher than the rate computed fromcensus statistics for 1940 and 1950. Since the 1940-1950period includes most of the Second World War, whenmortality was probably higher than in 1947, the rateo! 0.913 .from the census mate:ial may be quite consistent WIth the rate of 0.935 derived from the life table.Unde~ what conditions can such comparisons of
cohorts 10 successive censuses be made most meaningfully? One condition is either the absence of a substantial net immigration or emigration or full knowledgeabout the age .a.nd sex composition of 'the migrants.A second condition, analogous to the first is that ofconstant boundaries. If the country's boun'daries havechanged between the two censuses so that considerablenumbers of people have been added to or substractedfrom the population, the age and sex composition ofthese people must be known, if the cohort analysis isto give an accurate indication of the accuracy of the
19 Survival ratios computed from a life table are ratios ofthe approximate Le-values in the stationary population.
Toble 13
TEN-YEAR SURVIVAL RATES FOil. FIVE-YEAIl. COHORTS, BY SEX, ACCORDING TO LIFE TABLES OFTHREE COUNTll.IES
.Age .AgeaI al Thaila ..d 1941/1948 !apa.. 1941 MeJrico 1930
1Ieg........g e..d 1.of decade decD e Males Females Males Females Males Females
Ot04 10to 14 0.952 0.954 0.851 0.8515t09 15to 19 0.952 0.957 0.971 0.972 0.927 0.929
10to 14 20to 24 0.950 0.956 0.952 0.955 0.926 0.93015to 19 25to 29 0.936 0.941 0.925 0.935 0.906 0.91320to 24 30to 34 0.921 0.926 0.915 0.929 0.891 0.89925to 29 35to 39 0.907 0.915 0.916 0.931 0.878 0.88730to 34 40to 44 0.890 0.904 0.914 0.929 0.861 0.87735to 39 45to 49 0.867 0.895 0.903 0.923 0.838 0.86540to 44 50to 54 0.839 0.883 0.878 0.908 0.811 0.84245to 49 55to 59 0.806 0.861 0.834 0.880 0.778 0.80550t054 60to 64 0.767 0.823 0.762 0.834 0.730 0.74755to 59 65to 69 0.710 0.768 0.660 0.760 0.665 0.65860to 64 70to 74 0.623 0.687 0.538 0.655 0.571 0.54365to 69 75to 79 0.405 0.519 0.451 0.41570to 74 80to 84 0.274 0.361 0.329 0.299
44

r
statistics. A third condition is identical coverage ofthe population at the two censuses. For example, if theentire male population is enumerated in one census, butthe military are excluded at the second, the age cohortsinvolving the military cannot be compared without asuitable adjustment, unless the number of the militaryis negligible. If nationals living abroad are included inone census, and excluded from another, and if the numbers involved are large, especially if they are concentrated in any particular age or sex groups, this typeof analysis is invalidated.
In the case of a country of immigration, under certain circumstances a cohort can be compared at twocensuses even if migration data are lacking. If thenative population (that is to say, persons born in thecountry) are known not to have emigrated in important numbers, the age and sex data can be tabulatedby nativity, and comparisons of the two censuses limitedto the native population. This point will be illustratedsubsequently with data for the United States.
It should be noted that such survival rates can becalculated over any age span and time interval. Thoseshown in table 13 were calculated for a ten-year spanof ages; but they can be calculated for single years,five-year, fifteen-year, or twenty-year periods, or whatever length of time is desired. A ten-year period wasselected for the above illustrative purposes because the
actual census survival rates, which will be discussed below, were obtained from censuses taken ten years apart.
To illustrate the application of this test, six countries were selected, in each of which two censuses hadbeen taken a decade apart, and the data had been tabulated by five-year age groups and sex, So that it wasarithmetically simple to calculate ten-year survival ratesfor each of the age and sex groups. If the censuses hadbeen less than ten years apart, or if the data had beentabulated by age groups of varying size (for example,some groups of five years, some in single years, andsome of ten years) the arithmetic would have beenmuch more complicated.
Example of Egypt, 1937 to 1947
Table 14 and figure 3 show survival rates computedfrom the age distributions of the Egyptian censuses of1937 and 1947. The first observation is that in fourcases for the males, and in two for the females, the survival rate is higher than 1.00. The following possibilities must be considered: (a) net immigration into Egyptin those particular age and sex groups; (b) errors inthe 1937 census, and (c) errors in the 1947 census.Actually, there is no evidence of immigration into Egyptsuch as would explain these ratios, and the conclusionfollows that the 1937 or 1947 census data, or both, forthe cohorts mentioned were considerably in error.

1.2
0.2
0.4
1. 01---~~--__i~4--....;--+-------------------1
OL-_.l.-_...L.-_-'-_-L.._--I.._--L_---.JL-_.l.-_...L-_..I...._-L.._--I.._-..L__L-_.l.----J0-4 5-9 10-14 15-19 20-24 25-29 30-34 35-39 40-44 45-49 SO-54 55-59 60-64 65-69 70-74 75 and over
10-14 15-19 20-24 25-29 30-34 35-39 40-44 45-49 50-54 55-59 60-64 65-69 70-74 75-79 80-84 85 and over
Figure 3. TEN-YEAR SURVIVAL RATES FOR MALE AND FEMALE COHORTS COMPUTED FROM EGYPTIAN CENSUS DATA FOR 1937 AND 1947
Examination of the entire pattern of survival ratesreveals considerable irregularity. For example, amongmales 5 to 29 years old the rates were:
Between ages 5 to 9 and 15 to 19 0.888Between ages 10 to 14 and 20 to 24 0.657Between ages 15 to 19 and 25 to 29 0.961
Furthermore, between ages 50 to 54 and 60 to 64, thesurvival rate (0.763) was higher than the rate betweenthe ages of 10 to 14 and 20 to 24 (0.657) and higherthan between the ages of 35 to 39 and 45 to 49 (0.714).
Among females also the survival rates form an irregular pattern.
Comparison of the survival rates for males and females reveals that in four instances the rates are higherfor the males. Although not impossible, this is improbable. As stated previously, higher mortality rates, andconversely lower survival rates, for females than formales may occur during the child-bearing ages in somecountries having very high birth rates and high maternalmortality rates. Examination of the four instances inwhich the female survival rates were lower than thosefor males, reveals that only two of these were in thechild-bearing ages; other explanations would have to besought at least for the other two deviations; errors inthe data are strongly suggested.
In table 14, the rates are also shown for ten-year cohorts. The results reveal some smoothing of the irregular pattern previously observed. Nevertheless, for twomale cohorts, and one female cohort, the rate is overunity. For one cohort-between ages 25 to 34 and 35to 44-the rate for females is lower than that for males;this is during the child-bearing period.
In summary, it must be concluded that the patternsof survival rates obtained by comparing the two censusesare so irregular, particularly in comparison with thepatterns observed in other countries, as to imply a highdegree of inaccuracy in the data. Further investigationwould be required to arrive at definite estimates of theamounts of the errors and explanation of their causes(age mis-statements or under-enumeration in eachcensus).
Example of Honduras, 1940 to 1950
Survival rates, calculated from census data by thesame method as in the case of Egypt, are shown intable 15 for Honduras, the Philippines, Portugal,Thailand and Turkey. The rates for four of thesecountries are also presented in figure 4.
For Honduras, as for Egypt, the first observation isthat for four cohorts for the males and six for the fe-
46

Table15
SURVIVAL RATES OF 5-YEAR AND 10-YEAR COHORTS COMPUTED FROM CENSUS DATA FOR FIVE COUNTRIES
Five-year cohorts Honduras P"ilip~nes Portugal Thailand Turkey
. A~e at Age at 1940·1950 1939-1948 1940·1950 1937·1947 1935·1945
be~nning end ofMales Females Males Females Males Females Males Females Males Females
of decade decade
0- 4 10-14 0.966 0.918 0.988 0.979 0.952 0.971 0.928 0.927 0.898 0.828
5- 9 15-19 1.016 1.034 0.783 0.875 0:945 0.991 0.940 0.980 0.866 0.826
10-14 20-24 0.973 1.078 0.935 1.048 0.928 0.963 0.883 0.965 0.930 0.927
15-19 25-29 0.913 0.958 0.894 0.908 0.894 Qo.920 0.871 0.905 0.867 1.274
20-24 30-34 0.912 0.885 0.718 0.753 0.833 0.877 0.876 0.871 0.976 1.093
25-29 35-39 1.050 0.984 0.860 0.821 0.916 0.941 0.912 0.877 0.977 0.802
30-34 40-44 1.000 1.020 0.824 0.822 0.926 0.952 0.833 0.826 0.928 0.869
35-39 45-49 0.977 0.977 0.815 0.780 0.914 0.934 0.813 0.858 0.825 0.743
40-44 50-54 0.933 1.046 0.689 0.742 0.901 0.940 0.751 0.814 0.874 0.916
45-49 55-59 0.985 1.031 0.588 0.618 0.853 0.905 0.753 0.788 0.705 0.697
50-54 60-64 1.115 1.147 0.847 0.766 0.812 0.875 0.682 0.666 0.885 0.908
55-59 65-69 0.870 0.910 0.639 0.612 0.754 0.842 0.565 0.572 0.609 0.638
60-64 70-74 0.660 0.755 0.456 0.509 0.600 0.672 0.357 0.472 0.456 0.447
65-69 75-79 0.415 0.441 0.496 0.588 0.290 0.410 0.303 0.370
70-74 80-84 0.718 0.797" 0.538 0.565 0.323 0.415 0.256 0.337 0.266 0.303 b
75andover 85andover 0.385 0.351 0.149 0.211 0.230 0.257
Ten-year cohorts5-14 15-24 0.995 1.055 0.847 0.947 0.937 0.977 0.914 0.974 0.892 0.866
15-24 25-34 0.913 0.924 0.808 0.835 0.866 0.901 0.873 0.889 0.929 1.171
25-34 35-44 1.026 1.000 0.845 0.821 0.921 0.947 0.875 0.853 0.953 0.843
35-44 45-54 0.956 1.009 0.764 0.764 0.908 0.937 0.786 0.839 0.845 0.826
45-54 55-64 1.043 1.083 0.691 0.683 0.834 0.891 0.722 0.732 0.792 0.813
55-64 65-74 0.773 0.838 0.542 0.559 0.680 0.760 0.469 0.528 0.529 0.523
65-74 75-84 0.718 0.797· 0.465 0.498 0.425 0.515 0.279 0.383 0.280 0.322 4
75andover 85 andover 0.385 0.351 0.149 0.211 0.230 0.257
"Ratio of numbers aged 75 and over in 1950 to those agede Ratio of numbers aged 75 and over in 1950 to those aged
65 and over in 1940. 65 and over in 1940.
b Ratio of numbers aged 80 and over in 1945 to those aged 4 Ratio of numbers aged 75 and over in 1945 to those aged
70 and over in 1935. 65 and over in 1935.
T
males, the survival rates are above unity. The questionarises, whether immigration during this decade of persons in these particular age and sex groups could haveproduced this result.
The second observation is that the survival rates areall very high in comparison with those for the othercountries shown. If there was considerable immigrationat all ages or the death rate was unusually low in Honduras, these rates might be correct.
Comparison of the rates for the two sexes revealsthree ages at which the males have higher survivalrates. Two of these are in the child-bearing period.
The above short analysis is presented as an illustration of the procedure for detecting suspicious figures.Actually, the explanation for these unusual survivalrates is that the 1950 census data were adjusted forunder-enumeration whereas the 1940 figures were notso adjusted. Comparison of the unadjusted 1950 censusdata with those of 1940 reveals a much more plausiblepattern of survival rates. More details are given inappendix C.
Example of the Philippines, 1939 to 1948
In only one instance is the survival rate above unity,namely, for females between the ages of 10 to 14 and20 to 24. The pattern of decreasing survival rates withincreasing age is not as regular or smooth as would beexpected in a life-table population, but nevertheless,more regular than in the case of Egypt.
Comparison of the rates for males and females revealsseven cohorts in which the males had higher rates.
When the data are combined into ten-year groups, thepatterns become much more regular; with increasingage the survival rates become progressively smaller.There is only one exception, among men between theages of 15 to 24 and 25 to 34; this rate is lower thanthat of the preceding or following ages. One possibleexplanation for this lower rate is that it may have resulted from military casualties during the Second WorldWar. There was considerable fighting in the Philippinesand many men were killed; the group of men 15 to 24years of age in 1939 probably would have been moreinvolved in such fighting than other age groups.
Comparison of the rates for the lO-year cohorts ofmales and females reveals three cases in which the maleshave higher survival rates. This fact suggests that theremay have been differences in the completeness of enumeration of males and females at either or both of thecensuses. Such differences, of course, may have comefrom mis-statements of age. They could have resultedalso from:
(a) More under-enumeration of males than of females in 1939;
( b) More under-enumeration of females than ofmales in 1948;
(c) Over-enumeration of males in 1948 or of femalesin 1939;
(d) Any combination of the above.
47
~.i

l.5---.....,-----..---....,...-----, 1.5 ....---.,......--..,-----,--~--,
,..FEMALES, \
,-J \
0.5
FEMALES,\
HONDURAS, 1940-1950 PHILIPPINES, 1939-1948
40-4450-54
0L-__--l ....l-__--:-..1---~
from 0-4to 10-14
OL-__~----,.....1---~I.-:---......J
from 0-4to 10-14
1.5 ..----.-----,......---,......-----,1.5 r-----r-----r-----r---.--,
~
:\FEMALES, \, \I \
0.5
"FEMALES'\
\\\\
MALES\'
"\\\\\\
PORTUGAL, 1940-1950 \ TURKEY, 1935-1945
60-6470-74
40-4450-54
20-2430-34
0~L...__--l-:----....l-----:-..1---~
from 0-4to 10-14
from °0-L.4_-~-1.::":""---~---~---...Jto 10-14
Figure 4. TEN-YEAR SURVIVAL RATES FOR MALES AND FEMALES COMPUTED FROM CENSUSES OF
HONDURAS, THE PHILIPPINES, PORTUGAL AND TURKEY
48

Survival rate ()'/Jer decade
COMPUTATION OF SURVIVAL RATES FROM AGE 5 AND OVER
TO AGE 15 AND OVER
It is useful mainly as a check on the completeness ofenumeration, to compare the population aged 5 and overat the earlier census with those aged 15 and over at thelater census, in the six cases which have been chosen asexamples. In the absence of migration the latter groupshould be the survivors of the former. These ratios, bysex, are presented below:
One observation is that the rates for Honduras areunusually high in comparison with the other countries.In fact, they are so high that they are impossible, unlessthere was a large volume of immigration.
Among the other countries the survival rates, foreach sex separately, do not differ greatly. Among malesthe highest rate is 0.850 in Portugal and the lowest is0.785 for the Philippines. Among women the range isfrom 0.875 to 0.819.
There are no hard and fast rules regarding the amountof variation that is possible for this survival rate givenaccurate data. Purely as a rule of thumb, the rates inmost cases can be expected to fall within the range ofabout 0.800 to 0.900. If a rate is very much above orbelow these limits, it can be taken as an indication ofprobable errors in the census which should be investigated further.
USE OF THE BALANCING EQUATION
V~rious ~orms of the balancing equations have beenconsidered m chapters I and II. In those instances theterms of the equation were so arranged as to bring ~ostclearly into relief the effects of inaccurate census enumeration, incomplete birth registration, or errors in theregistration of deaths, as the case might be. Anothertype of balancing equation can be used as a refinementof the comparisons of survivors in a given cohort whichhave be.en disc':lsse~ in the preceding pages. Instead ofcomputm~ a,n implied survival rate and attempting toevaluate It, m. the case of each cohort, actual statisticsof deaths are introduced and so a better basis for comparing numbers at the two censuses is obtained. Foreach cohort, the balancing equation can then be expressed by the formula:
P1=Po - D + I - E
whe;e Po is the n?mber in the given cohort at theearlier census, PI IS the number in the same cohortat the more recent census, D is the number of deaths tomembers of the cohort during the census-interval I isthe number of. immigrants of relevant sex and ag~, and~ that of emigrants of such sex and age, during theinterval,
Actually, few countries have the required migrationdata by age and sex. Accordingly, in most cases it isnecessary to ignore the migration components andreduce the equation to :
Fetn4les
0.8740.9890.8190.8750.8520.844
Country Males
Egypt 0.830Honduras....... 0.959Philippines 0.785Portugal 0.850Thailand . . . . 0.822Turkey 0.850
Example of Thailand, 1937 to 1947
Examination of the survival rates for Thailand byfive-year age groups reveals approximately the samedegree of regularity observed in the case of the Philippines. There are no instances in which the survival ratesare above unity. On the other hand, in five instancesthe rates for the males are higher than those for thefemales.
Combining the ages into ten-year categories smoothesout some of the irregularities. In only one cohort is therate lower for females, the cohort which was 35 to 44years of age-still in the child-bearing period-in 1947.
Pending further investigation it can be concludedtentatiyely that the age data for this country are perhapsnot quite as accurate as those for Portugal, but perhapssomewhat better than those of the Philippines.
Example of Turkey, 1935 to 1945
There are two instances in which the five-year survival rates are over unity, both among females. Also,there are eight instances in which the survival rates formales are higher than those for females.
The rates fluctuate from one age cohort to the nextmore than they do in the cases of Portugal and Thailand.
Combining the data into ten-year groups does notsmooth the patterns of survival rates very much. Thereis still one cohort with a rate over unity, and four inwhich the rates for males are higher than those forfemales.
Comparisons of the Turkish patterns of census survival rates with those observed in some of the othercountries, and with the expected patterns, indicates thatthere were large errors and that the quality of the datamay be similar to that of the Egyptian material. Bothmis-statements of age and differences in the completeness of census enumeration in 1945 and 1935 may beinvolved.
Example of Portugal, 1940 to 1950
There are no instances in which the survival rates areover unity, and no instances in which the rates for themales are higher than those for the females. In general,the survival rates for each sex decrease with advancingage, except for slight deviations in the middle ages.
Examination of the data for 10-year cohorts suggeststhat there is only one cohort which deviates sufficientlyto attract attention; this is the cohort aged 15 to 24 in1940 and 25 to 34 in 1950. The survival rates for thisgroup, both for males and females, are lower than thosefor the preceding or following age groups. This couldhave resulted from emigration of members of these particular cohorts, or from the errors in the census. It isdesirable to investigate the former possibility by reference to migration data.
In summary, Portugal is a good illustration of acountry in which the census survival rates follow theexpected life-table pattern reasonably well. Additionaltests of the Portuguese age statistics can be made; oneof these tests is the application of the balancing equationto be described subsequently.
49

P1=PO - D.The remarks made previously regarding the limi
tations of cohs rt analyses where migration has takenplace are applicable here,
In addition to the effects of migration not taken intoaccount, failure of the equation to balance can be dueto any of the following factors or combinations of them:
1. Differences in completeness of the two censusenumerations, with respect to the cohort in question,
2. Age mis-statements at one or both of the censuses,3. Incompleteness of death registration,4. Mis-statement of ages at death.Knowledge and good judgment are important in
determining the relative weight of these factors in eachinstance. The results of other tests applied to the censusenumerations and vital statistics are especially helpful.For example, if a direct check of the death statisticsshows that registration is nearly complete and that thereporting of ages at death is not subject to such errorsas would greatly affect the balancing equation, any sizeable errors can be attributed to the census figures alone.In the case of incomplete death registration or erraticreporting; of ages at death, if estimates of the amounts oferror frohI these sources can be made, on the basis ofresults of checks or otherwise, the figures for deathscan be corrected before they are used in the balancingequation. The same remarks apply, of course, to knownerrors in the census figures, where the equations areused to check death registration in the various agegroups.
There are also some general considerations which arehelpful in identifying the sources of errors. In the firstplace, errors due to both under-enumeration in thecensus and under-registration of deaths will usuallyconform to a predictable pattern of differences fromage to age and between the sexes. The probability ofomission from the census is likely to be particularlygreat in the case of very young children, and there maybe some other sex-age groups for which the probabilityof omission is also high for reasons that will be knownto persons familiar with the census operations and thereactions of respondents in the country concerned(young men subject to military service, young womenof marriageable age, et cetera). With these exceptions,the amount of under-enumeration is likely to be similarfor different sex-age groups, though it may well varysomewhat with sex and age, and the changes from oneage group to the next will ordinarily not be very large.The same generalizations apply to under-registration ofdeaths. Consequently, if the discrepancies shown by thebalancing equations change abruptly from one cohort tothe next, mis-statement of ages, rather than underenumeration, is likely to be the main cause of thesevariations. Age mis-statements are especially indicatedif the discrepancies for successive cohorts are alternatelypositive and negative.
There is likely to be a relationship between mis-statements of ages in the census records and on death certificates. Although the frequency of mis-statements maynot be the same in the two types of records, the patternof their incidence in various age categories is likely tobe similar, at least in the cases of mis-statements due tonegligence or ignorance of the correct age. However,any errors in the reporting of ages on death certificates
50
will usually have much less effect on the balancingequations than errors in the census returns. Even withina period of ten years, only a minor fraction of eachcohort, unless of advanced ages, is expected to die. Ifcompleteness or accuracy of age statements in deathstatistics is comparable to completeness and age-accuracyat the census count, the errors which the death statisticsintroduce into the balancing equations are fractional ascompared to the census errors.
The effects of migration depend on the character ofthe migration. Migration for economic motives oftenaffects particularly the cohorts of young men. Differenttypes of migration may, however, vary as to their incidence by sex and age. The probable sex-age pattern ofmigration can usually be determined roughly, evenwithout a complete statistical measure, by analysingavailable sources of information on the characteristics ofthe migrants and reasons for their migration.
Example of PortugalData for Portugal will be used to illustrate the use of
balancing equations in the test for the accuracy of agereporting, for selected five-year age cohorts. These dataare the age and sex distributions from the 1940 and 1950censuses, and the deaths during this decade, as reportedby age and sex.
The discussion of the accuracy of death registrationin Portugal'" seemed to show some indication that deathreporting was not entirely complete. For the purposeof this example, however, no attempt has been made tocorrect the death statistics. Also, it was assumed forthis illustration that there was no migration, althoughit is known that there was some net out-migrationduring the decade. The method is illustrated with thefollowing data for the cohort of males aged 5 to 9 yearsin 1940:
Number reported in 1940 census 428,000Number 15 to 19 years reported in 1950census 404,400Apparent inter-censal decrease 23,600Number of deaths during decade reported to
cohort 10,600Residual (excess of inter-censal decrease over
number of reported deaths) 13,000
Table 16 presents the results of such calculations forselected age groups, for males and females separately.
There is considerable variation in the size of the residuals for the various age-sex cohorts shown. Forexample, the residuals are relatively small for thecohorts aged 50 to 54 years in 1940; among males theresidual amounts to only 2.1 per cent of the apparentinter-censal decrease, and among women to 8.3 per cent.On the other hand, among females aged 5 to 9 in 1940,the residual is greater than the inter-censal decrease, andamong males aged 5 to 9 in 1940, the residual amountsto 55.0 per cent of the reported inter-censal decrease.
How important are these residuals? Are they so smallthat they can be ignored for most analytical purposes?What are the sources of the errors? There is no simpleand decisive answer to these questions. In arriving atany final judgements it is necessary first of all, to introduce any data available on the numbers and age andsex composition of migrants during this decade. Itmight be, for example, that the residual of 15,800 males
20 See chapter II, pages 26-7.

Table 16
APPLICATION OF BALANCING EQUATION TO SELECTED AGE-SEX COHORTS, FOR PORTUGAL, 1940 TO 1950
(Numbers in thousands)
Age at Ag,at Number enumerated1940 1950
'census ,census 1940 1950
Males5 to 9 15 to 19 428.0 404.4
10 to 14 20 to 24 409.5 380.1
25 to 29 35 to 39 298.3 273.2
50 to 54 60 to 64 154.5 125.5
Females5to 9 15 to 19 410.3 406.6
10 to 14 20 to 24 396.3 381.625 to 29 35 to 39 312.5 294.150 to 54 60 to 64 192.8 168.7
ResjdfH~1
Per cent Per cent of
Inter· Number of jnter· number
censal of deaths censal enumerated
decrea.se reported Number decrea.se jn 1950
23.6 10.6 13.0 55.0 3.2
29.4 13.6 15.8 53.7 4.2
25.1 16.0 9.1 36.2 3.3
29.0 28.4 0.6 2.1 0.5
3.7 9.5 5.8 156.8 1.4
14.7 11.7 3.0 20.4 0.8
18.4 12.3 6.1 33.2 2.1
24.1 22.1 2.0 8.3 1.1
observed in the cohort aged 10 to 14 years in 1940would disappear if emigration were taken into account;or it might become negative. On the other hand, it is alsopossible that the introduction of migration statistics intothe equations would increase the residuals for cohortsaged 50 to 54 in 1940.
It should be noted that for some cohorts the residualis only one or two per cent of the number counted inthe census. For most purposes to which the censusdata might be put, such differences are small enoughto be ignored. Residuals which amount to four or fiveper cent or more, on the other hand, may have a significant effect upon the results of some types of analyses.
Example of Thailand
Several times in this manual reference has been madeto the fact that children under 5 years of age are almostuniversally under-counted in censuses. For an illustration of the use of balancing equations to investigateunder-enumeration in this age group, the following dataon male children in Thailand will be used:Number under 5 enumerated in the census of 1937.... 1,230,500Number 10 to 14 enumerated in the census of 1947.. 1,142,000Apparent inter-censal decrease 88,500Reported number of deaths during decade to cohort
under 5 years of age in 1937 ····.. 118,400Residual (excess of deaths over apparent inter-censal
decrease) ..........•.......•......•...•......... 29,900
The true excess of deaths over the inter-censal increase was probably greater than that shown above sincethe previous analysis (in chapter II) indicat~d theprobability of under-registration of deaths. One estimate" was that only 74 per cent of the deaths duringthe decade had been registered. Applying this proportion to 118,400 provides an estimate of about 160,000for the true number of deaths during the decade tochildren who were under 5 years of age in 1937. Ifthis were correct, the residual-the excess of deaths overinter-censal decrease-would be about 71,500.
What other errors could account for the residual?They may be listed as :
(1) Undercount in 1937 census of children under 5years of age;
21 See chapter II, page 26.
(2) Overcount of children 1947 census aged 10 to 14;(3) Age mis-statements in 1937 so that some chil
dren under 5 were returned as 5 to 9 years old;(4) Age mis-statements in 1947 so that some chil
dren under 10 or 15 and over were returned as aged10 to 14.
More than one of these errors probably occurred tosome extent, but what is the likelihood that the firsterror was the most serious and of the largest size?Further testing beyond the scope of this manual wouldbe required to establish the size of each type of error.Such testing should take into consideration all availabledata, both published and unpublished, which the technicians in the country can obtain, together with any additional knowledge of whatever social and economicfactors may be particularly important in the countryconcerned.
Example of the United States
Data are available for the United States for thedecade 1930 to 1940 which are useful for illustratingapparent discrepancies in the two census counts. Thesedata and the relevant calculations (shown in table 17)are for native white males. By limiting the analysis tothe native group any possible distortions which mightbe introduced by migration are largely avoided since,by and large, very few natives emigrated. There wereno ?oundary changes and no war to disrupt the comparison.
Instead of death statistics, which are known to havebeen somewhat incomplete, a life table constructed bythe national statisticians was used; this life table includescorrections for under-reporting of deaths. The numberof deaths in each cohort during the decade was estimatedby calculating life-table survival rates on the basis ofthe L, figures. These values (shown in column (b) oftable 17) were obtained by dividing the sum of L, foreach five-year age group by the sum of L, for the group10 years younger.
The findings are as follows:( 1) There was an under-enumeration of children
under 5 years of age in 1930. The number enumeratedin 1930 was 5,036,900 whereas the number 10 to 14years in 1940 was enumerated ali 5,231,900. Altogether
51

Table 17
ApPLICATION OF BALANCING EQUATION, BY MEANS OF LIFE-TABLE SURVIVAL RATIOS, TO CENSUS AGE DISTRIBUTIONS OF UNITED STATESNATIVE WHITE MALES, 1930 AND 1940."
(Numbers in thousands)
Survival ExpectedDiscrepancy
Enumerated rate number Enumerated As per centAge in 1930 1930-1939 in 1940 in 1940 Absolute of enumerated
(years) (a) (1)) ( c) (d) (e) (f)
oto 4 ...................... 5,036.9(0 years) ................. (965.2) (0.96272)(l year) .................. (960.3) (0.97707)(2 years) ................. (1,023.0) (0.98124)(3 years) ................. (1,046.6) (0.98332)(4 years) ................. (1,041.9) (0.98439)
5 to 9 ...................... 5,497.3 0.98432
10 to 14 ...................... 5,265.8 0.97838 4,926.0 5,231.9 +305.9 + 5.815 to 19 •••••••••••••••••••• 0' 4,907.3 0.96131 5,411.1 5,433.5 + 22.4 + 0.4
20 to 24 ...................... 4,346.9 0.96805 5,152.0 5,014.7 -137.3 - 2.725 to 29 ...................... 3,731.8 0.96131 4,769.9 4,698.4 - 71.5 - 1.5
30 to 34 ...................... 3,408.6 0.94920 4,208.0 4,230.3 + 22.3 + 0.535 to 39 ...................... 3,278.8 0.93063 3,587.4 3,724.2 +136.8 + 3.740 to 44 ...................... 2,771.5 0.90232 3,235.4 3,338.4 +103.0 + 3.145to49 ...................... 2,411.9 0.86278 3,051.3 3,025.7 - 25.6 - 0.8
50 to 54 ...................... 2,092.8 0.80819 2,500.8 2,568.4 + 67.6 + 2.655 to 59 ...................... 1,670.6 0.73120 2,080.9 2,054.2 - 26.7 - 1.3
60to64 ...................... 1,305.3 0.62691 1,691.4 1,659.2 - 32.2 - 1.965 to 69 ...................... 944.8 0.49318 1,221.5 1,314.2 + 92.7 + 7.170 to 74 ...................... 690.0 0.33944 818.3 873.2 + 54.9 + 6.375 to 79 ...................... 376.6 0.19590 466.0 487.8 + 21.8 + 4.580to84 ...................... 165.8 0.09118 234.2 25M + 16.2 + 6.585 to 89 ...................... 57.0 0.03263 73.8 81.8 + 8.0 + 9.890 to 94 ...................... 11.7 0.00772 15.1 17.3 + 2.2 +12.795 to 99 ...................... 1.9 1.9 2.9 + 1.0 +34.5
100 and over .................. 0.3 0.1 0.3 + 0.2 +66.7Unknown ...................... 36.5
Totals
All ages ....................... 48,010.1 43,445.1 44,006.8 +561.7 +1.320 years and over .............. 33,108.0 33,341.4 +233.4 + 0.7
• From A. Jaffe, Handbook of Statistical Methods for Demographers, U. S. Bureau of the Census, Washington 1951, p. 91.
an estimated 305,900 native white male children appearto have been omitted from the 1930 census.
(2) In 1940 there appears to be a deficit in the cohort20 to 29 years old at that time and a surplus in thecohort 30 to 39 years (or 30 to 44 years). This suggests that young adult males may have been missed inboth censuses, an observation which fits in with otherevidence and which could be explained on the theorythat many young men, at the age at which they leavetheir paternal home to seek employment and perhapsto migrate, and before they have established theirfamilies, do not have a well-established place of residencewhere they will be reported by other household membersto the census enumerators. The reasoning is as follows.If, in the United' States censuses there is a tendency toomit males about 20 to 29 years old, but not of men 30to 39 years old, the 1930 count for ages 20-29 is presumably too low, but the 1940 count for ages 30-39should be approximately correct, showing a surplussuch as that observed over the expected survivors of thiscohort. In the 1940 census on the other hand, therewould be again a deficit in the age range of 20 to 29
52
years. On the other hand, young men may have tendedto overstate their ages, with the result that unduly smallnumbers were reported in their twenties and undulylarge numbers in their thirties. If this happened frequently on the occasion of both censuses, the same results would follow.
(3) At the older ages beginning about 65 there appears to be a tendency to exaggerate age in the censusreports, a tendency which seems to increase with advancing age. Its appearance about 65 is probably related to the fact that at this age many persons becomeeligible for old-age benefits.
Comparison of the entire native white male population enumerated in 1930 with that 10 years of age andover in 1940 reveals on the whole but minor discrepancies, as follows:
Number enumerated in 1930 48,010,100Number 10 and over enumerated in 1940 44,006,800Apparent inter-censal decrease 4,003,300Estimated number of deaths during decade to per-
sons alive in 1930 4,565,000Residual (excess of deaths over apparent decrease). 561,700

D. Evaluation of the accuracy of statistics ofdeaths by sex and age groups
Of the total residual over one-half seems to be accountedfor by the presum;d under-enumeration of children in1930. If the balancing equation is applied to the population 10 years of age and over in. 1930.and 20 yearsof age and over in 1940, the resldual lS reduced to233,400,as follows:
The last residual is about 5.6 per cent of the intercensal decrease, and only 0.7 per cent of the enumerated1940 population-too small to invalidate the data formost purposes.
On the basis of a comparison of the 1940 and 1950censuses the United States Census Bureau reportedfinding substantially the same types of errors as described above in the 1950 age and sex statistics."
Errors in statistics of deaths classified by sex and agemay be caused by the same two factors noted in the caseof census returns, namely, mis-statements of age andomissions from the records that are more frequent insome sex-age categories than in others. In the caseof infant deaths there is an additional factor, whichmay be of considerable importance in many areas,namely, failure to follow exactly the prescribed statisticaldefinition of an infant death as distinguished from a stillbirth. The latter error commonly takes the form of reporting as still-born, if not failing to report in any way,infants who are born alive but die very shortly afterbirth.
The balancing equations and analogous computationsdescribed in preceding sections of this chapter can beused to test the accuracy of death statistics, as well aspopulation census returns, by sex and age groups.Valid conclusions with regard to the accuracy of thedeath statistics, however, will only be possible if thecensus data are very nearly accurate, or if the errorsin them have been measured by means of direct checks.In the case of infant deaths it is also necessary to haveaccurate data on the number of births in order to establish an equation which will yield a useful test of deathregistration, and this requirement is not likely to be metwhere the registration of infant deaths is seriouslydeficient.
Various other methods of investigating the reliabilityof statistics of death classified by sex and age groups,and of data on infant deaths, have been described inchapter II.
E. Direct checks
Direct checks on the completeness of census enumeration and registration of vital statistics such as have beendiscussed in chapters I and II can be used also to testthe accuracy of census and death statistics classified bysex and age groups, and to provide a basis for correcti?nof any errors which may have resulted either from rmsstatement of ages or from omissions varying in frequency within different sex-age categories. This canonly be done, of course, if the independent records,against which the census returns or death registers arechecked, contain reliable information on ages. Whenthe independent record is established by means of aspecial field survey, it is well worth-while to includeinformation on ages in this record and to take whateversteps are feasible to ensure accurate age returns. Ina sample check enumeration of the population, specially selected and trained enumerators conducting moreintensive interviews can obtain more accurate age reports than are obtained in the census; likewise, carefulinvestigation in a house-to-hotlse canvass of deaths mayyield more accurate reports on the ages of decedentsthan are to be found on the death certificates. Notonly the accuracy of age returns, but also the reliabilityof reports on other characteristics of the population andof decedents can be investigated in this manner.
On the other hand, no matter how carefully information on ages may be obtained in the check enumerationor survey, it is always subject in some degree to errorsof the same kind which affect the data being tested. Inparticular. willful mis-statements of age and errors dueto utter ignorance of the persons concerned may affectthe results of even the most carefully conducted check.
A better method of checking age returns is to matchthe census records or death certificates with the birthcertificates of the persons concerned. In a large countrywith a mobile population this procedure may be verylaborious and expensive, even for a small sample ofthe records. Nevertheless, this is the most objectivecheck on the accuracy of age statements which can bemade. In the birth registers, the date of birth will rarelybe mis-stated and. if so, probably only by a few days atthe most. The age of an individual, as computed fromthe date of his birth according to these records, is forall practical purposes exact. This type of check was conducted on the occasion of the 1921 census of NewZealand. The following is an excerpt from the report :23
" ... For the first time an attempt has been made to supplya more or less reliable measure of the extent and incidencegenerally of this assumed inaccuracy (i.e. of age statements).The modus operandi was of the simplest character, comprising little more than the checking of stated ages withbirth registration records. A selection of names and personsof both sexes was chosen, following certain age-divisions.The method employed naturally restricted operations tonative-born New Zealanders. Only those cases were chosenwhere the names and other particulars were such that certainidentification was possible.
"Altogether 2,524 cases were investigated, resulting in theactual testing of 2,219; the remaining 305 cases either could
37,475,90033,341,400
4,134,500
4,367,9004,134,500
233,400
Number aged 10 and over enumerated in 1930 .Number aged 20 and over enumerated in 1940 ..Apparent inter-censal decrease .Estimated number of deaths during decade to per-
sons 10 years of age and over in 1930 .Inter-censal decrease .Residual (excess of deaths) ..
22 United States, Bureau of the Census. 1950 Census ofPopulation, United States Summary, Bulletin P-C 1, p. xiii,Washington, 1953.
23 New Zealand, Census and Statistics Office, Results of aCensus of the Dominion of New Zealand taken for the nightof 17th April 1921. General Report. Wellington, 1925,pp. 93-96.
S3

not be located, or, for one reason or another, could not beidentified beyond doubt.
"The actual sample (2,219) is not a large one, consistingas it does, of only 0.24 per cent of the total native-born.That it is not larger is due to the considerable labour andinconvenience which larger numbers would have involved.Nevertheless the results show much consistency and are ofno little value.
"
"The following summary gives some of the facts in briefand shows that there exists a slight tendency to overstatethe age of minors, whether male or female, and that misstatement is much more common with adults. Adult femalesare not greatly less accurate than males in the matter ofstating ages; where, however, there is no defined tendencyin the male figures, those for females show a decided preference for understatement."
Ad,dls MinlWs
Number Percent Number Per cent
Males:Correctly stated ...... 392 76.41 567 94.82Understated ......... 62 12.09 3 0.50Overstated ........... 59 11.50 28 4.68
Females:Correctly stated ...... 352 68.75 568 95.30Understated ......... 115 22.46 7 1.18Overstated ........... 45 8.79 21 3.52
The ages reported in the census death records mayalso be compared with the ages or dates of birth statedin other records, for example, social insurance records.Likewise, for a sample of persons enumerated at onecensus, it is possible to examine ages returned at anothercensus, either prior or subsequent. This was done inNew Zealand for persons reporting advanced ages, andit was found that a large proportion of them hadexaggerated their ages.
54

CHAPTER IV. ADEQUACY OF MIGRATION STATISTICS
Previous chapters have presented tests for the accuracy of census data and of birth and death.statistics.The remaining component nee~ed for mea~unng 'p0p~lation change is that of migration. Accordingly, m thischapter, tests will be presented for appraismg the adequacy of migration statistics.
The term "adequacy," rather !han .accura~y .or completeness, is here used because migration statistics oftenpresent peculiar problems other than mere a~curacy ~fcount, arising from the definition of c~t~gones of. rmgrants to which they apply. The statistics sometimesrefer only to certain types of migrants; in this case theymay be accurate and y~t inadequate as a me~sure ofpopulation change resulting fro~ a~l movements mt~ andout of the given area. Other stansncs, relevant to migration, do not measure it directly. For example, censusdata on internal migration obtained by asking questions on place of birth or place of residence at a statedprevious date do not measure the movements themselves but their residual effects on population distribution. Here the question of adequacy involves the sufficiency of the information given for a correct evaluationof the actual movements during a given time intervalfor which population estimates are desired.
It is beyond the scope of this manual to investigatethe accuracy with which each of the various types ofmigratory movements is recorded. The tests consideredhere are designed to examine whether the availablemigration statistics furnish an adequate account of thosegains or losses which accrue to a population as a resultof migratory movements of all kinds.
Migration has relevance only in connexion with aspecific geographic area; this can be either an entirecountry or territory, or a subdivision thereof. In eithercase, the essence of migration is the crossing of someboundary. By combining the migration statistics withthe census and vital statistics for the population livingwithin the given boundaries, the required populationestimates are made for the specified geographic area.In case the census and vital statistics are recorded on ade facto basis, that is, with reference to the populationactually present within the area at the census date andthe vital events taking place in that area, it is desirablethat the migration statistics refer to all persons whocross the boundaries, but in practice it is not always easyto record all movements. On the other hand, in themore usual case .of de jure statistics referring to residents of a given area, it would seem more appropriateto have statistics of migrants who cross the boundariesin order to take up residence within the area, excludingvisitors, et cetera. The problem of who should and whoshould not be countecl is then not an easy one. Forthese reasons there are no easy tests for the completenessof migration counts. The problem can be seen moreeasily if two types of migration, international and internal, are separately examined.
A. Adequacy of international migration statistics
In the migration statistics compiled in many countries,an attempt is made to differentiate between "permanent"and "temporary" immigrants and emigrants.' Wherethis is done, the category of "permanent" migrants ~eemsin general to be appropriate, from a conceptual point ofview for use in estimating changes in the de Jure population. However, the proper classification of each migrant, or traveller, under either of these two cate!?ories,'is rarely obvious and there are many problems m thedefinition of these, as well as other classes, of personscrossing a country's boundaries. The actual definitionsof particular classes of migrants used for statisticalpurposes in most countries are the result of variousforms of legislation concerning migratory movements,which are rarely alike in any two countries. It is notthe purpose of this chapter to examine these problemsof legislation and definition, but only to investigatewhether the existing migration statistics, such as theyare, furnish a reasonable measure of the amount of population gain or loss resulting from any form of migration.
The statisticians of each country, being familiar withthe definitions of migration statistics currently in useand knowing generally whether the categories of migrants covered most of the important movements, willbe able to judge whether the. migration statisticsirrespective of their accuracy-are adequate for thepurpose of population estimates. If definitions andcoverage are not adequate, there is little need to investigate the accuracy of the data, so far as the present purpose is concerned.
USE OF THE BALANCING EQUATION
The balancing equation can sometimes be adapted fortesting international migration statistics. The particularadaptation to be made in a given situation is dependentupon the nature of the statistics which a country has, themain types of migration which occur, and the availability of the required census and vital statistics. However, unless the other components of the equation arehighly accurate, the balancing equation as applied tothe total population and its change during the intervalbetween two censuses will not yield a very useful indication of the accuracy of the migration component. This isso, because migration is almost always the smallestcomponent in the equation; hence errors which are smallin proportion to the other components loom large inproportion to migration. For example, an error in thecensus count which amounts to one-tenth of one percent is generally small enough to be ignored in so far
1 United Nations, Problems of Migration Statistics, Population Studies No.5, 1949. Recommendations for the collectionand classification of migration statistics will be found in UnitedNations, International Migration Statistics, Statistical Papers,Series M, No. 20, 1953.
5S

as the census count is concerned; this same error however may be larger than the recorded migration. Inother words, a residual due to very minor errors in theother components, might give a false impression of amajor error in the migration component.
For illustrative purposes, a balancing equation willbe shown for the foreign-born population of the UnitedStates, in order to appraise the migration statistics forthe decade 1940 to 1950. This form of the equation isjustified by the fact that the United States is a countryof immigration, and that very few of the native population or of the naturalized foreign born emigrate.What emigration does occur is mostly of persons whowere not born in the country and are not citizens thereof,that is to say, previous immigrants who subsequentlyemigrate. The equation is :
P1=Po-D + I-E
where Po= foreign-born population at the 1940 census,P1 = foreign-born population at time of 1950 census,D -= number of deaths to foreign-born in inter-censalperiod, I = number of immigrants, E = number ofemigrants.
Births are not taken into account because personsborn in the United States are, of course, natives, eventhough of foreign-born parentage, and so do not add tothe foreign-born population.
Actually the statistics are not available in exactly thedesired form. The numbers of foreign-born personsliving in the country in 1940and 1950are available fromthe census counts, by age and sex. The number ofdeaths to the foreign-born during the 1940's is notavailable; however, it is possible to estimate how manydeaths occurred by assuming that the foreign-born hadthe same death rates in each age and sex cohort as thegeneral population. The migration statistics show thenumbers of aliens admitted and of aliens who departed,but no data on the movements of naturalized Citizens.Many of the foreign born in the country are naturalized,but since very few of the naturalized emigrate; theomission of their movements does not seriously affectthe balancingequation.
It should be noted that the statistics on migration andcitizenship are highly complicated and it is not possiblein this manual to present a completeaccount of the manytechnical problems connected with their use.
The balancing equation then, can be stated as follows:Foreign-born population in 1950 ................•.. 10,161,000Foreign-born population in 1940 ...........•....... 11,420,000Apparent inter-censal decrease ....•............... 1,259,000Deaths among foreign-born persons who were living
in the United States in 1940, during decade 1940 to1950 (est.) 2,320,000
Aliens admitted during decade 1940 to 1950 .. ..•.... 3,496,000Aliens departed during decade . . . . . . . . . . . . . . . . . . . . . 2,263,000Migratory balance (excess of admissions over de-
partures) 1,233,000Expected inter-censal decrease (net excess of deaths
over migratory balance) 1,087,000Residual (excess of apparent over expected inter-
censal decrease) 172,000
The residual would actually be smaller than 172,000if deaths among those admitted during the decade hadbeen taken into account. Data are not available forestimating with any degree of precision the number of
56
persons admitted after 1940 who died before the 1950census enumeration. Of the 1,233,000 excess of admissions over departures during the decade, perhaps asmany as 125,000 may have died; this number couldaccount for more than one-half of the residual.
In summary, this equation balances out fairly well andleads to the conclusion that the migration statisticswere probably not affected by any very gross errors."
It would be possible to compute a similar balancingequation for' each sex and age cohort separately if thedata were available. The census enumerations of theforeign-born by age and sex are available, but tabulations of the migration statistics in the required age andsex groups are not available.
The equation can also be computed for the immigrantsfrom any given country, and the results may be useful inthe interpretation of the residual for all immigrants.
An example is afforded by the United States censusstatistics for persons born in Puerto Rico who wereliving in the continental United States at the time ofeach census. Another measure of the migration fromPuerto Rico to the continent is afforded by statisticson the numbers of passengers carried to and from theisland by airplanes; there is almost no passenger flowby water transportation j virtually all emigrants fromPuerto Rico go to the continental United States, andnearly all Puerto Rican immigrants to the United Statescome from that island. Under these circumstances it ispossible to calculate the following balancing equation:Persons born in Puerto Rico but living in continental
United States according to census of 1950 226,100Persons born in Puerto Rico but living in continental
United States according to census of 1940 70,000Apparent inter-censal change, that is to say, net
immigration from Puerto Rico during decade 156,100Number of air passengers carried out of Puerto Rico
during decade '.. . . . . . .. . . . . . . . . . . . . . • . . . . . • . . . . . . .. 770,000Number of air passengers carried into Puerto Rico
during decade ............•....•.................. 610,000Excess of passengers carried out 160,000Residual (excess of passengers carried out over appa-
rent inter-censal change) ••.......•..•.••....•..... 3,900
It will be noted that this equation balances out quitewell but not exactly. Part of the reason for the discrepancy is that no information is available on the number ofdeaths during the decade, among those persons whowere born in Puerto Rico but were living in the continental United States in 1940, or migrated to the continent during the 1940's. An approximate estimate ofthe number of such deaths is 5,000 to 6,000. This test,then, suggests that the data on place of birth, so far asPuerto Rico is concerned, do not seem to have seriouserrors.
INTERNATIONAL COMPARISON
A useful check is obtained by comparing the immigration statistics of one country with the emigration statistics of another, and vice versa. Persons leaving country
2 It should be noted, however, that considerable numbers ofMexicans who entered the country illegally' and who would,of course, not have been included in the migration records,may have also been omitted from the 1950 census count orreturned erroneously as natives of the United States. Theseerrors would not be shown by the balancing equation in theform used here.

A to settle in country B should in most cases be identicalwith persons arriving in country B whose origin wascountry A; the exceptions would be births and deathswhich occurred en route, and persons who eitherchanged their intentions while travelling or were notadmitted to country B. If the definitions used for migration statistics in the two countries are very nearlythe same, this comparison can serve to check the accuracy of migration records in either country. Wherethe bask definitions are at variance-which is the moreusual situation-the comparison may still serve as acheck on the adequacy with which the net migratorybalancesare measured.
DIRECT CHECKS
Post-enumeration checks can be made in the samemanner as described previously, in order to ascertainthe accuracy of enumeration of the foreign-born population. Furthermore, during the course of such a checkor at any other time, it is possible to obtain a list ofnames of persons who have entered the country duringa specified period, and to compare this list with thenames of the arrivals officially recorded. This type oftest is exactly the same as that which can be used for adirect check of the completeness of birth reporting.
If the census shows immigrants classified accordingto the year in which they immigrated (as, for example,in the case of Canada), there may be some advantage inmatching the census records with migration records fora particular year of immigration. Naturalization recordsmay also serve as a basis for checking the immigrationrecords. It may be noted that the population of foreignnationality is diminished as a result of naturalizations,a factor which must be taken into account in a balancingequation of the population of foreign nationality.
A direct check on statistics of emigrants is usuallyvery difficult. An individual who has left cannot beinterviewed; only if someone remains to report to afield worker that he left the country can his name beobtained for the purpose of a check.
B. Adequacy of statistics on internal migration
Very few countries collectany current data on internalmigration. The few countries that have done so havecollected these data in various ways, and there are nointernationally "approved" standards for such statistics.Consequently, appraisals have to be devised on an ad hocbasis to fit the type of data which are available in thecountry.
CONTINUOUS POPULATION REGISTERS
In a few countries, notably the Scandinavian countries and the Netherlands, continuous registers of thepopulation are maintained in each locality. An individualrecord is kept for each person, a record being added forevery birth and withdrawn for every death, and therecord is transferred from one locality to another whenthe person changes his place of residence. Internalmigration statistics are provided by tabulations of suchtransfers.
The accuracy of these registers is checked periodicallyby a balancing equation in which the recorded changesdue to births, deaths, and migration are compared with
the changes in the numbers of persons on the registerfor each locality. If the balance is not accurate, apparenterrors are investigated. But even a perfect balance isnot a sufficient guarantee that all the changes whichactually took place have been recorded and that theregister actually corresponds to the present population.One of the shortcomings of population registers is thelack of any sure check on persons who have left thecountry, whose departure may not have been reportedto the registration authorities. Because of these andother errors which may accumulate in the course of timethe registers must be checked from time to time againstindependent records. These are provided by censuses.Comparison of the census returns with registrationrecords provides a check on the accuracy of both, andany errors discovered are eliminated by local investigation.
The details of the procedures are complicated and arenot the same in all countries where continuous registersare kept."
CENSUS STATISTICS RELATING TO INTERNAL MIGRATION
Three types of questions which relate to internalmigration have been asked in various censuses or otherhouse-to-house surveys: place of birth; place of residence at some specifiedtime in the past; and duration ofresidence in the present place. The resulting statistics,though very useful for analysis of internal populationmovements, are subject to important weaknesses. Ofthe three questions, the one relating to birthplace ismost commonly asked; for a person no longer living inthe area where he was born it yields no informationon the time of migration and therefore permits no precise calculation of internal migration during any specified time period. The question on place of residence ata specified time in the past is free of this weakness, butthe results measure only the net effect of movementssince that time. If a person has moved more than onceduring the interval, that fact is not revealed; if he hasmoved away from the place of previous residence andthen returned, even the fact that he has migrated is notrevealed; furthermore, there is no record of the migrantswho have died prior to the time of the census. The question on duration of residence in the present place givesno information on the places of origin of the migrants,apart from such inferences as may be possible if thequestion of birthplace or residence at a specified pastdate is also asked.
In evaluating the adequacy of internal migration dataobtained from censuses, these weaknesses as well asany inaccuracies in the data must be taken into account.Errors of reporting, even though quite frequent, maybe less important than the other weaknesses. The testswhich can be applied vary with the forms in which therelevant census questions are asked.
TESTS OF DATA ON PLACE OF BIRTH
The accuracy of data on place of birth from two successive censuses can be tested, if the required data areavailable, by means of a balancing equation for personsborn in each part of the country. Such an equationtakes the form :
8 The reader interested in further detail may consult thecensus publications of the countries concerned.

I\=Po+B--:"Dwhere Po' and P1 represent the total population born-ina given part of the country according to each of thetwo censuses, B the number of birthk in that part of thecountry during the census interval, and D the numberof deaths, during the interval, to persons born in thatpart of the country. The latter quantity is ordinarilynot given in the statistics, deaths being rarely classifiedaccording to place of birth, but it may be estimated, possibly on the assumption that the death rate for personsborn in the given part of the country is similar to thedeath rate for the whole population in that part of thecountry. The discrepancy obtained may be due to errorsin reporting of birthplace, incomplete enumeration ateither census, incomplete birth registration, error inestimating the number of deaths, or failure to take international migration into account. In some circumstancesequations of this type may be more useful for testing theaccuracy of birth statistics than of census reports onplace of birth.
More useful balancing equations can be made if statistics of the population by place of birth are tabulated byage groups. The data for persons of a given age groupborn in a certain part of the country at one census datecan then be related to the records of births during acertain period of years in the past, corresponding to theage of the group. The equation takes the form:
P1=B-D
Po being zero by definition. This case will be illustratedwith statistics of the United States, for the age groupunder 5 years.
According to the 1950 census there were 77,400persons under 5 years of age living in the United Stateswho were born in the state of North Dakota. If state ofbirth and age were reported correctly, this numbershould correspond to the number of births in NorthDakota during the five years preceding the censusthat is to say, I April 1945 to 1 April 1950-minus thedeaths. The figures are as follows:Number of persons enumerated... 77,400Number of births reported.......................... 78,900
Excess of births 1,500
The number of deaths which occurred among thesechildren during the five-year period is not shown exactlyby the records, since some of these deaths occurred outside North Dakota, while some of the deaths registeredin North Dakota for this age group were to childrenborn elsewhere. The figure for deaths could be estimatedby assuming that the death rate was about the samefor the children born in North Dakota as for thoseresident in North Dakota during the five-year period;on this assumption it would be found that the number ofdeaths was not very different from the excess of birthsnoted above, and the residual representing errors would'be small. To complete the test, several age groups shouldbe tested in the same manner.
58
Still. mo~e illuminating !esults can be obtained by introducing 1OtO the equations for various age groupsdata;Jrom the ~abulations of birth place by age from a~earher census"lf these data are available. For example,let us suppose that the population born in a given partof the country, aged 15 to 19, has been obtained from the1950 census and the number born in the same areaaged 5 to 9, from the 1940 census. These figures ca~be compared with each other and with the recordednumber of births in the given area during the periodfrom 5 to 9 years prior to the 1940 census date byn:eans of the following simultaneous balancing equations :
P2=Pl-D2
P1=B-Dl
where P 2 = number aged 15-19 in 1950, P l = numberaged 5-9 in 1940, D2 = deaths among this cohort, between ages 5-9 and 15-19, during the decade 1940-1950,D, = deaths among the same cohort, between birth andages 5-9, during the decade 1930-1940 B = numberof births recorded during the period 5 t~ 9 years priorto the 1940 census date (circa 1930-1934.)
TESTS OF DATA ON PLACE OF RESIDENCE AT A PREVIOUS
DATE
The accuracy of data on residence at an earlier datecan be appraised by means of balancing equations if thespecified date coincides with the date of an earlier census.
For example, if two censuses have been taken 10years apart, and at the time of the second census allpersons (10 years of age and over) are asked wherethey lived 10 years ago, it is possible to reconstruct thepopulation at ~he earlier ~ensus date for each part ofthe. country, WIth approprI.ate allowances for mortality.ThIS reconstructed population can be compared with thecount obtained in the preceding census, and if the twoare .found. to agree fairly cl<;>sely the data on place ofearlier residence can be considered good. This test canbe made separately for age and sex groups if the censusdata on place of earlier residence are tabulated by ageand sex.
Actually, where questions on place of residence at aspecified previous date are asked in censuses the datechosen is likely not to be that of an earlier census butsome intervening date, so that information is obtainedon internal migration during a particular portion of theinter-censal period.
DIRECT CHECKS
. Direct checks .on the accuracy of returns relating toeither place of birth or place of residence at an earlierdate can be obtained from check re-enumerations forsamples of the population after the census.. Data on pl~ce of birth may also be verified by searchmg for the birth records of a sample of the population.
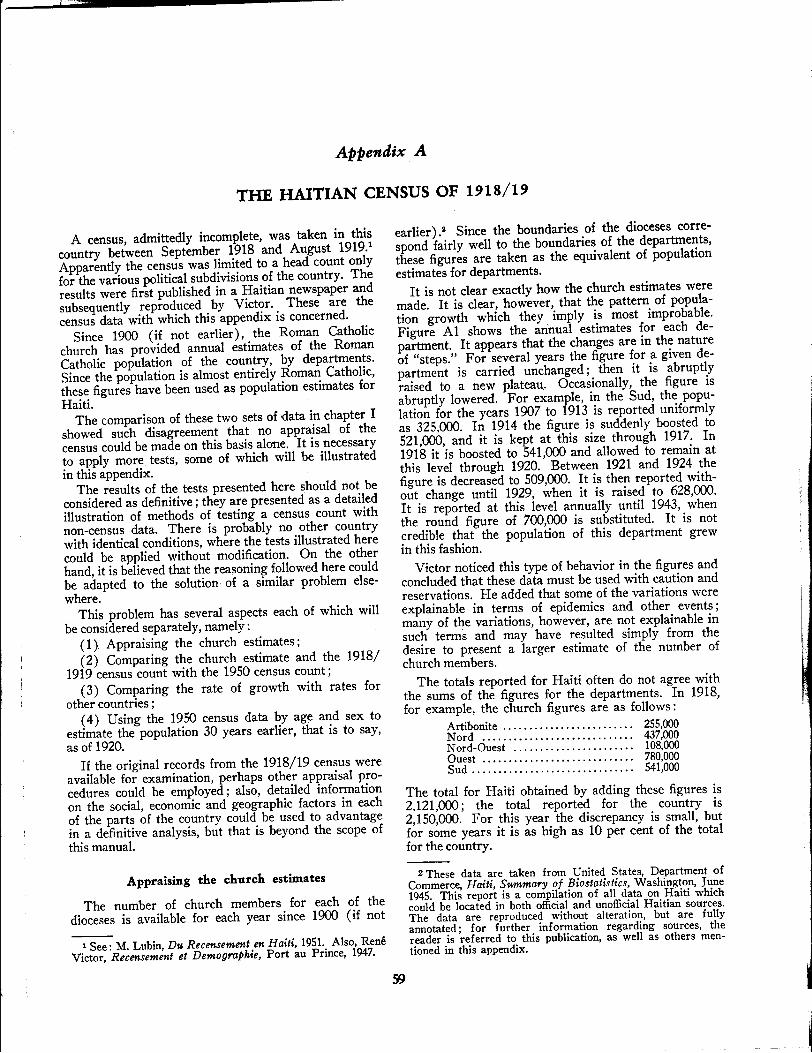
Appendix A
THE HAITIAN CENSUS OF 1918/19
A census, admittedly incomplete, was taken in thiscountry between September 1918 and August 1919.
1
Apparently the census was limited to a head count onlyfor the various political subdivisions of the country. Theresults were first published in a Haitian newspaper andsubsequently reproduced by Victor. These are thecensus data with which this appendix is concerned.
Since 1900 (if not earlier), the Roman Catholicchurch has provided annual estimates of the RomanCatholic population of the country, by departments.Since the population is almost entirely Roman Catholic,these figures have been used as population estimates forHaiti.
The comparison of these two sets of data in chapter Ishowed such disagreement that no appraisal of thecensus could be made on this basis alone. It is necessaryto apply more. tests, some of which will be illustratedin this appendix.
The results of the tests presented here should not beconsidered as definitive; they are presented as a detailedillustration of methods of testing a census count withnon-census data. There is probably no other countrywith identical conditions, where the tests illustrated herecould be applied without modification. On the otherhand, it is believed that the reasoning followed here couldbe adapted to the solution of a similar problem elsewhere.
This problem has several aspects each of which willbe considered separately, namely:
(1) Appraising the church estimates;(2) Comparing the church estimate and the 1918/
1919 census count with the 1950 census count;(3) Comparing the rate of growth with rates for
other countries;(4) Using the 1950 census data by age and sex to
estimate the population 30 years earlier, that is to say,as of 1920.
If the original records from the 1918/19 census wereavailable for examination, perhaps other appraisal procedures could be employed; also, detailed informationon the social, economic and geographic factors in eachof the parts of the country could be used to advantagein a definitive analysis, but that is beyond the scope ofthis manual.
Appraising the church estimates
The number of church members for each of thedioceses is available for each year since 1900 (if not
1 See: M. Lubin, Du Recensement en Haiti, 1951. Also, ReneVictor, Recensement et Demographie, Port au Prince, 1947.
earlier) .2 Since the boundaries of the dioceses correspond fairly well to the boundaries of the departments,these figures are taken as the equivalent of populationestimates for departments.
It is not clear exactly how the church estimates weremade. It is clear, however, that the pattern of population growth which they imply is most improbable.Figure Al shows the annual estimates for each department. It appears that the changes are in the natureof "steps." For several years the figure for a given department is carried unchanged; then it is abruptlyraised to a new plateau. Occasionally, the figure isabruptly lowered. For example, in the Sud, the population for the years 1907 to 1913 is reported uniformlyas 325.000. In 1914 the figure is suddenly boosted to521,000, and it is kept at this size through 1917. In1918 it is boosted to 541,000 and allowed to remain atthis level through 1920. Between 1921 and 1924 thefigure is decreased to 509,000. It is then reported without change until 1929, when it is raised to 628,000.It is reported at this level annually until 1943, whenthe round figure of 700,000 is substituted. It is notcredible that the population of this department grewin this fashion.
Victor noticed this type of behavior in the figures andconcluded that these data must be used with caution andreservations. He added that some of the variations wereexplainable in terms of epidemics and other events;many of the variations, however, are not explainable insuch terms and may have resulted simply from thedesire to present a larger estimate of the number ofchurch members.
The totals reported for Haiti often do not agree withthe sums of the figures for the departments. In 1918,for example, the church figures are as follows:
Artibonite 255,000Nord .................•........... 437,000Nord-Ouest 108,000Ouest 780,000Sud . . . . . . . . . . . . . . . . . . . . . . . . . . . . . . . 541,000
The total for Haiti obtained by adding these figures is2,121,000; the total reported for the country is2,150,000. For this year the discrepancy is small, butfor some years it is as high as 10 per cent of the totalfor the country.
2 These data are taken from United States, Department ofCommerce, Haiti, Summary of Biostatistics, Washington, June1945. This report is a compilation of all data on Haiti whichcould be located in both official and unofficial Haitian sources.The data are reproduced without alteration, but are fullyannotated; for further information regarding sources, thereader is referred to this publication, as well as others mentioned in this appendix.
59

---------------- --~-----
300,000
400,000
250,000
"" 'X
_-"1IIIIX
100,00090,00080,00070,000
60,000
50,000
300,000
250,000
4,000,000 4,000,000
3,000,000__·-x
3,000,000
2,500,000 2,500,000HAITI, Total
2,000,000 2,000,000
1,500,000 1,500,000
1,000,000 DEPARTMENTS: ......X1,000,000-900,000 900,000
800,000 800,000700,000 _--X 700,000
600,000.... X
600,000
500,000 I -r 500,000I
400,000 I 400,000
SudX
300,000 300,000
250,000 250,000
200,000 200,000
........X150,000 .",. 150,000
200, 000 '--_ _'__--&._--1I--_...L-_-L._--'__""-_-'-_-Io__~_ _'___ 200,0001900 1905 1910 1915 1920 1925 1930 1935 1940 1945 1950
The census results for Haiti and depanments are indicated on the chart by X
Figure Al. ANNUAL POPULATION ESTIMATES, 1900-1944, FOR HAITI AND DEPARTMENTS,AND CENSUS RESULTS, 1918/19 AND 1950
60

This type of error is mainly important in so fa~ asit suggests that the figures were not carefully compliedand that all of them may be subject to error. ~ach ofthe totals for a department presumably was ob~a~~ed byadding its component parts, and the possibility ofarithmetic errors in these sums has to be considered.Those who compiled the figures were apparently notmuch concerned with accuracy. Perhaps approximateestimates were sufficient for church purposes, but t~esefigures cannot be accepted as accurate standards againstwhich to evaluate the census count of 1918/19. Thefact that the two sets of figures do not agree cannotbe taken as proof that the census count was wrong.
Comparing the church estimate and the 1918/19census count with the 1950 census count
This comparison can be ma~e department by department, in an effort to determine whether one of theearlier sets of figures seems more reasonable than t~eother in light of the 1950 census count. Such a comparison is shown in table AI.
The two sets of earlier data show entirely differentrates of change when co~par~d with the 1950 c.ensuscount, except for the Art~bomte. In the Nord, It appears that the population Increased by 111 per cent onthe basis of the 1918/19 census, but only 23 per centon the basis of the 1919 church data. Which is morenearly correct? The answer should be sought by evalu.ating the indicated chang~s in t~e. ligh~ of known social,economic and geographic conditions In each of the departments. This analysis is beyond the scope of thepresent manual.
Comparison of rate of growth with that of othercountries
The annual geometric rate of increase shown by the1918/19 census and the 1950 census is 2.1 per cent;the rate indicated by the church estimate for 1919 andthe 1950 census is 1.2 per cent. For comparison, therates of growth in neighbouring Caribbean areas were:Dominican Republic (1920 to 1950) 2.9Jamaica (1921 to 1953) 1.7Other British West Indies (1921 to 1946) 1.2Cuba (1919 to 1943) 2.1French West Indies (1921 to 1946) 0.5
Since both rates for Haiti fall within the range ofrates found in the neighbouring islands, the results ofthis test are inconclusive.
Estimation of 1920 population from 1950 census data
Given the 1950 population by age and sex, and a setof mortality rates, it is possible to work backwar.ds andestimate the population of Haiti in 1920, of which thepopulation in 1950, aged 30 years and over, were thesurvivors."
The age and sex distribution of the. ~aitian population in 1950 is available, but the statistics by age aremarkedly inaccurate. Numbers reported at ages under 5,for example, appear much too small and, in the absenceof any other explanation, it must b~ presumed .that theenumeration of children was very Incomplete In 1950,and this suggests the possibility that there were important omissions also in the enumeration of adults. Inaccurate enumeration of children does not affect our computation, since only the persons aged 30 ye~rs ~nd overare relevant to an estimate of the population In 1920;however, if the adults were under-enumerated, the1920estimate may be too low.
A set of mortality rates for the period 1920-1950 isnot available from Haitian sources. Accordingly, it isnecessary to select a set of rates from among the lifetables available for various countries. Mexico as of1930 was chosen as a country which had about thesame age composition of population as Haiti in 1950,where the level of economic development and healthfacilities, though probably superior to those of Haiti,were not g-rossly different, and for which a life tablewas available. The life table of some other countrymight have been used equally well, but the Mexicanlife table will serve for illustrative purposes.
Thirty-year survival rates were obtained from theMexican life table and applied to the 1950 Haitian ageand sex composition. These procedures can be illustrated very briefly as follows. For males, according tothe life table, the survival rate between azes 20 to 24 and50 to 54, is 623 per 1,000. In 1950 in Haiti there were51,300 men aged 50 to 54 years; this number dividedby 0.623 provides an estimate of 82,300 males aged20 to 24 in 1920.
These calculations were carried through for each fiveyear age and sex cohort, and the results summed. Withthe addition of suitable estimates for the highest agegroups in 1920, from which there were few or no
S The census as of 1918/19 was taken about 31 years priorto the 1950 census. The 1950 data could have been projectedbackwards 31 years, but the computations are much simplerto make for a period of 30 years and the results are goodenough for illustrative purposes.
Table Al
COMPARISON OF THE 1950CENSUS COUNT WITH ESTIMATES FOR 1919 FOR HAITI, BY DEPARTMENTS
(Numbers in thousands)
Per cent 'ncrease up to 1950 from
1950 1918/19 1919 church 1918/19 1919 churchDepartment cetlS1U census estimate census estimate
Artibonite ••......• 569 241 255 136 123Nord ............. 540 256 437 111 23Nord-Ouest 168 78 108 115 55.......
1,095 671 780 63 40Ouest ..•..•••..•..Sud 740 385 541 92 37..............
TOTAL 3,112 1,631 2,121 91 47
61

survivors in 195Q4, an estimated population in 1920 of1,900,000 is obtained. This should be reduced, to allowfor increase from 1918/19 to 1920, to perhaps 1,850,000,which is intermediate between the 1918/19 census countand the 1919 church estimate. It must be admitted thatthis estimate is subject to a rather wide margin oferror. So far as it can be trusted, it suggests that thecensus figure is too low and the church estimate toohigh. A figure as low as the 1918/19 census count could
4 These estimates are necessarily rather arbitrary, but theage groups concerned are too small to have an important effecton the result.
62
be accepted as roughly correct only on the assumptionthat Haitian mortality was much lower than that indicated by the Mexican life table. This life table gives anexpectation of life at birth of about 33 years; if theexpectation for Haiti had been as high as 45 yearsduring the period in question-that is, about the sameas for Trinidad and Tobago in 1930-1932-the 1950and 1918/19 censuses would be reconciled; but this ishighly improbable. Acceptance of the 1919 church estimate, on the other hand, would imply either extremelyhigh Haitian mortality, at least equal to that of Indiafor a comparable period. or a gross under-count of theadult population in the 1950 census.

Appendix B
THE RELIABILITY OF CENSUS DATA FOR LIBYA1
A check on the accuracy of the census figures for1931and 1936 is provided by a comparison of the annualrates of growth (geometric mean) of the native population during the interval for major geographical divisions of the country (table 1).
Table 1INTERCENSAL INCREASE OF de facto NATIVE POPULATION
BY REGIONS, 1931-6Table 2
TOTAL de facto NATIVE POPULATION OF LIBYA 1931 COMPAREDWITH THOSE AGED 5 YEARS AND OVER IN 1936
ported by a comparison of the total native populationby sex for 1931 with the corresponding population aged5 years and over in 1936. The percentage reduction offemales, which should reflect in the main intercensalmortality if the data were accurate, is much lower thanthat of males (table 2).
Differenc,Populafion
An_al ferc,ntag,,.at, 0 f"DWth
(g,om""C _a..)PoptdlJlion
1936 1931
1931 1936 Nwmber P".cenlag,Libya .Tripoli .Misurata .Benghazi and Derna"..Libyan Sahara .
732,973343,093203,922137,58248,376
654,716296,946182,953136,21538,602
2.32.92.20.24.6
TOTAL 654,716
Males ..... 341,984Females '" 312,732
623,848
322,691301,157
30,868
19,29311,575
4.7
5.63.7
Table 3
Source: Italy, VIII Censimento generale della popolazione... , vol. v, pp, 24-5, 1939.
The population figures by sex and age groups alsoshow evidence of errors. They are available only for
2 As appears in a table (Appendix, table 3) of the work cited.
Differences in the numbers of persons enumerated in1931 and 1936 as nomads and semi-nomads in variousdistricts also suggest the possibility of errors in enumeration. . . .2 The figures for certain districts showfairly large numbers of nomads or semi-nomads in1936 where none were enumerated in 1931 andvice versa. To be sure, the differences may b~ duepartly to changes in the application of the terms" d" d'" d " hi h hnoma an semi-noman, w IC were rat er looselydefined, or perhaps to errors in the identification ofg~ographical areas, but they suggest the possibility thatSIzeable groups of these people were omitted from theenumeration in 1931 or 1936, or in both censuses. Eventhe figures for whole provinces, as given by the twocensuses, seem incon.sistent; they are also contrary tothe generally held VIews that the people of Benghaziand Derna are relatively mobile and that those of theLibyan Sahara are more nomadic than those of thenorthern provinces. The figures by provinces are summarized in table 3.
18.115.46.0
13.710.8
1936
23.635.023.8
4.5
1931
P,,.C"'lag, of nafiv, populafionenumerated (U nomtJd4 Dr' 4nni..._d,
p,.DfJlnc,
Tripoli ..•...................•Misurata .Benghazi ...............•.....Derna .Libyan Sahara ..
• Data for Benghazi and Derna are combined because of largeinterprovincial migration during this period. Source: Vol. v,p.21.
The rate of 0.2% for Benghazi and Derna stands inmarked contrast to the rates for the other regions, reflecting the possibility of higher mortality, lower fertility, and much larger emigration resulting from theItalian military custody of one-third to one-half ormore of the regional population during 1923-35. Thelarge increase in the Libyan Sahara is possibly due tounderenumeration there in 1931. The increase of 3%per year in the province of Tripoli seems hardly possible without heavy immigration. It was alleged thatmany exiles who left the country during 1915-30 returned between 1931 and 1936. Their return may havein part accounted for the rapid increase in the provinceof Tripoli.
A higher rate of increase for females than for malesis shown by the. census figures for natives in all provinces except Benghazi and Derna (see Appendix, table1). For the territory as a whole the figures show aratio of 1094 males per 1000 females among the de factonative population of 1931, 1062 in the de facto population of 1936, and 1075 in the resident native populationof 1936. These figures suggest a relatively greater underenumeration of women than of men in the 1931 census.The departure of exiles prior to the 1931 census andtheir return during 1931-6 does not explain thesefigures. On the contrary, since the exiles must havebeen mostly men the trend of the sex ratios is contraryto that which would have been expected to result fromthese movements.
The hypothesis of relatively greater underenumerationof women than of men in the 1931 census is also sup-
1 Reproduced by permission of the author, from Chia-linPan, "The Population of Libya", Population Studies, Vol. III,No.1, June 1949, pp. 106-108.
63

Under 5 10165- 9 1143
10-14 134415-19 111120-24 88525-29 96830-39 100140-49 99550-59 117360-69 . 115270-79 109380 and over 1083
the resident native population of 1936. The sex ratioscomputed from these figures are presented in table 4.
The ratios for the age groups under 5, 20-24, and25-29 seem to be too low in relation to those of theneighbouring age groups. On the other hand, those forthe group 10-14 and for all groups above 50 seem toohigh. To some extent these variations may be due tomis-statement of ages of men or women; and the continued absence of male exiles at ages 20-29 may help toexplain the ratio for that age. However, the figuressuggest the possibility of serious underenumeration ofmales of ages 20-29 and of females of ages 10-14 and50 and over.
All ages 100.0 100.0
The census data for Italians appear to be much moreaccurate. The distributions by sex, age and maritalstatus for the Italian population are characteristic of apopulation built up mainly by immigration....8
15.314.115.113.4H.711.47.44.72.71.2
Females
Table 5
0- 4 14.55- 9 15.0
10-19 17.620-29 11.630-39 13.740-49 10.550-59 8.160-69 5.170-79 2.780 and over 1.2
Age (years) Males
The proportionate distribution by age of the residentnative population in 1936, which is shown in table 5,suggests underenumeration at ages under 10 and 20-29for both sexes.
Males per 1000 females
Table 4
Age (years)
All ages 1075 3 Data are given in the Appendix (Tables 14-16) of thework cited.
Appendix
Table 1
PRESENT NATIVE POPULATION OF LIBYA, 1931 AND 1936, AND RESIDENT NATIVE POPULATION,1936, BY SEX AND MAJOR ADMINISTRATIVE DIVISIONS
Present populationResident
Administrative P~rcentage pop..lationdivision and se« 1931 1936 Increase 1936
Libya, total ....................... 654,716 732,973 12.0 750,851Males .......................... 341,984 377,416 1Q.4 388,948Females ........................ 312,732 355,557 13.7 361,903
Province of Tripoli ............. 296,946 343,093 15.5 351,774Males ........................ 154,834 174,881 12.9 182,265Females ...................... 142,112 168,212 18.4 169,509
Province of Misurata ........... 182,953 203,922 11.5 213,486Males ........................ 95,109 103,712 9.0 111,230Females ...................... 87,844 100,210 14.1 102,256
Province of Benghazi and Derna", 136,215 137,582 1.0 137,426Males ........................ 72,376 75,079 - 3.7 71,908Females ...................... 63,839 62,503 - 2.1 65,518
Libyan Sahara .................. 38,602 48,376 25.3 48,165Males .•..........•........... 19,665 23,744 20.7 23,545Females .................... 18,937 24,632 30.1 24,620
• Data for Benghazi and Derna are combined because of large inter-provincial migrationduring this period.
64

Appendix C
THE CENSUSES OF HONDURAS
Table ciPOPULATION OF HONDURAS ACCORDING TO CENSUSES TAKEN FROM
1881 TO 1950, AND APPARENT INTER-CENSAL RATES OF INCREASE
Because censuses have been taken at frequent intervals, the population statistics of Honduras provideexcellent material for the application of various methodsfor their appraisal. In this example, i:: is intendedchiefly to show how a series of several successive population counts can be utilized in a tentative evaluation oftheir relative degrees of accuracy. More definite appraisal becomes possible only after application of variousbalancing eqL itions to specific census intervals, as des.cribed in the SEveral chapters of this manual.
The series of census results for Honduras since 1881shown in table C1 is very irregular. If all censuses hadbeen accurate, the series would indicate moderate ratesof population growth in the periods 1881-1887, 19101916, 1916-1926, and 1940-1945; rapid growth in theperiods' 1905-1910, 1930-1935, 1935-1940, and 19451950; extraordinarily rapid growth in the periods 18871901 and 1926-1930 and a decline in the period 19011905. Only very unusual events could have resulted insuch fluctuations of the rate of growth. Actually, it ishighly improbable that all censuses could have beencorrect; if some of them were fairly accurate, someothers must have been very inaccurate.
Date of census
1881 .1887 .1901 .
31 XII 1905 ..18 XII 1910 .18 XII 1916 ..26 XII 1926 ..29 VI 1930 ..30 VI 1935 .30 VI 1940 ..24 VI 1945 .18 VI 1950 ..
Pnpulation
307,289331,917543,841500,136553,446605,997700,811854,184962,000
1,107,8591,200,5421,368,6051>
Apparentannual ratecd increase a
1.303.59
- 2.072.061.521.465.802.412.861.632.66
as they were.' It is not within the scope of this manualto discuss methods for the revision of past estimates.Although the revised figures to Tosco and Mondragonhave been adopted for official purposes, we shall, in thepresent appendix, concern ourselves mainly with theraw census data, which were obtained directly from theadmittedly inaccurate census enumerations,"
The consistency of the census totals
The inconsistency of the series of census results shownin table Cl is very obvious mainly because censuseshave been taken in close succession. The effect of anerror in a census enumeration on the apparent intercensal rate of increase is very large if the census interval is short. For longer census intervals, the calculatedaverage rates of increase are less severely affected byerrors. For example, although both the 1881 and 1950figures may have been in error, the apparent rate ofincrease for the entire period-2.l9 per cent per annum-is plausible and is probably not much in error." Wemay compute apparent rates of increases from the results of any two censuses in order to determine whichfigures could be consistent with one another, and whichnot. In this fashion, by accepting some censuses andeliminating others, we can obtain various series of censusresults which, taken by themselves, would not seem to benecessarily inconsistent.
One such possible series is obtained by acceptingonly the results of the censuses of 1887, 1905, 1910,1916, 1926 and 1945, while rejecting the censuses of1881, 1901, 1930, 1935, 1940 and 1950. Another possible series may include the censuses of 1881, 1910, 1930,1935, 1940 and 1950, while rejecting those of 1887,1901, 1905, 1916, 1926 and 1945. (See table C2.) Apparently consistent series may also be obtained byselecting other combinations of censuses. The censusof 1901, however, cannot easily be fitted consistentlyinto any series. Either the enumeration of 1901 was exaggerated (possibly intentionally) or else most, if notall, of the other enumerations were deficient.
Apparent average annual rate ofincrease, 1881-1950 2.19
• Average annual geometric rates.I>Unrevised result, as obtained from the enumeration.
Aware of these inconsistencies, the statisticians ofHonduras have expressed their doubts as to the accuracy of the most recent census as well as of earliercensuses. Tosco and Mondragon have proceeded toconstruct a series of revised population estimates whichthey consider to be closer to reality than those whichcould be made on the basis of the census results, such
~ ToscC!, M., and Mondr~g6n, R., Analisis dinamieo y econon;~co-soc~al de La poblaCJon de Honduras, Servicio Informatrvo del Banco Central de Honduras y del Banco Nacional deFomento, Tegucigalpa, 1952.
2 The revised census age distribution has been used in theexample. in chap!er III on page 46 for the computation ofhypothetical survival rates. It was found that the revised datafor 1950 were not consistent with the unrevised census agedistribution of 1940.
S This rate may be compared with long-term inter-censalrates of increase for neighbouring areas. For Nicaragua, from1906 to 1950, the apparent rate amounts to 1.70 per cent perannum; for Costa Rica, from 1864 to 1950, 2.23 per cent perannum; for Panama, from 1906 to 1950, 2.48 per cent perannum; for Cuba, from 1899 to 1950, 2.45 per cent per annum'and for Mexico, from 1921 to 1950, 2.04 per cent. '
6S

Table C2
ApPARENTLY CONSISTENT SERIES OF SELECTED CENSUS RESULTSFOR HONDURAS, 1881-1950
The first alternative suggests population growth at adeclining rate until 1926, followed by very rapid growth.
Dote of census
First alternative1887 .
31 XII 1905 .18 XII 1910 ..18 XII 1916 .26 XII 1926 .24 VI 1945 .Second alternative
1881 .18 XII 1910 ..29 VI 1930 ..30 VI 1935 .30 VI 1940 .18 VI 1950 .
Populationenumerated
331,917500,136553,446605,997700,811
1,200,542
307,289553,446854,184962,000
1,107,8591,368,605
Apparent annualrate qfincrease
2.242.061.521.462.95
2.012.252.412.862.14
A possible explanation for this mode of growth mightbe the political disturbances from which Honduras suffered during the first quarter of the present century.The second alternative, which seems more plausible,portrays a gradually accelerating trend, which might beaccounted for by a gradual fall in mortality rates owingto improving knowledge in matters of health and personal hygiene; after 1940, however, there follows anunexplained drop in the rate of growth.
Consistency of census results with vital statistics
A series of the numbers of births and deaths registered in Honduras, beginning with the year 1910, isavailable.' There are minor gaps in this series, the figures not being available for the years 1917, 1922, 1924and 1932; the missing figures can, however, be easilyinterpolated without the risk of any major error (theseries being, on the whole, fairly smooth). Since migration was probably of small numerical importance in mostyears, these figures probably suffice for balancing equations of the total population in each of the census intervals beginning with 1910.
Table C3
ApPARENT INTER-CENSAL INCREASES AND APPARENT EXCESS OF BIRTHS OVER DEATHS IN EACHCENSUS INTERVAL, HONDURAS, 1910-1950
Discrepancy
ApparentPer cent
Apparentqf census Per c"'t qf
exceS$ totot at apparentinter-censal of births end of inter-censot
Census interval increase over deaths Amount period inc1'ease
1910-1916 .............. 52,551 60,126 - 7,575 - 1.25 -14.41916-1926 .............. 94,814 lll,435 - 16,621 - 2.37 -17.51926-1930 .............. 153,373 52,474 100,899 11.81 65.81930-1935 .............. 107,816 81,645 26,171 2.72 24.31935-1940 .............. 145,859 100,880 44,979 4.06 30.81940-1945 .............. 92,683 110,239 - 17,556 - 1.46 -18.91945-1950 .............. 168,063 162,924 5,139 0.38 3.1
-- -- --1910-1950 .............. 815,159 679,723 135,436 9.90 19.9
The interpretation of these balancing equations depends mainly on the assumptions made with regard tothe accuracy of the vital statistics. Three assumptionscan be made, namely: (a) that the vital statistics wereaccurate; (b) that the vital statistics, though inaccurate,were of comparable accuracy throughout the periodfrc 1910 to 1950; and (c) that the accuracy of vitalstat•. .ics has improved in the course of time.
Assumption (a) would favour the interpretation thatthe censuses of 1945 and 1950 were fairly accurate or,if incomplete, were both incomplete to nearly the sameextent. On the same assumption, the 1940 census wouldbe somewhat more complete, but earlier censuses considerably less complete. The latter conclusions arereached by calculating backward the population according to the observed natural increase. For example, ifthe population in 1950 was 1,368,605, and the naturalincrease of the past 40 years was 679,723, then thepopulation of 1910 should have been 688,882, whereasthe census of 1910 reported 553,446. The 1910 census,then, would grossly be deficient. On the other hand, thecensus of 1901 would then appear more acceptable thanit appeared at first.
Assumption (b) is more likely if we are inclined tobelieve that the census of 1910, and some of the subsequent ones, though perhaps not very accurate, were notas grossly in error as would follow from assumption(a) . If, during the entire 4O-year period, populationactually increased by 815,159, as implied by the censusesof 1910 and 1950, but a natural increase of only 679,723is accounted for by vital statistics, we might consider ahypothetical constant ratio of true increase to reportednatural increase which is obtained by dividing 815,159by 679,723. This ratio amounts to 1.20. Multiplying thefigures for natural increase of each inter-censal periodby this ratio, we obtain hypothetical estimates of truenatural increase. Subtracting the latter from the censusfigure for 1950, we obtain alternative population estimates for each census year which may then be comparedwith the census figures actually obtained. This leads tothe following results:
'United States, Bureau of the Census, Hondaras, Summaryof Biostatistics, Washington, D. C. 1944, and United Nations,Demographic Yearbook, 1952.

Natural.,.erelUe ui to 1950POjJu/alWl< PopultJl1o,.
Yellr ttl CorrecWm Hypot1t4tieGl es"male for reported
eetISfU ' flJCfor As retDrled -IStimate ee"'''' yellr life.,..'"
1950 .................... 1.20 1,369,000 1,369,000
1945 .................... 1.20 163,000 196,000 1,173,000 1,201,000
1940 .................... 1.20 273,000 328,000 1,041,000 1,108,000
1935 .................... 1.20 374,000 449,000 920,000 962,000
1930 .................... 1.20 456,000 547,000 822,000 854,000
1926 .................... 1.20 507,000 608,000 761,000 701,000
1916 .................... 1.20 620,000 744,000 625,000 606,000
1910 .................... 1.20 680,000 816,000 553,000 553,000
If the assumptions are correct, it appears that, relativeto the censuses of 1910 and 1950, the censuses of 1916and 1926 were deficient while those of 1930, 1935, 1940and 1945 were in excess. Alternatively, the census of1940 might have been nearly correct, in which case thecensuses of 1930, 1935, 1945 and 1950 would have beenslightly deficient and those of 1916 and 1926 greatlydeficient.
In accordance with assumption (c), namely, the progressive improvement in the accuracy of vital statistics,
we might assume for the sake of illustration that thereported natural increase was nearly accurate by 1950,that it requires a correction factor of 1.20 for the entire40-year period, but that the correction factor diminishesby 0.005 each year so that, by 1950, it equals unity. Itmust be admitted that the sizes of the correction factorsassumed for different years are highly arbitrary, but thehypothesis of registration improving over a long periodof time is in accordance with the experience of manycountries. The results of this computation are presentedbelow:
Natural i,.creue up to 1950Populatio,. Populau-
Year of CorrecfiOl< HypothetieGl esfsmate for reponed
(en.stU factor As reported estimate emsus year af census
1950 ................... 1.000 1,369,000 1,369,0001945 ................... 1.025 163,000 167,000 1,202,000 1,201,000
1940 ................... 1.050 273,000 287,000 1,082,000 1,108,0001935 ................... 1.075 374,000 402,000 967,000 962,0001930 ................... 1.100 456,000 502,000 867,000 854,0001926 ................... 1.120 507,000 568,000 801,000 701,0001916 ................... 1.170 620,000 725,000 644,000 606,0001910 ................... 1.200 680,000 816,000 553,000 553,000
The population estimates made on this assumptionshow a surprisingly good agreement with the results for1930, 1935, 1940, 1945. The average annual rates ofnatural increase implied by the estimates on this assumption have been computed for each time-interval.From 1916 onward, the rate of increase rises gradually,from 2.0 per cent per annum in 1916-1926 to 2.6 percent in 1945-1950; this trend is quite similar to the experience of other countries in Central America. For the1910-1916 period, however, the implied rate of naturalincrease is 2.5 per cent, a figure which is too high to fitthe pattern. This implies that recorded natural increasein 1910-1916 was probably more nearly correct, beforethe adjustment, than that for later periods.
Because of their dependence on unproven assumptions relating to the vital statistics, these tests are in-
sufficient. Nevertheless, the reasoning underlying assumption (c), namely, that vital statistics improved inthe course of time, though perhaps with some temporaryrelapse after 1916, is probably in the right direction. Ifso, it seems that the census series is fairly consistentexcept for the censuses of 1916 and 1926, which wereprobably incomplete. The evidence, however, requiresstrengthening by means of balancing equations designedto appraise the accuracy of the vital statistics series inthe several inter-censal periods.
Statistics are available for additional tests. For several censuses, the sex-age distribution of the population,as well as its geographic distribution, by department andmunicipality, have been published. Statistics of deathsare given by sex and age. With these data, many of thetests described in this manual can be performed.
67