Methods Matter: Investigating Causation & Correlation
23
Methods Matter: Investigating Causation & Correlation Are Local Health Department Expenditures Related to Racial Disparities in Mortality? David Grembowski University of Washington Funded by the Robert Wood Johnson Foundation & Changes in Health Care Financing and Organization
-
Upload
beck-russell -
Category
Documents
-
view
43 -
download
1
description
Methods Matter: Investigating Causation & Correlation. Are Local Health Department Expenditures Related to Racial Disparities in Mortality? David Grembowski University of Washington Funded by the Robert Wood Johnson Foundation & Changes in Health Care Financing and Organization. Outline. - PowerPoint PPT Presentation
Transcript of Methods Matter: Investigating Causation & Correlation
Methods Matter:Investigating Causation &
Correlation
Are Local Health Department Expenditures Related to Racial
Disparities in Mortality?
David GrembowskiUniversity of Washington
Funded by the Robert Wood Johnson Foundation &Changes in Health Care Financing and Organization

Outline
Write the question Apply a conceptual model Choose a study design Identify data sources Measure mortality disparities Identify control variables in conceptual model Link mortality & control variables Adjust for baseline mortality differences Address variation in covariates over time Deal with reverse causation Data analysis & results Assess external validity Limitations
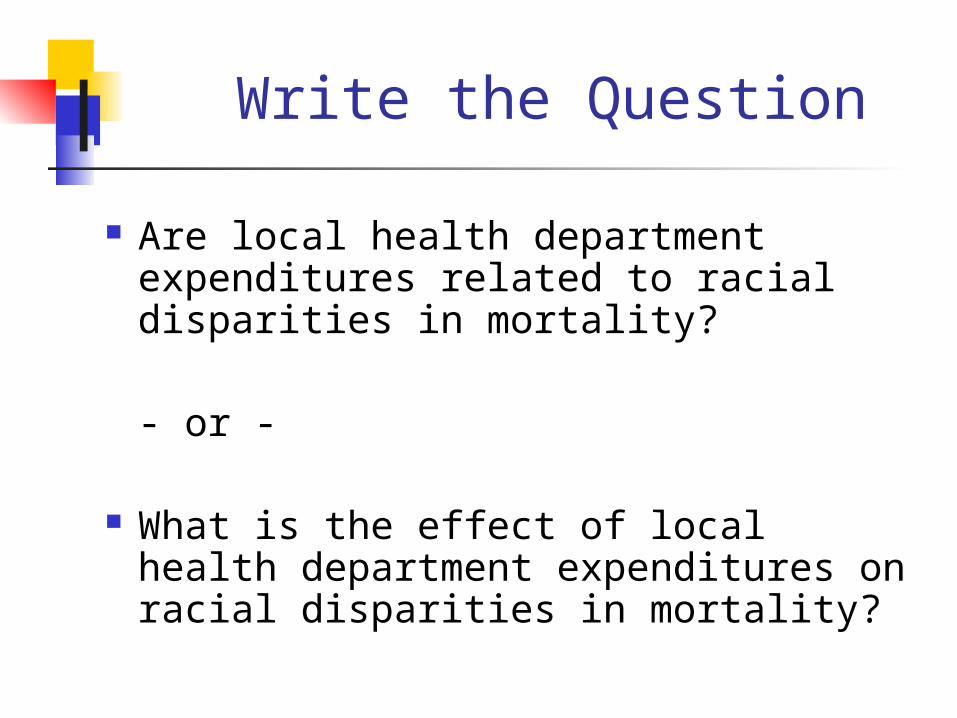
Write the Question
Are local health department expenditures related to racial disparities in mortality?
- or -
What is the effect of local health department expenditures on racial disparities in mortality?
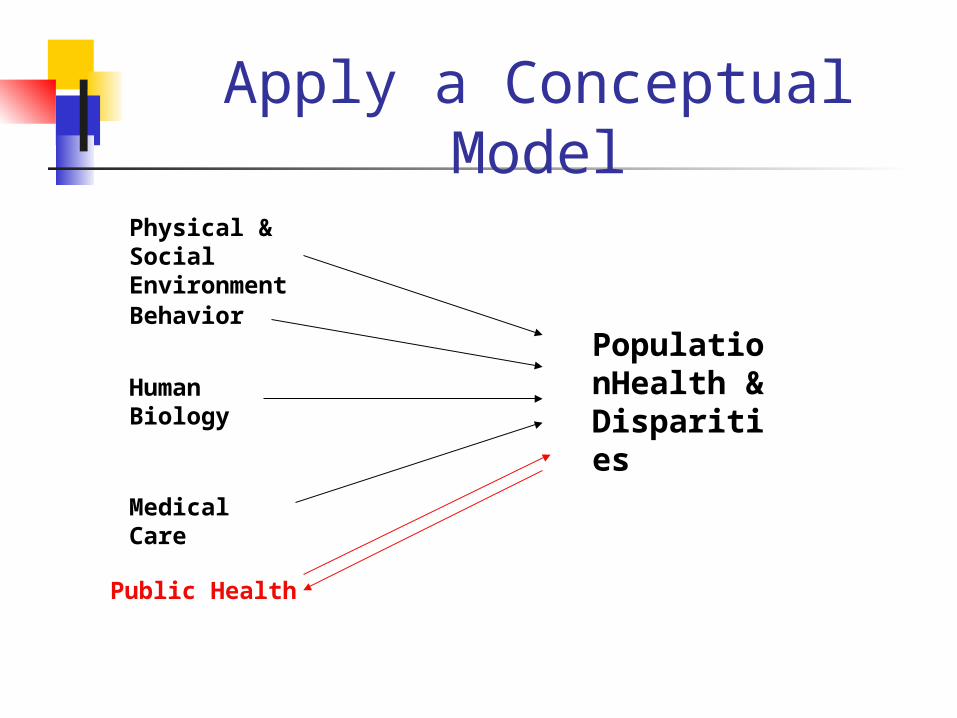
Apply a Conceptual Model
Physical & SocialEnvironment
Behavior
Human Biology
PopulationHealth &Disparities
Medical Care
Public Health
Can Local Public Health Reduce Racial/Ethnic
Disparities?
Yes! Population-based interventions that influence everyone
have the potential to reduce health disparities Water fluoridation, highway safety improvements Raising the health of the worst off fastest
No! Population-based interventions that depend on
voluntary participation may increase disparities because people with more resources are more likely to take advantage of them
Goal of improving population health may conflict with goal of reducing health disparities Link & Phelan 2005; Mechanic
2002

Choose a Study Design: Internal Validity
Longitudinal (randomized) experiment
Longitudinal observational data
Cross-sectional observational data
Choose a Study Design
Time-Trend Ecologic Study Design
Test whether changes in LHD spending per capita
are associated with
changes in Black & White mortality rates
(Temporal rather than causal effects)
Identify Data Sources
LHD expenditures 1990 & 1997 National Profiles of Local Health Departments
from the National Association of County and City Health Officials (NACCHO)
1990 & 1997 Black and White mortality rates from CDC
County Sociodemographic and Government Characteristics from U.S. Census & Area Resource File
County Medicare expenditures from Centers for Medicare and Medicaid Services
Rural/urban county commuting codes from Department of Agriculture
Measure Mortality Disparities
Population Health Paradox
Population health has increased in many developed countries
Disparities in population health have increased in many developed countries

Absolute Change vs. Relative Disparity
in Infant Mortality by Racial/Ethnic Group
2002- Absolute 1950 2004 Change
Black 44 14 30 White 27 6 21 B/W Rate Ratio* 1.63 2.33 .70 bigger
gap* 1950 Black/White Rate Ratio = 44/27 = 1.63
Infant mortality rate: rate of deaths in children less than 1 year old per 1,000 live births
Health, United States, 2007
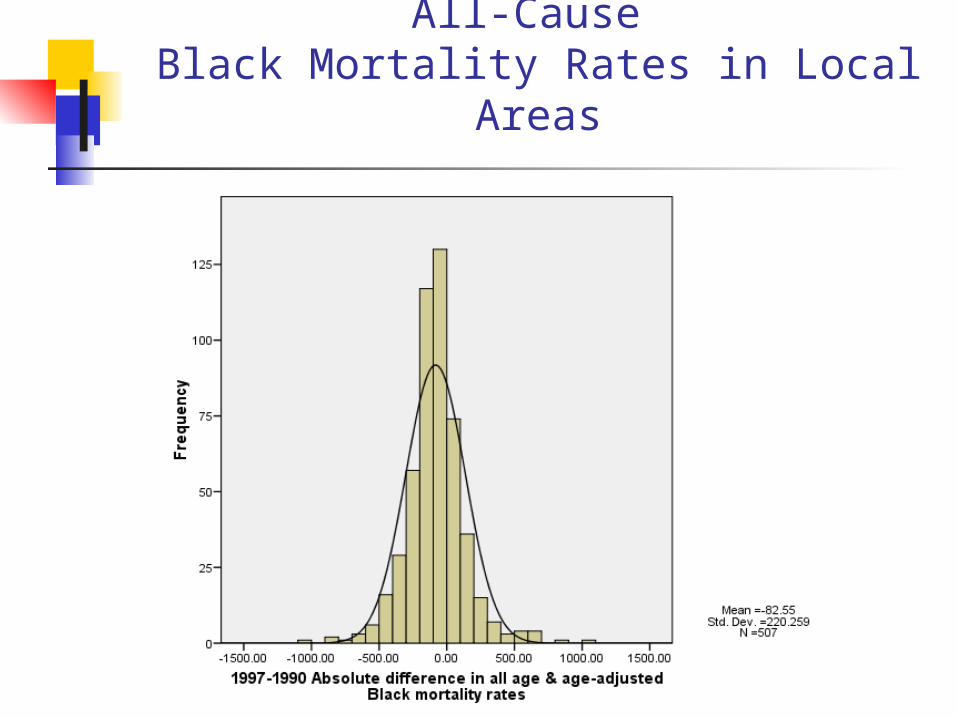
1997-1990 Absolute Change in All-Cause
Black Mortality Rates in Local Areas
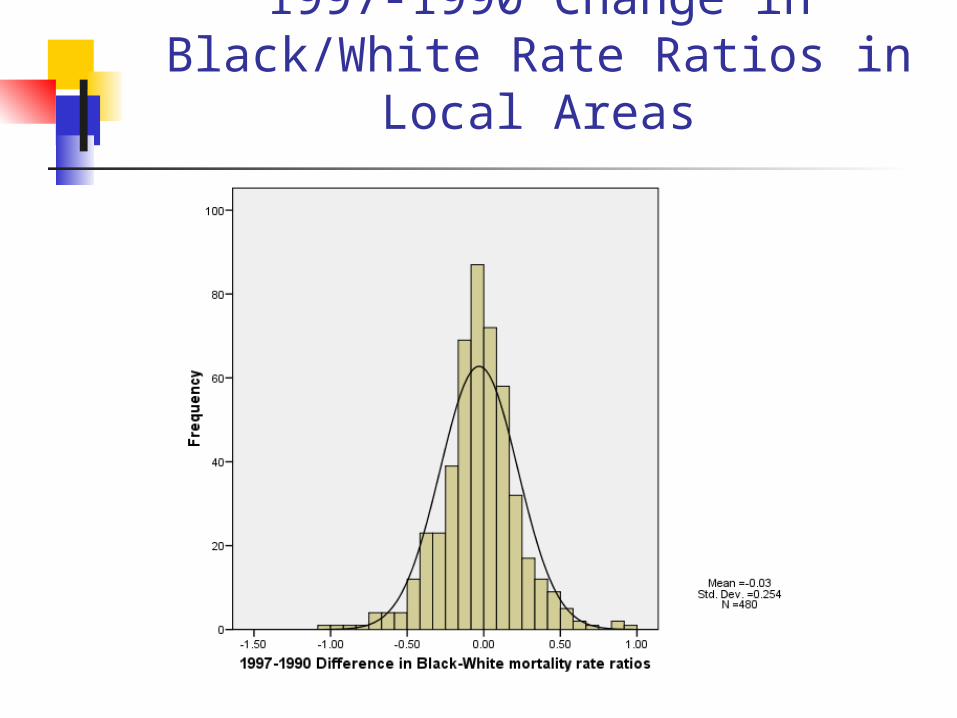
1997-1990 Change in Black/White Rate Ratios in Local Areas
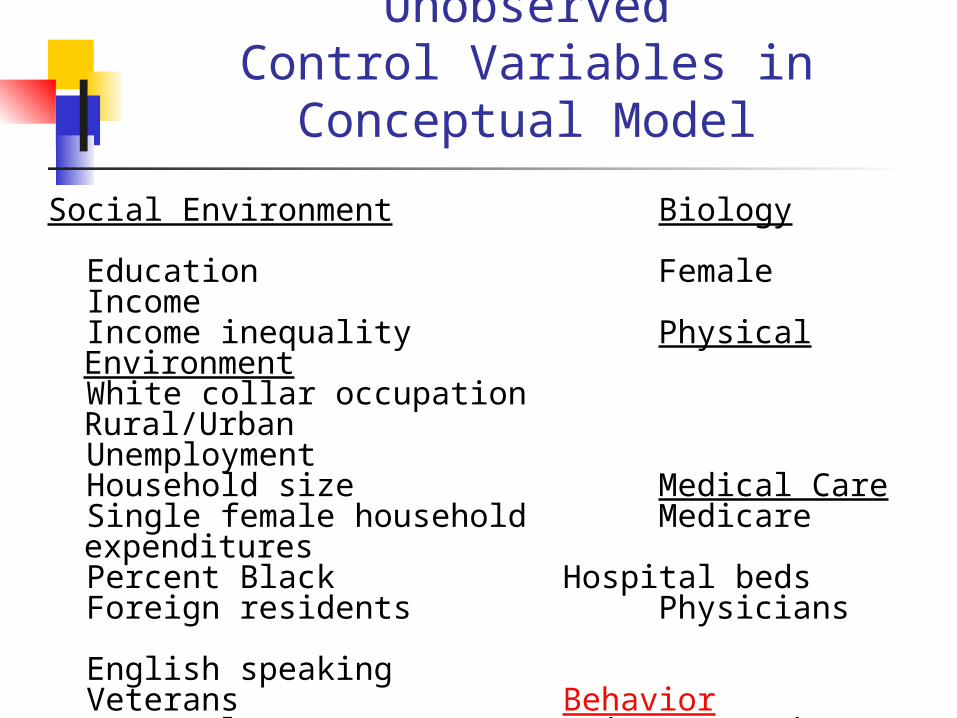
Identify Observed & UnobservedControl Variables in Conceptual
Model
Social Environment Biology Education Female Income Income inequality Physical Environment White collar occupation Rural/Urban Unemployment Household size Medical Care Single female household Medicare
expenditures Percent Black Hospital beds Foreign residents Physicians English speaking Veterans Behavior Home values Drive to work People in mental institutions People in correctional institutions
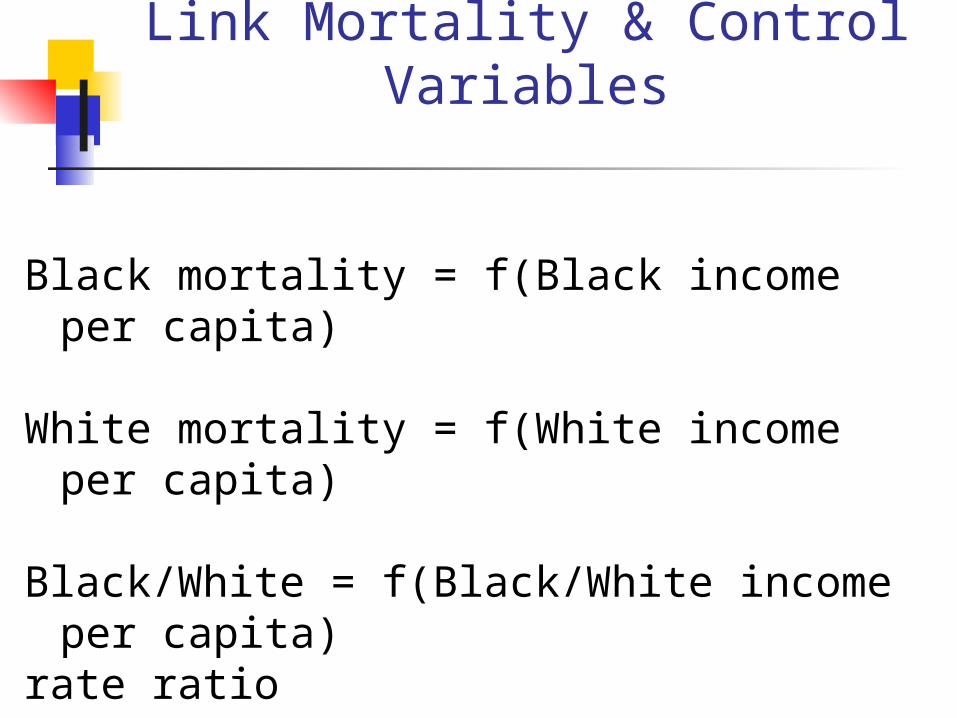
Link Mortality & Control Variables
Black mortality = f(Black income per capita)
White mortality = f(White income per capita)
Black/White = f(Black/White income per capita)
rate ratio
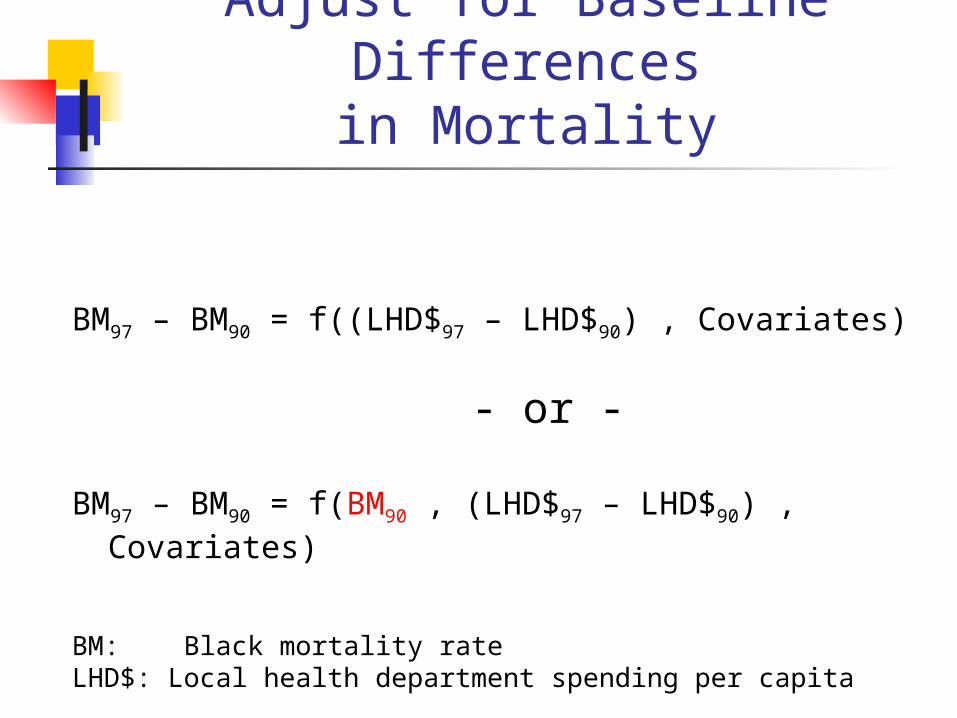
Adjust for Baseline Differencesin Mortality
BM97 – BM90 = f((LHD$97 – LHD$90) , Covariates)
- or -
BM97 – BM90 = f(BM90 , (LHD$97 – LHD$90) , Covariates)
BM: Black mortality rateLHD$: Local health department spending per capita
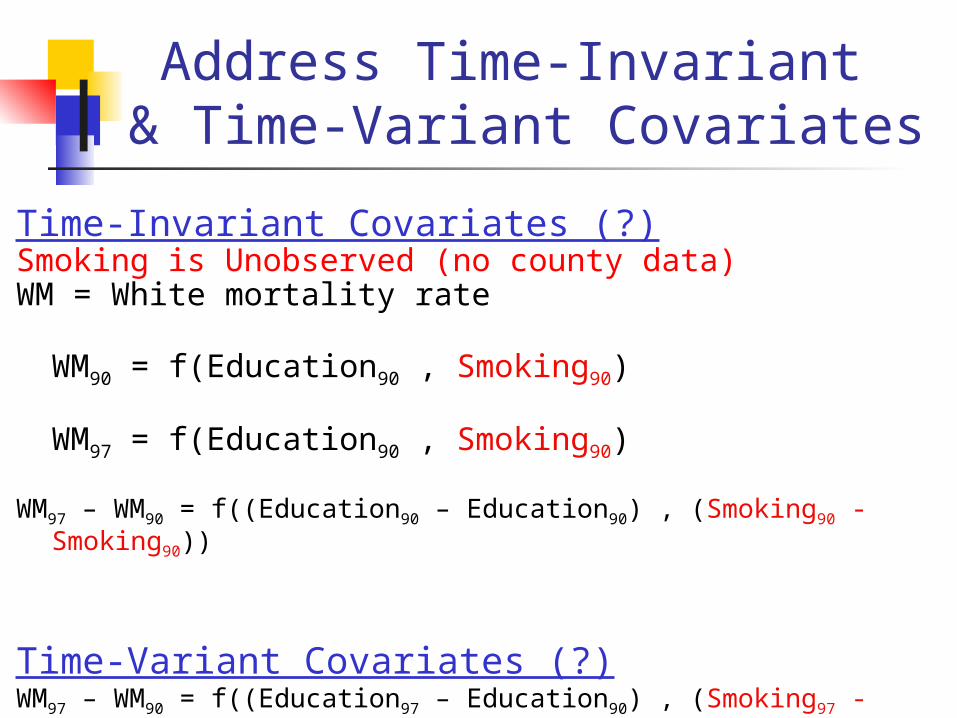
Address Time-Invariant & Time-Variant Covariates
Time-Invariant Covariates (?)Smoking is Unobserved (no county data)WM = White mortality rate
WM90 = f(Education90 , Smoking90)
WM97 = f(Education90 , Smoking90)
WM97 – WM90 = f((Education90 – Education90) , (Smoking90 - Smoking90))
Time-Variant Covariates (?)WM97 – WM90 = f((Education97 – Education90) , (Smoking97 -
Smoking90))
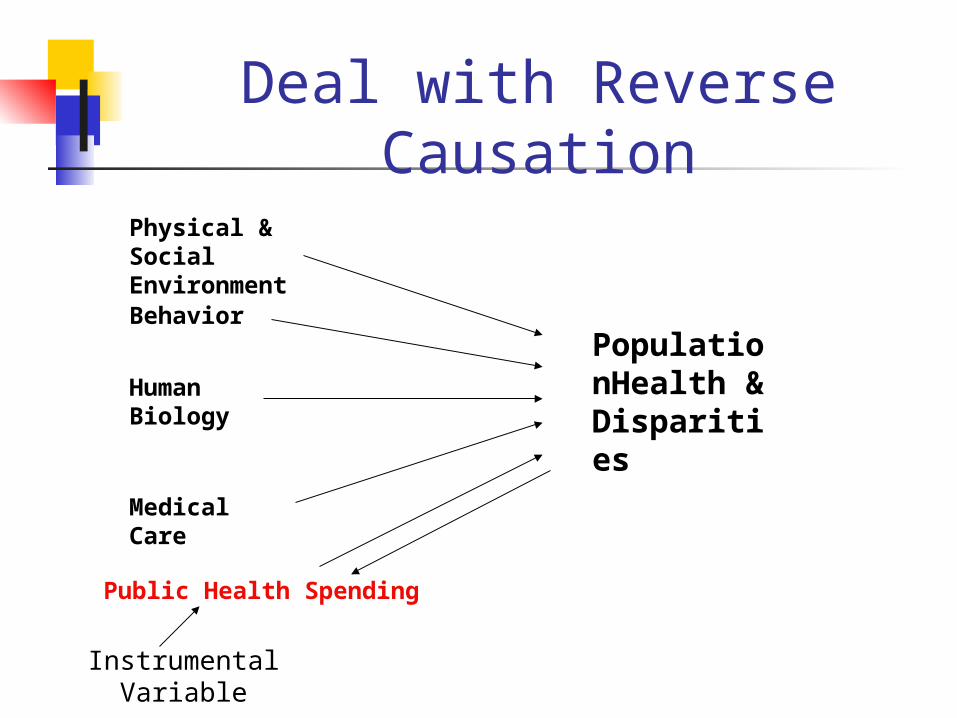
Deal with Reverse Causation
Physical & SocialEnvironment
Behavior
Human Biology
PopulationHealth &Disparities
Medical Care
Public Health Spending
InstrumentalVariable
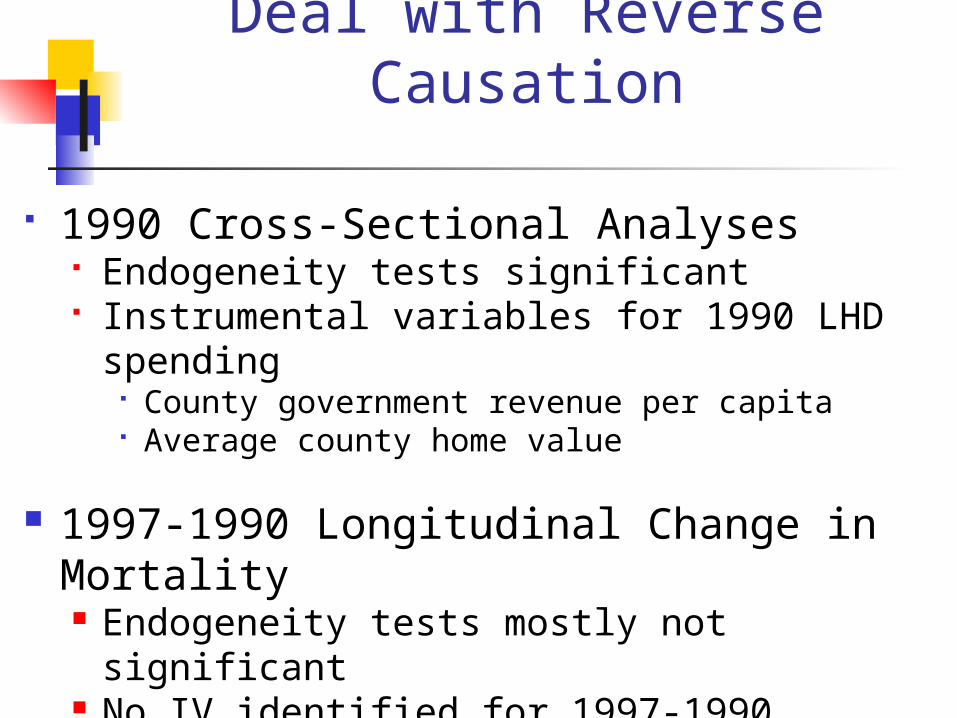
Deal with Reverse Causation
1990 Cross-Sectional Analyses Endogeneity tests significant Instrumental variables for 1990 LHD
spending County government revenue per capita Average county home value
1997-1990 Longitudinal Change in Mortality Endogeneity tests mostly not significant No IV identified for 1997-1990 changes in
health department spending
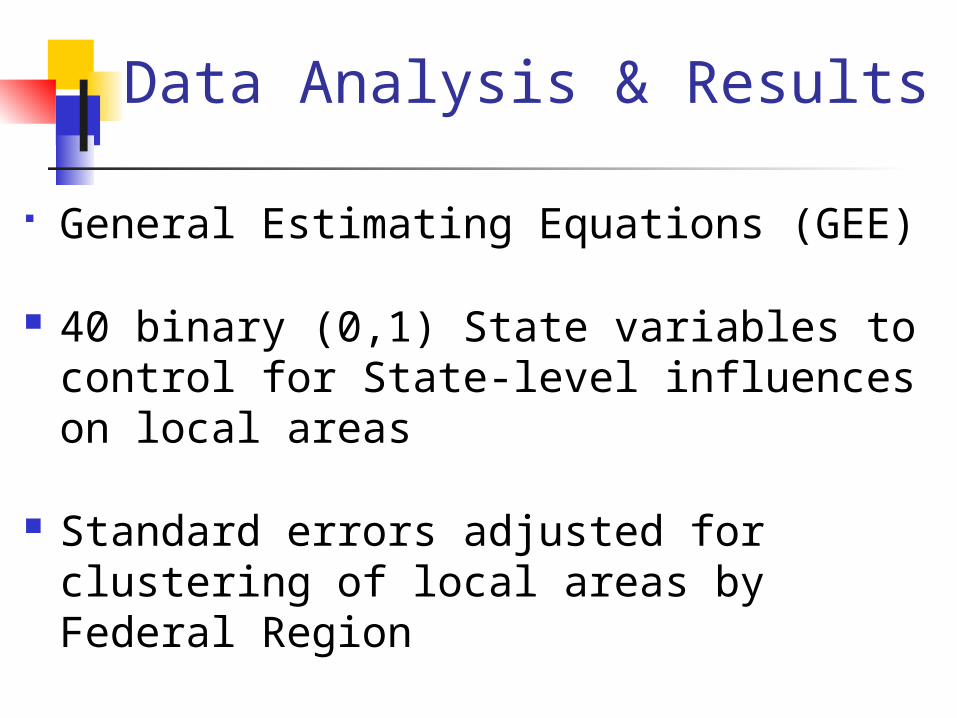
Data Analysis & Results
General Estimating Equations (GEE)
40 binary (0,1) State variables to control for State-level influences on local areas
Standard errors adjusted for clustering of local areas by Federal Region
Hausman-Durbin-Wu test for 2-way causation between LHD spending and mortality
Results
Per capita LHD expenditures generally not related to disparities in all-cause, all-age Black and White mortality rates and infant mortality rates
We also are analyzing whether LHD services are related to Black/White disparities in mortality
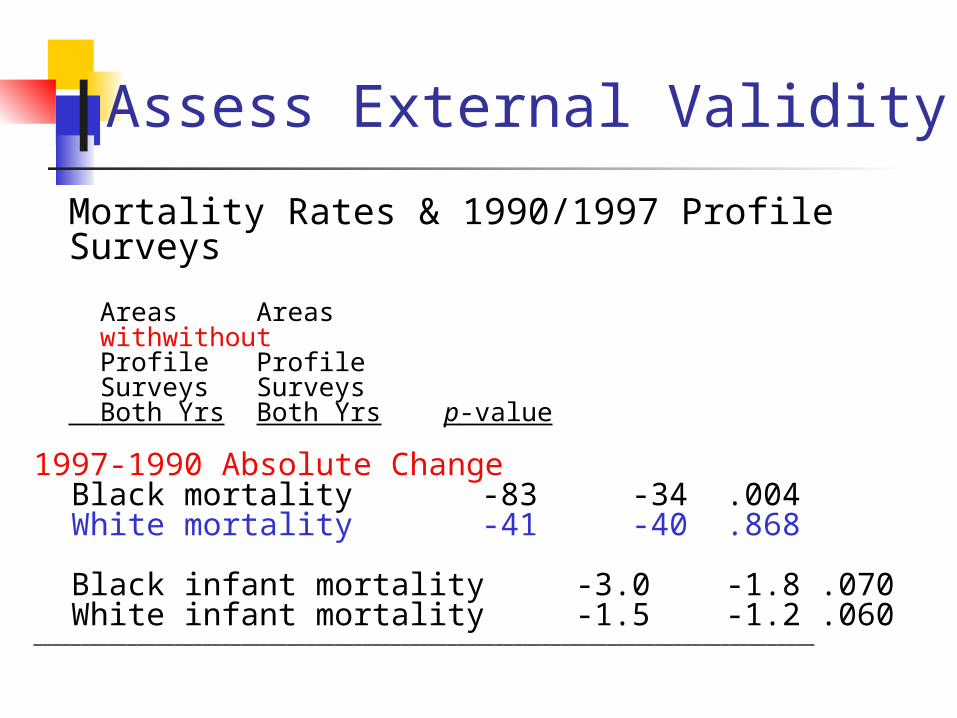
Assess External Validity
Mortality Rates & 1990/1997 Profile Surveys
Areas Areas with without Profile Profile Surveys Surveys Both Yrs Both Yrs p-
value
1997-1990 Absolute Change Black mortality -83 -34 .004 White mortality -41 -40 .868
Black infant mortality -3.0 -1.8 .070 White infant mortality -1.5 -1.2 .060___________________________________________________________________________________
Limitations
Study design
Omitted variables (e.g., population-level smoking, medical care rates)
No data for LHDs without Profile Surveys
No data for how LHDs spent funds in 1990/97 Profile Surveys
No data for public health spending by other community agencies
Black county populations often too small to calculate cause of death mortality rates (by gender and by age group)
Only 2 racial/ethnic groups
Are Local Health Department Expenditures Related to Racial
Disparities in Mortality?
David GrembowskiDouglas ConradBetty BekemeierWilliam Kreuter
Eric Darst
University of Washington
Funded by the Robert Wood Johnson Foundation &Changes in Health Care Financing and Organization