methods - Journal of Lipid Research · of healthy donors, and then separated by HPLC on a C8 ......
12
This article is available online at http://www.jlr.org Journal of Lipid Research Volume 51, 2010 3377 Copyright © 2010 by the American Society for Biochemistry and Molecular Biology, Inc. that are excreted to the skin surface and form sebum. The function of sebum is still a matter of investigation. It is only hypothesized that sebum may play a role in the protection of skin from dehydration, ultraviolet radiation (UVR), wrinkling, and infection (1, 2). The sebaceous lipid mix- ture is highly complex and consists of triacylglycerols (TAG), diacylglycerols (DAG), and free fatty acids (FFA), which together account for 50–60% of its composition. Se- bum also contains 20–30% wax esters (WE), 10–16% squa- lene (SQ), and 2–4% cholesterol esters (CE) (1, 2). Initial analyses of the components of the sebaceous lipid mixture conducted by Nicolaides et al. (3–5) led to the identifica- tion of several different types of acyl chains in esters with glycerol, cholesterol, and waxes. Fatty acids (FA) with an odd number of carbon atoms, branched side chains, and sites of unsaturation at unconventional positions were characterized. However, information on the intact lipids remained to be determined. A detailed characterization of the lipid repertoire in sebum in physiologic and diseased conditions is very limited due to the unavailability of meth- ods for the comprehensive and simultaneous analysis of whole lipids. Prior investigations of the composition of se- bum have been mostly concerned with acne, a multifac- torial skin disorder that affects the pilosebaceous unit. Currently, only a few parameters are addressed when in- vestigating alterations in sebum, such as SQ levels and the composition of FA obtained from the hydrolysis of TAG, DAG, WE, and CE. The methodology for the targeted analysis of SQ involves gas chromatography (GC) with Abstract Sebum is a complex lipid mixture that is synthe- sized in sebaceous glands and excreted on the skin surface. The purpose of this study was the comprehensive detection of the intact lipids that compose sebum. These lipids exist as a broad range of chemical structures and concentrations. Sebum was collected with SebuTape TM from the foreheads of healthy donors, and then separated by HPLC on a C8 stationary phase with sub 2 μm particle size. This HPLC method provided high resolution and excellent reproduc- ibility of retention times (RT). Compound mining was per- formed with time of flight (TOF) and triple quadrupole (QqQ) mass spectrometers (MS), which allowed for the classification of lipids according to their elemental compo- sition, degree of unsaturation, and MS/MS fragmentation. The combination of the two MS systems detected 95 and 29 families of triacylglycerols (TAG) and diacylglycerols (DAG), respectively. Assignment was carried out regardless of posi- tional isomerism. Among the wax esters (WE), 28 species were found to contain the 16:1 fatty acyl moiety. This method was suitable for the simultaneous detection of squalene and its oxygenated derivative. A total of 9 cholesterol esters (CE) were identified and more than 48 free fatty acids (FFA) were detected in normal sebum. The relative abundance of each individual lipid within its own chemical class was deter- mined for 12 healthy donors. In summary, this method pro- vided the first characterization of the features and distribution of intact components of the sebum lipidome.—Camera, E., M. Ludovici, M. Galante, J-L. Sinagra, and M. Picardo. Compre- hensive analysis of the major lipid classes in sebum by rapid resolution high-performance liquid chromatography and elec- trospray mass spectrometry. J. Lipid Res. 2010. 51: 3377–3388. Supplementary key words mass accuracy • lipidomics • triacylglycer- ols • diacylglycerols • wax esters • cholesterol esters • squalene • free fatty acids Skin is a metabolically active tissue that contains seba- ceous glands, which are specialized organelles equipped for the synthesis of a broad spectrum of lipid compounds Manuscript received 12 May 2010 and in revised form 17 August 2010. Published, JLR Papers in Press, August 17, 2010 DOI 10.1194/jlr.D008391 Comprehensive analysis of the major lipid classes in sebum by rapid resolution high-performance liquid chromatography and electrospray mass spectrometry Emanuela Camera, 1, * Matteo Ludovici,* Marisa Galante,* Jo-Linda Sinagra, † and Mauro Picardo* Laboratorio di Fisiopatologia Cutanea e Centro Integrato di Metabolomica* and Acne Unit, † Istituto Dermatologico San Gallicano (IRCCS), Rome, Italy Abbreviations: ACN, acyl carbon number; CE, cholesteryl/choles- terol ester; CN, carbon number; DAG, diacylglycerol; DB, double bond; EIC, extracted ion chromatogram; FOH, fatty alcohol; NL, neutral loss; PI, product ion; p.s., particle size; QqQ, triple quadrupole; RR-RP- HPLC, rapid resolution reversed-phase HPLC; RT, retention time; SQ, squalene; TAG, triacylglycerol; TIC, total ion chromatogram; TOF, time of flight; WE, wax ester. 1 To whom correspondence should be addressed. e-mail: [email protected] The online version of this article (available at http://www.jlr.org) contains supplementary data in the form of four figures and five tables. methods by guest, on June 7, 2018 www.jlr.org Downloaded from .html http://www.jlr.org/content/suppl/2010/08/17/jlr.D008391.DC1 Supplemental Material can be found at:
Transcript of methods - Journal of Lipid Research · of healthy donors, and then separated by HPLC on a C8 ......

This article is available online at http://www.jlr.org Journal of Lipid Research Volume 51, 2010 3377
Copyright © 2010 by the American Society for Biochemistry and Molecular Biology, Inc.
that are excreted to the skin surface and form sebum. The function of sebum is still a matter of investigation. It is only hypothesized that sebum may play a role in the protection of skin from dehydration, ultraviolet radiation (UVR), wrinkling, and infection ( 1, 2 ). The sebaceous lipid mix-ture is highly complex and consists of triacylglycerols (TAG), diacylglycerols (DAG), and free fatty acids (FFA), which together account for 50–60% of its composition. Se-bum also contains 20–30% wax esters (WE), 10–16% squa-lene (SQ), and 2–4% cholesterol esters (CE) ( 1, 2 ). Initial analyses of the components of the sebaceous lipid mixture conducted by Nicolaides et al. ( 3–5 ) led to the identifi ca-tion of several different types of acyl chains in esters with glycerol, cholesterol, and waxes. Fatty acids (FA) with an odd number of carbon atoms, branched side chains, and sites of unsaturation at unconventional positions were characterized. However, information on the intact lipids remained to be determined. A detailed characterization of the lipid repertoire in sebum in physiologic and diseased conditions is very limited due to the unavailability of meth-ods for the comprehensive and simultaneous analysis of whole lipids. Prior investigations of the composition of se-bum have been mostly concerned with acne, a multifac-torial skin disorder that affects the pilosebaceous unit. Currently, only a few parameters are addressed when in-vestigating alterations in sebum, such as SQ levels and the composition of FA obtained from the hydrolysis of TAG, DAG, WE, and CE. The methodology for the targeted analysis of SQ involves gas chromatography (GC) with
Abstract Sebum is a complex lipid mixture that is synthe-sized in sebaceous glands and excreted on the skin surface. The purpose of this study was the comprehensive detection of the intact lipids that compose sebum. These lipids exist as a broad range of chemical structures and concentrations. Sebum was collected with SebuTape TM from the foreheads of healthy donors, and then separated by HPLC on a C8 stationary phase with sub 2 µm particle size. This HPLC method provided high resolution and excellent reproduc-ibility of retention times (RT). Compound mining was per-formed with time of fl ight (TOF) and triple quadrupole (QqQ) mass spectrometers (MS), which allowed for the classifi cation of lipids according to their elemental compo-sition, degree of unsaturation, and MS/MS fragmentation. The combination of the two MS systems detected 95 and 29 families of triacylglycerols (TAG) and diacylglycerols (DAG), respectively. Assignment was carried out regardless of posi-tional isomerism. Among the wax esters (WE), 28 species were found to contain the 16:1 fatty acyl moiety. This method was suitable for the simultaneous detection of squalene and its oxygenated derivative. A total of 9 cholesterol esters (CE) were identifi ed and more than 48 free fatty acids (FFA) were detected in normal sebum. The relative abundance of each individual lipid within its own chemical class was deter-mined for 12 healthy donors. In summary, this method pro-vided the fi rst characterization of the features and distribution of intact components of the sebum lipidome. — Camera, E., M. Ludovici, M. Galante, J-L. Sinagra, and M. Picardo. Compre-hensive analysis of the major lipid classes in sebum by rapid resolution high-performance liquid chromatography and elec-trospray mass spectrometry. J. Lipid Res. 2010. 51: 3377–3388.
Supplementary key words mass accuracy • lipidomics • triacylglycer-ols • diacylglycerols • wax esters • cholesterol esters • squalene • free fatty acids
Skin is a metabolically active tissue that contains seba-ceous glands, which are specialized organelles equipped for the synthesis of a broad spectrum of lipid compounds
Manuscript received 12 May 2010 and in revised form 17 August 2010.
Published, JLR Papers in Press, August 17, 2010 DOI 10.1194/jlr.D008391
Comprehensive analysis of the major lipid classes in sebum by rapid resolution high-performance liquid chromatography and electrospray mass spectrometry
Emanuela Camera , 1, * Matteo Ludovici , * Marisa Galante , * Jo-Linda Sinagra , † and Mauro Picardo *
Laboratorio di Fisiopatologia Cutanea e Centro Integrato di Metabolomica* and Acne Unit, † Istituto Dermatologico San Gallicano (IRCCS) , Rome, Italy
Abbreviations: ACN, acyl carbon number; CE, cholesteryl/choles-terol ester; CN, carbon number; DAG, diacylglycerol; DB, double bond; EIC, extracted ion chromatogram; FOH, fatty alcohol; NL, neutral loss; PI, product ion; p.s., particle size; QqQ, triple quadrupole; RR-RP-HPLC, rapid resolution reversed-phase HPLC; RT, retention time; SQ, squalene; TAG, triacylglycerol; TIC, total ion chromatogram; TOF, time of fl ight; WE, wax ester.
1 To whom correspondence should be addressed. e-mail: [email protected]
The online version of this article (available at http://www.jlr.org) contains supplementary data in the form of four fi gures and fi ve tables.
methods
by guest, on June 7, 2018w
ww
.jlr.orgD
ownloaded from
.html http://www.jlr.org/content/suppl/2010/08/17/jlr.D008391.DC1Supplemental Material can be found at:

3378 Journal of Lipid Research Volume 51, 2010
ammonium ions. A highly accurate mass measurement was achieved with time of fl ight (TOF) MS. The reproduc-ibility of the HPLC/MS data facilitated a comparison be-tween lipid profi les in the tested healthy volunteers. The identifi cation of a large fraction of the constituents of sebum was achieved by integrating HPLC/TOF-MS and tandem MS/MS data. Taken together, this study provides funda-mental information on the features and distribution pro-fi le of intact lipids in sebum. A thorough understanding of sebum composition gives new opportunities to further in-vestigate the regulation of the sebaceous lipidome.
MATERIALS AND METHODS
Chemicals HPLC/MS-grade methanol (MeOH) and isopropyl alcohol
(iPrOH) were purchased from Merck (Darmstadt, Germany), and HPLC/MS-grade ammonium formate (HCOONH 4 ) was purchased in granular form from Fluka (Buchs SG, Switzerland). Authentic 1-palmitoyl-2-oleoyl-3-lineoleoyl-rac-glycerol (MW 857.41) and 1,2-dioleoyl- sn -glycerol (MW 620.99) were purchased from Cayman Chemical (Ann Arbor, MI). Authentic linoleic acid (MW 280.45), palmitoleic acid (MW 254.41), palmitic acid (MW 256.42), stearic acid (MW 284.43), oleic acid (MW 282.5), linolenic acid (MW 278.43), 1,3-dipalmitoyl-2-oleoylglycerol (MW 833.36), lauryl palmitoleate (MW 422.73), cholesteryl palmitoleate (MW 623.05), cholesteryl oleate (MW 651.10), and squalene (MW 410.72) were purchased from Sigma-Aldrich (Mi-lan, Italy). Standards were diluted in the mixture used to dissolve sebum extracts, namely, acetone/MeOH/iPrOH 40/40/20 at the fi nal concentration 10 µM to be injected.
Human sebum samples Sebum lipids were sampled from the central foreheads of 12
Caucasian volunteers (8 females and 4 males, mean age 22.8 ± 6.7 years), as previously described ( 7, 12 ). The volunteers showed no signs of skin disease at the time of sebum sampling. Briefl y, the sampling surface was cleansed with a gauze pad presoaked in 70% ethanol solution. After allowing the surface to dry, two sebum-adsorbent tapes (Sebutape TM , CuDerm Corp., Dallas, TX), which had been previously weighed, were held onto the skin for 30 min. Then the tapes were reweighed for the gravimet-ric assessment of sampling. The average weight of sampled se-bum was 1.5 ± 0.7 mg. The samples were stored at � 80°C until extraction and analysis. The study was performed in agreement with the institutional review board, and the informed consent was obtained from each volunteer.
Sample extraction The solvent to use for extraction from the tape was selected
among those previously described ( 7, 12 ). Hexane, which is the solvent of choice for sebum extraction from tape ( 12 ), and chlo-roform/MeOH 2:1 could not be used due to the apparent dissolution of the Sebutape TM polymer, which could severely con-taminate the HPLC and MS systems. As extraction of Sebutape TM with absolute ethanol (EtOH) has been shown to be compati-ble with the HPLC/MS analysis of sebum ( 7 ), we tested this system with slight modifi cations. Briefl y, the tapes were extracted with 10 ml of absolute EtOH, which was then evaporated under nitrogen. The concentrated EtOH solution was subjected to liq-uid-liquid extraction with ethyl acetate to abate matrix-derived material. The fi nal lipid extract was dissolved in acetone/MeOH/iPrOH 40/40/20 to obtain a solution of sebum at the fi nal w/v
fl ame ionization detector (FID) or mass spectrometry (MS) detector, as well as high performance liquid chroma-tography (HPLC)/MS ( 6, 7 ). To analyze complex lipids, ester bonds are hydrolyzed to yield FA, which are detected using various analytical techniques ( 3–5 ). GC/MS and HPLC/MS analyses of methyl and trimethyaminoethyl es-ters of hydrolyzed FA have been used extensively ( 8–11 ). These approaches have reduced the complexity of the data, allowing for easy detection of the FA component. However, information on their arrangement in the entire lipid was indefi nite. In contrast, sebum can be analyzed according to lipid classes using thin-layer chromatography (TLC) ( 12, 13 ) and nuclear magnetic resonance (NMR) ( 14 ). Both TLC and NMR methods are advantageous because they are semi quantitative in terms of their ability to quan-tify the expression of the lipid families. However, the com-position of each subclass remains elusive. To understand the distribution of individual sebum constituents, the ideal analytical approach would allow for the simultaneous de-tection and identifi cation of intact species belonging to different lipid classes. Current knowledge of the actual composition of sebum is very limited. To date, an in-depth investigation of individual lipids without decomposition/hydrolysis has yet to be achieved in complex matrices. In this study, recent advances in both chromatography and MS have been utilized to develop a method to analyze the sebum lipidome. Lipidomics-based approaches that rely on HPLC/MS enable the simultaneous detection of a spectrum of compounds belonging to different classes of lipids, even without the use of authentic standards. Never-theless, the available reference compounds are useful to optimize analytical conditions and to provide insights in the identifi cation of analyzed components. Sebum shares several chemical functionalities with other biological ma-trices. Both normal phase (NP) and reversed phase (RP) HPLC have been employed to separate neutral lipids, in-cluding acylglycerols, WE, and CE, from complex mixtures that were subsequently characterized using MS. NP-HPLC has the advantage of reducing the analysis time and ensur-ing the separation of each of the lipid classes. However, the resolution between members of the same class is often unsatisfactory ( 15, 16 ). RP-HPLC is a suitable system for the separation of lipid mixtures with a relatively broad range of hydrophobicity. RP-HPLC has been used to sepa-rate complex natural lipid mixtures, including TAG, which was subsequently detected using a mass analyzer ( 17, 18 ). Additionally, RP-HPLC has proven effective in the sepa-ration of FFA, which can be detected in negative ion atmospheric pressure chemical ionization (APCI) ( 19 ). Nonaqueous RP (NARP)-HPLC coupled with APCI is ideal for the analysis of the hydrophobic features of neutral lip-ids ( 20–22 ). RP-UPLC TM with sub 2 µm particle size (p.s.) C18 stationary phase has been successfully employed to separate glycerol esters ( 23 ). In this study, sebum was sepa-rated using a C8 stationary phase with sub 2 µm p.s., which offered improved selectivity as well as a shorter time for the simultaneous analysis of lipids belonging to different sebaceous classes. Compounds were ionized in the electro-spray ionization interface (ESI), assisted by the addition of
by guest, on June 7, 2018w
ww
.jlr.orgD
ownloaded from
.html http://www.jlr.org/content/suppl/2010/08/17/jlr.D008391.DC1Supplemental Material can be found at:

Lipid profi ling of sebum 3379
matographic conditions). Nitrogen was used as the nebulizing and drying gas, and settings were the same used above with the TOF-MS. Neutral loss (NL) experiments were carried out by scanning the fi rst quadrupole and the third quadrupole simulta-neously. The collision energy applied was adjusted to optimize fragmentation, where the fragmentor was set at 140 V. Each NL spectrum was scanned from m/z 500 to 1,000. To carry out prod-uct ion (PI) scan experiments, the QqQ was operated with differ-ent collision energies for the analysis of the various lipid classes in sebum. Collision energy values were reported below with the respective data.
Nomenclature and abbreviations used to describe lipid com-ponents. Notation of triacylglycerol (TAG) and diacylglycerol (DAG) was reported to include the total number of carbon atoms (CN) arising from the fatty acyls (ACN) and to indicate the total number of carbon-carbon double bonds (DB) born by fatty acyls independent of their distribution (e.g., TAG 50:1 indicated a TAG whose ACN and DB were 50 and 1, respectively). Notation for fatty acids (FA) and fatty alcohols (FOH) was reported as in-dicating the CN and the number of DB (e.g., FA 18:1 and FOH 18:1 were oleic acid and alcohol, respectively). The short nota-tion for free FA was FFA. SQ was the abbreviation for squalene. Wax esters (WE) notation included the CN and the number of DB (e.g., WE 24:2). WE bearing FA 16:1 as the acyl group was notated as FA 16:1-WE. Individual cholesteryl esters (CE) were designated according to the CN and DB of the side fatty acyl (e.g., CE 18:1 was the cholesteryl oleate).
Data extraction and statistical analysis. To determine the reproducibility of the retention times (RT) for the identifi ed lipid species, extracted ion chromatograms (EIC) were derived for each m/z value of the base mass peak. RT were measured at the apex of the chromatographic peak. To obtain the relative abundance of homolog species within the corresponding lipid class, the peak area was integrated after extraction of the calcu-lated exact mass. Asymmetrical or partially resolved peaks in the EIC of the single m/z value were regarded as one species. For the normalization of data, the peak areas of the identifi ed lipids be-longing to the same class were summed, and the abundance of individual compound was determined as percentage of the total area. Average RT, peak areas, and mass accuracy of identifi ed lipids were calculated for the analyzed 12 donors along with stan-dard deviation (SD).
RESULTS
Identifi cation of components of sebum lipid classes Information on the intact constituents in sebum is very
limited. Selected reference compounds were investigated for application of the chosen RR-RP-HPLC/TOF-MS and MS/MS conditions to the analysis of general lipid classes in sebum. Then sebum lipids were individuated on the ba-sis of accurate mass measurement, isotopic pattern, and MS/MS experiments. To ensure a uniform lipid mixture representative of average sebum composition, six random-ized samples were pooled by mixing equal volumes of ex-tracts. Reproducibility of RT and mass error were evaluated by analyzing individual sebum samples. The 12 sebum samples analyzed separately displayed very similar compo-sitions with respect to the compounds in the lipid classes described below.
concentration 5 mg/ml. To test the effi cacy of the selected ex-traction method, we compared TLC of sebum collected from two volunteers. Three tapes from the same donor were extracted with hexane, chloroform/MeOH 2:1, and EtOH followed by ethyl ac-etate, respectively. No apparent differences were observed in the TLC analysis of the different lipids extracts (not shown). Before injection, sebum samples were diluted 1:5 in acetone/MeOH/iPrOH 40/40/20.
Instrumentation Rapid resolution reversed-phase HPLC. The chromato-
graphic apparatus consisted of a 1200 series rapid resolution HPLC (Agilent Technologies, Santa Clara, CA) equipped with a degasser, autosampler, and thermostated column compartment from the same manufacturer. For the rapid resolution reversed-phase HPLC (RR-RP-HPLC) separation, two columns were con-nected in a series. The fi rst was a Zorbax SB-C8 rapid resolution cartridge 2.1 × 30 mm 3.5 µm p.s. (Agilent Technologies), and the second was a Zorbax SB-C8 rapid resolution HT 2.1 × 100 mm 1.8 µm p.s. with a maximal operational backpressure at 600 bar (Agilent Technologies). Sebum samples and authentic standards were eluted with a binary gradient of (A) 5 mM ammonium for-mate in MilliQ water (18.2 � ) and (B) MeOH/iPrOH 95/5. The mobile phases were fi ltered through 0.45 µm glass fi lters and continuously degassed under vacuum. The elution program was as follows: 0–1 min 70% B, 20 min 99% B, 20–32 min 99% B, 34 min 100% B, 34–44 min 100% B, 56 min 70% B. A postrun of 4 min at 70% B was included. The fl ow rate was maintained at 0.25 ml/min during the entire HPLC run and postrun time (4 min-utes). The column was thermostated at 60°C. The injection vol-ume was 0.5 µL. The injector needle was washed with the mobile phase in the wash port during the HPLC runs. The eluent outlet was connected to two different MS analyzers for detection and characterization.
Mass spectrometers Electrospray ion source and TOF mass spectrometer. Measure-
ments of accurate mass and isotope pattern were conducted with a G6220A series TOF-MS (Agilent Technologies) equipped with an ESI interface operating in the positive ion mode. Acidic com-pounds, namely, free fatty acids, were detected also in the nega-tive ion mode. Analytes eluted from the RR-RP-HPLC system were introduced into the TOF-MS apparatus at the operating chromatographic fl ow rate (see chromatographic conditions). Nitrogen was used as the nebulizing and desolvation gas. The temperature and the fl ow of the drying gas were 350°C and 10 l/min, respectively The capillary and the cone voltage were 4,000 and 60 V, respectively. Scan mode TOF mass spectra were ac-quired in the positive and negative ion mode by using the TOF at 10,000 mass resolving power for scans over the range from m/z 100 to m/z 1,000. MS scans were processed using the Mass Hunter software (B.01.03 version). To enhance accurate mass measure-ment for the ion species, a reference solution was vaporized in continuum in the spray chamber. The resulting data were con-verted to mass centroid from which the accurate m/z value was measured.
ESI-MS with a triple quadrupole mass spectrometer. ESI tan-dem mass spectra were obtained with a G6410A series triple quadrupole (QqQ) (Agilent Technologies). Data were acquired in the positive ion mode at unit mass resolving power by scanning ions between m/z 100 and m/z 1000. MS spectra were averaged and processed with the Mass Hunter software (B.01.03 version). Analytes eluted from the RR-RP-HPLC system were introduced into the QqQ instrument at the operating fl ow rate (see chro-
by guest, on June 7, 2018w
ww
.jlr.orgD
ownloaded from
.html http://www.jlr.org/content/suppl/2010/08/17/jlr.D008391.DC1Supplemental Material can be found at:

3380 Journal of Lipid Research Volume 51, 2010
experimental conditions. [M+Na] + and the less abundant proton adduct [M+H] + were observed along with the [M+NH 4 ] + formation ( Fig. 2 ). As reported, DAG presented a rather complicated mass spectrum due to fragmentation of the [M+NH 4 ] + and [M+H] + ions, likely occurring in the ion source ( 16 ). Loss of water led to [M+H-H 2 O] + ions for-mation. Consistent with reported data ( 25, 26 ), the [M+NH 4 -RCOONH 4 ] + ion was observed for each of the two-side acyl groups. DAG in the sebaceous mixture separated in the RR-RP-HPLC system showed recognizable patterns of ion spectra acquired by +ESI/TOF-MS and MS/MS. EIC of the sebaceous DAG 36:2 is reported in Fig. 2D . Different iso-mers of DAG 36:2 were present in the sebum, including the 1,2-dioleoylglycerol, as demonstrated by the multiple fragments populating the PI spectrum ( Fig. 2E ). A total of 29 families of DAG, ranging from 28 to 36 can, were de-tected in sebum based on TOF-MS signals of the [M+NH 4 ] + and [M+NH 4 -RCOONH 4 ] + ions. Altogether, the number of DB in the side FA ranged from 0 to 4. Identity of DAG was confi rmed in MS/MS experiments upon the NL of RCOONH 4 (supplementary Table II) that was achieved with collision energy of 14 V. NL of RCOONH 4 were in agreement with reported data ( 26 ). Although relative abundance of [M+NH 4 -RCOONH 4 ] + ions could be theo-retically exploited for the determination of the prevailing FA in the sn-2 position ( 34 ), attempts to distinguish posi-tional isomers were deferred to future studies. Isobaric DAG analyzed in the pooled sebum appeared to be either unresolved or eluted at close RT. Excellent reproducibility of the RT of DAG families was obtained by analyzing the individual donors (supplementary Table II).
Identifi cation of major wax esters Reportedly, WE containing FA 16:1 (FA 16:1-WE) repre-
sent a major fraction of the total WE in sebum ( 4 ). RR-RP-HPLC/ESI-TOF analysis of the authentic lauryl palmitoleate (FA 16:1-WE 28:1, Fig. 3 ) produced a peak eluting at 21.60 min with m/z 423.4196, corresponding to the [M+H] + ion with the ion formula C 28 H 53 O 2 (mass error � 2 ppm). [M+H] + was the major ion, whereas the ammoniated ad-duct represented � 25% of the base peak. PI scan of the [M+H] + ion showed a characteristic pattern of fragmenta-tion of synthetic FA 16:1-WE 28:1 ( Fig. 3A ), which was com-mon to the major WE species detected in the pooled sebum ( Fig. 3B-F ). The fragmentation spectra of WE were in agree-ment with previous reports ( 35–39 ). Nevertheless, MS/MS spectra of sebaceous WE demonstrated that different iso-mers were present. Combination of the TOF-MS data and the PI fragmentation pattern allowed for the identifi cation of FA 16:1-WE in sebum (supplementary Table III). Fea-tures of the fatty alcohol, such as its CN and DB, could be tentatively assigned on the basis of elemental composition and fragmentation pattern of the single WE species. Excel-lent reproducibility of RT of FA 16:1-WE in the RR-RP-HPLC system was observed (supplementary Table III).
Identifi cation of cholesteryl esters CE in human sebum were recognized to form mainly
the sodiated pseudomolecular ion in the +ESI conditions
Identifi cation of acylglycerols RR-RP-HPLC/TOF-MS analysis of the authentic 1,3-
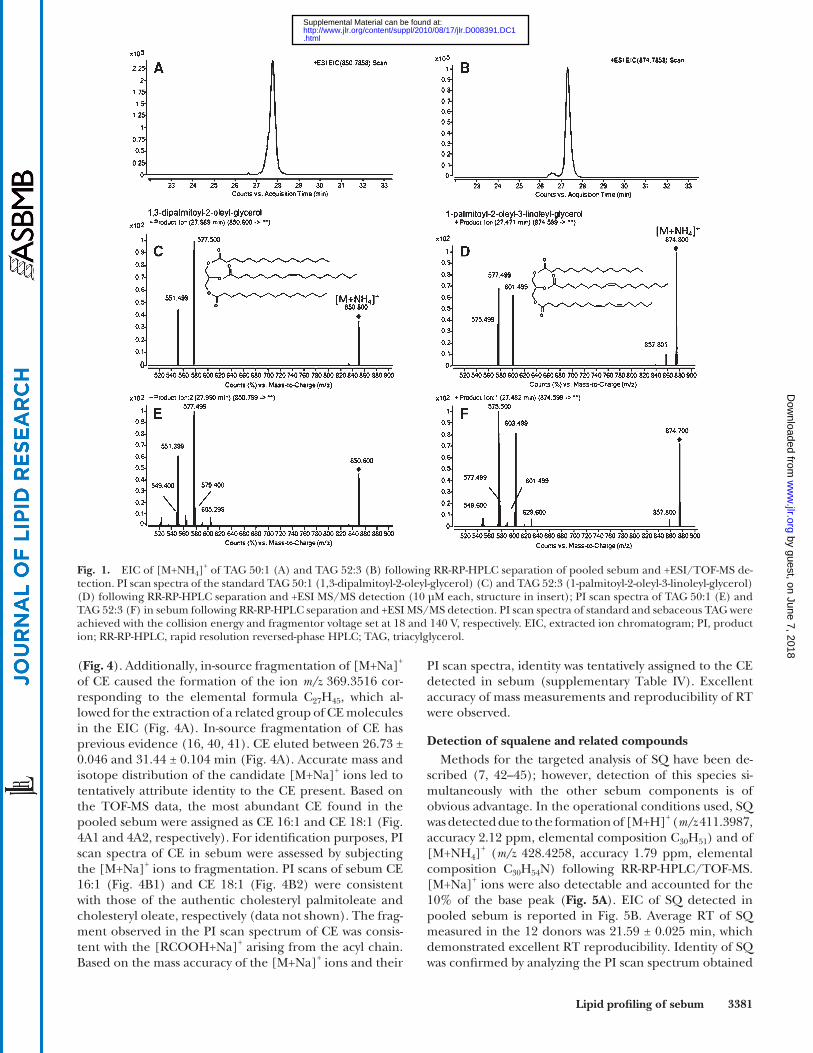
dipalmitoyl-2-oleyl-glycerol (TAG 50:1) and 1-palmitoyl-2-oleoyl-3-linoleyl glycerol (TAG 52:3) showed that [M+NH 4 ] + ions were promptly generated with positive ion ESI (+ESI) in the presence of ammonium formate, as pre-viously demonstrated ( 24–33 ). Mass accuracy and isotope distribution of the [M+NH 4 ] + ions indicated that the ele-mental composition was C 53 H 103 NO 6 and C 55 H 104 NO 6 for the ions with m/z 850.7871 (mass accuracy 1.42 ppm), and 874.7866 (mass accuracy 0.64 ppm) for the synthetic TAG 50:1 and TAG 52:3, respectively. [M+NH 4 ] + was the base peak, whereas [M+Na] + was on average the 30% of the base peak, and [M+H] + had little-to-negligible abundance (data not shown). Following RR-RP-HPLC/TOF-MS analy-sis of sebum, EIC of the calculated m/z 850.7858 ( Fig. 1A ) and m/z 874.7858 ( Fig. 1B ) for TAG 50:1 and TAG 52:3, respectively, showed that TAG isobaric with the authentic reference compounds were present in the pooled sebum at comparable RT. For structural elucidation, both stan-dard and corresponding sebaceous TAG were subjected to MS/MS fragmentation. In agreement with previous re-ports ( 17, 24, 30–34 ), fragment ions in the PI scans of the standard TAG 50:1 ( Fig. 1C ) and TAG 52:3 ( Fig. 1D ) were due to the NL of RCOONH 4 for each acyl chain. PI scans of ions with m/z 850.8 ( Fig. 1E ) and m/z 874.8 ( Fig. 1F ) in sebum confi rmed their identity as TAG species. Neverthe-less, MS/MS spectra of the sebaceous TAG 50:1 and TAG 52:3 demonstrated that different isomers were present. While the prominent TAG 50:1 isoform was consistent with dipalmitoyl-oleyl-glycerol, the most abundant TAG 52:3 isoform in sebum was tentatively characterized as dioleyl-palmitoleyl-glycerol. MS/MS experiments were run with the QqQ MS to attempt to identify the whole reper-toire of TAG in sebum. Details of the MS/MS spectra of TAG in sebum are to be described in later report. The RR-RP-HPLC/TOF-MS analysis showed that TAG were eluted between 22.4 ± 0.04 and 35.1 ± 0.26 min. The [M+NH 4 ] + ions of TAG in sebum ranged from m/z 654,5660 ± 0,0014 (C 39 H 76 NO 6 , TAG 36:1) to m/z 948,8940 ± 0,0007 (C 60 H 118 NO 6 , TAG 57:1). Within this mass range, a total of 95 TAG families were identifi ed that from 0 to 5 DB. Sup-plementary Table I summarizes RT, calculated and aver-age m/z of the base mass peak, and mass error detected for the TAG species found in the 12 donors. The majority of the peaks obtained in the EIC of TAG showed a non-symmetrical peak shape, indicating that more than one isobaric TAG species was present (data not shown). Nev-ertheless, it was not excluded that isobaric [M+NH 4 ] + ions could populate apparently monocomponent chromato-graphic peaks. Various isobaric TAG could be derived from either different acyl chains, which in total accounted for the same ACN and DB, or from TAG regioisomers ( 22 ). As reported in supplementary Table I, an excellent reproducibility of the RT of TAG in sebum from the ana-lyzed donors was observed.
The +ESI/TOF-MS spectra of the authentic 1,2-dioleoyl-glycerol (DAG 36:2) and sebaceous DAG showed a preva-lent formation of their ammoniated adducts in the
by guest, on June 7, 2018w
ww
.jlr.orgD
ownloaded from
.html http://www.jlr.org/content/suppl/2010/08/17/jlr.D008391.DC1Supplemental Material can be found at:
Lipid profi ling of sebum 3381
PI scan spectra, identity was tentatively assigned to the CE detected in sebum (supplementary Table IV). Excellent accuracy of mass measurements and reproducibility of RT were observed.
Detection of squalene and related compounds Methods for the targeted analysis of SQ have been de-
scribed ( 7, 42–45 ); however, detection of this species si-multaneously with the other sebum components is of obvious advantage. In the operational conditions used, SQ was detected due to the formation of [M+H] + ( m/z 411.3987, accuracy 2.12 ppm, elemental composition C 30 H 51 ) and of [M+NH 4 ] + ( m/z 428.4258, accuracy 1.79 ppm, elemental composition C 30 H 54 N) following RR-RP-HPLC/TOF-MS. [M+Na] + ions were also detectable and accounted for the 10% of the base peak ( Fig. 5A ). EIC of SQ detected in pooled sebum is reported in Fig. 5B . Average RT of SQ measured in the 12 donors was 21.59 ± 0.025 min, which demonstrated excellent RT reproducibility. Identity of SQ was confi rmed by analyzing the PI scan spectrum obtained
( Fig. 4 ). Additionally, in-source fragmentation of [M+Na] + of CE caused the formation of the ion m/z 369.3516 cor-responding to the elemental formula C 27 H 45 , which al-lowed for the extraction of a related group of CE molecules in the EIC ( Fig. 4A ). In-source fragmentation of CE has previous evidence ( 16, 40, 41 ). CE eluted between 26.73 ± 0.046 and 31.44 ± 0.104 min ( Fig. 4A ). Accurate mass and isotope distribution of the candidate [M+Na] + ions led to tentatively attribute identity to the CE present. Based on the TOF-MS data, the most abundant CE found in the pooled sebum were assigned as CE 16:1 and CE 18:1 (Fig. 4A1 and 4A2, respectively). For identifi cation purposes, PI scan spectra of CE in sebum were assessed by subjecting the [M+Na] + ions to fragmentation. PI scans of sebum CE 16:1 (Fig. 4B1) and CE 18:1 (Fig. 4B2) were consistent with those of the authentic cholesteryl palmitoleate and cholesteryl oleate, respectively (data not shown). The frag-ment observed in the PI scan spectrum of CE was consis-tent with the [RCOOH+Na] + arising from the acyl chain. Based on the mass accuracy of the [M+Na] + ions and their
Fig. 1. EIC of [M+NH 4 ] + of TAG 50:1 (A) and TAG 52:3 (B) following RR-RP-HPLC separation of pooled sebum and +ESI/TOF-MS de-tection. PI scan spectra of the standard TAG 50:1 (1,3-dipalmitoyl-2-oleyl-glycerol) (C) and TAG 52:3 (1-palmitoyl-2-oleyl-3-linoleyl-glycerol) (D) following RR-RP-HPLC separation and +ESI MS/MS detection (10 µM each, structure in insert); PI scan spectra of TAG 50:1 (E) and TAG 52:3 (F) in sebum following RR-RP-HPLC separation and +ESI MS/MS detection. PI scan spectra of standard and sebaceous TAG were achieved with the collision energy and fragmentor voltage set at 18 and 140 V, respectively. EIC, extracted ion chromatogram; PI, product ion; RR-RP-HPLC, rapid resolution reversed-phase HPLC; TAG, triacylglycerol.
by guest, on June 7, 2018w
ww
.jlr.orgD
ownloaded from
.html http://www.jlr.org/content/suppl/2010/08/17/jlr.D008391.DC1Supplemental Material can be found at:

3382 Journal of Lipid Research Volume 51, 2010
(FFA 18:2), such as 272.2584 (C 16 H 34 NO 2 ) and 298.2741 (C 18 H 36 NO 2 ), respectively, assisted the defi nition of the general ionization behavior of FFA in the +ESI. On the basis of the mass accuracy of the isotopic distribution, var-ious FFA were tentatively identifi ed in sebum analyzed in the positive ion mode (data not shown). When the nega-tive ion mode was used, responses of standard FFA 16:1 and 18:2 were increased from 2- to 10-fold (data not shown). Thus, detecting FFA in the negative ion mode re-sulted in a higher sensitivity and specifi city for the FFA compounds. Negative ions ESI ( � ESI) allowed the acqui-sition of accurate m/z of [M-H] � of the above authentic FFA 16:1 and FFA 18:2 and of the species tentatively iden-tifi ed as FFA in the +ESI mode. Additional FFA species, which were below the sensitivity in the +ESI mode, were detectable in the � ESI mode. Under the conditions of RR-RP-HPLC separation and � ESI/TOF-MS detection, numerous FFA were tentatively identifi ed. The species assigned as FFA had a chain length ranging between 12 and 30 CN; their unsaturation degrees were between 0 and 4 DB (supplementary Table V). Excellent reproduc-ibility of RT, determined at the maximal abundance of the EIC acquired for the different donors, was observed (sup-plementary Table V). Authentic standards are available for the majority of common FFA recognized in sebum. Due to the elevated number of candidate FFA, unequivocal identifi cation of all species by comparison with reference compounds was costly and beyond the scope of the study.
for this compound with collision energy of 16 V ( Fig. 5C ). The PI scan spectrum of SQ in sebum was consistent with that acquired for the standard SQ analyzed under the same conditions (data not shown). An unidentifi ed peak ap-peared consistently in the total ion chromatogram (TIC) acquired for all donors. The peak presented the +ESI/TOF-MS spectrum reported in Fig. 5D , which was consis-tent with previous fi ndings demonstrating the existence of squalene epoxide in fi ngerprints ( 46 ). The detected m/z 409.3829, 427.3934, 444.4201, and 449.3754, which were attributed with to the ion formulae C 30 H 49 ([M+H-H 2 O] + ), C 30 H 51 O ([M+H] + ), C 30 H 54 NO ([M+NH 4 ] + ), and C 30 H 50 NaO ([M+Na] + ), respectively, were consistent with an oxygenated SQ derivative. EIC of m/z 427.3934 in pooled sebum is re-ported in Fig. 5E . Average RT of relative peaks in the EIC of the analyzed donors was 19.64 ± 0.036 min. PI scans of the [M+H] + ion ( m/z 427.3934) and its dehydrated product [M+H-H 2 O] + ( m/z 409.3829) demonstrated that the un-known compound shared with SQ the region of lower m/z , which was consistent with an isoprenoid structure ( Fig. 5F ). Based on this evidence, the unknown compound was ten-tatively identifi ed as SQ epoxide.
Detection of free fatty acids FFA were detected as [M+NH 4 ] + adducts in the +ESI
mode. Exact mass and isotope distribution, which were de-termined with TOF-MS for the [M+NH 4 ] + ions of the authentic palmitoleic acid (FFA 16:1) and linoleic acid
Fig. 2. Structure of 1,2 dioleyl-glycerol (DAG 36:2) and ions formed with +ESI (A), +ESI/TOF-MS spectrum (B), and PI scan spectrum (C) of chromatographed standard DAG 36:2. EIC of [M+NH 4 ] + ion (D) and PI scan spectrum of sebaceous DAG 36:2 following RR-RP-HPLC separation of pooled sebum. PI scans of standard and sebaceous DAG 36:2 were achieved with the collision energy and the fragmentor voltage set at 14 and 140 V, respectively. DAG, diacylglycerol; EIC, extracted ion chromatogram; PI, product ion; RR-RP-HPLC, rapid resolu-tion reversed-phase HPLC; TOF, time of fl ight.
by guest, on June 7, 2018w
ww
.jlr.orgD
ownloaded from
.html http://www.jlr.org/content/suppl/2010/08/17/jlr.D008391.DC1Supplemental Material can be found at:

Lipid profi ling of sebum 3383
sebum. Their RT, accurate mass, and isotope distribution were consistent with those of the corresponding FFA detected in sebum samples (data not shown). Partially resolved chromatographic peaks were suggestive of the presence of different isoforms of FFA with an odd CN. The
In contrast, as a proof of concept, RT and accurate mass were detected for a selected group of authentic FFA, in-cluding palmitic acid (FFA 16:0), stearic acid (FFA 18:0), oleic acid (FFA 18:1), and linolenic acid (FFA 18:3), which were analyzed under the same experimental conditions as
Fig. 3. Structure and fragmentation pattern of authentic lauryl palmitoleate (FA 16:1-WE 28:1, upper scheme); PI scan spectra of standard lauryl palmitoleate (A) and of the isobaric FA 16:1-WE 28:1 in sebum (B); PI scan spectra of the major FA 16:1-WE identifi ed in sebum (D–G). PI scans of standard and sebaceous WE were achieved with the collision energy and the fragmentor voltage set at 18 and 140 V, respectively. PI, product ion; WE, wax ester.
Fig. 4. Structure and fragmentation scheme of CE (upper right); EIC of total CE (A), CE 16:1 (A1), and CE 18:1 (A2) following RR-RP-HPLC separation and +ESI/TOF-MS detection of pooled sebum; PI scan spectra of CE 16:1 (B1), and CE 18:1 (B2) in sebum separated in the same chromatographic conditions. PI scans of CE were achieved with the collision energy and the fragmentor voltage set at 24 and 140 V, respectively. CE, cholesteryl/cholesterol ester; EIC, extracted ion chromatogram; PI, product ion; RR-RP-HPLC, rapid resolution reversed-phase HPLC; TOF, time of fl ight.
by guest, on June 7, 2018w
ww
.jlr.orgD
ownloaded from
.html http://www.jlr.org/content/suppl/2010/08/17/jlr.D008391.DC1Supplemental Material can be found at:

3384 Journal of Lipid Research Volume 51, 2010
relative to the total TAG area was plotted against the ACN. TAG grouped by their unsaturation degree presented the following distribution: DB:1 (38.0%) > DB:2 (29.8%) > DB:0 (19.6%) > DB:3 (10.9%) > DB:4 (2.2%) > DB:5 (0.3%). The abundance of the collective TAG subgroups was not corrected by a response factor theoretically correlated with the unsaturation degree ( 26–29 ). Nevertheless, it is likely that TAG DB:1 accounted for the most abundant portion of total TAG in the analyzed donors even after correction, as its summed area was greater than all the other unsaturated TAG. Moreover, our fi nding was in line with the indication that sebum is composed mainly by mono-unsaturated fatty acyls ( 49 ). Experiments are in progress to defi ne response factors of sebaceous TAG with different unsaturation degrees. In contrast, TAG with the same DB were likely to have the same response factor. TAG pro-fi led according to their unsaturation degree showed a pecu-liar distribution into subgroups with an even and an odd ACN. In each subclass, percentages were signifi cantly dif-ferent between TAG with an even and TAG with an odd ACN. TAG with an even ACN were more abundant than the TAG with an odd ACN.
Profi les of distribution of DAG were obtained after sorting species by their DB number ( Fig. 7 ). Relative abundance of DAG was plotted against their ACN. Col-lectively, saturated and monounsaturated DAG presented comparable abundance, whereas DAG with two DB were expressed at lower extent. Differences in the relative abundance of DAG with an even and an odd ACN were apparent.
FFA 15:0, 15:1, 17:0, and 17:1 appeared to be present in different isoforms (supplementary Fig. I). FFA with an odd number of carbon atoms could have a straight chain or a branched side chain. Bound and free FA in sebum have been described to possess iso- and anteiso-branched car-bon chains ( 47, 48 ). FFA 18:2 also appeared in different isoforms in sebum (supplementary Fig. IIA). The fi rst eluted peak had the same RT of the FFA 18:2 linoleic acid (9Z,12Z-octadecadienoic acid) (supplementary Fig. IIB). Identifi cation of the second eluting peak was not pursued due to the commercial unavailability of reference com-pounds for the candidate FFA 18:2 sebaleic acid (5Z,8Z octadecadienoic acid). Experiments are in progress to ad-dress separation of sebaceous FFA with respect to DB posi-tioning and ramifi cations.
Within-class distribution of sebaceous lipids Data from individual sebum samples were analyzed to
obtain profi les of distribution of lipid species within the same lipid class. Based on the excellent mass accuracy and reproducibility of RT reported above, the RR-RP-HPLC/TOF-MS data were feasible for sebaceous lipid profi ling. Relative abundance of each member within the respective lipid classes was obtained as described above. The 12 do-nors displayed consistent patterns of distribution of the compounds within each lipid class.
Profi le of distribution of acylglycerols Fig. 6 depicts the within-class distribution of TAG rec-
ognized in sebum. The abundance of individual TAG
Fig. 5. +ESI/TOF-MS spectrum (A), EIC of the [M+H] + ion (B), and PI scan spectrum (C) of squalene following RR-RP-HPLC separation of pooled sebum; +ESI/TOF-MS spectrum (D), and EIC of the [M+H] + ion (E) of oxygenated squalene. PI scan spectra of oxygenated squalene were obtained by fragmenting the [M+H] + (F, upper panel) and the [M+H-H 2 O] + ions (F, lower panel). In the PI scan mode, the collision energy and the fragmentor voltage were set at 16 and 140 V, respectively. EIC, extracted ion chromatogram; PI, product ion; RR-RP-HPLC, rapid resolution reversed-phase HPLC; TOF, time of fl ight.
by guest, on June 7, 2018w
ww
.jlr.orgD
ownloaded from
.html http://www.jlr.org/content/suppl/2010/08/17/jlr.D008391.DC1Supplemental Material can be found at:

Lipid profi ling of sebum 3385
the other CE in sebum ( Fig. 8 ). SQ is a monocomponent fraction of sebum. Absolute quantifi cation of SQ was not attempted because it was beyond the purpose of this study. However, to test consistency of SQ detection across the do-nors, abundance of SQ was determined relative to that of CE. The ratio between the area of the [M+H] + ion of SQ and the area of total CE obtained from the EIC of m/z 369.3516 (SQ/CE ratio) was calculated in the 12 samples. The average SQ/CE ratio was 0.19 ± 0.07.
Profi le of distribution of free fatty acids Profi les of relative abundance versus CN in the subgroups
of FFA with the same DB number were obtained (supple-mentary Fig. IV). Collectively, saturated (supplementary Fig. IVA) and monounsaturated FFA (supplementary Fig. IVB) presented comparable relative abundance. Doubly and polyunsaturated FFA (supplementary Fig. IVC and D, respectively) were considerably less abundant. In the DB:0, DB:1, and DB:2 subgroups, relative abundances were signifi cantly different between FFA with an even CN and
Profi le of distribution of wax esters, cholesterol esters, and relative squalene abundance
Relative abundance of WE with DB:1 and DB:2, which included contributions from FA 16:1-WE and isobaric WE, was calculated in the individual donors and plotted against the CN. Percentages of abundance of WE with one and two DB detected by RR-RP-HPLC/TOF-MS are reported in supplementary Fig. IIIA and B, respectively. WE with even CN were more abundant than those with an odd CN. The more abundant species WE 30:1, WE 32:1, and WE 34:1 were prevalently FA 16:1-WE containing FOH 14:0, 16:0, and 18:0, respectively (supplementary Table III). On the other hand, WE 36:2 was the most abundant doubly unsaturated WE, made up prevalently of FA 16:1 and FOH 20:1. This evidence was in agreement with earlier fi ndings achieved with different methods ( 4 ). Analogous to the other sebum components, this strategy allowed delineat-ing distributions of CE in healthy sebum samples without attempting absolute quantifi cation. Interestingly, CE 16:1 presented a considerably high expression compared with
Fig. 6. Relative abundance of TAG within the same lipid class in sebum. TAG were subgrouped by their DB number. Percentage of TAG was plotted against ACN in each subgroup. Data were reported as mean ± SD calculated for the 12 sebum donors. Full and dashed lines represent TAG with an even and an odd ACN, respectively. ACN, acyl carbon number; DB, double bond; TAG, triacylglycerol.
Fig. 7. Relative abundance of DAG within the same lipid class in sebum. DAG were subgrouped by their DB number. Percentage of DAG was plotted against ACN in each DB:0, DB:1, and DB:2 subgroup. Data were reported as mean ± SD calculated for the 12 sebum donors. Full and dashed lines represent DAG with an even and an odd ACN, respectively. ACN, acyl carbon number; DAG, diacylglycerol; DB, double bond.
by guest, on June 7, 2018w
ww
.jlr.orgD
ownloaded from
.html http://www.jlr.org/content/suppl/2010/08/17/jlr.D008391.DC1Supplemental Material can be found at:

3386 Journal of Lipid Research Volume 51, 2010
The identifi cation of an analytical method that allows for the comprehensive detection of intact lipids is indispens-able for profi ling purposes. In this study, we explored the use of RR-RP-HPLC as a chromatographic system for the simultaneous separation of lipids that are known to be present in sebum and that belong to chemically distinct lipid classes. We demonstrated that the molecular species present in sebum can be effi ciently separated by RR-RP-HPLC on a C8 stationary phase with sub 2 µm particle size. The use of RR-RP-HPLC allowed for the elution of the sebaceous lipids in a relatively short period of time, es-pecially when compared with the complexity of the lipid mixture. Additionally, we reported that separation using the RR-RP-HPLC produced excellent reproducibility of RT for all species present in the sebum of different do-nors. Coupling RR-RP-HPLC and TOF-MS with an ESI interface has been exploited for the identifi cation of struc-turally related compounds on the basis of highly accurate mass measurement and isotopic distribution, thereby al-lowing for the prediction of the elemental composition of the species present. The addition of ammonium ions en-hanced sensitivity and improved stability of the signal in the ESI mode, which concurred with previous observations ( 24–31 ). In our system, species belonging to all lipid classes, with the exception of CE, formed adducts with ammonium ions.
By pairing accurate mass detection with MS/MS data, we identifi ed 95 and 29 families of TAG and DAG, respec-tively, characterized by different ACN and degrees of unsaturation. TAG are the most abundant lipid class in sebum. Information regarding the distribution of TAG in sebum with respect to their size and degree of unsatura-tion has been provided here for the fi rst time. Previous studies using methods based on hydrolysis of acylglycerols have shown that FA with an odd CN participate in the ester bond of sebaceous TAG. Collectively, TAG with an odd ACN were detected with a relative abundance lower than those with an even ACN. In cellular metabolic processes, DAG serve as crucial intermediates for the biosynthesis and remodeling of other fatty acyl containing lipids, such as TAG, WE, and CE. In sebum, DAG can arise also from the degradation of TAG by endogenous or bacterial lipases ( 49 ). However, defi nitive data regarding the processes re-sponsible for the abundance of DAG in sebum is lacking. Simultaneous detection of TAG and DAG offers a new tool for studying the relationship between these closely related classes of lipids. WE, which represent a very signifi cant lipid category in sebum, were also characterized in the se-baceous mixture ( 5, 49 ). The majority of the WE were shown to contain an FA 16:1 acyl group. We also identifi ed the type and the relative abundance of CE in sebum. CE serve as a form of cholesterol storage in most cells. Similar to other components of sebum, CE are released onto the skin surface through sebaceous gland secretion ( 5, 49 ). Defi nitive identifi cation of the role(s) played by CE in se-bum is as yet undiscovered. In contrast with the complex-ity of acylglycerols and WE, CE were found to be a less diverse group of neutral lipids. Nine CE, mostly bearing monounsaturated fatty acyl chains, were detected in se-
an odd CN. Polyunsaturated FFA with three and four DB were detected exclusively as having even CN (supplemen-tary Fig. IVD).
DISCUSSION
To the best of our knowledge, this is the fi rst report on the features of intact lipids in sebum. The method adopted in this study provided information on the range of carbon atoms and the number of double bonds in seba-ceous lipid components, which were detected in their intact form. Accurate mass measurements and RT were highly reproducible across sebum sampled from 12 do-nors. Therefore, it was possible to accurately characterize the mass and RT of compounds profi led in sebum, which demonstrated consistent lipid distribution in different donor samples. The distribution profi les of same-class compounds were analyzed regardless of normalization with internal standards.
Historically, identifi cation of intact neutral lipids in sebaceous secretion has been a considerable challenge for chromatographers and mass spectrometers, mainly due to the complex nature of the mixture, hydrophobic-ity of the components, negligible volatility, and diffi culties in ionization. Within the last decade, numerous studies have improved current approaches and have identifi ed novel analytical methods for investigating neutral and polar lipids. Moreover, these methods have allowed lipid characterization at the level of individual components or molecular species. Acylglycerols, CE, and WE exist as multiple entities that only differ in the features of the fatty acyl chain, and in the case of DAG and TAG, in the position of the ester on the glycerol backbone. The ma-jority of analytical approaches focusing on neutral lipids have attempted to separate and characterize single groups instead of simultaneously detecting different classes of lipids.
An analytical method with the ability to detect multiple classes of lipids is paramount in the investigation of native components of sebum, and we have addressed this in the present study. The presence of TAG, DAG, WE, CE, SQ, and FFA in sebum has been well documented ( 1–6, 12, 13 ).
Fig. 8. Distribution profi le of CE detected in sebum. Data repre-sent abundance of individual CE relative to the total CE area and were reported as mean ± SD calculated following RR-RP-HPLC/TOF-MS analysis of sebum from the 12 donors. CE, cholesteryl/cholesterol ester; RR-RP-HPLC, rapid resolution reversed-phase HPLC; TOF, time of fl ight.
by guest, on June 7, 2018w
ww
.jlr.orgD
ownloaded from
.html http://www.jlr.org/content/suppl/2010/08/17/jlr.D008391.DC1Supplemental Material can be found at:

Lipid profi ling of sebum 3387
4 . Nicolaides , N. , H. C. Fu , M. N. Ansari , and G. R. Rice . 1972 . The fatty acids of wax esters and sterol esters from vernix caseosa and from human skin surface lipid. Lipids . 7 : 506 – 517 .
5 . Nicolaides , N. 1974 . Skin lipids: their biochemical uniqueness. Science . 186 : 19 – 26 .
6 . Capitanio , B. , J. L. Sinagra , M. Ottaviani , V. Bordignon , A. Amantea , and M. Picardo . 2007 . ‘Smoker’s acne’: a new clinical entity? Br. J. Dermatol. 157 : 1070 – 1071 .
7 . Ekanayake Mudiyanselage , S. , M. Hamburger , P. Elsner , and J. J. Thiele . 2003 . Ultraviolet A induces generation of squalene mono-hydroperoxide isomers in human sebum and skin surface lipids in vitro and in vivo. J. Invest. Dermatol. 120 : 915 – 922 .
8 . Patterson , B. W. , G. Zhao , N. Elias , D. L. Hachey , and S. Klein . 1999 . Validation of a new procedure to determine plasma fatty acid con-centration and isotopic enrichment. J. Lipid Res. 40 : 2118 – 2124 .
9 . Lee , S. H. , C. Pettinella , and I. A. Blair . 2006 . LC/ESI/MS analysis of saturated and unsaturated fatty acids in rat intestinal epithelial cells. Curr. Drug Metab. 7 : 929 – 937 .
10 . Pettinella , C. , S. H. Lee , F. Cipollone , and I. A. Blair . 2007 . Targeted quantitative analysis of fatty acids in atherosclerotic plaques by high sensitivity liquid chromatography/tandem mass spectrometry. J. Chromatogr. B Analyt. Technol. Biomed. Life Sci. 850 : 168 – 176 .
11 . Araujo , P. , T. T. Nguyen , L. Frøyland , J. Wang , and J. X. Kang . 2008 . Evaluation of a rapid method for the quantitative analysis of fatty acids in various matrices. J. Chromatogr. A . 1212 : 106 – 113 .
12 . Nordstrom , K. M. , H. G. Schmus , K. J. McGinley , and J. J. Leyden . 1986 . Measurement of sebum output using a lipid absorbent tape. J. Invest. Dermatol. 87 : 260 – 263 .
13 . Pappas , A. , M. Anthonavage , and J. S. Gordon . 2002 . Metabolic fate and selective utilization of major fatty acids in human sebaceous gland. J. Invest. Dermatol. 118 : 164 – 171 .
14 . Robosky , L. C. , K. Wade , D. Woolson , J. D. Baker , M. L. Manning , D. A. Gage , and M. D. Reily . 2008 . Quantitative evaluation of sebum lipid components with nuclear magnetic resonance. J. Lipid Res. 49 : 686 – 692 .
15 . Sommer , U. , H. Herscovitz , F. K. Welty , and C. E. Costello . 2006 . LC-MS-based method for the qualitative and quantitative analysis of complex lipid mixtures. J. Lipid Res. 47 : 804 – 814 .
16 . Hutchins , P. M. , R. M. Barkley , and R. C. Murphy . 2008 . Separation of non polar neutral lipids by normal phase chromatography and analysis by electrospray ionization mass spectrometry. J. Lipid Res. 49 : 804 – 813 .
17 . Holcapek , M. , P. Jandera , P. Zderadicka , and L. Hrubá . 2003 . Characterization of triacylglycerol and diacylglycerol composi-tion of plant oils using high-performance liquid chromatography-atmospheric pressure chemical ionization mass spectrometry. J. Chromatogr. A . 1010 : 195 – 215 .
18 . Nagy , K. , D. Bongiorno , G. Avellone , P. Agozzino , L. Ceraulo , and K. Vékey . 2005 . High performance liquid chromatography-mass spectrometry based chemometric characterization of olive oils. J. Chromatogr. A . 1078 : 90 – 97 .
19 . Nagy , K. , A. Jakab , J. Fekete , and K. Vékey . 2004 . An HPLC-MS ap-proach for analysis of very long chain fatty acids and other apolar compounds on octadecyl-silica phase using partly miscible solvents. Anal. Chem. 76 : 1935 – 1941 .
20 . Lísa , M. , M. Holcapek , T. Rezanka , and N. Kabátová . 2007 . High-performance liquid chromatography-atmospheric pressure chemi-cal ionization mass spectrometry and gas chromatography-fl ame ionization detection characterization of Delta5-polyenoic fatty ac-ids in triacylglycerols from conifer seed oils. J. Chromatogr. A . 1146 : 67 – 77 .
21 . Lísa , M. , and M. Holcapek . 2008 . Triacylglycerols profi ling in plant oils important in food industry, dietetics and cosmetics using high-performance liquid chromatography-atmospheric pressure chemical ionization mass spectrometry. J. Chromatogr. A . 1198–1199: 115–130.
22 . Fauconnot , L. , J. Hau , J. M. Aeschlimann , L. B. Fay , and F. Dionisi . 2004 . Quantitative analysis of triacylglycerol regioisomers in fats and oils using reversed-phase high-performance liquid chroma-tography and atmospheric pressure chemical ionization mass spec-trometry. Rapid Commun. Mass Spectrom. 18 : 218 – 224 .
23 . Leskinen , H. , J. P. Suomela , and H. Kallio . 2007 . Quantifi cation of triacylglycerol regioisomers in oils and fat using different mass spec-trometric and liquid chromatographic methods. Rapid Commun. Mass Spectrom. 21 : 2361 – 2373 .
24 . McAnoy , A. M. , C. C. Wu , and R. C. Murphy . 2005 . Direct qualita-tive analysis of triacylglycerols by electrospray mass spectrometry using a linear ion trap. J. Am. Soc. Mass Spectrom. 16 : 1498 – 1509 .
bum. In particular, CE appeared to act as a depot for the FA 16:1 in sebum. This evidence may be useful for the identifi cation of a physiological activity of CE. Our fi nd-ings showing that the predominant length of the FA com-ponents in acylglycerols, CE, and WE was of 16 CN is consistent with the characteristic composition of sebum ( 3–5, 49 ). In addition, our method allowed for the simul-taneous detection of SQ, which is specifi c to human se-bum. We also identifi ed a compound structurally related to SQ and tentatively designated it as squalene epoxide. FA are the building blocks of the majority of neutral lipids in sebum. They are found in both bound and free forms in sebum. In this study, we were able to simultaneously detect FFA and neutral lipids in the +ESI mode. However, the sensitivity and specifi city were improved in the –ESI mode. Distribution of FFA in sebum demonstrated that FFA 16:0, FFA 16:1, and FFA 18:1 were the most prevalent. FFA with an even number of carbon atoms that were unsaturated at positions C9, C12, and C15, such as palmitoleic acid (FFA 16:1 � 9), linoleic acid (FFA 18:2 � 9,12), and linolenic acid (FFA 18:3 � 9,12,15), respectively, and even-numbered sat-urated FFA accounted for most of the FFA present. Sapi-enic acid (FFA 16:1 � 6) and sebaleic acid (FFA 18:2 � 5,8) are considered indexes of the lipidogenesis occurring in the sebaceous glands ( 1, 49 ). The presence of these FFA is due to the activity of a � 6 desaturase in the sebaceous gland. Straight or branched FFA with an odd CN are found in sebum due to the utilization of precursors that are dis-tinct from acetyl-CoA for their biosynthesis ( 5, 36 ). Using the method reported here, we detected the presence of FFA typically found in sebaceous secretions. However, ad-ditional experiments are required for a comprehensive HPLC/MS characterization of FFA with uncommon DB positioning and branching.
Taken together, we have identifi ed a method for char-acterizing sebaceous lipids that requires minimal sample preparation and allows for the analysis of individual species in complex mixtures in their intact form. This method allows for the high throughput analysis of seba-ceous lipids based on the accurate mass and reproduc-ible RT of the chromatographic separation. This method also has the potential to identify reciprocal relationships between different sebaceous lipid classes and thereby fa-cilitate the investigation of pathways involved in their me-tabolism.
The authors are grateful to Steve Fischer and Theodore Sana (Agilent Technologies, Santa Clara, CA) for their useful input in the method setup.
REFERENCES
1 . Smith , K. R. , and D. M. Thiboutot . 2008 . Thematic review series: skin lipids. Sebaceous gland lipids: friend or foe? J. Lipid Res. 49 : 271 – 281 .
2 . Picardo , M. , M. Ottaviani , E. Camera , and A. Mastrofrancesco . 2009 . Sebaceous gland lipids. Dermatoendocrinol. 1 : 68 – 71 .
3 . Nicolaides , N. , M. N. Ansari , H. C. Fu , and D. G. Lindsay . 1970 . Lipid composition on comedones compared with that of human skin surface in acne patients. J. Invest. Dermatol. 54 : 487 – 495 .
by guest, on June 7, 2018w
ww
.jlr.orgD
ownloaded from
.html http://www.jlr.org/content/suppl/2010/08/17/jlr.D008391.DC1Supplemental Material can be found at:

3388 Journal of Lipid Research Volume 51, 2010
25 . Ryhage , R. , and E. Stenhagen . 1960 . Mass spectrometry in lipid re-search. J. Lipid Res. 1 : 361 – 390 .
26 . Murphy , R. C. , P. F. James , A. M. McAnoy , J. Krank , E. Duchoslav , and R. M. Barkley . 2007 . Detection of the abundance of diacylglyc-erol and triacylglycerol molecular species in cells using neutral loss mass spectrometry. Anal. Biochem. 366 : 59 – 70 .
27 . Gakwaya , R. , X. Li , Y. L. Wong , S. Chivukula , E. J. Collins , and J. J. Evans . 2007 . Examining the collision-induced decomposition spec-tra of ammoniated triglycerides. III. The linoleate and arachido-nate series. Rapid Commun. Mass Spectrom. 21 : 3262 – 3268 .
28 . Li , X. , E. J. Collins , and J. J. Evans . 2006 . Examining the collision-induced decomposition spectra of ammoniated triglycerides as a function of fatty acid chain length and degree of unsaturation. II. The PXP/YPY series. Rapid Commun. Mass Spectrom. 20 : 171 – 177 .
29 . Li , X. , and J. J. Evans . 2005 . Examining the collision-induced de-composition spectra of ammoniated triglycerides as a function of fatty acid chain length and degree of unsaturation. I. The OXO/YOY series. Rapid Commun. Mass Spectrom. 19 : 2528 – 2538 .
30 . Byrdwell , W. C. , and W. E. Neff . 2002 . Dual parallel electrospray ionization and atmospheric pressure chemical ionization mass spectrometry (MS), MS/MS and MS/MS/MS for the analysis of tri-acylglycerols and triacylglycerol oxidation products. Rapid Commun. Mass Spectrom. 16 : 300 – 319 .
31 . Malone , M. , and J. J. Evans . 2004 . Determining the relative amounts of positional isomers in complex mixtures of triglycerides using reversed-phase high-performance liquid chromatography-tandem mass spectrometry. Lipids . 39 : 273 – 284 .
32 . Jakab , A. , I. Jablonkai , and E. Forgács . 2003 . Quantifi cation of the ratio of positional isomer dilinoleoyl-oleoyl glycerols in vegetable oils. Rapid Commun. Mass Spectrom. 17 : 2295 – 2302 .
33 . Neff , W. E. , and W. C. Byrdwell . 1998 . Characterization of model triacylglycerol (triolein, trilinolein and trilinolenin) autoxidation products via high performance liquid chromatography coupled with atmospheric pressure chemical ionization mass spectrometry. J. Chromatogr. A . 818 : 169 – 186 .
34 . Ham , B. M. , J. T. Jacob , M. M. Keese , and R. B. Cole . 2004 . Iden-tifi cation, quantifi cation and comparison of major non-polar lipids in normal and dry eye tear lipidomes by electrospray tandem mass spectrometry. J. Mass Spectrom. 39 : 1321 – 1336 .
35 . Fitzgerald , M. , and R. C. Murphy . 2007 . Electrospray mass spec-trometry of human hair wax esters. J. Lipid Res. 48 : 1231 – 1246 .
36 . Butovich , I. A. , E. Uchiyama , M. A. Di Pascuale , and J. P. McCulley . 2007 . Liquid chromatography-mass spectrometric analysis of lipids present in human meibomian gland secretions. Lipids . 42 : 765 – 776 .
37 . Vrkoslav , V. , K. Urbanová , and J. Cva ka . 2010 . Analysis of wax ester molecular species by high performance liquid chromatography/atmospheric pressure chemical ionization mass spectrometry. J. Chromatogr. A . 1217: 41844294.
38 . Butovich , I. A. , E. Uchiyama , and J. P. McCulley . 2007 . Lipids of human meibum:mass-spectrometric analysis and structural elucida-tion. J. Lipid Res. 48 : 2220 – 2235 .
39 . Butovich , I. A. , J. C. Wojtowicz , and M. Molai . 2009 . Human tear fi lm and meibum. Very long chain wax esters and (O-acyl)-omega-hydroxy fatty acids of meibum. J. Lipid Res. 50 : 2471 – 2485 .
40 . Butovich , I. A. 2009 . Cholesteryl esters as a depot for very long chain fatty acids in human meibum. J. Lipid Res. 50 : 501 – 513 .
41 . Nagy , K. , A. Jakab , F. Pollreisz , D. Bongiorno , L. Ceraulo , M. R. Averna , D. Noto , and K. Vékey . 2006 . Analysis of sterols by high-performance liquid chromatography/mass spectrometry combined with chemometrics. Rapid Commun. Mass Spectrom. 20 : 2433 – 2440 .
42 . Acimovic , J. , A. Lövgren-Sandblom , K. Monostory , D. Rozman , M. Golicnik , D. Lutjohann , and I. Björkhem . 2009 . Combined gas chromatographic/mass spectrometric analysis of cholesterol pre-cursors and plant sterols in cultured cells. J. Chromatogr. B Analyt. Technol. Biomed. Life Sci. 877 : 2081 – 2086 .
43 . Nakagawa , K. , D. Ibusuki , Y. Suzuki , S. Yamashita , O. Higuchi , S. Oikawa , and T. Miyazawa . 2007 . Ion-trap tandem mass spectromet-ric analysis of squalene monohydroperoxide isomers in sunlight-exposed human skin. J. Lipid Res. 48 : 2779 – 2787 .
44 . Zambonin , C. G. , C. D. Calvano , L. D’Accolti , and F. Palmisano . 2006 . Laser desorption/ionization time-of-fl ight mass spectrometry of squalene in oil samples. Rapid Commun. Mass Spectrom. 20 : 325 – 327 .
45 . Masukawa , Y. , H. Tsujimura , and G. Imokawa . 2005 . A systematic method for the sensitive and specifi c determination of hair lipids in combination with chromatography. J. Chromatogr. B Analyt. Technol. Biomed. Life Sci. 823 : 131 – 142 .
46 . Mountfort , K. A. , H. Bronstein , N. Archer , and S. M. Jickells . 2007 . Identifi cation of oxidation products of squalene in solution and in latent fi ngerprints by ESI-MS and LC/APCI-MS. Anal. Chem. 79 : 2650 – 2657 .
47 . Nicolaides , N. , and J. M. Apon . 1977 . The saturated methyl branched fatty acids of adult human skin surface lipid. Biomed. Mass Spectrom. 4 : 337 – 347 .
48 . Apon , J. M. , and N. Nicolaides . 1975 . The determination of the position isomers of the methyl branches fatty acids methyl esters by capillary GC/MS. J. Chromatogr. Sci. 13 : 467 – 473 .
49 . Stewart , M. E. 1992 . Sebaceous gland lipids. Semin. Dermatol. 11 : 100 – 105 .
by guest, on June 7, 2018w
ww
.jlr.orgD
ownloaded from
.html http://www.jlr.org/content/suppl/2010/08/17/jlr.D008391.DC1Supplemental Material can be found at:


![for · 1. The type of isomerism shown by the complex [CoCl 2 (en) 2] is (1) Geometrical isomerism (2) Linkage isomerism (3) Ionization isomerism (4) Coordination isomerism Answer](https://static.fdocuments.in/doc/165x107/5ea5e4a5a62be97117265dc3/for-1-the-type-of-isomerism-shown-by-the-complex-cocl-2-en-2-is-1-geometrical.jpg)