METHODS IN MOLECULAR BIOLOGY Cell–Cell...
301
Edited by Sean P. Colgan Cell–Cell Interactions METHODS IN MOLECULAR BIOLOGY ™ 341 Methods and Protocols Edited by Sean P. Colgan Cell–Cell Interactions Methods and Protocols
Transcript of METHODS IN MOLECULAR BIOLOGY Cell–Cell...

Edited by
Sean P. Colgan
Cell–CellInteractions
METHODS IN MOLECULAR BIOLOGY™ 341
Methods and Protocols
Edited by
Sean P. Colgan
Cell–CellInteractionsMethods and Protocols

Cell–Cell Interactions

M E T H O D S I N M O L E C U L A R B I O L O G Y™
John M. Walker, SERIES EDITOR
357. Cardiovascular Proteomics: Methods and Protocols,edited by Fernando Vivanco, 2006
356. Cellomics: Methods and Protocols, edited by KenGuiliano, D. Lansing Taylor, and Jeffrey Haskins, 2006
355. Plant Proteomics: Methods and Protocols, editedby Hervé Thiellement, Michel Zivy, CatherineDamerval, and Valerie Mechin, 2006
354. Plant–Pathogen Interactions: Methods andProtocols, edited by Pamela C. Ronald, 2006
353. DNA Analysis by Nonradioactive Probes: Methodsand Protocols, edited by Elena Hilario and John. F.MacKay, 2006
352. Protein Engineering Protocols, edited by KristianMüller and Katja Arndt, 2006
351. C. elegans: Methods and Applications, edited byKevin Strange, 2006
350. Protein Folding Protocols, edited by Yawen Baiand Ruth Nussinov 2006
349. YAC Protocols, Second Edition, edited by AlasdairMacKenzie, 2006
348. Nuclear Transfer Protocols: Cell Reprogrammingand Transgenesis, edited by Paul J. Verma and AlanTrounson, 2006
347. Glycobiology Protocols, edited by Inka Brockhausen-Schutzbach, 2006
346. Dictyostelium discoideum Protocols, edited byLudwig Eichinger and Francisco Rivero-Crespo, 2006
345. Diagnostic Bacteriology Protocols, Second Edition,edited by Louise O'Connor, 2006
344. Agrobacterium Protocols, Second Edition:Volume 2, edited by Kan Wang, 2006
343. Agrobacterium Protocols, Second Edition:Volume 1, edited by Kan Wang, 2006
342. MicroRNA Protocols, edited by Shao-Yao Ying, 2006341. Cell–Cell Interactions: Methods and Protocols,
edited by Sean P. Colgan, 2006340. Protein Design: Methods and Applications, edited by
Raphael Guerois and Manuela López de la Paz, 2006339. Microchip Capillary Electrophoresis: Methods
and Protocols, edited by Charles Henry, 2006338. Gene Mapping, Discovery, and Expression:
Methods and Protocols, edited by M. Bina, 2006337. Ion Channels: Methods and Protocols, edited by
James D. Stockand and Mark S. Shapiro, 2006336. Clinical Applications of PCR: Second Edition,
edited by Y. M. Dennis Lo, Rossa W. K. Chiu, and K. C.Allen Chan, 2006
335. Fluorescent Energy Transfer Nucleic AcidProbes: Designs and Protocols, edited by VladimirV. Didenko, 2006
334. PRINS and In Situ PCR Protocols: SecondEdition, edited by Franck Pellestor, 2006
333. Transplantation Immunology: Methods and Proto-cols, edited by Philip Hornick and Marlene Rose, 2006
332. Transmembrane Signaling Protocols: Second Edition,edited by Hydar Ali and Bodduluri Haribabu, 2006
331. Human Embryonic Stem Cell Protocols, edited byKursad Turksen, 2006
330. Embryonic Stem Cell Protocols, Second Edition,Vol. II: Differentiation Models, edited by KursadTurksen, 2006
329. Embryonic Stem Cell Protocols, Second Edition,Vol. I: Isolation and Characterization, edited byKursad Turksen, 2006
328. New and Emerging Proteomic Techniques, ed-ited by Dobrin Nedelkov and Randall W. Nelson, 2006
327. Epidermal Growth Factor: Methods and Proto-cols, edited by Tarun B. Patel and Paul J. Bertics, 2006
326. In Situ Hybridization Protocols, Third Edition,edited by Ian A. Darby and Tim D. Hewitson, 2006
325. Nuclear Reprogramming: Methods and Proto-cols, edited by Steve Pells, 2006
324. Hormone Assays in Biological Fluids, edited byMichael J. Wheeler and J. S. Morley Hutchinson, 2006
323. Arabidopsis Protocols, Second Edition, edited byJulio Salinas and Jose J. Sanchez-Serrano, 2006
322. Xenopus Protocols: Cell Biology and SignalTransduction, edited by X. Johné Liu, 2006
321. Microfluidic Techniques: Reviews and Protocols, edited by Shelley D. Minteer, 2006
320. Cytochrome P450 Protocols, Second Edition, editedby Ian R. Phillips and Elizabeth A. Shephard, 2006
319. Cell Imaging Techniques, Methods and Protocols, edited by Douglas J. Taatjes and Brooke T. Mossman,2006
318. Plant Cell Culture Protocols, Second Edition, editedby Victor M. Loyola-Vargas and Felipe Vázquez-Flota,2005
317. Differential Display Methods and Protocols, SecondEdition, edited by Peng Liang, Jonathan Meade, andArthur B. Pardee, 2005
316. Bioinformatics and Drug Discovery, edited byRichard S. Larson, 2005
315. Mast Cells: Methods and Protocols, edited by GuhaKrishnaswamy and David S. Chi, 2005
314. DNA Repair Protocols: Mammalian Systems, SecondEdition, edited by Daryl S. Henderson, 2006
313. Yeast Protocols: Second Edition, edited by WeiXiao, 2005
312. Calcium Signaling Protocols: Second Edition,edited by David G. Lambert, 2005
311. Pharmacogenomics: Methods and Protocols,edited by Federico Innocenti, 2005
310. Chemical Genomics: Reviews and Protocols,edited by Edward D. Zanders, 2005
309. RNA Silencing: Methods and Protocols, edited byGordon Carmichael, 2005
308. Therapeutic Proteins: Methods and Protocols,edited by C. Mark Smales and David C. James, 2005
307. Phosphodiesterase Methods and Protocols,edited by Claire Lugnier, 2005
306. Receptor Binding Techniques: Second Edition,edited by Anthony P. Davenport, 2005
305. Protein–Ligand Interactions: Methods andApplications, edited by G. Ulrich Nienhaus, 2005
304. Human Retrovirus Protocols: Virology andMolecular Biology, edited by Tuofu Zhu, 2005
303. NanoBiotechnology Protocols, edited by Sandra J.Rosenthal and David W. Wright, 2005
302. Handbook of ELISPOT: Methods and Protocols,edited by Alexander E. Kalyuzhny, 2005

M E T H O D S I N M O L E C U L A R B I O L O G Y™
Cell–Cell InteractionsMethods and Protocols
Edited by
Sean P. ColganCenter for Experimental Therapeutics and Reperfusion Injury
Brigham and Women's Hospital, Havard Medical School Boston, MA

© 2006 Humana Press Inc.999 Riverview Drive, Suite 208Totowa, New Jersey 07512
www.humanapress.com
All rights reserved. No part of this book may be reproduced, stored in a retrieval system, or transmitted inany form or by any means, electronic, mechanical, photocopying, microfilming, recording, or otherwisewithout written permission from the Publisher. Methods in Molecular BiologyTM is a trademark of TheHumana Press Inc.
All papers, comments, opinions, conclusions, or recommendations are those of the author(s), and do notnecessarily reflect the views of the publisher.
This publication is printed on acid-free paper. ∞ANSI Z39.48-1984 (American Standards Institute) Permanence of Paper for Prined Library Materials.
Production Editor: Melissa Caravella
Cover design by Patricia F. Cleary
Cover illustration: From Fig. 2 in Chapter 3, “The Role of Junctional Adhesion Molecules in InteractionsBetween Vascular Cells,” by Triantafyllos Chavakis and Valeria Orlova.
For additional copies, pricing for bulk purchases, and/or information about other Humana titles, contactHumana at the above address or at any of the following numbers: Tel.: 973-256-1699; Fax: 973-256-8341;E-mail: [email protected]; or visit our Website: www.humanapress.com
Photocopy Authorization Policy:Authorization to photocopy items for internal or personal use, or the internal or personal use of specificclients, is granted by Humana Press Inc., provided that the base fee of US $30.00 per copy is paid directlyto the Copyright Clearance Center at 222 Rosewood Drive, Danvers, MA 01923. For those organizationsthat have been granted a photocopy license from the CCC, a separate system of payment has been arrangedand is acceptable to Humana Press Inc. The fee code for users of the Transactional Reporting Service is:[1-58829-523-0/06 $30.00].
Printed in the United States of America. 10 9 8 7 6 5 4 3 2 1
eISBN 1-59745-113-4
ISSN 1064-3745
Library of Congress Cataloging-in-Publication Data
Cell–cell interactions : methods and protocols / edited by Sean P. Colgan.
p. ; cm. -- (Methods in molecular biology, ISSN 1064-3745 ; . 341)
Includes bibliographical references and index.
ISBN 1-58829-523-0 (alk. paper)
1. Cell interaction. 2. Cell junctions. 3. Epithelial cells.
[DNLM: 1. Cell Communication--physiology. 2. Endothelial Cells--physiology. 3. Epithelial Cells--physiology. 4. Tight Junctions--physiology. QU 375 C3925 2006] I. Colgan, Sean P. II. Series: Methodsin molecular biology (Clifton, N.J.) ; v. 341.
QH604.2.C4418 2006
571.6--dc22
2005029552

v
PrefaceStudies incorporating cell–cell interactions remain an exciting and ever-evolving
discipline within the broader areas of biology. Although recent advances in geneticshave provided much insight into gene- and disease-specific mechanisms, such modelsare often limited by tissue/organ complexity. The use of directed cell models to studythe manner by which two or more cells interact has revolutionized our understandingof protein–protein interactions in a complex milieu and have provided an invaluableplatform for the identification of new molecules.
The aim of Cell–Cell Interactions: Methods and Protocols is to provide a collectionof diverse protocols, incorporating methods-based approaches both in vitro and in vivo.The authors of the various chapters are highly skilled experts in the development andutilization of cell–cell interaction assays. Their extensive expertise provides a detailed,step-by-step map of a reproducible protocol. Importantly, these protocols are readilyadaptable for nearly any cell type and any organ system, and for this reason, I havetried to compile a diverse set of chapters incorporating numerous individual types ofcells. It is my hope that this book will be both insightful to the beginner and inspiringto the experienced.
Sean P. Colgan


vii
Contents
Preface ..............................................................................................................v
Contributors ..................................................................................................... ix
1 Blood–Brain Barrier and Cell–Cell Interactions: Methodsfor Establishing In Vitro Models of the Blood–Brain Barrierand Transport Measurements
Michael Aschner, Vanessa A. Fitsanakis,Ana Paula Marreilha dos Santos, Luisa Olivi, and Joseph P. Bressler .... 1
2 Interactions of Intestinal Epithelial Cells With Bacteriaand Immune Cells: Methods to Characterize Microfloraand Functional Consequences
Geraldine Canny, Alexander Swidsinski, and Beth A. McCormick .... 173 The Role of Junctional Adhesion Molecules in Interactions
Between Vascular CellsTriantafyllos Chavakis and Valeria Orlova ......................................... 37
4 Cell–Cell Interactions on Solid MatricesNancy A. Louis, Dionne Daniels, and Sean P. Colgan ....................... 51
5 Cell–Cell Interactions in the Kidney: Inducible Expressionof Mutant G Protein α-Subunits in Madin–Darby Canine KidneyCells for Studies of Epithelial Cell Junction Structure and Function
Ernesto Sabath and Bradley M. Denker .............................................. 616 Nucleotide Metabolism and Cell–Cell Interactions
Holger K. Eltzschig, Thomas Weissmüller, Alice Mager,and Tobias Eckle ............................................................................. 73
7 Analysis of Mammalian Sperm–Egg Membrane InteractionsDuring In Vitro Fertilization
Genevieve B. Wortzman, Allison J. Gardner, and Janice P. Evans .... 898 Collagen Gel Contraction Assay
Peter Ngo, Punitha Ramalingam, Jonathan A. Phillips,and Glenn T. Furuta...................................................................... 103
9 Methods to Assess Tissue PermeabilityJuan C. Ibla and Joseph Khoury ........................................................ 111

viii Contents
10 Bacterial–Bacterial Cell Interactions in Biofilms: Detectionof Polysaccharide Intercellular Adhesins by Blottingand Confocal Microscopy
Kimberly K. Jefferson and Nuno Cerca............................................. 11911 A Biochemical Method for Tracking Cholera Toxin Transport
From Plasma Membrane to Golgi and Endoplasmic ReticulumHeidi E. De Luca and Wayne I. Lencer ............................................. 127
12 Isolation and Culture of Murine Heart and Lung EndothelialCells for In Vitro Model Systems
Yaw-Chyn Lim and Francis W. Luscinskas........................................ 14113 Expression Cloning of Signaling Proteins Regulated
by Cell AdhesionMichelle L. Matter and Joe W. Ramos .............................................. 155
14 Assays for the Calcium Sensitivity of DesmosomesAnita J. Merritt, Anthea Scothern, and Tanusree Bhattacharyya ..... 167
15 Tight Junctions and Cell–Cell InteractionsMarkus Utech, Matthias Brüwer, and Asma Nusrat ......................... 185
16 Simultaneous Immunofluorescence Detection of Cadherinand β-Catenin in Mouse Tissue Sections
Nobuko Obara .................................................................................. 19717 In Vitro Neutrophil Transepithelial Migration
Winston Y. Lee, Alex C. Chin, Susan Voss, and Charles A. Parkos ..... 20518 The Blot Rolling Assay: A Method for Identifying Adhesion
Molecules Mediating Binding Under Shear ConditionsRobert Sackstein and Robert Fuhlbrigge .......................................... 217
19 Cell–Cell Interaction in the Transcellular Biosynthesisof Novel ω-3-Derived Lipid Mediators
Nan Chiang and Charles N. Serhan .................................................. 22720 Isolation and Analysis of Lipid Rafts in Cell–Cell Interactions
Aimee Landry and Ramnik Xavier .................................................... 251Index ............................................................................................................ 283

ix
Contributors
MICHAEL ASCHNER • Department of Pediatrics Pharmacology and The KennedyCenter, Vanderbilt University School of Medicine, Nashville, TN
TANUSREE BHATTACHARYYA • Faculty of Life Sciences, University of Manchester,Manchester, United Kingdom
JOSEPH P. BRESSLER • Department of Environmental Health Sciences,The Kennedy Krieger Institute, John Hopkins University BloombergSchool of Public Health, Baltimore, MD
MATTHIAS BRÜWER • Department of General Surgery, University of Münster,Münster, Germany
GERALDINE CANNY • Center for Experimental Therapeutics and ReperfusionInjury, Brigham and Women's Hospital, Harvard Medical School, Boston, MA
TRIANTAFYLLOS CHAVAKIS • Experimental Immunology Branch, NationalCancer Institute, National Institutes of Health, Bethesda, MD
NUNO CERCA • The Channing Laboratory, Brigham and Women's Hospital,Harvard Medical School, Boston, MA
NAN CHIANG • Department of Anesthesiology, Perioperative, and Pain Medicine,Center for Experimental Therapeutics and Reperfusion Injury, Brighamand Women's Hospital, Harvard Medical School, Boston, MA
ALEX C. CHIN • Division of Gastrointestinal Pathology, Department of Pathologyand Laboratory Medicine, Emory University School of Medicine, Atlanta, GA
SEAN P. COLGAN • Center for Experimental Therapeutics and Reperfusion Injury,Brigham and Women's Hospital, Harvard Medical School, Boston, MA
DIONNE DANIELS • Center for Experimental Therapeutics and ReperfusionInjury, Brigham and Women's Hospital, Harvard Medical School, Boston, MA
HEIDI E. DE LUCA • Gastrointestinal Cell Biology, Children's HospitalBoston, Harvard Medical School, Boston, MA
BRADLEY M. DENKER • Renal Division, Brigham and Women's Hospital,Harvard Medical School, Boston, MA
ANA PAULA MARREILHA DOS SANTOS • Faculty of Pharmacy, University of Lisbon,Lisbon, Portugal
TOBIAS ECKLE • Department of Anesthesiology and Intensive Care Medicine,Tübingen University Clinic, Tübingen, Germany
HOLGER K. ELTZSCHIG • Department of Anesthesiology and Intensive CareMedicine, Tübingen University Clinic, Tübingen, Germany
JANICE P. EVANS • Division of Reproductive Biology, Department of Biochemistryand Molecular Biology, John Hopkins University Bloomberg School of PublicHealth, Baltimore, MD
VANESSA A. FITSANAKIS • Department of Pediatrics, Vanderbilt UniversityMedical Center, Nashville, TN

ROBERT FUHLBRIGGE • Harvard Skin Disease Research Center and Departmentof Dermatology, Harvard Medical School, Boston, MA
GLENN T. FURUTA • Division of Pediatric Gastroenterology and Centerfor Experimental Therapeutics and Reperfusion, Brigham and Women'sHospital, Children's Hospital Boston, Harvard Medical School, Boston, MA
ALLISON J. GARDNER • Division of Reproductive Biology, Departmentof Biochemistry and Molecular Biology, John Hopkins UniversityBloomberg School of Public Health, Baltimore, MD
JUAN C. IBLA • Department of Anesthesiology, Perioperative, and Pain Medicine,Center for Experimental Therapeutics and Reperfusion Injury, Brighamand Women's Hospital, Children's Hospital Boston, Harvard MedicalSchool, Boston, MA
KIMBERLY K. JEFFERSON • Department of Microbiology and Immunology, VirginiaCommonwealth University, Richmond, VA
JOSEPH KHOURY • Department of Anesthesiology, Perioperative, and PainMedicine, Center for Experimental Therapeutics and Reperfusion Injury,Brigham and Women's Hospital, Children's Hospital Boston, HarvardMedical School, Boston, MA
AIMEE LANDRY • Department of Molecular Biology, Massachusetts GeneralHospital, Boston, MA
WINSTON Y. LEE • Division of Gastrointestinal Pathology, Departmentof Pathology and Laboratory Medicine, Emory University Schoolof Medicine, Atlanta, GA
WAYNE I. LENCER • Gastrointestinal Cell Biology, Children's Hospital Boston,Harvard Medical School, Boston, MA
YAW-CHYN LIM • Department of Pathology and Physiology, ImmunologyProgram, National University of Singapore, Singapore
NANCY A. LOUIS • Center for Experimental Therapeutics and ReperfusionInjury, Brigham and Women's Hospital, Harvard Medical School, Boston, MA
FRANCIS W. LUSCINSKAS • Department of Pathology, Center for Excellencein Vascular Biology, Brigham and Women's Hospital, Harvard MedicalSchool, Boston, MA
ALICE MAGER • Department of Anesthesiology and Intensive Care Medicine,Tübingen University Clinic, Tübingen, Germany
MICHELLE L. MATTER • John A. Burns Medical School, University of Hawaiiat Manoa, Honolulu, HI
BETH A. MCCORMICK • Department of Pediatric Gastroenterology and Nutrition,Massachusetts General Hospital and Department of Microbiologyand Molecular Genetics, Harvard Medical School, Boston, MA
ANITA J. MERRITT • Faculty of Life Sciences, University of Manchester,Manchester, United Kingdom
PETER NGO • Fellow in Pediatric Gastroenterology, Center for ExperimentalTherapeutics and Reperfusion Injury, Brigham and Women's Hospital,Harvard Medical School, Boston, MA
x Contributors

ASMA NUSRAT • Department of Pathology and Laboratory Medicine, EpithelialPathobiology Unit, Emory University School of Medicine, Atlanta, GA
NOBUKO OBARA • Department of Oral Anatomy, School of Dentistry, HealthSciences University of Hokkaido, Hokkaido, Japan
LUISA OLIVI • The Kennedy Krieger Institute, John Hopkins UniversityBloomberg School of Public Health, Baltimore, MD
VALERIA ORLOVA • Experimental Immunology Branch, National CancerInstitute, National Institutes of Health, Bethesda, MD; Departmentof Internal Medicine, University of Heidelberg, Heidelberg, Germany
CHARLES A. PARKOS • Division of Gastrointestinal Pathology, Departmentof Pathology and Laboratory Medicine, Emory University Schoolof Medicine, Atlanta, GA
JONATHAN A. PHILLIPS • Department of Gravitational Biology, Ames ResearchCenter, Moffett Field, CA
PUNITHA RAMALINGAM • Center for Experimental Therapeutics and ReperfusionInjury, Brigham and Women's Hospital, Harvard Medical School, Boston, MA
JOE W. RAMOS • Cancer Research Center of Hawaii, University of Hawaiiat Manoa, Honolulu, HI
ERNESTO SABATH • Renal Division, Brigham and Women's Hospital, HarvardMedical School, Boston, MA
ROBERT SACKSTEIN • Harvard Skin Disease Research Center and Departmentsof Dermatology and Medicine, Brigham and Women's Hospital, HarvardMedical School, Boston, MA
ANTHEA SCOTHERN • Faculty of Life Sciences, University of Manchester,Manchester, United Kingdom
CHARLES N. SERHAN • Department of Anesthesiology, Perioperative, and PainMedicine, Center for Experimental Therapeutics and Reperfusion Injury,Brigham and Women's Hospital, Harvard Medical School, Boston, MA
ALEXANDER SWIDSINSKI • Innere Klinik, Gastroenterologie, Charit,Berlin, Germany
MARKUS UTECH • Department of Pathology and Laboratory Medicine, EpithelialPathobiology Unit, Emory University School of Medicine, Atlanta, GA; USADepartment of General Surgery, University of Münster, Münster, Germany
SUSAN VOSS • Division of Gastrointestinal Pathology, Departmentof Pathology and Laboratory Medicine, Emory University Schoolof Medicine, Atlanta, GA
THOMAS WEISSMÜLLER • Department of Anesthesiology and Intensive CareMedicine, Tübingen University Clinic, Tübingen, Germany
GENEVIEVE B. WORTZMAN • Division of Reproductive Biology, Departmentof Biochemistry and Molecular Biology, Johns Hopkins UniversityBloomberg School of Public Health, Baltimore, MD
RAMNIK XAVIER • Department of Medicine and Molecular Biology,Massachusetts General Hospital, Harvard Medical School, Boston, MA
Contributors xi


List of Color PlatesColor Plates follow p. 50
Color Plate 1. Fig. 1, Chapter 2: Bacterial flora attached to the ileal mucosain a patient with Crohn's disease (at a magnification of×1000). The triangle of lumen is at the bottom right. Bacteriaare tightly attached to the intact mucosal surface. (See completecaption on p. 20.)
Fig. 2, Chapter 3: JAM-C localization at interendothelialborders and colocalization with ZO-1. Representive immuno-fluorescence of HUVECs showing JAM-C distribution(incubation with MAb Gi11 followed by secondaryrhodamine-coupled anti-mouse IgG) together with ZO-1distribution (incubation with rabbit anti-ZO-1 followed byfluorescein isothiocyanate-coupled anti-rabbit IgG.(See complete caption on p. 44.)
Color Plate 2. Fig. 1, Chapter 4: Models of noncontact substrate grown co-cultures. (A) Cell type 1 (e.g., epithelia) and cell type 2 (e.g.,endothelia) are plated on opposing surfaces of membrane per-meable supports (0.4-µm pores). (See complete caption on p. 54.)
Color Plate 3. Fig. 2, Chapter 4: Models of contact substrate grown co-cultures.(A) Cell type 1 (e.g., epithelia) and cell type 2 (e.g., endothelia)are plated on opposing surfaces of membrane permeable supports(5-µm pores).(See complete caption on p. 56.)
Color Plate 4. Fig. 1, Chapter 9: Photographs representing normal andincreased vascular permeability in mice. C57B16 male micewere injected with 2 mL of Evan's blue via tail vein. (Seecomplete caption on p. 113.)
Fig. 2, Chapter 10: Use of confocal microscopy to analyzeEPS elaboration. The intercellular adhesin (ica) locus inS. aureus encodes the proteins necessary for PNAG synthesis soica-positive and ica-negative mutants were used as positiveand negative controls. (See complete caption on p. 124.)
xiii


1
1
Blood–Brain Barrier and Cell–Cell Interactions
Methods for Establishing In Vitro Models of the Blood–BrainBarrier and Transport Measurements
Michael Aschner, Vanessa A. Fitsanakis, Ana Paula Marreilha dos Santos,Luisa Olivi, and Joseph P. Bressler
SummaryThis chapter describes in vitro methods for studying the blood–brain barrier. These methods
include a cell line and isolated brain microvessels. The rat brain endothelial cell line 4 (RBE4)express many properties that are expressed by brain endothelial cells in vivo. Tissue culturemethods allow the investigator to design experiments for studying transporters and permeabilitythat would be much more difficult in vivo. A method for making preparations of isolated brainmicrovessels also is described. These preparations are highly enriched and also can be used forstudying transport in vitro, but their short life span is a limitation. Two methods are discussed formeasuring transport in cell culture. In one method, permeability is measured across a cell mono-layer. This method is useful for measuring luminal and abluminal transport. The second methodis especially designed for measuring the families of efflux transporters. These in vitro methodswill complement many of the in vivo techniques, and they may be used as screening for moretimely and expensive experiments, and also reducing the need for experimental animals.
Key Words: Blood–brain barrier; RBE4 cells; brain microvessels; transporters; permeability;multidrug resistance.
1. IntroductionThe blood–brain barrier (BBB) is a specialized capillary bed separating the
blood from the central nervous system parenchyma. It regulates amino acid,peptide, and protein transport, allowing for tight control of the composition ofthe brain’s interstitial fluid composition. It also assures that changes in bloodmetabolite and ion composition (e.g., nutrients) are not reflected within thebrain’s milieu by preventing charged and large molecules from entering the brain.
From: Methods in Molecular Biology, vol. 341: Cell−Cell Interactions: Methods and ProtocolsEdited by: S. P. Colgan © Humana Press Inc., Totowa, NJ

Two main factors contribute to the BBB’s restrictive nature, and they include aphysical barrier comprised of tight junctions between the endothelial cells (1,2)and a plethora of proteins on the endothelium, which play a key role in regu-lating influx and efflux of nutrients, ions, and other materials between the two(blood and brain) compartments (3,4). Brain capillary endothelial cells arepolarized into luminal (blood-facing) and abluminal (brain-facing) plasmamembrane domains. Nutrients are transported from the luminal side to the ablu-minal side by transporters. Additionally, the BBB expresses efflux pumpsbelonging to the superfamily of adensoine-5′-triphosphate (ATP)-binding cas-sette (ABC) proteins that prevent a broad range of amphiphatic chemicals fromentering the brain. Efflux pumps that have been discovered thus far in the BBBinclude multidrug resistance glycoprotein, also referred to as P-glycoprotein(and most recently referred to as ABCB1), and breast cancer resistance pro-tein (and most recently referred to as ABCG2 [5]). ABCB1 and ABCG2 areexpressed on the luminal surface of brain endothelial cells in the BBB. Theexpression of members of the family of multidrug resistance-associated pro-teins (ABCC family) has been reported in cultures of bovine brain endothelialcells (6) but not in isolated human (7) or rat microvessels (8) ABCB1 andABCG2 transport lipophilic and cationic compounds with overlap (9,10),whereas multidrug resistance proteins transport organic anions, glutathione, orglucuronide-conjugated compounds, as well as various nucleosides (11).
In vitro and in vivo methods have been described for studying permeability ofthe BBB. Obviously, the advantage of in vivo methods is that the integrity of theBBB is maintained, but these methods have distinct disadvantages when com-pared with in vitro methods, including cost and sensitivity. Also, the experimentaldesign is more difficult when the experiments involve inhibitors and inducers oftransporters. In an in vitro method, such as cell culture, it is relatively easy tomodify the activity of transporters. Nonetheless, a distinct disadvantage of cul-tures of brain endothelial cells is that they do not fully mimic the properties of theBBB in situ. The most notable property that is not fully mimicked when using invitro models of the BBB is the expression of a tight barrier (commonly measuredas the electrical resistance [12]). Accordingly, a combination of both in vivo andin vitro methods is needed.
This chapter discusses two in vitro models for studying permeability andtransport; these include cultures of the rat brain endothelial cell line (RBE4)and isolated brain microvessels. We also describe methods for examining trans-port permeability. In addition to RBE4 cell line, other cell culture modelsare available. Primary cultures of brain endothelial cells, for example, commonlyare used. Monolayer cultures of porcine and bovine brain endothelial cells have
2 Aschner et al.

been reported to display higher electrical resistance than most cell lines (13–15).Nonetheless, a wide variation in electrical resistance has been observed in dif-ferent preparations of primary cultures of endothelial cells from bovine andporcine brain from the same laboratory (13,14). Also, a practical issue in prepar-ing primary cultures is the laboratory’s proximity to the slaughterhouse. Poorcell yield will be obtained when brains are kept on ice for longer than 1 h. Werefer the reader to manuscripts describing methods for preparing primary cul-tures of brain endothelial cells (14,15).
2. Materials1. Minimal Essential Media (MEM), with Earle’s salts (Gibco-BRL, Grand Island,
NY; cat. no. 11095-080). MEM was modified to contain no Ca2+, which can pro-duce cell clumping as the result of interactions of extracellular matrix proteins.
2. Heat-inactivated horse serum (Gibco-BRL; cat. no. 26050-088). Repeatedfreeze–thaw cycles of serum should be avoided. To thaw frozen serum, place thebottle in a refrigerator for approx 24–48 h. If rapid thawing is needed, place in awater bath no warmer than 40°C. Once thawed, serum can be stored at 4°C forapprox 1 wk; however, we suggest aliquoting into 50-mL tubes and storingat –20°C. These 50-mL tubes can then be thawed as needed at room temperatureover a few hours.
3. Penicillin G (10,000 U/mL)–streptomycin sulfate (10,000 µg/mL; Gibco-BRL;cat. no. 15140-122). Storing penicillin/streptomycin in 10-mL aliquots at –20°C issuggested to avoid repeated freeze–thaw cycles and because it provides the correctamount for 1 L of media.
4. Fungizone® (Amphotericin B, 250 µg/mL; Gibco-BRL; cat. no. 15290-018): itsuse if optional to prevent fungal or yeast contaminations.
5. Trypan blue 0.4%. Trypan blue is used determine cell viability. Intact cells areable to exclude trypan blue, whereas dead or damaged cells retain the dye. This isa useful method when determining plating density needed for the experiments.
2.1. Cell Culture
1. RBE4 cells: Neurotech SA (Evry, France) graciously provided the RBE4 cells.2. MEM, alpha medium, F-10 nutrient mixture, glutamine, penicillin, streptomycin,
heat-inactivated fetal bovine serum, and geneticin (G418).3. T-75 flasks, which must be collagen coated and are obtained from BD Bioscience
(Bedford, MA). Experiments are routinely conducted after microscopic and visualconfirmation of confluence and are performed in HEPES buffer of the followingcomposition: 25 mM HEPES/NaOH, 122 mM NaCl, 3.3 mM KCl, 0.4 mM MgSO4,1.3 CaCl2, 1.2 mM KH2PO4, 10 mM glucose, adjusted to pH 7.4, and at 25°C unlessotherwise desired (for example, as in studies examining the effect of temperature-dependence on transport kinetics).
BBB and Cell–Cell Interactions 3

2.2. Efflux Transporters
1. Hank’s Balanced Salt Solutions (HBSS; with Ca, Mg, and glucose) withoutphenol red. Verapamil is kept at 1 mM in HBSS in small aliquots at –20°C. Work-ing dilution is 20 µM in HBSS, and the final concentration is 10 µM.
2. Calcein AM is made at 1 mM in dimethyl sulfoxide and kept in small aliquots inthe freezer at –20°C. It is light sensitive. The final concentration is 2 µM in HBSS.
3. MicroFluor 96-well black plates.4. Phosphate-buffered saline with 1% Triton X-100 or an equivalent nonionic deter-
gent. Store the buffer at room temperature.
2.3. Isolated Microvessels
1. Media 199.2. Nytex nylon mesh (www.sefar.com).3. Dextran.4. Dounce homogenizer with a Teflon pestle (0.25-mm clearance). The homogenizer
is purchased from a supply company and shaved by a machine shop.5. Motorized homogenizer.6. Dissecting tools, such as scissors and forceps.7. Kim wipes.8. 250-mL flat-bottom centrifuge tubes with lid.9. Buchner funnel and fitting flask.
10. 3-mL syringe.11. 0.25-mm glass beads.
3. Methods3.1. Cell Culture
Our focus is on RBE4 cells in describing a cell culture method for studyingthe BBB. These cells were derived from rat brain microvascular endothelialcells immortalized with the plasmid pE1A-neo containing the E1A region ofadenovirus 2 and a neomycin resistance gene (16–18). The RBE4 cell line hasbeen used in our laboratory for a number of years with great success, andthese cells have proven to be a useful tool for probing the characteristics of theBBB in vitro. RBE4 cells have been used extensively by others as well, rep-resenting a wide range of transporter studies, including multidrug transporters(19) serotonin (5-HT [20]; L-3,4-dihydroxyphenylalanine or L-DOPA [21]),organic cation transporter/carnitine transporter OCTN2 (22), and glucose trans-porter 1 (23) RBE4 cells also express the specific brain endothelial enzymesγ-glutamyltranspeptidase and alkaline phosphatase (16,24).
The RBE4 cell cultures are maintained in T-75 flasks coated with rat tailcollagen I and subcultured into transparent six-well plates with porous nitrocel-lulose and collagen I-coated inserts (both from BD Biosciences, Bedford, MA)
4 Aschner et al.

for transport studies. The flasks and/or plates are routinely monitored by inversemicroscopy before their doubling rate, approximately every 20 to 24 h, and themedia are replaced after each doubling. In reality, the media is replaced approx-imately every 48 h to prevent the unnecessary disruption of the RBE4 cellmonolayers (see Note 1). RBE4 monolayers in the flasks are subcultured every 3 to 4 d just as each flask’s monolayer becomes confluent at approx 1.5 ×10⁵ cell/cm2. During this fractional splitting, these newly confluent monolayersare washed with 3 mL of 0.125% trypsin, detached with 1 mL 0.25% trypsin,centrifuged at very low speed (∼1000g for 1 min), and fractionated 13 or 14,depending on the quality of the monolayer and the time frame in which they areneeded. This procedure is routinely conducted for each flask and for each typeof media (either astrocyte-conditioned media [ACM] or normal alpha medium)at approx 105 cell/cm2.
This method is a gentler way of manipulating the eukaryotic RBE4 cellsand their collagen adherent proteins. Trituration, after the addition of trypsin,is accomplished more easily and with less shearing. The result is a more uni-form and disbursed initial cell layer over the hydrated nitrocellulose collagenfilters and a faster growing, uniformly confluent monolayer in the modelchambers (see Notes 2–4).
The media specifications are largely dependent on the experimental designand the parameters that are to be tested. We have traditionally used two differ-ent types of medium for RBE4 growth. These include the traditional alpha-type media (16,18) and ACM, which is known to decrease transendothelialpermeability by physically tightening the barrier and reducing transluminal dif-fusion (25) and thus representing a more amenable model system for probingissues related to transport properties of the BBB (see Note 5).
ACM is made just before use. It consists of equal parts (11, v/v) of freshastrocyte growth media (MEM with Earl’s salts containing 10% heat-inactivatedhorse serum, 100 U/mL penicillin, 100 µg/mL streptomycin, and 0.25 µg/mLFungizone) and used astrocyte growth media siphoned from stock primary astro-cyte colonies maintained in the laboratory.
3.2. Transcellular Transport
The RBE4 cells are grown to confluent monolayers on porous, collagenI-coated, nitrocellulose filters and transferred to six-well plates. Each well has theporous filters attached to the base acrylic-walled inserts. Each insert sits securelysuspended in its respective well, creating a top well above the cell monolayer anda bottom layer below each filter. Permeability and flux derivations are based on aone-dimensional permeability mathematical model derived from Fick’s law:
JF (x,t) = –D (δC (x,t)/δx)
BBB and Cell–Cell Interactions 5

where D is the gross coefficient of diffusion, and C is the chemical expressionof concentration of distributed mass. The minus sign insures a stable, thermo-dynamically sound system with a downhill concentration gradient.
Unidirectional flux (J) is calculated using the following equation:
J = ∆Q/∆t*A
where Q is the fraction of the original radioisotope on the basolateral side of theculture model to the original activity applied to the apical side of the system.This value, Q (nanomoles), is divided by time of the experiment (t; minutes),and area (A; cm2) of the filter.
Concentration apparent permeability (concPapp) is calculated by dividing flux(J) by the initial concentration (Ca) used on the apical side of the model BBBsystem (26,27):
concPapp= J/Ca.
Results are presented as both concPapp relative to percent control and asequivalent nanomoles over the time course of the assay.
The permeability or flux of 54Mn2+ across confluent monolayers of RBE4 cellsis quantified by liquid scintillation counting. The asymmetric timepoints chosenfor measurement were 1, 5, 10, 30, 60, and 120 min. They proved to be spacedwell enough apart for practical considerations and long enough in breadthbetween and in duration for Michaelis–Menton saturation kinetic calculationsbased on flux rate and concentration to be practicable as well.
The results are reported as mean ± SEM. All experiments are analyzed rou-tinely per well, with n ≥ 9 (one should use power analysis to calculate thenumber of wells and replicates needed to perform sound statistical analyses). Inour laboratory, we routinely use InStat (GraphPad Software, El Camino Real,San Diego, CA) to analyze the data by one-way analysis of variance with apost-hoc test such as Tukey, when the number of groups is greater than two(to avoid multiple Student’s t-tests). Results are considered to be statisticallysignificantly from controls if the p < 0.05.
3.3. Efflux Pumps
The most direct method of assaying efflux pumps is a functional assay mea-suring intracellular accumulation of a radioactive or fluorescent substrate (probe)in the presence of a competing substrate. The competition will result in greateruptake of the probe. Alternatively, ATPase assays (28,29) have been describedbut are difficult to interpret because P-glycoprotein-associated ATPase activity isaffected differently by different substrates. We prefer fluorescent probes in thefunctional assay because they are less expensive yet display the same level ofsensitivity as radioactive probes. Instruments that have been used for measuring
6 Aschner et al.
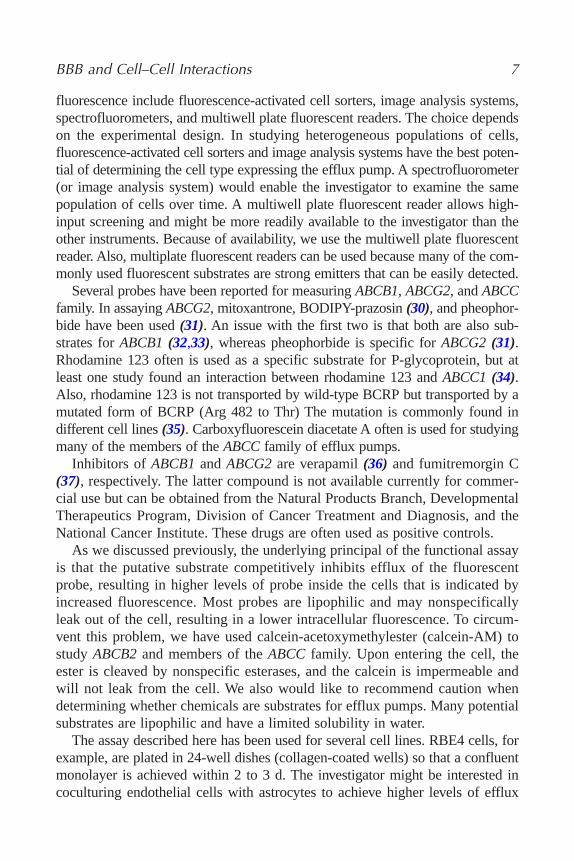
fluorescence include fluorescence-activated cell sorters, image analysis systems,spectrofluorometers, and multiwell plate fluorescent readers. The choice dependson the experimental design. In studying heterogeneous populations of cells,fluorescence-activated cell sorters and image analysis systems have the best poten-tial of determining the cell type expressing the efflux pump. A spectrofluorometer(or image analysis system) would enable the investigator to examine the samepopulation of cells over time. A multiwell plate fluorescent reader allows high-input screening and might be more readily available to the investigator than theother instruments. Because of availability, we use the multiwell plate fluorescentreader. Also, multiplate fluorescent readers can be used because many of the com-monly used fluorescent substrates are strong emitters that can be easily detected.
Several probes have been reported for measuring ABCB1, ABCG2, and ABCCfamily. In assaying ABCG2, mitoxantrone, BODIPY-prazosin (30), and pheophor-bide have been used (31). An issue with the first two is that both are also sub-strates for ABCB1 (32,33), whereas pheophorbide is specific for ABCG2 (31).Rhodamine 123 often is used as a specific substrate for P-glycoprotein, but atleast one study found an interaction between rhodamine 123 and ABCC1 (34).Also, rhodamine 123 is not transported by wild-type BCRP but transported by amutated form of BCRP (Arg 482 to Thr) The mutation is commonly found indifferent cell lines (35). Carboxyfluorescein diacetate A often is used for studyingmany of the members of the ABCC family of efflux pumps.
Inhibitors of ABCB1 and ABCG2 are verapamil (36) and fumitremorgin C(37), respectively. The latter compound is not available currently for commer-cial use but can be obtained from the Natural Products Branch, DevelopmentalTherapeutics Program, Division of Cancer Treatment and Diagnosis, and theNational Cancer Institute. These drugs are often used as positive controls.
As we discussed previously, the underlying principal of the functional assayis that the putative substrate competitively inhibits efflux of the fluorescentprobe, resulting in higher levels of probe inside the cells that is indicated byincreased fluorescence. Most probes are lipophilic and may nonspecificallyleak out of the cell, resulting in a lower intracellular fluorescence. To circum-vent this problem, we have used calcein-acetoxymethylester (calcein-AM) tostudy ABCB2 and members of the ABCC family. Upon entering the cell, theester is cleaved by nonspecific esterases, and the calcein is impermeable andwill not leak from the cell. We also would like to recommend caution whendetermining whether chemicals are substrates for efflux pumps. Many potentialsubstrates are lipophilic and have a limited solubility in water.
The assay described here has been used for several cell lines. RBE4 cells, forexample, are plated in 24-well dishes (collagen-coated wells) so that a confluentmonolayer is achieved within 2 to 3 d. The investigator might be interested incoculturing endothelial cells with astrocytes to achieve higher levels of efflux
BBB and Cell–Cell Interactions 7

pumps (see Subheading 3.1. for culturing endothelial cells with astrocytes or inthe presence of AC [38]). Co-cultures can be achieved either by plating astrocytesand endothelial cells on opposite sides of polycarbonate filters or by placing insertscontaining cultures of astrocyte monolayers into endothelial cell monolayers in24-well dishes for a few days. The efflux assay is performed immediately on theendothelial cells immediately after removing the insert.
Cultures are washed three times with HBSS and incubated at 37°C with 500 µLof verapamil and 500 µL of calcein-AM to achieve a final concentration of 10 µMand 1 µM of verapamil and calcein, respectively. In examining potential substratesfor the efflux pumps, we routinely preincubate the cells with the substrate for10 min at 37°C before adding calcein-AM. After 60 min with calcein-AM, thecells are again given three washes, and the intracellular calcein is extracted byincubating cells with 200 µL of phosphate-buffered saline/Triton X-100 for 30 minat 4°C. Because calcein-AM is light-sensitive, we shield the plates with aluminumfoil. The extract is transferred to the microtiter plate, and the fluorescence is mea-sured at an excitation of and emission as shown in Table 1. The data are expressedas relative fluorescence or computed as percent control (see Note 6).
3.4. Isolation of Microvessels From Bovine Brain
Isolated microvessels have been used for characterizing transporters and otherbrain capillary specific proteins and for studying signaling pathways. We use theterm microvessel instead of capillary because the procedure isolates vessels thatare 5 to 25 µm in diameter, which will include venules and arterioles, as well ascapillaries. The isolated microvessels consist of endothelial cells, abluminallylocated pericytes, and their surrounding extracellular basement but are void ofperivascular astrocytes that in vivo ensheath the microvessel (39). Whereas pri-mary cultures of endothelial cells lose the expression of some of the genes areexpressed in vivo and gain the expression of genes needed for sustenance andgrowth in culture, isolated microvessels are the best preparation of enrichedendothelial cell protein. Indeed, typical fold enrichments of endothelial cellproteins (e.g., γ-glutatmyl peptidase and alkaline phosphatase) are approx 20 but
8 Aschner et al.
Table 1Excitation and Emission Wavelengths of Commonly Used Probes
Probe Excitation Emission Final concentration
Rhodamine 123 507 529 2.5 µMCalcein 493 515 1 µMBODIPY-prazosin 488 530 250 µMPheophorbide 488 650 10 µM

might vary depending on the brain region (40). The reader should be aware of twoproblems in using isolated microvessels. First, isolated microvessels have a briefviability because they cannot maintain adequate levels of ATP (41) (see Note 7).The second problem is associated with transport measurements. In vivo, trans-port from blood to brain across the BBB is unidirectional. Most substrates starttheir journey from the luminal surface, cross to the abluminal surface, and enterthe parenchyma. In isolated microvessels, transport is assayed by measuringuptake into the microvasculature and transport is bidirectional because both theluminal and abluminal surfaces are exposed to the substrate undergoing trans-port. Furthermore, the luminal surface might not be accessible to the substratebecause the microvessels could have been damaged during the preparation.Nonetheless, amino acid and glucose transporters, and efflux pumps have beencharacterized in isolated microvessels (42). More recently, a method for studyingtransport has been described using fluorescent substrates with confocalmicroscopy (43). This approach has two advantages. First, undamaged capillariescan be selected and assayed. Second, a microscopic assay requires less material.
The procedure is used for isolating brain microvessels from rats (44) andcows (40) in our laboratory and likely has been applied to other mammals.When working with larger mammals, it is advised to work with only graymatter unless there is a specific reason for studying capillaries from whitematter. It is important to keep brains at 4°C throughout the procedure. Thebasis of the procedure for isolating brain microvessels is that the integrity ofbrain capillaries is not compromised when brain is homogenized in a Douncehomogenizer. The pestle of the homogenizer is shaved by a machine shop toachieve a clearance of 0.25 mm. Because the microvessels are intact, but theremaining cells in the brain are disrupted, microvessels can be isolated asdescribed in the next paragraph (see Note 8).
The following protocol is tailored for isolating brain microvessels from adultrats. Dissect the brains and place them on cellophane wrap on ice. Wipe thesurface with a Kim wipe to remove meninges containing superficial arteriesand membranes. Cut away the cerebellum and brain-stem and open up the twohalves of the cortex to remove the choroid plexus from the ventricles. Withforceps, remove arteries along the surface. Place the brain in a 250-mL beakercontaining 50 mL of ice-cold Media 199 that was pregassed with 95% O2/5%CO2 containing 1% (bovine serum albumin [BSA]) solutions on ice. With fourpairs of scissors, and two hands, mince the brain until it is the consistency ofoatmeal. Divide the mince into four homogenization tubes and add 9 volumesof Media 199. Homogenize 20 strokes for 2 min slowly at 40 rpm with an elec-trical homogenizer so that there is no spillage.
Take the homogenate and dilute 110 with Media 199/BSA in flat-bottomcentrifuge tubes that have closed lids. Shake the tubes for 1 min and centrifuge
BBB and Cell–Cell Interactions 9

for 10 min at 1000g. Aspirate the supernatant and add 15% (wt/vol) dextran inMedia 199 (see Note 9). Several investigators have substituted 25% BSA.Shake vigorously for 1 min and centrifuge for 10 min at 4000g. The myelinfloats and the cell pellet containing microvessels and nuclei. If not shaken prop-erly, myelin will not separate from the cell pellet. Aspirate (do not pour) thesupernatant and wipe fat clinging to the walls of the centrifuge tube with Kimwipes. Resuspend the pellet thoroughly in ice-cold Media 199/1% BSA usinga broken capillary pipet.
The microvessels are separated from larger vessels by filtering a nylonscreen. Secure a piece of 118-µm mesh onto a 4-in. Buchner funnel with arubber band. Wet the mesh and make a depression so liquid will flow to thecenter and not the edges. Add the suspension of microvessels to the filter andcollect the microvessels that flow through. Fat and larger vessels will beretained. Keep washing the mesh with Media 199 while pushing aside fat andlarger vessels with a spatula. Rinse the centrifuge tube making sure all of themicrovessels have been removed. Approximately 10 mL of suspension willhave resulted in at least 100 mL of flow-through. Centrifuge the flow-throughat 4000g for 10 min and aspirate the supernatant. Resuspend the pellet with4 mL of Media 199.
Microvessels are separated from nuclei through a column of glass beads.Plastic columns are prepared by cutting both ends of 3-mL syringe and secur-ing one end with a small piece of 53-µm mesh that is secured with a rubberband. Fill the columns 1.5 cm with glass beads (0.25 mm) and wash columnwith 10 mL of Media 199. Add 1 mL of suspension to each column and allowthe capillaries to be trapped by the glass beads. Squirt 2 mL of Media 199 intoeach column, let it flow until the media is collected, and repeat five times.Remove the column, add the glass beads and nylon mesh to 10 mL of Media199 in a 50-mL tube, gently swirl, and allow the beads to settle and mesh, andtransfer the fluid to a new centrifuge tube. Place a drop on a microscope slideand view under phase contrast. Small thin capillaries should be observed without contaminating nuclei. Wash the beads again and combine the wash-ings in one tube. Centrifuge for 5 min at 500g. In addition to visually monitoringpurity, we recommend comparing the specific activity of alkaline phosphatase orgamma-glutamyl transpeptidase between brain homogenate and microvesselhomogenate. Alkaline phosphatase activity should be approx seven-fold greaterand γ-glutamyl transpeptidase activity should be 20-fold greater in microvessels.
4. NotesThis section identifies major sources of problems associated with RBE4 cell
culturing and notes how these problems can be identified and rectified. Specific
10 Aschner et al.

attention is directed to the subculturing and culturing techniques along with adetailed section on troubleshooting.
1. A new subculturing technique has been used in our laboratory to negate the occur-rence of aberrant confluence in some BBB model culture dish wells. The newmethod requires a wash step to clear any serum from the T-75 flask monolayerbefore trypsinization.
2. Important variables to consider when performing studies with cultures are theeffects of confluency and time in culture. Unlike tumor cells, these cell culturesstop growing and dividing once confluent because of cell–cell interactions. It isstrongly recommended that the effects of confluency be determined by treatingcells at various states of confluency. In a related issue, the time the cells are main-tained in culture can have profound effects on the genotype and phenotype of thecells. Thus, preliminary studies should examine temporal changes in expression ofthe product of interest, and subsequent studies must contain appropriate controlsto account for temporal changes in expression during treatments.
3. Microbial contamination of cell culture is probably the most common problemencountered once the initial cell isolation is successful. Contamination may bethe result of invasion by bacteria, yeast, fungi, molds, mycoplasma, viruses, or anycombination of these. Although isolated contamination of an individual cultureplate or two is not uncommon, widespread or continual contaminations (in morethan two separate cultures) require investigation into the source of the microbes.Once contamination is suspected, the rapid and accurate identification of theoffending class of microbe can aid in determining the source of contamination. Wehighly recommend if contamination of cells is suspected that a sample be sent toa certified microbiological laboratory for identification of the class of microbe.Any infected culture plates must be disposed of immediately. All surfaces, includ-ing microscopes, pipettors, incubator and refrigerator door handles, also should becleaned with 70% ethanol.
4. Because the growth media contains antibiotics (penicillin and streptomycin), bac-terial contamination is uncommon. The addition of gentamycin sulfate may be ben-eficial in controlling bacterial and mycoplasma contamination. When adding newantibiotics, we suggest beginning with the lowest recommended concentrations(available in Gibco-BRL catalog) and performing a dose-toxicity curve in a fewnoninfected plates to assess effects on growth rate and cytotoxicity. In general, thehighest concentration of antibiotic that does not adversely inhibit cell growthshould be used. In our experience, the most common sources of contamination areyeast and fungi. We have found the addition of 0.25 µg/mL Fungizone (Ampho-tericin B) effectively halts both yeast and fungal infections. We do not routinelyadd Fungizone to the growth media but use it only as necessary to control sporadicinfections that seem to occur mainly during spring and summer. Cultures withyeast contamination can usually be readily identified by the examination of themedia. The growth media appears cloudy and usually turns yellow as the result ofacidification. The rapidly growing yeast consume the available glucose and convert
BBB and Cell–Cell Interactions 11

to anaerobic metabolism, which produces large quantities of lactic acid; it is thislactic acids which alters the pH (and thus the color) of the growth media. Micro-scopic examination of yeast-contaminated cultures reveals small round spores float-ing throughout the media. The source of yeast often is hard to identify and, thus,the list of possible suspects is long. Any item to be placed in the laminar flowhood should be cleaned with 70% ethanol, but special care must be taken whenlaboratory water baths are used to thaw or warm reagents for cell culture. The useof disposable plastic pipets can greatly reduce the possibility of contamination.Pipets should only be placed in the growth media once and used to feed one“stack” of culture plates. This prevents transfer of contaminates from a single plateto the growth media, which can then infect the entire culture. The Pasteur pipetsused for removal of media should similarly be changed frequently. Fungus often isfound growing directly on the cell layers, or even the walls of culture plates. Itgrows rapidly to form green to yellow sponge-like circles, and rapidly absorbsmuch of the growth media. When a fungal infection is discovered careful exami-nation of the incubator is required, as this is often a reservoir of fungal spores. Athorough disinfection of the incubator with 70% ethanol is suggested. Mycoplasmacontamination cannot be easily detected by visual inspection of the cultures. If cul-tures die before reaching confluency or are growing slowly, mycoplasma contam-ination may be suspected. Once again, we recommend sending samples to acertified microbiological laboratory for testing of mycoplasma. Alternatively, kitsdesigned for mycoplasma detection are commercially available (MycoTest, Gibco-BRL, 15672-017 or Mycoplasma Detection Kit, Roche, 1296744).
5. The total time for the preparation of cultures is dependent upon the desirednumber of plates. Routinely splitting cells into 12 to 18 filters for the study oftransport can take as long as 2 to 4 h. The changing of media (“feeding”) andsubculturing usually requires approx 1 to 2 h but will of course vary with thenumber of plates/T-75 flasks.
6. Because potential chemical substrates of efflux pumps are lipophilic and havelimited solubility in water, care should be exercised in solubilizing the chemical.The functional assay could be conducted in 96-well plates for high-input screen-ing. Table 1 lists dyes that have been described for studying different transporters.The concentrations are those that have worked for us using the protocol described.
7. Isolation of Microvessels. Because microvessels become energy depleted, brainsshould not be kept on ice for longer than 60 min.
8. The most common cause for poor recovery is associated with homogenizing tubesthat do not provide a 0.25-mm clearance. Homogenizing tubes should be discardedwhen poor recovery is noticed.
9. Dextran is made at 33% in water (w/v) with constant heating and stirring. A 2X(30%) working solution is made by diluting it 110 with 10X Media 199.
AcknowledgmentsThis review was partially supported by Public Health grants from the
National Institutes of Health 10563 and 07331 (to M.A.), Department of
12 Aschner et al.

Defense DAMD17-01-1-0685 (to M.A.), Gerber Foundation (to J.P.B.), andNational Institutes of Health Center Grant 03819 (to J.P.B.).
References1. Reese, T. S. and Karnovsky, M. J. (1967) Fine structural localization of a blood–
brain barrier to exogenous peroxidase. J. Cell Biol. 34, 207–217.2. Brightman, M. and Reese, T. (1969) Junctions between intimately apposed cell
membranes in the vertebrate brain. J. Cell Biol. 40, 648–677.3. Vannucci, S. J., Maher, F., and Simpson, I. A. (1997) Glucose transporter proteins
in brain: delivery of glucose to neurons and glia. Glia 21, 2–21.4. Bradbury, M. W. (1985) The blood–brain barrier. Transport across the cerebral
endothelium. Circ. Res. 57, 213–222.5. de Boer, A. G., van der Sandt, I. C., and Gaillard, P. J. (2003) The role of drug
transporters at the blood-brain barrier. Annu. Rev. Pharmacol. Toxicol. 43, 629–656.6. Zhang, Y., Schuetz, J. D., Elmquist, W. F., and Miller, D. W. (2004) Plasma mem-
brane localization of multidrug resistance-associated protein homologs in braincapillary endothelial cells. J. Pharmacol. Exp. Ther. 311, 449–455.
7. Seetharaman, S., Barrand, M. A., Maskell, L., and Scheper, R. J. (1998) Multidrugresistance-related transport proteins in isolated human brain microvessels and incells cultured from these isolates. J. Neurochem. 70, 1151–1159.
8. Regina, A., Koman, A., Piciotti, M., et al. (1998) Mrp1 multidrug resistance-associated protein and P-glycoprotein expression in rat brain microvessel endothe-lial cells. J. Neurochem. 71, 705–715.
9. Doyle, L. A. and Ross, D. D. (2003) Multidrug resistance mediated by the breastcancer resistance protein BCRP (ABCG2). Oncogene 22, 7340–7358.
10. Suzuki, H. and Sugiyama, Y. (2000) Role of metabolic enzymes and efflux trans-porters in the absorption of drugs from the small intestine. Eur. J. Pharm. Sci.12, 3–12.
11. Borst, P., Evers, R., Kool, M., and Wijnholds, J. (1999) The multidrug resistanceprotein family. Biochim. Biophys. Acta 1461, 347–357.
12. Wolburg, H., Neuhaus, J., Kniesel, U., et al. (1994) Modulation of tight junctionstructure in blood-brain barrier endothelial cells. Effects of tissue culture, secondmessengers and cocultured astrocytes. J. Cell Sci. 107, 1347–1357.
13. Wolburg, H., Neuhaus, J., Kniesel, U., et al. (1994) Modulation of tight junctionstructure in blood-brain barrier endothelial cells. Effects of tissue culture, secondmessengers and cocultured astrocytes. J. Cell Sci. 107, 1347–1357.
14. Gaillard, P. J., Voorwinden, L. H., Nielsen, J. L., et al. (2001) Establishment andfunctional characterization of an in vitro model of the blood–brain barrier, compris-ing a co-culture of brain capillary endothelial cells and astrocytes. Eur. J. Pharm.Sci. 12, 215–222.
15. Parran, D. K., Magnin, G., Li, W., Jortner, B. S., and Ehrich, M. (2005) Chlor-pyrifos alters functional integrity and structure of an in vitro BBB model:co-cultures of bovine endothelial cells and neonatal rat astrocytes. Neurotoxicology26, 77–88.
BBB and Cell–Cell Interactions 13

16. Roux, F., Durieu-Trautmann, O., Chaverot, N., et al. (1994) Regulation of gamma-glutamyl transpeptidase and alkaline phosphatase activities in immortalized ratbrain microvessel endothelial cells. J. Cell Physiol. 159, 101–113.
17. Durieu-Trautmann, O., Bourdoulous, S., Roux, F., Bourre, J. M., Strosberg, A. D.,and Couraud, P. O. (1993) Immortalized rat brain microvessel endothelial cells:II–Pharmacological characterization. Adv. Exp. Med. Biol. 331, 205–210.
18. Roux, F., Durieu-Trautmann, O., Bourre, J. M., Strosberg, A. D., and Couraud, P.O. (1993) Immortalized rat brain microvessel endothelial cells: I–Expression ofblood-brain barrier markers during angiogenesis. Adv. Exp. Med. Biol. 331,201–204.
19. Begley, D. J., Lechardeur, D., Chen, Z. D., et al. (1996) Functional expression ofP-glycoprotein in an immortalised cell line of rat brain endothelial cells, RBE4. J. Neurochem. 67, 988–995.
20. Brust, P., Friedrich, A., Krizbai, I. A., et al. (2000) Functional expression of theserotonin transporter in immortalized rat brain microvessel endothelial cells. J. Neu-rochem. 74, 1241–1248.
21. Sampaio-Maia, B., Serrao, M. P., and Soares-da-Silva, P. (2001) Regulatory path-ways and uptake of L-DOPA by capillary cerebral endothelial cells, astrocytes,and neuronal cells. Am. J. Physiol. 280, C333–C342.
22. Friedrich, A., Prasad, P. D., Freyer, D., Ganapathy, V., and Brust, P. (2003)Molecular cloning and functional characterization of the OCTN2 transporter atthe RBE4 cells, an in vitro model of the blood-brain barrier. Brain Res. 968,69–79.
23. Regina, A., Roux, F., and Revest, P. A. (1997) Glucose transport in immortalizedrat brain capillary endothelial cells in vitro: transport activity and GLUT1 expres-sion. Biochim. Biophys. Acta 1335, 135–143.
24. el Hafny, B., Bourre, J. M., and Roux, F. (1996) Synergistic stimulation of gamma-glutamyl transpeptidase and alkaline phosphatase activities by retinoic acid andastroglial factors in immortalized rat brain microvessel endothelial cells. J. CellPhysiol. 167, 451–460.
25. Yang, J., Mutkus, L. A., Sumner, D., et al. (2001) Transendothelial permeability ofchlorpyrifos in RBE4 monolayers is modulated by astrocyte-conditioned medium.Brain Res. Mol. Brain Res. 97, 43–50.
26. Pachot, J. I., Botham, R. P., Haegele, K. D., and Hwang, K. (2003) Experimentalestimation of the role of P-Glycoprotein in the pharmacokinetic behaviour oftelithromycin, a novel ketolide, in comparison with roxithromycin and othermacrolides using the Caco-2 cell model. J. Pharm. Pharm. Sci. 6, 1–12.
27. Brown, R. C., Mark, K. S., Egleton, R. D., and Davis, T. P. (2004) Protectionagainst hypoxia-induced blood-brain barrier disruption: changes in intracellularcalcium. Am. J. Physiol. Cell Physiol. 286, C1045–C1052.
28. Ambudkar, S. V. (1998) Drug-stimulatable ATPase activity in crude membranesof human MDR1-transfected mammalian cells. Methods Enzymol. 292, 504–514.
29. Senior, A. E., al-Shawi, M. K., and Urbatsch, I. L. (1998) ATPase activity of Chinesehamster P-glycoprotein. Methods Enzymol. 292, 514–523.
14 Aschner et al.

30. Robey, R. W., Honjo, Y., van de Laar, A., et al. (2001) A functional assay for detec-tion of the mitoxantrone resistance protein, MXR (ABCG2) Biochim. Biophys.Acta 1512, 171–182.
31. Robey, R. W., Steadman, K., Polgar, O., et al. (2004) Pheophorbide a is a specificprobe for ABCG2 function and inhibition. Cancer Res. 64, 1242–1246.
32. Lee, Y. J., Kusuhara, H., Jonker, J. W., Schinkel, A. H., and Sugiyama, Y. (2005)Investigation of efflux transport of dehydroepiandrosterone sulfate and mitox-antrone at the mouse blood-brain barrier: a minor role of breast cancer resistanceprotein. J. Pharmacol. Exp. Ther. 312, 44–52.
33. Shapiro, A. B., Fox, K., Lam, P., and Ling, V. (1999) Stimulation of P-glycoprotein-mediated drug transport by prazosin and progesterone. Evidence for a third drug-binding site. Eur. J. Biochem. 259, 841–850.
34. Daoud, R., Kast, C., Gros, P., and Georges, E. (2000) Rhodamine 123 binds to mul-tiple sites in the multidrug resistance protein (MRP1) Biochemistry 39, 15,344–15,352.
35. Robey, R. W., Honjo, Y., Morisaki, K., Nadjem, T. A., Runge, S., Risbood, M.,et al. (2003) Mutations at amino-acid 482 in the ABCG2 gene affect substrate andantagonist specificity. Br. J. Cancer 89, 1971–1978.
36. Cornwell, M. M., Safa, A. R., Felsted, R. L., Gottesman, M. M., and Pastan, I.(1986) Membrane vesicles from multidrug-resistant human cancer cells contain aspecific 150- to 170-kDa protein detected by photoaffinity labeling. Proc. Natl.Acad. Sci. USA 83, 3847–3850.
37. Rabindran, S. K., He, H., Singh, M., Brown, E., Collins, K. I., Annable, T., andGreenberger, L. M. (1998) Reversal of a novel multidrug resistance mechanism inhuman colon carcinoma cells by fumitremorgin C. Cancer Res. 58, 5850–5858.
38. Jodoin, J., Demeule, M., Fenart, L., Cecchelli, R., Farmer, S., Linton, K. J., et al.(2003) P-glycoprotein in blood-brain barrier endothelial cells: interaction andoligomerization with caveolins. J. Neurochem. 87, 1010–1023.
39. Algers, G., Karlsson, B., and Sellstrom, A. (1986) On the composition and char-acteristics of microvessels isolated from the rabbit and bovine brain. Neurochem.Res. 11, 661–670.
40. Wolff, J. E. A., Belloni-Olivi, L., Bressler, J. P., and Goldstein, G. W. (1992)Gamma-glutamyl transpeptidase activity in brain microvessels exhibits regionalheterogeneity. J. Neurochem. 58, 909–915.
41. Lasbennes, F. and Gayet, J. (1984) Capacity for energy metabolism in microvesselsisolated from rat brain. Neurochem. Res. 9, 1–10.
42. Betz, A. L. and Goldstein, G. W. (1986) Specialized properties and solute transportin brain capillaries. Annu. Rev. Physiol. 48, 241–250.
43. Miller, D. S., Nobmann, S. N., Gutmann, H., Toeroek, M., Drewe, J., and Fricker, G.(2000) Xenobiotic transport across isolated brain microvessels studied by confocalmicroscopy. Mol. Pharmacol. 58, 1357–1367.
44. Goldstein, G. W., Wolinsky, J. S., Csejtey, J., and Diamond, I. (1975) Isolation ofmetabolically active capillaries from rat brain. J. Neurochem. 25, 715–717.
BBB and Cell–Cell Interactions 15


2
Interactions of Intestinal Epithelial Cells With Bacteria and Immune Cells
Methods to Characterize Microflora and Functional Consequences
Geraldine Canny, Alexander Swidsinski, and Beth A. McCormick
SummaryEpithelial cells at all mucosal surfaces are potentially apposed to bacteria, particularly in the
intestine. It is established that intestinal epithelial cells (IECs) represent an important barrierbetween lamina propria cells and the potentially harmful lumenal contents. In addition, IECsare important immunoeffector cells with the capacity to release cytokines, chemokines, and othermolecules involved in antigen presentation and immune defense. The interaction of IECs withintestinal bacteria can result in a decrease in barrier function and the development of inflamma-tion, which is known to be an important factor in the development of intestinal pathology. Thepotential role of such crosstalk between bacteria and other intestinal cell types in normal physio-logy and/or pathophysiology is therefore a topic of intense investigation. In this chapter, weprovide protocols for the identification of bacteria that are associated with the epithelium andmucosa in addition to functional assays examining the interactions of neutrophils with epithelialcells and epithelial cell-mediated killing of bacteria.
Key Words: Structural organization of intestinal microbiota; fluorescence in situ hybridization(FISH); bacterial–epithelial interactions; neutrophil transepithelial migration; bacterial killing byepithelial cells.
1. IntroductionIntestinal epithelial cells (IECs) represent the first line of defense against
potentially harmful bacteria present in the lumen. The human intestine is colo-nized by a huge number of bacteria, with approx 1012 bacteria contained in agram of colonic content, for example (1).
From: Methods in Molecular Biology, vol. 341: Cell−Cell Interactions: Methods and ProtocolsEdited by: S. P. Colgan © Humana Press Inc., Totowa, NJ
17
In addition, IECs are important immunoeffector cells with the capacity torelease cytokines, chemokines, and other molecules involved in antigen presen-tation and immune defense (2,3). Although bacteria are clearly necessary forthe development of normal immune function in the intestine, they also areinvolved in the pathogenesis of inflammatory bowel disease (IBD). Undernormal circumstances, bacterial–epithelial interactions may result in the gen-eration of tolerogenic signals, and no obvious inflammation ensues (2). Theunderlying mechanisms involved in normal individuals that are abrogated inIBD remain largely unknown. However, a significant number of both clinicaland laboratory findings have provided evidence for the contribution of luminalbacteria to the pathogenesis of IBD (4), with considerable data from practicallyall animal models implicating bacteria in this process (5). The potential role ofsuch crosstalk between bacteria and other intestinal cell types in normal phys-iology and/or pathophysiology is therefore a topic of intense investigation. Inthis chapter, we provide protocols for the identification of bacteria that areassociated with the epithelium and mucosa in addition to functional assaysdetermining the interactions of neutrophils with epithelial cells and the killingof bacteria by enterocytes. A large influx of neutrophils into the mucosa fromthe underlying vasculature occurs during intestinal bacterial infections (6,7).A marked infiltration of activated lymphocytes, macrophages, and granulo-cytes into the gut mucosa is also a salient feature in the pathology of IBD(8,9). This chronic influx and activation of immunocytes result in the sustainedoverproduction of reactive metabolites of oxygen and nitrogen, and it isthought that some of the intestinal injury and dysfunction observed in IBDresults from the elaboration of these reactive species (10). Neutrophils travers-ing the intestinal epithelium can lead to the formation of crypt abscesses.Moreover, large-scale transepithelial polymorphonuclear (PMN) leukocytemigration causes decreased barrier function (11). Bacteria can use secretionsystems to insert proteins into enterocytes and thus activate inflammatory sig-naling pathways. For example, SipA, a protein secreted by Salmonellatyphimurium, is necessary and sufficient to drive PMN transmigration acrossmodel intestinal epithelia (12). The transepithelial migration protocol describedin this chapter is of great use in understanding the dynamics and functionalconsequences of neutrophil interaction with enterocytes, the mediators pro-duced by both cell types, how this process contributes to pathology, and howit might be prevented therapeutically (13).
The gastrointestinal expression of antimicrobial peptides is evolutionarilyconserved (14) but it is a relatively recent discovery that epithelial cells have thecapacity to actively kill bacteria. Indeed, antimicrobial peptides and proteins arethought to constitute an important facet of innate immunity in the intestine. Mostantimicrobial peptides and proteins expressed by mammalian epithelial cells are
18 Canny, Swidsinski, and McCormick

members of protein families that mediate nonoxidative microbial cell killing byphagocytes (15). Indeed enterocytes express members of the defensin family (3)and other antimicrobial proteins, such as BPI (16), which are thought to beinvolved in the maintainance of homeostasis toward intestinal microflora andtheir products such as lipopolysaccharide (LPS). It is noteworthy that a defi-ciency in the production of certain defensins may play a role in the aetiopatho-genesis of Crohn’s disease (17). The killing assay provided here can be used todetermine the contribution of IEC to mucosal defense and whether this is sub-ject to regulation.
Formation of sessile communities and their inherent resistance to antibioticsand host immune attack are increasingly identified as a source of many recalci-trant bacterial infections. These include periodontal disease, endocarditis, chronicobstructive lung disease, and foreign body-related infections (18,19). With theexception of Helicobacter pylori, the impact of biofilms on the pathogenesis ofintestinal diseases is unknown. We describe an easy practicable fluorescencein situ hybridization (FISH) methodology achieving high-quality pictures byaccurate resolution of spatial structure and the composition of the microbiotaassociated with intestinal tissues. Probes are inexpensive and can be purchasedfrom many oligonucleotide manufacturers (such as MWG Biotech, Ebersberg,Germany) using different fluorochromes. Cy3, Cy5, or fluorescein isothio-cyanate (FITC) fluorochromes do not bleach quickly, have little auto fluores-cence background, and allow high-quality micrographs (Fig. 1). Cy3 providesbetter resolution than Cy5, and Cy5 is better than FITC. The results with otherfluorochromes are less encouraging. Presently, the sequences of more than 200FISH probes targeting the bacterial rRNA at domain group and species levelsare described in the literature. Some of the probes frequently used for evalua-tion of fecal communities are listed in Table 1 (20–23).
Contrary to expectations, none of the FISH probes that we have testedare absolutely specific. Depending on the microbial community investigated(e.g., human or animal intestine, pancreatic duct, gallstones, biliary stents) allFISH probes demonstrated some kind of cross-hybridization at the conditionsof optimal stringency. Many probes delivering specific results in human intes-tine were widely cross hybridizing in murine material. Cross-hybridizationof probes observed when characterizing biofilms within billiary stents andgallstones did not occur while investigating colonic microbiota even withinthe same patient. The choice of FISH probes must therefore be adjusted to thespecific requirements of the investigation. FISH is an excellent tool for theassessment of spatial structure. However, care must be taken when inter-preting the results, and the presence of specific bacterial groups must beconfirmed using alternative methods such as culturing, polymerase chain reac-tion with subsequent cloning, and sequencing. Taken together, the methods
Interactions of Intestinal Epithelial Cells 19

20 Canny, Swidsinski, and McCormick
Fig. 1. Bacterial flora attached to the ileal mucosa in a patient with Crohn’s disease(at a magnification of ×1000). The triangle of lumen is at the bottom right. Bacteria aretightly attached to the intact mucosal surface. Bacteroides is detected using an orange-labeled Cy3 probe, Erec (Eubacterium rectale Clostridium coccoides group), is stainedred (Cy5). No bacteria are found in normal controls (data not shown). (Please see colorinsert following p. 50 for a color version of this figure.)
Table 1FISH Probes
Name Target Reference
Eub338 Virtually all bacteria, Kingdom (Eu)Bacteria 20Ebac Enterobacteriaceae 21Erec482 Clostridium coccoides-Eubacterium rectale group 22Chis150 Clostridium histolyticum group 22Clit135 Clostridium lituseburense group
(incl. Clostridium difficile) 22Strc493 Streptococcus group 22Ecyl Eubacterium cylindroides and other 23Phasco Phascolarctobacterium faecium group 23Veil Veillonella group 23Rbro, Rfla Ruminococcus bromii, Ruminococcus
flavefaciens and other 23

22 Canny, Swidsinski, and McCormick
Table 2BPosthybridization Wash Buffer Composition
Formamide (%) NaCl mM (µL) 5 M NaCl (µL) (=y) 0.5 M EDTA (µL)
0 900 9000 05 636 6300 0
10 450 4500 015 318 3180 020 225 2150 50025 159 1490 50030 112 1020 50035 80 700 50040 56 460 50045 40 300 50050 28 180 50055 20 100 500
Table 2AHybridization Buffer Composition
Formamide (%) Formamide (µL) (=x) Distilled H2O (µL)
0 0 16005 100 1500
10 200 140015 300 130020 400 120025 500 110030 600 100035 700 90040 800 80045 900 70050 1000 60055 1100 50060 1200 40065 1300 300
H2O, 10 mL of 1 M HEPES, 9.5 g of HBSS– powder [Sigma], 0.05 mL 10 NNaOH; pH 7.4). All chemicals are obtained from Sigma.
4. Polystyrene T162 Tissue Culture Flasks with Phenolic Cap supplied by FisherScientific (Costar).

provided here are of considerable use in characterizing intestinal bacterial floraand examining their interactions with other cell types in this environment toelucidate functional implications in health and disease.
2. Materials2.1. Fluorescence In Situ Hybridization
1. Carnoy-solution (ethanol 6glacial acetic acid 3chloroform 1 from Sigma,St. Louis, MO) stored in the refrigerator.
2. Clean, filtered paraffin wax held at 2–4°C above its melting point (Kendall,Mansfield, MA).
3. A cold plate to rapidly cool the wax.4. A supply of molds in which to embed the tissues.5. SuperFrost® glass slides (Fisher Scientific, Pittsburgh, PA).6. PAP-PEN (Birmingham, UK).7. Forceps.8. Xylene (Sigma).9. Absolute alcohol.
10. FISH Probes. For commonly used probes, see Table 1.11. Hybridization buffer for (2 mL): 360 µL of 5 M NaCl; 40 µL of 1 M Tris-HCl,
pH 7.4, x mL (see Table 2A) formamide, deionized, 10 µL of 10% sodium dode-cyl sulfate (the amount will vary depending on the probe). With the exception offormamide, which must be deionized, all stock solutions can be stored at roomtemperature (RT) for 1 mo.
12. Posthybridization wash buffer (for 50 mL): 1 mL of 1 M Tris-HCl pH 7.4, y mL of5 M NaCl (depending on the formamide concentration in the hybridization buffer, seeTable 2B), 500 µL of 0.5 M EDTA (if formamide is used), 50 µL of 10% sodiumdodecyl sulfate. This buffer should be made up fresh. Buffers can be made accordingto Table 2B.
13. DAPI (Sigma), store at –20°C. Dilute to a working solution of 0.5 or 1 µg/mL.14. For mounting SlowFade (Molecular Probes), ProLong anti-fade (Molecular
Probes), or CitiFluor (CitiFluor, Ltd.) can be used.
2.1.1. Cell Culture
1. Cell culture medium: T84 intestinal epithelial cells are grown as monolayers in a11 mixture of Dulbecco’s Modified Eagle’s Medium and Ham’s F12 Nutrientmixture (Invitrogen) supplemented with 14 mM NaHCO3; 15 mM HEPES buffer,pH 7.5, 40 mg/L penicillin, 8 mg/L ampicillin, 90 mg/L streptomycin (all Sigma);and 5% newborn calf serum (Sigma).
2. Solution of trypsin (0.25%) and EDTA (1 mM) from Invitrogen.3. Hank’s Balanced Salts Solution (HBSS) buffers. HBSS with Ca2+ and Mg2+ is
termed HBSS+ (for 1 liter: 990 mL of deionized-distilled H2O, 10 mL of 1 MHEPES, 9.75 g of HBSS+ powder [Sigma], 0.05 mL 10N NaOH; pH 7.4). HBSSwithout Ca2+ and Mg2+ is termed HBSS– (for 1 liter: 990 mL of deionized-distilled
Interactions of Intestinal Epithelial Cells 21

5. 0.33-cm2 (5 µm pore size) collagen-coated polycarbonate filters (Costar Corp.,Cambridge, MA).
6. Triton X-100 (10% solution; Sigma).7. N-formyl-Met-Leu-Phe (1 µM stock solution; Sigma).
2.1.2. Solution of Rat Tail Collagen
1. Rat tails.2. 1% acetic acid (Sigma).3. Spectropor no. 1 dialysis tubing (Fisher Scientific).4. 70% ethanol.
2.1.3. Bacterial Growth Medium
1. Luria-Bertani broth (LB), per liter: 10 g tryptone/5 g yeast extract/10 g NaCl(Difco Laboratories Inc.).
2. Luria agar is LB containing 12 g of Bacto agar (Difco Laboratories Inc.) per liter.3. MacConkey agar (Difco Laboratories) is prepared according to package instruc-
tions (50 g powder per liter of deionized-distilled H2O).4. Gentamicin (Sigma ): 50 µg/mL prepared in deionized-distilled H2O.
2.1.4. Neutrophil Isolation
1. 2% Gelatin (Sigma) prepared in HBSS. Make up 2% gelatin fresh per each use bypreparing 3 g gelatin in 150 mL of HBSS– as follows: Preheat HBSS– to no morethan 45°C (gelatin has collagen in it that could degrade). Then, add gelatin whilestirring continually. Visually confirm that all of the gelatin is dissolved and letthe solution cool to 37°C before using (do not over cool). Prepare 50 mL of 2%gelatin per 60 mL of blood drawn.
2. 13% Acid-citrate-dextrose per liter: 13.7 g of citric acid, 25 g of sodium citrate,20 g of dextrose (all chemicals from Sigma).
3. Lysis buffer (keep at 4°C), per liter: 8.29 g of NH4Cl, 1 g of NaHCO3, 0.038 g ofEDTA (all chemicals Sigma).
4. Hemocytometer.5. Siliconized Pasteur pipets (Sigmacote; Sigma).6. 2% Acetic acid (Sigma).
2.1.5. Myeloperoxidase Assay
1. 2,2′- azino-bis-(3-ethylbenzthiazoline-6-sulfonic acid) (ABTS) substrate solution.ABTS is made fresh before every use: 28 mg ABTS, 45 mL H2O, 5 mL citratebuffer.
2. Citrate buffer (store at 4°C), for 500 mL: 400 mL of deionized-distilled H2O,73.5 g of sodium citrate, 52.5 g of citric acid, pH 4.2.
3. 30% H2O2. All chemicals obtained from Sigma.4. 96-well plates.
Interactions of Intestinal Epithelial Cells 23

2.2. Epithelial Cell-Killing Assay
1. Cell culture: Caco2 cells are cultured in Dulbecco’s Modified Eagle’s Mediumsupplemented with 10% fetal bovine serum, 100 U/mL of penicillin, and 100 µg/mLStreptomycin sulfate. All reagents were obtained from Sigma. Other necessarycell culture materials are listed in Subheading 2.1.1.
2. Sterile HBSS– (Sigma). Store at 4°C. Killing assays are conducted in the pres-ence of HBSS– as calcium and magnesium inhibit BPI-mediated activity (24);see Note 1.
3. Sterile water.4. Sterilized Eppendorf tubes (Fisher Scientific).5. Cell scrapers (Fisher Scientific).6. Luria Bertani broth and agar plates, prepared as detailed in Subheading 2.1.3.
3. Methods3.1. Fluorescence In Situ Hybridization
For Probe fixation, see Note 2.
1. Place the biopsy in an Eppendorf tube with 1.5 mL of cold Carnoy solution.Leave large probes longer in Carnoy (on average 1 h for each millimeter of tissuethickness).
2. Transfer the biopsy from Carnoy to the chilled absolute ethanol twice and fromethanol to xylene twice. Incubate the biopsy for 15 min in each. Embed the biopsyin liquid paraffin.
3. Paraffin embedding (see Note 3). Select the mold; there should be sufficient roomfor the tissue allowing for at least a 2-mm surrounding margin of wax.
4. Fill the mold with paraffin wax.5. Using warm forceps, select the tissue, taking care that it does not cool.6. Chill the mold on the cold plate, orienting the tissue and pressing it into the wax
with warmed forceps. This step ensures that the correct orientation is maintainedand the tissue surface to be sectioned is kept flat.
7. Insert the identifying label or place the labeled embedding ring or cassette baseonto the mold.
8. Cool the block on the cold plate, or carefully submerge it under water when athin skin has formed over the wax surface.
9. Remove the block from the mold.10. Cross check block, label, and worksheet.11. Cut the paraffin blocks to 2- to 10-µm thick slices and put them on super frost
glass slices (two slices for each appointed FISH probe). It is important to have aproperly fixed and embedded block and sharp knife or many biases can be intro-duced in the sectioning. Common biases include tearing, ripping, “venetian blinds,”holes, and folding.
12. Once sections are cut, they are floated on a warm water bath, which helps removewrinkles. They are then picked up on a glass microscopic slide.
24 Canny, Swidsinski, and McCormick

13. Place the glass slides in a warm oven at 50°C for approx 60 min to help the sectionadhere to the slide.
14. Deparaffinize the slides by running them through xylene to alcohol shortly beforehybridization: 4X 3-min incubations in xylene and 4X 3-min incubations inabsolute ethanol; all steps can be carried out at RT. Change the ethanol and xylenesolutions every 40 slices containing intestinal contents to prevent fecal bacteriafloating in the fluid and being found on the slices.
15. Heat the slices once more in a warm oven at 50°C for approx 25 min.16. Demark the area of the hybridization with a PAP-PEN and air-dry.17. Prepare the hybridization chamber using a Tupperware container that seals well.
Darken the chamber to avoid bleaching of the fluorescence. A platform can becreated for the slides, that must by absolutely horizontal over the hybridizationtime. Soak several paper towels with hybridization buffer to keep the chamberhumidified so the hybridizations do not dry out. Individual slides can also behybridized in humidified, 50-mL plastic screw cap tubes.
18. Mix 16 µL of hybridization buffer with 2 µL of the FISH probes (∼10 ng of eachprobe) and distribute it over the biopsy surface. Be careful not to scratch the probewhile distributing it. Do not use cover slips; they can mechanically disturb themucus layer and spatial structures.
19. Place slides in box and incubate for 60 to 90 min in a moisture chamber at probe-specific temperature (see Note 4).
20. Posthybridization washes; remove the slices from the hybridization chamber. Theyshould not be dry! Rinse the slides with MQ H2O and transfer them immediatelyinto a 50-mL tube with washing buffer prewarmed to the required hybridizationtemperature (two slides in each tube). Wash for 5 min in a water bath at the requiredhybridization temperature.
21. After 5 min of washing, rinse the probes with MQ H2O, air-dry.22. DAPI counter staining; apply 20 µL of DAPI to each section, stain for 5 min at
RT, wash with MQ H2O, and air-dry.23. Mounting; apply anti-fading mountant to the section. Add cover slip and view under
an epifluorescent microscope and take pictures as desired (see Note 5). Becausethe slides fade quickly, they should be viewed within 2 d and stored in the dark.
3.2. Enteric Pathogen Interactions With Model IEC-Polarized Monolayers
3.2.1. Preparation of Rat Tail Collagen
The isolation of rat tail collagen is performed by the method of Cereijidoet al. (25).
1. Strip the skin from the rat tail; the tendons are almost pure collagen. 2. Soak 0.75 g of collagen in 70% ethanol for 20 min to dehydrate. Next, solubilize
the tendons in 100 mL of 1 % acetic acid (v/v) precooled to 4°C. Stir the mixtureovernight at 4°C.
Interactions of Intestinal Epithelial Cells 25

At this point, the solution should be viscous and some undissolved material willremain.
3. Spin the collagen solution at 25,000g for 30 min at 4°C. Discard only the pelletand put the collagen preparation into dialysis tubing (Spectropor no. 1), whichhas been presoaked in distilled-deionized H2O for 1 h.
4. Place the tubing in a 2 L beaker, add cold distilled-deionized H2O, and dialyze for24 h at 4°C against two to three changes of H2O.
5. Remove the collagen from the dialysis tubing and dilute the solution if necessary.The collagen solution should be a little thinner than the consistency of honey.
6. Store at 4°C for 2 mo.
3.2.2. Preparation of T84 Cells Grown on Collagen-Coated Polycarbonate Filters
1. Conventional inserts are prepared for the use in bacterial invasion assays (26).A 50-µL aliquot of the rat tail collagen mixture is placed in each well. Careshould be taken to make sure collagen is evenly distributed across the filter andthat the collagen stock solution is maintained at 4°C.
2. Allow plates to completely dry (3–24 h). 3. Next, the T84 cells, which are grown on 162-cm2 flasks are trypsinized, and 7.5 × 10⁵
cells are then suspended in 75 µL of media and are placed in each transwell™
(Costar). A total 900 µL of cell culture media is placed in the outside chamber. Polar-ized monolayers prepared in this fashion can be used 6 to 14 d after plating.A steady-state resistance is reached 4 to 6 d after plating, with variability largelyrelated to the cell passage number.
4. Inverted monolayers are prepared for use in neutrophil transmigration assays (26).The transwells (Costar) are removed from their respective wells and are placedupside down in a large gridded Petri dish; one invert to each petri dish grid square(each Petri dish holds 24 inverts).
5. A 50-µL aliquot of rail tail collagen is placed on the filter. When adding thecollagen to the filter it is important to keep the solution at 4°C. Let the collagendry on the filter overnight in the covered Petri dish.
6. Carefully add 75 µL of a 7.5 × 10⁵ T84 cell suspension to each invert andincubate at 37°C overnight. The next day, use forceps to aseptically flip theinverts into a 24-well plate. Add 1 mL of cell culture medium to the outsidewell and 200 µL to the inside of the invert. Polarized monolayers prepared inthis fashion can be used 6 to 14 d after plating. A steady-state resistance isreached 4 to 6 d after plating, with variability largely related to the cell passagenumber.
3.2.3. Growth of Bacteria
Nonagitated microaeophilic cultures of S. typhimurium are prepared byinoculating 10 mL of LB broth with 0.01 mL of a stationary-phase culture,followed by overnight incubation (18 h) at 37°C. Bacteria from such cultures
26 Canny, Swidsinski, and McCormick

are in late logarithmic phase of growth and represent approx 5–7 × 10⁸ colony-forming units (CFUs)/mL. CFUs are determined by serially diluting thebacteria and plating onto MacConkey agar medium.
3.2.4. Neutrophil Isolation
The neutrophil isolation procedure is based on the method of Henson andOades (27).
1. From a healthy human volunteer, draw 60 mL of blood directly into a 50-mLsyringe that contains 6 mL of 13% acid-citrate-dextrose (pH 4.0).
2. Spin for the buffy coat (400g, 20 min at RT). 3. Using prepared, siliconized pasteur pipets, remove top yellow serum layer down
through the white interface by gentle aspiration. The interface contains lympho-cytes, platelets, and monocytes, while the neutrophils are in the red layer, andjust below the white interface.
4. Once the buffy-coat is removed, dispense 20 mL of the blood per 50 mL Falcon™
centrifuge tube and then add the 2% gelatin bringing the final volume to 50 mL(i.e., should have three tubes/60-mL blood draw). Let stand for 25 min at 37°C,during which time the red blood cells will settle to the bottom of the tube.
5. Using a 10-mL pipet, combine as much of the clear supernatant as possible innew tubes and do not contaminate with the bottom red blood cell layer.
6. Spin the clear supernatant at RT in a tabletop centrifuge for 10 min at 400g.7. Remove the supernatant by aspiration and gently resuspend the white pellet in
3 mL cold (4°C) lysis buffer per 50-mL tube. 8. Next, bring the volume of cold lysis buffer to 50 mL, and centrifuge at 4°C for
10 min at 1200g. Aspirate off the supernatant and discard. 9. Gently resuspend the pellet in 5 mL cold HBSS– and wash with 50 mL of cold
HBSS–. Resuspend the pellet in 3 mL cold HBSS– and carefully break up thepellet by gentle pipetting.
10. To count the neutrophils, remove 5 µL of the suspension and place this in 500 µLof 2% acetic acid. Acetic acid prevents swelling of the neutrophils and lyses thered blood cells, permitting one to view the morphology of cells. Add 12 µL of theneutrophil suspension to each side of the hemocytometer and count the number ofcells in each of the chambers and average the counts.
11. Resuspend the neutrophils at a final concentration of 5 × 10⁷/mL in HBSS–. PMNare kept on ice in HBSS– and are used within 1 hr of being isolated. It is alsoimportant to keep the PMN in HBBS– buffer since the addition of divalent cationswill cause them to become activated.
3.2.5. Invasion of S. typhimurium Into T84 Intestinal Epithelial Monolayers
Infection of T84 monolayers is performed by the method of Lee andFalkow (28) with slight modification (26).
Interactions of Intestinal Epithelial Cells 27

1. Inserts with attached monolayers are lifted from the wells, drained of media byinverting, and gently washed by immersion in a beaker containing HBSS+,warmed to 37°C. Cells are incubated in HBBS+ buffer because the absence ofdivalent cations will cause the opening of intestinal epithelial tight junctions.
2. Next, the monolayers are placed in a new 24-well tissue culture plate bathed with1.0 mL HBSS+ in the lower (outer) well and 0.05 mL HBSS+ added to the upper(inner well) and are then equilibrated for 30 min at 37°C.
3. 7 µL of each HBSS+ washed, bacterial sample (representing an inoculation ratio of10:20 bacteria:epithelial cell) is added per monolayer for 1 h. If necessary, the bac-terial invasion can be followed throughout a time-course of 1 h. Two populationsof bacteria generally are assessed: cell associated and internalized. Cell-associatedbacteria represent the population of bacteria adherent to and/or internalized into theT84 monolayers and are released by incubation with 0.1 mL of 1% Triton X-100for 20 min at 4°C. Internalized bacteria are those obtained from the lysis ofepithelial cells with 1% Triton X-100, 90 min after the addition of gentamicin(50 µg/mL). Gentamicin, an aminoglycoside antibiotic, does not permeate eukary-otic plasma membranes and is therefore cytolytic only to extracellular populationsof bacteria while intracellular bacterial populations remain viable (29).
4. For both cell associated and internalized bacteria, 0.9 mL of LB is then addedand each sample is vigorously mixed and quantified by plating for CFUs onMacConkey agar. To determine the number of adherent organisms the internalizedpopulation is subtracted from the cell-associated population (i.e., cell associated –internalized = adherent).
3.2.6. PMN Transepithelial Migration
Evaluation of neutrophil migration across monolayers of polarized intestinalepithelia stimulated by S. typhimurium is performed by the method of McCormicket al. (26) and is illustrated in Fig. 2.
1. T84 inverted monolayers are extensively rinsed in HBSS+ to remove residualserum components.
2. S. typhimurium is prepared by washing twice in HBSS+ and then are suspendedto a final concentration of 5 × 10⁹/mL. Then, 100-µL aliquots of the bacterialsuspension are microcentrifuged at 13,000g for 3 min and resuspended in HBSS+a final volume of 25 µL.
3. Inverted cell monolayers are removed from each well and placed in a moist cham-ber such that the epithelial apical membrane surface is oriented upward.
4. The bacterial suspension is gently distributed onto the apical surface and incu-bated for 45 min at 37°C.
5. Nonadherent bacteria are then removed by washing three times in HBSS+ buffer.The monolayers are then transferred, by inverting, back into the 24-well tissueculture tray containing 1.0 mL of HBSS+ buffer, in the lower (apical membranenow colonized with Salmonella) reservoir and 160 µL in the upper (basolateralinterface) reservoir.
28 Canny, Swidsinski, and McCormick
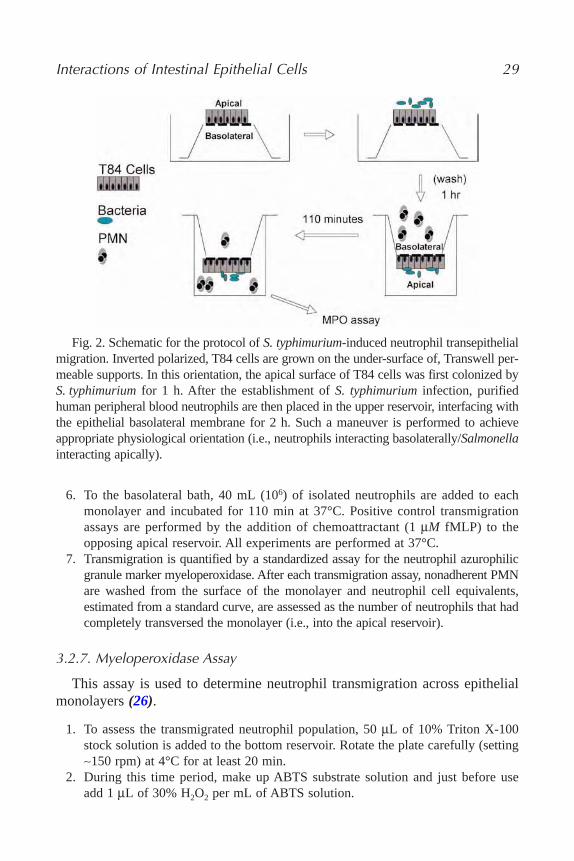
6. To the basolateral bath, 40 mL (106) of isolated neutrophils are added to eachmonolayer and incubated for 110 min at 37°C. Positive control transmigrationassays are performed by the addition of chemoattractant (1 µM fMLP) to theopposing apical reservoir. All experiments are performed at 37°C.
7. Transmigration is quantified by a standardized assay for the neutrophil azurophilicgranule marker myeloperoxidase. After each transmigration assay, nonadherent PMNare washed from the surface of the monolayer and neutrophil cell equivalents,estimated from a standard curve, are assessed as the number of neutrophils that hadcompletely transversed the monolayer (i.e., into the apical reservoir).
3.2.7. Myeloperoxidase Assay
This assay is used to determine neutrophil transmigration across epithelialmonolayers (26).
1. To assess the transmigrated neutrophil population, 50 µL of 10% Triton X-100stock solution is added to the bottom reservoir. Rotate the plate carefully (setting∼150 rpm) at 4°C for at least 20 min.
2. During this time period, make up ABTS substrate solution and just before useadd 1 µL of 30% H2O2 per mL of ABTS solution.
Interactions of Intestinal Epithelial Cells 29
Fig. 2. Schematic for the protocol of S. typhimurium-induced neutrophil transepithelialmigration. Inverted polarized, T84 cells are grown on the under-surface of, Transwell per-meable supports. In this orientation, the apical surface of T84 cells was first colonized byS. typhimurium for 1 h. After the establishment of S. typhimurium infection, purifiedhuman peripheral blood neutrophils are then placed in the upper reservoir, interfacing withthe epithelial basolateral membrane for 2 h. Such a maneuver is performed to achieveappropriate physiological orientation (i.e., neutrophils interacting basolaterally/Salmonellainteracting apically).

3. Prepare neutrophil standards by serially diluting 1 × 10⁶ neutrophils down to 5 ×10³.
4. Add 50 µL of citrate buffer to each well.5. Remove 100 µL of sample from each well and add it into a 96-well plate in
duplicate.6. Add 100 µL of the ABTS solution (supplemented with H2O2) to the prepared
96-well plates. 7. Place at 37°C and let develop for 15 to 20 min. 8. Read the plate in an ELISA plate reader at a wavelength of 405 nm.
3.3. Epithelial Cell-Killing Assay
1. Culture S. typhimurium in LB broth at 37°C until the culture reaches an absorbanceof 0.8 when spaced at 600 nm. This corresponds to approx 1 × 10⁹ CFU/mL. If the bacteria have grown further, dilute the culture to this absorbance in HBSS–.These bacteria are in log phase.
2. Centrifuge the bacterial culture at 3000g for 10 min. Aspirate off the broth andresuspend the pellet in 5 mL of prewarmed HBSS–. Repeat this procedure once towash the bacteria. Resuspend the bacteria in 5 mL HBSS–.
3. Fill and label Eppendorfs with 1 mL of HBSS–, these are used to dilute the samples. For purposes of accuracy it is important to pipet exact volumes.
4. Fill a 15-mL sterilin for each well of cells with 5 mL ice-cold sterile water andkeep the sterilins on ice.
5. Take the plate of epithelial cells, aspirate off the medium and wash gently with1 mL of warm HBSS–.
6. Reaspirate and add 1 mL of HBSS– to the cells. 7. Then incubate the cells with 100 µL of the bacterial suspension. We generally
use 6 well plates of 7- to 10-d-old Caco2 cells but this method can be modified forcells cultured on inserts by adding HBSS– apically and basolaterally and incubat-ing the cells with apically applied bacteria, thereby mimicking the physiologicalscenario. Incubate HBSS– and bacteria in an additional plate to serve as a bacte-rial control. This bacterial standard allows for control of bacterial death andgrowth independent of epithelial cells and will be used to calculate percentagekilling.
8. Incubate the cell culture plates at 37°C on a rotating platform set to 60 rpm. 9. At desired time-points, scrape the cells using a cell scraper along with the super-
natants into 5 mL ice-cold water to hypotonically lyse the epithelial cells andprevent further killing or growth of bacteria.
10. Take samples from epithelial lysates and the bacterial standard and serially dilutethem by transferring 10 µL of lysate into 1 mL HBSS– and 100 µL of this dilu-tion into 1 mL HBSS–. To reduce variability this volume should be added with-out touching the liquid in the Eppendorf. Plate triplicate 50-µL drops of 1/1000and 1/10,000 dilutions on agar (this allows for replicates to be plated) and culture
30 Canny, Swidsinski, and McCormick

the plates at 37°C overnight. Determine the percentage bacterial killing using thefollowing equation:
Mean standard CFU – mean sample CFU/Mean standard CFU × 100 = % killing
where mean sample CFU was the mean of triplet drops for each dilution ofthe cellular lysate and standard was that of the bacteria alone. Results can alsobe expressed as CFU or CFU/mL. Alternatively, the plating may be performedusing the “pour plate method” if desired. For Caco2 cells, significant killing hasoccurred by 15 min and, in our hands, it frequently is maximal by approx60 min. For results of a typical experiment using a smooth strain of Salmo-nella, see Fig. 3. Care must be taken to ensure that the bacteria are not dyingthroughout the course of the experiment, thus negating the results. In thisregard, Salmonella are viable for several hours in HBSS.
To prove that the killing is mediated by a specific peptide or protein, aninhibitory antibody or antisera may be used. In this case, prepare the antibodyor antisera at the appropriate dilution and after washing the epithelial mono-layer add 1 mL of this solution to the cells. Incubate for 30 min at 4°C. This isdone to allow attachment of the antibody and prevent non-specific binding.
Interactions of Intestinal Epithelial Cells 31
Fig. 3. (A) A time course depicting the killing of a smooth strain of Salmonellatyphimurium by Caco2 cells. (B) Epithelial pre-exposure to the stable Lipoxin A4
analog ATLa enhances this killing in a concentration-dependant fashion. Results areexpressed as mean ± SEM.

Thereafter, allow the plate to warm to 37°C, add the bacterial suspension andcontinue with the procedure above. Additional controls should be included torule out the possibility of the antibody affecting bacterial growth.
4. Notes1. Initial growth curves should be conducted to relate absorbance to bacterial
number. We have used this protocol to assess the contribution of BPI to bacterialkilling mediated by intestinal epithelial cells but the assay can be adapted forother mucosal epithelial cells using a relevant strain of bacteria. Anionic sites inthe Lipid A region of LPS are normally occupied by divalent cations (Ca2+ and/orMg2+) which result in tight LPS packing. Bacterial/permeability increasing proteinat antibacterial concentrations effectively competes for these sites in the LPSmolecule and conversely, bound bacterial/permeability increasing protein can bedisplaced by these cations (24).
2. Before the spatial organization of intestinal microbiota can be investigated, it mustbe preserved. Shock frosting of the probes allows the preparation of native tissueslices with bacteria attached to the mucosa and intestinal contents. However, thefluorescent in situ hybridization takes place in an aqueous environment at temper-atures of 46°C and higher. Hybridization occurs during a period of at least 90 min,which is necessary to achieve sufficient signals, but during this time bacteria arebeing progressively detached from the tissue and the spatial structure is lost. For-malin disintegrates spatial structures even before hybridization and tends to swelltissues rendering loose bacterial conglomerates within mucus more vulnerable todisintegration. The use of nonaqueous fixatives to preserve the mucus layer iscrucial. We achieved excellent results preserving the material of human biopsies,surgically removed tissues and whole animal intestines with Carnoy solution.Once the structure of microbial communities is stabilized FISH proves to be asimple and reliable method.
3. The mechanical treatment of tissues while obtaining specimens leads to biasescaused by dragging, crushing, and disrupting of normal anatomy. Fecal bacteriamay be integrated into the distorted tissues and found at atypical anatomic sites andeven within single cells. The optical integrity of the epithelial layer or of the tissueat the site of investigation is extremely important. Normally the autofluorescencebackground of human tissues allows good visualization and orientation within histo-logical structures and the mucus layer. However, at least two additional stains(Alcian blue, hematoxylin and eosin, or other) for each biopsy or tissue specimensshould be performed and are extremely helpful especially during optimization. Noevaluation should be attempted when signs of tissue damage are obvious.
4. When optimizing probes for specificity, it is necessary to vary the hybridizationtemperature or formamide concentrations (increased temperature or formamideconcentration means increased specificity). If possible do not use temperatureshigher than 50°C or formamide concentrations higher than 55%. High tempera-tures result in mucus detachment and formamide introduces biases in eucaryotictissues leading to bizarre fluorescent signals. Whenever possible, short hybridiza-
32 Canny, Swidsinski, and McCormick

tion times of 90 min are preferable, and the hybridization should not exceed 6 h.In most cases, 90 min provides excellent resolution when Cy3, Cy5, or FITCfluorochromes are used.
5. The quantification of bacteria within spatial structures cannot be directly verifiedby stepwise dilution of bacteria. We use the approximation based on the follow-ing model. A 10-µL suspension of bacteria of 107 cells per mL applied to a glasssurface in a circle of 1 cm results in 40 cells per average microscopic field of200 µm diameter at a magnification of ×1000. One bacterium thus occupies anarea of 785 µm2. One bacterium averages 0.8 µm in size. Under these assump-tions, a surface of 100 µm2 containing one (or 100) bacterial cells will correspondto a concentration of 1 × 10⁹ (or 1 × 10¹¹) cells per microliter in tissue slides thatare 10-µm thick. 250 bacterial cells per 100 µm2 does not allow the visual distinc-tion of single bacteria but spaces between bacteria can still be seen; cases such asthis were therefore assigned a concentration of 1011 cells per milliliter. A homo-geneous carpet without any empty spaces between them occurs as bacteriaincrease to 2500 cells/100 µm2; these cases were assigned a concentration of 1012
cells per milliliter. In cases of extremely high bacterial concentrations sections of4 or even 2 µm in size can be performed. The spatial organization and the com-position of the biofilm can be evaluated using a cumulative multi-step extensionanalysis which includes detection of bacteria using single FISH probes (Cy3) andDAPI DNA counter-stain. For each sample, probes that positively hybridize withmore than 1% of the bacteria that are visualized by DAPI are further combinedwith each other in pairs and triplets and applied simultaneously using different flu-orochromes in a single hybridization (Cy3/FITC/Cy5/ DAPI corresponds toorange/green/dark red/blue). This permits a three- or four-color analysis of thepopulation structure within the same microscopic field. The hybridizations withdifferent probe combinations are cumulatively extended until the position of allrelevant bacterial groups to each other and their relative concentrations are clari-fied. When probes for unrelated bacterial groups hybridize with the same bacteria,it is necessary to adjust the hybridization stringency (see Note 4) until a cleardifferentiation of the bacterial groups is possible. Probes cross-hybridizing evenunder high stringency conditions should be excluded from the evaluation.
References1. Berg, R. D. (1996) The indigenous gastrointestinal microflora. Trends Microbiol.
4, 430–435. 2. Sansonetti, P. J. (2004) War and peace at mucosal surfaces. Nat. Rev. Immunol.
4, 953–964. 3. Ouellette, A. J. (2004) Defensin-mediated innate immunity in the small intestine.
Best Pract. Res. Clin. Gastroenterol. 18, 405–419.4. Swidsinski, A., Ladhoff, A., Pernthaler, S., et al. (2002) Mucosal flora in inflam-
matory bowel disease. Gastroenterology 122, 44–54. 5. Fiocchi, C. (1998) Inflammatory bowel disease; etiology and pathogenesis. Gastro-
enterology 115, 182–205.
Interactions of Intestinal Epithelial Cells 33

6. Turnbull, P. C. and Richmond, J. E. (1978) A model of salmonella enteritis: thebehaviour of, Salmonella enteritidis in chick intestine studies by light and electronmicroscopy. Br. J. Exp. Pathol. 59, 64–75.
7. Wallis, T. S., Hawker, R. J., Candy, D. C., et al. (1989) Quantification of the leuco-cyte influx into rabbit ileal loops induced by strains of, Salmonella typhimurium ofdifferent virulence. J. Med. Microbiol. 30, 149–156.
8. MacDermott, R. P. (1999) Chemokines in the inflammatory bowel diseases. J. Clin.Immunol. 19, 266–272.
9. Ajuebor, M. N. and Swain, M. G. (2002) Role of chemokines and chemokinereceptors in the gastrointestinal tract. Immunology 105, 137–143.
10. Pavlick, K. P., Laroux, F. S., Fuseler, J., et al. (2002) Role of reactive metabolitesof oxygen and nitrogen in inflammatory bowel disease (1,2). Free Radic. Biol.Med. 33, 311–322.
11. Nash, S., Stafford, J., and Madara, J. L. (1987) Effects of polymorphonuclearleukocyte transmigration on the barrier function of cultured intestinal epithelialmonolayers. J. Clin. Invest. 80, 1104–1113.
12. Lee, C. A., Silva, M., Siber, A. M., Kelly, A. J., Galyov, E., and McCormick, B. A.(2000) A secreted Salmonella protein induces a proinflammatory response inepithelial cells, which promotes neutrophil migration. Proc. Natl. Acad. Sci. USA97, 12,283–12,288.
13. Mrsny, R. J., Gewirtz, A. T., Siccardi, D., et al. (2004) Identification of hepoxilin,A3 in inflammatory events: a required role in neutrophil migration across intesti-nal epithelia. Proc. Natl. Acad. Sci. USA 101, 7421–7426.
14. Zasloff, M. (1992) Antibiotic peptides as mediators of innate immunity. Curr.Opin. Immunol. 4, 3–7.
15. Nissen-Meyer, J. and Nes, I. F. (1997) Ribosomally synthesized antimicrobialpeptides: their function, structure, biogenesis, and mechanism of action. Arch.Microbiol. 167, 67–77.
16. Canny, G., Levy, O., Furuta, G. T., et al. (2002) Lipid mediator induced expressionof bactericidal/permeability-increasing protein (BPI) in human mucosal epithelia.Proc. Natl. Acad. Sci. USA 99, 3902–3907.
17. Fellermann, K., Wehkamp, J., Herrlinger, K. R., and Stange, E. F. (2003) Crohn’s dis-ease: a defensin deficiency syndrome? Eur. J. Gastroenterol. Hepatol. 15, 627–634.
18. Costerton, J. W., Veeh, R., Shirtliff, M., Pasmore, M., Post, C., and Ehrlich, G. (2003)The application of biofilm science to the study and control of chronic bacterialinfections. J. Clin. Invest. 112, 1466–1477.
19. Wilson, M. (2001) Bacterial biofilms and human disease. Sci. Prog. 84, 235–254.20. Amann, R., Krumholz, L., and Stahl, D. A. (1990) Fluorescent-oligonucleotide
probing of whole cells for determinative, phylogenetic, and environmental studiesin microbiology. J. Bacteriol. 172, 762–770.
21. Bohnert, J., Hübner, B., and Botzenhart, K. (2002) Rapid identification of Enterobacteriaceae using a novel 23S rR. N.A-targeted oligonucleotide probe. Int.J. Hyg. Environ. Health 203, 77–82.
34 Canny, Swidsinski, and McCormick

22. Franks, A. H., Harmsen, H. J., Raangs, G. C., Jansen, G. J., Schut, F., and Welling,G. W. (1998) Variations of bacterial populations in human feces measured byfluorescent in situ hybridization with group-specific 16S rR. N.A-targeted oligonu-cleotide probes. Appl. Environ. Microbiol. 64, 3336–3345.
23. Harmsen, H. J., Raangs, G. C., He, T., Degener, J. E., and Welling, G. W. (2002)Extensive set of 16S rRNA-based probes for detection of bacteria in human feces.Appl. Environ. Microbiol. 68, 2982–2990.
24. Elsbach, P. and Weiss, J. (1992) Oxygen-independent antimicrobial systems ofphagocytes, in Inflammation: Basic principles and Clinical Correlates, SecondEdition (Gallin, J. I., Goldstein, I. M., and Snyderman, R., eds.), Raven, New York,pp. 603–636.
25. Cereijido, M., Robbins, E. S,. Dolan, W. J., Rotunno, C. A., and Sabitini, D. D.(1978) Polarized monolayers formed by epithelial cells on a permeable and translu-cent support. J. Cell Biol. 77, 853–880.
26. McCormick, B.A., Colgan, S. P., Delp-Archer, C., Miller, S. I., and Madara, J. L.(1993) Salmonella typhimurium attachment to human intestinal epithelial monolay-ers: transcellular signaling to subepithelial neutrophils. J. Cell Biol. 123, 895–907.
27. Henson, P. M. and Oades, Z. G. (1975) Stimulation of human neutrophils bysoluble and insoluble immunoglobulin aggregates: secretion of granule constituentsand increased oxidation of glucose. J. Clin. Invest. 56, 1053–1061.
28. Lee, C. A. and Falkow, S. (1990) The ability of Salmonella to enter mammaliancells is affected by bacterial growth state. Proc. Natl. Acad. Sci. USA 87, 4304–4308.
29. Lissner, C. R., Swanson, R. N., and O’Brien, A. D. (1983) Genetic control of theinnate resistance of mice to Salmonella typhimurium expression of the Ity gene inperitoneal and splenic macrophages is located in vitro. J. Immunol. 131, 3006–3013.
Interactions of Intestinal Epithelial Cells 35


37
3
The Role of Junctional Adhesion Moleculesin Interactions Between Vascular Cells
Triantafyllos Chavakis and Valeria Orlova
SummaryAdhesive interactions between cells regulate tissue integrity as well as the process of
inflammatory cell recruitment. Such intercellular interactions are regulated by adhesion receptorsand can be homotypic, that is, between cells of the same type, for example, between adjacentendothelial cells in the vasculature, as well as heterotypic, that is, between different cells, suchas the leukocyte endothelial interactions that take place during leukocyte extravasation. Emerg-ing evidence points to the importance of the family of junctional adhesion molecules (JAMs),which are localized in interendothelial contacts and are implicated in the regulation of leukocyteextravasation. JAMs are members of the immunoglobulin superfamily and can undergo bothhomophilic and heterophilic interactions. This chapter deals with the role of JAMs in the regu-lation of adhesive interactions between vascular cells.
Key Words: Cell adhesion; transmigration; junction; JAM, inflammation; homophilic;heterophilic; co-immunoprecipitation; leukocyte; endothelial.
1. IntroductionJunctional adhesion molecules (JAMs) belong to the CD2 subgroup of the
immunoglobulin superfamily and consist of two extracellular Ig-like domains,followed by a single transmembrane region and a short cytoplasmic tail. Thegenes for human JAM-A, JAM-B, and JAM-C are localized on the chromosomes1, 21, and 11, respectively, and the encoded mature glycoproteins have molecu-lar masses of 32, 40, and 43 kDa, respectively (1–3). JAM-A is found on differ-ent circulating blood cells, including granulocytes, monocytes, lymphocytes,platelets, and erythrocytes, as well as on endothelial and epithelial cells (4,5).JAM-B particularly localizes on vascular and lymphatic endothelium andespecially at high endothelial venules (6). JAM-C is expressed on endothelial
From: Methods in Molecular Biology, vol. 341: Cell−Cell Interactions: Methods and ProtocolsEdited by: S. P. Colgan © Humana Press Inc., Totowa, NJ

cells, and platelets (7–9) and on epithelial cells (10). All three JAMs have a class-II PDZ domain-binding motif at their final carboxy-terminus (three C-terminalamino acids). This motif predisposes the molecules to interact with PDZ-domain-containing molecules, such as the ones found in tight junctions (TJs [2]). SuchPDZ-domain molecules include zonula occludens (ZO)-1 (11), AF6/afadin (12),MUPP 1 (multi-PDZ-domain-protein 1 [13]), and PAR-3 (partitioning defective),which forms a complex with atypical protein kinase C and PAR-6 (14,15). Theassociation of JAMs with TJ-marker proteins such as ZO-1 can be studied withcoimmunoprecipitation experiments. The codistribution of these molecules canalso be confirmed by immunofluorescence studies. Thus, JAMs may be involvedin a multiprotein complex located at TJs and, because ZO-1 and AF-6 are linkeddirectly to the actin cytoskeleton (16), JAMs may be involved in the dynamicregulation of junction assembly. Here, a particular role may be assigned to thehomophilic interaction between JAMs on two adjacent cells.
As opposed to the homophilic interaction, JAMs also can undergo hetero-philic interactions and several lines of evidence point to the fact that JAMs alsoare engaged as counter-receptors for leukocyte integrins: in particular, JAM-Abinds the leukocyte integrin αLβ2 (LFA-1 [17]), JAM-B associates with α4β1(VLA-4 [18]), and JAM-C interacts with αMβ2 (Mac-1 [9]). The latter interac-tion also mediates leukocyte-platelet interactions. Moreover, the cellular local-ization of JAMs and these heterophilic binding capacities pointed to a potentialrole of JAMs in leukocyte extravasation. These heterophilic interactions ofJAMs with leukocyte integrins and their potential applications in leukocytetransendothelial migration can be investigated by specific assays, including thebinding of isolated proteins in vitro, the adhesion of leukocytes, as well as theirtransendothelial migration in vitro.
2. Materials2.1. Cell Culture and Lysis for the Preparation of Samples
1. Endothelial cell growth medium (PromoCell, Heidelberg, Germany) supplementedwith growth factors and 5% FCS (PromoCell).
2. Alpha-Minimal Essential Media growth medium (PAA, Linz, Austria) supple-mented with 10% heat-inactivated fetal calf serum (FCS; Biowest, Nuaillé, France;see Note 1), 1% penicillin/streptomycin/glutamine, 1% Na-Pyruvate (GIBCO/BRL,Bethesda, MD).
3. Zeocin (Invitrogen, Carlsbad, CA); Accutase (PAA); Trypsin solution (10X)(GIBCO/BRL).
4. To prepare 0.2% gelatin solution, dilute 2% gelatin stock-solution (Sigma-Aldrich,Munich, Germany) in Hank’s Balanced Salt Solution.
5. NP-40 lysis buffer: 50 mM Tris-HCl, pH 7.4, 150 mM NaCl, and 0.5% NP-40.Buffer should be stored at 4°C. Before use, add protease inhibitor cocktail tablets(Complete Mini, EDTA-free, Roche, Mannheim, Germany), phosphatase inhibitor
38 Chavakis and Orlova

cocktail 1 (Sigma), 2.5 mM Na-ortovanadate (Stock 200 mM, Sigma; see Note 2),and 1 mM NaF (Sigma).
6. Cell scrapers (Greiner Bio-One, Frickenhausen, Germany).
2.2. Immunoprecipitation
1. Mouse monoclonal antibodies against human JAM-C (Gi11) were provided byDr. S. Santoso (Giessen, Germany [9]).
2. UltraLink Immobilized Protein A/G (PIERCE, Rockford, IL).3. Sample buffer (4X): 240 mM Tris-HCl, pH 6.8, 40% (w/v) glycerol, 8% (w/v)
sodium dodecyl sulfate (SDS), 0.1% (w/v) bromophenol blue.
2.3. SDS-PAGE
1. Separating buffer (4X): 1.5 M Tris-HCl, pH 8.8, 0.4% SDS. Store at 4°C.2. Stacking buffer (4X): 0.5 M Tris-HCl, pH 6.8, 0.4% SDS. Store at 4°C.3. 10% (w/v) Ammonium persulfate solution (APS), dissolve in water, and store at
room temperature (RT; up to 1 wk) or at 4°C.4. Thirty percent acrylamide/bis solution (37.51) and TEMED (Sigma).5. Running buffer (5X): 125 mM Tris-HCl, 1.25 M glycine, 0.5% (w/v) SGS. Store
at RT.6. Prestained protein molecular weight marker (Fermentas, Hanover, MD).
2.4. Western Blot
1. Transfer buffer: 20 mM Tris, 150 mM glycine, 20% (v/v) methanol.2. Gel-blotting paper (Schleicher & Schuell, Dassel Germany) and Nybond-Enhanced
Chemiluminescence (ECL) Nitrocellulose membrane (Amersham Biosciences,Freiburg, Germany).
3. PBS-T20: Prepare 10X phosphate-buffered saline (PBS) stock solution of 1.37 MNaCl, 27 mM KCl, 81 mM Na2HPO4x2H2O, and 18 mM KH2PO4. Dilute PBS to1X and add 0.05% (v/v) Tween-20.
4. Blocking buffer: 5% (w/v) nonfat dry milk in PBS-T20. 5. Primary antibody dilution buffer: 1% (w/v) BSA in PBS-T20.6. Primary antibody: Rabbit anti-ZO-1 (Zymed, South San Francisco, CA).7. Secondary antibody: Pork anti-rabbit IgG-HRP (Dako Cytomation, Hamburg,
Germany).8. ECL Western blotting detection reagent and Hyperfilm ECL (Amersham Bioscience).
2.5. Immunofluorescence
1. Eight-well chamber slides (Permanox; Nunc, Roskilde, Denmark). 2. Human umbilical vein endothelial cells (HUVECs) grown on eight-well chamber
slides precoated with 0.2% gelatin for 36 to 48 h at 37°C. 3. The methanol used to fix cells should be ice cold.4. Primary antibodies: MAb Gi11 against JAM-C (see Subheading 2.2.) and rabbit
polyclonal antibody against ZO-1 (Zymed).
Role of Junctional Adhesion Molecules 39

5. Antibody-dilution buffer: 5% goat serum + 1% bovine serum albumin (BSA) inPBS.
6. Secondary antibodies: rhodamine-coupled anti-mouse IgG (Dianova, Hamburg,Germany) and fluorescein-coupled anti-rabbit IgG.
7. Vectashield to mount slides (Vector Laboratories, Burlingame, CA).
2.6. Enzyme-Linked Immunosorbent Assay for Ligand–Receptor Interactions
1. Coating buffer (HEPES buffer): 20 mM HEPES, 150 mM NaCl, 1 mM Mn2+,pH 7.4.
2. Blocking buffer: HEPES buffer supplemented with 3% BSA, pH 7.4.3. Washing buffer: HEPES buffer supplemented with 0.05% Tween-20.4. Binding buffer: HEPES buffer supplemented with 0.05% Tween-20 and 0.5% BSA
(see Note 3).5. Maxisorp plates (Greiner).6. Purified Mac-1, LFA-1 were provided by Dr. C. Gahmberg (Helsinki, Finland).
Soluble recombinant human JAM-C was produced as previously described (19).Purified recombinant intercellular adhesion molecule (ICAM)-1 was provided byDr. S. Bodary (Genentech, CA; see Note 4).
7. Primary antibodies: mouse monoclonal antibody (MAb) to human JAM-C, Gi11(9), and mouse MAb to human ICAM-1 (DAKO Cytomation). Secondary anti-body: peroxidase-conjugated antibody to mouse immunoglobulins (DAKOCytomation).
8. Substrate for quantification of bound secondary antibody: 2,2′-azino-bis-(3-ethyl-benzthiazoline-6-sulfonic acid) (ABTS; Boehringer Mannheim, Germany): ABTS-substrate solution: 0.022 g/mL in double-distilled (dd) H2O; ABTS-Buffer: 0.1 MNa-acetate, 0.05 M NaH2PO4, pH 5.5; Hydrogen peroxide solution: 30% H2O2
(w/w). Mix ABTS-substrate solution/ABTS–Buffer/Hydrogen peroxide solution4.76/95.17/0.07 (v/v/v), e.g., 0.75 mL of ABTS-substrate solution + 15 mL ofABTS-Buffer + 0.01 mL of hydrogen peroxide solution.
9. Microplate reader: BIO-TEK (Neufahrn, Germany).
2.7. THP-1 Cell Adhesion to Immobilized Soluble Human JAM-C
1. THP-1 cells were cultivated in RPMI supplemented with 10% FCS (Gibco,Bethesda, MD).
2. Coating buffer: 15 mM Na2CO3, 35 mM NaHCO3, pH 9.6.3. Blocking buffer: PBS supplemented with 3% BSA.4. Washing buffer: PBS.5. Adhesion buffer: Serum-free RPMI (see Note 5).6. Phorbol 12-myristate 13-acetate (PMA; Sigma) is dissolved at 1 mg/mL in
dimethyl sulfoxide and stored in single use aliquots at –80°C.7. Antibodies that were used in the adhesion assay: MAb IB4 against β2 integrin
subunit (CD18; Alexis, Gruenberg, Germany); MAb L15 against LFA-1 (kindlyprovided by Dr. C. Figdor, Nijmegen, The Netherlands); MAb LPM19c against
40 Chavakis and Orlova

Mac-1 (kindly provided by Dr. A. May, Munich, Germany); MAb 6S6 against β1integrin subunit (CD29) (Chemicon, Temecula, CA).
8. Soluble recombinant human JAM-C (see Subheading 2.6.).9. Ice-cold methanol-acetone 11 (v/v) for fixing cells.
10. Staining solution: 0.5% (w/v) Crystal violet (Sigma), 20% methanol, 80% dd H2O.11. Destaining solution: acetic acid/methanol/dd H2O (10/30/60, v/v/v).12. Tissue culture 96-well plates (Greiner).13. Microplate reader (BIO-TEK, Neufahrn, Germany).
2.8. THP-1 Cell Transendothelial Migration
1. 6.5-mm Transwells with a 8-µm pore size (Costar, Bodenheim, Germany).2. HUVECs cultivated in endothelial cell growth medium (PromoCell) supplemented
with growth factors and 5% FCS on 0.2% gelatin-precoated transwells.3. Monocyte chemoattractant protein (MCP)-1 (R&D Systems, Wiesbaden, Germany)
is dissolved at 10 µg/mL in PBS containing 0.1% BSA.4. Antibodies that were used in the adhesion assay: MAb LPM19c against Mac-1;
MAb L15 against LFA-1; MAb Gi18 against platelet endothelial cell adhesionmolecule-1 (PECAM-1) (kindly provided by Dr. S. Santoso, Giessen, Germany).
5. Soluble recombinant human JAM-C (see Subheading 2.6.).
3. Methods
3.1. Cell Culture and Lysis
1. Primary HUVECs were grown on gelatin-coated 100-mm dishes until confluence.When confluent, they were passaged with trypsin/EDTA to provide new cultureson 100-mm tissue dishes (for maintenance) or on eight-well chamber slides (forimmunofluorescence), or on transwell filters (for transmigration). For mainte-nance, cells were split 14 to approach confluence after 72 h (see Note 6).
2. Chinese hamster ovary (CHO) cells transfected with JAM-C (9) were grown on100-mm dishes in alpha-Minimal Essential Media media supplemented withzeocin 200 ng/mL. Cells were split 110 every 4 d with accutase treatment.
3. For each IP, approx 2 × 10⁷ JAM-C-transfected CHO cells were used. Cells werewashed twice with ice-cold PBS and 500 µL of NP-40 lysis buffer were added.After scraping, lysates were incubated for additional 30 min on ice and then pre-cleaned by centrifugation at 16,000g for 15 min at 4°C. The supernatant was trans-ferred in to a fresh vial and then processed for immunoprecipitation. A 100-µLaliquot was kept for further Western blot analysis and frozen at −20°C.
3.2. Immunoprecipitation
1. Extracts were precleaned by rotating at 4°C with Protein A/G (50 µL per 1 mL)for 30 min. After centrifugation, supernatants were transferred to a new tube.
2. MAb Gi11 against JAM-C or an irrelevant antibody (each at 4 µg/mL) was addedto the cell lysate. The lysate-antibody mixture was vortexed and incubated overnight with gentle rotation at 4°C.
Role of Junctional Adhesion Molecules 41
3. The next morning, 50 µL of UltraLink Protein A/G are added to the cell extractand incubated rotating for additional 2 h at 4°C.
4. The beads are then washed three times with NP-40 lysis buffer, resuspended in 60 µLof 2X sample buffer, and boiled for 5 min at 95°C. Thereafter, samples were sepa-rated by sodium dodecyl sulfate polyacrylamide gel electrophoresis (SDS-PAGE).
3.3. SDS-PAGE
1. For SDS-PAGE, we used Mini Protean II Gel System (Bio-Rad, Munich, Germany).Glass plates were rinsed with detergent and dried with paper towel before theprocedure.
2. A 1.5-mm thick 6% gel was prepared by mixing 3 mL of separation buffer (4X),2.4 mL acrylamide solution, 6.5 mL of water, 120 mL of APS solution, and 12 mLof TEMED. Pour 7.5 mL of the gel solution and overlay with 0.5 mL of water.After the gel is polymerized, remove water with Whatman paper. The stacking gelis prepared by mixing 1 mL of stacking buffer (4X), 0.4 mL of acrylamide, 2.56 mLof water, 100 mL of APS, and 9 mL of TEMED. Pour the gel and insert the comb.
3. Prepare 1X running buffer by mixing four parts of water with one part of the4X running buffer.
4. After the stacking gel is polymerized, remove the comb carefully and wash thewells with running buffer.
5. Add running buffer to the top and bottom chamber. Boil samples for 5 min at95°C and load into the wells.
6. Run gel at 100 V for 2.5 h.
3.4. Western Blotting
1. Transfer is performed using Mini Trans-Blot System (Bio-Rad).2. Prepare blotting buffer. Cut membrane and two pieces of blotting paper (they
should be larger than the gel). Soak membrane with water and than equilibratemembrane and blotting paper in blotting buffer for 15 min.
3. Assemble blotting sandwich on transfer cassette as follows: sponge prewetted inblotting buffer, then blotting paper, membrane, and the gel. There should be nobubbles between blotting paper, membrane, and the gel. Cover gel with anothersheet of blotting paper and sponge. Close transfer cassette and put it to the trans-fer tank filled with blotting buffer. Perform transfer for 3 h 100 mA at RT.
4. When transfer is finished, take out membrane and place it to the chamber withblocking buffer. Incubate membrane in blocking buffer for 1 h at RT with shak-ing and thereafter wash once with PBS-T20.
5. Add primary antibody against ZO-1, diluted 12500 in PBS-T20/1% BSA andincubate overnight at 4°C with shaking.
6. Discard antibody solution (see Note 7). Wash membrane three times for 5 mineach in PBS-T20.
7. Add freshly prepared secondary antibody diluted 110,000 in PBS-T20/1% BSAand incubate with shaking for 45 min at RT.
8. Wash membrane in PBS-T20 three times for 5 min each.
42 Chavakis and Orlova

9. Discard secondary antibody and place membranes on saran wrap protein side up.Prepare ECL reagent by mixing equal parts of detection reagent 1 with detectionreagent 2. Add ECL reagent to the membrane and incubate for 1 min. DiscardECL reagent and rinse membrane with 1X PBS. Then, cover membrane with newpiece of saran wrap, put to the X-ray cassette and expose to film (Fig. 1).
3.5. Immunofluorescence
1. HUVECs were passaged and 30,000 cells/well plated onto eight-well chamberslides that were precoated with 0.2% gelatin (2 h at 37°C) and were allowed toadhere and grow to confluence for 36–48 h at 37°C.
2. After washing the cells three times with PBS, the cells were fixed with ice-coldmethanol for 15 min.
3. Methanol is discarded, the cells are washed twice with PBS, and then blocked inantibody dilution buffer for 1 h at RT.
4. The blocking solution is removed and replaced with MAb Gi11 against JAM-C(10 µg/mL) and rabbit polyclonal antibody against ZO-1 (5 µg/mL) in antibodydilution buffer for 2 h at 22°C.
5. The primary antibody is removed and the samples washed three times for 2 mineach with PBS. Then, rhodamine-coupled anti-mouse IgG or fluorescein-coupledanti-rabbit IgG is added (each at 1100) for 1 h at 22°C.
Role of Junctional Adhesion Molecules 43
Fig. 1. Coimmunoprecipitation of JAM-C with ZO-1 in chinese hamster ovary (CHO)cells transfected with JAM-C. Detection of ZO-1 by Western blot in JAM-C transfectedCHO cell lysates (— indicates no immunoprecipitation) or in CHO-JAM-C cell lysatesthat were subjected to immunoprecipitation with MAb against JAM-C, as indicated.

6. The secondary antibody is removed, the cells are washed three times with PBS,and DAPI is added for 10 min at RT to stain the DNA and identify the nuclei.
7. The samples are then washed five times in PBS. The gasket is then removed fromthe chamber slide, and then mounting medium (Vectashield) and a cover slip areadded.
8. The slides are viewed and double-stained images are merged to analyze colocali-zation (Fig. 2).
3.6. Enzyme-Linked Immunosorbent Assayfor Ligand–Receptor Interactions
1. The buffers used are described in Subheading 2.6. 2. Maxisorp plates are coated with Mac-1, LFA-1, or BSA (5 µg/mL) dissolved in
coating buffer overnight at 4°C (see Note 8).3. Discard the integrins and BSA and wash the wells twice in washing buffer. Wells
are then blocked with blocking buffer for 1 h at RT. 4. The wells are then washed twice in washing buffer. Binding of soluble human
JAM-C (0–20 µg/mL) or soluble human intercellular adhesion molecule-1 to theimmobilized integrins or to BSA-coated wells is performed in a final volume of50 µL in binding buffer for 2 h at 22°C. In Fig. 3, binding of 10 µg/mL JAM-Cand 10 µg/mL ICAM-1 is shown.
5. After the incubation period the ligands are discarded and wells are washed threetimes in washing buffer. To detect bound JAM-C or ICAM-1, the appropriate
44 Chavakis and Orlova
Fig. 2. JAM-C localization at interendothelial borders and colocalization with ZO-1.Representative immunofluorescence of HUVECs showing JAM-C distribution (incuba-tion with MAb Gi11 followed by secondary rhodamine-coupled anti-mouse IgG)together with ZO-1 distribution (incubation with rabbit anti-ZO-1 followed by fluores-cein isothiocyanate-coupled anti-rabbit IgG). Double stained images were merged toanalyze colocalization of JAM-C with ZO-1. (Please see color insert following p. 50for a color version of this figure.)

primary antibodies (see Subheading 2.6.) in binding buffer are added to the wells(50 µL/well) at a dilution of 11000 for 2 h at 22°C.
6. After the incubation period, the primary antibodies are discarded and the wells arewashed three times in washing buffer. Then, the secondary antibody in bindingbuffer is added (50 µL/well) at a dilution of 12000 for 1 h at 22°C. The plateshould be kept in a dark place after addition of the secondary antibody.
7. The secondary antibody is discarded and wells are washed four times withwashing buffer.
8. Bound secondary antibody is quantified by using the substrate containing ABTS(see Subheading 2.6.; 150 µL/well). The plate should be kept in a dark place atRT and incubated for 5 to 120 min so that the change of color takes place.
9. The colorimetric reaction is quantified by measuring the absorbance at 405 nm inmicroplate reader. Nonspecific binding of JAM-C or ICAM-1 to BSA-coatedwells is used as blank and is subtracted to calculate specific binding of theseligands to the integrins (Fig. 3).
3.7. THP-1 Cell Adhesion to Immobilized Soluble Human JAM-C
1. The buffers used are described in Subheading 2.7.2. 96-well tissue culture plates are coated with JAM-C or BSA (each 10 µg/mL)
dissolved in coating buffer overnight at 4°C.3. Discard the JAM-C and BSA and wash the wells once with PBS. Wells are then
blocked with blocking buffer for 1 h at RT.4. During the 1-h incubation: THP-1 cells (cells grow in suspension) are collected
from the tissue culture plate and washed in serum-free RPMI medium. For thewashing, cells are centrifuged for 5 min at 1200 rpm, the pellet is resuspended in
Role of Junctional Adhesion Molecules 45
Fig. 3. Interaction between purified JAM-C and Mac-1 proteins. The binding ofJAM-C or ICAM-1 to immobilized Mac-1 (filled bars) or to immobilized LFA-1 (openbars) is presented. Binding of ICAM-1 or JAM-C to BSA was subtracted to obtainspecific binding to the integrins. Specific binding is expressed as absorbance at 405 nm.Data are mean + SD (n = 3) of a typical experiment.

10 mL serum-free RPMI (keep a small aliquot, e.g., 10 or 20 µL to measurecell number), and then cells are centrifuged once more for 5 min at 200g. Duringthis centrifugation step the cell number should be estimated (see Note 9). The cellsshould then be resuspended in serum-free RPMI at a density of 2 × 10⁶/mL.
5. After the 1-h incubation, the wells are washed twice in washing buffer. 50 µL ofserum-free RPMI is added to each well without or with 50 ng/mL PMA (see Notes5 and 10) and in the absence or presence of competitors (competitors are describedin Subheading 2.7.; see Note 11). Immediately thereafter, 50 µL of the THP-1cell solution should be added per well (i.e., 100,000 cells/well). Incubate cells at37°C for 40 to 60 min.
6. After the incubation period, the wells are washed twice with PBS, to remove non-adherent cells. Adhesion buffer or PBS should be aspirated at this washing step.
7. Adherent cells are then fixed with methanol aceton (11; 100 µL/well) at 4°C for30 min.
8. Discard methanol-aceton and stain adherent cells with staining solution (50 µL/well)for 30 min at RT.
9. Remove the staining solution and wash the plates in a bucket with tap water forseveral times. Let the plate dry. Add the destaining solution (100 µL/well) to thestained adherent cells. Wait for 5 min and then measure absorbance at 595 nm in amicroplate reader. Nonspecific adhesion of THP-1 cells to BSA-coated wells is usedas blank and is subtracted to calculate specific cell adhesion to JAM-C (see Note 12;Fig. 4A).
3.8. THP-1 Cell Transendothelial Migration
1. HUVECs are passaged and are plated on 0.2% gelatin-precoated 6.5-mm trans-wells with a 8-µm pore size in endothelial cell growth medium supplementedwith growth factors and 5% FCS at a density of 30,000 cells per well. At thisdensity the wells are confluent after 36–48 h incubation in a humidified atmos-phere (37°C, 5% CO2; see Note 13).
2. After this incubation period, chambers are examined microscopically for integrityand uniformity of endothelial monolayers. Monolayers are washed once with PBSand medium is switched to serum-free conditions (endothelial cell growth mediumwithout FCS). If needed, stimuli are added (e.g., tumor necrosis factor-α, 10 ng/mLfor 6 h at 37°C) to the endothelial cells, which will upregulate the expression ofadhesion molecules on HUVECs.
3. At the beginning of the transmigration assay, THP-1 cells are collected from thetissue culture plate and washed in serum-free RPMI medium. For the washing,cells are centrifuged for 5 min at 1200 rpm, the pellet is resuspended in 10 mLserum-free RPMI (keep a small aliquot, for example, 10 or 20 µL to measure cellnumber), and then cells are centrifuged once more for 5 min at 1200 rpm. Duringthis centrifugation step, the cell number should be estimated. The cells shouldthen be resuspended in serum-free RPMI at a density of 4 × 10⁶/mL.
4. The transwell filters (inserts) are removed from their wells and 600 µL migrationassay medium (serum-free RPMI in the absence or presence of 50 ng/mL MCP-1)
46 Chavakis and Orlova
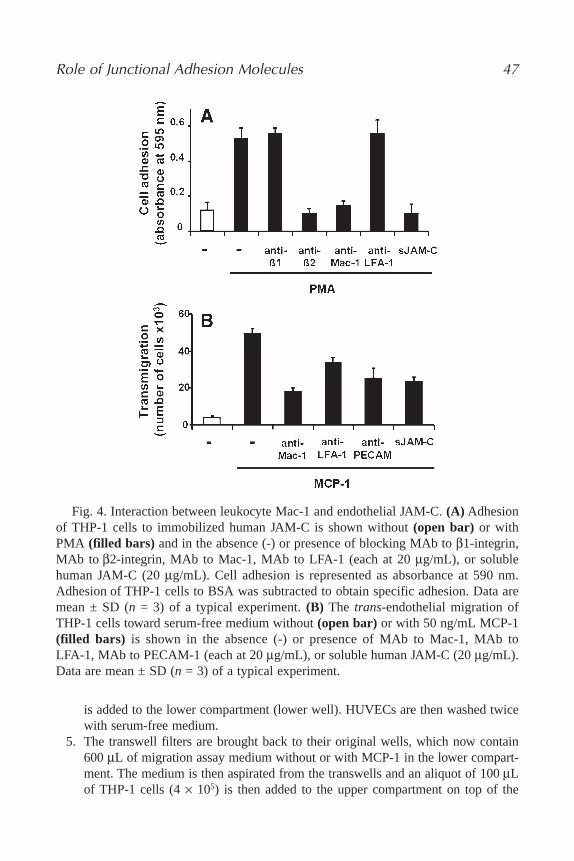
is added to the lower compartment (lower well). HUVECs are then washed twicewith serum-free medium.
5. The transwell filters are brought back to their original wells, which now contain600 µL of migration assay medium without or with MCP-1 in the lower compart-ment. The medium is then aspirated from the transwells and an aliquot of 100 µLof THP-1 cells (4 × 10⁵) is then added to the upper compartment on top of the
Role of Junctional Adhesion Molecules 47
Fig. 4. Interaction between leukocyte Mac-1 and endothelial JAM-C. (A) Adhesionof THP-1 cells to immobilized human JAM-C is shown without (open bar) or withPMA (filled bars) and in the absence (-) or presence of blocking MAb to β1-integrin,MAb to β2-integrin, MAb to Mac-1, MAb to LFA-1 (each at 20 µg/mL), or solublehuman JAM-C (20 µg/mL). Cell adhesion is represented as absorbance at 590 nm.Adhesion of THP-1 cells to BSA was subtracted to obtain specific adhesion. Data aremean ± SD (n = 3) of a typical experiment. (B) The trans-endothelial migration ofTHP-1 cells toward serum-free medium without (open bar) or with 50 ng/mL MCP-1(filled bars) is shown in the absence (-) or presence of MAb to Mac-1, MAb to LFA-1, MAb to PECAM-1 (each at 20 µg/mL), or soluble human JAM-C (20 µg/mL).Data are mean ± SD (n = 3) of a typical experiment.

endothelial monolayer. The competitors (different MAb or soluble proteins, asdescribed under 2.8.) are immediately added (see Note 11) to the transwell filters.
6. After incubation for 4 h at 37°C the transwell filters (inserts) are removed fromtheir wells to stop the experiment. The inserts are washed twice in PBS and fixedwith methanol/acetone (11), stained with crystal violet and mounted on glassslides in order to confirm the confluency of the endothelial monolayer of the fil-ters after the assay (for details on staining procedure please see Subheading 3.7.).
7. The number of transmigrated cells in the lower compartment is estimated bymeasuring cell number of an aliquot of the lower well with a cell counter (CASY-Counter, Schärfe-System, Reutlingen, Germany; see Note 12; Fig. 4B).
4. Notes1. Heat inactivation is performed by incubating FCS for 30 min at 56°C and there-
after serum is stored in single-use aliquots at –20°C. 2. Activated Na-ortovanadate solution is prepared by dissolving an appropriated
amount of reagent into ddH2O, adjusting pH to 10.0 and boiling for approx10 min (until it turns colorless). This procedure is repeated one more time and Na-ortovanadate is stored in 1-mL aliquots at –20°C.
3. To keep the immobilized integrins in an active conformation, the supplementationof 1 mM Mn2+ to the coating, washing, blocking and binding buffers is extremelyimportant. Without Mn2+ binding of integrins to their ligands will be very weak.
4. Recombinant ICAM-1 or ICAM-1-Fc chimera can also be commercially pur-chased (e.g., by R&D Systems).
5. In cell adhesion experiments instead of using serum-free RPMI, a buffer contain-ing 20 mM HEPES, pH 7.5; 140 mM NaCI; and 2 mg/mL glucose may be usedas the adhesion buffer. In this case, 1 mM MnCI should be used as the stimulusfor cell adhesion instead of PMA.
6. We recommend that early-passage HUVECs (up to fourth passage) are used.7. It is possible to reuse primary antibody for several times. For storage 0.02%
sodium azide should be added and solution might be kept at 4°C.8. When the interaction between β2-integrins and their ligands is investigated, it is
strongly recommended that the integrin is immobilized and the ligand is in solution.9. 10 or 20 µL of the cells should be diluted in 10 mL of NaCl and the number of cells
should be estimated in a cell counter. We use CASY-Counter (Schaerfe-System).Alternatively, the number of the cells can also be measured in a Neubauer chamber.
10. Besides PMA and MnCl, another way to specifically stimulate β2-integrin-dependent adhesion is by using stimulating mAb, such as Kim127 or Kim185(use at 20 µg/mL; kindly provided by Dr. M. Robinson, Slough Berkshire, UK).
11. In some cases an additional preincubation of the competitors with the THP-1 cellsis recommended rather than the single coincubation of the competitors during theadhesion or transmigration assay in order to obtain higher degrees of inhibition.This can be performed by preincubating the antibodies or soluble proteins withthe THP-1 cells for 30 min on ice. In this way the inhibitory antibodies such as theblocking MAb against Mac-1 (see Subheading 2.7.) or soluble JAM-C can already
48 Chavakis and Orlova

bind to and block Mac-1. When cell–cell adhesion, e.g., THP-1 cell adhesion toHUVECs or THP-1 transendothelial migration is assessed, such a preincubationcan be performed on both the THP-1 cells or the HUVECs as appropriate.
12. We have used the same protocols for adhesion and transmigration to test theHUVEC adhesion and transendothelial migration of freshly isolated neutrophilsfrom peripheral blood (19,20). The pattern observed was comparable to resultswith THP-1 cells.
13. It is very important that no medium is added to the lower compartment before thebeginning of the transmigration assay. In particular, serum-containing medium inthe lower compartment might prevent HUVECs from growing to confluence onthe transwell filter.
References1. Bazzoni, G. (2003) The JAM family of junctional adhesion molecules. Curr. Opin.
Cell. Biol. 15, 525–530.2. Ebnet, K., Suzuki, A., Ohno, A., and Vestweber, D. (2004) Junctional Adhesion
Molecules (JAMs): more molecules with dual functions? J. Cell. Sci. 117, 19–29.3. Keiper, T., Santoso, S., Nawroth, P. P., Orlova, V., and Chavakis, T. (2005) The role
of junctional adhesion molecules in cell–cell interactions. Histol. Histopathol. 20,197–203.
4. Kornecki, E., Walkowiak, B., Naik, U. P., and Ehrlich, Y. H. (1990) Activation ofhuman platelets by a stimulatory monoclonal antibody. J. Biol. Chem. 265,10,042–10,048.
5. Sobocka, M. B., Sobocki, T., Banerjee, P., et al. (2000) Cloning of the humanplatelet F11-receptor: a cell adhesion molecule member of the immunoglobulinsuperfamily involved in platelet aggregation. Blood 95, 2600–2609.
6. Palmeri, D., van Zante, A., Huang, C. C., Hemmerich, S., and Rosen, S. D. (2000)Vascular endothelial junction-associated molecule, a novel member of theimmunoglobulin superfamily, is localized to intercellular boundaries of endothelialcells. J. Biol. Chem. 275, 19,319–19,345.
7. Aurrand-Lions, M. A., Duncan, L., Ballestrem, C., and Imhof, B. A. (2001) JAM-2,a novel immunoglobulin superfamily molecule, expressed by endothelial andlymphatic cells. J. Biol. Chem. 276, 2733–2741.
8. Aurrand-Lions, M. A., Johnson-Leger, C., Wong, C., DuPasquier, L., and Imhof,B. A. (2001) Heterogeneity of endothelial junctions is reflected by differential andspecific subcellular localization of three JAM family members. Blood 98, 3699–3707.
9. Santoso, S., Sachs, U. J. H., Kroll, H., et al. (2002) The junctional adhesionmolecule 3 (JAM-3) on human platelets is a counterreceptor for the leukocyteintegrin Mac-1. J. Exp. Med. 196, 679–691.
10. Zen, K., Babbin, B. A., Liu, Y., Whelan, J. B., Nusrat, A., and Parkos, C. A. (2004)JAM-C is a component of desmosomes and a ligand for CD11b/CD18-mediatedneutrophil transepithelial migration. Mol. Biol. Cell. 15, 3926–3937.
11. Bazzoni, G., Martinez-Estrada, O. M., Orsenigo, F. M., Cordenonsi, M., Citi, S.,and Dejana, E. (2000). Interaction of junctional adhesion molecule with the
Role of Junctional Adhesion Molecules 49

tight junction components ZO-1, cingulin, and occludin. J. Biol. Chem. 275,20,520–20,526.
12. Ebnet, K., Schulz, C. U., Meyer Zu Brickwedde, M. K., Pendl, G. G., andVestweber, D. (2000) Junctional adhesion molecule interacts with the PDZdomain-containing proteins AF-6 and ZO-1. J. Biol. Chem. 275, 27,979–27,988.
13. Hamazaki, Y., Itoh, M., Sasaki, H., Furuse, M., and Tsukita, S. (2002) Multi-PDZdomain protein 1 (MUPP1) is concentrated at tight junctions through its possibleinteraction with claudin-1 and junctional adhesion molecule. J. Biol. Chem. 277,455–461.
14. Ebnet, K., Suzuki, A., Horikoshi, Y., et al. (2001) The cell polarity proteinASIP/PAR-3 directly associates with junctional adhesion molecule (JAM). EMBO J.20, 3738–3748.
15. Ebnet, K., Aurrand-Lions, M., Kuhn, A., et al. (2003) The junctional adhesionmolecule (JAM) family members JAM-2 and JAM-3 associate with the cell polar-ity protein PAR-3: A possible role for JAMs in endothelial cell polarity. J. Cell. Sci.116, 3879–3891.
16. Fanning, A. S., Jameson, B. J., Jesaitis, L. A., and Anderson, J. M. (1998) Thetight junction protein ZO-1 establishes a link between the transmembrane proteinoccludin and the actin cytoskeleton. J. Biol. Chem. 273, 29,745–29,753.
17. Ostermann, G., Weber, K. S., Zernecke, A., Schroeder, A., and Weber, C. (2002)JAM-1 is a ligand of the beta(2) integrin LFA-1 involved in transendothelial migra-tion of leukocytes. Nat. Immunol. 3, 151–158.
18. Cunningham, S. A., Rodriguez, J. M., Arrate, P. M., Tran, T. M., and Brock, T. A.(2002) JAM2 interacts with alpha4beta1. Facilitation by JAM3. J. Biol. Chem. 277,27,589–27,592.
19. Chavakis, T., Keiper, T., Matz-Westphal, R., et al. (2004) The junctional adhesionmolecule-C promotes neutrophil transendothelial migration in vitro and in vivo.J. Biol. Chem. 279, 55,602–55,608.
20. Chavakis, T., Athanasopoulos, A., Rhee, J. S., et al. (2005) Angiostatin is a novelanti-inflammatory factor by inhibiting leukocyte recruitment. Blood 105, 1036–1043.
50 Chavakis and Orlova

51
4
Cell–Cell Interactions on Solid Matrices
Nancy A. Louis, Dionne Daniels, and Sean P. Colgan
SummaryModels to study molecular, biochemical, and functional responses in vitro generally incorporate
an individual cell type or group of cells organized in a random fashion. Normal physiologicalresponses in vivo require that individual cell types be oriented in an organized fashion withthree-dimensional architecture and appropriately positioned cellular interfaces. Much recentprogress has been made in the development and implementation of models to study cell–cellcontact using substrate grown cells. Here, we summarize the use of membrane permeable sup-ports to study functional responses in appropriately positioned cell types. These models incorpo-rate two or more different cells cultured in physiologically positioned locales on solid substrates.Models incorporating nonadherent cells (e.g., leukocytes) in co-culture with such models also arediscussed. Such models have been used extensively to discovery both cell-bound as well assoluble mediators of physiological and pathophysiological processes.
Key Words: Cell–cell interactions; substrate; endothelia; epithelia; leukocyte; co-culture.
1. IntroductionIn intact tissues, matrix-bound cells must communicate not only with outside
environment but also with other cells in the local microenvironment. For example,mucosal epithelial cells provide a barrier that separates lumenal and vascularcompartments. This monolayer of cells provides barrier function and serves as aconduit for vectorial ion movement, the transport event responsible for mucosalhydration (1). By secreting solutes and transporting fluid across the epithelium,epithelia are able to coordinate compositional changes of the lumenal compart-ment. A number of stimuli, including hormones, neurotransmitters, and cytokines,have been shown to directly regulate both epithelial barrier function and iontransport (2).
In intact mucosal tissues, including the lung and intestine, epithelial cells areanatomically positioned in close proximity to a number of subepithelial cell
From: Methods in Molecular Biology, vol. 341: Cell−Cell Interactions: Methods and ProtocolsEdited by: S. P. Colgan © Humana Press Inc., Totowa, NJ

types, including lymphocytes, fibroblasts, smooth muscle cells, and endothelia.These subepithelial cell populations contribute to epithelial function throughparacrine pathways (3). Under these circumstances, for example, the vascularendothelium functions as more than a passive conduit for blood componentsand synthesizes many compounds that precisely regulate blood vessel tone,vascular composition, and leukocyte movement (4,5). Under such conditions,endothelial cells themselves respond to a variety of proinflammatory stimulithat, in turn, can release inflammatory mediators such as cytokines and bioactivelipids (4). The vital role of the endothelium in coordinating inflammation andthe proximity of the vasculature to the epithelium provides a potential paracrinecrosstalk pathway between these two cell types.
Here, we discuss the design and implementation of models to study interac-tions between two or more cell types on solid matrices. These culture modelsprovide ideal opportunities to identify paracrine mediators of physiological andpathophysiological importance and allow flexibility in the use of multiple func-tional responses. For the purposes of this chapter, we summarize models imple-menting mucosal epithelial cells as at least one component, but it should benoted that nearly any matrix-bound cell can be integrated into these models.
2. Materials2.1. Epithelial and Endothelial Cell Culture
1. T84 cells: 11 ratio of Dulbecco’s Modified Eagle’s Medium (Gibco/BRL,Bethesda, MD) and Hams F-112 Medium supplemented with 10% fetal bovineserum (Invitrogen, Carlsbad, CA), 15 mM HEPES buffer (pH 7.5; Sigma, St. Louis,MO), 14 mM Na HCO3 (Sigma), 40 mg/L penicillin (Sigma), 8 mg/L ampicillin(Sigma), and 9 mg/L streptomycin (Sigma).
2. Human microvascular endothelial cells (HMECs): Dulbecco’s Modified Eagle’sMedium supplemented with 10% fetal bovine serum; 15 mM HEPES buffer,pH 7.5; 14 mM Na HCO3; 40 mg/L penicillin; 8 mg/L ampicillin; 9 mg/L strep-tomycin; 10 ng/mL epidermal growth factor (Collaborative Biomedical Products,Bedford, MA); and 1 µg/mL hydrocortisone (Sigma).
3. Membrane permeable supports in various formats and pore sizes are availablefrom Corning-Costar (Cambridge, MA).
4. Endotoxin (List Biologicals, Campbell, CA).5. Forskolin (Sigma):10mMstocksolutionmade inDMSO(Sigma)andstoredat–20°C.6. Mineral oil (Sigma).7. Hank’s Buffered Salt Solution (HBSS) (Sigma) supplemented with 10 mM HEPES.8. Modified HBSS (without Ca2+ or Mg2+; Sigma) supplemented with 10 mM HEPES.9. Voltage clamp (Iowa Dual Voltage Clamps, Bioengineering, University of Iowa)
interfaced with an equilibrated pair of calomel electrodes and a pair of Ag–AgClelectrodes.
10. Evohm (World Precision Instruments Inc.).
52 Louis, Daniels, and Colgan

2.2. Neutrophil Transmigration
1. Histopaque 1077 (Sigma). 2. Gelatin (100 bloom, Fisher Scientific). 3. Ammonium chloride lysis buffer: mix 8.29 g of NH4Cl (Sigma), 1 g of NaCO3
(Sigma), and 0.038 g of EDTA (disodium salt, Sigma) in 1 L of distilled anddeionized water.
4. Acid citrate dextrose is prepared by mixing 13.7 g of citric acid (Sigma), 25 g ofsodium citrate (Sigma) and 20 g of dextrose (Sigma) in 1 L of distilled and deion-ized water.
5. Citrate buffer: titrate 1 M sodium citrate (Sigma) with 1 M citric acid (Sigma) tofinal pH of 4.2.
6. 2,2′-azino-bis-(3-ethylbenzothiazoline-6-sulfonic acid) (ABTS) reagent is madeby adding 50 mg ABT to 100 mM citrate buffer and a final concentration of0.03% H2O2 (Sigma).
7. N-formyl-methionyl-leucyl-phenylalanine (fMLP; Sigma) prepared as a 10 mMstock in dimethyl sulfoxide and stored at –20°C.
3. MethodsCell culture models on solid matrices have proven important in the model-
ing of normal biochemical and molecular signaling in vitro, which is particu-larly important for cells that grow as polarized monolayers (e.g., epithelialcells). This principle has been defined to test and implement a number ofcell–cell interaction models, including endothelial–epithelial interactions (3),fibroblast–epithelial interactions (6), neutrophil–epithelial interactions (7,8),mononuclear cell–epithelial interactions (9,10), and neutrophil interactions withresidual matrix proteins (11). Examples of each of these cultures, as well assample sets of data, are provided in this chapter.
3.1. Preparation of Epithelial–Endothelial Co-Cultures
1. T84 cells are trypsinized using standard methods of trypsin and EDTA solution(see Note 1).
2. T84 cells are washed in phosphate-buffered saline, diluted in media to a final con-centration of × 105/mL, and plated on the underside of polycarbonate inserts(termed inverts; see Notes 2 and 3), using no more that 82 µL of cell suspension.For these purposes, cells are carefully beaded onto the underside of the insert.Alternatively, cloning rings (6.5 mm diameter) can be glued to the underside ofsupports to provide a reservoir for plating cells.
3. After plating, inverts are carefully transferred to a tissue culture incubator, andincubated at 37°C for 12 to 18 h. Monolayers are re-oriented (Fig. 1A) into T84cell media.
4. HMECs are trypsinized using standard methods of trypsin and EDTA solution.
Solid Matrices Cell–Cell Interactions 53
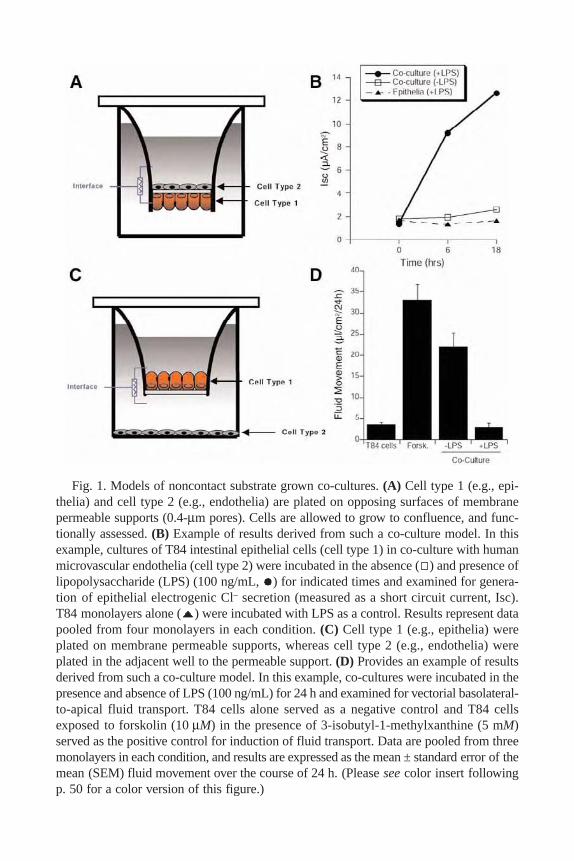
Fig. 1. Models of noncontact substrate grown co-cultures. (A) Cell type 1 (e.g., epi-thelia) and cell type 2 (e.g., endothelia) are plated on opposing surfaces of membranepermeable supports (0.4-µm pores). Cells are allowed to grow to confluence, and func-tionally assessed. (B) Example of results derived from such a co-culture model. In thisexample, cultures of T84 intestinal epithelial cells (cell type 1) in co-culture with humanmicrovascular endothelia (cell type 2) were incubated in the absence ( ) and presence oflipopolysaccharide (LPS) (100 ng/mL, ) for indicated times and examined for genera-tion of epithelial electrogenic Cl– secretion (measured as a short circuit current, Isc).T84 monolayers alone ( ) were incubated with LPS as a control. Results represent datapooled from four monolayers in each condition. (C) Cell type 1 (e.g., epithelia) wereplated on membrane permeable supports, whereas cell type 2 (e.g., endothelia) wereplated in the adjacent well to the permeable support. (D) Provides an example of resultsderived from such a co-culture model. In this example, co-cultures were incubated in thepresence and absence of LPS (100 ng/mL) for 24 h and examined for vectorial basolateral-to-apical fluid transport. T84 cells alone served as a negative control and T84 cellsexposed to forskolin (10 µM) in the presence of 3-isobutyl-1-methylxanthine (5 mM)served as the positive control for induction of fluid transport. Data are pooled from threemonolayers in each condition, and results are expressed as the mean ± standard error of themean (SEM) fluid movement over the course of 24 h. (Please see color insert followingp. 50 for a color version of this figure.)
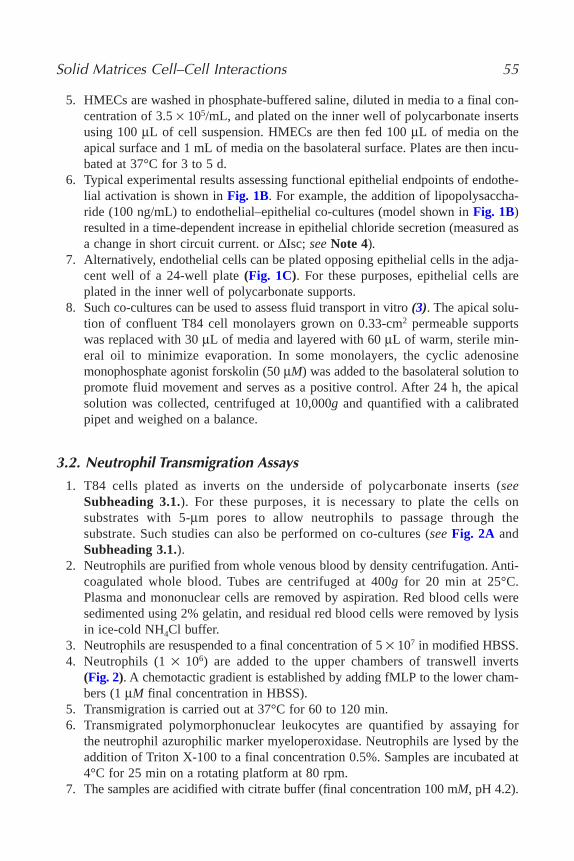
Solid Matrices Cell–Cell Interactions 55
5. HMECs are washed in phosphate-buffered saline, diluted in media to a final con-centration of 3.5 × 10⁵/mL, and plated on the inner well of polycarbonate insertsusing 100 µL of cell suspension. HMECs are then fed 100 µL of media on theapical surface and 1 mL of media on the basolateral surface. Plates are then incu-bated at 37°C for 3 to 5 d.
6. Typical experimental results assessing functional epithelial endpoints of endothe-lial activation is shown in Fig. 1B. For example, the addition of lipopolysaccha-ride (100 ng/mL) to endothelial–epithelial co-cultures (model shown in Fig. 1B)resulted in a time-dependent increase in epithelial chloride secretion (measured asa change in short circuit current. or ∆Isc; see Note 4).
7. Alternatively, endothelial cells can be plated opposing epithelial cells in the adja-cent well of a 24-well plate (Fig. 1C). For these purposes, epithelial cells areplated in the inner well of polycarbonate supports.
8. Such co-cultures can be used to assess fluid transport in vitro (3). The apical solu-tion of confluent T84 cell monolayers grown on 0.33-cm2 permeable supportswas replaced with 30 µL of media and layered with 60 µL of warm, sterile min-eral oil to minimize evaporation. In some monolayers, the cyclic adenosinemonophosphate agonist forskolin (50 µM) was added to the basolateral solution topromote fluid movement and serves as a positive control. After 24 h, the apicalsolution was collected, centrifuged at 10,000g and quantified with a calibratedpipet and weighed on a balance.
3.2. Neutrophil Transmigration Assays
1. T84 cells plated as inverts on the underside of polycarbonate inserts (seeSubheading 3.1.). For these purposes, it is necessary to plate the cells onsubstrates with 5-µm pores to allow neutrophils to passage through thesubstrate. Such studies can also be performed on co-cultures (see Fig. 2A andSubheading 3.1.).
2. Neutrophils are purified from whole venous blood by density centrifugation. Anti-coagulated whole blood. Tubes are centrifuged at 400g for 20 min at 25°C.Plasma and mononuclear cells are removed by aspiration. Red blood cells weresedimented using 2% gelatin, and residual red blood cells were removed by lysisin ice-cold NH4Cl buffer.
3. Neutrophils are resuspended to a final concentration of 5 × 10⁷ in modified HBSS. 4. Neutrophils (1 × 10⁶) are added to the upper chambers of transwell inverts
(Fig. 2). A chemotactic gradient is established by adding fMLP to the lower cham-bers (1 µM final concentration in HBSS).
5. Transmigration is carried out at 37°C for 60 to 120 min. 6. Transmigrated polymorphonuclear leukocytes are quantified by assaying for
the neutrophil azurophilic marker myeloperoxidase. Neutrophils are lysed by theaddition of Triton X-100 to a final concentration 0.5%. Samples are incubated at4°C for 25 min on a rotating platform at 80 rpm.
7. The samples are acidified with citrate buffer (final concentration 100 mM, pH 4.2).

Fig. 2. Models of contact substrate grown co-cultures. (A) Cell type 1 (e.g., epi-thelia) and cell type 2 (e.g., endothelia) are plated on opposing surfaces of membranepermeable supports (5 µm pores). Cells are allowed to grow to confluence, and function-ally was assessed as a substrate for migration of human neutrophils (cell type 3). (B) Anexample of results derived from such a model. In this example, cultures of T84 intesti-nal epithelial cells (cell type 1) in co-culture with human microvascular endothelia (celltype 2) were washed, and a gradient of indicated concentrations of the neutrophilchemoattractant fMLP was placed in the lower chamber. Purified human neutrophils(1 × 10⁶) were placed added to the inner well and transmigration over the courseof 90 min was determined by quantification of the detergent extractable neutrophilmarker myeloperoxidase. Data are pooled from three monolayers in each condition, andresults are expressed as the mean ± SEM number of transmigrated neutrophils. (C) Celltype 1 (e.g., epithelia) were plated on membrane permeable supports (0.4 µm) in directco-culture with cell type 2 (e.g., mononuclear cells). (D) An example of results derivedfrom such a co-culture model. In this example, co-cultures of T84 epithelial cells andhuman mononuclear cells were plated at indicated mononuclear cell:epithelial ratios(where control condition is epithelia alone and beads condition represents three latexbeads per epithelial cell). Co-cultures were grown for 6 d and assessed for barrier func-tion by measurement of transepithelial resistance. Data are pooled from three monolay-ers in each condition and results are expressed as the mean ± standard error of the mean(SEM) transepithelial resistance (ohm · cm2). (Please see color insert following p. 50for a color version of this figure.)

8. An aliquot of sample (70 µL) is added to an equal volume of ABTS solution in a96-well plate. The resulting absorbance is determined on a plate reader at 405 nm.
9. Typical results of a transmigration are shown in Fig. 2B.
3.3. Preparation of Epithelial–Mononuclear Cell Co-Cultures
1. Mononuclear cells are isolated from the interface of density gradients (seeSubheading 3.2.) and quantified by counting on a hemocytometer.
2. T84 cells are trypsinized using standard methods of trypsin and EDTA solution. 3. After trypsinization, epithelial cells are mixed with mononuclear cells in various
ratios; for example, 0.3 mononuclear cells per epithelial cell (0.31), 1 mononu-clear cell per epithelial cell (11), and 3 mononuclear cells per epithelial cell(31; Fig. 2C). Latex beads (11.9 ± 1.9 µm diameter, neutral charge, Seradyn Inc.,Indianapolis, IN) were mixed with epithelial cells at the time of plating (threebeads per epithelial cell).
4. Epithelial/mononuclear cell mixtures are plated on 0.33-cm2 ring supported poly-carbonate filters (0.4-µm pore size).
5. Co-cultures are grown in T84 cell media to which human recombinant interleukin-2is added at a final concentration of 2 nM. These epithelial–lymphocyte co-cultures areused 6 to 10 d after plating.
6. Typical experimental results assessing functional epithelial endpoints (e.g., barrierfunction) are shown in Fig. 2D.
3.4. Preparation of Residual Matrix Cultures
1. Endothelial or epithelial cultures are established on 0.33-cm2 ring-supported poly-carbonate filters (5-µm pore size; see Subheading 3.1.).
2. Removal of cells from the polycarbonate filters is accomplished by incubation in5 mM EDTA in modified HBSS at 37°C (see Note 5).
3. Filters are vigorously washed in HBSS and used to assess migration of neutrophils(see Subheading 3.2.).
4. Typical experimental results comparing neutrophil transendothelial and transma-trix migration are shown in Fig. 3B.
4. Notes1. Trypsinizing T84 cells can take anywhere between 5 and 20 min. Trypsin–EDTA
becomes less active with repeated freeze–thaw cycles. To reduce the time it takesto trypsinize T84 cells, use trypsin that has been aliquoted to avoid repeatedfreeze–thaw cycles.
2. Generally, cells grow better if the inserts are collagen coated the night before plat-ing. The surfaces are coated with 50 to 150 µL (depending on the diameter ofthe surface) of type IV collagen and allowed to dry for 12 to 18 h in the hoodunder ultraviolet light. The type IV collagen is dissolved in 0.2% acetic acid andthen diluted in 60% EtOH. Dissolving the collagen can take up to 3 d. Allow theinserts to air dry, and plate cells directly over the collagen coating. No washing isnecessary.
Solid Matrices Cell–Cell Interactions 57

58 Louis, Daniels, and Colgan
Fig. 3. Models of residual matrix co-cultures. (A) Cells (e.g., endothelia) are platedon membrane permeable supports (5-µm pores) and allowed to grow to confluence.Cells are then removed by vigorous washing in EDTA (2 mM), resulting in residualmatrix proteins attached to the membrane support. (B) An example of results derivedfrom such a model. In this example, neutrophils were pre-exposed to indicated con-centrations of the phosphoinositide-3-kinase inhibitor wortmannin and assessed forfMLP (10−8M)-stimulated transmigration across confluent endothelia ( ) or acrossmatrix-coated substrates ( ). Transmigrated neutrophils were quantified by determi-nation of myeloperoxidase content after termination of the assay. Data are derivedfrom four monolayers in each condition with results expressed as mean ± standarderror of the mean (SEM) number transmigrating neutrophils.
3. Individual inserts are kept sterile and flipped upside down into a large Petri dish. 4. To measure agonist-stimulated short circuit currents (Isc), transepithelial potentials
and resistance, a commercially available voltage clamp (Iowa Dual VoltageClamps, Bioengineering, University of Iowa) interfaced with an equilibrated pairof calomel electrodes and a pair of Ag-AgCl electrodes is utilized, as described indetail elsewhere (12). Using these values and Ohm’s law, transepithelial resis-tance and transepithelial current were calculated. Fluid resistance within thesystem accounts for less than 5% of total transepithelial resistance. HBSS wasused in both apical and basolateral baths during all experiments, unless otherwisenoted. Cl– secretory responses are expressed as a change in short circuit current(∆Isc) necessary to maintain zero potential difference across the monolayer.
5. An alternative method for generating a general matrix has also been used (11).Acellular, matrix-coated permeable support substrates can be generated as follows:bare polycarbonate permeable supports (Corning-Costar, Cambridge, MA, 5-µmpore size) are precoated for 30 min with 50 µL of 0.1% gelatin (derived fromporcine skin, 175 Bloom, Attachment Factor, Cascade Biologics, Portland, OR)followed by the addition of media (containing 10% newborn calf serum, Gibco,

Grand Island, NY) for an additional 30 min. Inserts are rinsed in HBBS andpolymorphonuclear leukocyte transmigration assessed using similar conditions asdescribed in Subheading 3.2.
Acknowledgments This work was supported by National Institutes of Health grants DK50189
and HL60569 (to S. P. C.) and by DK62007 (to N. A. L.).
References1. Barrett, K. E. and Keely, S. J. (2000) Chloride secretion by the intestinal epithe-
lium: molecular basis and regulatory aspects. Annu. Rev. Physiol. 62, 535–572.2. Colgan, S. P., Furuta, G. T., and Taylor, C. T. Cytokines and epithelial function, in
Microbial Pathogeneis and the Intestinal Epithelial Cell (Hecht, G., ed.), ASMPress, Washington, DC, pp. 61–78.
3. Blume, E. D., Taylor, C. T., Lennon, P. F., Stahl, G. L., and Colgan, S. P. (1998)Activated endothelial cells elicit paracrine induction of epithelial chloride secre-tion: 6-keto-PGF1α is an epithelial secretagogue. J. Clin. Invest. 102, 1161–1172.
4. Pober, J. S. and Cotran, R. S. (1990) Overview: the role of endothelial cells ininflammation. Transplantation 50, 537–541.
5. Vane, J. R., Anggard, E. E., and Botting, R. M. (1990) Regulatory functions ofthe vascular endothelium. N. Eng. J. Med. 323, 27–36.
6. Berschneider, H. M. and Powell, D. W. (1992) Fibroblasts modulate intestinalsecretory responses to inflammatory mediators. J. Clin. Invest. 89, 484–489.
7. Parkos, C. A., Colgan, S. P., Delp, C., Arnaout, M. A., and Madara, J. L. (1992)Neutrophil migration across a cultured epithelial monolayer elicits a biphasic resis-tance response representing sequential effects on transcellular and paracellularpathways. J. Cell. Biol. 117, 757–764.
8. Parkos, C. A., Delp, C., Arnaout, M. A., and Madara, J. L. (1991) Neutrophil migra-tion across a cultured intestinal epithelium: dependence on a CD11b/CD18-mediated event and enhanced efficiency in the physiologic direction. J. Clin. Invest. 88, 1605–1612.
9. Kaoutzani, P., Colgan, S. P., Cepek, K. L., et al. (1994) Reconstitution of culturedintestinal epithelial monolayers with a mucosal-derived T lymphocyte cell line:Modulation of epithelial phenotype dependent on lymphocyte-basolateral mem-brane apposition. J. Clin. Invest. 94, 788–796.
10. McKay, D. M. and Singh, P. K. (1997) Superantigen activation of immune cellsevokes epithelial (T84) transport and barrier abnormalities via, I. F.N-gamma and,T. N.F-alpha: inhibition of increased permeability, but not diminished secretoryresponses by TGF-beta2. J. Immunol. 159, 2382–2390.
11. Bruyninckx, W. J., Comerford, K. M., Lawrence, D. W., and Colgan, S. P. (2001)Phosphoinositide 3-kinase modulation of beta(3)-integrin represents an endogenous“braking” mechanism during neutrophil transmatrix migration. Blood 97, 3251–3258.
12. Dharmsathaphorn, K. and Madara, J. L. (1990) Established intestinal cell lines asmodel systems for electrolyte transport studies. Methods Enzymol. 192, 354–389.
Solid Matrices Cell–Cell Interactions 59


61
From: Methods in Molecular Biology, vol. 341: Cell−Cell Interactions: Methods and ProtocolsEdited by: S. P. Colgan © Humana Press Inc., Totowa, NJ
5
Cell–Cell Interactions in the Kidney
Inducible Expression of Mutant G Protein α-Subunits in Madin–Darby Canine Kidney Cells for Studies of Epithelial Cell Junction Structure and Function
Ernesto Sabath and Bradley M. Denker
SummaryDisrupted epithelial cell junctions are a hallmark of numerous disease processes. The
signaling mechanisms regulating barrier function and re-establishment of intact junctions afterinjury and during development are complex and tightly regulated. We have shown thatheterotrimeric G proteins regulate assembly and maintenance of epithelial cell barrier in cul-tured Madin–Darby canine kidney (MDCK) cells. The inducible expression of mutant signalingmolecules (constitutively active or dominant negative) in polarized cells is a useful strategy forelucidating the role(s) for specific proteins. Using tetracycline-off inducible expression of wild-type and constitutively active Gα12, we have demonstrated a fundamental role for Gα12 inregulating the junction of MDCK cells. Inducible expression permits the comparison of the iden-tical cell line in the presence and absence of the protein of interest and minimizes variation aris-ing from distinct clones. The methods described here are applicable to virtually any protein thatmay regulate maintenance or assembly of the epithelial cell junctional complex.
Key Words: G proteins; Madin–Darby canine kidney cells; tight junctions; signaling; epithelialcells; kidney; ZO-1.
1. IntroductionG proteins (guanine nucleotide binding proteins) are molecular switches relay-
ing information from upstream molecules (receptor or equivalent) to downstreamtargets (effectors). The fundamental “switch” in these proteins occurs after anupstream interaction (i.e., receptor) induces a change in conformation, resultingin the dissociation of bound guanosine diphosphate (GDP). Guanosine triphos-phate (GTP) normally is present in cells at higher concentrations than GDP, and

GTP binds to the G protein. The G protein remains activated and capable ofdownstream interactions until the intrinsic GTPase activity hydrolyzesbound GTP to GDP (reviewed in refs. 1 and 2). There are two broad families ofG proteins: monomeric (single subunit) GTPases of the Ras Superfamily, andheterotrimeric (composed of Gα GTPase and Gβγ). Both families of G proteinsregulate epithelial cell junctions (3,4). Regulating these signaling pathways holdspromise for novel therapies to prevent or treat disorders resulting in disruption ofjunctional integrity. Madin–Darby canine kidney (MDCK) cells (derived fromcanine kidney, distal tubule, or collecting duct) are used widely for studies ofepithelial cell polarity and cell junctions. MDCK cells have proven to be a usefulmodel for studies of tight junction assembly through the “calcium switch” (5).When cultured in low calcium (µM), cells lose polarity, junctional proteinsbecome intracellular, and monolayer integrity is lost. With switching to normalcalcium medium (“calcium switch”), there is coordinated assembly of the tightjunctions thought to recapitulate fundamental processes involved in junctionalbiogenesis during development and after injury (6). Synchronized tight junctionassembly without new protein synthesis allows the process to be studied bio-chemically. Functionally, the integrity of the barrier is monitored through themeasurement of transepithelial resistance (TER) at specific time points during theswitch process. Recently, this model has been modified to permit the effects ofan induced protein on the development of the epithelial barrier to be studied. Anexample of an inducible system that will be described in detail in this chapter isthe “doxycycline switch.” In the most common MDCK cell system (tetracycline-off [Tet-off]), the removal of doxycycline (dox) induces protein expression,permitting the effects of the transfected protein on the cell to be studied. We haveused this methodology to elucidate the role of the Gα12-subunit on the epithe-lial cell barrier (7,8).
2. Materials2.1. Plasmids and DNA Preparation
1. pTRE (Clontech, Palo Alto, CA).2. Complimentary DNA (cDNA) of interest and control.3. Restriction enzymes.4. Gel extraction kit (QIAquick; Qiagen, Valencia, CA).5. Calf intestinal alkaline phosphatase (New England Biolabs, Beverly, MA). 6. T4 DNA Ligase 400,000 U/mL (New England Biolabs).7. DH5α competent cells (Invitrogen, Carlsbad, CA).8. Luria-Bertani (LB) broth powder (Sigma, St. Louis, MO).9. Bacteriological agar (Sigma).
10. Ampicillin sodium salt powder (Sigma).
62 Sabath and Denker

11. Petri dishes 100 mm (BD Falcon).12. Qiagen Plasmid Mini or Midi-Kit (Qiagen).
2.2. Cell Culture
1. MDCK type II cells stably expressing the tetracycline (Tc)-controlled transactiva-tor for use in the Tet-off gene expression system (Clontech, Palo Alto, CA).
2. Dulbecco’s Modified Eagle’s Medium (500 mL) with 4.5 g/L glucose and L-glutamine (Cellgro, Herndon, VA).
3. Fetal bovine serum Tet System Approved (Clontech). Heat inactivate at 55°C for30 min. Use at 5% (25 mL) final concentration.
4. Solution of 10,000 U/mL penicillin G sodium and 10,000 µg/mL streptomycinsulfate (Gibco-BRL, Carlsbad, CA). Add 5 mL of stock solution to medium.
5. G418 Powder, 1 g (Cellgro, Herndon, VA). Prepare stock solution at a concentra-tion of 50 mg/mL. Add 1 mL to 500 mL of medium.
6. Hygromycin B from Streptomyces hygroscopicus. Stock solution (50 mg/mL;Roche Diagnostics, Mannheim, Germany.) Add 1 mL to medium.
7. Dox (Sigma) or Tc (see Note 1). Store in aliquots (concentration 1 mg/mL) at −20°C, store in the dark and protect from light with foil. Add 20 µL for a final con-centration of 40 ng/mL.
8. Phosphate-buffered saline (PBS) tablets (Sigma). To prepare 1X solution, dissolveone tablet/200 mL H2O and sterilize.
9. Trypsin 0.25% and EDTA (Sigma).10. Tissue culture microscope.
2.3. Stable Transfection and Selection of Antibiotic-Resistant Clones
1. Lipofectamine 2000 1 mL (Invitrogen).2. OptiMEM I Reduced Serum Medium for transfections (Gibco, Carlsbad, CA).3. pTRE Vector-Gene X.4. pTK-Hyg (see Note 2; Clontech).5. Cloning cylinders (Scienceware, Pequannock, NJ). An alternative is to cut 200-µL
pipet tips approx 0.5 cm from wide end and autoclave. 6. High vacuum grease (Dow Corning, Fisher Scientific). Autoclave.7. Tissue culture plates 24-, 12-, and 6-well plates, and 60-mm plates (BD Falcon).
2.4. Sodium Dodecyl Sulfate-Polyacrylamide Gel Electrophoresis
1. Stacking buffer (4X): Tris-HCl 0.5 M, pH 6.8, 0.4% sodium dodecyl sulfate (SDS).2. Separating buffer (4X): Tris-HCl 1.5 M, pH 8.8, 0.4% SDS.3. 30% Acrylamide Solution (Caution: When acrylamide is unpolymerized, it is a
neurotoxin that may be harmful if inhaled, swallowed, or exposed directly to skin).4. TEMED (Sigma).5. Ammonium persulfate (APS). Prepare 10% solution in water and store at −20ºC
(Sigma).6. Isobutanol, water saturated.
Cell–Cell Interactions in the Kidney 63

7. Electrode (running) buffer (10X): 0.25 M Tris-HCl, 1.9 M glycine; add SDS 0.1%before use.
8. Sample buffer (3X): 187.5 mM Tris-HCl, pH 6.8, 6% SDS, 30% glycerol, 0.003%bromophenol blue. Add β-mercaptoethanol 5% before use.
9. Prestained molecular weight markers (Bio-Rad, Hercules, CA).
2.5. Cell Lysis
1. PBS (see Subheading 2.2., item 8).2. Tissue Buffer: 10 mM Na–HEPES, pH 7.5, 1% NP-40, 0.25% Na–deoxycholate,
0.1% SDS, 150 mM NaCl, 1 mM EDTA, 1 mM phenylmethyl sulfonyl fluoride,protease inhibitor cocktail (Complete, Roche. One tablet in 1 mL of water makesa solution 50X); Na3VO4 (tyrosine-phosphatase inhibitor) 1 mM; NaF (serine-phosphatase inhibitor) 25 mM; and 1-mL tuberculin syringe with 27-gage needle.
3. Tabletop centrifuge in a cold room at 4°C.4. Liquid nitrogen (see Note 3).5. Water bath at 37°C.
2.6. Western Blot
1. Electrophoretic transfer cell (Bio-Rad).2. Nitrocellulose Pure Transfer Membranes (GE Osmonics Labstore, Minnetonka, MN).3. Transfer buffer (glycine 39 mM, Tris-base 48 mM, SDS 0.04%, methanol 20%).4. Filter paper, Whatmann 3MM (Fisherbrand).5. GB003 thick 0.8 filter paper (Schleicher & Schuell BioScience, Keene, NH).6. Ponceau-S Solution (Sigma).7. Tris-buffer saline with Tween-20 (TBST): 20 mM Tris-HCl, pH 7.6, 137 mM
NaCl, 0.05% Tween-20.8. Blocking-buffer: TBST containing 5% dry milk or 2% albumin powder.9. Enhanced chemiluminescent reagents (Pierce, Rockford, IL).
10. Rabbit Gα12 antibody (Santa Cruz Biotechnologies, Santa Cruz, CA).11. Goat anti-rabbit IgG, secondary antibody (Santa Cruz Biotechnologies).
2.7. TER Measurements
1. Polycarbonate filters (Transwell, Costar, Acton, MA): tissue culture-treated, 12-mmdiameter, and 0.4-µm pore size.
2. MDCK II cells (stably transfected).3. Millipore ERS Electrical Resistance System (Millipore, Billerica, MA).4. Dulbecco’s Modified Eagle’s Medium with additives.
3. MethodsThe Tet systems permit gene expression to be tightly regulated in response to
varying concentrations of Tc or dox. In the Tet-off system, gene expression isturned on when Tc or dox is removed from the culture medium. In contrast,expression is turned on in the Tet-on system by the addition of dox (see Note 1
64 Sabath and Denker

and Figs. 1 and 2). Background or leaky expression of Protein X in the absenceof induction is low with pTRE; however, it is important to add fresh dox every2 d (see Note 4). A major advantage of this system is the comparison of thesame clone in conditions ± dox (without or with gene X expression). In additionto ± gene X expression, it is also recommended to prepare a parallel transfectionwith a control gene. For example, in our analysis of Gα12, two different celllines were established; one expressing the constitutively activated QLα12 geneand another expressing the wild-type protein (see Figs. 1 and 2).
Cell–Cell Interactions in the Kidney 65
Fig. 1. Gα12 Western blot of inducible Gα12 expression in MDCK cells. Approx-imately 50 µg of cell lysates were analyzed by SDS-PAGE and Western blot asdescribed. Monolayers were maintained in +dox for several days before switching to−dox for the indicated times. There is a small amount of endogenous Gα12 visible inthe +dox lysates that is also seen in Tet-off MDCK cells (not shown). Both wild-typeand activated (QL) α12 are rapidly induced with dox removal. The readdition of doxfor 48 h (QLα12) demonstrates complete resuppression of protein expression.
Fig. 2. QLα12 expression results in loss of barrier function. TER was monitoreddaily for 10 d in wild-type and QLα12-MDCK cells ± dox. The rectangles denote thetime interval during which dox was removed. In wild-type Gα12-MDCK cells, therewas little change in TER during the 10-d period regardless of Gα12 expression. WithQLα12 expression, there was a significant decrease in TER correlating with QLα12expression, and the effect on TER was completely reversible with readdition of dox.

3.1. Creating the Gene-Specific Expression Vector
1. Transform each of the plasmids into a DH5α Escherichia coli (or equivalent) toensure a renewable source of DNA.
2. Linearize pTRE Tet-vector using the appropriate restriction enzymes contained inthe multicloning site. Cut your X-gene cDNA with the same restriction enzymes.
3. Run an agarose gel, check the digestion of the plasmids, and excise the bands cor-responding at the Tet-vector and X-gene cDNA with a new razor blade; avoid longexposure to the ultraviolet light because it can crosslink the DNA (see Note 5).Take a picture from the remaining gel to be sure that no DNA remains.
4. Purify the DNA using a gel-extraction kit or a polymerase chain reaction-purification kit.
5. Add calf intestinal alkaline phosphatase to the pTRE vector for 1 h at 37°C todecrease the probability for self-ligation.
6. To perform ligation, use a ratio of pTRE:X gene cDNA of 13, add 10X ligasebuffer (see Note 6), 1 µL of T4 Ligase, and water (to complete 10–15µL/reac-tion). Incubate for 1 h at room temperature. For blunt-end ligation, incubate for16 h at 16°C (see Note 7).
7. Perform transformation in DH5α cells.8. Purify DNA from bacteria with Miniprep kit according to the manufacturer’s
instructions.9. Corroborate your ligation product by restriction analysis and/or sequencing.
10. Produce 50–100 µg of DNA using the Midiprep kit according to manufacturer’sinstructions.
3.2. Cell Culture
1. Culture the MDCK II cells in Dulbecco’s Modified Eagle’s Medium with 4.5 g/Lglucose and L-glutamine. Add fetal calf serum 5%, penicillin–streptomycin (5 mL),and G418 (1 mL) to the medium.
2. Grow the cells at 37°C in a humidified chamber with 5% CO2. Split (trypsinize)the cells when 90 to 100% confluent. Remove the Dulbecco’s medium, washtwice with PBS (prewarmed to 37°C), add trypsin–EDTA (2 mL/10 cm plate).Incubate at 37°C for 5 to 15 min. Check under microscope for detachment ofcells. Add Dulbecco’s Medium (8 mL) to quench the trypsin and split into newplates at 15–10 (see Note 8).
3.3. Preparing Frozen Stocks
1. Trypsinize the desired number of plates or flasks.2. Centrifuge cells at 100g for 3 to 5 min and aspirate the supernatant.3. Resuspend the pellet in freezing medium. We resuspend cells from a confluent
10-cm plate in 1 mL and divide into 2 × 0.5 mL aliquots for long-term storage.Freezing medium can be purchased from Sigma (cat. no. C6164) or cells can befrozen in 90% fetal bovine serum and 10% dimethyl sulfoxide.
4. Dispense 0.5-1-mL aliquots into sterile cryovials.
66 Sabath and Denker

5. Freeze gradually. Start with −20°C for 1 to 2 h. Transfer to −80°C overnight andthen store in liquid nitrogen.
3.4. Titrating Antibiotics (Kill Curve)
Before using hygromycin or puromycin to establish your stable cell lines, itis recommended to titrate the selection agent to determine the optimal concen-tration for selection.
1. Plate cells at normal dilutions (usually 1:10) in a six-well plate. Allow them toattach for 24 h, then add complete medium plus varying amounts (0, 50, 100,200, 400, 800 µg/mL) of hygromycin.
2. Incubate the cells for 10 to 14 d, replacing the selective medium every 2 to 3 d.Examine the dishes for viable cells every 2 d.
3. For selecting stable transformants, use the lowest concentration that demonstratessignificant cell death at approx 5 d and 100% mortality at 10 to 14 d. For Tet-offMDCK cells, we have found 200 µg/mL hygromycin to be optimal but it mayvary from lot to lot.
3.5. Stable Transfection and Colony Selection
The goal with the stable transfection is to generate a cell line that gives lowbackground and high expression of Protein X. Both expression levels and induc-tion of Protein X can be significantly affected by the site of plasmid integration.Insertion near an enhancer may result in high basal expression of Protein X,whereas other insertion sites may result in suboptimal induction. To find the clonewith the highest induction and lowest background, we recommend that you growand analyze as many clones as feasible. We usually aim for 30 to 50 clones ini-tially; 20 to 50% will be lost on subsequent processing (to mininize the loss ofclones, it is important to avoid long exposure times to trypsin).
1. Grow cells to 80% confluency in complete medium.2. Transfect pTRE-Gene X (25 µg/100 cm2 dish) and your Selection Marker
(pTK-Hyg, or pPUR; 2.5–5 µg/100 cm2 dish). The plasmids can be linearizedbefore transfection and this may increase transfection efficiency.
3. To transfect MDCK II cells, use a lipid agent, such as Lipofectamine 2000.4. We recommend adding dox (40 ng/mL) to the transfection medium within 10 to
12 h of the transfection. This step is particularly important if your proteinproduct may be toxic to the cells.
5. Split the cells (110) 24 h after the transfection. Usually, a 10-cm plate will besplit into ten 10-cm plates.
6. Allow cells to grow 24 h, then add hygromycin (or puromycin) at the optimalconcentration (previously determined by killing curve). Sometimes we have addedhygromycin immediately after the first split (step 5) and have found comparableresults.
Cell–Cell Interactions in the Kidney 67

7. Replace medium containing hygromycin (or puromycin) every 2 d. Fresh doxmust be added every 2 d for Tet-off cells (see Note 4).
8. After about 5 d, clear patches of plastic devoid of cells should begin to be apparentat low magnification under the tissue culture microscope. Ideally, cells at this stageshould not be trypsinized and split (however, if your cells become confluent, youshould trypsinize and split again).
9. After 2 to 4 wk, hyg- (or puro-) resistant colonies will begin to become visible tothe naked eye and can be viewed by low power on the tissue culture scope. Viewand circle with a marker on the bottom of the plate to know where to place thecloning cylinder or pipet ring. Avoid waiting until your colonies get confluent,but ideally they should be greater than 50 cells.
10. Viewing the plate from the bottom, you may distinguish small white spots that arecolonies. Mark them and confirm under the microscope. Expect 0 to more than 30distinct colonies per 10-cm plate. It is important that you look carefully at plateperiphery because sometimes the colonies prefer this location.
11. Wash entire plate twice with PBS (prewarmed to 37°C).12. According to the size of the colony (usually 10–100 cells) choose a cloning cylin-
der, place vacuum grease on lower lip, and place over the margins of your colony.Add trypsin–EDTA 50 to 100 µL per ring. Incubate at 37°C for 5 min and lookfor cell detachment under the microscope. To avoid excessive trypsinization, checkcells every 2 min. After cells detach, add complete medium and transfer the cellsto a 24 well-plate.
13. Grow the cells with complete medium plus hygromycin and dox. When confluent,transfer to a 12-well plate. When clones nearly confluent, repeat this process for asix-well plate.
14. When the cells are confluent in a six-well plate, we recommend splitting the entirewell into a 10-cm plate. When this plate is confluent, we trypsinize and freeze 90%of the cells to insure a continued lineage. The remaining 10% of cells are placed ina six-well plate for analysis.
15. When a clone in the six-well plate is confluent, the media is changed to −dox for72 h to induce protein expression. Make a cell lysate and determine proteinexpression by SDS/Western blot. Controls include one +dox cell lysate and oneTet-off cell lysate on the Western (see Note 9).
3.6. Cell Lysis
1. Wash monolayer with PBS three times.2. Scrape with rubber policeman in 0.5 to 5 mL of tissue buffer plus protease
inhibitors and place in a 1.5-mL Eppendorf tube.3. Freeze in liquid nitrogen; thaw in 37°C water bath. Be careful not to let sample
warm. Repeat two more times.4. Triturate by passing 10 to 20 times through a 27-gage needle. 5. Centrifuge samples at 3000 rpm for 5 min to pellet nuclei and debris.6. Determine protein concentration and store samples at −80°C.
68 Sabath and Denker

3.7. Sodium Dodecyl Sulfate-Polyacrylamide Gel Electrophoresis
Gα-subunits migrate at 39 to 43 kDa on SDS-polyacrylamide gel electropho-resis (PAGE). Therefore, we use 10 to 12% acrylamide gels.
1. The glass of your gel system should be cleaned with a rinsable detergent(Alconox, Alconox, NY). Rinse extensively with distilled water and do the lastwash with ethanol 70%. Dry at room temperature.
2. Assemble your gel system. Make sure that your system is not leaky. 3. Prepare a 0.75-mm thick, 10% gel using 30% acrylamide, 1.25 mL of separating
buffer, 25 µL of 10% APS, and 5 µL of TEMED. Pour the gel, leaving space forthe stacking gel, and overlay with water-saturated isobutanol. The gel should poly-merize in approx 25 to 30 min.
4. Pour off the isobutanol and rinse with distilled water until alcohol odor is gone.5. Prepare the stacking gel. Pour the stacking gel solution on to the top of the sepa-
rating gel, and insert the comb. Once your gel has polymerized, remove the comband fill the spaces with running (electrode) buffer.
6. Add sample-buffer to your cell lysate (usually 10–60 µg of protein); heat yoursamples for 4 to 5 min at 95°C.
7. With an electrophoresis tip, fill the wells of the stacking gel with your samplesand add your molecular weight marker (Bio-Rad) to one or more lanes.
Connect your device to the power supply. The gel can be run overnight at40–50 V (constant voltage) or at 15–20 mA/gel until the sample has exitedthe stacking gel and entered the running gel. Current can be increased to30–40 mA/gel until the blue dye reaches the bottom (usually ∼2–3 h). Gelsrun in this manner should be cooled.
3.8. Western Blot
1. After SDS-PAGE, transfer is done with the Bio-Rad transfer system.2. Disconnect the gel unit from the power supply and disassemble. Discard the
stacking gel.3. To assembly your transfer system, you need two foam sheets, two thick filter paper
sheets, two thin filter paper sheets, and one nitrocellulose membrane. We usuallyuse squares of 14 cm2; try to get all pieces to be the same size. Pour transfer bufferin a big tray and assemble components immersed in transfer buffer. Assemble atransfer cassette (be sure to assemble in order): place two foam sheets, one thickfilter paper sheet, one thin filter paper sheet, and then nitrocellulose. The gel islaid on the nitrocellulose and the sandwich completed by placing thin filter paperfollowed by thick filter paper and the foam sheet.
4. Place your cassette in the transfer tank; your nitrocellulose membrane should beoriented to the anode (red color) and the gel to the cathode (black color). To avoidoverheating your system, place your transfer tank on ice and in a cold room. Youcan transfer your proteins overnight at 0.25 mA or in 2 h at 0.5 to 0.75 mA.
Cell–Cell Interactions in the Kidney 69

5. Once the transfer is complete, remove the cassette and disassemble. Mark thelocation of the prestained markers. To assess the quality of transfer, place mem-brane in Ponceau-S solution for 3 min, wash first with water and then with TBSTand look for protein bands. Optional: take a photocopy for later comparison.
6. Incubate nitrocellulose membrane in blocking solution (TBST + 5% dry milk)for 1 h at room temperature or overnight at 4°C on a rocking platform.
7. Discard blocking solution and rinse membrane once with TBST.8. Place membrane inside a plastic sealable bag, add Gα12 primary antibody (diluted
11000 in TBST), and seal. Incubate overnight at 4°C on a rocking platform.9. Remove the primary antibody (see Note 10) and wash the membrane three times,
10 min each with TBST.10. Add goat anti-rabbit IgG secondary antibody (diluted 110,000 in TBST) and
incubate for 1 h at room temperature in a rocking platform.11. Remove the secondary antibody and wash six times for 5 min each with TBST.12. Prepare enhanced chemiluminescent solution mixing 2 mL of each component.
Add this solution to membrane, taking care to cover all the surface of your mem-brane. Incubate for 5 min.
13. Remove membrane and place into film cassette with intensifying screens andexpose to X-ray film for various times to optimize visualization of the protein.
3.9. TER Measurements
1. Split cells with trypsin–EDTA.2. Plate the cells on polycarbonate filters (Transwell, Costar) at confluent density
(3 × 10⁵ cells/cm2). From a 10-cm plate in 10 mL of medium, place 0.5 mL of cellsuspension in the top chamber. Add 1 mL of medium to the lower reservoir. Leaveone filter blank with no cells.
3. Allow 24 to 48 h for attachment. 4. TER stabilizes over the course of 2 to 4 d after plating; once TER is stabilized
you can switch your cells to −dox.5. To measure TER, rinse the Millipore ERS electrodes in 70% ethanol, allow them
to air-dry, and then rinse them with sterile PBS. When obtaining measurements, itis important to always place the electrode in the same orientation (see Note 11).One prong of the chopstick electrode (shorter) is placed inside the suspended filterand the other in the outer well. Press the measure button, wait approx 1 s for thevalue to stabilize and record. Subtract the value of your blank (this number shouldbe around 100 Ω/cm2). (Note: we find our Tet-off cells with TER ∼75–90 Ω/cm2.)
4. Notes1. Dox has some advantages over Tc, including a lower concentration for inactiva-
tion and a longer half-life in culture.2. There are other vectors with the Tet-responsive cassette. The pTRE2pur (Clontech,
Palo Alto, CA) confers resistance to puromycin instead of hygromycin. Thereis no clear advantage for either of the antibiotics. The pTRE-Tight (Clontech) isreported to minimize the basal expression of most proteins. Other TRE vectors
70 Sabath and Denker

permit placement of an epitope tag to aid in protein detection (i.e., pTRE-myc;Clontech).
3. There are other alternatives to extract proteins from the cell lysate, such as soni-cation on ice.
4. This is the most important procedure to avoid leaky protein expression. Store Doxin the dark at −20°C for no more than 6 mo. Add fresh Dox to medium every 2–3d, and replace the medium of cells every 2–3 d.
5. This step is important for success in ligation. Exposure of DNA to ultravioletlight can result in damage to the ends and lower ligation efficiency.
6. Use fresh ligase buffer and avoid many thaw–freeze cycles because this mayinactivate the ATP.
7. For ligations, we have obtained the same results incubating the ligation mixturefor 1 h at room temperature in comparison with 16 h at 16°C.
8. When trypsin is thawed at 37°C, it can lose activity. Aliquot your trypsin to avoidfreeze–thaw cycles.
9. On occasion, well-characterized stable cell lines can lose their responsiveness to Tcor Dox. This can occur after changing lots serum and may be the result ofcontamination with antibiotics. If a sudden loss of responsiveness is observed,check serum by performing a dose–response curve. It is recommended to subcloneand freeze stocks of your cells at various stages.
10. The primary antibody can be saved for subsequent experiments. Add 0.02% finalconcentration of sodium azide (prepare a 10% stock solution), and storage at 4°C.
11. TER measurements are inherently slightly variable. Measure TER with all the fil-ters in the same orientation, angle and depth of electrodes, media volume andduration of “pulse.” Filters that have had TER recently measured (within last15–20 min) may have TER values that are noticeably higher if remeasured withinthis time frame.
References1. Li, G. and Zhang, X. C. (2004) GTP hydrolysis mechanism of Ras-like GTPases.
J. Mol. Biol. 340, 921–932.2. Robishaw, J. D. and Berlot, C. H. (2004) Translating G protein subunit diversity
into functional specificity. Curr. Opin. Cell Biol. 16, 206–209.3. Jou, T. S., Schneeberger, E. E., and Nelson, W. J. (1998) Structural and functional
regulation of tight junctions by RhoA and Rac1 small GTPases. J. Cell Biol. 142,101–115.
4. Denker, B. M., Saha, C., Khawaja, S., and Nigam, S. K. (1996) Involvement of aheterotrimeric G protein α subunit in tight junction biogenesis. J. Biol. Chem. 271,25,750–25,753.
5. Gonzalez-Mariscal, L., Contreras, R. G., Bolivar, J. J., Ponce, A., Chavez DeRamirez, B., and Cereijido, M. (1990) Role of calcium in tight junction formationbetween epithelial cells. Am. J. Physiol. 259, 978–986.
6. Rodriguez-Boulan, E. and Nelson, W. J. (1989) Morphogenesis of the polarizedepithelial cell phenotype. Science 245, 718–725.
Cell–Cell Interactions in the Kidney 71

7. Meyer, T. N., Hunt, J., Schwesinger, C., and Denker, B. M. (2003) Gα12 regulatesepithelial cell junctions through Src tyrosine kinases. Am. J. Physiol. 285,1281–1293.
8. Meyer, T. N., Schwesinger, C., and Denker, B. M. (2002) Zonula occludens-1 is ascaffolding protein for signaling molecules. Gα12 directly binds to the Src homology3 domain and regulates paracellular permeability in epithelial cells. J. Biol. Chem.277, 24,855–24,858.
72 Sabath and Denker

73
6
Nucleotide Metabolism and Cell–Cell Interactions
Holger K. Eltzschig, Thomas Weissmüller, Alice Mager, and Tobias Eckle
SummaryInteractions between the vascular endothelium and polymorphonuclear leukocytes (PMNs)
are central to PMN emigration into inflamed tissues, and to neutrophil–endothelial crosstalkpathways that modulate inflammatory responses and vascular barrier function. For example,during episodes of inflammation, the transendothelial migration (TEM) of PMNs potentiallydisturbs vascular barrier and gives rise to intravascular fluid extravasation and edema. However,because of the close special relationship between PMNs and the vascular endothelium, TEMcreates an ideal situation for neutrophil–endothelial crosstalk. While investigating innate mecha-nisms to dampen intravascular fluid loss and edema occurring during TEM, we observed thatPMNs release adenine nucleotides after activation (adenosine triphosphate [ATP] and adenosinemonophosphate [AMP]). ATP and AMP are metabolized by endothelial cell-surface enzymes, theecto-apyrase (CD39, metabolizes ATP to AMP) and the 5′-ecto-nucleotidase (CD73, metabo-lizes AMP to adenosine). Adenosine generated in this fashion can activate endothelial adenosinereceptors, leading to increases in intracellular cyclic AMP and resealing of the endothelialjunctions, thereby promoting vascular barrier function. This crosstalk pathway provides anendogenous mechanism to dampen vascular leak syndrome during neutrophil–endothelialinteraction. In other words, during TEM, neutrophils close the door behind them.
Key Words: Adenosine; adenosine monophosphate; adenosine triphosphate, ectonucleotidase;endothelium; neutrophil; CD73; CD39; inflammation.
1. IntroductionNeutrophil-mediated tissue injury is a prominent component in organ damage
during inflammation (1,2). Endothelial cells, which line the inner lumen of bloodvessels and largely determine overall vascular permeability (3), are primary targetsfor polymorphonuclear leukocyte (PMN) during uncontrolled inflammatoryresponses (4). Endothelial injury may result in increased endothelial paracellularpermeability and decreased endothelial barrier function. The resultant local tissue
From: Methods in Molecular Biology, vol. 341: Cell−Cell Interactions: Methods and ProtocolsEdited by: S. P. Colgan © Humana Press Inc., Totowa, NJ

edema and intravascular loss of fluid and solutes may further exacerbate tissueinjury via interference with cellular function and limitation of regional bloodflow (5).
To understand such interactions between PMNs and the vascular endothe-lium and potentially identify therapeutic targets for limiting vascular leak syn-drome associated with inflammation and hypoxia, the first step is to identifybiological mechanisms that control endothelial barrier function and regulate vas-cular leak. For example, macromolecule transit across blood vessels has evolvedto be tightly controlled. Relatively low macromolecular permeability of bloodvessels is essential for maintenance of a physiologically optimal equilibriumbetween intravascular and extravascular compartments (6,7). Endothelial cellscomprise the inner cell layer of blood vessels and are the predominant cell typedetermining vascular permeability (3). Disturbance of endothelial barrier duringdisease states can lead to deleterious loss of fluids and plasma protein into theextravascular compartment. Such disturbances in endothelial barrier functionare prominent in disorders such as shock and ischemia-reperfusion and con-tribute significantly to organ dysfunction (1,2,8). However, the direct relationshipbetween PMN activation and increased endothelial permeability is not clear.Although PMN accumulation and increased vascular permeability often arecoincidental, particularly at sites of inflammation/hypoxia, PMN activationcan occur with limited or no net changes in endothelial permeability (9–12).Moreover, although PMN depletion has been demonstrated to decrease organinjury in some models of ischemia and reperfusion (13), PMNs have beendemonstrated to exert a protective effect in other models (14–16). Therefore,further information regarding PMN–endothelial cell interactions and theirinfluence on endothelial permeability may provide a better understanding of theregulation of endothelial permeability.
Approximately 70 million PMNs exit the vasculature per minute (17). Theseinflammatory cells move into underlying tissue by initially passing betweenendothelial cells that line the inner surface of blood vessels. This process,referred to as transendothelial migration (TEM), is particularly prevalent ininflamed tissues. Understanding the biochemical details of leukocyte–endothelialinteractions is currently an area of concentrated investigation, and recent studiesof genetically modified animals have suggested that specific molecules mayestablish “bottlenecks” to the control of the inflammatory response (18).For example, detailed studies have revealed that the process of leukocyte TEMentails a concerted series of events involving intimate interactions of a series of leukocyte and endothelial glycoproteins that include selectins, integrins,and members of the immunoglobulin supergene family (e.g., intercellularadhesion molecule-1 [19–21] ). Moreover, histological studies of TEM revealthat PMNs initially adhere to endothelium, move to nearby interendothelial
74 Eltzschig et al.
junctions via diapedesis, and insert pseudopodia into the interendothelial paracel-lular space (22). Successful TEM is accomplished by temporary PMN self-deformation with localized widening of the interendothelial junction. After TEM,adjacent endothelial cells appear to “reseal,” leaving no residual interendothelialgaps (22). These histological studies are consistent with the observation thatleukocyte TEM may result in little or no change in endothelial permeability tomacromolecules (9–12,23). In the absence of this tight and dynamic control ofendothelial morphology and permeability, interendothelial gap formation duringleukocyte TEM could lead to marked increases in endothelial permeability.However, only limited information exists regarding the biochemical eventswhich maintain and dynamically regulate endothelial permeability in the settingof either PMN activation or TEM (22,24).
Despite the severe course in which inflammatory diseases can proceed, mostinflammation is self-limiting. One important factor may be increased productionof endogenous adenosine, a naturally occurring anti-inflammatory agent (25–27).Several lines of evidence support this assertion. First, adenosine receptors arewidely expressed on target cell types as diverse as leukocytes, vascular endothe-lia, and mucosal epithelia and have been studied for their capacity to modulateinflammation (27). Second, murine models of inflammation provide evidencefor adenosine receptor signaling as a mechanism for regulating inflammatoryresponses in vivo in endogenous anti-inflammation. For example, mice deficientin A2A-adenosine receptor (AdoRA2A) show increased inflammation-associatedtissue damage (28). Third, hypoxia is a common feature of inflamed tissues (29)and is accompanied by significantly increased levels of adenosine (30–33). Atpresent, the exact source of adenosine is not well-defined but likely results froma combination of increased intracellular metabolism and amplified extracellularphosphohydrolysis of adenine nucleotides via surface ecto-nucleotidases.
Previous studies have indicated that activated PMN release a number of solu-ble mediators that regulate vascular permeability during transmigration. For -example, PMNs have been demonstrated to actively release adenine nucleotides(in the form of adenosine triphosphate [ATP] or adenosine monophosphate[AMP]). On the endothelial surface, ATP can be converted by the ecto-apyrase(CD39) to AMP, which in turn is converted by the 5′-ectonucleotidase (CD73) toadenosine (14,15,34,35). Adenosine generated in this fashion is then available toactivate adenosine receptors either on the endothelial surface or on neutrophilsto modulate inflammatory responses.
To pursue studies of neutrophil–endothelial interaction, we first describe anisolation technique of fresh PMNs from human blood and a high-performanceliquid chromatography (HPLC)-based technique to measure nucleotide/nucleosiderelease from activated neutrophils. Then, we introduce an in vitro model ofendothelial permeability that allows the in vitro measurement of endothelial
Leukocyte–Endothelial Interaction During Inflammation 75

barrier function. Finally, we describe techniques to measure induction of CD73 orCD39 protein and function on the endothelial surface.
2. Materials2.1. Isolation of Human Neutrophils
1. Citrate blood: 10 mL of Monovets containing Na–citrate, 1 mL (Sarstedt, Nüm-brecht, Germany).
2. Percoll (Amersham Biosciences, Uppsala, Sweden).3. NH4Cl lysis buffer: 420 mg of NH4Cl, 4 g of NaHCO3, and 18.5 mg of EDTA;
bring with H2O to 500 mL.4. Hank’s Balanced Salts Solution (HBSS)– (Gibco/Invitrogen) containing no calcium
and no magnesium, buffered with HEPES (Gibco/Invitrogen) 10 mM to pH 7.4(10 mL of the 1 M stock solution is added to 1 L of HBSS).
2.2. Preparation of Activated PMN Supernatantsand Measurement of Nucleotide Contents
1. N-formyl-Met-Leu-Phe (fMLP; Sigma-Aldrich, Munich, Germany).2. HBSS– (Gibco/Invitrogen) containing no calcium and no magnesium, buffered with
HEPES (Gibco/Invitrogen) 10 mM to pH 7.4 (10 mL of the 1 M stock solution isadded to 1 L of HBSS).
3. HBSS+ (Gibco/Invitrogen) containing calcium and magnesium, buffered withHEPES (Gibco/Invitrogen) 10 mM to pH 7.4 (10 mL of the 1 M stock solution isadded to 1 L of HBSS).
4. CHRONO-LUME reagent (Crono-log Corp, Haverton, PA).5. For activation of murine PMN, use Leukotriene B4 (Calbiochem, San Diego, CA).
2.3. Cell Isolation and Cell Culture
1. HBSS– (Gibco/Invitrogen) containing 1% antibiotic–antimycotic solution (Sigma-Aldrich).
2. Lactated Ringer’s Solution (Fresenius, Bad Homburg, Germany).3. Collagenase A solution (Roche, Mannheim, Germany) in HBSS– to 1 mg/mL.4. Modified Medium 199, Medium 199 (Cambrex, Verbier, Belgium) and fetal calf
serum (FCS; PAA, Cölbe, Germany) + 1% Na Pyruvate (Sigma-Aldrich) + 1%antibiotic/antimycotic solution (Sigma-Aldrich).
5. Antibiotic solution: antibiotic–antimycotic solution (Sigma-Aldrich).6. Endothelial cell basal medium (Promo Cell, Heidelberg, Germany) supplemented
with endothelial cell growth media (Promo Cell).7. Accutase (PAA).8. Trypsin–EDTA (Cambrex).9. Trypsin neutrolizing solution (Cambrex).
10. Human microvascular endothelial cells (HMEC) media: modified MCDB 131(Gibco/Invitrogen) with L-glutamin 5 mM (Gibco), 10% fetal calf serum (PAA),
76 Eltzschig et al.

1 µg/mL hydrocortisone (Sigma), and epidermal growth factor (BD Biosciences,Bradford, MA).
2.4. Endothelial Permeability Assay
1. HBSS+ (Gibco/Invitrogen) containing calcium and magnesium, buffered with10 mM HEPES (Gibco/Invitrogen) pH 7.4 (10 mL of the 1 M stock solution isadded to 1 L of HBSS).
2. HBSS– (Gibco/Invitrogen) containing no calcium and no magnesium, buffered with10 mM HEPES (Gibco/Invitrogen) pH 7.4 (10 mL of the 1 M stock solution isadded to 1 L of HBSS).
3. 70-kDa fluorescein isothiocyanate (FITC)-labeled dextran (Molecular Probes,Eugene, OR).
2.5. Immunoprecipitation
1. Biotin (Sigma-Aldrich, 1 mM final concentration).2. NH4Cl buffer (150 mM): for 50 mL add 0.4 g of NH4Cl to 50 mL of H2O. 3. Radio-immunoprecipitation (RIPA) buffer: 250 mM NaCl, 10 mM Tris-HCl,
pH 8.1, 1% Triton X-100 (Sigma-Adrich) 1%; NP 40 (Igepal/CA630, Sigma-Aldrich); and 1 mM EDTA. Add protease/phosphatase inhibitors immediatelybefore use: 1 mM phenylmethylsulfonyl fluoride, 1 µg/mL leupeptin, and 100 µMsodium orthovanadate.
4. Protein G–Sepharose (Amersham Bioscience).5. Reducing sample buffer: 2.5% sodium dodecyl sulfate, 0.38 M Tris-HCl, pH 6.8,
20% glycerol, and 0.1% bromophenol blue.6. Wash buffer: 30 g of NaCl, 2 mL of Tween-20 (Sigma-Aldrich), and 10 mL of
1 M HEPES to 1000 mL with H2O.7. Blocking buffer: use wash buffer with 3% bovine serum albumin.8. Streptavidin-peroxidase (Sigma-Aldrich).9. Enhanced chemiluminescence (Amersham Pharmacia Biotechnology).
2.6. Measurement of Endothelial Surface Enzyme Activityof the Ecto-Apyrase (CD39) and the 5′-Ectonucleotidase (CD73)
1. Etheno-ATP (E-ATP; Molecular Probes).2. Etheno-AMP (E-AMP; Sigma-Aldrich).3. Etheno-adenosine (Sigma-Aldrich).
Avoid frequent thawing of the etheno-compounds because they will losetheir activity. Thaw once, and aliquot them as needed for each experiment.
3. Methods3.1. Isolation of Human Neutrophils (PMNs)
PMNs have to be freshly isolated from whole blood obtained by venipuncturefrom human volunteers and anticoagulated with acid citrate. We use 10-mL
Leukocyte–Endothelial Interaction During Inflammation 77

monovets containing Na–citrate (Sarstedt, Nümbrecht, Germany) to draw theblood. To remove platelets, plasma, mononuclear cells, and most of the erythro-cytes, a double-density centrifugation technique is applied using the Percollsystem (see Note 1).
1. In short, 4 mL of Percoll, prepared to a density of 63% (see manufacturer’sinstructions) is placed into a clear 15-mL tube, and 4 mL of Percoll, density 73%,is carefully placed below.
2. Then, 4 mL of the anticoagulated whole blood is placed carefully on top (Fig. 1). 3. The tubes are centrifuged at 500g for 30 min at room temperature, no break. 4. After the centrifugation, three bands can be visualized in the tube. At the bottom
are the erythrocytes, the second band represents the PMNs, and the third bandcontains the mononuclear cells (Fig. 1). To isolate the neutrophils, the plasmaand the band containing the mononuclear cells are removed to gain easier accessto the PMN-containing band.
5. Next, the band with the neutrophils is transferred into a 50-mL tube. From thispoint forward, PMNs should be kept strictly at 4°C (see Note 2).
Residual erythrocytes are removed by lysis in cold NH4Cl buffer. For this pur-pose, PMN are resuspended into 30 mL of ice-cold NH4Cl buffer, incubated at
78 Eltzschig et al.
Fig. 1. Isolation of PMNs using double-density centrifugation of whole blood.Whole blood is obtained by venipuncture from human volunteers and anticoagulatedwith acid citrate. To remove platelets, plasma, mononuclear cells and erythrocytes, adouble-density centrifugation technique is applied using the Percoll system. For thispurpose 4 mL of Percoll, prepared to a density of 63% (see manufacturer’s instruc-tions), is placed into a clear 15-mL tube, and 4 mL of Percoll, density 73%, is carefullyplaced into the bottom. Then, 4 mL of whole blood is placed on top (left). The tubesare centrifuged at 500g for 30 min at room temperature, no break. After the centrifu-gation, three bands can be visualized in the tube: below are the erythrocytes, the secondband consists of the PMNs, and the third band contains the mononuclear cells (right).

4°C for 10 min, and centrifuged at 170g (10 min, 4°C, break on). The super-natant is discarded, and the cells are washed with HBSS– twice (400g, 10 min,4°C, break on). Remaining cells should consist of 97% or greater PMNs, as canbe assessed by microscopic evaluation. PMNs should be studied within 2 h oftheir isolation. In general, approx 0.5 to 1 × 10⁸ PMNs can be isolated from50 mL of fresh blood.
3.2. Preparation of Activated PMN Supernatants and Measurement of Nucleotide Contents
To measure nucleotide release from activated PMN, freshly isolated humanneutrophils are activated with fMLP, and samples from the supernatant aretaken at different time-points after activation and analyzed by HPLC.
1. In short, freshly isolated human PMNs (107 cells in 1 mL of HBSS+ with 10–6 MfMLP) are incubated end-over-end at 37°C.
2. At 1, 5, 10, and 15 min, 200-µL samples are transferred into an ice-cold Eppendorfcup and immediately pelleted (1000g for 20 s at 4°C).
3. The resultant cell-free supernatants are filtered (0.45-µm Phenomenex, Torrance,CA) and kept strictly on ice until assessed by HPLC. Alternatively, supernatantscan be stored at –80°C until HPLC measurements are performed. To determinenucleotide content, the cell-free supernatants are resolved by HPLC (Hewlett-Packard, Palo Alto, CA; model 1050) with an HP 1100 diode array detector byreverse-phase on an HPLC column (Luna 5-µm C18, 150 × 4.60 mm; Phenomenex,Torrance, California, CA) with 100% H2O mobile-phase. ATP and adeninenucleotides can thus be identified by their chromatographic behavior (retentiontime, ultraviolet absorption spectra, and co-elution with standards).
In experiments when only the ATP content of the supernatant is of interest,a luciferase-based technique can be applied. This technique has a higher reso-lution because ATP concentrations in the picco-molar range can easily bedetected. To do this, PMN are activated as outlined previously, supernatantsare collected, and the ATP content can be quantified using CHRONO-LUMEreagent (Crono-log Corp, Haverton, PA). Luciferase activity can be assessedon a luminometer (Turner Designs Inc., Sunnyvale, CA) and compared withinternal ATP standards (see Notes 3 and 4).
3.3. Endothelial Cell Isolation and Culture
For assessment of endothelial barrier function in vitro, human umbilical veinendothelial cells (HUVECs) or immortalized HMEC-1 were used. HUVECswere isolated from a 10- to 15-cm long “fresh” piece of umbilical cord(minimum 10 cm). The umbilical cord was transported on ice from the laborfloor to the laboratory in a sterile bottle without any solution. The residual bloodwithin the umbilical cord provides the best media for the cells until isolation.
Leukocyte–Endothelial Interaction During Inflammation 79
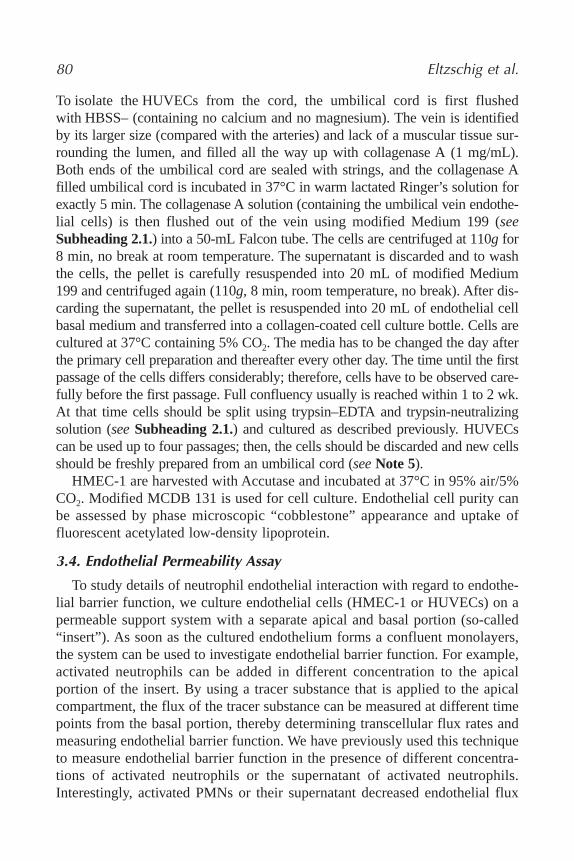
To isolate the HUVECs from the cord, the umbilical cord is first flushedwith HBSS– (containing no calcium and no magnesium). The vein is identifiedby its larger size (compared with the arteries) and lack of a muscular tissue sur-rounding the lumen, and filled all the way up with collagenase A (1 mg/mL).Both ends of the umbilical cord are sealed with strings, and the collagenase Afilled umbilical cord is incubated in 37°C in warm lactated Ringer’s solution forexactly 5 min. The collagenase A solution (containing the umbilical vein endothe-lial cells) is then flushed out of the vein using modified Medium 199 (seeSubheading 2.1.) into a 50-mL Falcon tube. The cells are centrifuged at 110g for8 min, no break at room temperature. The supernatant is discarded and to washthe cells, the pellet is carefully resuspended into 20 mL of modified Medium199 and centrifuged again (110g, 8 min, room temperature, no break). After dis-carding the supernatant, the pellet is resuspended into 20 mL of endothelial cellbasal medium and transferred into a collagen-coated cell culture bottle. Cells arecultured at 37°C containing 5% CO2. The media has to be changed the day afterthe primary cell preparation and thereafter every other day. The time until the firstpassage of the cells differs considerably; therefore, cells have to be observed care-fully before the first passage. Full confluency usually is reached within 1 to 2 wk.At that time cells should be split using trypsin–EDTA and trypsin-neutralizingsolution (see Subheading 2.1.) and cultured as described previously. HUVECscan be used up to four passages; then, the cells should be discarded and new cellsshould be freshly prepared from an umbilical cord (see Note 5).
HMEC-1 are harvested with Accutase and incubated at 37°C in 95% air/5%CO2. Modified MCDB 131 is used for cell culture. Endothelial cell purity canbe assessed by phase microscopic “cobblestone” appearance and uptake offluorescent acetylated low-density lipoprotein.
3.4. Endothelial Permeability Assay
To study details of neutrophil endothelial interaction with regard to endothe-lial barrier function, we culture endothelial cells (HMEC-1 or HUVECs) on apermeable support system with a separate apical and basal portion (so-called“insert”). As soon as the cultured endothelium forms a confluent monolayers,the system can be used to investigate endothelial barrier function. For example,activated neutrophils can be added in different concentration to the apicalportion of the insert. By using a tracer substance that is applied to the apicalcompartment, the flux of the tracer substance can be measured at different timepoints from the basal portion, thereby determining transcellular flux rates andmeasuring endothelial barrier function. We have previously used this techniqueto measure endothelial barrier function in the presence of different concentra-tions of activated neutrophils or the supernatant of activated neutrophils.Interestingly, activated PMNs or their supernatant decreased endothelial flux
80 Eltzschig et al.

of 70 kDa dextran, thereby promoting barrier function in the below describedmodel (Fig. 2).
For preparation of experimental endothelial monolayers used to measureendothelial barrier function, confluent endothelial cells are seeded at approx1 × 105 cells/cm2 onto either permeable polycarbonate inserts or 100-mmPetri dishes. In short, HMEC-1 are seated on polycarbonate permeable inserts(0.4-µm pore, 6.5-mm diameter; Costar Corp., Cambridge, MA). To do this,HMEC-1 from a cell culture bottle (area 75 cm2) of fully confluent HMEC-1are detached with trypsin and suspended in 20 mL of HMEC media. As next,1 mL of HMEC media (without cells) is placed on the basal portion of the insertand 80 µL of the cell suspension is carefully placed on the apical portion of theinsert. A few drops of media are then added to the apical portion. Endothelialbarrier function can be studied when controls seated on Petri dishes reachfull confluency (usually 5–7 d after seeding; see Note 6). To study endothelial
Leukocyte–Endothelial Interaction During Inflammation 81
Fig. 2. Activated PMNs promote endothelial barrier function. PMNs activated withfMLP (10−6 M) and FITC-dextran 70 kDa were added to HMEC-1 monolayers. Trans-endothelial flux was calculated by linear regression (six samples over 60 min) and nor-malized as percent of control (HBSS+ only). Data are derived from six monolayers ineach condition; results are expressed as mean of percent control flux ± standarddeviation. *p < 0.05.

barrier function, inserts are placed in HBSS+-containing wells (0.9 mL), andHBSS+ (alone or with PMN, PMN supernatant, or ATP) is added to the apicalportion (100 µL). At the start of the assay (t = 0), FITC-labeled dextran 70 kDa(concentration 3.5 µM) is added to fluid within the apical portion of the insert.The size of FITC–dextran, 70 kDa, approximates that of human albumin, bothof which have been used in similar endothelial paracellular permeability models(36,37). Fluid from the opposing well (basal portion) are sampled (50 µL) overthe course of 60 min (t = 20, 40, and 60 min). Fluorescence intensity of eachsample can then be measured (excitation, 485 nm; emission, 530 nm; Cytofluor2300; Millipore Corp., Waters Chromatography, Bedford, MA) and FITC–dex-tran concentrations are determined from standard curves generated by serialdilution of FITC–dextran. Paracellular flux is calculated by linear regression ofsample fluorescence (37). Consistent with observations of other investigators,control experiments demonstrate decreased paracellular permeability withforskolin or 8-bromo-cyclic AMP (38) and increased paracellular permeabilitywith thrombin and hydrogen peroxide (39).
3.5. Immunoprecipitation
To show expression or induction of a specific cellular protein on theendothelial surface, surface proteins can be labeled with biotin. Using an avidinblot, these proteins can be quantified. We have previously used this techniqueto show expression and induction of the CD39 and CD73 by hypoxia (14,34).
To pursue this, HMEC-1 or HUVECs are grown to full confluency in100-mm Petri dishes. The labeling has to be performed in the cold (4°C) to sta-bilize surface proteins (see Note 7). Therefore, Petri dishes with cells are takento a cold room (4°C) and placed on a cold surface (4°C). Cells are washed twicewith ice-cold HBSS+ and are labeled with biotin (final concentration 1 mM). Forthis purpose, cover cells completely with 1 mM Biotin in HBSS+, enough tocover all cells (minimum 3 mL), and place cells on a rotator (slow settings) for20 min at 4°C. As next, cells are rinsed twice with HBSS+. Then, endothelia areincubated with 150 mM NH4CL buffer (10 mL/plate, 30 min at 4°C), rinsedtwice with HBSS+, and lysed with RIPA buffer. For this purpose, 1.25 mL ofRIPA buffer is given to each 100-mm Petri dish, cells are scraped with a cell-scraper or a pipet tip and transferred into an Eppendorf cup (avoid bubbles).The Eppendorf cups are rotated end-over-end for 30 min, and cell debris isremoved by centrifugation (1000g at 4°C for 5 min). Immunoprecipitation isthen performed with mono or polyclonal antibodies (e.g., for human CD39[Research Diagnostics, Inc. Flanders, NJ; 5 µg/mL], CD73 with MAb 1E9[5 µg/mL, a kind gift from Dr. Linda Thompson, Oklahoma Medical ResearchFoundation]) followed by addition of 100 µL of pre-equilibrated protein
82 Eltzschig et al.
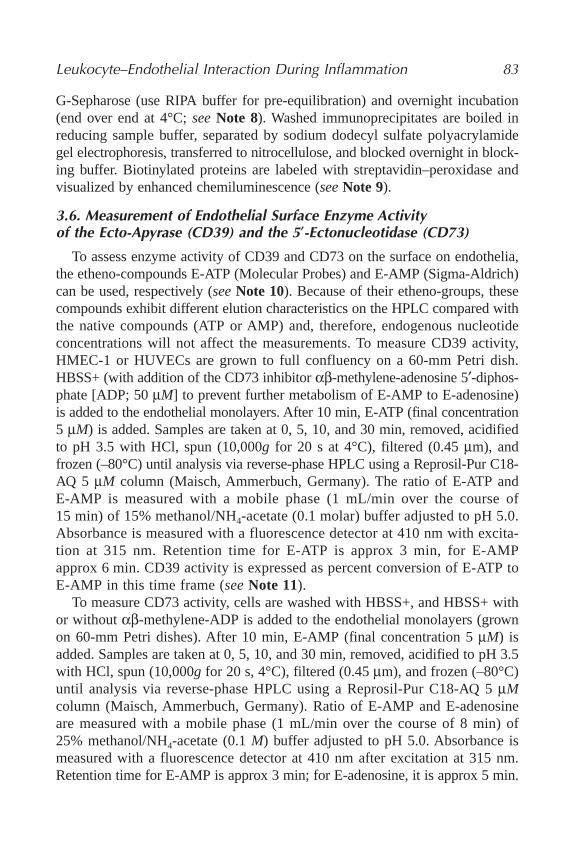
G-Sepharose (use RIPA buffer for pre-equilibration) and overnight incubation(end over end at 4°C; see Note 8). Washed immunoprecipitates are boiled inreducing sample buffer, separated by sodium dodecyl sulfate polyacrylamidegel electrophoresis, transferred to nitrocellulose, and blocked overnight in block-ing buffer. Biotinylated proteins are labeled with streptavidin–peroxidase andvisualized by enhanced chemiluminescence (see Note 9).
3.6. Measurement of Endothelial Surface Enzyme Activity of the Ecto-Apyrase (CD39) and the 5′-Ectonucleotidase (CD73)
To assess enzyme activity of CD39 and CD73 on the surface on endothelia,the etheno-compounds E-ATP (Molecular Probes) and E-AMP (Sigma-Aldrich)can be used, respectively (see Note 10). Because of their etheno-groups, thesecompounds exhibit different elution characteristics on the HPLC compared withthe native compounds (ATP or AMP) and, therefore, endogenous nucleotideconcentrations will not affect the measurements. To measure CD39 activity,HMEC-1 or HUVECs are grown to full confluency on a 60-mm Petri dish.HBSS+ (with addition of the CD73 inhibitor αβ-methylene-adenosine 5′-diphos-phate [ADP; 50 µM] to prevent further metabolism of E-AMP to E-adenosine)is added to the endothelial monolayers. After 10 min, E-ATP (final concentration5 µM) is added. Samples are taken at 0, 5, 10, and 30 min, removed, acidifiedto pH 3.5 with HCl, spun (10,000g for 20 s at 4°C), filtered (0.45 µm), andfrozen (–80°C) until analysis via reverse-phase HPLC using a Reprosil-Pur C18-AQ 5 µM column (Maisch, Ammerbuch, Germany). The ratio of E-ATP andE-AMP is measured with a mobile phase (1 mL/min over the course of15 min) of 15% methanol/NH4-acetate (0.1 molar) buffer adjusted to pH 5.0.Absorbance is measured with a fluorescence detector at 410 nm with excita-tion at 315 nm. Retention time for E-ATP is approx 3 min, for E-AMPapprox 6 min. CD39 activity is expressed as percent conversion of E-ATP toE-AMP in this time frame (see Note 11).
To measure CD73 activity, cells are washed with HBSS+, and HBSS+ withor without αβ-methylene-ADP is added to the endothelial monolayers (grownon 60-mm Petri dishes). After 10 min, E-AMP (final concentration 5 µM) isadded. Samples are taken at 0, 5, 10, and 30 min, removed, acidified to pH 3.5with HCl, spun (10,000g for 20 s, 4°C), filtered (0.45 µm), and frozen (–80°C)until analysis via reverse-phase HPLC using a Reprosil-Pur C18-AQ 5 µMcolumn (Maisch, Ammerbuch, Germany). Ratio of E-AMP and E-adenosineare measured with a mobile phase (1 mL/min over the course of 8 min) of25% methanol/NH4-acetate (0.1 M) buffer adjusted to pH 5.0. Absorbance ismeasured with a fluorescence detector at 410 nm after excitation at 315 nm.Retention time for E-AMP is approx 3 min; for E-adenosine, it is approx 5 min.
Leukocyte–Endothelial Interaction During Inflammation 83

Retention time for E-adenosine is confirmed using commercially availableE-adenosine (Sigma-Aldrich). CD73 activity is expressed as percent conver-sion of αβ-methylene-ADP inhibited E-AMP conversion to E-adenosine in thistime frame.
4. Notes1. For neutrophil isolation, it is critical that the freshly drawn blood and both Percoll
solutions have the same temperature. Otherwise, the double-density centrifugationcannot be performed successfully, and the different bands cannot be distinguishedclearly.
2. To be able to measure release of nucleotides upon PMN activation, it is critical toavoid activation of PMNs in the process of isolation and washing. Therefore, allsolutions used during this process should not contain calcium (e.g., HBSS–). Also,after the initial isolation, PMNs should be kept on ice all the time, and centrifugesshould be used at 4°C. Do not let keep PMNs in the pellet; instead, keep them insolution in HBSS–.
3. To activate PMNs, neutrophils in HBSS– are pelleted by centrifugation (400gfor 10 min at 4°C) and transferred into warm HBSS+ (37°C), containing fMLP(100 nM).
4. In case that murine PMNs are studied, the neutrophils cannot be activated byfMLP because murine PMNs do not express fMLP receptors. Instead of fMLP,murine PMN can be activated using leukotriene B4 (i.e., leukotriene B4 [40]).
5. Don’t use PBS to wash or flush HUVECs.6. When changing the media or the HBSS solution of inserts used to measure
endothelial barrier function in vitro, one has to be extremely careful not to touchthe cell layer with a pipet. If that happens, the barrier is lost, and the tracer sub-stance will immediately equilibrate between apical and basal compartment.
7. For surface labeling of endothelial proteins with biotin, it is critical to perform thewhole experiment at 4°C to stabilize the confirmation and position of surfaceproteins.
8. When performing end-over-end incubations for immunopreciptation, the Eppen-dorf cups should be locked tightly and sealed with plastic foil to avoid leakageand loss of the lysates.
9. Do not perform an avidin blot with milk powder. Instead, use 3% bovine serumalbumin resolved in wash buffer.
10. The etheno-compounds in the supernatant of HMEC-1 or HUVECs are unstable,unless acidified and cooled to 4°C immediately.
11. It is important to filter the samples thoroughly before injection into the HPLC.Otherwise, HPLC filter systems may be blocked or increased pressure readingswill occur.
AcknowledgmentsThis work was supported by Fortune grant 1319-0-0 and DFG grant
EL274/2-2 to HKE.
84 Eltzschig et al.

References1. Waxman, K. (1996) Shock: ischemia, reperfusion, and inflammation. New Horiz. 4,
153–160.2. Kloner, R.A., Ellis, S. G., Lange, R., and Braunwald, E. (1983) Studies of exper-
imental coronary artery reperfusion. Effects on infarct size, myocardial function,biochemistry, ultrastructure and microvascular damage. Circulation 68, I8–I15.
3. Ramirez, C., Colton, C., Smith, K., Stemerman, M., and Lees, R. (1984) Transportof 125I-albumin across normal and deendothelialized rabbit thoracic aorta in vivo.Arterioscler. Thromb. Vasc. Biol. 4, 283–291.
4. Takano, T., Clish, C. B., Gronert, K., Petasis, N., and Serhan, C. N. (1998)Neutrophil-mediated changes in vascular permeability are inhibited by topicalapplication of aspirin-triggered 15-epi-lipoxin a4 and novel lipoxin b4 stableanalogues. J. Clin. Invest. 101, 819–826.
5. Sunnergren, K. P. and Rovetto, M. J. (1987) Myocyte and endothelial injury withischemia reperfusion in isolated rat hearts. Am. J. Physiol. 252, H1211–H1217.
6. Rippe, B. and Haraldsson, B. (1994) Transport of macromolecules across micro-vascular walls: the two-pore theory. Physiol. Rev. 74, 163–219.
7. Lum, H. and Malik, A. B. (1994) Regulation of vascular endothelial barrier function.Am. J. Physiol. 267, L223–L241.
8. Kloner, R.A., Ganote, C. E., and Jennings, R. B. (1974) The “no-reflow” phe-nomenon after temporary coronary occlusion in the dog. J. Clin. Invest. 54,1496–1508.
9. Dejana, E., Corada, M., and Lampugnani, M. G. (1995) Endothelial cell-to-celljunctions. FASEB J. 9, 910–918.
10. Huang, A. J., Furie, M. B., Nicholson, S. C., Fischbarg, J., Liebovitch, L. S., andSilverstein, S. C. (1988) Effects of human neutrophil chemotaxis across humanendothelial cell monolayers on the permeability of these monolayers to ions andmacromolecules. J. Cell Physiol. 135, 355–366.
11. Lewis, R. E. and Granger, H. J. (1988) Diapedesis and the permeability of venousmicrovessels to protein macromolecules: the impact of leukotriene B4 (LTB4).Microvasc. Res. 35, 27–47.
12. Meyrick, B., Hoffman, L. H., and Brigham, K. L. (1984) Chemotaxis of granulo-cytes across bovine pulmonary artery intimal explants without endothelial cellinjury. Tissue Cell 16, 1–16.
13. Welbourn, C. R., Goldman, G., Paterson, I. S., Valeri, C. R., Shepro, D., andHechtman, H. B. (1991) Pathophysiology of ischaemia reperfusion injury: centralrole of the neutrophil. Br. J. Surg. 78, 651–655.
14. Eltzschig, H. K., Ibla, J. C., Furuta, F. T., et al. (2003) Coordinated adeninenucleotide phosphohydrolysis and nucleoside signaling in posthypoxic endothe-lium: role of ectonucleotidases and adenosine A2B receptors. J. Exp. Med. 198,783–796.
15. Eltzschig, H. K., Thompson, L. F., Karhausen, J., et al. (2004) Endogenous adeno-sine produced during hypoxia attenuates neutrophil accumulation: coordination byextracellular nucleotide metabolism. Blood 104, 3986–3992.
Leukocyte–Endothelial Interaction During Inflammation 85

16. Lennon, P. F., Taylor, C. T., Stahl, G. L., and Colgan, S. P. (1998) Neutrophil-derived5′-adenosine monophosphate promotes endothelial barrier function via CD73-mediated conversion to adenosine and endothelial A2B receptor activation. J. Exp.Med. 188, 1433–1443.
17. Dancey, J. T., Deubelbeiss, K. A., Harker, L. A., and Finch, C. A. (1976) Neu-trophil kinetics in man. J. Clin. Invest. 58, 705–715.
18. Ley, K. (2001) Pathways and bottlenecks in the web of inflammatory adhesionmolecules and chemoattractants. Immunol. Res. 24, 87–95.
19. Gonzalez-Amaro, R. and Sanchez-Madrid, F. (1999) Cell adhesion molecules:selectins and integrins. Crit. Rev. Immunol. 19, 389–429.
20. Springer, T. A. (1994) Traffic signals for lymphocyte recirculation and leukocyteemigration: the multistep paradigm. Cell 76, 301–314.
21. Shimizu, Y., Rose, D. M., and Ginsberg, M. H. (1999) Integrins in the immunesystem. Adv. Immunol. 72, 325–380.
22. Dejana, E., Spagnuolo, R., and Bazzoni, G. (2001) Interendothelial junctions andtheir role in the control of angiogenesis, vascular permeability and leukocyte trans-migration. Thromb. Haemost. 86, 308–315.
23. Shaw, J. O. and Henson, P. M. (1982) Pulmonary intravascular sequestration ofactivated neutrophils: failure to induce light-microscopic evidence of lung injury inrabbits. Am. J. Pathol. 108, 17–23.
24. Ley, K. (2002) Integration of inflammatory signals by rolling neutrophils.Immunol. Rev. 186, 8–18.
25. Hasko, G., Sitkovsky, M. V., and Szabo, C. (2004) Immunomodulatory and neuro-protective effects of inosine. Trends Pharmacol. Sci. 25, 152–157.
26. Linden, J. (2001) Molecular approach to adenosine receptors: receptor-mediatedmechanisms of tissue protection. Ann. Rev. Pharmacol. Toxicol. 41, 775–787.
27. Sitkovsky, M. V., Lukashev, D., Apasov, S., et al. (2004) Physiological control ofimmune response and inflammatory tissue damage by hypoxia-inducible factorsand adenosine A2A receptors. Ann. Rev. Immunol. 22, 657–682.
28. Ohta, A. and Sitkovsky, M. (2001) Role of G-protein-coupled adenosine receptorsin downregulation of inflammation and protection from tissue damage. Nature 414,916–920.
29. Cramer, T., Yamanishi, Y., Clausen, B. E., et al. (2003) HIF-1alpha is essential formyeloid cell-mediated inflammation. Cell 112, 645–657.
30. MacLean, D. A., Sinoway, L. I., and Leuenberger, U. (1998) Systemic hypoxiaelevates skeletal muscle interstitial adenosine levels in humans. Circulation 98,1990–1992.
31. Mo, F. M. and Ballard, H. J. (2001) The effect of systemic hypoxia on interstitialand blood adenosine, AMP, ADP and ATP in dog skeletal muscle. J. Physiol.(Lond.) 536, 593–603.
32. Phillis, J. W., O’Regan, M. H., and Perkins, L. M. (1992) Measurement ofrat plasma adenosine levels during normoxia and hypoxia. Life Sci. 51,PL149–PL152.
86 Eltzschig et al.

33. Saito, H., Nishimura, M., Shinano, H., et al. (1999) Plasma concentration ofadenosine during normoxia and moderate hypoxia in humans. Am. J. Respir. Crit.Care Med. 159, 1014–1018.
34. Synnestvedt, K., Furuta, G. T., Comerford, K. M., Louis, N., Karhausen, J.,Eltzschig, H. K., et al. (2002) Ecto-5′-nucleotidase (CD73) regulation by hypoxia-inducible factor-1 mediates permeability changes in intestinal epithelia.J. Clin. Invest. 110, 993–1002.
35. Thompson, L. F., Eltzschig, H. K., Ibla, J. C., et al. (2004) Crucial Role for Ecto-5′-Nucleotidase (CD73) in Vascular Leakage during Hypoxia. J. Exp. Med. 200,1395–1405.
36. Mizuno-Yagyu, Y., Hashida, R., Mineo, C., Ikegami, S., Ohkuma, S., and Takano, T.(1987) Effect of PGI2 on transcellular transport of fluorescein dextran through anarterial endothelial monolayer. Biochem. Pharmacol. 36, 3809–3813.
37. Sanders, S. E., Madara, J. L., McGuirk, D. K., Gelman, D. S., and Colgan, S. P.(1995) Assessment of inflammatory events in epithelial permeability: a rapidscreening method using fluorescein dextrans. Epithelial Cell Biol. 4, 25–34.
38. Casnocha, S. A., Eskin, S. G., Hall, E. R., and McIntire, L. V. (1989) Permeabilityof human endothelial monolayers: effect of vasoactive agonists and cAMP. J. Appl.Physiol. 67, 1997–2005.
39. Garcia, J. G., Siflinger-Birnboim, A., Bizios, R., Del Vecchio, P. L., Fenton, 2nd,J. W., and Malik, A. B. (1986) Thrombin-induced increase in albumin permeabilityacross the endothelium. J. Cell Physiol. 128, 96–104.
40. Haribabu, B., Verghese, M. W., Steeber, D. A., Sellars, D. D., Bock, C. B., andSnyderman, R. (2000) Targeted disruption of the leukotriene B4 receptor in micereveals its role in inflammation and platelet-activating factor-induced anaphylaxis.J. Exp. Med. 192, 433–438.
Leukocyte–Endothelial Interaction During Inflammation 87


89
7
Analysis of Mammalian Sperm–Egg MembraneInteractions During In Vitro Fertilization
Genevieve B. Wortzman, Allison J. Gardner, and Janice P. Evans
SummaryThe interactions between egg and sperm are among the most fascinating in cell biology.
These interactions include cell–cell adhesion and then membrane fusion between the twogametes. This chapter details the experimental methods used to for gamete culture and in vitrofertilization using mouse sperm and eggs.
Key Words: In vitro fertilization; cell adhesion; membrane fusion; cell–cell fusion.
1. IntroductionThis chapter focuses on the cell–cell interactions between mouse sperm and
egg, namely the interactions between sperm and egg plasma membranes, whichinclude sperm–egg adhesion (or binding) and sperm–egg fusion. Generalaspects of the cell and molecular biology of fertilization have been addressedin recent review articles (1,2). It should be noted that normally the sperm inter-acts with the egg on three different levels. The first two interactions are with theegg’s two extracellular coats, the cumulus layer and the zona pellucida (ZP).After penetrating these two layers, the sperm gains access to the perivitellinespace, between the inner surface of the ZP and the egg plasma membrane; it isin this space that sperm–egg membrane interactions occur. For most experi-ments for the study of sperm–egg adhesion and fusion, the cumulus layers andthe ZP are removed from the eggs, as addressed in the chapter, with relevantaspects of gamete cell biology discussed in the appropriate portions of theNotes section. Mammalian eggs have not yet completed meiosis (in contrastto the sperm, which complete meiosis during spermatogenesis in the testis).Instead, most mammalian eggs are arrested in metaphase of meiosis II, with
From: Methods in Molecular Biology, vol. 341: Cell−Cell Interactions: Methods and ProtocolsEdited by: S. P. Colgan © Humana Press Inc., Totowa, NJ

fertilization by the sperm providing the trigger to complete meiosis (3). Thisactivation by the sperm results in cytokinesis that produces a small cell, calledthe polar body, containing half of the egg’s DNA (Fig. 1). This leaves a haploidset of DNA in the egg that will ultimately fuse with the DNA delivered by thesperm, at approx 7 to 8 h after fertilization.
The processes of fertilization are highly conserved between mammalianspecies. For experimental studies, the mouse is most commonly used becausegamete collection and in vitro fertilization (IVF) procedures have been verywell refined (Fig. 2). IVF is more difficult in other species, for example, lowfertilization rates are common with rat gametes, and polyspermy (fertilizationby more than one sperm) is common with pig gametes. It should be noted thatthe main barrier for species specificity of fertilization is the ZP, whereassperm–egg membrane fusion is much less species-specific than sperm–ZP inter-actions. Mouse sperm can fuse with the eggs of rat, guinea pig, and rabbit (4).ZP-free eggs from golden hamsters can be fertilized by sperm from a very widevariety of species (including human, bat, and dolphin [4]). Because of logisti-cal and ethical problems associated with doing experiments with human spermand eggs, it is common for studies of human sperm to use ZP-free hamstereggs. However, for general interests in cell–cell interactions, it is more appro-priate to use sperm and eggs from the same species because potentially mis-leading results can come from studies of heterologous gametes (5). This chapter
90 Wortzman, Gardner, and Evans
Fig. 1. DAPI-stained fertilized egg, approx 60 min after insemination. (A) Phasecontrast image. (B) Fluorescent image of the DAPI-stained DNA. This egg has nearlycompleted meiosis, as indicated by the emission of the polar body (PB). The spermnucleus is present in the egg cytoplasm; this will ultimately form a male pronucleuswhich will fuse with the female pronucleus to create the new diploid organism.

presents protocols for gamete collection and IVF using the mouse as an exper-imental model system. The reader also is advised that there are a number ofother issues related to the experimental procedures used to assess sperm–egginteractions that are beyond the scope of this chapter (the interested reader isreferred to Section 3 in ref. 6 ).
2. Materials
1. Mice: the females most commonly used for superovulation and egg collection areCF-1 (non-Swiss albino) or CD-1 (ICR) from Harlan or Charles River. An inex-pensive choice for males is CD-1 retired breeders; sperm quality from these malesgenerally is good, although there will be occasional mice with suboptimal sperm(e.g., low count, self-aggregating and clumpy). An alternative source of sperm areF1 hybrid males, such as from Jackson Laboratories, although these tend to besignificantly more expensive. Insemination conditions (optimal sperm concentra-tions, insemination times) may vary for gametes from mice of different strains.
Mammalian Sperm–Egg Membrane Interactions 91
Fig. 2. Flow chart of the experimental design for an IVF study.

92 Wortzman, Gardner, and Evans
2. Gonadotropins are the hormones used to induce females to ovulate. Pregnant mare’sserum gonadotropin (PMSG) has activity similar to the naturally occurring pitu-itary hormone follicle-stimulating hormone and is used to prime the females forovulation. Human chorionic gonadotropin (hCG) has activity similar to the naturallyoccurring pituitary hormone luteinizing hormone, and is used to induce ovulation.
PMSG (Calbiochem, San Diego, CA; cat. no. 367222, 5000 IU) is dissolved in100 mL of phosphate-buffered saline (PBS) for a final concentration of 5 U/0.1mL. hCG from human pregnancy urine (Sigma, St. Louis, MO; cat. no. CG-10,10,000 U, or cat. no. C1063, 2500 IU) is dissolved in PBS for a final concentrationof 5 U/0.1 mL. Store aliquots of 600 µL (enough for three to six mice) at –20 or–80°C. (PMSG in particular may lose effectiveness when stored below –20°C.)
3. Whitten’s medium stock (7): begin with high-quality water (such as sterile sur-gical irrigation water; Abbott Laboratories, North Chicago, IL or water forembryo transfer; Sigma; cat. no. W1503). Add 109.5 mM NaCl, 4.7 mM KCl,1.2 mM KH2PO4, 1.2 mM MgSO4, 5.5 mM glucose, 0.23 mM pyruvic acid, 4.8mM lactic acid, 0.01% gentamycin, and 0.0001% Phenol Red. For Whitten’s-HEPES medium (W-H), add 7 mM NaHCO3 and 15 mM HEPES and adjustpH to 7.4. For Whitten’s bicarbonate medium (W-B), add 22 mM NaHCO3.Filter through a surfactant-free cellulose acetate 0.2-µm filter, and store at 4°C(see Note 1).
4. W-B medium with 15 mg/mL bovine serum albumin (W-B/15). This medium ismade the night before or the day of the IVF experiment by adding 15 mg/mL ofbovine serum albumin (BSA; Albumax I, Gibco-BRL, Gaithersburg, MD) to thedesired volume of W-B. Typically 5 to 10 mL is made, depending on the scale of theexperiment. Invert gently to dissolve the BSA into solution (do not vortex). Addapprpox 5 µL of 1 N NaOH per 1 mL of medium; the medium color will changefrom orange-ish to pinkish-purple. Gently filter through a 0.2-µm surfactant-free cel-lulose acetate syringe filter, and then incubate at 37°C, 5% CO2 in air (see Note 2).
5. Whitten’s bicarbonate medium with 0.01–0.1% polyvinyl alcohol (W-B/PVA)(PVA, Sigma; cat. no. P-8136). We make this in batches of approx 50 mL, and ourpreferred concentration of PVA is 0.05% (see Note 3).
6. Pipets for handling eggs: Pasteur pipets made of borosilicate glass (Fisher; cat. no.13-678-20D; do not use not soda lime glass) are heated in a flame and pulledthin. Using a Bunsen burner, hold both ends of the pipet so the flame touchesone spot on the narrow region of the pipet. As the glass softens, in one motionquickly lift the pipet out of the flame and pull the ends of the pipet apart. Donecorrectly, the pipet is intact with a very narrow section in the middle. After theglass has cooled, slide the thinned section of glass between your index finger andthumb with light pressure until the pipet breaks. This will result in a pipet with anarrow tip and a clean edge (see Note 4).
Egg handling is managed by mouth pipetting. Homemade mouth pipets aremade of mouthpieces (HPI Hospital Products, Altamonte Springs, FL) and con-ventional rubber tubing (Latex amber thick wall tubing, 1/8 in. inner diameter,1/16 in. wall thickness, 1/4 in. outer diameter; Fisher; cat. no. 14-178-5B).
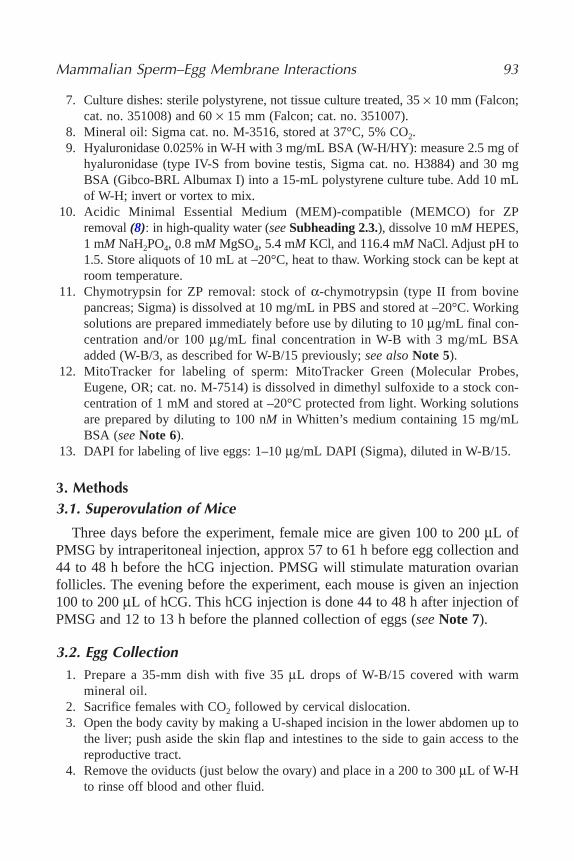
Mammalian Sperm–Egg Membrane Interactions 93
7. Culture dishes: sterile polystyrene, not tissue culture treated, 35 × 10 mm (Falcon;cat. no. 351008) and 60 × 15 mm (Falcon; cat. no. 351007).
8. Mineral oil: Sigma cat. no. M-3516, stored at 37°C, 5% CO2.9. Hyaluronidase 0.025% in W-H with 3 mg/mL BSA (W-H/HY): measure 2.5 mg of
hyaluronidase (type IV-S from bovine testis, Sigma cat. no. H3884) and 30 mgBSA (Gibco-BRL Albumax I) into a 15-mL polystyrene culture tube. Add 10 mLof W-H; invert or vortex to mix.
10. Acidic Minimal Essential Medium (MEM)-compatible (MEMCO) for ZPremoval (8): in high-quality water (see Subheading 2.3.), dissolve 10 mM HEPES,1 mM NaH2PO4, 0.8 mM MgSO4, 5.4 mM KCl, and 116.4 mM NaCl. Adjust pH to1.5. Store aliquots of 10 mL at –20°C, heat to thaw. Working stock can be kept atroom temperature.
11. Chymotrypsin for ZP removal: stock of α-chymotrypsin (type II from bovinepancreas; Sigma) is dissolved at 10 mg/mL in PBS and stored at –20°C. Workingsolutions are prepared immediately before use by diluting to 10 µg/mL final con-centration and/or 100 µg/mL final concentration in W-B with 3 mg/mL BSAadded (W-B/3, as described for W-B/15 previously; see also Note 5).
12. MitoTracker for labeling of sperm: MitoTracker Green (Molecular Probes,Eugene, OR; cat. no. M-7514) is dissolved in dimethyl sulfoxide to a stock con-centration of 1 mM and stored at –20°C protected from light. Working solutionsare prepared by diluting to 100 nM in Whitten’s medium containing 15 mg/mLBSA (see Note 6).
13. DAPI for labeling of live eggs: 1–10 µg/mL DAPI (Sigma), diluted in W-B/15.
3. Methods3.1. Superovulation of Mice
Three days before the experiment, female mice are given 100 to 200 µL ofPMSG by intraperitoneal injection, approx 57 to 61 h before egg collection and44 to 48 h before the hCG injection. PMSG will stimulate maturation ovarianfollicles. The evening before the experiment, each mouse is given an injection100 to 200 µL of hCG. This hCG injection is done 44 to 48 h after injection ofPMSG and 12 to 13 h before the planned collection of eggs (see Note 7).
3.2. Egg Collection1. Prepare a 35-mm dish with five 35 µL drops of W-B/15 covered with warm
mineral oil.2. Sacrifice females with CO2 followed by cervical dislocation.3. Open the body cavity by making a U-shaped incision in the lower abdomen up to
the liver; push aside the skin flap and intestines to the side to gain access to thereproductive tract.
4. Remove the oviducts (just below the ovary) and place in a 200 to 300 µL of W-Hto rinse off blood and other fluid.

94 Wortzman, Gardner, and Evans
5. In a 60-mm culture dish, put a drop of W-H/HY for every two oviducts and twodrops of W-B for washing the eggs.
6. Transfer the oviducts to the W-H/HY drops and puncture the swollen ampullaregion (in which a “cloud” of eggs should be visible) with a 27-gage needle torelease the cumulus-encased eggs. The eggs can be gently pipetted through awide-bore pipet to help break up the complexes and give the hyaluronidase accessto the cumulus cells’ extracellular matrix. As the cumulus cells disperse from theeggs in the W-H/HY, transfer the cumulus cell-free eggs to a wash drop of W-B(see Note 8).
7. Wash the cumulus-free eggs through the second W-B drop and then a freshW-B/15 drop.
8. Transfer the eggs to the previously prepared 35-mm culture dish with five 35-µLdrops of W-B/15, covered with warm oil. Eggs should be cultured in W-B/15 at37°C, 5% CO2 until the next step.
3.3. Sperm Preparation (see Note 9)
1. Sacrifice one male mouse with CO2 followed by cervical dislocation. Clip awaythe skin/muscle layer of the lower abdomen in an inverted “U” shape; pull flap up.Gently clip the cauda epididymis and upper part (∼1 cm) of vas deferens freefrom surrounding tissue.
2. Add the two caudae epididymides to 250 µL of W-B/15 covered in warm mineraloil in a 35-mm Petri dish. Clean scissors and gently mince the tissue. Incubate thedrop at 37°C, 5% CO2 for 10 min to allow sperm to swim out into the medium.Remove the tissue from the sperm suspension. Gently draw up the 250-µL spermsuspension into a pipet and carefully transfer the sperm suspension to the bottom ofa 1.5 mL of W-B/15 in a 12 × 75-mm polystyrene culture tube. After 45 min,remove the top 440 µL from the tube and place this sperm suspension in a freshculture dish and cover with warm mineral oil (see Note 10).
3. To determine the concentration of sperm (sperm/milliliter), prepare a 110 dilu-tion of swim-up sperm in water and transfer 10 µL of this to a hemacytometer.Count the number of sperm in the 4 × 4 double-line-bordered square. Repeat fortwo other squares and average these values. To determine the number ofsperm/mL, multiply this average sperm count value by the dilution factor (whichis 10, for the 110 dilution in water) and also by 104 (a correction factor for thehemacytometer). This will give you the number of sperm per mL in the swim-upstock suspension (see Note 11).
3.4. Two Methods of ZP Removal From Eggs (see Note 12)
3.4.1. Acid Solubilization of the ZP
1. Set up a Petri dish with one drop of acidic MEMCO and several drops of W-B/15.2. Work in batches of 5 to 20 eggs, depending on skill level. Transfer ZP-intact eggs
to the drop of Acidic MEMCO and pipet the eggs up and down for approx 15 s,watching closely as the ZP dissolve.

Mammalian Sperm–Egg Membrane Interactions 95
3. As soon as the ZP have dissolved, wash the eggs by transferring them throughadjacent drops of W-B/15. Transfer ZP-free eggs to fresh drops of W-B/15 coveredin warm mineral oil; culture at 37°C, 5% CO2 in air for 60 min to allow eggs torecover from ZP removal.
3.4.2. Protease Treatment and Mechanical Removal of the ZP
1. Set up a Petri dish with one drop of 10 µg/mL chymotrypsin in W-B/3, one dropof 100 µg/mL chymotrypsin in W-B/3, three drops of W-B/3, and three drops ofW-B/15, covered in warm mineral oil. (Each drop can be ∼50–100 µL.)
2. Transfer eggs to the drop of 10 µg/mL chymotrypsin in W-B/3 at 37°C and checkfor ZP swelling after approx 2 min. If the ZP appears swollen, use a thin-bore pipetto shear off the ZP from the egg. If the ZP is not swollen, incubate an additionalapprox 2 min. If the ZP is not swollen after this second incubation, transfer to thedrop containing 100 µg/mL chymotrypsin in W-B/3 for approx 1 min (see Note 5).
3. After shearing off the ZP, immediately wash eggs through the W-B/3 drops thenthe W-B/15 drops.
3.5. Optional Additional Step: Labeling of Live SpermWith MitoTracker Green (see Note 13)
1. Collect epididymal sperm as described in Subheading 3.3. (sperm collection) andallow the sperm to capacitate for 2.5 to 3 h before use.
2. Approximately 15 min before the start of IVF, prepare the labeling solution for thesperm. Dilute the 1 mM MitoTracker Green stock to 200 nM with W-B/15 (i.e.,double the final working concentration of MitoTracker Green).
3. Dilute the 200 nM MitoTracker Green solution to the working concentration of100 nM by adding an equal volume of sperm to be labeled (see Note 14).
4. Incubate the sperm in the MitoTracker Green-containing medium for 10 min at37°C in a dark, humidified atmosphere of 5% CO2.
5. Dilute the labeled sperm to the desired concentration for IVF with W-B/15 (see Note 6).
3.6. Optional Supplement: Loading Live Eggs With DAPI (see Note 15)
1. Dilute DAPI in W-B/15 as noted in Subheading 2.11. (1–10 µg/mL final concen-tration). Prepare approx 25-µL drops of this medium and cover with warmmineral oil.
2. Approximately 25 min before the start of the insemination, transfer eggs to theW-B/15 containing DAPI and incubate for 15 min, then wash through 3 to 4 50- to 100-µL drops of W-B/15 before insemination (see Note 16).
3.7. IVF (see Notes 17 and 18)
1. Prepare a suspension of sperm at the desired concentration in W-B/15, typically25,000 to 100,000 sperm/mL (see Note 17). Make 10-µL drops of this spermsuspension and cover with warm mineral oil. (If you have 20 eggs per experi-mental group, make two 10-µL drops of sperm suspension.)

2. Add 10 eggs per 10-µL drop of sperm suspension. Co-culture the eggs withsperm in these insemination drops at 37°C, 5% CO2 in air for desired length oftime (see Note 17).
3. To remove loosely attached sperm from the eggs, wash the eggs using a pipetapprox 1.5X the diameter of the eggs. Transfer the eggs to the top of an approx75-µL drop of W-B/15, blowing gently (as if blowing a whistle quietly); allow theeggs to settle to the bottom. Repeat two more times (see Notes 19 and 20).
4. To prepare the eggs for viewing on a fluorescent microscope to assess sperm–egg interactions, fix the eggs in 3.7% to 4.0% paraformaldehyde in PBS for 15 to 60 min. Fixed eggs are then permeabilized in PBS containing 0.05% TritonX-100 (3–15 min), washed briefly in PBS two to three times, and then mounted inmounting medium (e.g., VectaShield, Vector Laboratories) containing 1.5 µg/mLDAPI to stain the DNA in the eggs and sperm. Eggs also can be viewed live(particularly if DAPI-loaded eggs were used to assess sperm–egg fusion).
4. Notes1. The culture medium should be prepared using glassware designated only for
media preparation. Do not use metal spatulas to weigh out the dry reagents. W-Hand W-B can be prepared together. To prepare 500 mL of each, add all the ingre-dients up to the phenol red and bring up the volume to 900 mL; then divide intotwo batches of 450 mL and add the remaining reagents for either W-H or W-B.
2. We have had good success with Whitten’s medium for IVF. There are also com-mercially available media for IVF (e.g., Human Tubal Fluid), although makingyour own Whitten’s medium is more economical. W-H medium is used for collec-tion and other work in regular atmosphere, whereas W-B medium, containingbicarbonate only (no HEPES), is used for culture in 5% CO2. Care should betaken to maintain appropriate pH of the W-B medium, as shifts in the pH mayaffect the health of eggs and sperm and fertilization success.
3. The addition of BSA or PVA keeps eggs from sticking to the culture dish. Ifmaking W-B with 0.1% PVA, it is likely that not quite all the PVA will go intosolution; it is recommended that the medium be filtered before use.
4. Pipet pulling is a process of trial and error; you pull a couple dozen pipets, andthen check them once you are at the dissecting microscope working with the eggs.The size of the pipet opening will vary, but a standard size for moving eggs willhave a diameter slightly larger than the egg. It is advisable to have separate pipetsfor separate experimental groups (e.g., a control antibody and an experimentalantibody), to avoid contamination between groups.
5. The times stated are approximate, but it is recommended that the eggs not beincubated for an extended period of time with chymotrypsin. As noted in Note 9,with the chymotrypsin treatment some eggs may never undergo ZP swelling; theseeggs should be discarded.
6. Because the concentration of MitoTracker Green in the medium needs to be dilutedbefore fertilization to reduce levels of background staining (i.e., dye uptake by themitochondria of the eggs), label a sperm concentration that is about five fold higher
96 Wortzman, Gardner, and Evans

Mammalian Sperm–Egg Membrane Interactions 97
than what will be used for insemination. Immediately before IVF, dilute the spermto the desired concentration with W-B/15. See Fig. 3 for images of MitoTracker-labeled sperm fertilizing an egg.
7. The number of female mice used will depend on the planned scope of an experi-ment. It is preferable to have 20 to 30 eggs per experimental group for a given day’sexperiment (with a given experimental series being repeated at least three times).Average egg yield is approx 20 eggs per mouse but can vary widely. Healthy eggsare round with clear cytoplasm; the first polar body (the product of the first meioticdivision) may or may not be present. Discard eggs that have a brown, granularcytoplasm, eggs that are fragmented, eggs that still have a germinal vesicle, oreggs that have extruded a second polar body. Eggs should be collected at approx12 to 13 h after hCG injection for best quality and egg health (9).
8. Cumulus cells are somatic cells that are derived from the ovarian follicle. Cumu-lus cell detachment from the eggs happens somewhat asynchronously; some eggsare clean in approx 1 min and some require 5 min. Pipetting through a wide-borepipet can facilitate cumulus removal and exposure of the hyaluronic acid (the extra-cellular matrix in which the cumulus cells are embedded) to the hyalurdonidase.Transfer an egg to W-B as soon as it is cumulus cell-free. Try to minimize thetime the eggs are in hyaluronidase (excessive exposure to hyaluronidase has beenassociated with spontaneous egg activation). It is not necessary to remove 100% ofthe cumulus cells, as a few residual cumulus cells will detach with ZP removal.
9. Sperm must undergo a maturational change known as capacitation in order to beable to fertilize eggs. Capacitation occurs in vitro in the appropriate culture medium(such as Whitten’s medium) containing energy substrates, a cholesterol acceptor(e.g., BSA), NaHCO3, Ca2+, and low K+ and physiological Na+ concentrations (10).During capacitation, a subset of sperm will undergo spontaneous acrosomeexocytosis; this is crucial for fertilization of ZP-free eggs as only acrosome-reacted
Fig. 3. Fluorescent images of an egg inseminated with unlabeled and MitoTrackerGreen-labeled sperm. (A) Phase contrast image with asterisks indicating the location oftwo sperm tails. (B) Fluorescent image showing DAPI staining of the egg DNA, polarbody DNA (PB), and two sperm nuclei. (C) Image photographed with the FITC filter,to show MitoTracker Green staining. This image shows that one of the two sperm thatfertilized the egg was labeled with MitoTracker Green.

98 Wortzman, Gardner, and Evans
Fig. 4. DAPI-stained eggs, showing morphology of egg DNA and sperm DNA atdifferent stages of fertilization. Dotted lines show the approximate outline of the egg;mouse eggs are approx 80 µm in diameter. (A) Unfertilized metaphase II egg, witha side view of the chromosomes on the metaphase plate. White lines indicate thedirections of the microtubules holding the chromosomes in place. (B) Unfertilizedmetaphase II egg, with an en face view of the chromosomes on the metaphase plate.Microtubules of the meiotic spindle are extending backward and forward from the

sperm are capable of binding and fusing with the egg plasma membrane (11). It isadvisable to allow 2.5 to 3 h of capacitation time for these IVF experiments. There-fore, this is a key factor when planning the timing of sperm collection.
10. The “swim-up” preparation for sperm selects for the most motile sperm and reducesthe risk of including any dead or immotile sperm in the preparation. A typical spermconcentration for the sperm swim-up preparation is 1–5 × 10⁶ sperm/mL.
11. For example, if you counted 20, 19, and 30 sperm in three separate squares on thehemacytometer, the calculation would be to determine the sperm concentrationwould be:
(20 + 19 + 30)/3 × 10 × 104 = 2.3 × 10⁶ sperm/mL
Please note that it is important to prepare the sperm dilution in water (notmedium) so that the sperm stop swimming to facilitate counting.
12. There are two commonly used methods for ZP removal: low pH to solubilize theZP and chymotrypsin treatment to induce ZP swelling and thus facilitate mechan-ical removal. (It is possible to remove the ZP by mechanical manipulation alone,but this is extremely difficult and often results in low yields of ZP-free eggs becauseso many eggs lyse during the procedure.) We primarily use the acid solubilizationmethod, although there are advantages and disadvantages to each method. Thechymotrypsin-mechanical method has the disadvantage of resulting in lower yieldsof eggs than the acid solubilization method, as some ZP will never swell suffi-ciently for removal. The exposure of surface proteins to a protease like chy-motrypsin can also be disadvantageous, although the exposure of surface moleculesto low pH has the potential to alter them (we have observed the reversible modifi-cation of one monoclonal antibody epitope on eggs exposed to low pH [12]).
13. MitoTracker Green-labeling of sperm can be useful for a variety of experimentaldesigns. We have used labeled sperm to inseminate early zygotes, that is, eggsthat have been previously fertilized. Sperm labeling also can be used to distinguishbetween two different experimental groups, such as control versus drug-treated orwild-type versus knockout.
14. The MitoTracker Green signal will fade if left exposed to light for a prolongedperiod of time. Protect MitoTracker aliquots and labeled sperm suspensions from
Mammalian Sperm–Egg Membrane Interactions 99
Fig. 4. (continued) plane of the image. (C) An egg with a bound sperm, with insetshowing a close-up of the sperm DNA. (The egg DNA is out of the plane of focus.)(D) An egg with a recently fused sperm, with inset showing a close-up of the spermDNA. (The egg DNA is out of the plane of focus.) Note the difference in appearance(slight flaring) at the posterior end of the sperm nucleus as compared to the bound spermin (C). (E) Eggs with sperm at a later stage of decondensation, with inset showing aclose-up of the sperm DNA. (The egg DNA is out of the plane of focus.) The flare at theposterior region of the sperm nucleus has become more pronounced. (F) An egg with twofused sperm. The egg has exited from metaphase II arrest and is progressing in toanaphase (labeled “ana”). The sperm heads are marked with an asterisk and an arrow-head; the one marked with the arrowhead is somewhat beyond the plane of focus.

light and view labeled sperm by fluorescence microscopy as soon as possible(preferably on the same day the experiment is performed).
15. Labeling of eggs with DAPI (or Hoechst [13]) allows for the detection ofsperm–egg fusion by observing the transfer of the DNA-staining dye from the eggcytoplasm to the sperm nucleus once the sperm has fused with the egg.Alternatively, sperm-egg fusion can be detected simply by staining the fertilizedeggs with a DNA-specific dye, as sperm head morphology changes upon sperm-egg fusion and with the initiation of sperm nucleus decondensation. This methodis easier, although recognizing the earliest stages of sperm decondensation requiressome practice; stages of sperm nucleus decondensation are illustrated in Fig. 4.
16. It is important to wash the eggs thoroughly so that no DAPI is left in the culturemedium to stain the sperm.
17. Insemination conditions are selected based on the fertilization end point of interest,the desired rate of fertilization for control eggs, and the tolerance for polyspermy. A15-min insemination protocol has been used to assess sperm–egg adhesion beforeany decreases in egg membrane receptivity to sperm that can occur approx 60 minafter fertilization (14–16). Inseminations of 45 to 60 min routinely are used to exam-ine sperm–egg adhesion and fusion. Typical sperm concentrations used to inseminateZP-free eggs are in the range of 10,000 to 250,000 sperm/mL. In our experience(with eggs from CF-1 females and sperm from CD-1 males), a 60 min inseminationwith 25,000 sperm/mL (i.e., a spermegg ratio of 251) will result in 70 to 80% ofthe egg fertilized with low levels of polyspermy. A 60-min insemination with100,000 sperm/mL (i.e., a spermegg ratio of 1001) will result in 90 to 100% of theeggs fertilized with 10 to 50% of the eggs being polyspermic (fertilized by morethan one sperm). The emission of the second polar body, indicative of exit of the eggfrom meiotic arrest, will be apparent at approx 60 to 90 min after insemination.
18. Experimental manipulations of sperm or eggs can be performed at several points inthis protocol. The gametes can be pretreated with antibodies to surface moleculesor with pharmacological reagents before and/or during insemination (Fig. 1). If adrug has reversible effects, then it must be present during the insemination; thisthen should be taken into account when interpreting results, as both the eggs andsperm would have been exposed during this time period.
19. It is critical that these washes are kept consistent between experimental groups foraccurate assessment of sperm adhesion to the egg membrane. All washes of allexperimental groups should be performed by the same person using the samepipet, preferably by an individual who does not know which experimental groupis which to avoid bias.
20. For experiments in which is it desired to aggressively remove the majority of boundsperm, eggs can be washed more forcefully in W-B containing 0.05% PVA.
AcknowledgmentResearch in our laboratory is supported by the National Institute of Child
Health and Human Development and by the March of Dimes.
100 Wortzman, Gardner, and Evans

Mammalian Sperm–Egg Membrane Interactions 101
References1. Evans, J. P. and Florman, H. M. (2002) The state of the union: the cell biology of
fertilization. Nat. Cell Biol. 4(Suppl.), s57–s63.2. Primakoff, P. and Myles, D. G. (2002) Penetration, adhesion, and fusion in mam-
malian sperm-egg interaction. Science 296, 2183–2185.3. Runft, L. L., Jaffe, L. A., and Mehlmann, L. M. (2002) Egg activation at fertilization:
where it all begins. Dev. Biol. 245, 237–254.4. Yanagimachi, R. (1988) Sperm-egg fusion. Curr. Top. Memb. Transport. 32, 3–43.5. Primakoff, P. and Hyatt, H. (1986) An antisperm monoclonal antibody inhibits
sperm fusion with zona-free hamster eggs but not homologous eggs. Fertil. Steril.46, 489–493.
6. Evans, J. P. (1999) Sperm disintegrins, egg integrins, and other cell adhesionmolecules of mammalian gamete plasma membrane interactions. Front. Biosci. 4,D114–D131.
7. Whitten, W. K. (1971) Nutrient requirements for the culture of preimplantationembryos in vitro. Adv. Bio. Sci. 6, 129–139.
8. Evans, J. P., Schultz, R. M., and Kopf, G. S. (1995) Identification and localization ofintegrin subunits in oocytes and eggs of the mouse. Mol. Reprod. Dev. 40, 211–220.
9. Xu, Z., Abbott, A., Kopf, G. S., Schultz, R. M., and Ducibella, T. (1997) Sponta-neous activation of ovulated mouse eggs: time-dependent effects on M-phase exit,cortical granule exocytosis, maternal messenger ribonucleic acid recruitment, andinositol 1,4,5-trisphosphate sensitivity. Biol. Reprod. 57, 743–750.
10. Visconti, P. E., Westbrook, V. A., Chertihin, O., Demarco, I., Sleight, S., andDiekman, A. B. (2002) Novel signaling pathways involved in sperm acquisition offertilizing capacity. J. Reprod. Immunol. 53, 133–150.
11. Yanagimachi, R. (1994) Mammalian fertilization, in The Physiology of Reproduc-tion, 2nd ed. (Knobil, E. and Neill, J. D., eds.), Raven Press, Ltd., New York,pp. 189–317.
12. Evans, J. P., Kopf, G. S., and Schultz, R. M. (1997) Characterization of the bind-ing of recombinant mouse sperm fertilin β subunit to mouse eggs: Evidence foradhesive activity via an egg β1 integrin-mediated interaction. Dev. Biol. 187, 79–93.
13. Conover, J. C. and Gwatkin, R. B. L. (1988) Pre-loading of mouse oocytes withDNA-specific fluorochrome (Hoechst 33342) permits rapid detection of spermoocyte-fusion. J. Reprod. Fert. 82, 681–690.
14. Redkar, A. A. and Olds-Clarke, P. J. (1999) An improved mouse sperm-oocyteplasmalemma binding assay: Studies on characteristics of sperm binding inmedium with or without glucose. J. Androl. 20, 500–508.
15. Zhu, X., Bansal, N. P., and Evans, J. P. (2000) Identification of key functionalamino acids of the mouse fertilin β (ADAM2) disintegrin loop for cell-cell adhe-sion during fertilization. J. Biol. Chem. 275, 7677–7683.
16. McAvey, B. A., Wortzman, G. B., Williams, C. J., and Evans, J. P. (2002) Involve-ment of calcium signaling and the actin cytoskeleton in the membrane block topolyspermy in mouse eggs. Biol. Reprod. 67, 1342–1352.


103
8
Collagen Gel Contraction Assay
Peter Ngo, Punitha Ramalingam, Jonathan A. Phillips, and Glenn T. Furuta
SummaryMucosal tissues undergo contraction and relaxation on a continuous basis. In its normal
state, the pliable intestinal tract is characterized by a rhythmic pattern of contractions controlledby its intrinsic neuronal innvervation. In chronic inflammatory diseases such as Crohn’s disease,the intestine can become stiff and fibrotic, losing much of its normal motility. Although musclefiber contraction accounts for much of this activity, contraction of nonmuscle tissue is con-stantly occurring in events associated with chronic inflammation, such as wound healing, scarformation, and tissue remodeling. However, the physiological and pathological mechanismsdefining these events are not well defined. Tissue contraction is a dynamic event characterizedby both intracellular and extracellular events. A number of cells, such as fibroblasts, epithelialcells, lymphocytes, and eosinophils, normally reside within the gastrointestinal tract. Addition-ally, the extracellular matrix is composed of a complex infrastructure that includes collagenand other molecules. The manner in which these two components interact is not certain, but theuse of recent model systems has provided insights into these processes. The collagen latticecontraction assay provides a model for tissue contraction that takes advantage of the finding thatcell-populated collagen hydrogels contract over time in a predictable, consistent manner. Thismodel allows for investigation of the influence of specific agonists on the rate and extent ofmatrix contraction.
Key Words: Contraction; collagen hydrogel; collagen lattice; collagen gel.
1. IntroductionMucosal tissues are composed of several molecular and cellular components.
Extracellular matrices can be remodeled by resident cells, such as fibroblasts, toform scar tissue and to contract. In vitro models of tissue wound healing,remodeling, and contraction offer investigators a highly controlled and flexibleenvironment to study the influences of a variety of factors contributing to matrixcontraction. Because collagen is the principle extracellular matrix molecule
From: Methods in Molecular Biology, vol. 341: Cell−Cell Interactions: Methods and ProtocolsEdited by: S. P. Colgan © Humana Press Inc., Totowa, NJ
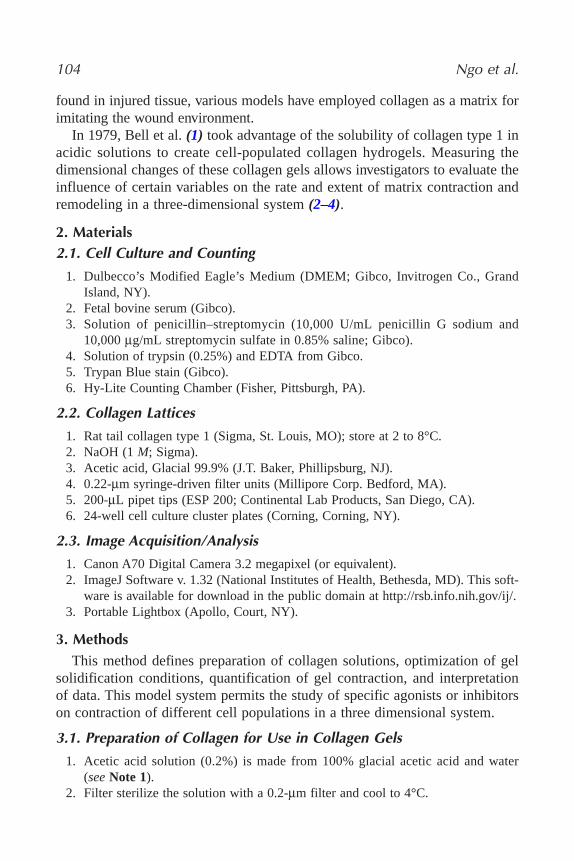
found in injured tissue, various models have employed collagen as a matrix forimitating the wound environment.
In 1979, Bell et al. (1) took advantage of the solubility of collagen type 1 inacidic solutions to create cell-populated collagen hydrogels. Measuring thedimensional changes of these collagen gels allows investigators to evaluate theinfluence of certain variables on the rate and extent of matrix contraction andremodeling in a three-dimensional system (2–4).
2. Materials2.1. Cell Culture and Counting
1. Dulbecco’s Modified Eagle’s Medium (DMEM; Gibco, Invitrogen Co., GrandIsland, NY).
2. Fetal bovine serum (Gibco).3. Solution of penicillin–streptomycin (10,000 U/mL penicillin G sodium and
10,000 µg/mL streptomycin sulfate in 0.85% saline; Gibco).4. Solution of trypsin (0.25%) and EDTA from Gibco.5. Trypan Blue stain (Gibco).6. Hy-Lite Counting Chamber (Fisher, Pittsburgh, PA).
2.2. Collagen Lattices
1. Rat tail collagen type 1 (Sigma, St. Louis, MO); store at 2 to 8°C.2. NaOH (1 M; Sigma).3. Acetic acid, Glacial 99.9% (J.T. Baker, Phillipsburg, NJ).4. 0.22-µm syringe-driven filter units (Millipore Corp. Bedford, MA).5. 200-µL pipet tips (ESP 200; Continental Lab Products, San Diego, CA).6. 24-well cell culture cluster plates (Corning, Corning, NY).
2.3. Image Acquisition/Analysis
1. Canon A70 Digital Camera 3.2 megapixel (or equivalent).2. ImageJ Software v. 1.32 (National Institutes of Health, Bethesda, MD). This soft-
ware is available for download in the public domain at http://rsb.info.nih.gov/ij/.3. Portable Lightbox (Apollo, Court, NY).
3. MethodsThis method defines preparation of collagen solutions, optimization of gel
solidification conditions, quantification of gel contraction, and interpretationof data. This model system permits the study of specific agonists or inhibitorson contraction of different cell populations in a three dimensional system.
3.1. Preparation of Collagen for Use in Collagen Gels
1. Acetic acid solution (0.2%) is made from 100% glacial acetic acid and water(see Note 1).
2. Filter sterilize the solution with a 0.2-µm filter and cool to 4°C.
104 Ngo et al.

3. Type 1 collagen is mixed with 0.2% acetic acid solution under sterile conditionsto make 6 mg/mL of collagen solution (100 mg collagen dissolved into 16.7 mLacetic acid solution in 50-mL conical tube).
4. Gently agitate the collagen solution at 4°C. This process takes 2 to 5 d and collagenmust be completely in solution before proceeding (see Note 2).
5. After the collagen is entirely dissolved into solution, dilute with equal volume offilter-sterilized water to make a 3 mg/mL collagen solution in 0.1% acetic acid.
6. Equilibrate with gentle shaking at 4°C for 1 d.7. Collagen solution should be stored at 4°C.
3.2. NaOH Titration of Collagen
Perform this assay whenever using a new batch of collagen to optimizesolidification. After identifying the optimal amount of NaOH to add to the collagen/media mixture, use the same quantity for all subsequent gels.
1. Use eight clear-colored 1.6-mL Eppendorf tubes for pH titration of gels.2. Add 0.4 mL of cell specific media or DMEM to each Eppendorf.3. Add 0.2 mL of collagen solution (3 mg/mL in 0.1% acetic acid) to one tube con-
taining media. Immediately add 1 µL of 1 M NaOH and pipet mixture up anddown three times with 1-mL pipet. DO NOT DELAY (see Note 3).
4. Repeat the above step with increasing amounts of 1 M NaOH solution (1–8 µL)to determine the amount of NaOH needed to produce a well-solidified gel withneutral pH (see Note 4).
5. Allow the mixture to solidify for 20 min. The final collagen concentration shouldbe 1 mg/mL. Compare rigidity and color of gels titrated with different volumes ofNaOH to determine which volume of NaOH produces a well-solidified gel withneutral pH. The least amount of NaOH needed to turn the phenol red media indi-cator a light pink color will produce the most rigid collagen gels.
3.3. Preparing Cells Before Suspension in Collagen Gels
Populating collagen gels with cells requires careful attention to cell concen-trations. Determining optimal cell concentration requires performance of a cellconcentration curve. Below is a protocol that provides uniform distribution for a final population of 1 × 10⁵ cells/mL of Caco2 epithelial cells. During this portion of the procedure cells can be resuspended in media containing agonist/antagonists to determine effects on collagen gel contraction.
1. A confluent layer of Caco2 cells should be detached from the culture vessel usingwarmed Trypsin-EDTA solution (0.25% trypsin + EDTA-4Na in Hank’s BalancedSalts Solution; see Note 5).
2. Suspend cells into complete culture media (∼10mL media per 75-cm2 vessel).DMEM with 10% fetal calf serum and 1% penicillin–streptomycin was used forCaco2 cells (see Note 6).
3. Count cells using Trypan Blue stain and counting chamber.
Collagen Gel Contraction Assay 105

4. Centrifuge the remaining cell suspension at 500g for 10 min.5. Remove supernatant and add fresh warm culture media (± experimental variable)
to achieve a concentration of 1.5 × 10⁵ cells/mL (see Note 7). Cells should beresuspended at 1.5 times the final desired cell concentration as cells are furtherdiluted with addition of collagen solution.
6. Mix cells gently into suspension.
3.4. Pouring Cell Populated 1 mg/mL Collagen Gels
Creating consistent, homogeneous, cell populated collagen gels requirespractice. Because of the rapid solidification of the collagen gels, it is importantto calculate the necessary volumes of all reagents and ensure that adequatequantities are readily available before starting the protocol. The following is aprotocol using 24-well plates as molds for 500-µL collagen gels.
1. Collagen gels should be prepared under sterile conditions.2. Add 0.66 volumes of well-mixed cell suspension (± experimental variable) to a
sterile tube.3. Add 0.33 volumes of 3 mg/mL collagen solution to the cell suspension (see Note 8).4. Quickly add the appropriate volume of 1 M NaOH (see Subheading 3.2.) and
mix the solution up and down three times. 5. Immediately transfer 500 µL of the mixture to a 1.9-cm2 well (see Note 9).6. Allow gels to solidify, covered at room temperature for 20 min.7. Gently add a minimum of an equal volume (500 µL) of culture media (± experi-
mental variable) to each well.8. Dissociate the gel from its mold by gently running the tip of a 200-µL pipet tip
along gel edges being careful not to shear or tear gels.9. Resuspend gels by gently pulling the edges of the gel away from the mold using
the pipet tip (see Note 10). Gently swirl plate to make sure that gel is free fromthe plate.
10. Replace 24-well plate into incubator at 37°C, humidified 5% CO2.
3.5. Documenting Contraction
Contraction occurs in a time dependent manner. The rate and degree of con-traction depends on the cell type and concentration, and the presence of anycontraction agonists or inhibitors in the media. The concentration of serum inthe media also affects contraction. Figure 1 illustrates contraction of Caco2populated collagen gels at 24 h.
1. At predetermined time-points, remove the 24-well plate from the incubator forimage acquisition (see Note 11).
2. Place the 24-well plate on top of a lightbox.3. Using a digital camera at a fixed distance above the gels, obtain an image at each
of the time-points (see Note 12).4. Return the gels to the incubator.
106 Ngo et al.

3.6. Interpretation of Data
The degree and rate of contraction of gels exposed to various conditions canbe evaluated by calculating the gel surface area from acquired images. To stan-dardize comparison, results can be reported as a percent of initial surface areafor each given time point. Figure 2 shows results at 24 h from a collagen gelcontraction assay with 3T3 fibroblast cell concentration curve. Increasing cellconcentrations result in increased collagen lattice contraction.
1. Images can be analyzed with National Institutes of Health ImageJ software.2. Trace the outline of each collagen gel and calculate the surface area according to
ImageJ software instructions (see Note 13).3. Report the surface area at each time point as a percentage of initial gel surface
area.
4. Notes1. Unless stated otherwise, all solutions should be prepared in water that has resis-
tivity of 18.2 MΩ-cm and total organic content of less than five parts per billion.This standard is referred to as “water” in this text.
2. Gentle agitation with a shaker may be used to aid in dissolving collagen, butforceful agitation or repeated inversion may disassociate collagen fibrils, leadingto poorly solidifying gels.
3. A collagen lattice will begin to form immediately when collagen, media, and NaOHare mixed together. Reagents and equipment (NaOH, collagen solution, and 1-mL
Collagen Gel Contraction Assay 107
Fig. 1. Photograph of collagen gels taken at 24 h. The top two wells contain acellu-lar collagen gels showing no contraction. The bottom two wells contain Caco2-populatedgels displaying uniform, symmetric contraction.

pipet set to 500 µL of volume) should be readily available for immediate use.Repeated pipetting or agitation after the gel has begun to solidify will shear collagenand produce a poorly solidified gel.
4. After mixing, gels should be a homogeneous color. A nonhomogeneous gel indi-cates inadequate mixing.
5. Trypsin not only aids in lifting cells from culture vessels but also breaks up aggre-gates of cells to produce a more even distribution of cells within gels.
6. Contraction of collagen gels is dependent on the presence of serum in media andgels. Gel contraction increases in a concentration dependent manner with increas-ing serum so consistent serum concentrations should be used for all conditionswithin a particular assay (4). Media containing 10% fetal bovine serum yieldsconsistent results.
7. This step allows resuspension of cells at desired concentrations. In addition, cellscan be resuspended in solutions containing contraction agonists or inhibitors. Thisstep should be performed for all cell populations as it also removes trypsin fromthe suspension which may interfere with collagen gel contraction.
8. When making each 500-µL collagen gel, it is adviseable to mix 400 µL of cell sus-pension and 200 µL of collagen solution; the additional volume allows for easiertransfer of mixtures into molds without incorporating bubbles in gels. Multiples ofthese volumes can be used to create experimental replicates.
108 Ngo et al.
Fig. 2. Results from 3T3 fibroblast collagen gel contraction assay with 3T3 cellconcentration curve. Increasing 3T3 concentrations result in increased collagen gelcontraction. Results represent means ± standard deviation of mean of four lattices.

9. Be careful not to introduce bubbles into the mixture as these will solidify in thegel. For replicates, a 5-mL stripette works well to both mix and quickly dispense500-µL of mixture into each well. Drawing up more than the needed volume intothe stripette will prevent air bubbles from incorporating into the last poured gel.
10. All gels should be freed from well walls in the same manner. Running the pipettip around edges of detached gels should cause the gel to turn easily within thewell, confirming that it is not adherent to the well bottom.
11. Depending on the rate and degree of contraction with each specific cell type andconcentration, photographs should be obtained at different time points, that is,0, 6, 12, 24, and 48 h after gels are poured typically yields an adequate initialtime course.
12. Using a Canon Powershot A70 3.2 megapixel digital camera, a distance of 40 cmwith 3X optical zoom yields good quality images of the 24-well plate and colla-gen gels. It is best to obtain several photos at each time point to ensure an imagewith good resolution is obtained. With increasing cell concentrations and withincreasing contraction the gel edge is easier to visualize allowing for easier analy-sis of contraction. Alternatively, a flatbed digital scanner can be used to obtainimages for analysis.
13. Adjusting the contrast or brightness of each image prior to analysis with ImageJsoftware may allow easier surface area calculation. To increase accuracy in outlin-ing gels, images can be magnified using ImageJ software without affecting surfacearea calculations. The outline of wells in the 24-well plate provides an optimal ref-erence for initial surface area of each gel.
References1. Bell, E., Ivarsson, B., and Merrill, C. (1979) Production of a tissue-like structure
by contraction of collagen lattices by human fibroblasts of different proliferativepotential in vitro. Proc. Natl. Acad. Sci. USA 76, 1274–1278.
2. Levi-Schaffer, F., Garbuzenko, E., Rubin, A., et al. (1999) Human eosinophilsregulate human lung- and skin-derived fibroblast properties in vitro: a role fortransforming growth factor beta (TGF-beta). Proc. Natl. Acad. Sci. USA 96,9660–9665.
3. Zagai, U., Skold, C. M., Trulson, A., Venge, P., and Lundahl, J. (2004) The effectof eosinophils on collagen gel contraction and implications for tissue remodel-ling. Clin. Exp. Immunol. 135, 427–433.
4. Gillery, P., Maquart, F. X., and Borel, J. P. (1986) Fibronectin dependence of thecontraction of collagen lattices by human skin fibroblasts. Exp. Cell Res. 167,29–37.
Collagen Gel Contraction Assay 109


111
9
Methods to Assess Tissue Permeability
Juan C. Ibla and Joseph Khoury
SummaryAn essential requirement for adequate organ performance is the formation of permeability
barriers that separate and maintain compartments of distinctive structure. The endothelial cell liningof the vasculature defines a semipermeable barrier between the blood and the interstitial spaces ofall organs. Disruption of the endothelial cell barrier can result in increased permeability and vascu-lar leak. These effects are associated with multiple systemic disease states. The mechanisms thatcontrol barrier function are complex and their full understanding requires a multidisciplinaryapproach. In vivo permeability data often complement molecular findings and add power to thestudies. The interaction of multiple cell types and tissues present only on mammalian models allowfor testing of hypothesis and to establish the physiological significance of the results. In this chap-ter, we describe methods that can be used systematically to measure the permeability characteris-tics of several organs.
Key Words: Permeability assay; vasculature; edema; inflammation; Evan’s blue; fluorescence;bioparticles; water content; wet/dry ratio.
1. IntroductionMucosal surfaces provide a physical barrier between the environment and
the internal layers of many organs. The dual role of maintaining close contact,yet separated biological compartments requires multiple interactions betweenendothelia, epithelia, and trans-membrane adhesion domains. This highlyadapted cellular hierarchy denotes a specific anatomical location within anorgan (e.g., polarized epithelia) and assigns individual cell types vital tasks fororgan function. The endothelial lining of all organs is charged to interact withthe systemic circulation, transduce soluble messages, and control regional bloodflow and organ development (1,2). Insight into the mechanisms that regulatethese natural barriers is necessary for the understanding or normal physiologyand disease progression. It is well established that abnormal barrier function is
From: Methods in Molecular Biology, vol. 341: Cell−Cell Interactions: Methods and ProtocolsEdited by: S. P. Colgan © Humana Press Inc., Totowa, NJ

present in a multitude of disease states and that available methods can be usedto estimate the severity of diseases and response to treatment (3). Severalmethods have been developed to study endothelial permeability in the vascula-ture, both in vivo and in vitro (4). These include blood clearance and diffusionmethods that can be performed both invasively and noninvasively in animaland human subjects (5). Experimentally, tissue permeability methods can beaccomplished with equipment available in standard laboratory settings and theresults obtained are easy to interpret and highly reproducible.
2. Materials2.1. Miles Assay for Vascular Permeability
1. Mice.2. Phosphate-buffered saline (PBS; Gibco BRL, Invitrogen, Carlsbad, CA).3. Evan’s blue (Sigma, St. Louis, MO).4. Ligand, cytokine, growth factor, or condition being tested.5. Syringe with needles.6. Surgical dissecting equipment.7. Photographic equipment.8. Formamide (Sigma).9. Water bath at 55°C.
10. Spectrophotometer at 450 nm and 590 to 620 nm (SpecraMax 250, MolecularDevices, Sunnyvale, CA).
11. 96-well plate or cuvette for spectrophotometer (Corning Costar, Acton, MA).
2.2. Fluorescent-Labeled Molecules
1. Mice.2. PBS.3. Fluorescein isothiocyanate (FITC)–dextran, molecular weight 4 to 40 kDa (Sigma),
or fluorescent-labeled microspheres (Molecular Probes, Eugene, OR).4. 1-mL syringe and 23-gage needles.5. 1.5-mL microcentrifuge tubes (Eppendorf, Westbury, NY).6. Fluorescent plate reader (Cytofluor 2300, Millipore, Framingham, MA).7. Fluorescent microscope (Olympus, B.H2, Melville, NY).8. Plates for fluorescence (Corning Costar).
2.3. Labeled Bioparticles
1. Fluorescent bacteria commercially labeled with flourescein, Alexa.2. Fluor (488/594) and Texas Red dye among others (Molecular Probes).3. Sterile PBS or normal saline.4. 2 mM sodium azide (Sigma).5. Vortex (Bio-Rad, Hercules, CA).6. Hemocytometer (Fisher Scientific, Pittsburgh, PA).
112 Ibla and Khoury

7. Microscope (Olympus BH2).8. Mice.
2.4. Water Content in Tissues
1. Microcentrifuge tubes (Eppendorf).2. High-fidelity electronic balance (Mettler-Toledo, P.M 400, Columbus, OH).3. Speed-Vac (Vaccufuge, Eppendorf).4. Tissue.
3. Methods3.1. Miles Assay for Vascular Permeability
The classical method in which vascular permeability can be measured invivo is by the Miles Assay for Vascular Permeability, also known as the Evan’sblue dye method (6). Evan’s blue is a marker that specifically binds to albumin,allowing for a quantification of vascular leakage into the extravascular tissues.The accumulated dye can be quantified by the use of a spectrophotometer.Results are often evident at the macroscopic level, as depicted in Fig. 1.
Fig. 1. Photographs representing normal and increased vascular permeability in mice.C57Bl6 male mice were injected with 0.2 mL of Evan’s blue via tail vein. Animalswere then subjected to 4 h of normobaric hypoxia (8% O2, 92% N2) or room air condi-tions. Postmortem macroscopic examination of intra-abdominal viscera displayedsignificant differences between experimental and control groups. (Please see color insertfollowing p. 50 for a color version of this figure.)

1. Reconstitute, Evan’s blue to a final concentration of 0.5% in PBS.2. 0.2 mL of Evan’s blue is administered by tail vein injection per mouse.3. The stimulation of choice is then administered with a subset of mice not receiving
the stimulation as controls.4. The mice are then sacrificed. 5. Dissection of the organs of interest are performed and photographed as necessary.6. Evan’s blue concentration is quantified by eluting 50 mg of individual organs in
0.5 mL of formamide at 55°C from 2 h to overnight.7. Aliquots of the eluted dye are then measured by absorbance at 610 nm with sub-
traction of reference absorbance at 450 nm.
3.2. Fluorescent-Labeled Molecules
Fluorescent dyes are linked to either dextran or polysterene microspheresthat could be used as tracers for permeability. These tracers may then be visual-ized either directly in vivo by aid of intravital microscopy or in tissue sections.Several dyes and molecule sizes may be used to assay both epithelial andendothelial permeability. Although the initial method employed by, Rudolphand Heymann (7) used radiolabeled microspheres, growing concerns over envi-ronmental and health issues as well as cost of handling, disposal and half-lifeof the radiolabel have brought to the development of nonisotope fluorescent orcolored molecules. The method we describe here uses FITC–dextran (8), butit may easily be adapted for various fluorescent-labeled microspheres (seeNote 1).
1. Reconstitute FITC–dextran in, P.BS to a concentration of 80 mg/mL.2. Administer FITC–dextran to each animal 60 mg/100 g body weight (see Note 2).3. Expose animals to condition of interest for appropriate amount of time (2–6 h).4. Collect whole blood by cardiac puncture in anesthetized animals using the syringe
and needle.5. Transfer blood to a microcentrifuge tube, let sit on ice for 1 h, spin at 77,000g for
5 min, and collect supernatant (serum).6. On a fluorescence plate, make serial dilutions of FITC–dextran in PBS (range
from 10 to 0.015 µg/mL), to unknown wells, add 60 µL 13 diluted serum inPBS per well (triplicate).
7. Read plate at excitation wavelength 485 nm and emission 530 nm.8. Measurements are recorded as nanograms of FITC–dextran per microliter of
serum.
3.3. Labeled Bioparticles
The dynamic interaction of cellular components within a tissue can beanalyzed in vivo by the kinetics of labeled bioparticles during exposure to crit-ical physiological conditions. This technique utilizes a series of fluorescentlabeled, heat or chemically killed bacteria of a variety of sizes and antigenic
114 Ibla and Khoury

characteristics. These methods have been employed to study a diverse group ofparameters including epithelial permeability, phagocytosis and opsonization.Results can be obtained by fluorescent microscopy, quantitative spectropho-tometry and flow cytometry (9,10). We have used these methods to study bac-terial translocation in transgenic mice exposed to mucosal barrier disruptiveconditions (hypoxia).
1. Reconstitute labeled bacteria (100 mg, 3 × 10⁸ Escherichia coli) to 20 mg/mL insterile PBS or normal saline (see Note 3).
2. Add 2 mM sodium azide to bacterial suspension and store at 4°C. Without theaddition of sodium azide, bacterial suspension should be used within 1 d.
3. Vigorously vortex the solution 3 × 15 s at the highest setting.4. Count the number of bioparticles per millititer using a hemocytometer in a phase-
contrast or fluorescence microscope.5. Dilute bioparticles to 4 × 10⁸ per 0.5 mL.6. Vortex aliquots of bioparticles 3 × 15 s at the highest setting.7. Using a 1-mL syringe, inject bioparticle suspension into mice by oral/esophageal
injection.8. Expose animals to desired experimental conditions.9. Harvest target organs and serum.
10. Fluorescence can be are quantified directly in serum or by eluting organ aliquotsin formamide at 55°C from 2 h to overnight.
11. Dissected organs can be fixed in formalin embedded and cut for microscopy.
3.4. Water Content in Tissues
Tissue inflammation is often characterized by cellular infiltration and accu-mulation of extracellular water (edema). Quantifying water content in tissuescan be a useful measurement to determine the integrity of vascular and epithe-lial barriers. This parameter can often be combined with other permeabilityassays to corroborate the effect of experimental conditions or pharmacologicalinterventions (11,12). We describe a simple and highly accurate method to mea-sure water content in tissues using dry to wet weight ratios. Multiple organs canbe assayed simultaneously as shown in Fig. 2.
1. After the experimental conditions have been completed, collect 20 to 50 mg oftissue of interest from a representative portion of the organ (see Note 4).
2. Obtain wet weight on an electronic high fidelity balance and record (tissue aloneand tube containing tissue).
3. Place samples on labeled microcentrifuge tubes (make sure that sample is placedat the bottom of the tube).
4. Place tubes in speed-vac. Set up for vacuum mode at 65°C for 12 to 18 h(see Note 5).
5. Obtain dry weight as described previously.6. Subtract dry value from wet weight.
Assessing Tissue Permeability 115

4. Notes1. If using fluorescent microspheres, fluorescence may be measured directly in
serum or in frozen sections of tissues using fluorescence microscopy.2. For intestinal epithelial permeability, FITC–dextran solution is given by oral
gavage. For pulmonary epithelial permeability, FITC–dextran is injected directlyinto the trachea of anesthetized animals.
3. Bioparticles are provided as lyophilized powders. Upon receipt, they should bestored frozen at –20°C. In the case of fluorescent-labeled products, these shouldbe protected from light exposure.
4. Smaller amounts of tissue (10–30 mg) from organs with high fat content (intestine)or high cellular density (kidney) can be used, since these tissues will take longerto dry.
5. If tissues from different organs are processed simultaneously, check the vacuumrun periodically (every 6–8 h). Lung tissue depending on the amount will typicallyrequire less time to dry compared with other organs. Over exposure of the samplesmay result in protein evaporation, tissue destruction and inaccurate readings.
AcknowledgmentThis work was supported by a fellowship award from the Foundation for
Anesthesia, Education and Research (to J.C.I.).
116 Ibla and Khoury
Fig. 2. Vascular permeability profile of different organs in mice. All organs wereharvested and water content quantified by wet/dry ratios. Multiple organs were profiledsimultaneously. Data are expressed in mg/mg of tissue.

References1. Beck, K. F., Eberhardt, W., Frank, S., et al. (1999) Inducible NO synthase: role in
cellular signaling. J. Exp. Biol. 202, 645–653.2. Bertuglia, S. and Giusti, A. (2005) Role of nitric oxide in capillary perfusion and
oxygen delivery regulation during systemic hypoxia. Am. J. Physiol. Heart Circ.Physiol. 288, H525–H531.
3. Hofmann, T., Stutts, M. J., Ziersch, A., et al. (1998) Effects of topically deliveredbenzamil and amilorideon nasal potential difference in cystic fibrosis. Am. J. Resp.Crit. Care Med. 157, 1844–1849.
4. Karhausen, J., Ibla, J. C., and Colgan, S. P. (2003). Implications of hypoxia onmucosal barrier function. Cell. Mol. Biol. 49, 77–87.
5. Bleeker-Rovers, C. P., Boerman, O. C., Rennen, H. J., et al. (2004) Radiolabeledcompounds in diagnosis of infectious and inflammatory disease. Curr. Pharm.Design. 10, 2935–2950.
6. Miles, A. A. and Miles E. M. (1952) Vascular reactions to histamine, histamine-liberator, and leukotaxine in the skin of guinea pigs. J. Physiol. (London) 118,228–257.
7. Rudolph, A. M. and Heymann, M. A. (1967) The circulation of the fetus in utero.Methods for studying distribution of blood flow, cardiac output and organ bloodflow. Circ. Res. 21, 163–184.
8. Synnestvedt, K., Furuta, G. T., Comeford, K. M., et al. (2002) Ecto-5′-nucleotidase(CD 73) regulation by hypoxia-inducible factor-1 (HIF-1) mediates permeabilitychanges in intestinal epithelia. J. Clin. Invest. 110, 993–1002.
9. Samel, S., Keese, M., Kleczka, M., et al. (2002) Microscopy of bacterial translo-cation during small bowel obstruction and ischemia in vivo—a new animal model.BMC Surg. 2, 6.
10. Sorrells, D. L., Friend, C., Koltuksuz, U., et al. (1996) Inhibition of nitric oxidewith aminoguanidine reduces bacterial translocation after endotoxin challenge invivo. Arch. Surg. 131, 1155–1163.
11. Thompson, L. F., Eltzschig, H. K., Ibla, J. C., et al. (2004) Critical role for theecto-5′-nucleotidase (CD73) in vascular leak during hypoxia. J. Exp. Med. 200,1395–1405.
12. Toung, T. J., Chang, Y., Lin, J., and Bhardwaj, A. (2005) Increases in lung andbrain water following experimental stroke: effect of mannitol and hypertonic saline.Crit. Care Med. 33, 203–208; discussion 259–260.
Assessing Tissue Permeability 117


119
10
Bacterial–Bacterial Cell Interactions in Biofilms
Detection of Polysaccharide Intercellular Adhesins by Blotting and Confocal Microscopy
Kimberly K. Jefferson and Nuno Cerca
SummaryAdhesive interactions between bacterial cells coupled with adherence to a solid surface can
lead to the formation of a biofilm. The important role of biofilm formation in the pathogenesis ofcertain types of infection, especially those involving indwelling medical devices, is becomingincreasingly apparent. Critical to the development of a biofilm is the elaboration of exo-polysaccharide that contributes to substrate and intercellular adhesion. The synthesis and secretionof large exo-polysaccharides is a metabolically expensive process and is therefore often suppressedunder conditions that favor the planktonic mode of growth. One way to identify the environmentalcues that cause a given bacterial species to switch to the biofilm mode of growth is to monitor exo-polysaccharide elaboration in vitro. The exo-polysaccharide involved in biofilm formation in anumber of bacterial species is a polymer of N-acetyl-glucosamine. In this chapter, we outline twomethods that use wheat germ agglutinin, a lectin that binds to N-acetyl-glucosamine, to evaluateextracellular polysaccharide production by a variety of bacterial species.
Key Words: Biofilms; exo-polysaccharide; polysaccharide matrix; bacteria; lectins; wheat germagglutinin; confocal microscopy.
1. Introduction“United we stand, divided we fall” is one of the most famous quotes of the
legendary Greek fabulist Aesop. The truism is as befitting to bacterial consortiaas it is to human societal interactions. Interactions between bacterial cells andadherence to a solid surface, mediated in large part by exo-polysaccharide (EPS)intercellular adhesins, result in cohesive, structured communities called biofilms,which are able to withstand many adverse environmental conditions that woulddestroy individual free-floating bacteria. For reasons that are not completely
From: Methods in Molecular Biology, vol. 341: Cell−Cell Interactions: Methods and ProtocolsEdited by: S. P. Colgan © Humana Press Inc., Totowa, NJ

understood, many bacterial and fungal species switch from a planktonic toa biofilm mode of growth under certain environmental conditions or duringinfection. Many types of infections, including osteomyelitis, endocarditis, andcatheter or other medical device-related infections, involve biofilm formation,which is problematic for a number of reasons. Biofilms are tenacious andresilient. Physical forces such as the shear force of blood flow or urine flowacross the surface of intravenous or urinary catheters do not wash them away.Biofilms also are resistant to phagocytosis and can tolerate levels of antibiotics10- to 1000-fold higher than the levels required to inhibit or kill free-floatingbacteria. Thus, biofilm infections often are chronic or relapsing, frequently arerefractory to antimicrobial chemotherapy, and often necessitate the removal ofthe colonized tissue or device.
The biofilm EPS matrix is an important intercellular adhesin and is thereforefundamental to biofilm development and structure. EPS also plays a role in pro-tecting the bacteria from adverse conditions and has been implicated in resis-tance of Staphylococcus epidermidis to phagocytosis (1). Elaboration of EPS isa key factor in the switch from planktonic to biofilm growth (2). Antibodiesthat react specifically to the EPS of certain bacterial species have been pro-duced and used to monitor the effect of different mutations or environmentalconditions on EPS production; however, EPS-specific antibodies are not alwaysreadily available (3,4). The biofilm EPS elaborated by a number of bacterialspecies, including Staphylococcus aureus and Staphylococcus epidermidis,Escherichia coli, and Acinetobacter, is a polymer of N-acetyl-glucosaminereferred to as PNAG, PGA, or polysaccharide intercellular adhesin (4–7). Thesugar residue N-acetyl-glucosamine is a ligand for the lectin wheat germ agglu-tinin (WGA). Horseradish peroxidase-labeled and fluorescently labeled WGA iscommercially available and can be used to detect EPS semiquantitatively byimmunoblotting and by confocal microscopy, respectively (8,9). Thus, we havedeveloped a technique that can be used to detect EPS production by a numberof bacterial species for which a specific anti-polysaccharide antibody is notreadily available.
2. Materials2.1. Cell Culture
1. Culture medium is chosen depending on the environmental conditions beingtested. A rich medium such as tryptic soy broth + 1% glucose is recommendedwhen it is desirable to maximize biofilm formation.
2. For EPS blots, use 50-mL polystyrene conical tubes.3. For confocal microscopy, use either 35-mm collagen-coated glass-bottom micro-
well dishes (Mat-Tek, Ashland, MA) or 35-mm tissue culture-treated polystyrenewells (Corning, Corning, NY).
120 Jefferson and Cerca

2.2. Preparation of EPS Extract
1. dH2O (distilled water) and ddH2O (deionized, distilled water). 2. 0.5 M EDTA (American Bioanalytical, Natick, MA), pH 8.0. Prepare by adding
186.12 mg of EDTA to 900 mL of dH2O, add 5 N NaOH dropwise, and mixcontinuously until the pH reaches 8.0 and the EDTA is completely dissolved.
3. Proteinase K 20 mg/mL (Qiagen, Valencia, CA).4. 60 and 80°C heat-blocks.
2.3. Blotting and Detection of EPS
1. Vacuum manifold slot-blotter or dot-blotter.2. Nitrocellulose (Amersham, Piscataway, NJ).3. Tris-buffered saline (TBS). Prepare a stock solution of 1 M Tris-HCl pH 7.5. For
1 L of TBS, combine 100 mL of 1 M Tris-HCl, pH 7.5., 9 g NaCl, and 900 mLof dH2O and store at room temperature (RT).
4. TBS + 0.05% Tween-20 (TBST).5. Blocking solution. Prepare fresh by dissolving 1% w/v bovine serum albumin
(Sigma, St. Louis, MO) in TBST.6. WGA–horseradish peroxidase-labeled lectin from Triticum vulgaris (HRP;
Sigma). Prepare a stock solution by dissolving 1 mg WGA–HRP in 1 mL ofddH2O. Store 10-µL aliquots at −20°C.
7. Chemiluminescent HRP substrate (ECL kit, Amersham).8. Plastic wrap.9. Film cassette.
10. Kodak BioMax MS X-ray film (Amersham).
2.4. Confocal Microscopy
1. Phosphate-buffered saline (PBS). To prepare a 10X stock solution, dissolve 1.44 g KH2PO4, 90 g NaCl, and 7.95 g Na2HPO4 in 1 L of dH2O and adjust thepH to 7.5.
2. WGA-Oregon green conjugate (WGA-Green; Molecular Probes, Eugene, OR).Prepare a stock solution by dissolving 10 mg WGA–Green in 1 mL of H2O. Storein aliquots of 25 µL at −80°C.
3. Methods3.1. Preparation of EPS Samples
1. Grow bacteria to stationary phase in 5 mL of medium.2. Approximately 5 × 10⁹ bacterial cells are collected by centrifugation at 8000g.
The culture supernatant may be discarded (see Note 1) or saved for analysis. 3. Resuspend bacterial cells in 180 µL of 0.5 M EDTA by pipetting up and down or
by gentle sonication (see Note 2) using a probe-type sonicator. Transfer the sus-pension to a microfuge tube and boil for 5 min to kill the bacteria and to aid inrelease of EPS from the cell surface.
Bacterial Polysaccharide Adhesins 121

4. Centrifuge the samples at 18,000g to remove the cells, and transfer 150 µL ofthe EPS-containing supernatant to a fresh microfuge tube.
5. Add 15 µL of proteinase K (2 mg/mL final concentration) and incubate the sam-ples at 60°C for 1 h. After protein digestion, heat-inactivate the proteinase K at80°C for 30 min.
3.2. Blotting and Detection of EPS
1. Cut a piece of nitrocellulose to fit into the slot-blot apparatus, and pre-wetwith TBS.
2. Sandwich the nitrocellulose between the gasket and top plate of the blottingapparatus and the turn on the clamp vacuum. Fill the wells with TBS and turn onthe sample vacuum until the liquid has been drawn through the membrane. Turnoff the sample vacuum.
3. A series of 2- to 10-fold dilutions of the EPS samples should be made in TBS.Add the samples and dilutions to the wells of the vacuum manifold and turn onthe vacuum until the samples have been completely drawn through the nitrocel-lulose membrane.
4. Disassemble the vacuum manifold and allow the nitrocellulose membrane to drythoroughly at RT.
5. Wet the membrane with TBS and block in 25 mL of blocking solution (see Note 3)for 1 h at RT with rocking.
6. Add 15 mL of 50 ng of WGA–HRP + 10 mg bovine serum albumin/mL TBSTand incubate for 30 min at RT with rocking.
7. Wash the membrane 3 times for 5 min with at least 25 mL of TBST.8. Rinse the membrane briefly with dH2O. Lift the membrane with forceps or gloved
fingers and gently shake off excess water. Lay the membrane on a flat surfacesuch as a clean benchtop.
9. Work very quickly from this step forward. Thoroughly mix 2 mL of ECL reagent1 and 2 mL of reagent 2 and immediately pipet onto the membrane. Surfacetension will hold the solution on the blot. Leave the solution on the blot forexactly 1 min.
10. Lift the blot and shake off excess solution. Wrap the blot in plastic wrap and tapeto the inside of a film cassette. Take the film cassette to a darkroom and lay apiece of film on the blot under safelight conditions. Close the cassette and exposethe film for 1 min. Remove and develop the first film, add a second film to theblot and start a stopwatch to monitor the exposure-time of the second film.
11. Gage the exposure time for the second film after the first film has been developed.A sample blot illustrating results obtained with EPS-positive and EPS-negativestrains of staphylococci and E. coli is shown in Fig. 1.
3.3. Prepare Biofilms for Confocal Microscopy
1. Inoculate 2.5 mL of the medium from liquid cultures and grow biofilms at 37°Cwith rocking for 18 to 72 h (see Note 4) in 35-mm dishes (see Note 5).
2. Remove medium from biofilm and rinse with PBS (see Note 6).
122 Jefferson and Cerca

3. Dilute WGA–Green in PBS (final concentration 0.1 mg/mL) and add 1 mL to thebiofilm. Incubate in the dark for 15 min (see Note 7).
4. Pipet off WGA–Green solution and rinse the biofilm with 2 mL of PBS.
3.4. Detection of EPS by Confocal Microscopy
1. Biofilms should be observed by confocal microscopy using an immersion objec-tive (Achroplan ×63/0.95W).
2. The bacterial cells are detected by the refraction of light in the red spectrum(see Note 8) and WGA–Green is detected by fluorescence in the green spectrum,using a single channel analysis (see Note 9).
3. Excitation wavelengths are set at 633 nm with a output power of 70% for thedetection of bacterial cells and 488 nm with a output power of 10% for the detec-tion of WGA–Green. The excitation beam splitter is HFT UV/488/543/633.
4. The filter used to detect the light refracted by bacterial cells is LP650, and thefilter for detection of light emitted by WGA–Green is BP 505-530. The beamsplitter is NFT 545.
5. The pinholes of both channels are adjusted to obtain equivalent stack sizes.6. A fast scan is performed to adjust the detector gain and detector offset of both
channels. The color palette is set to Range Indicator, and the detector gain isadjusted to minimize background color intensity (an indication of minimum sat-uration of the detector gain). The detector offset should also be adjusted tominimize color intensity if background pixels.
7. A fast scan is performed to determine the top and bottom of the biofilm.
Bacterial Polysaccharide Adhesins 123
Fig. 1. Analysis of EPS elaboration by blotting. Surface extracts from staphylococciand E. coli were blotted onto nitrocellulose and probed with WGA–HRP. Strains areindicated to the left of each blot: PNAG-hyper-producing S. aureus strain MN8m,the PNAG-negative S. aureus strain MN8∆ica::tet, PNAG-producing S. epidermidisstrain M187, PNAG-negative staphylococcal species S. haemolyticus (strain M176),pga-positive, E. coli clinical isolate (strain HMS-U) from a urinary tract infection, anda pga-negative, E. coli urinary tract infection isolate (strain HMS-I).

8. Once the z-settings have been set, a full resolution scan is done. Sample imagesof EPS-positive and EPS-negative strains of S. aureus are shown in Fig. 2.
4. Notes1. EPS may be secreted into the culture fluid; therefore, the investigator may wish to
reserve the supernatant and blot it onto the nitrocellulose membrane. However,noncell-associated EPS does not appear to contribute to biofilm development (10).
2. EPS-producing bacteria may be mucoid and difficult to resuspend. Sonicationmay be used to disrupt cell clusters but should be at low power to prevent releaseof cell wall components that may contain N-acetyl-glucosamine and could cross-react with WGA–HRP.
3. Skim milk contains sugars that can interact with WGA, and should not be used asa blocking agent.
4. In some bacterial species, biofilm maturation requires several days of growth (11).If bacteria are allowed to grow for more than 18 h, then the medium should bereplaced every 12 h.
5. Because of variations in surface proteins and hydrophobicity among differentbacterial species, glass or tissue culture-treated polystyrene may provide a bettersubstrate for adherence and biofilm formation. This must be determined experi-mentally for each species. Most bacteria will not, however, adhere to polystyrenethat has not been tissue culture-treated.
124 Jefferson and Cerca
Fig. 2. Use of confocal microscopy to analyze EPS elaboration. The intercellularadhesin (ica) locus in S. aureus encodes the proteins necessary for PNAG synthesis soica-positive and ica-negative mutants were used as positive and negative controls.Biofilms produced by (A) the strong PNAG-producing S. aureus strain MN8m and(B) the PNAG-negative S. aureus strain MN8∆ica::tet were stained with WGA–Greenand imaged by confocal microscopy. Biofilm cells are presented in red and PNAG ingreen. Each bar segment represents 20 µm. (Please see color insert following p. 50 fora color version of this figure.)

6. Loosely adherent biofilms should be washed very gently or the initial washingstep may be skipped.
7. The 15-min incubation time should be adhered to as longer incubation times canactually reduce the level of fluorescence.
8. Fluorescent labeling of bacterial cells can produce artifactual results and certainmarkers can interfere with the binding or detection of WGA–Green. The detectionof unlabeled bacterial cells by refracted light overcomes this problem.
9. If there is a chance that emission or reflected light spectra could overlap, thenmulti track analysis should be used, instead of single track.
AcknowledgmentsWe thank Michelle Ocana and the Center for Brain Imaging, Harvard Center
for Neurodegeneration and Repair (Harvard University, Boston, MA) for use oftheir confocal microscope. This work was funded by National Institutes ofHealth grant R21AI61590-01 from the National Institute of Allergy andInfectious Diseases and by the FCT and Portuguese Fulbright Commission.
References1. Vuong, C., Voyich, J. M., Fischer, E. R., et al. (2004) Polysaccharide intercellular
adhesin (PIA) protects Staphylococcus epidermidis against major components ofthe human innate immune system. Cell Microbiol. 6, 269–275.
2. Jefferson, K. K. (2004) What drives bacteria to produce a biofilm? FEMS Micro-biol. Lett. 236, 163–173.
3. Cramton, S. E., Ulrich, M., Götz, F., and Doring, G. (2001) Anaerobic conditionsinduce expression of polysaccharide intercellular adhesin in Staphylococcus aureusand Staphylococcus epidermidis. Infect. Immun. 69, 4079–4085.
4. Kaplan, J. B., Velliyagounder, K., Ragunath, C., Rohde, H., Mack, D., Knob-loch, J. K., and Ramasubbu, N. (2004) Genes involved in the synthesis and degra-dation of matrix polysaccharide in Actinobacillus actinomycetemcomitans andActinobacillus pleuropneumoniae biofilms. J. Bacteriol. 186, 8213–8220.
5. Mack, D., Fischer, W., Krokotsch, A., et al. (1996) The intercellular adhesin involvedin biofilm accumulation of Staphylococcus epidermidis is a linear beta-1, 6-linkedglucosaminoglycan: purification and structural analysis, J. Bacteriol. 178, 175–183.
6. Maira-Litran, T., Kropec, A., Abeygunawardana, C., Joyce, J., Mark, G., 3rd,Goldmann, D. A., and Pier, G. B. (2002) Immunochemical properties of thestaphylococcal poly-N-acetylglucosamine surface polysaccharide. Infect. Immun.70, 4433–4440.
7. Wang, X., Preston, J. F., 3rd, and Romeo, T. (2004) The pgaABCD locus ofEscherichia coli promotes the synthesis of a polysaccharide adhesin required forbiofilm formation, J. Bacteriol. 186, 2724–2734.
8. Leriche, V., Sibille, P., and Carpentier, B. (2000) Use of an enzyme-linked lectin-sorbent assay to monitor the shift in polysaccharide composition in bacterialbiofilms, Appl. Environ. Microbiol. 66, 1851–1856.
Bacterial Polysaccharide Adhesins 125

9. Thomas, V. L., Sanford, B. A., Moreno, R., and Ramsay, M. A. (1997) Enzyme-linked lectinsorbent assay measures N-acetyl-D-glucosamine in matrix of biofilmproduced by Staphylococcus epidermidis. Curr. Microbiol. 43, 249–254.
10. Vuong, C., Kocianova, S., Voyich, J. M., et al. (2004) A crucial role for exo-polysaccharide modification in bacterial biofilm formation, immune evasion, andvirulence. J. Biol. Chem. 279, 54,881–54,886.
11. Costerton, J. W., Stewart, P. S., and Greenberg, E. P. (1999) Bacterial biofilms: acommon cause of persistent infections. Science 284, 1318–1322.
126 Jefferson and Cerca
127
11
A Biochemical Method for Tracking Cholera Toxin Transport From Plasma Membrane to Golgi and Endoplasmic Reticulum
Heidi E. De Luca and Wayne I. Lencer
SummaryAsiatic cholera is a rapidly progressing disease resulting in extreme diarrhea and even death.
The causative agent, cholera toxin, is an AB5-subunit enterotoxin produced by the bacteriumVibrio cholera. The toxin must enter the intestinal cell to cause disease. Entry is achieved by theB-subunit binding to a membrane lipid that carries the toxin all the way from the plasma mem-brane through the trans-Golgi to the endoplasmic reticulum (ER). Once in the ER, a portion ofthe A-subunit, the A1 chain, unfolds and separates from the B-subunit to retro-translocate to thecytosol. The A1 chain then activates adenylyl cyclase to cause disease. To study this pathway inintact cells, we used a mutant toxin with C-terminal extension of the B-subunit that contains N-glycosylation and tyrosine-sulfation motifs (CT-GS). This provides a biochemical readout fortoxin entry into the trans Golgi (by 35S-sulfation) and ER (by N-glycosylation). In this chapter,we describe the methods we developed to study this trafficking pathway.
Key Words: Retrograde transport; ganglioside; lipid trafficking; cholera toxin; retro-translocation;N-glycosylation; tyrosine sulfation; endoplasmic reticulum; trans-Golgi network.
1. IntroductionCholera toxin (CT) typifies the structure and function of the AB5 toxins, all of
which must enter the cytosol of host cells by traveling backwards from the plasmamembrane (PM) to the endoplasmic reticulum (ER) and retro-translocating tothe cytosol (1,2). This pathway is unusual because membrane proteins rarelymove backwards from the PM to the ER (3,4) and because it is dependent ontoxin binding to a membrane lipid, ganglioside GM1 for CT, and not a mem-brane protein (5).
From: Methods in Molecular Biology, vol. 341: Cell−Cell Interactions: Methods and ProtocolsEdited by: S. P. Colgan © Humana Press Inc., Totowa, NJ

128 De Luca and Lencer
To study the toxin pathway, we modified an approach originally developedby Rapak and Johannes (6,7). It uses a mutant toxin tagged with tyrosine-sulfation and N-glycosylation motifs and exploits the subcellular localization of the enzymes that catalyze these reactions in native cells. Post-translationaltyrosine-sulfation of nascent proteins occurs in the trans-Golgi network (TGN)and N-glycosylation occurs in the ER (6,8,9). As such, measurement of thesemodifications on CT gives a biochemical measure of toxin transport from PMthrough TGN to ER (Fig. 1). In addition, because the ER-localized mutantCT is modified by N-glycosylation, the ER fraction of toxin can be isolated byaffinity purification using lectins that bind the oligosaccharide (Fig. 2; [5]).
Two methods are discussed in this chapter. One describes the measurementof toxin transport from PM to TGN to ER, as reported by glycosylation andsulfation, and the other describes the affinity purification of the toxin fractionlocalized in ER. The sulfation–glycosylation assay depends on immuno-precipitation of the B-subunit and subsequent detection of the 35S-sulfatedfraction of this B-subunit by sodium dodecyl sulfate polyacrylamide gelelectrophoresis (SDS-PAGE) and autoradiography. N-glycosylation is detectedby an N-glycanase-sensitive shift in apparent molecular weight as observed bySDS-PAGE. In some cells, only a very small fraction of toxin moves through
Fig. 1. Phosphorimage showing sulfation (marked by *) and N-glycosylation(marked by **) of CT-GS B-subunit 3 h after apical and basolateral application to T84cells (see Subheading 3.1.). Immunoprecipitates were divided into three equal samplesand treated with PNGaseF (lane 2), EndoH (lane 3), or mock treated (lane 1) beforeanalysis by SDS-PAGE. (Reprinted with permission from ref. 5.)

the Golgi and into the ER. In this method, because only the fraction of toxinthat traveled through the Golgi is radiolabeled, the assay is extremely sensitiveand specific for Golgi/ER transport.
The second method, isolation of the ER glycosylated toxin, describes a tech-nique for affinity isolation of the small fraction of the glycosylated B-subunit.This method depends on two sequential affinity precipitations. The first one iso-lates all the N-glycosylated proteins with a glucose/mannose specific lectin, andthe second one isolates the subfraction of toxin B-subunit from this collection ofN-glycosylated proteins. The double-affinity precipitation method proved to behighly specific and allowed us to determine the conformation of toxin in the ER.Since protein disulfide isomerase can interact only with the proteolytically acti-vated CT A-subunit to unfold and dissociate the A1 chain from the B-subunit, theCT-GS toxin used in this assay is activated by trypsin incubation before use.
2. MaterialsSee Table 1 for a summary of buffers used in these assays.
2.1. Sulfation and Glycosylation Assay
1. Hank’s Balanced Salt Solution (HBSS) without sulfate: Dissolve dry HBSS with-out calcium chloride, magnesium sulfate, phenol red, and sodium bicarbonate(Sigma, St Louis, MO) in 900 mL of water. Adjust to 1 mM magnesium chloride,1 mM calcium chloride, and 10 mM HEPES final concentration. Adjust the pH to7.4, bring volume to 1 L with water, and store at 4°C for up to 4 d (see Note 1).
2. HBSS with sulfate: dissolve dry HBSS without phenol red and sodium bicarbonate(Sigma) in 900 mL of water. Adjust to 10 mM HEPES final concentration, adjust thepH to 7.4, bring volume to 1 L with water, and store at 4°C for up to 4 d.
Tracking Retrograde Transport 129
Fig. 2. Immunoblot for A- and B-subunits after double affinity precipitation (seeSubheading 3.2., lanes 2–4) or single precipitation by GM1 beads alone (lanes 5 and 6)in Vero cells. Lane 4 shows the same sample as in lane 3 treated with PNGaseF. Lane 1shows purified CT-GS as control. (Reprinted with permission from ref. 5.)

130
Table 1Summary of Buffers Used in the Assays
Buffer Buffer name Composition Protocol steps
A Lysis stock buffer 20 mM Tris-base, 150 mM NaCl, 5 mM EDTA,20 mM Triethanolamine, pH to 8.0 with HCl
B SDS-based lysis buffer 0.5% (w/v) SDS, 0.2% (w/v) bovine serum Subheading 3.1.2., step 1albumin in lysis stock buffer (Buffer A)
C Triton dilution buffer 2.5% (v/v) Triton X-100 (Sigma) in lysis stock Subheading 3.1.2., step 3buffer (Buffer A)
D Mixed micelle buffer 1% (v/v) Triton X-100, 0.2% (w/v) SDS, Subheading 3.1.2., step 108% (w/v) sucrose in lysis stock buffer (Buffer A)
E Sucrose final wash buffer 8% (w/v) sucrose in lysis stock buffer (Buffer A) Subheading 3.1.2.,steps 10 and 11
F TN lysis buffer 10 mM Tris-base, pH 7.4, 150 mM NaCl, 5 mM EDTA, Subheading 3.2.2.,1% (v/v) Triton X-100, 1.75% (w/v) NOG, steps 5 and 60.2% (w/v) gelatin, 0.1% sodium azide
G ConA-binding buffer 10 mM Tris-base, pH 7.4, 6 mM CaCl2, 6 mM MnCl2, Subheading 3.2.3., step 16 mM MgCl2, 0.5 M NaCl, 0.2% (w/v) gelatin
H TN wash buffer for 10 mM Tris-base, pH 7.4, 0.5 M NaCl, Subheading 3.2.3.,ConA beads 1% (v/v) Triton X-100, 1.75% (w/v) NOG, steps 2–4
1 mM CaCl2, 1 mM MnCl2, 1 mM MgCl2,0.1% (w/v) sodium azide in water
I TN wash buffer for 10 mM Tris-base, pH 7.4, 0.15 M NaCl, Subheading 3.2.3., step 6GM1 beads 1% (v/v) Triton X-100, 1.75% (w/v) NOG,
1 mM CaCl2, 1 mM MnCl2, 1 mM MgCl2,0.1% (w/v) sodium azide in water
SDS, sodium dodecyl sulfate; NOG, octyl β-D-glucopyranoside; TN, Triton-NOG; ConA, Concanavalin A.

Tracking Retrograde Transport 131
3. 35S-Sodium Sulfate (Sulfur-35 Radionuclide ∼1000 Ci/mMole, Perkin Elmer,Boston, MA; see Note 2). All radioactive precautions must be taken when workingwith any kind of radioactivity, including 35S. We routinely use a radioactive betashield when working with this nuclide, in addition to gloves, goggles, and a labcoat. All radioactive waste must be disposed of properly and according to eachinstitution’s guidelines.
4. Sepharose CL-4B (Sigma) is washed three times in phosphate-buffered saline(PBS) and resuspended to 50% slurry in PBS/0.02% sodium azide before use.Wash sepharose by spinning at 3000g to pellet, remove supernatant, add washbuffer to fill tube, and rotate 1 to 2 min at 4°C. Spin again to pellet beads andrepeat wash twice more. After the final wash, remove as much wash buffer aspossible with a gel loading tip or small gage needle, and add wash buffer to create50% slurry of the sepharose (see Note 3).
5. Protein A sepharose (Amersham Biosciences, Piscataway, NJ) is washed three timesin PBS and resuspended to 50% slurry in PBS before use. Wash sepharose by spin-ning at 3000g to pellet, remove supernatant, add wash buffer to fill tube and rotate1 to 2 min at 4°C. Spin again to pellet beads, and repeat wash twice more. After thefinal wash, remove as much wash buffer as possible with a gel loading tip or smallgauge needle, and add wash buffer to create 50% slurry of the sepharose.
6. Lysis stock buffer (Buffer A): 20 mM Tris-base 150 mM NaCl, 5 mM EDTA,20 mM triethanolamine, pH 8.0. The stock buffer can be stored for 3 mo at 4°C.
7. SDS lysis buffer (Buffer B): 0.5% (w/v) SDS, 0.2% (w/v) bovine serum albuminin Lysis stock buffer (Buffer A). Buffer B must be kept at room temperature;otherwise, the SDS will precipitate out of solution. It can be stored at 4°C butmust be warmed to room temperature to redissolve SDS crystals. Add proteaseinhibitors just before use (see Note 4).
8. Triton dilution buffer (Buffer C): 2.5% (v/v) Triton X-100 in Buffer A.9. Mixed micelle buffer (Buffer D): 1% (v/v) Triton X-100, 0.2% (w/v) SDS, and
8% (w/v) sucrose in Buffer A.10. Sucrose final wash buffer (Buffer E): 8% (w/v) sucrose in Buffer A.11. Rubber cell scraper (Fisher Scientific, Pittsburgh, PA).12. 2X Laemmli sample buffer (Bio-Rad, Hercules, CA): add dithiothreitol or 5% (v/v)
β-mercaptoethanol to sample buffer immediately before use. β-mercaptoethanolshould be handled in a fume hood with gloves because of its toxicity andstrong odor.
13. 10 to 20% Tris-HCl ready gel and gel running and transfer apparatus includingcells, electrodes, and power supply (Bio-Rad). Precautions should be taken to avoidany electric shock stemming from the power supply unit. Carefully read the instruc-tions of the power supply before use. Always ensure the power supply is off beforeconnecting or disconnecting the electrodes to reduce the risk of electric shock.
14. Gel fixation buffer: 30% (v/v) methanol, 7% (v/v) acetic acid in water.15. Rabbit anti-CT B-subunit antibody (3–5 mg/mL [10,11]) can be aliquoted and
stored at –80°C.16. CTB-GS and CT-GS protein (0.1–3 mg/mL [5]) aliquoted and stored at –80°C.

17. Radioactive containment box (see Note 5).18. Gel-drying apparatus.19. PhosphoImager.20. Six-well tissue culture plate, with 35 mm diameter wells (Fisher Scientific).
2.2. Capture and Isolation of ER Glycosylated Toxin
1. N-p-Tosyl-L-phenylalanine chloromethyl ketone (TPCK)-treated trypsin (Sigma).2. Soybean trypsin inhibitor (Sigma): We prepare a stock solution of 0.7 mg/25 µL
in water just before use.3. Triton-NOG lysis buffer (Buffer F): 10 mM Tris, pH 7.4, 150 mM NaCl, 5 mM
EDTA; 1% (v/v) Triton X-100, 1.75% (w/v) octyl β-D-glucopyranoside (NOG),0.2% (w/v) gelatin. Store at 4°C and use within 2 d. Add protease inhibitors justbefore use.
4. Concanavalin A (ConA)-binding buffer (Buffer G): 10 mM, Tris-base pH 7.4, 6 mMCaCl2, 6 mM MnCl2, 6 mM MgCl2, 0.5 M NaCl, and 0.2% (w/v) gelatin. Store at4°C and use within 2 d. Add protease inhibitors just before use.
5. ConA sepharose beads (Amersham Biosciences, Piscataway, NJ) are prewashedthree times in a 11 solution of Buffer FBuffer G. Wash sepharose by spinningat 3000g to pellet, remove supernatant, add wash buffer to fill tube, and rotate1 to 2 min at 4°C. Spin again to pellet beads, and repeat wash twice more. Afterthe final wash, remove as much wash buffer as possible with a gel loading tip orsmall gage needle, and add wash buffer to create 50% slurry of the sepharose.
6. Triton-NOG wash buffers (Buffers H and I): Start with a stock buffer of 10 mMTris-base, pH 7.4; 1% (v/v) Triton X-100, 1.75% (w/v) NOG, 1 mM CaCl2, 1 mMMnCl2, and 1 mM MgCl2 in water. For ConA bead wash buffer (Buffer H), add0.5 M NaCl. For GM1 bead wash buffer (Buffer I), add 0.15 M NaCl. Store solu-tions at 4°C and use within 2 d. Add protease inhibitors just before use.
7. 0.2 M methyl-α-D-mannopyranoside (Sigma) is dissolved in Buffer H.8. PBS: Prepare 10X stock with 1.48 M NaCl, 14 mM KH2PO4, 81 mM Na2HPO4,
26.8 mM KCl, adjust pH to 7.4, and bring volume to 1 L. Filter sterilize into anautoclaved bottle, and store at room temperature. Prepare working 1X solutionby diluting one part 10X stock with nine parts water.
9. GM1 beads are prepared with lyso-monosialoganglioside GM1 (Matreya, PleasantGap, PA) and Dynabeads® M-270 Carboxylic Acid (Dynal, Oslo, Norway) accord-ing to Dynal’s manufacturer instructions for bead coupling. The coupled beads arethen washed in PBS three times before they are added to the sample. The beadsare easily washed using the capture magnet and successive removal and addition of1 mL of PBS. After the washes, bring the beads up to the original volume in PBS.
10. Peptide: N-Glycosidase F (PNGase F, Glycerol free) and associated buffers (NewEngland Biolabs, Beverly, MA).
11. SDS loading buffer (6X): Mix 7 mL of 4X Tris-HCl/SDS pH 6.8 (0.5 M Tris-HClcontaining 0.4% (w/v) SDS), 3 mL of glycerol, 1 g of SDS, 0.93 g of dithiothre-itol, and 1.2 mg of bromophenol blue. Bring the volume to 10 mL with water,divide into 0.5-mL aliquots, and freeze at –80°C.
132 De Luca and Lencer

12. SDS running buffer: Make a 10X stock of 250 mM Tris, 1.92 M glycine, and1% (w/v) SDS in water. DO NOT adjust pH. For a working stock, mix one part10X buffer with nine parts water. Store 10X and 1X buffers at room temperature.
13. Transfer buffer: 200 mL of methanol, 3 g of Tris-base, 14.4 g of glycine are addedto 800 mL of water. Mix and store at 4°C to chill before use. This solution ismade fresh for every gel, but a 10X stock can be made with the salts and thendiluted with methanol and water before use. The solution should be cooled to 4°Cbefore use to help minimize any temperature increase during the transfer.
14. Tris-buffered saline (TBS): Make a 10X stock of TBS with 500 mM Tris 2 M NaCl,pH 7.4 in water. Prepare a working stock of 1X TBS by adding one part 10X TBSto nine parts water. Both 10X and 1X stocks can be stored at 4°C for 4 mo.
15. TBS with Tween-20 (TTBS; Sigma): Prepare a working stock of 1X TTBS byadding 1% (v/v) Tween-20 to 1X TBS. Both 10X and 1X stocks can be stored at4°C for 4 mo.
16. Blocking buffer: Add 5% (w/v) of nonfat dry milk to TTBS. Stir 30 min at roomtemperature and filter into a vacuum flask using a büchner funnel and a piece offilter paper. Store up to 3 d at 4°C.
17. Anti-rabbit IgG (whole molecule)–peroxidase antibody produced in goat (sec-ondary antibody, Sigma).
18. Enhanced chemiluminescent detection kit (Pierce Biotechnology, Rockford, IL).19. Round tissue culture dishes, 60-mm diameter. The actual growth area diameter
of these dishes is approx 50 mm (Fisher Scientific, Pittsburgh, PA).
3. MethodsThe mutant cholera toxin used in the following assays was developed by
Jobling and Fujinaga (5). The C-terminal motifs were specifically designed toprovide maximum opportunity for glycosylation and sulfation and to exert min-imal effect on normal cholera toxin function in the cell. Theories regardingoptimal placement of these motifs, linker lengths, and conformation were con-sidered when designing the mutant toxin. Functional tests revealed a minimalchange in toxicity of the mutant toxin compared to the wild type.
The following methods can be modified to fit other cell or biological systems. Depending on the binding affinity of the toxin to the cell receptor,the conditions and incubation times should be modified to achieve maximalsaturation binding at steady state. Although there are no specific cleavage siteswithin the linker, the appended tag is subject to nonspecific proteolysis. In some cell or in vivo systems, the addition of protease inhibitors is crucial tomaintain the full-length tag to allow affinity precipitation with the lectin. To control for the isolation of the ER glycosylated toxin, a single affinity pre-cipitation with GM1 alone is conducted with a fraction of the lysate. This willreveal, by immunoblot, the entire B-subunit toxin that was taken up by the cellduring the incubation and control for any problems that may have occurredduring the toxin uptake steps.
Tracking Retrograde Transport 133

3.1. Sulfation and Glycosylation Assay
3.1.1. Depletion of Cell Sulfate and Toxin Incubation
1. Seed T84, Vero, Cos, or Y1 cells into a six-well plate and grow to 90 to 100%confluency.
2. Wash each well three times with 4 mL of 37°C HBSS without sulfate. This iseasily done by aspirating off the media with a 5-mL pipet, gently adding theHBSS wash, and then repeating this process twice.
3. Add 4 mL of HBSS without sulfate to each well and incubate at 37°C for 30 minin a CO2 incubator.
4. Aspirate off the HBSS without sulfate and replace with 4 mL fresh HBSS with-out sulfate. Incubate for 1 h at 37°C in a CO2 incubator.
5. Aspirate the HBSS without sulfate and replace with 1 mL of 0.5 mCi/mL 35S-sodium sulfate in HBSS without sulfate. Incubate the cells for 30 min at 37°Cin a CO2 incubator using a radioactive containment box to prevent contamination.
6. Add CTB-GS or CT-GS to a final concentration of 20 nM (or appropriate) andincubate for desired time (30 min to overnight) at 37°C in CO2 incubator, using aradioactive containment box.
7. Aspirate off and properly dispose of 35S toxin solution.8. Wash cells three times with 3 mL of 4°C HBSS with sulfate. Add wash buffer to
cells by gently pipetting against the wall of the well and gently aspirate off washbuffer. This technique helps prevent the cells from being washed off the wellbottom.
3.1.2. Immunoprecipitation With CT antibody
1. Remove the last wash buffer from the wells and add 600 µL of room temperatureBuffer B.
2. Using a rubber cell scraper, scrape the cells off the well bottom and collect in a2-mL screw cap tube (see Note 6).
3. Heat the tube to 100°C for 5 min, then transfer the tube to ice, and add 600 µL ofice-cold Buffer C. This is an appropriate stopping point for the assay. If desired,after the addition of Buffer C, the samples can be stored at –80°C for laterprocessing.
4. To fracture the DNA, put the sample tubes in an automatic vortex at 4°C, andvortex at maximum speed for 20 min. Pass the sample through a 25-gage needlefive to six times to disrupt the DNA, and transfer the sample to a new tube.
5. Clarify the DNA by adding 30 µL of 50% Sepharose CL-4B slurry. Tumblesample for 5 min, spin at maximum speed (16,000g) for 3 min, and transfer thesupernatant to a new tube. Repeat this clarification step one more time.
6. Preadsorb the sample by adding 15 µL of 50% protein A bead slurry. Tumblesample for 15 min at 4°C, spin at maximum speed for 1 min, and transfer thesupernatant to a new tube.
7. Dilute the anti-CTB stock antibody 130 in PBS and add 100 µL of this to eachtube. Tumble at 4°C for 1 h.
134 De Luca and Lencer

8. Add 15 µL of 50% protein A bead slurry to each tube and tumble at 4°C for 1 hto overnight.
9. Spin the sample at maximum speed for 1 min. Carefully remove the supernatantand store at –80°C (in case of recapture).
10. Wash the protein A bead pellet in 1 mL of ice-cold Buffer D. Add 1 mL of bufferto the pellet, incubate on ice for 2 min, and spin at maximum speed for 1 min.Remove the supernatant and repeat the wash four times for a total of five washes,then repeat the wash step once more with Buffer E.
11. Remove as much Buffer E as possible with a gel-loading tip or small gauge needleand then add 20 µL of 2X Laemmli sample buffer to the bead pellet. Use a 30-gage needle to make a hole in the top of the tube (to avoid explosion), and boilfor 5 min.
12. Spin at maximum speed for 5 min and carefully remove the supernatant. This isthe final sample and can be stored at –80°C until further processing.
3.1.3. SDS-PAGE and Phosphoimaging
1. Run the samples on a 10 to 20% gradient SDS-PAGE gel with approx 6–12 µLper lane for a phosphoimage. (For a Western blot, load 2–3 µL per lane. For moredetailed SDS-PAGE and Western blotting instructions, see Subheading 3.2.5.)
2. Incubate the gel in fixation solution at room temperature for 1 h with gentle shaking.3. Soak the gel in water at room temperature for 30 min with gentle shaking. During
the 30-min incubation, change the water four times.4. Dry the gel down onto a piece of filter paper using a vacuum driven gel-drying
apparatus (or other quick gel-drying method).5. Expose the dried gel in a PhosphoImager plate for 3 d to 2 wk and then read the
plate on a PhosphoImager (see Note 7).
3.2. Isolation of ER Glycosylated Toxin
3.2.1. Nicking Toxin With Trypsin Treatment
1. Incubate 12 µg of CT-GS with 6 µg of TPCK treated trypsin for 30 min at 37°C.We usually add 6 µL of a 1 mg/mL solution of TPCK trypsin to 12 µg of CT-GSin PBS to a final volume of 180 µL for the incubation.
2. After the incubation, add 0.56 mg of soybean trypsin inhibitor to stop the trypsindigest. Bring the final volume to 12 mL with HBSS with sulfate to yield a solu-tion of 10 nM CT-GS.
3.2.2. Toxin Incubation and Cell Lysis
1. Seed cells on a 6 cm2 dish and grow until 90 to 100% confluent. For Vero cells,we typically seed them in the plates and allow them to grow for 2 to 3 d to adhereto the plate.
2. Wash the adherent cells three times with cold HBSS with sulfate. This is easilydone by gently aspirating off the media, adding 2–3 mL of HBSS, and then aspirating off HBSS. Take care to do these steps gently because any turbulencemay lift the cells off the plate.
Tracking Retrograde Transport 135

3. Add 10 nM of the nicked CT-GS to the plate. This is usually done in a 1-mL volume.Incubate the cells for the desired time, realizing that even if the uptake incubationis for a short time, the internalization incubation needs to be 3–5 h at 37°C forglycosylation to occur (see Note 8).
4. After the incubation, wash the adherent cells four times with HBSS with sulfate.The first wash should be done with 37°C HBSS, and the subsequent three with4°C HBSS. This will help to release any CT-GS bound to membranes, thus givinga cleaner pulldown.
5. Add 1 mL of Buffer F to each dish and let sit 10 min on ice. Scrape off the cellswith a rubber cell scraper, and collect in a 1.5-mL Eppendorf tube. Lyse cells bypipetting up and down with a 1-mL tip seven to eight times.
6. Spin the lysate at 6000g for 10 min at 4°C to pellet insoluble material. Removethe supernatant (∼1 mL) and transfer it to a new tube. Reserve 20 µL of the super-natant to run as “lysate” on the SDS-PAGE gel.
3.2.3. Double Pulldown With ConA and GM1
1. Add an equal volume of Buffer G to the lysate. Add 100 µL of ConA beads to thetube. Rotate for 1 h at 4°C (see Note 9).
2. Spin the samples at 3000g for 5 min at 4°C. Remove and save the supernatant(in case of recapture). Wash the ConA bead pellet with Buffer H. Add 1 mL ofBuffer H to the bead pellet, resuspend the pellet for 1 to 2 min on a mixer or byinverting, then spin at 3000g for 5 min to pellet the beads. Repeat the wash threemore times.
3. Use a small-gage needle or gel loading tip to remove as much buffer as possiblefrom the bead pellet.
4. Elute the glycosylated toxin by adding 50 µL of 0.2 M methyl α-D-manno-pyranoside in Buffer H to the beads. Rotate the sample for 1 h at 4°C for maxi-mal elution. Spin the sample at 3000g for 5 min at 4°C. Collect the supernatantand save the beads in case of re-elution. If applicable, combine supernatants intoone tube (see Note 10).
5. Bring the volume of the eluted sample to 1 mL with PBS (with protease inhibitors).Add 40 µL of GM1 beads. Rotate the samples overnight at 4°C (see Note 11).
6. Wash the GM1 beads four times with Buffer I. Each wash should allow the beadsto rotate with Buffer I for 1 to 2 min. Using a small-gage needle or gel-loadingtip, remove as much of the wash buffer as possible.
3.2.4. PNGase Treatment
1. To load sample directly onto an SDS-PAGE gel, add 20 µl 2X Laemmli samplebuffer to GM1 beads and boil 10 min. Isolate the supernatant with the capturemagnet. Load 3 µL of this sample onto an SDS-PAGE gel for a Western blot.
2. To proceed with a PNGase digest, add 20 µL of 2X denaturing buffer from thePNGase kit and boil 10 min. Using the capture magnet, remove the supernatant.Follow manufacturer’s instructions for PNGase treatment. We typically mix 3 µLof eluted sample together with 2 µL of NP-40, 1 µL of 10X G7 buffer, 1 µL of
136 De Luca and Lencer

PNGase, 3 µL of water, and incubate at 37°C for 2 h. In parallel, prepare andincubate a control digest containing all the reagents of the digest with the excep-tion of substituting water for PNGase. After digestion, add two microliters of 6Xsample buffer to the digested samples, and boil 10 min. The entire 12 µL is loadedonto a reducing SDS-PAGE gel and Western blotted for CTB.
3.2.5. SDS-PAGE and Western Blot
1. The following SDS-PAGE instructions assume the use of a Bio-Rad Mini Pro-tean Cell or Criterion Cell and Mini Trans Blot Cell or Criterion Blotter. If usingother systems, follow the manufacturer’s instructions. Load 3 µL of the undi-gested sample, 12 µL of the digested samples (± PNGase), and 2 µL of thereserved lysates into separate lanes of a 10 to 20% Tris-HCl ready gel (Bio-Rad).Assemble the gel apparatus and fill the gel box with SDS running buffer. Connectthe gel box to a power supply and run at approx 30 to 35 mA per gel until the dyefront has just reached the bottom of the gel.
2. After the gel is completed, disassemble the apparatus, remove the gel, and place itin a large (9 × 13 in) pan filled with transfer buffer. Open the transfer cassette andsubmerge the black side of the cassette in the pan. Place one pre-wet sponge ontothe black side of the cassette (this should be the interior of the cassette), and layersuccessively one piece of filter paper, the gel, one piece of nitrocellulose, onepiece of filter paper, and one sponge onto the cassette. Using the provided roller,very gently roll across the top of the transfer sandwich to remove any air bubbles.Close the cassette, assemble it the transfer cell with the black side of the cassettetoward the black electrode, and fill the cell with transfer buffer. Connect to a powersupply and transfer at 100 V for 45 min to 1 h (see Note 12).
3. After the transfer turn off the power, disassemble the transfer cell, remove thenitrocellulose blot, and properly dispose of the transfer buffer (see Note 13). Thenitrocellulose should be placed in a small incubation dish with blocking buffer andgentle shaking for a minimum of 1 h at room temperature.
4. Remove the blocking buffer, add a 12000 dilution of CTB antibody in blockingbuffer and incubate 1 h with gentle shaking at room temperature. After the pri-mary incubation, wash the blot three times for 5 min each with TTBS. Removethe last wash buffer.
5. Add a 12500 dilution of Anti-Rabbit IgG (whole molecule)–Peroxidase secondaryantibody in blocking buffer to the blot, and incubate for 1 h at room temperature.After the secondary incubation, wash the blot three times for 10 min each withTTBS, then two times for 10 min each with TBS.
6. Develop the blot with a chemiluminescent substrate for detection of horseradishperoxidase. We use the Pierce supersignal detection kit (Pierce, Rockford, IL).
4. Notes1. When making solutions with water, always use milliQ water with a resistivity of
18 MΩ. This is assumed for all solutions that are made with “water.”
Tracking Retrograde Transport 137

2. When purchasing 35S-sodium sulfate from Perkin Elmer, be sure to specify “highspecific activity” and request the freshest lot. We always plan the experiment tocoincide with the production of a fresh lot to ensure the highest activity.
3. To create 50% slurry, we typically determine the volume of beads by filling anidentical tube to the same volume of water, measuring this volume, doubling it,and adding enough wash buffer to the tube with beads to reach the doubledvolume.
4. We typically use an EDTA-free protease inhibitor tablet from Roche Diagnostics(Indianapolis, IN). The tablets are available in sizes to accommodate 10 or 50 mL.Various protease inhibitors can also be added individually to the solutions.
5. The radioactive containment box is used to prevent radio contamination of theCO2 incubator. The box is made by affixing a piece of charcoal paper to a cut outsection of the lid of a square (2.4 L) Tupperware® container. Charcoal pelletsare added to the bottom of the container. The plate of cells with 35S-sodiumsulfate is placed on top of the pellet layer, and the lid is closed. This device helpsto prevent 35S contamination of the incubator.
6. It is necessary to use a screw cap tube because of the subsequent boiling step. Thescrew cap prevents explosion of the tube which could result in radioactive conta-mination of the surrounding workspace.
7. Do not use any type of plastic wrap to cover the gel because the 35S signal is veryweak. For T84 cells we find 3 d to 2 wk is necessary to see a signal; 1 to 3 d areenough for Vero, Cos, and Y1 cells.
8. We typically incubate with toxin for 45 min on ice, then discard the incubationbuffer containing the toxin, add back 3 mL HBSS+, and incubate for an addi-tional 4.5 h at 37°C. It is also a good idea to run a negative control in parallel, inwhich the entire toxin incubation is held at 4°C. Because the toxin is not taken upat this temperature, the pulldown should be negative for CT.
9. The volume of the lysate is usually 1 mL; therefore, 1 mL of ConA-binding bufferis added. If the volume of cell lysate differs, simply change the volume of ConA-binding buffer added to make a 11 dilution. The bed volume of 100 µL of 50%slurry of ConA beads is 50 µL.
10. A solution of up to 1 M methyl α-D-mannopyranoside can be used without diffi-culty. We have found that 0.2 M methyl α-D-mannopyranoside solution may notalways elute the entire toxin sample off ConA beads. The 1-h incubation step canbe reduced to 30 min if necessary; however, the best results and highest elutionrates are observed with 1 hour incubation. It often is beneficial to repeat this elu-tion step by adding another 50 µL of methyl α-D-mannopyranoside to the beads,rotating 1 h, spinning at 3000g, and combining this 50 µL with the first elution of50 µL for a total of 100 µL.
11. An overnight incubation yields the best results for the GM1 pulldown. We suspectit takes some time for the CT to release from the membrane GM1 and bind to theGM1 beads.
12. It is imperative to follow the manufacturer’s instructions regarding cooling of thetank. Typically sufficient cooling is achieved by either adding a frozen ice block to
138 De Luca and Lencer

the transfer cell, or using a cooling coil in the transfer cell. A rise in temperature willcause the gel to transfer poorly, and may also damage the transfer equipment.
13. The methanol in the transfer buffer may be considered hazardous waste in someinstitutions.
AcknowledgmentsThis work was supported by DK48106 to WIL and DK34854 to the Harvard
Digestive Diseases Center.
References1. Lencer, W. I. (2004) Retrograde transport of cholera toxin into the ER of host
cells. Int. J. Med. Microbiol. 293, 491–494.2. Spangler, B. D. (1992) Structure and function of cholera toxin and the related
Escherichia coli heat-labile enterotoxin. Microb. Rev. 56, 622–647.3. Volz, B., Orberger, G., Porwoll, S., Hauri, H. P., and Tauber, R. (1995) Selective
reentry of recycling cell surface glycoproteins to the biosynthetic pathway inhuman hepatocarcinoma HepG2 cells. J. Cell Biol. 130, 537–551.
4. Porwoll, S., Loch, N., Kannicht, C., et al. (1998) Cell surface glycoproteinsundergo postbiosynthetic modification of their N-glycans by stepwise demanno-sylation. J. Biol. Chem. 273, 1075–1085.
5. Fujinaga, Y., Wolf, A. A., Rodigherio, C., et al. (2003) Gangliosides that associatewith lipid rafts mediate transport of cholera toxin from the plasma membrane to theER. Mol. Biol. Cell 14, 4783–4793.
6. Rapak, A., Falnes, P. Ø., and Olsnes, S. (1997) Retrograde transport of mutantricin to the endoplasmic reticulum with subsequent translocation to the cytosol.Proc. Natl. Acad. Sci. USA 94, 3783–3788.
7. Johannes, L., Tenza, D., Antony, C., and Goud, B. (1997) Retrograde transport ofKDEL-bearing B-fragment of shiga toxin. J. Biol. Chem. 272, 19,554–19,561.
8. Gavel, Y. and von Heijne, G. (1990) Sequence differences between glycosylatedand non-glycosylated Asn-X-Thr/Ser acceptor sites: implications for protein engineering. Protein Eng. 3, 433–442.
9. Bundgaard, J. R., Vuust, J., and Rehfeld, J. F. (1997) New consensus features fortyrosine O-sulfation determined by mutational analysis. J. Biol. Chem. 272,21,700–21,705.
10. Lencer, W. I., Constable, C., Moe, S., et al. (1995) Targeting of cholera toxin andE. coli heat labile toxin in polarized epithelia: role of C-terminal KDEL. J. CellBiol. 131, 951–962.
11. Lencer, W. I., Moe, S., Rufo, P. A., and Modara, J. L. (1995) Transcytosis of choleratoxin subunits across model human intestinal epithelia. Proc. Natl. Acad. Sci. USA92, 10,094–10,098.
Tracking Retrograde Transport 139


141
12
Isolation and Culture of Murine Heart and LungEndothelial Cells for In Vitro Model Systems
Yaw-Chyn Lim and Francis W. Luscinskas
SummaryThe inflammatory response is a critical component of host defense. An important goal of our
group has been to understand the endothelial-dependent mechanisms that mediate leukocyterecruitment during an inflammatory response. In this chapter, we present a detailed method forthe isolation and in vitro culture of murine vascular endothelial cells from the lung and heart. Theendothelial cells are of high purity (85–99%) and retain certain of their functional differences,including constitutive and cytokine inducible adhesion molecule expression and chemokine production. Such endothelial cells, therefore, can be used for various in vitro models includingleukocyte adhesion assay or in depth biochemical analyses.
Key Words: Inflammation; immunity; leukocytes; in vitro culture; cell heterogeneity.
1. IntroductionThe endothelial monolayer lining all blood vessels plays an active role in the
recruitment of blood leukocytes to tissues and organs in response to infection,injury, and immune responses. It is well documented that during an inflammatoryresponse, the endothelium becomes “activated” by inflammatory cytokines orbacterial endotoxins and regulates the expression of adhesion molecules and theproduction of chemokines that mediate blood leukocyte adhesion and transmigra-tion (1,2). Recent studies reveal that the endothelium is not homogenous becauseendothelial cells within various vascular beds and organs exhibit different cellu-lar and biochemical properties that are specifically adapted to meet the require-ments of their local environment (3–6).
Leukocyte recruitment is a critical component of the inflammatory and immuneresponse systems. However, when recruitment persists or becomes dysregulated,it can lead to numerous pathological conditions, including allergic reactions,
From: Methods in Molecular Biology, vol. 341: Cell−Cell Interactions: Methods and ProtocolsEdited by: S. P. Colgan © Humana Press Inc., Totowa, NJ

reperfusion injury, organ rejection, and atherosclerosis and result in massive tissueand organ damage. Many studies have been devoted to the elucidation of themolecular and biochemical signals that mediate these interactions in attempt toformulate effective therapeutic interventions. Much of the knowledge on thiscomplex phenomenon is generated from well-designed in vitro studies that useisolated human leukocytes and endothelial cells, such as human umbilical veinendothelial cells, in their model systems.
To study the mechanisms that initiate and propagate the immune and inflam-matory responses, investigators increasingly have turned to gene knockoutapproaches to create mice deficient in one or more molecules implicated in theseprocesses (7–9). However, the ability to set-up useful in vitro models usingendothelium from these knockout mice remains limited because the methods toisolate and culture murine endothelial cells have met with varying success. Thisin part is caused by the amount of tissue available from a mouse as well as thedifficulties isolating pure populations of endothelial cells. Nevertheless, the avail-ability of a simple, reproducible, and well-tested method to isolate murineendothelial cells would be useful because it would enable us to culture cells fromthese genetically modified animals for use in various in vitro model systems(5,10–12).
In this chapter, we describe a detailed protocol for the isolation, culture, andcharacterization of murine lung and heart endothelial cells. This protocol hasallowed us (and other groups) to generate endothelial cells from different mousestrains and backgrounds for in vitro models to study the role of adhesion mole-cules and chemokines in leukocyte–endothelial cell interactions under differentbiological conditions (5,13–15). A more detailed characterization of lung andheart endothelial cell phenotypes isolated using this protocol is available (5).
2. Materials2.1. Endothelial Cell Isolation and Culture
1. Collagenase solution: Hank’s Balanced Salt Solution (HBSS; Biowhittaker, cat.no. 10-543) containing 0.2 mg/mL (∼180–200 U/mL) type 1 collagenase (Wor-thington Biochemical Corporation; cat no. 4197; see Note 1).
2. Base medium: Dulbecco’s Modified Eagle’s Medium (Invitrogen Corporation,cat. no. 11965-092) containing 25 mM HEPES (Sigma; cat. no. H0887), 20%fetal calf serum, 100 U/100mg/mL penicillin and streptomycin, and 2 mML-glutamine (Invitrogen Corporation, cat. nos. 600-5140 and 320-5030, respec-tively; see Note 2).
3. Complete culture medium: 80 mL of base medium supplemented with heparin(Sigma, cat. no. H-3933, 100 µg/mL final concentration), endothelial cell growthstimulant (Biomedical Technologies, cat. no. BT-203, 100 µg/mL final concentra-tion), nonessential amino acid (Invitrogen Corporation; cat. no. 11140050), and
142 Lim and Luscinskas

Mouse Endothelial Cell Isolation 143
sodium pyruvate (Invitrogen Corporation, cat. no. 11360070) at 1X final concentra-tion, respectively.
4. Trypsin–versene mixture (0.5% trypsin–0.02% EDTA) from Invitrogen (cat. no.610-5300) or Biowhittaker (cat. no. 17-161).
5. Cell dissociation buffer from Sigma (cat. no. C5789).6. Precoat a 75-mm2 flask with sterile filtered 0.1% gelatin solution (Sigma; cat. no.
G1393) as follows: pipet 4 mL of 0.1% gelatin solution to generously cover thebottom of the flask, leave for 1 min, and remove any excess fluid. Air-dry flaskcompletely (4 h under tissue culture hood) before use. Solution can be reused forcoating additional flasks.
7. Dynal M-450 sheep anti-rat immunoglobulin (Ig)G magnetic beads (Dynal,cat. no. 110.07; concentration 4 × 10⁸ beads/mL).
8. Purified rat anti-mouse CD31 (PECAM-1, clone MEC13.3, 0.5 mg/mL concentra-tion, Pharmingen cat. no. 557355 or 553370) and rat-anti-mouse CD102 (intercellu-lar adhesion molecule [ICAM]-2, clone 3C4, 0.5 mg/mL concentration, Pharmingencat. no. 553326).
9. Dynal magnetic bead wash buffer (bead buffer): phosphate-buffered saline (PBS)containing 0.1% bovine serum albumin (Sigma, cat. no. A9647).
2.2. Endothelial Cell Characterization
2.2.1. Flow Cytometric Analysis (i.e., Fluorescence-Activated Cell Sorting)
1. Wash buffer/diluent–PBS containing 1% bovine serum albumin.2. Anti-mouse CD31 conjugated to APC (Pharmingen, cat. no. 551262) and anti-mouse
ICAM-2 (CD102) conjugated to fluorescein isothiocyanate (FITC; Pharmingen;cat. no. 557444). Use at 150 (v/v) in wash buffer/diluent.
3. Isotype-matched rat-IgG2a conjugated to FITC or APC (Caltag; cat. no. R2a01and R2a05, respectively). Use at 150 (v/v) dilution.
4. Fixative: 1% formaldehyde (37% stock, Baker Chemical) diluted (v/v) in PBS,pH 7.4.
2.2.2. Fluorescent Immunoassay
1. Wash buffer/diluent–PBS containing 1% bovine serum albumin (see Note 3).2. Rat antibodies against mouse ICAM-1 (clone YN1/1.7.4, ATCC no. CRL1878,
ascites) and vascular cell adhesion molecule (VCAM)-1 (clone M/K2.7, ATCCno. CRL1909, culture supernatant) were used at 1200 and 150 dilution, respec-tively. Purified mouse antibodies against mouse E-selectin (clone RME-1) and P-selectin (clone RMP-1) were kind gifts from Dr. Andrew Issekutz (DalhousieUniversity, Halifax, Canada) and were used at 10 µg/mL final concentration (seeNote 3).
3. Negative control was rat IgG (Caltag Laboratories; cat. no. 10700; 10 µg/mL) asnonbinding MAb control. An irrelevant nonbinding mouse monoclonal antibody(clone K16/16, IgG1 nonbinding control; hybridoma culture supernatant [16]) wasused undiluted.

4. FITC-conjugated anti-rat IgG (Caltag Laboratories, cat. no. M30101) or FITC-conjugated anti-mouse IgG (Caltag Laboratories, cat. no. M30101) was used at180 dilution.
2.3. Mice
Optimal results were obtained using three mice of 7 to 9 d of age. We usedmice from either C57/BL6 or the 129 background (Taconics Farm, Germantown,NY). The animals were sacrificed by carbon dioxide asphyxiation as approved bythe panel on euthanasia at the American Veterinary Association (see Note 4).
2.4. Instruments and Disposable Supplies for Organ Isolationand Tissue Dissociation
All metal instruments were sterilized by autoclaving; sterile disposables werefrom B-D Falcon.
2.4.1. Animal Dissection
1. Two pairs of scissors and two pairs of forceps. Stand the instruments in 70%ethanol (to minimize contamination) when not in use.
2.4.2. Tissue Dissociation
1. Two pairs of scissors.2. Two pairs of forceps.3. 6-in. long 14-G metal cannula (Fisher Scientific, 6-in. popper needles; cat. no.
1482516N).4. 70-µm pore size cell strainer (B-D Falcon, cat. no. 352350).5. 50-mL screw cap centrifuge tubes (B-D Falcon, cat. no.352098).6. 100-mm diameter cell culture dishes (B-D Falcon, cat. no.353003).7. 5-mL round-bottom tube with snap-cap (B-D Falcon, cat. no. 352058).
3. Methods3.1. Endothelial Cell Isolation and Culture
3.1.1. Precoating of Anti-Rat IgG Dynal Beads
In accordance with the manufacturer’s recommendations, our standardizedprotocol for the Dynal bead coating used 1.25 µg of antibody per 107 beads.The bead concentration was maintained at 4 × 10⁸ beads per milliliter.
1. Resuspend an aliquot of the Dynal magnetic beads in 1 mL of PBS + 0.1% bovineserum albumin (bead wash buffer), mix well, and place on Magnetic separator(Dynal MPC-S).
2. Remove supernatant and repeat wash three times.3. Resuspend beads in original volume with bead wash buffer.4. Add 5 µL (2.5 µg) of antibody for every 50 µL (2 × 10⁷) of beads.
144 Lim and Luscinskas

Mouse Endothelial Cell Isolation 145
5. Incubate bead suspension on an end-over-end rotator overnight at 4°C or for 3 hat room temperature.
6. Repeat wash (steps 1 and 2) four times.7. Resuspend immunobeads in the original volume with bead wash buffer (see Note 5).
Store beads at 4°C and use within 1 to 2 wk.
3.1.2. Dissection
1. Sacrifice the mice and totally submerge the carcass into 70% ethanol, taking carethat the skin and fur of the animal is soaked through.
2. Place two paper towels on a Styrofoam board and pin the mouse supine.3. Pick up the skin above the pubis with a pair of forceps, make a small incision in
the skin with a pair of scissors, and deglove the skin to above the chest.4. Spray chest/abdomen with 70% ethanol and remove any loose fur from gloves
and surgical field.5. Cut open the anterior abdomen and take down the anterior diaphragm.6. Grip the rib cage with the forceps and cut along the lateral walls of the chest.7. Flip the “freed” rib cage back and pin away from the exposed thoracic cavity
(see Fig. 1A).8. Switch to a second set of dissection instruments.9. Grasp the mediastinum and carefully cut the tissues and organs away from the
vertebral column. Place the excised tissue (see Fig. 1B) into a 50-mL tube con-taining 30 mL of ice-cold base medium.
10. Repeat dissection procedure with the other two mice.
3.1.3. Tissue Dissociation
Transfer the tissues to a sterile hood for the remainder of the protocol.
1. Using fresh instruments, transfer the tissues to a sterile, disposable 100-mm diam-eter tissue culture dish.
2. Grasp the heart, cut it away from the mediastinal tissue and remove most of theleft and right atria to reduce contamination of endothelial cells from large vessels(see Fig. 1C).
3. Make a central cut in the organ to open up the ventricles and put it into a freshtube containing 30 mL of base medium.
4. Dissect out the lobes of the lung carefully; taking care to cut away any visiblebronchi and mediastinal tissues (see Fig. 1D).
5. Cut the larger lobes of the lung into two and place them into another tube contain-ing 30 mL of base medium.
6. Repeat with the mediastinum from the other two mice and pool the organs intheir respective tubes. Label tubes to avoid cross contamination of organs.
7. Gently agitate the tubes (1 min) to wash out excess red blood cells from theorgans.
8. Place the hearts on a new, dry 100-mm diameter dish and mince finely with scissors(see Note 6).
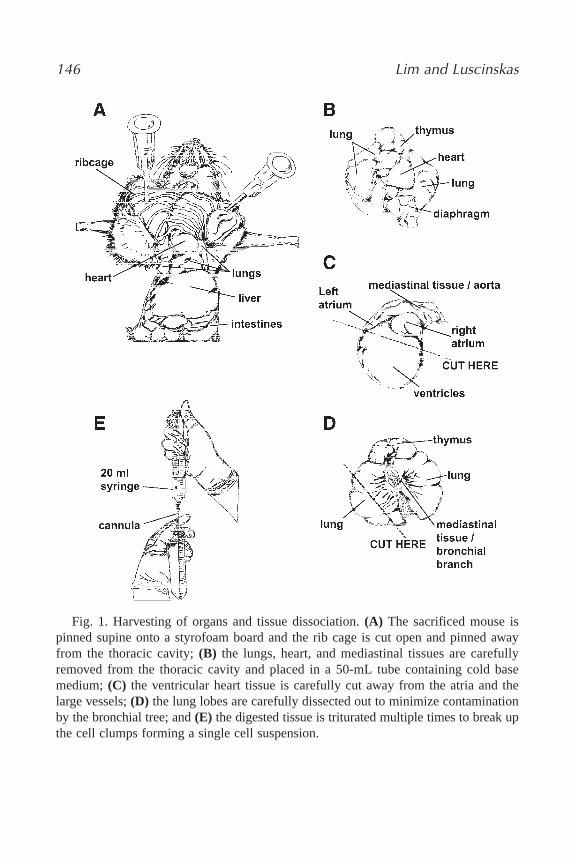
146 Lim and Luscinskas
Fig. 1. Harvesting of organs and tissue dissociation. (A) The sacrificed mouse ispinned supine onto a styrofoam board and the rib cage is cut open and pinned awayfrom the thoracic cavity; (B) the lungs, heart, and mediastinal tissues are carefullyremoved from the thoracic cavity and placed in a 50-mL tube containing cold basemedium; (C) the ventricular heart tissue is carefully cut away from the atria and thelarge vessels; (D) the lung lobes are carefully dissected out to minimize contaminationby the bronchial tree; and (E) the digested tissue is triturated multiple times to break upthe cell clumps forming a single cell suspension.
Mouse Endothelial Cell Isolation 147
9. Transfer the minced heart tissues to a 50-mL tube containing 15 mL of prewarmedcollagenase solution. Wash all the tissue bits off the dish and into the tube of collagenase.
10. Repeat steps 8 and 9 with the lung tissues.11. Incubate at 37°C with gentle agitation for 45 min.12. Attach a 20-mL syringe to a cannula; triturate the cellular suspension 12 to 20 times,
taking care to avoid frothing (see Fig. 1E).13. Filter the cell suspension through a 70-mm cell strainer into fresh 50-mL tube
and rinse the sieve with 15 mL of base medium.14. Use a new canula and sieve for each of the different tissues.15. Centrifuge the cell suspension at 400g (∼1300 rpm with a 15-cm diameter rotor)
for 8 min at 4°C.16. Discard supernatant and resuspend the heart endothelial cell preparation in 1 mL
of cold base medium. Transfer to 5-mL tube.17. Repeat step 16 with the lung preparation using 2 mL of cold base medium.
3.1.4. Cell Sorting: Primary Immunobead Isolation
From this point onward, both the heart and lung preparations are treatedidentically.
1. Add 15 µL of anti-CD31 coated beads for every milliliter of cell suspension.2. Incubate the tube on an end-over-end rotator for 10 min at room temperature.3. Place the tubes on a magnetic separator and leave for 2 min. Cell-bound and
unbound magnetic beads will be pulled to the magnet side of the tube.4. Gently, without moving the tube, aspirate the supernatant using a 9-in. glass Pasteur
pipet. The beads/cells pellet on the side of the tube should look somewhat foamy ifthere is a good yield of positively selected endothelial cells.
5. Remove the tube from the magnet and resuspend the pellet in 3 mL of basemedium (see Note 7).
6. Replace the tube back on the magnetic separator for 2 min; aspirate the super-natant carefully.
7. Repeat washes (steps 5 and 6) four times (or more) until the supernatant appearsclear.
8. After the last wash, resuspend beads/cell pellet in 3 mL of complete growth mediumand transfer to a gelatin coated T75 culture flask. Add 7 mL of complete medium.
9. Culture in a standard CO2 (5%) incubator.10. After an overnight incubation, remove the non-adherent cells, wash the adherent
cells twice with HBSS and add 10 mL of fresh complete medium.11. Re-feed cultures every other day with 10 mL of fresh complete medium.
3.1.5. Second Immunobead Isolation
The primary cultures are sorted a second time (second immunobead isolation)at 70 to 80% confluence (usually 7–9 d after plating), to improve endothelial cellpurity. These cultures should contain discrete colonies of endothelial cells with the

classical “cobblestone” appearance when viewed by phase contrast microscopy(see Fig. 2). Routinely, we discard and do not second immunobead sorted culturesthat contain less that 70% of “endothelial-like” cells as determined by cell mor-phology using phase contrast microscopy.
1. Remove culture supernatant and wash the endothelial monolayer twice with 7 mLof Ca/Mg-free HBSS.
2. Add 2mL of trypsin–EDTA, agitate gently, and incubate at 37°C for 3 min.3. Examine the flask by phase contrast microscopy to confirm that endothelial cells
have detached. Monitor this stage carefully to avoid over exposure to trypsin (seeNote 8).
4. Neutralize the trypsin with 10 mL of base medium and transfer the detached cellsto a 15-mL tube.
5. Centrifuge at 400g to pellet the cells.6. Aspirate the supernatant; resuspend the cell pellet carefully in 2 mL of base
medium and transfer to a round-bottom 5-mL tube.7. Add 30 µL of anti-CD102 coated magnetic beads (prepared per Subheading 3.1.1.)
and incubate for 10 min at room temperature on an end-over-end rotator (see Note 9).8. Place the tube with the cell suspension on a magnetic separator for 2 min to retain
cells; remove the supernatant.9. Resuspend the positively selected cell pellet in 3 mL of base medium and replace
on the magnetic separator. Repeat this wash step four times (steps 8 and 9).10. After the last wash, resuspend the cells in complete medium and plate onto a
gelatin-coated T75 culture flask (see Note 10).
148 Lim and Luscinskas
Fig. 2. Confluent mouse lung and heart endothelial cells in culture. Purified mouseendothelial cells were plated out in Dulbecco’s Modified Eagle’s Medium containingFCS, standard supplements, endothelial cell growth stimulant, heparin, sodium pyru-vate, and nonessential amino acids on gelatin-coated 75-mm2 flask. These cells grow asa monolayer in culture and exhibit the well-described cobblestone morphology.

Mouse Endothelial Cell Isolation 149
3.1.6. In Vitro Cell Propagation
1. The endothelial cell cultures are fed on alternate days with 10 mL of completeculture medium.
2. At confluence, the cultures should be detached with trypsin–EDTA and subcul-tured at a split ratio of no more than 13.
3. The cells should be used in experiments from passage 2 to 4 as follows: Theheart endothelial cells (MHECs) retain phenotypic markers (sw>80% positive forVE-cadherin, Tie2, and PECAM-1) at passage 4. In contrast, mouse lungendothelial cells (MLEC) retain these markers only up to passage 3 (5). Thepurity of cultured MLECs and MHECs will vary from preparation to preparation(see Subheading 3.3.).
3.2. Endothelial Lineage Characterization
3.2.1. Morphological Appearance
Both murine lung and heart endothelial cells (MLECs and MHECs, respec-tively) isolated by double-selection method are essentially of mixed vascular bedorigin (microvessels, arterial, venous). At confluence, these monolayers exhibitclassical cobblestone morphology typical of vascular endothelium (Fig. 2). However, overconfluent cultures tend to progressively acquire a more spindlyappearance as the cells pack more closely together.
3.2.2. Detection of Endothelial Cell Markers by Two-ColorFluorescence-Activated Cell Sorting
The lineage and purity of the cell cultures can be confirmed by immunostain-ing the cells (at subculture 1 or 2) for surface expression of two endothelial cellmarkers used for the cell isolation, namely platelet endothelial cell adhesionmolecule (PECAM)-1 and ICAM-2 or, alternatively, VE-cadherin.
1. Plate isolated endothelial cells in gelatin-coated 60-mm diameter tissue cultureplates.
2. Wash the confluent monolayer of endothelial cells twice with HBSS to removeany traces of serum.
3. Add 5 mL of prewarmed nonenzymatic cell dissociation buffer and incubate at37°C for 15 to 20 min. Monitor the cell detachment progress under a phase con-trast microscope. When the cells have all rounded up, gently triturate the media todetach cells and to create single, unicellular suspension (see Note 11).
4. Add 8 mL of base medium and transfer the cell suspension to a fresh 15-mL centrifuge tube.
5. Centrifuge at 400g to pellet cells.6. Resuspend cell pellet to 3 to 5 × 10⁶ cells/mL in wash buffer/diluent and aliquot
100 µL of cell suspension into each tube (see Note 12).

7. Add 2 µL of anti-PECAM-1 APC and 2 µL of anti-ICAM-2 FITC monoclonalantibodies to tube no. 1.
8. Add appropriate isotype controls to tube no. 2.9. Incubate on ice for 30 to 45 min (minimum is 30 min).
10. Add 1 mL of wash buffer/diluent to each tube, vortex gently, and centrifugeat 400g.
11. Repeat wash step with PBS.12. Suspend stained endothelial cells in 200 to 300 µL of fixative (1% formaldehyde
in PBS, pH 7.4).13. Keep tubes containing stained cells tightly capped and covered with aluminum
foil at 4°C until analysis.
3.2.3. Fluorescent Immunoassay of Constitutive and Inducible Adhesion Molecules
To characterize the ability of these cells to respond to proinflammatorycytokine stimulation, the expression of various constitutive and inducible adhe-sion molecules on unstimulated and tumor necrosis factor (TNF)-α-stimulatedMLECs and MHECs were detected by fluorescent immunoassay. Confluentmonolayers in 96-multiwell plates are stimulated with murine TNF-α(120 ng/mL in RPMI + 5% fetal calf serum (FCS) with L-glutamine and antibi-otics, 100 µL/well) for 6 or 24 h. Monolayers incubated with medium aloneserve as negative (unstimulated) control.
1. Wash wells with 200 µL of wash buffer/diluent twice (see Note 13).2. Incubate triplicate wells with diluted primary antibody or with control rat IgG or
murine nonbinding control K16/16 MAb (100 µL/well) for 45 min on ice.3. Wash five times with wash buffer/diluent.4. Incubate wells with diluted FITC-conjugated secondary antibody (diluted 100 µL/
well) for 45 min on ice.5. Wash five times with 200 µL wash buffer/diluent.6. Wash once with PBS.7. Read fluorescence at 485 nm in a fluorescence microtiter plate.
3.3. Quantification and Interpretation: General Conclusions
1. The endothelial cell purity varies from preparation to preparation, but generallytwice-sorted isolated MLEC and MHEC cultures that are between 85 and 99%PECAM-1 and ICAM-2 double positive at sc1 or sc2 as determined by fluorescence-activated cell sorting. These cells also are negative for VEGF-R3, thus suggestingthat the cultures were minimally contaminated by lymphatic endothelial cells (5).
2. The mean fluorescence ± standard deviation (SD) for each adhesion moleculeexpression is calculated as follows:
Step 1: Calculate the mean background fluorescence level from the mean (tripli-cate) negative control rat IgG, or K16/16 antibody wells.
150 Lim and Luscinskas

Fig. 3. Expression pattern of adhesion molecules on MLECs and MHECs. Consti-tutive expression of PECAM-1 and ICAM-2 is not influenced by TNF-α stimulationover the time period studied. In contrast, the expression of ICAM-1, E-selectin, and P-selectin is significantly elevated by continuous exposure to recombinant murine TNF-α. Surprisingly, expression of VCAM-1 on both MLEC and MHEC was not dra-matically further increased by TNF-α. Data are mean ± SEM from three experiments.(From ref. 5 with permission.)
Mouse Endothelial Cell Isolation 151
Step 2: Deduct the mean background fluorescent level from each test well toobtain a corrected mean fluorescence intensity for each well.
Step 3: Determine the mean net fluorescence ± SD for each set of triplicate wells.
3. Treatment with TNF-α should not significantly increase the expression PECAM-1and ICAM-2 on either MLEC or MHEC at any time point (Fig. 3, top panels)because these adhesion molecules are constitutively expressed (endothelial lineagemarkers) and not induced by TNF-α stimulation.
4. Both MLECs and MHECs show constitutive ICAM-1 expression in culture, whichis significantly upregulated by TNF-α after 6 and 24 h of continuous treatment(Fig. 3, top panel).
5. Resting MLECs and MHECs did not express P- or E-selectin, but both moleculeswere induced after 6 h of treatment with TNF-α. The increased levels of bothselectins returned to baseline by 24 h (Fig. 3, bottom panel).

6. VCAM-1 was constitutively expressed at high levels in MHECs, whereas the levelswere significantly lower in MLECs. Treatment of MHECs with murine TNF-α for6 or 24 h did not induce a further increase. MLEC expression of VCAM-1 wasincreased after both 6 and 24 h of TNF-α treatment, but the increases did not reachstatistical significance (Fig. 3; [5]).
7. Taken together, these data indicate that endothelial cells from different vascularbeds do exhibit differences in their constitutive expression of VCAM-1. In addition,vascular endothelium isolated from lung and heart and propagated in vitro doesretain certain of these properties and can be triggered by TNF-α to upregulateadhesion molecules that mediate leukocyte recruitment.
4. Notes1. Collagenase preparation. Dissolve collagenase in HBSS by incubation at 37°C
for 1 h before sterile filtering with 0.22-µm filter. Collagenase solution should beprepared fresh and excess solution used within the week.
2. The efficacy of FCS to support endothelial cell growth and proliferation variesbetween commercial vendors and also from lot to lot from the same vendor.Whenever possible, FCS should be batch tested for endothelial cell growth supportbefore use and optimal FCS purchased in bulk.
3. Add 1% goat serum to the wash buffer/diluent if there is noticeable non-specificbackground staining. Anti-E-selectin and anti-P-selectin antibodies are also avail-able from BD Pharmingen (clone 10E9.6, Pharmingen cat. no. 553749 and cloneRB40.34, Pharmingen cat. no. 553742, respectively).
4. Although our previous studies (5) used mice from 6 to 7 wk of age, our new stud-ies (Lamont and Luscinskas, unpublished observations) show endothelial cells iso-lated from pups 7 to 9 d of age routinely display better growth and morphologycharacteristics and longer resection (beyond passage 4) of phenotypic markers asassessed by FACS of VE cadherin.
5. 0.02% sodium azide may be added to the anti-CD31 (or anti-CD102)-coatedbeads as preservative but must be removed by wash before use in cell purificationoutlined here.
6. It is not necessary to add any medium to the tissue while mincing because therewill be sufficient fluid carry-over from the wash to keep the tissue moist.
7. Avoid the natural tendency to be too gentle with the resuspension steps in Subheadings 3.1.4. and 3.1.5. The cells/beads clumps must be properly “brokenup” to get rid of any unbound cells (i.e., nonendothelial cells) caught within theclumps. However, overvigorous pipetting may dislodge beads from the cells!
8. Overexposure to trypsin will affect the viability of cells. If so desired, the detach-ment of rounded cells can be sped up with a sharp tap on the side of the flask withan open palm.
9. Murine PECAM-1 (CD31) is trypsin sensitive and anti-CD31 beads should not beused for the second-sort.
10. After the second-sort, plate the cells on a single T75 flask. It is important to main-tain high cell density plating to avoid large numbers of senescent cells.
152 Lim and Luscinskas
Mouse Endothelial Cell Isolation 153
11. Alternatively, the monolayers can be detached by brief trypsin-versene EDTAtreatment of no longer than 2 min at 37°C.
12. A confluent monolayer of endothelial cells from a T75 flask contains 1–3 × 10⁶ cells.For fluorescence-activated cell sorting analysis, the cells are used at 0.3 to 0.5 × 10⁶
cells/100 µL reaction volume.13. Check five random wells under the phase contrast microscope to confirm mono-
layers remained intact during the wash steps. We used unfixed monolayers in thisprotocol because the anti-E-selectin (RME-1) and anti-P-selectin (RMP-1) anti-bodies are not suitable for use on fixed cells.
AcknowledgmentsWe thank the late William Atkinson for his invaluable early contributions to
this project. We appreciate the advice, assistance, and helpful suggestions of ourcolleagues Drs. Andy Connolly (Department of Pathology, Stanford Univer-sity, Palo Alto, CA), Jennifer Allport (Novartis, Cambridge, MA), MichaelGimbrone, and Guillermo Garcia-Cardena (Brigham and Women’s Hospital,Boston, MA). We thank Dr. Andrew Issekutz for his kind gifts of reagents andMr. Matsuni bin Hamzah of Medical Illustration Unit, Department of Pathol-ogy, National University of Singapore for his assistance in generating Fig. 1.This work was supported by National Institutes of Health grants HL36028,HL56985, HL65090 and HL53993.
References1. Adams, D. H. and Shaw, S. (1994) Leucocyte-endothelial interactions and regulation
of leucocyte migration. Lancet 343, 831–836.2. Springer, T. A. (1994) Traffic signals for lymphocyte recirculation and leukocyte
emigration: the multistep paradigm. Cell 75, 301–314.3. Gerritsen, M. E. (1987) Functional heterogeneity of vascular endothelial cells.
Biochem. Pharmac. 36, 2701–2711.4. Stevens, T., Rosenberg, R., Aird, W. C., et al. (2001) NHLBI workshop report:
endothelial cell phenotypes in heart, lung, and blood diseases. Am. J. Physiol. CellPhysiol. 281, C1422–C1433.
5. Lim Y-C., Garcia-Cardena, G., Allport, J. R., et al. (2003) Heterogeneity of endo-thelial cells from different organ sites in T-cell subset recruitment. Am. J. Pathol.162, 1591–1601.
6. Rajotte, D., Arap, W., Hagedorn, M., Koivunen, E., Pasqualini, R., and Ruoslahti, E.(1998) Molecular heterogeneity of the vascular endothelium revealed by in vivophage display. J. Clin. Invest. 102, 430–437.
7. Goodarzi, K., Goodarzi, M., Tager, A. M., Luster, A. D., and von Andrian, U.(2003) Leukotriene B4 and BLT1 control cytotoxic effector T cell recruitment toinflamed tissues. Nature Immunol. 4, 965–973.
8. Aird, W. C., Edelberg, J. M., Weiler-Guettler, H., Simmons, W. W., Smith, T. W.,and Rosenberg, R. D. (1997) Vascular Bed-specific expression of an endothelial

cell gene is programmed by the tissue microenvironment. J. Cell Biol. 138,1117–1124.
9. Savinov, A. Y., Wong, F. S., Stonebraker, A. C., and Chervonsky, A.V. (2003)Presentation of antigen by endothelial cells and chemoattraction are required forhoming of insulin-specific CD8+ T cells. J. Exp. Med. 197, 643–656.
10. Gerritsen, M. E., Shen C-P., Mchugh, M. C., et al. (1995) Activation-dependentisolation and culture of murine pulmonary microvascular endothelium. Microcircu-lation 2, 151–163.
11. Dong, Q. G., Bernasconi, S., Lostaglio, S., et al. (1997) A general strategy for iso-lation of endothelial cells from murine tissues—Characterization of two endothelialcell lines from the murine lung and subcutaneous sponge implants. Arterioscler.Thromb. Vasc. Biol. 17, 1599–1604.
12. Marelli-Berg, F. M., Peek, E., Lidington, E. A., Stauss, H. J., and Lechler, R. I.(2000) Isolation of endothelial cells from murine tissue. J. Immunol. Methods 244,205–215.
13. Allport, J. R., Lim Y-C., Shipley, J. M., Senior, et al. (2002) Neutrophils fromMMP-9-or neutrophil elastase-deficient mice show no defect in transendothelialmigration under flow in vitro. J. Leukoc. Biol. 71, 821–828.
14. Tager, A. M., Bromley, S. K., Medoff, B. D., et al. (2003) Leukotriene B4 recep-tor BLT1 mediates early effector T cell recruitment. Nat. Immunol. 4, 982–990.
15. Peng, X., Ueda, H., Zhou, H., et al. (2004) Overexpression of focal adhesionkinase in vascular endothelial cells promotes angiogenesis in transgenic mice. Cardiovasc. Res. 64, 421–430.
16. Luscinskas, F. W., Ding, H., and Lichtman, A. H. (1995) P-selectin and vascularcell adhesion molecule 1 mediate rolling and arrest of CD4+ T lymphocytes onTNF-α-activated vascular endothelium under flow. J. Exp. Med. 181, 1179–1186.
154 Lim and Luscinskas

155
From: Methods in Molecular Biology, vol. 341: Cell−Cell Interactions: Methods and ProtocolsEdited by: S. P. Colgan © Humana Press Inc., Totowa, NJ
13
Expression Cloning of Signaling Proteins Regulated by Cell Adhesion
Michelle L. Matter and Joe W. Ramos
SummaryMany proteins involved in cell–cell and cell–matrix adhesion are regulated by signal
transduction pathways and can activate signal transduction on ligation. Adhesion-related signaltransduction is important throughout development, hemostasis, immunity, and in diseases such ascancer. Therefore, the identification of the various signaling pathways that are involved is crucial.Expression cloning is an unbiased way to isolate proteins with specific biological functions. Thismethodology has been adapted for the identification of proteins involved in cell signaling path-ways that are mediated by cell–cell and cell–matrix interactions. We have successfully developedand used a novel expression cloning strategy to isolate the integrin-regulated apoptosis signalingprotein BIT-1. This screen was based on previous observations that integrin-mediated adhesionupregulates the anti-apoptotic protein bcl-2. Our strategy described in this chapter uses flowcytometry and a reporter construct in which the bcl-2 promoter is linked to enhanced greenfluorescence protein. The advantage of using flow cytometry in expression cloning is that itincreases the sensitivity of the screen by enabling us to examine function quantitatively at thelevel of a single cell millions of times in one experiment. The following protocol provides adetailed method for the isolation of proteins that are regulated by cell adhesion.
Key Words: Expression cloning; integrin; cell–cell adhesion; cell–matrix adhesion; flow cytom-etry; EGFP; bcl-2; Bit-1.
1. IntroductionCell surface proteins that mediate cell–cell and cell–matrix adhesion such as
cadherins and integrins are regulated by signal transduction pathways and canthemselves activate signal transduction in response to adhesion (1–3). Oneapproach that has been used to successfully identify some of the proteins thatmediate these signaling events is expression cloning. Expression cloning allowsfor the isolation of complementary DNAs (cDNAs) that encode proteins with a
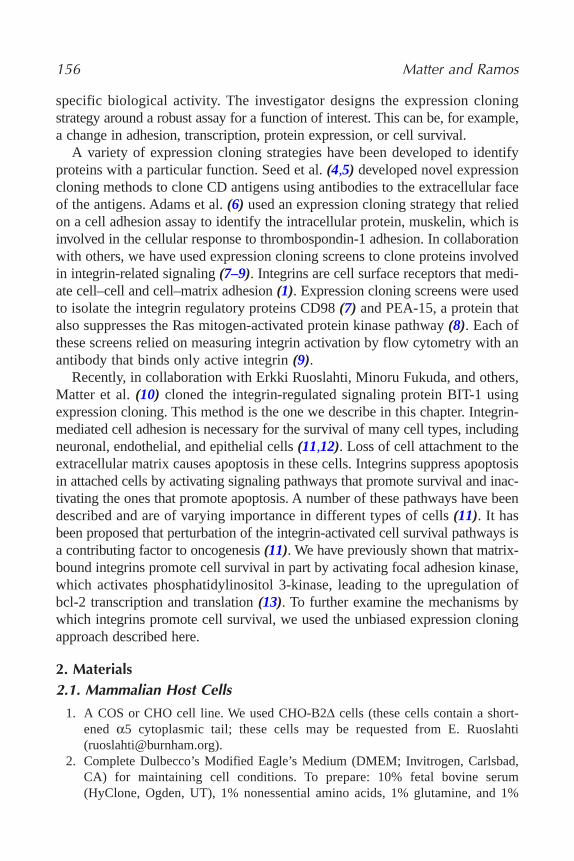
specific biological activity. The investigator designs the expression cloningstrategy around a robust assay for a function of interest. This can be, for example,a change in adhesion, transcription, protein expression, or cell survival.
A variety of expression cloning strategies have been developed to identifyproteins with a particular function. Seed et al. (4,5) developed novel expressioncloning methods to clone CD antigens using antibodies to the extracellular faceof the antigens. Adams et al. (6) used an expression cloning strategy that reliedon a cell adhesion assay to identify the intracellular protein, muskelin, which isinvolved in the cellular response to thrombospondin-1 adhesion. In collaborationwith others, we have used expression cloning screens to clone proteins involvedin integrin-related signaling (7–9). Integrins are cell surface receptors that medi-ate cell–cell and cell–matrix adhesion (1). Expression cloning screens were usedto isolate the integrin regulatory proteins CD98 (7) and PEA-15, a protein thatalso suppresses the Ras mitogen-activated protein kinase pathway (8). Each ofthese screens relied on measuring integrin activation by flow cytometry with anantibody that binds only active integrin (9).
Recently, in collaboration with Erkki Ruoslahti, Minoru Fukuda, and others,Matter et al. (10) cloned the integrin-regulated signaling protein BIT-1 usingexpression cloning. This method is the one we describe in this chapter. Integrin-mediated cell adhesion is necessary for the survival of many cell types, includingneuronal, endothelial, and epithelial cells (11,12). Loss of cell attachment to theextracellular matrix causes apoptosis in these cells. Integrins suppress apoptosisin attached cells by activating signaling pathways that promote survival and inac-tivating the ones that promote apoptosis. A number of these pathways have beendescribed and are of varying importance in different types of cells (11). It hasbeen proposed that perturbation of the integrin-activated cell survival pathways isa contributing factor to oncogenesis (11). We have previously shown that matrix-bound integrins promote cell survival in part by activating focal adhesion kinase,which activates phosphatidylinositol 3-kinase, leading to the upregulation ofbcl-2 transcription and translation (13). To further examine the mechanisms bywhich integrins promote cell survival, we used the unbiased expression cloningapproach described here.
2. Materials2.1. Mammalian Host Cells
1. A COS or CHO cell line. We used CHO-B2∆ cells (these cells contain a short-ened α5 cytoplasmic tail; these cells may be requested from E. Ruoslahti([email protected]).
2. Complete Dulbecco’s Modified Eagle’s Medium (DMEM; Invitrogen, Carlsbad,CA) for maintaining cell conditions. To prepare: 10% fetal bovine serum(HyClone, Ogden, UT), 1% nonessential amino acids, 1% glutamine, and 1%
156 Matter and Ramos

penicillin–streptomycin. Prepare in DMEM and sterilize through a 0.2-micronfilter. Store at 4°C (see Note 1).
3. L-glutamine (cat. no. G9273, Sigma, St. Louis, MO).4. Nonessential amino acids (Sigma, cat. no. M7145).5. Penicillin–streptomycin (Invitrogen).
2.2. cDNAs, cDNA Library, and cDNA Preparation
1. 3 M sodium acetate, pH 7.0 (Sigma, cat. no. 52404).2. Ampicillin (AMP; 25 µg/mL; Sigma).3. Tetracycline (Tet; 10 µg/mL; Sigma).4. A cDNA library that has been directionally cloned into a mammalian expression
vector (see Note 2).5. Falcon no. 2059 tubes.6. Glycerol (Sigma).7. MC1061/P3 cells at a competency of 109 or more colony-forming units per µg
(cfu/µg) DNA (Invitrogen, San Diego, CA; see Note 3).8. DNA maxi and mini-prep kits (Qiagen, Valencia, CA).9. Promoterless enhanced green fluorescence protein (EGFP-1; BD Biosciences
Clontech, Palo Alto, CA, cat. no. 6086-1). 10. Phenolchloroformisoamyl alcohol (25241; Sigma, cat. no. P3803).11. Lysogeny Broth (LB) Medium (Invitrogen).12. SOC Medium (Invitrogen).13. Nitrocellulose membranes (15 cm, BA-85, Schleicher & Schuell, Keene, NH).14. Polyoma large T-antigen, if not present in cell line (see Note 2).15. 100-mm tissue culture dishes (Falcon).16. 15-cm plates (Falcon).
2.3. Cell Transfection and Cell Isolation
1. LipofectAMINE (Invitrogen) or other appropriate and efficient transfection reagent.2. Polystyrene tubes (Falcon, cat. no. 2054).3. 1X PBS (10X solution): 87.7 g of NaCl, 7.1 g of Na2HPO4 (anhydrous), and 6.0 g
of NaH2PO4 (anhydrous). Dissolve in 1 liter of double-distilled (dd)H2O, pH 7.2.Dilute 110 in ddH2O for a 1X solution.
4. Hirt’s solution: 0.6% sodium dodecyl sulfate, 10 mM ETDA in 5 mL of ddH2O.5. 5 M NaCl (Sigma).6. Buffer-saturated phenol (Invitrogen).7. High-performance liquid chromatography-grade H2O.
2.4. Fluorescence-Activated Cell Sorting
1. Cell dissociation solution (enzyme-free Hank’s based Cat S-004-H, SpecialtyMedia Division of Cell and Molecular Technologies Inc., Phillipsburg, NJ).
2. EDTA (10 mM; Sigma).3. 0.2 mg/mL; Propidium iodide (Sigma).4. 5% fetal calf serum (Invitrogen).
Expression Cloning 157

2.5. Equipment
1. Fluorescence-activated cell sorter (FACS; FACSTAR, Becton Dickinson, FranklinLakes, NJ).
2. Flow cytometer (FACScalibur, Becton Dickinson).3. 42°C water bath.4. Electroporator.
3. MethodsThe following strategy describes an expression cloning screen to identify
proteins involved in signaling mediated by cell–matrix adhesion. This method isbriefly described in Fig. 1. This method also may be adapted to identify pro-teins in other signaling pathways including cell–cell adhesion. Expressioncloning has numerous advantages for the identification of adhesion proteins andproteins that regulate their signaling. It provides an unbiased approach to cloneproteins that are involved in adhesion or that may affect adhesion related signal
158 Matter and Ramos
Fig. 1. Expression cloning of transcriptional regulators of bcl-2. CHO∆ cellsattached to fibronectin were transfected with a fetal brain cDNA library, the polyomalarge T-antigen and the bcl-2 promoter EGFP marker. Cells expressing EGFP were col-lected by a sterile fluorescence-activated cell sorter and plasmid DNA was isolated byHirt supernatant. Sibling selection using analytical fluorescence-activated cell sortinganalysis to identify positive groups of cells was repeated five times until a single clonethat upregulated the bcl-promoter EGFP marker was isolated.

transduction. Every protein expressed in the cDNA library is tested in the screenand the assay determines the functional relevance of the clones. Moreover, pro-teins can be isolated that have a functional relationship to adhesion but do notinteract directly with specific adhesion proteins. The main disadvantages ofexpression cloning are that functional alterations that require more than one pro-tein may not be isolated and functions resulting from posttranslational modifica-tions can not be identified.
The expression cloning strategy we describe was successful in isolating theintegrin-regulated signaling protein BIT-1 (10). We previously reported that inserum-free conditions cell attachment through the α5β1 integrin promotesupregulation of bcl-2 at both protein and transcriptional levels by activatingShc, which activates focal adhesion kinase, which activates phosphatidylinositol3-kinase (13). Our screening strategy relied on inactivating this integrin-mediatedsignaling pathway and isolating clones that increased bcl-2 levels in these cells.Because expression cloning relies on the expression of a library of cDNAs, itis essential that it be done in cells that are highly transfectable and that expressexogenous protein well. We used a CHO cell line with an α5 cytoplasmic dele-tion that inhibits upregulation of bcl-2. These cells were transfected with a fetalbrain-derived cDNA library. The cells were also transfected with a plasmid thatexpressed EGFP (a green fluorescent protein) under the control of the bcl-2 pro-moter. Thus cells in which bcl-2 transcription was upregulated would fluoresceat 511 nm. This fluorescence was monitored in a flow cytometer, and cellsin which bcl-2 transcription was upregulated were isolated (as detected byEGFP expression). This system allows for rapid and quantitative measurementof millions of cells in a single experiment and thus increases the sensitivity ofthe screen.
The remainder of our expression cloning method involves sibling selectionas described herein and was adapted from a method that was used to isolate anovel sulfotransferase using antibody binding and flow cytometry (14). It isalso important to note that the cDNAs we isolated were not necessarily specificfor integrin-activated signaling. Anything that could generally upregulate bcl-2might also be cloned. Further experiments are usually required to verify therelevance of a newly identified cDNA. In this way, BIT-1 was identified as anovel regulator of apoptosis by integrins.
3.1. Cell Transfection
It is important to have adequate controls in addition to having a sufficientnumber of experimental samples for sorting the cells and recovery of plasmidcDNA. Controls should include (1) control plate 1 containing co-transfected trans-fection marker plasmid (promoter bcl-2 EGFP), empty vector plasmid, and thepolyoma large T-antigen; and (2) control plate 2 containing co-transfected EGFP
Expression Cloning 159

under its own promoter, the empty vector plasmid (pcDNA3.1; see Note 2),and polyoma large T-antigen (this control allows assessment of overall transfec-tion efficiency). These two controls allow the baseline fluorescence of the cellsto be measured (control plate 1) and the overall efficiency of the transfection(control plate 2). In addition, they are helpful when setting the collection gate onthe cell sorter.
1. Twenty-four hours before transfection, plate cells to be transfected at 2 × 10⁶ cellsper plate in 100-mm tissue culture dishes (at least 20 plates total; see Note 4).
2. Transfect cells with 20 µL of LipofecAMINE in 100 µL of serum-free DMEM,according to the manufacturer’s direction along with the following plasmids orDNAs:Control plate 1: 4 µg og bcl-2 promoter EGFP, 6 µg of vector DNA plasmid(pcDNA3.1; see Note 2), and 4 µg of polyoma large T-antigen.
Control plate 2: 4 µg of EGFP-C1 (this has its own promoter; Clontech), 6 µg ofvector DNA plasmid (pcDNA3.1), and 4 µg of polyoma large T-antigen.
Sort plates: 4 µg of bcl-2 promoter EGFP, 6 µg of cDNA library (fetal braincDNA library) and 4 µg of polyoma large T-antigen.
3. Incubate for 24 hours at 37°C, in 5% CO2 and 95% humidity.4. Wash all plates with 2 mL of serum-free DMEM media.5. Add 10 mL of serum-free DMEM and incubate cells for an additional 24 h at
37°C in 5% CO2 and 95% humidity.
3.2. Fluorescence-Activated Cell Sorting
1. After 24-h incubation time, aspirate media from the dishes.2. Rinse with 5 mL of 1X PBS. Remove supernatant.3. Add 10 mL of Cell Dissociation Solution + 10 mM EDTA to the sort plates and
control plates.4. Incubate for 5 min at room temperature.5. Collect cells from sort plates and combine into one 50-mL tube (labeled sort
cells).6. Centrifuge the sort cells and the control cells at 120g in a tabletop centrifuge at
room temperature to pellet the cells.7. Aspirate supernatant.8. Resuspend the sort cells in 1.4 mL of DMEM media by gentle agitation of each
tube.9. Divide the sort cells into six tubes (Falcon, cat. no. 2054) of 225 µL each.
10. Resuspend the control cells separately, each in 200 µL of DMEM.11. Add propidium iodide (0.1 µg to 0.5 µg per 1 × 10⁵ cells) to the samples. Incu-
bate all tubes on ice in the dark for 5 min (see Note 5).12. Wash the cells with 2 mL of cold 1X PBS.13. Centrifuge the cells for 5 min at 120g at room temperature.14. Resuspend and combine sort cells in a total of 4 mL of 1X PBS.
160 Matter and Ramos

15. Resuspend each tube of control cells in 500 µL of 1X PBS.16. Set the parameters for FACS such that highly transfected control cells from con-
trol plate 2 fall within the gate, whereas similarly transfected control cellsfrom control plate 1 do not.
17. Collect the EGFP positive sort cells by FACS, into 1 mL of complete DMEMmedia (see Note 6).
3.3. cDNA Recovery From Hirt Supernatant
1. Add an equal volume of 2X lysis buffer (1.2% sodium dodecyl sulfate/20 mMEDTA, pH 7.4) to the tube containing 1 mL of sorted cells.
2. Mix by inversion and incubate for 15 min at room temperature.3. Add 500 µL of 5 M NaCl, mix and incubate overnight at 4°C.4. Transfer sorted cells into two sterile microcentrifuge tubes, centrifuge for 20 min
at 18,000g at 4°C.5. Carefully transfer and combine supernatant into a 15-mL Falcon polypropylene tube.6. Phenolcholoroform extract each supernatant twice (see Note 7).7. Transfer aqueous phase equally into four microtubes.8. Transfer content of each tube into a Microcon Unit (Microcon 30; Amicon) that
is on a filtrate collection tube.9. Close cap and centrifuge at 18,000g for 10 min (or until there is 10 to 20 µL of
retentate remaining).10. Add 400 µL of high-performance liquid chromatography-quality H2O to the Micro-
con unit and spin at 18,000g for 10 min. Repeat this step three times to ensure saltremoval because salt can negatively affect the subsequent electroporation step.
11. Remove Microcon unit and invert into a new collection tube (see Note 8).12. Add 8 µL of sterile DI H2O directly into the six small holes of the Microcon unit
and pulse spin at high speed for 5 s (see Note 9).13. Remove unit from each collection tube and discard Microcon unit. Keep plasmid
samples on ice.
3.4. Electroporation
1. Prepare LB AMP/Tet plates (AMP at 25 µg.mL; Tet at 10 µg/mL).2. Take 1 µL of plasmid cDNA and electroporate into MC1061/P3 cells (efficiency
is usually from 1 × 10⁷ to 1 × 10⁸ colony-forming units/µg DNA).3. Titer to see how many colonies per 1 µL. Rescue cells in 500 µL of SOC media
and grow for 1 h at 37°C.4. Plate 10, 100, and 250 µL onto 15-cm LB AMP/Tet plates.5. Place remaining samples at –20°C until required.
3.5. Sib-Selection of Clones and Detection of Positive Clones
1. Calculate the amount of plasmid DNA required for electroporation into bacterialcells to obtain 500 to 1000 colonies per 15-cm LB AMP/Tet plate. Enough plas-mid samples should be electroporated to obtain 8000 colonies, which requireusing between 10 to 16, 15-cm LB AMP/Tet plates (see Note 10).
Expression Cloning 161

2. Label plates. Incubate overnight (<16 h) at 37°C.3. Prepare 16 nitrocellulose membranes and carefully layer over the agar. Incubate
upside down for 5 h at 37°C.4. Carefully remove membrane from each plate. Place each membrane (colony side
up) into a labeled 15-cm Petri dish. 5. Prepare 170 mL of LB AMP/Tet (50 µg AMP and 10 µg Tet/mL). Transfer 10 mL
of LB AMP/Tet to each plate containing a membrane.6. Using a sterile cell scraper, scrape off the colonies from each membrane. Trans-
fer culture into a labeled sterile 50-mL centrifuge tube. Secure lid with a piece oftape (do not tightly close lid) and incubate overnight at 37°C.
7. Make a permanent stock of each of the cultures by removing 900 µL of culture intoa sterile microfuge tube containing 100 µL of dimethyl sulfoxide. Store bacteriaat –80°C.
8. Isolate and purify the plasmids from the remaining 9 mL using a Qiagen miniplasmid kit (see Note 11).
9. Dissolve each plasmid pool into 100 µL of 1X Tris-EDTA buffer, pH 7.5. 10. Determine the concentration of plasmid by absorbance at A260 nm and store plas-
mid preps at –20°C.
3.6. Sib-Selection of Clones and Detection of Positive Clones by FAC Analysis
At this step, the goal is to identify the pools of cDNAs that induce the signalthat is being measured. The example described here is the ability of the proteinfrom one of the cDNAs to activate bcl-2 promoter signaling and thereby turn onEGFP. These isolated cDNAs will substitute for the library in the initial screen-ing process. The cells will have to be collected and subjected to FACS analysisfollowing the same procedure as that described for the library screening methodabove (see Note 12).
1. Co-transfect 8 µg of each pool of DNA into the cells along with 6 µg of activa-tor (bcl-2 promoter-EGFP) and 6 µg of polyoma large T-antigen. In addition,transfect the two control plates as described previously.
2. Isolate the cells as described previously.3. Perform analytical FACS to identify the cDNA pools that produce the desired
change in the activity of the pathway (here it is the upregulation of bcl-2 transcrip-tion that is visualized by EGFP expression).
4. From positive FACS analysis of EGFP expression prepare DNA by Qiagenminiprep according to standard protocol.
5. Repeat sib-selection on the plasmid pool that showed positive results in the FACSanalysis by overlaying a labeled nitrocellulose membrane onto the master plate forthat plasmid group. Mark the membrane into eight equal quadrants with a pencil.These marked quadrants should then be traced onto the agar-side (bottom) of the15-cm LB master plate using a black felt tip pen and labeled 1 to 8 accordingly
162 Matter and Ramos

(see Note 13). Incubate the master plates with the marked nitrocellulose membranesfor 5 h at 37°C.
6. Carefully peel nitrocellulose membrane off the master plates and cut into the eightmarked quadrants.
7. Scrape the colonies growing on each quadrant into 10 mL of LB-AMP/Tet usinga sterile cell scraper.
8. The plasmids from each quadrant of each master plate are then isolated and puri-fied using a Qiagen mini plasmid kit.
9. Cell transfection is repeated until another sub-pool of positive clones is isolated byanalytical FACS.
10. Repeat this procedure until one positive clone is isolated.11. The plasmid DNA from this clone is then isolated, purified and sequenced (see
Note 14).
4. Notes1. During expression cloning experiments using our system, no fetal bovine serum is
added to the DMEM.2. Although there are several options in preparing a cDNA library, we chose to
purchase a premade cDNA library from a commercial source. We used a fetalbrain cDNA library (Clontech) cloned into pcDNA1, which is no longer availablecommercially. A replacement vector such as pcDNA3.1 may be used; however,it lacks the polyoma origin of replication and instead contains an SV40 origin.Therefore, the cell line will need to express the SV40 T-antigen to obtain highplasmid amplification. If a murine host cell line is used, then the cDNA encodingthe polyoma large T-antigen should be co-transfected. This will promote increasedamplification of the desired plasmid (the plasmid should harbor the polyomaorigin of replication).
3. The pcDNA1 vector contains the supF suppressor tRNA, which allows theMC106/P3 cells containing pcDNA1 to be resistant to both AMP and Tet.MC1061/P3 cells containing the polyoma large T-antigen (pPSVE1-PyE) are resis-tant to AMP but not to Tet. This fact allows for the isolation of plasmids derivedfrom pcDNA1 to be obtained and amplified.
4. We transfect 16 sort plates per screen and two control plates.5. Propidium iodide stains the dead cells and allows them to be removed from the
sort gate.6. We sorted more than 6 × 10⁶ cells and collected at least 70,000 cells. Make a note
of the number of cells sorted and collected for comparison between multiple screens.7. Make sure that you no longer see the interface. If it is still apparent, then do one
more extraction.8. It is important to use new tubes at this step.9. It is important to place the H2O directly into the small holes using a P10 pipet.
10. To obtain 8000 colonies, 6 µL of plasmid DNA is electroporated into 6X 20-µLcells. These plates must be dried for 15 min at 42°C to have a distribution ofcolonies over the entire plate surface.
Expression Cloning 163

11. For a higher yield, use 2X the volume of P1, P2, and P3 solutions when using apcDNA1-derived cDNA library.
12. Changes in the activity of the signaling pathway may be very low during theinitial rounds of screening, but the signal should increase as the individual cDNAclone is isolated.
13. Careful concise labeling is imperative for each of the 16 master plates and subse-quent overlays with nitrocellulose.
14. Isolation of a single active clone usually requires three to five rounds of sib-selection. Each subsequent round should demonstrate an enrichment of positivecells and an increase in the FACS signal. We performed five rounds of sib-selectionto obtain Bit-1.
AcknowledgmentsThe authors would like to thank Drs. M. Fukuda and E. Ong for their instru-
mental help in the practical considerations of the strategy. We would also liketo thank Dr. E. Ruoslahti for his advice in developing the initial screen. M. L.Matter is supported by a grant from the National Institutes of Health (P20-RR016453). J.W. Ramos is supported in part by a grant from the National Insti-tutes of Health (CA93849).
References 1. Hynes, R. O. (2002) Integrins: bidirectional, allosteric signaling machines. Cell
110, 673–687.2. Juliano, R. L. (2002) Signal transduction by cell adhesion receptors and the
cytoskeleton: functions of integrins, cadherins, selectins, and immunoglobulin-superfamily members. Annu. Rev. Pharmacol. Toxicol. 42, 283–323.
3. Wheelock, M. J. and Johnson, K. R. (2003) Cadherin-mediated cellular signaling.Curr. Opin. Cell Biol. 15, 509–514.
4. Seed, B. (1995) Developments in expression cloning. Curr. Opin. Biotechnol. 6,567–573.
5. Tanaka, T., Camerini, D., Seed, B., et al. (1992) Cloning and functional expressionof the T cell activation antigen CD26. J. Immunol. 149, 481–486.
6. Adams, J. C., Seed, B., and Lawler, J. (1998) Muskelin, a novel intracellularmediator of cell adhesive and cytoskeletal responses to thrombospondin-1.EMBO J. 17, 4964–4974.
7. Fenczik, C. A., Sethi, T., Ramos, J. W., Hughes, P. E., and Ginsberg, M. H. (1997)Complementation of dominant suppression implicates CD98 in integrin activation.Nature 390, 81–85.
8. Ramos, J. W., Kojima, T. K., Hughes, P. E., Fenczik, C. A., and Ginsberg, M. H.(1998) The death effector domain of PEA-15 is involved in its regulation ofintegrin activation. J. Biol. Chem. 273, 3897–3900.
9. Matter, M. L., Ginsberg, M. H., and Ramos, J. W. (2001) Identification of cellsignaling molecules by expression cloning. Sci. STKE 9, L9.
164 Matter and Ramos

10. Jan, Y., Matter, M., Pai, J. T., et al. (2004) A mitochondrial protein, Bit1, mediatesapoptosis regulated by integrins and Groucho/TLE corepressors. Cell 116, 751–762.
11. Frisch, S. M. and Screaton, R. A. (2001) Anoikis mechanisms. Curr. Opin. CellBiol. 13, 555–562.
12. Frisch, S. M. and Ruoslahti, E. (1997) Integrins and anoikis. Curr. Opin. Cell Biol.9, 701–706.
13. Matter, M. L. and Ruoslahti, E. (2001) A signaling pathway from the alpha5beta1and alpha(v)beta3 integrins that elevates bcl-2 transcription. J. Biol. Chem. 276,27,757–27,763.
14. Ong, E., Yeh, J. C., Ding, Y., Hindsgaul, O., and Fukuda, M. (1998) Expressioncloning of a human sulfotransferase that directs the synthesis of the HNK-1 glycanon the neural cell adhesion molecule and glycolipids. J. Biol. Chem. 273, 5190–5195.
Expression Cloning 165


167
14
Assays for the Calcium Sensitivity of Desmosomes
Anita J. Merritt, Anthea Scothern, and Tanusree Bhattacharyya
SummaryEpithelial cells in vivo exist as confluent cell sheets, but this confluence is disrupted if the
sheets are wounded, if the cells are undergoing morphogenesis, or if they are taking part in inva-sion and metastasis. Desmosomes are one of the principal types of adhesive junctions in epithe-lia and are responsible for maintaining tissue integrity. It is likely that modulation of desmosomaladhesion is required to facilitate cell motility in response to alterations in the tissue architecture.Desmosomal adhesion changes from a calcium-dependent state to a calcium-independent statewhen cells become confluent. Our laboratory has shown that the α isoform of protein kinase Cis involved in signaling the response of desmosomes to calcium concentration and wounding, incultured epithelial cells and in mouse epidermis (in vivo).
Key Words: Desmosomes; calcium dependence; calcium independence; protein kinase Cα(PKCα); desmoplakin; cell adhesion; MDCK cells.
1. IntroductionDesmosomes are intercellular adhesive junctions that provide tensile
strength to epithelial tissues and cardiac muscle, and are particularly abundantin the epidermis. Their major adhesive molecules are the desmocollins anddesmogleins, members of the calcium (Ca)-dependent cadherin family (1) TheCa switch assay has been used extensively for the study of desmosome assem-bly (2–5). Cells grown in low Ca medium (≤ 0.1 mM) begin to assembledesmosomes when the Ca concentration is raised to physiological levels(∼1.8 mM). Desmosomes can exist in two adhesive states; Ca-dependent andCa-independent, and the transition between the two is regulated by proteinkinase C (PKC)α (6). Cells in culture become Ca-independent after they reachconfluence, and Ca-independence is the natural state of desmosomes in vivo.When confluent cell monolayers are wounded or treated with activators of
From: Methods in Molecular Biology, vol. 341: Cell−Cell Interactions: Methods and ProtocolsEdited by: S. P. Colgan © Humana Press Inc., Totowa, NJ

PKC, cells rapidly revert to Ca-dependence (Fig. 1). In this chapter, we illus-trate, using the Madin–Darby canine kidney (MDCK) model epithelial cellline, how desmosomal adhesion can be switched between Ca-dependence andCa-independence. This chapter includes protocols for wounding and treatmentwith PKC activators/inhibitors. We also will describe how immunofluores-cence and electron microscopy can be used to determine the adhesive state ofdesmosomes and will demonstrate how the assays can be extended to studydesmosomal adhesion in mouse epidermis (in vivo).
2. Materials2.1. Cell Culture
1. Tissue culture hood and incubators at 37°C, 5% CO2.2. T75 tissue culture flasks, 24-well plates, 0.2-µm filters, haemocytometer.3. MDCK II cells (www.ecacc.org.uk).4. Dulbecco’s Modified Eagle’s Medium (DMEM) with 10% FBS (Normal Calcium
Medium [NCM], Gibco).5. Ca-free DMEM (Gibco).6. Phosphate-buffered saline (PBS) or Hank’s Balanced Salt Solution (HBSS) without
Ca or magnesium (Gibco).7. Trypsin–EDTA (Gibco).8. EGTA (Sigma, St. Louis, MO).9. Fetal bovine serum (FBS; Gibco).
10. Chelex resin (Sigma).11. Whatman filter paper.12. Sterile 13-mm circular glass cover slips (Scientific Laboratory Supplies, Notting-
ham, UK).
168 Merritt, Scothern, and Bhattacharyya
Fig. 1. Diagram to illustrate factors that modulate desmosomes between Ca-dependence (Ca-Dep) and Ca-independence (Ca-Ind).

Desmosome Calcium Switch 169
13. 100% methanol.14. Sterile scalpel blades (size 24, Swann-Morton) and cell scrapers (Costar).15. 5050 methanol: acetone (store at −20°C).16. Dimethyl sulfoxide (Sigma).17. Phorbol-12,13-didecanoate, phorbol-12,13-dibutyrate (TPA; Sigma).18. Gö6976 (Calbiochem).19. Chelerythrine chloride (Calbiochem).20. 100-cm2 plastic dishes (Sterilin).
2.2. Immunofluorescence
1. Antibody to desmosomal protein such as 11–5F mouse monoclonal Ab to desmo-plakin I and II (7).
2. Rabbit anti-PKCα polyclonal antibody (Sigma).3. Fluorescein isothiocyanate (FITC)-conjugated anti-rabbit immunoglobulin (Ig)G,
and rhodamine red-conjugated anti-mouse IgG (Jackson Labs).4. PBS tablets (Sigma).5. 0.5% Triton X-100 (Sigma).6. Wax pen (DAKO).7. Gelvatol mounting medium: Gradually add 10 g of gelvatol vinyl alcohol (Fisons)
to 20 mL of 0.02 M Na2HPO4, 0.02 M KH2PO4, and 0.14 M NaCl at pH 7.2 with0.04% w/v sodium azide and 1% v/v DABCO. Stir the solution overnight andadjust pH to 6.7. Remove insoluble material by centrifugation at 12,000g for30 min. Store at 4°C.
8. Microscope slides and 22 × 50-mm glass cover slips (Scientific Laboratory Sup-plies, Nottingham, UK).
9. Parafilm.10. Clear nail polish.11. Poly-L-lysine-coated slides (BDH).12. Humidified box (see Note 1).13. Fluorescence microscope with FITC and rhodamine red filters such as Zeiss
Axiophot or Axioplan.
2.3. Wounding of Mouse Epidermis
1. Hair clippers.2. Scalpel with number 11 blades (Swann-Morton).3. Marker pen or surgical pen.4. 70% ethanol.5. Anaesthesia apparatus.6. Dissection instruments.7. Ruler.8. Aluminium foil.9. OCT cryoprotectant (RA Lamb Ltd, Eastbourne, UK).
10. Liquid nitrogen.
2.4. Conventional Electron Microscopy
1. Ultramicrotome.2. Platinum wire loops (0.5–3 mm).3. Molds for embedding.4. Razor blade.5. Tungsten-coated glass knives.6. 100 mesh hexagonal grids of copper.7. Cacodylate buffer: 1 M sodium cacodylate, 250 mM sucrose, and 2 mM CaCl2,
pH 7.5.8. Paraformaldehyde (PFA) solution: add 8 g of PFA powder to 100 mL of double
distilled (dd)H2O in a glass flask. Cover with a glass funnel and an inverted glassPetri dish to form a reflux system. Heat with stirring to 60 to 70°C for at least 30min. Clear the remaining cloudiness with a few drops of 4 M sodium hydroxidesolution. Allow to cool and then filter through Whatman paper. Dilute to 4% w/vwith ddH2O.
9. PFA in cacodylate buffer: prepare double-strength cacodylate buffer above (i.e.,0.2 M sodium cacodylate) and mix 5050 with fresh 4% aqueous PFA solution.Re-adjust the pH to 7.5.
10. Uranyl acetate stain: prepare a 2% w/v solution of uranyl acetate dissolved in77% ethanol. Centrifuge 1.5-mL aliquots at 1000g for 20 min before use.
11. Lead citrate stain: prepare a 0.3% w/v solution of lead citrate in 0.1 M sodiumhydroxide. Centrifuge 1.5-mL aliquots at 1000g for 20 min before use.
12. Spurr’s resin (medium hardness).13. Ethanol concentrations 70, 80, and 100%.14. Toluidine blue stain.
2.5. Immunogold Labeling
1. Cryoultramicrotome.2. Tungsten-coated glass knives.3. Diamond knife.4. Eyelash probe (see Note 2).5. Platinum loops.6. 100 mesh nickel hexagonal grids coated with formvar and carbon (Agar Scientific
Ltd).7. Liquid nitrogen storage.8. Aluminium cryopins (Reichert-Jung Ltd).9. Light microscope.
10. HEPES buffer: 0.2 M HEPES, pH 7.4.11. PFA in HEPES buffer: prepare double-strength HEPES buffer above (i.e., 0.4 M
HEPES) and mix 5050 with fresh 4% aqueous PFA solution. Re-adjust thepH to 7.4.
12. Sucrose/polyvinyl pyrrolidone (PVP [8]): prepare a solution of 2 M sucrose in 0.2 MHEPES buffer. Heat the mixture with stirring to 60 to 70°C until the sucrose has
170 Merritt, Scothern, and Bhattacharyya

Desmosome Calcium Switch 171
dissolved completely. Mix the sucrose solution with a further 100 mL of HEPESbuffer and then add 4 mL of 1.1 M sodium carbonate solution. Add 20 g of PVP-10(molecular weight 10,000) to the solution. Leave the paste overnight at room tem-perature covered with aluminum foil. The bubbles in the paste will escape leavinga clear solution.
13. Retrieval buffer: 0.2 M HEPES pH 7.4, 2 M sucrose, 0.75% gelatin.14. PBS.15. 2% gelatin in PBS poured into sterile Petri dishes.16. 0.02 M glycine in PBS.17. Normal goat serum diluted to 5% in PBS containing 1% bovine serum albumin
(BSA).18. Normal goat serum diluted to 10% in PBS containing 1% BSA.19. 11–5F antibody (7).20. 0.1% BSA in PBS.21. Gold-conjugated goat anti-mouse secondary antibody.22. 2.5% glutaraldehyde in PBS.23. 2% uranyl acetate oxalate: mix equal volumes of a 4% (w/v) stock of uranyl acetate
and 0.3 M oxalic acid. Adjust the pH to 7.5 with 5% ammonium hydroxide. Storein the dark at 4°C and filter through Whatman no. 1 filter paper before use.
24. 2% aqueous polyvinyl alcohol containing 0.2% uranyl acetate.
3. MethodsTo examine the effect of Ca concentration on desmosomal adhesion, low
Ca medium (LCM) must first be prepared by chelation of the Ca from FBSbefore adding to Ca-free DMEM (LCM) MDCK cells should then be grown onglass cover slips to the required level of confluence before performing the Caswitch assay. To measure the percentage of Ca-dependent and Ca-independentcells, the cells are first stained with a desmosomal antibody, such as one todesmoplakin, before microscopic examination for internalization of desmoplakinstaining (Ca-dependent) or cell membrane staining (Ca-independent) and count-ing the numbers of each type of cell. Ca-dependence also can be induced inconfluent (Ca-independent) monolayers by wounding (scraping the monolay-ers) or by treatment with PKC activators. Similarly, Ca-independence can beinduced by treatment with PKC inhibitors. The Ca switch assay also can beused for untreated or wounded mouse skin tissue, in a similar way to MDCKcells. The effects on desmosomes can be investigated further by electronmicroscopy to see whether desmosomes have normal ultrastructure with intactmidlines (Ca-independent) or have split into half desmosomes (Ca-dependent).Because PKCα is an important regulator of the adhesive state of desmosomes,it often is useful to look for colocalization of PKCα with desmosomes and theideal way to confirm this is by immunogold labeling of desmosomes for PKCαand desmoplakin.

3.1. Ca Switch Assay for MDCK Cells
3.1.1. Preparation of LCM
1. Stir 20 g of Chelex resin with 50 mL of heat-inactivated FBS (56°C for 30 min)for 2 h (or overnight if more convenient) at 4°C.
2. Decant liquid from beads and sterilize by passing through 0.2-µm filter.3. Add the chelated FBS to Ca-free DMEM to a concentration of 10% w/v.4. Add EGTA to a concentration of 3 mM (pH 7.5; see Note 3).5. Store at 4°C until needed for Ca switch assay (see Subheading 3.1.3.).
3.1.2. Culture of MDCK Cells on Glass Cover Slips
1. Culture MDCK II cells in NCM (DMEM with 10% FBS), until confluent in a T75flask (∼1 × 10⁷ cells/flask). MDCK cells have a characteristic “cobblestone” epithe-lial morphology when grown as confluent monolayers (see Fig. 2).
2. Prepare 24-well plates in which one 13-mm diameter circular glass cover slip canoccupy each well (see Note 4). The cover slips can be sterilized by autoclaving orby immersing in 100% ethanol (see Note 5).
3. Passage the cells with trypsin–EDTA, perform cell counts using a haemocytome-ter, and seed onto the glass cover slips; 4–5 × 10⁵ cells should be seeded per wellto achieve confluence during the next 24 to 48 h.
172 Merritt, Scothern, and Bhattacharyya
Fig. 2. Phase contrast image of a confluent monolayer of MDCK cells. MDCK cellswere seeded at a density of 4.5 × 10⁵ cells/well and maintained for 6 d in NCM. Thecobble-stone epithelial morphology is readily visible. Scale bar = 25 µm.
Desmosome Calcium Switch 173
3.1.3. Ca Switch (NCM to LCM; see Note 6)
1. Grow MDCK cells (see Notes 7 and 8) to the required level of confluence (seeSubheading 3.1.2.). If the recommended 4–5 × 10⁵ cells/cover slip are seeded,then to guarantee a majority of Ca-dependent desmosomes, cells should be grownto 95% confluence (∼1–2 d): if a majority of Ca-independent desmosomes isrequired, cells should be maintained at confluent density for 6 d. At approx 4 to5 d, you will get a mix of Ca-dependent and Ca-independent desmosomes.
2. To perform the Ca switch, remove the NCM from the cells and wash three timeswith Ca-free PBS or HBSS (1 mL per well per wash).
3. Incubate cells with the preprepared chelated LCM (see Subheading 3.1.1.) for90 min at 37°C.
4. Remove LCM, wash briefly in Ca-free PBS or HBSS, and fix with ice-cold5050 methanolacetone for 10 min.
5. Remove fixative, cover plate, and store at −20°C until required for immunofluo-rescence (see Subheading 3.3.1.).
3.2. Ca Switch Assay for Mouse Epidermis
1. Sacrifice mouse and remove hair from back skin using clippers.2. Dissect mouse skin from back, trim fat and dermis tissue, wash in Ca-free PBS,
and cut into 1-mm3 pieces.3. Submerge tissue in LCM and incubate for up to 6 h in tissue culture incubator
(37°C, 5% CO2) Incubate control tissue in NCM.4. Remove medium and wash in Ca-free PBS.5. Place tissue in aluminum foil molds containing OCT cryoprotectant and freeze in
liquid nitrogen.6. Label molds and store in a −80°C freezer.7. Cut sections (7 µm) using a cryostat onto poly-L-lysine-coated slides.8. Air-dry slides for 1 h at room temperature, then cover and place in −80°C freezer
until required for immunofluorescence (see Subheading 3.3.2.).
3.3. Immunofluorescence for Desmoplakin
3.3.1. Cell Monolayers (see Fig. 3)
1. If cover slips have been stored in −20°C, allow to reach room temperature for 15 min.2. Wash cells in PBS, 3 × 10 min.3. Block nonspecific binding in 5% normal goat serum, 2% BSA, and 0.05%
Triton-X-100 in PBS for 30 min.4. Incubate in mouse anti-desmoplakin antibody (11–5F), at a dilution of 1/50 in
PBS, for 1 h at room temperature (see Notes 9 and 10).5. Wash in PBS, 3 × 10 min.6. Incubate in secondary anti-mouse IgG antibody, such as Donkey anti-mouse IgG
FITC at a dilution of 1/100 in PBS, for 30 min at room temperature (see Note 11).7. Wash in PBS, 3 × 10 min, then wash off the PBS by washing with dH2O.8. Mount onto microscope slides with gelvatol and allow to solidify.

9. To stop drying out, seal the cover slips onto the slides with clear nail polish.10. When nail polish is dry, wrap slides in aluminium foil and store at −20°C until
viewing under fluorescence microscope (see Notes 12 and 13) and performingcounts of Ca-dependent and Ca-independent cells (see Subheading 3.6.).
3.3.2. Tissue Sections (see Fig. 4)
1. Take frozen sections out of the −80°C freezer and fix in ice-cold 5050methanol:acetone for 20 min at −20°C.
2. Draw a ring around each section on the slide using a wax pen to prevent antibodyrunning from one section to another.
3. Stain the sections using the same protocol for monolayers with two exceptions:(a) add 20 µL of diluted antibody per section and (b) incubate slides in a humidi-fied box (see Note 1).
4. Perform counts of Ca-dependent and Ca-independent cells (see Subheading 3.6.).Similar protocols can be used for PKCα immunofluorescence (see Notes 14and 15).
3.4. Wounding
3.4.1. Wounding Cell Monolayers
1. Grow MDCK cell monolayers on glass microscope slides within 100-cm2 plasticdishes. The cells should be seeded at a density of 1.5 × 10⁵ cells/cm2. Incubate at37°C for 6 d.
2. Make a template for wounds by drawing a rectangular grid on paper and placeunder the slide and view under microscope.
174 Merritt, Scothern, and Bhattacharyya
Fig. 3. Immunofluorescence for desmoplakin on MDCK cell monolayers. MDCKcells were seeded at confluent density (4.5 × 10⁵ cells/well) and maintained for 2 d(A, B) or 6 d (C). Cells were then either left in NCM (A), or cells were switched toLCM (B, C) Cells were then fixed and stained for desmoplakin using the antibody 11-5F. In (A), cells have staining at the cell membranes. In (B), the cells have separatedand desmoplakin has been internalized, indicative of Ca-dependent desmosomes. In(C), the cells have pulled apart, but processes remain connecting the cells and thosestain brightly, indicative of Ca-independent desmosomes.

Desmosome Calcium Switch 175
3. Create simple wounds by drawing a scalpel blade across the monolayer by hand,tracing the predrawn grid.
4. For multiple wounds, score parallel lines 5 to 20 mm apart, rotate the monolayer90° and draw a second set of parallel lines.
5. Prepare cell islands by removing cells between alternative sets of parallel scorelines using a cell scraper.
6. Place cells in LCM or NCM (for controls).7. Perform immunofluorescence for desmoplakin (see Subheading 3.3.1.), and count
the percentage of Ca-independent and Ca-dependent cells (see Subheading 3.6.).
3.4.2. Wounding Mouse Epidermis
1. Anesthetize mice using inhalation anaesthetic such as halothane.2. Sterilize back of mouse with a swab of 70% ethanol.3. Shave back with electric clippers.4. Mark 1-cm regions for wounding using a marker pen (see Fig. 8; Note 16).5. Using a scalpel with a no. 11 blade, wound the mice on these marks. The wounds
should be of full thickness, cutting through epidermis, dermis, and muscle.6. Let the mouse recover and give analgesia as required.7. To harvest the wounds, sacrifice the mice at the appropriate time.8. Dissect at least 1 cm around the wound area and process for Ca switch assay
(Subheading 3.2.) conventional electron microscopy (Subheading 3.7.), orimmunogold labeling (Subheading 3.8.) as required.
Fig. 4. Immunofluorescence for desmoplakin on mouse epidermis. Immunofluores-cence image of 2-wk-old Balb-C mouse skin stained with 11-5F antibody for desmo-plakin. Positive staining is evident around the cell membranes of epidermal cells. Scalebar = 5 µm.

3.5. Treatment of Cell Monolayers With PKC Activators and Inhibitors
3.5.1. Treatment With PKC Activators to Revert Ca-IndependentDesmosomes to Ca-Dependent
1. Seed MDCK cells at 4–5 × 10⁵ cells/cm2 on to cover slips and culture for 6 d.2. Treat the cells with the drug as follows: 5 nM TPA for 1 h; 50 nM phorbol-12,
13-didecanoate for 1 h; and 50 nM phorbol-12, 13- dibutyrate for 1 h. Withdifferent batches of cells, the optimal incubation times and concentrations ofthe drugs may vary slightly.
3. Switch to drug-free LCM for 90 min.4. Fix the cells and stain for desmoplakin using protocol described in Subheading
3.3.1.5. Calculate the proportion of cells with Ca-independent desmosomes as described in
Subheading 3.6.
3.5.2. Treatment With PKC Inhibitors to Revert Ca-Dependent Desmosomes to Ca-Independent
1. Seed MDCK cells at 4–5 × 10⁵ cells/cm2 on to cover slips and culture for 24 h.2. Treat the cells with the drug as follows: (a) 10 nM Gö6976 for 1 h; (b) 8.7 µM
chelerythrine chloride for 15 min. With different batches of cells, the optimalincubation times and concentrations of the drugs may vary slightly.
3. Switch to drug-free LCM for 90 min.4. Fix the cells and stain for desmoplakin using protocol described in Subheading
3.3.1.5. Calculate the proportion of cells with Ca-independent desmosomes as described in
Subheading 3.6.
3.6. Scoring Cells for Ca-Independence
1. Select at least 10 fields of view at random.2. Count the number of cells that remain attached by at least one desmoplakin-staining
projection (see Fig. 3), using a hand-held counter. (These are Ca-independent cells.)3. Count the total number of cells using a hand-held counter.4. Express the number of Ca-independent cells as a proportion of the total number
of cells in the fields.5. Count several duplicates of cultures/tissue for each experimental point.
3.7. Conventional Transmission Electron Microscopy Examination of Desmosome Ultrastructure (see Figs. 5 and 6)
3.7.1. Fixation and Embedding
1. Fix 1-mm3 pieces of tissue (Subheading 3.2. or Subheading 3.4.2.) in 2% PFAplus 2% glutaraldehyde in cacodylate buffer pH 7.5 for 2 h at room temperature,changing the fixative after 1 h. Leave in fixative overnight at 4°C.
2. Wash the samples in several changes of cacodylate buffer for 1 h at roomtemperature.
176 Merritt, Scothern, and Bhattacharyya

Desmosome Calcium Switch 177
3. Postfix in 2% osmium tetroxide in cacodylate buffer for 1 h at room temperature.4. Rinse several times in ddH2O.5. Dehydrate through an ethanol series: 70% for 15 min, 80% for 15 min, and 100%
three times for 20 min each.
Fig. 5. Electron micrograph showing the ultrastructure of a desmosome. DM, densemidline; PM, plasma membrane; ODP, outer dense plaque; IDP, inner dense plaque; IF,intermediate filaments. Scale bar = 100 nm.
Fig. 6. Electron micrographs showing Ca-independent and Ca-dependent desmosomesafter incubation in low Ca medium. (A) Ca-independent desmosomes in mouse epidermis(white arrows) Note the enlarged intercellular spaces. (B) Ca-independent desmosomes inwounded mouse epidermis. White arrows show the desmosomes split into half-desmo-somes. (C) Wounded mouse epidermis with Ca-dependent desmosomes (black arrows)and Ca-independent desmosomes (white arrows) further away from the wound edge.Scale bars = 100 nm.

6. Infiltrate tissue with Spurr’s resin (medium hardness): 50% resin in dry ethanolovernight, 70% resin in dry ethanol for 1 h, 100% resin in dry ethanol for 3 hthree times.
7. Embed tissue in molds containing fresh resin and polymerize at 60°C for 72 h.8. Embedded tissue can be stored at room temperature before sectioning.
3.7.2. Sectioning
1. Trim resin blocks first with a razor blade and then finely trim on ultramicrotometo remove excess resin (see Note 17).
2. Cut semithin sections (250–500 nm) and collect on poly-L-lysine-coated glassslides for staining with toluidine blue and examination under the light microscopeto ensure that epidermis or wound edges are included in the section.
3. Cut ultrathin sections (50–70 nm) using a diamond knife. The sections will floataway from the knife edge on the water reservoir.
4. Collect sections from the water on 100 mesh grids and leave to air-dry (seeNote 18).
3.7.3. Staining
1. Wet grids on drops of ddH2O.2. Float grids on drops of 2% uranyl acetate solution for 30 min at room temperature.3. Wash each grid three times in ddH2O.4. Incubate on 0.3% lead citrate solution for 5 min.5. Wash thoroughly in ddH2O and then allow to air-dry overnight before examination
in the transmission electron microscope (TEM).
3.8. Immunogold Electron Microscopy to Localize Desmoplakin or PKCα Within the Desmosome (see Fig. 7 and Notes 19 and 20)
3.8.1. Fixation and Infiltration
1. Fix 1-mm3 pieces of tissue (Subheadings 3.2. or 3.4.2.) in 2% PFA in HEPESbuffer for 45 min at room temperature.
2. Wash four times with HEPES buffer, 10 min per wash.3. Infiltrate with sucrose/PVP for 4 h at room temperature or overnight at 4°C (see
Notes 21 and 22).4. Mount the infiltrated tissue on freshly cleaned aluminium cryopins and remove
any excess sucrose/PVP.5. Manually plunge freeze the tissue in liquid nitrogen and then store under liquid
nitrogen prior to sectioning.
3.8.2. Cryoultramicrotomy Sectioning (see Notes 23 and 24)
1. Precool the chamber of a cryoultramicrotome to −80°C and place the 45° glassand diamond knives inside to equilibrate.
2. Transfer the frozen tissue from liquid nitrogen to the cryochamber and allow it toequilibrate for 15 min.
178 Merritt, Scothern, and Bhattacharyya

Desmosome Calcium Switch 179
Fig. 7. Electron micrographs of wounded mouse epidermis immunogold labeledfor PKCα. Note the localization of PKCα to the desmosomes (black arrows). Scalebar = 100 nm.
3. Using the glass knife, trim the sucrose/PVP block to the smallest possible area.4. Cut semithin sections for staining with toluidine blue and collect on poly-
L-lysine-coated glass slides. Examine under the light microscope to ensurevisualization of the epidermis or wound edge.
5. Reduce the temperature of the cryochamber to −120°C and allow it and the knivesto equilibrate.
6. Once the temperature of the tissue has reached −110°C, ultrathin sections can becut using the diamond knife.
7. Adjust the cutting speed to allow sections of the required thickness (50–60 nm) tobe obtained and to maintain the temperature of the specimen.
8. The sections will form a ribbon on the knife. Use an eyelash probe to arrangethem in groups of three or four.
9. Retrieve the sections using a 1.5- to 3-mm wire loop containing a droplet ofretrieval buffer. Work quickly to avoid the buffer freezing. The sections will meltinstantaneously and adhere to the buffer. Rapidly withdraw the loop (see Note 25).
10. Transfer the cryosections to 100 mesh formvar-coated grids.11. Invert the grids onto a plate of 2% gelatin in PBS and store overnight at 4°C.
3.8.3. Immunogold Labeling
1. Immediately before labeling, liquefy the gelatin block by incubating at 37°C for20 min (see Notes 26 and 27).
2. Transfer the grids across three drops of 0.02 M glycine in PBS for 1 h at roomtemperature (see Note 28).
3. Block nonspecific labeling by incubating grids on droplets of 5% normal goatserum plus 1% BSA for 1 h at room temperature.
4. Prepare the monoclonal antibody 11–5F at a dilution of 1/20 in PBS plus 1% BSA.5. Transfer the grids through three drops of the diluted primary antibody at 37°C
(20 min per drop).6. Wash the grids five times (10 min per wash) in PBS plus 0.1% BSA.7. Dilute gold conjugated goat anti-mouse secondary antibody 1200 in 10% normal
goat serum plus 1% BSA in PBS.8. Incubate grids on the secondary antibody for 45 min at room temperature.9. Wash five times (10 min per wash) in PBS.

10. Post fix in 2.5% glutaraldehyde in PBS for 5 min at room temperature.11. Wash in five changes of ddH2O for 5 min (see Note 29).12. Contrast sections on drops of 2% uranyl acetate oxalate and then wash briefly on
three drops ddH2O (see Note 30).13. Incubate the grids on 2% aqueous polyvinyl alcohol (PVA)/0.2% uranyl acetate
for 15 min (see Note 31).14. Use wire loops to retrieve the grids and draw across filter paper to remove excess
liquid.15. Allow the grids to air-dry before examination in the TEM (see Note 31).
4. Notes1. A humidified box can be made from a plastic sandwich box containing paper
towels wetted with distilled water or PBS.2. An eyelash probe is made by attaching an eyelash to a wooden stick.3. The Ca concentration of LCM should be less than 0.05 mM, and the Ca concen-
tration of NCM is approx 1.8 mM. The Ca concentration can be measured byatomic absorption spectroscopy if required. See ref. 10 for details.
4. Each time point in an experiment requires a separate 24-well plate because allcells in one plate should be fixed simultaneously. For each time point, some coverslips should be kept in NCM as controls.
5. If the ethanol method is chosen for sterilizing cover slips, the ethanol should becompletely removed before adding cells by either flaming cover slips in a Bunsenflame or allowing to air-dry in the tissue culture hood for 30 min.
6. This method is for a downward Ca switch, i.e. from NCM to LCM. Cells canalso be switched from LCM to NCM as described in (4).
7. The Ca switch assay also can be performed with primary keratinocytes (3), Caco-2colon cells (9), HaCaT cells, and A431 cells (our unpublished data).
8. MDCK cells stably transfected with GPF or YFP-labeled desmosomal proteinscan also be used to directly visualize desmosomes during Ca switch assays.
9. Other antibodies than the mouse monoclonal antibody to desmoplakin (11–5F)can be used as a marker for desmosomes. Some excellent antibodies are commer-cially available from Progen (www.progen.de) or Research Diagnostics Inc(www.researchd.com) Requests for our antibody to desmoplakin (11–5F) should beaddressed to Professor David Garrod, University of Manchester, UK.
10. To perform the immunofluorescence of the cover slips, cover a large glass platewith Parafilm. Place drops of solutions directly onto the Parafilm and invert thecover slips in the drops. Allow 15 µL for blocking reagent and antibodies and200 µL for PBS washes. Use forceps to transfer the cover slips from one drop tothe next.
11. Nuclei can be counterstained blue by including a 1/1000 dilution of Hoechst33258 stock (5 mg/mL) with the secondary antibody.
12. Fluorescently stained slides can be kept for up to 2 wk wrapped in foil in −20°Cfreezer and sometimes longer.
180 Merritt, Scothern, and Bhattacharyya

Desmosome Calcium Switch 181
Fig. 8. Diagram to show the regions for wounding mouse epidermis. Wounds weremade 3 cm posterior to the animal’s neck, measured from the base of the scull, 1 cmlong and 2 cm apart. Each mark was 1 cm lateral to the animal’s midline. A and B are1-cm wound sites.
13. All our microscopy is conducted using a Zeiss Axioplan microscope with a 50WHBO bulb for epi-fluorescence, using ×16, ×40, and ×63 objectives. The filter setswe use are: blue (G365, FT 395, LP420), green (450–490, FT510, 515–565), andred (530–585, FT 600, LP615).
14. To analyze the distribution of PKCα by immunostaining: seed the cells at conflu-ent density and maintain for 6 d to acquire Ca-independent desmosomes then stainexactly as for desmoplakin (DP) but use the anti-PKCα antibody at a dilution of1/50–1/100, and a goat-anti-rabbit secondary antibody conjugated to cy3 or rho-damine red.
15. To perform double staining for desmplakin and PKCα, add anti-DP antibody for1hr, wash in PBS, add anti-PKCα for 1 h, wash in PBS, then add secondary anti-bodies together for 30 min. We recommend using a FITC-labeled secondary anti-body for detecting DP and either rhodamine red or cy3 for PKCα. Take care whenanalyzing the double staining under the fluorescence microscope, not to getbleedthrough from red channel into FITC channel.
16. The regions for wounding on mouse epidermis were made 3 cm posterior to theanimal’s neck, measured from the base of the scull, 1 cm long, and 2 cm apart.Each mark was 1cm lateral to the animal’s midline. See Fig. 8 and (11) for furtherdetails. In the UK, a Home Office licence is required for this procedure.

17. We conduct our sectioning for conventional electron microscopy on an Ultracutultramicrotome (Reichert-Jung Ltd).
18. An indication of a good section is a silver/gold interference color.19. Before trying any antibody in immunogold labeling, we strongly recommend
trying it on PFA fixed tissue with the immunofluorescence method. If the antibodydoes not work with this method, it almost certainly will not work in immunogoldlabeling.
20. Our cryoultramicrotomy protocol is based on that developed by Tokuyasu(8,12–15).
21. The addition of PVP to the sucrose infiltrating solution confers greater plasticityon the blocks than sucrose alone.
22. Tissue sections for immunogold labeling can be embedded in PVA; see ref. 15 fora protocol.
23. The cryoultramicrotome we use is a Leica Ultracut S/FCS.24. Glass knives are coated with tungsten as described by Roberts (16) and Griffiths
et al. (17).25. To transfer a grid to a droplet from the loop: hold the loop containing the grid per-
pendicular to the drop and lower into the liquid. The surface tension will releasethe grid.
26. The immunogold labeling is conducted on drops of each reagent placed on a sheetof clean parafilm.
27. It is very important to keep the back of the grids dry and not to immerse them inreagent. The grids should float on top of the drops.
28. The glycine wash is to quench any free aldehydes in the fixed tissue.29. It is important to wash the grids in ddH2O afrer postfixing to remove all traces of
PBS that would precipitate with the uranyl acetate forming large, electron-densecrystals of uranyl phosphate.
30. The uranyl acetate oxalate step is thought to stabilize membranes against the lowpH of unbuffered uranyl acetate.
31. The final PVA embedding step is to protect the cryosections from air-drying arte-facts and should be sufficient to leave only a thin film over the section. The addi-tion of uranyl acetate to the PVA adds contrast to the sections.
32. We use Philips 400 and Philips Tecnai Biotwin transmission electron microscopes.
AcknowledgmentsWe acknowledge Drs Sarah Wallis, Mohamed Berika, and Melanie Blisset
for protocols obtained from their PhD theses. We also thank Maybo Chiu,Tomomi Kimura, and Svetlana Riazanskaia for providing some of the figures,and Professor David Garrod for his advice on the manuscript. Work in thislaboratory is funded by the Medical Research Council and the Welcome Trust.
References1. Garrod, D. R., Merritt, A. J., and Nie, Z. (2002) Desmosomal cadherins. Curr.
Opin. Cell Biol. 14, 537–545.
182 Merritt, Scothern, and Bhattacharyya

Desmosome Calcium Switch 183
2. Hennings, H. and Holbrook, K. A. (1983) Calcium regulation of cell-cell contactand differentiation of epidermal cells in culture: an ultrastructural study. Exp. CellRes. 143, 127–142.
3. Watt, F. M., Mattey, D. L., and Garrod, D. R. (1984) Calcium-induced reorganiza-tion of desmosomal components in cultured human keratinocytes. J. Cell Biol. 99,2211–2215.
4. Mattey, D. L. and Garrod, D. R. (1996a) Calcium-induced desmosome formationin cultured kidney epithelial cells. J. Cell Sci. 85, 95–111.
5. Mattey, D. L. and Garrod, D. R. (1986b) Splitting and internalization of the desmo-somes of cultured kidney epithelial cells by reduction in calcium concentrations.J. Cell Sci. 85, 113–124.
6. Wallis, S., Lloyd, S., Wise, I., Ireland, G., Fleming, T. P., and Garrod, D. R.(2000) The α isoform of protein kinase C is involved in signaling the response ofdesmosomes to wounding in cultured epithelial cells. Mol. Biol. Cell 11,1077–1092.
7. Parrish, E. P., Steart, P. V., Garrod, D. R., and Weller, R. O. (1987) Antidesmoso-mal monoclonal antibody in the diagnosis of intracranial tumors. J. Pathol. 153,265–273.
8. Tokuyasu, K. T. (1989) Use of poly(vinylpyrrolidone) and poly(vinyl alcohol) forcryoultramicrotomy. Histochem. J. 21, 163–171.
9. Collins, J. E., Taylor, I., and Garrod, D.R (1990) A study of desmosomes in colo-rectal carcinoma. Br. J. Cancer 62, 796–805.
10. Brennan, J. K., Mansky, J., Roberts, G., and Lichtman, M. A. (1975) Improvedmethods for reducing calcium and magnesium concentrations in tissue culturemedium: application to studies of lymphoblast proliferation in vitro. In Vitro 11,354–360.
11. Tomlinson, A. and Ferguson, M. J. (2003) Wound healing: a model of dermalwound repair, in Inflammation Protocols (Winyard, P. and Willoughby, D. A., eds.),Humana, Totowa, NJ, pp. 249–260.
12. Tokuyasu, K. T. (1973) A technique for ultracryotomy of cell suspensions and tissues. J. Cell Biol. 57, 551–565.
13. Tokuyasu, K. T. (1980) Immunochemistry on ultrathin frozen sections. Histochem. J.12, 381–403.
14. Tokuyasu, K. T. and Singer, S. J. (1976) Improved procedures for immunoferritinlabelling of ultrathin frozen sections. J. Cell Biol. 71, 894–906.
15. North, A. J., Chidgey, M. A. J., Clarke, J. P., Bardsley W. G., and Garrod, D. R.(1996) Distinct desmocollin isoforms occur in the same desmosomes and showreciprocally graded distribution in bovine nasal epidermis. Proc. Natl. Acad. Sci.USA 93, 7701–7705.
16. Roberts, I. M. (1975) Handling and staining epoxy resin sections for light micro-scopy. J. Microsc. 103, 113–119.
17. Griffiths, G., McDowall, A., Back, R., and Dubochet, J. (1984) On the preparationof cryosections for immunocytochemistry. J. Ultrastruct. Res. 89, 65–79.

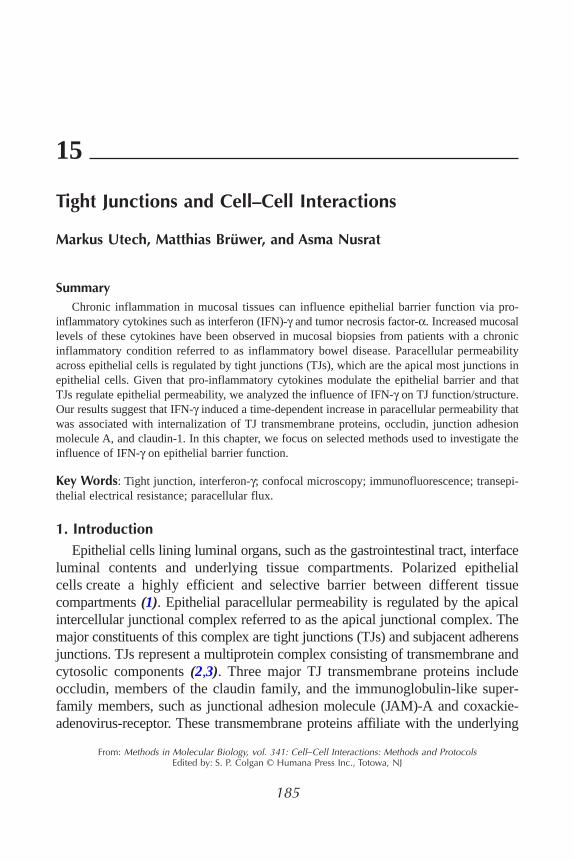
185
15
Tight Junctions and Cell–Cell Interactions
Markus Utech, Matthias Brüwer, and Asma Nusrat
SummaryChronic inflammation in mucosal tissues can influence epithelial barrier function via pro-
inflammatory cytokines such as interferon (IFN)-γ and tumor necrosis factor-α. Increased mucosallevels of these cytokines have been observed in mucosal biopsies from patients with a chronicinflammatory condition referred to as inflammatory bowel disease. Paracellular permeabilityacross epithelial cells is regulated by tight junctions (TJs), which are the apical most junctions inepithelial cells. Given that pro-inflammatory cytokines modulate the epithelial barrier and thatTJs regulate epithelial permeability, we analyzed the influence of IFN-γ on TJ function/structure.Our results suggest that IFN-γ induced a time-dependent increase in paracellular permeability thatwas associated with internalization of TJ transmembrane proteins, occludin, junction adhesionmolecule A, and claudin-1. In this chapter, we focus on selected methods used to investigate theinfluence of IFN-γ on epithelial barrier function.
Key Words: Tight junction, interferon-γ; confocal microscopy; immunofluorescence; transepi-thelial electrical resistance; paracellular flux.
1. IntroductionEpithelial cells lining luminal organs, such as the gastrointestinal tract, interface
luminal contents and underlying tissue compartments. Polarized epithelialcells create a highly efficient and selective barrier between different tissuecompartments (1). Epithelial paracellular permeability is regulated by the apicalintercellular junctional complex referred to as the apical junctional complex. Themajor constituents of this complex are tight junctions (TJs) and subjacent adherensjunctions. TJs represent a multiprotein complex consisting of transmembrane andcytosolic components (2,3). Three major TJ transmembrane proteins includeoccludin, members of the claudin family, and the immunoglobulin-like super-family members, such as junctional adhesion molecule (JAM)-A and coxackie-adenovirus-receptor. These transmembrane proteins affiliate with the underlying
From: Methods in Molecular Biology, vol. 341: Cell−Cell Interactions: Methods and ProtocolsEdited by: S. P. Colgan © Humana Press Inc., Totowa, NJ

perijunctional F-actin ring via cytoplasmic plaque proteins, primarily zonulaoccludens (ZO) proteins ZO-1, ZO-2, and ZO-3 (2,4,5). Increased permeabilityof the epithelial barrier is a key contributor to various gastrointestinal diseasessuch Crohn’s disease and ulcerative colitis (6,7), which are characterizedby increased mucosal levels of proinflammatory cytokines such as interferon(IFN)-γ (8).
Given the complex composition of mucosal tissues and diverse array ofcytokines released in inflammatory states, we have used a reductionisticin vitro cell culture approach to examine the influence of a single proinflam-matory cytokine on epithelial barrier function. A model intestinal epithelialcell line, T84 and human recombinant IFN-γ was used to analyze the effects ofthis cytokine on structure and function of the epithelial TJs.
2. Materials2.1. Collagen Coating of Permeable Polycarbonate Filter Supports
1. Rat tails (store at −80°C; Pet-Freez Biologicals, Rogers, AK).2. Hemostat (Daigger, Vernon Hills, IL).3. 1% (v/v) acetic acid solution in water (see Note 1).4. Dialysis tubing: Spectra/Por no. 1 (Spectrum Laboratories Inc., Rancho Domin-
guez, CA).5. Parafilm “M” (pechiney plastic packing, Chicago, IL).6. Permeable polycarbonate membrane filters with surface areas of 0.33 cm2 (5-µm
pore size) and 5 cm2 (3-µm pore size; Costar Transwell, Corning Incorporated,Corning, NY).
2.2. Cell Culture
1. T84 epithelial cells (ATCC, Rockville, MD).2. Cell medium: 11 Dulbecco’s Modified Eagle’s Medium and Ham’s F-12 medium
supplemented with 15 mM HEPES, pH 7.5, 14 mM NaHCO3, 0.4% (w/v) peni-cillin, 0.08% (w/v) ampicillin, 0.9% (w/v) streptomycin, and 6% (v/v) newborncalf serum.
3. IFN-γ stock solution (2500 U/mL; kind gift of Genentech, San Francisco, CA).
2.3. Transepithelial Electrical Resistance
1. EVOM™ Epithelial Voltohmmeter (World Precision Instruments, Sarasota, FL).2. STX2 electrode set (World Precision Instruments, Sarasota, FL).3. 0.15 M KCl.
2.4. Fluoresceinated Dextran-3 Flux
1. Fluoresceinated dextran (FD)-3 solution: 1% (w/v) fluorescein-labeled dextran 3kDa (Molecular Probes, Eugene, OR) in Hank’s balanced salt solution (HBSS).
2. 96-well plate (NUNC, Rochester, NY).
186 Utech, Brüwer, and Nusrat

2.5. Cell Preparation for Immunoblotting
1. Cell lysate buffer: 100 mM KCl, 3 mM NaCl, 3.5 mM MgCl2, 10 mM HEPES,pH 7.4, 1% (v/v) Triton X-100, protease inhibitor cocktail (1100, Sigma,St. Louis, MO).
2. Cell scraper: 1.3-cm blade, total length 16 cm. (Sarstedt Inc., Newton, NC).3. Glass homogenizer (douncer; Weathon Inc., Millville, NJ).4. Protein concentration assay: BCA Protein assay kit (Pierce, Rockford, IL).
2.6. Differential Detergent Extraction of TJ Transmembrane Proteins
1. TX 100 extraction buffer: 100 mM KCl, 3 mM NaCl, 3.5 mM MgCl2, 10 mMHEPES, pH 7.4, 1% (v/v) Triton X-100, protease inhibitor cocktail (1100,Sigma).
2. Running buffer (2X) (pH 8.3): 3% (w/v) sodium dodecyl sulfate (SDS), 0.75 MTris-HCl, pH 8.8, 20% (v/v) glycerol, and 20 mM dithiothreitol.
2.7. SDS-Polyacrylamide Gel Electrophoresis
1. Separating buffer: 1.5 M Tris-HCl, pH 8.6. Store at 4°C.2. Stacking buffer: 1 M Tris-HCl, pH 6.8. Store at 4°C.3. 30% (w/v) acrylamidebisacrylamide solution (37.51; National Diagnostics,
Atlanta, GA).4. TEMED (Bio-Rad, Hercules, CA).5. SDS solution: 10% (w/v) solution in water (store at room temperature).6. Ammonium persulfate (AP) solution: 10% (w/v) AP solution in water (prepare
solution before use).7. Running buffer: 50 mM Tris-HCl, 190 mM glycine, 1% (w/v) SDS. Store at room
temperature.8. Prestained protein markers, broad range (6–175 kDa; New England Biolabs,
Beverly, MA).
2.8. Western Blotting
1. Transfer buffer: 25 mM Tris-HCl (do not adjust pH), 190 mM glycine, 20% (v/v)methanol.
2. Trans-Blot Transfer membrane, pure nitrocellulose membrane (0.2 µm; Bio-Rad,Hercules, CA).
3. Tris-buffered saline (TBS): 200 mM NaCl, 50 mM Tris-HCl, pH 7.4.4. TBS with Tween (TTBS): Add 1% (v/v) Tween-20.5. Blocking buffer: 5% (w/v) nonfat dry milk in TTBS.6. Primary antibodies are diluted in blocking buffer: polyclonal antibodies: anti-
occludin (3 µg/mL), claudin-1 (3 µg/mL), and JAM-A (12 µg/mL) pAbs (ZymedLaboratories, San Francisco, CA).
7. Secondary antibodies are diluted in blocking buffer: horseradish peroxidase-conjugated goat anti-rabbit 0.16 µg/mL (Jackson Immunoresearch Laboratories,West Grove, PA).
Tight Junctions and Cell–Cell Interactions 187

8. ECL Western blot detection reagent (Amersham Biosciences, Piscataway, NJ).9. Hyperfilm ECL film (Amersham Biosciences).
10. Trans-blot paper (Bio-Rad).
2.9. Immunofluorescence Labeling of TJ Proteins and Confocal Microscopy
HBSS+: 0.95% (w/v) HBSS (Sigma) and 10 mM HEPES, pH 7.4.
1. Fixation solution: absolute ethyl alcohol stored at −20°C.2. Blocking solution and antibody dilution buffer: 1.5% (w/v) bovine serum albumin
(BSA; Sigma) in HBSS+.3. Primary antibodies: anti-occludin (8 µg/mL), claudin-1 (8 µg/mL), and JAM-A
(8 µg/mL) pAbs (Zymed Laboratories).4. Filter paper: 90-mm diameter (Whatman, Florham Park, NJ).5. Secondary antibodies: goat anti-rabbit and goat anti-mouse secondary anti-
bodies conjugated to Alexa-488 or Alexa-546 dyes (4 µg/mL; Molecular Probes,Eugene, OR).
6. Mounting medium: Slow Fade anti-fade kit (Molecular Probes, Eugene, OR).7. Cover glasses: 18 mm2 (Corning Inc., Corning, NY).
3. MethodsEpithelial cells are grown as monolayers on permeable polycarbonate
supports. In this system epithelial cells can polarize and form well-developedintercellular junctions and are amenable to analysis by numerous techniques.Functional analysis of paracellular permeability across epithelial monolayerscan be determined by measuring the transepithelial electrical resistance (TEER)to passive ion flow and by measuring the rate of paracellular solute flux of trac-ers from the apical to the basolateral compartment of epithelial cells. Functionalstudies can be complemented by morphological analysis of TJ protein localiza-tion by immunofluorescence labeling/confocal microscopy and by biochemicaldetermination of protein expression and their subcellular compartmentalization.Because such an approach has been widely used to study epithelial TJs, we havehighlighted some of the practical aspects of these techniques that we have usedto examine the influence of IFN-γ on epithelial barrier function. More biophysicalexplanations and a general overview of these methods can be found in otherreviews (9–11).
3.1. Collagen Coating of Permeable Polycarbonate Filter Supports
1. A razor blade is used to make a longitudinal incision through the skin of a rat-tail. The skin is stripped from the underlying tendons, which are extracted usinghemostats. Mince and weigh the material extracted. This material can be frozenin 0.75-g aliquots at −80°C.
2. Soak 0.75 g of collagen in 70% ethanol for 10 to 20 min to dehydrate.
188 Utech, Brüwer, and Nusrat

3. Solubilize collagen in 100 mL of 1% (v/v) acetic acid at 4°C. Stir the mixtureslowly at 4°C overnight. The next day, the solution will be viscous and someundissolved material will remain.
4. Spin the collagen solution at 25,000g for 30 min at 4°C.5. Collect the collagen solution, avoiding sedimented material, and dialyze against 2 L
water for 24 h; use dialysis tubing, presoaked, for 1 h. Change water three timesduring dialysis.
6. Remove the collagen from the bag and dilute the solution with water if necessary(a little thinner than honey).
7. Store at 4°C.8. Before use, dilute stock collagen 1100 with 70% ethanol.9. Put 50 µL of diluted collagen on each 0.33-cm2 filter, and 500 µL on 5-cm2 filters.
10. Allow to dry before use.
3.2. Cell Culture
1. The intestinal epithelia cell line, T84 cells is grown in 5% CO2 at 37°C withinhumidified incubators. These cells are passaged when approaching confluence withtrypsin/EDTA to provide new maintenance cultures in 162-cm2 flasks and experi-mental cultures on different collagen coated filters.
2. For cell culture we plate the cells at 50% density (see Note 2).3. Confluent monolayer of T84 cells in 162-cm2 flask will yield 1.7 × 10⁷ cells. Place
2 × 10⁵ cells on 0.33 cm2 and 2 × 10⁶ cells in 5 cm2. At such a density, epithelialcells achieve confluence and become polarized after 7 days on 0.33-cm2 filter and10 d on 5-cm2 filters.
4. Before each experiment, measure the TEER of each filter.5. For IFN-γ incubation in 0.33-cm2 (5-cm2) filters, remove 40 µL (80 µL) of media
in the lower chamber and add 40 µL (80 µL) of IFN-γ stock solution basolaterally(see Note 3).
3.3. Transepithelial Electrical Resistance
1. To determine TEER, plate cells on 0.33-cm2 filters and let them grow for 7 d (seeNote 4).
2. The total resistance of the monolayer is defined as follows:
R(total) = R(monolayer) + R(blank)
3. Measure the blank resistance through a 0.15 M KCl solution and across the mem-brane support lacking cells.
4. Before measuring TEER incubate the STX2 electrode in 70% ethanol for 10 minand let it air-dry.
5. Measure TEER by dipping simultaneously the electrode in the upper and lowerchambers.
6. Calculate the TEER (see Note 5).
Record TEER of filters with or without cytokine incubation over a period of48 h are presented in Fig. 1A.
Tight Junctions and Cell–Cell Interactions 189

3.4. Paracellular Flux
1. For flux experiments plate cells on 0.33-cm2 filters and let them grow for 7 d (seeNote 6).
2. Check TEER of all monolayers.3. Wash cells three times with warm HBSS+.4. Add 200 µL of HBSS+ in the upper and 1 mL in the lower chamber.5. Equilibrate cells in HBSS+ for 10 min on an orbital shaker and keep the cells on
a heating stage at 37°C.6. Aspirate HBSS+ from the upper chamber (avoid disturbing the monolayer).7. Add 200 µL of FD-3 solution to the upper chamber (see Note 7). Shake the plate
on orbital shaker at 37°C.8. Remove 50 µL from the lower chamber at T = 120 min. Place in 96-well plate
(see Note 8).9. Create a standard curve with the FD-3 (serial dilution of mg/mL).
10. Read plate in fluorescence plate reader. Excitation: approx 490 nm, emission:approx 520 nm.
11. Plot standard curve to convert arbitrary fluorescence units to concentration. Fluxis expressed as concentration/observed area/time (µM/cm2/h).
Paracellular flux of fluorescein isothiocyanate dextran (3 kDa) measurementsacross epithelial cells exposed to IFN-γ is shown in Fig. 1B.
3.5. Cell Preparation for Immunoblotting
1. T84 cells are grown on 5-cm2 permeable supports for 10 d and incubated withIFN-γ for 48 h.
2. Wash cells twice with HBSS+.
190 Utech, Brüwer, and Nusrat
Fig. 1. Influence of IFN-γ on epithelia barrier function. Barrier function was monitoredby measuring TEER and paracellular flux of FD-3. (A) TEER was measured afterbasolateral incubation of polarized epithelial monolayers with IFN-γ. (B) Paracellularflux of FD-3 in confluent T84 monolayers was measured after basolateral exposure toIFN-γ.

3. Scrape cells into cell lysis buffer by using cell scraper at 4°C.4. Break cells by using a douncer. Use for every sample the same number of strokes
(e.g., 15) at 4°C.5. Centrifuge cell lysates (1500g, 5 min, 4°C).6. Determine the protein concentration of each sample and equalize protein concen-
trations (10 µg/lane).7. Add the sample buffer and boil the sample for 5 min at 95°C.8. Analyze equal amount of each fraction by SDS-polyacrylamide gel electrophoresis
(PAGE)/Western blotting.
3.6. Differential Detergent Extraction of TJ Proteins
1. T84 cells are grown on 5-cm2 permeable supports for 10 d and incubated withIFN-γ for 48 h.
2. Wash cells twice with HBSS+.3. Incubate cells for 30 min with TX-100 extraction buffer. Shake the plate on orbital
shaker at 4°C.4. Carefully remove supernatant.5. Subject the TX-100-soluble fraction to low-speed centrifugation (1500g, 5 min, 4°C)
to remove cellular debris.6. Add the TX-100-soluble fraction to an equal amount of sample buffer.7. Scrape the TX-100-insoluble fraction into an equal amount of SDS sample buffer.8. Boil samples for 5 min at 95°C.9. Analyze equal volumes of each fraction by SDS-PAGE/Western blotting.
3.7. SDS-Polyacrylamide Gel Electrophoresis
1. These instructions assume the use of a Mini-PROTEAN 3 Electrophoresis System(Bio-Rad).
2. For occludin and JAM-A Western blotting prepare a 1.5-mm thick, 8% gel bymixing 2.5 mL of separating buffer with 2.7 mL of acrylamide/bis solution, 4.6 mLof water, 100 µL of AP solution, 100 µL of SDS solution, and 6 µL of TEMED. Forclaudin-1 Western blotting, prepare a 1.5-mm thick, 12% gel by mixing 2.5 mL ofseparating buffer with 4.0 mL of acrylamide/bis solution, 3.3 mL of water, 100 µLof AP solution, 100 µL of SDS solution, and 4 µL of TEMED. Pour the gel, leav-ing space for a stacking gel, and overlay it with water. The gel should polymerizein about 30 min.
3. Pour off the water.4. Prepare the stacking gel by mixing 0.75 mL of stacking buffer with 1 mL
acrylamide/bis solution, 4.1 mL of water, 50 µL of AP solution, 50 µL of SDSsolution, and 10 µL of TEMED. Pour the stack and insert the comb. The stackinggel should polymerize within 30 min.
5. Once the stacking gel has set, carefully remove the comb and use a 3-mL syringefitted with a 22-gage needle to wash the wells with running buffer.
6. Add the running buffer to the upper and lower chambers of the gel unit and loadthe samples.
Tight Junctions and Cell–Cell Interactions 191

7. Complete the assembly of the gel unit and connect to a power supply. The gel canbe run at 30 mA.
3.8. Western Blotting
1. Switch the refrigerated/circulating water bath to maintain a temperature around 4°C.2. Prechill the transfer buffer.3. The samples that have been separated by SDS-PAGE are transferred elec-
trophoretically to nitrocellulose membranes. These directions assume the use of aBio-Rad transfer tank system.
4. Assemble a transfer cassette consisting of the gel and nitrocellulose.5. Ensure that no bubbles are trapped in the gel, nitrocellulose sandwich.6. The cassette is placed into the transfer tank such that the gel is between the nitro-
cellulose membrane and the cathode.7. Assemble the lid on the transfer tank and activate the power supply. Transfers
can be accomplished at 1 A for 1 h at 4°C.8. Once the transfer is complete the cassette is taken out of the tank and disassem-
bled carefully.9. The nitrocellulose is incubated in 50 mL of blocking buffer for 1 h at room tempera-
ture on a rocking platform.10. The blocking buffer is discarded and the membrane is quickly shrink-wrapped so
that a small aperture is left to fill with 1 mL of primary antibody solution.11. Air bubbles are smoothed out and the plastic foil is finally sealed.12. Rotate the membrane for 1 h at room temperature.13. The primary antibody is then removed and the membrane washed three times for
5 min each with 50 mL of TTBS.14. The secondary antibody is freshly prepared for each experiment and the membrane
is placed in 10 mL of secondary antibody solution for 1 h at room temperature ona rocking platform.
15. The secondary antibody is discarded and the membrane washed twice for 20 minwith TTBS and finally with TBS for 20 min.
16. ECL reagent is assembled according to manufacture instructions.17. After rotating the membrane in 2 mL of ECL reagent by hand for 1 min, the blot is
removed, slightly desiccated by using Kim-Wipes, and then placed between the leavesof an acetate sheet protector that has been cut to the size of an X-ray film cassette.
18. The blot is then placed in an X-ray film cassette with film for a suitable exposuretime.
Examples of proteins expression and differential detergent extraction resultsare shown in Fig. 2.
3.9. Confocal Immunofluorescence for TJ Proteins
1. For immunofluorescence labeling confluent T84 cells are plated on 0.33-cm2 filters.2. The cells should be rapidly rinsed twice with ice-cold HBSS+.3. Precooled ethanol solution is then added to inserts for 20 min and stored at
−20°C (200 µL in the upper and 1 mL in the lower chamber).
192 Utech, Brüwer, and Nusrat

4. Ethanol is discarded and the samples are blocked by incubation in blocking bufferfor 1 h at room temperature.
5. Disassemble the filters supports and place filters in buffer drops on parafilm inhumidity chambers.
6. Transfer filters to 50-µL drops containing primary antibody for 1 h at roomtemperature.
7. After incubation with the respective first antibody the filters are washed threetimes and incubated with secondary antibodies.
8. The filters are washed three times for 5 min with HBSS+.9. Filters are mounted in mounting solution on glass slides. Nail varnish is used to
seal the cover glasses and slides. The sample can be viewed immediately afterthe varnish has dry, or be stored in the dark at −20°C for as long as a month.
Confocal images showing internalized TJ transmembrane proteins after 48 hof IFN-γ treatment are shown in Fig. 3.
4. Notes1. Unless stated otherwise, all solutions should be prepared in water with a resistance
of 18.2 M Ohm*cm.2. T84 cells should not be plated too thinly, otherwise they do not grow properly.
A way to increase the density of cells is to trypsinize the cells and to place themin a smaller flask.
Tight Junctions and Cell–Cell Interactions 193
Fig. 2. Influence of IFN-γ on protein expression level and differential detergent solu-bility of TJ transmembrane proteins. (A) Protein expression levels of occludin, JAM-Aand claudin-1 in cells incubated with IFN-γ (100 U/mL) for 48 h or control were deter-mined. By using SDS-PAGE and immunoblotting for occludin, JAM-A, and claudin-1, noalteration in their overall expression was observed after treatment with IFN-γ. (B) T84monolayers treated with or without IFN-γ (100 U/mL) for 48 h were incubated at 4°Cwith extraction buffer containing 1% TX-100. The TX-100-soluble (Sol.) and -insoluble(Insol.) fractions were analyzed by SDS-PAGE and immunoblotted for occludin, JAM-A,and claudin-1. Significant pools of occludin were TX-100 insoluble, whereas JAM-A andclaudin-1 had a significant TX-100-soluble pool. In IFN-γ-treated cells, we observed achange in the TX-100 insolubility profiles of JAM-A. The small fraction of JAM-A in theTX-100-insoluble pool was further diminished by cytokine exposure.

3. T84 cells express the IFN-γ receptors exclusively basolaterally. Furthermore weobserved that T84 cells responsed to IFN-γ if the cells are plated on 5-µm poresize filters.
4. Before each experiment check TEER of each filter to maintain equal starting pointfor each experiment. The TEER should not be lower than 1000 Ω·cm2.
5. The TEER is definite as the resistance of a 1-cm2 area:
TEER = R(monolayer) · π · d2 4
where d = diameter. Resistance readings for 24 mm or lager diameter insertsobtained by using the EVOM with the STX2 electrode should not be converted tounit area resistance. The Endohm is recommended for these large inserts.
6. Fluorescent-labeled dextran instead of radiolabeled solute was used for experiments.A consistent picomolar flux of FD in a range of sizes (3–70 kDa) across T84 epithe-lial monolayers has been demonstrated. FD flux is time- and dose-dependent (12).
7. Keep 1mL of HBSS+ in the lower chamber without FD-3 solution.8. Protect plate from light.
References1. Madara, J. L. and Stafford, J. (1989) Interferon-gamma directly affects barrier
function of cultured intestinal epithelial monolayers. J. Clin. Invest. 83, 724–727.
194 Utech, Brüwer, and Nusrat
Fig. 3. IFN-γ stimuli induce internalization of TJ transmembrane proteins. Localizationof occludin, JAM-A and claudin-1 was determined by immunofluorescence labeling/confocal microscopy. In control T84 cells occludin, JAM-A and claudin-1 reveal typicaldistribution of these proteins in TJs. In T84 cells treated with 100 U/mL IFN-γ (for 48 h,occludin, JAM-A, and claudin-1 were internalized from the lateral membrane [arrow-heads]). Scale bar = 10 µm.

2. Gonzalez-Mariscal, L., Betanzos, A., and Nava, P. (2003) Tight junction proteins.Prog. Biophys. Mol. Biol. 81, 1–44.
3. Tsukita, S., Furuse, M., and Itoh, M. (2001) Multifunctional strands in tight junc-tions. Nat. Rev. Mol. Cell Biol. 2, 285–293.
4. Fanning, A. S., Jameson, B. J., and Jesaitis, L. A. (1998) The tight junction proteinZO-1 establishes a link between the transmembrane protein occludin and the actincytoskeleton. J. Biol. Chem. 273, 29,745–29,753.
5. Wittchen, E. S., Haskins, J., and Stevenson, B. R. (1999) Protein interactions at thetight junction. Actin has multiple binding partners, and ZO-1 forms independentcomplexes with ZO-2 and ZO-3. J. Biol. Chem. 274, 35,179–35,185.
6. Sandle, G. I., Higgs, N., Crowe, P., Marsh, M. N., Venkatesan, S., and Peters, T. J.(1990) Cellular basis for defective electrolyte transport in inflamed human colon.Gastroenterology 99, 97–105.
7. Katz, K. D., Hollander, D., Vadheim, C. M., et al. (1989) Intestinal permeability inpatients with Crohn’s disease and their healthy relatives. Gastroenterology 97,927–931.
8. Stallmach, A., Giese, T., and Schmidt, C. (2004) Cytokine/chemokine transcriptprofiles reflect mucosal inflammation in Crohn’s disease. Int. J. Colorectal Dis. 19,308–315.
9. Madara, J. L. (1998) Regulation of the movement of solutes across tight junctions.Annu. Rev. Physiol. 60, 143–159.
10. Clausen, C. (1989) Impedance analysis in tight epithelia. Methods Enzymol. 171,628–642.
11. Stoddard, J. S. and Reuss, L. (1988) Voltage- and time dependence of apical mem-brane conductance during current clamp in Necturus gallbladder epithelium. J. Membr. Biol. 103, 191–204.
12. Sanders, S. E., Madara, J. L., McGuirk, D. K., Gelman, D. S., and Colgan, S. P.(1995) Assessment of inflammatory events in epithelial permeability: a rapidscreening method using fluorescein dextrans. Epithelial Cell Biol. 4, 25–34.
Tight Junctions and Cell–Cell Interactions 195


197
From: Methods in Molecular Biology, vol. 341: Cell−Cell Interactions: Methods and ProtocolsEdited by: S. P. Colgan © Humana Press Inc., Totowa, NJ
16
Simultaneous Immunofluorescence Detection of Cadherin and β-Catenin in Mouse Tissue Sections
Nobuko Obara
SummaryBoth cell–cell adhesion and secreted signaling molecules are involved in the regulation of
normal tissue development and maintenance. β-catenin seems to link cadherin-mediated cell–celladhesion and Wnt signaling. Thus, its activity in particular cells or tissues, either during normaldevelopment or in tumorigenesis, has become a fascinating topic of investigation. Because themultiple functions of β-catenin intimately relate to its amount and localization within a cell,immunohistochemical detection of this molecule simultaneously with the cell adhesion mole-cule cadherin should provide helpful information on its potential activities. This detection can beconducted on tissue sections by using appropriate tissue preparation procedures and primaryantibodies from different species.
Key Words: Cadherin; β-catenin; cell adhesion; Wnt signaling; subcellular localization;immunofluorescence; confocal laser microscopy.
1. IntroductionDirect cell–cell adhesion mediated by cell-adhesion molecules, as well as
indirect cell–cell interaction mediated by secreted signaling molecules, consti-tutes the fundamentals of normal tissue development and maintenance (1).Classical cadherins are the best-studied family of cell adhesion molecules thatmediate Ca2+-dependent cell–cell adhesion (2), and alterations in cadherin func-tion have been implicated in tumorigenesis (3). β-catenin is one of the cytoplas-mic components of the molecular assembly required for cell–cell adhesionmediated by cadherin (4), and this molecule also participates in the canonicalWnt signaling pathway (5,6). During embryonic development, the Wnt signal-ing regulates cell proliferation, cell fate specification, and differentiation. Mis-regulation of this Wnt signaling pathway caused by defects in Wnt components

leads to abnormality in embryonic development and to a variety of diseases,including cancer in adults (6). Because β-catenin has been presumed to be akey molecule integrating cadherin-mediated cell–cell adhesion with Wnt signal-ing (5,7,8), the activity of this molecule is an attractive subject to be studied inboth normal development and tumorigenesis.
The amount and localization of β-catenin in a cell can be regulated by Wntsignaling. In the absence of Wnt signaling, β-catenin free from cadherin is phos-phorylated and targeted for ubiquitination through interaction with axin, adeno-matous polypopsis coli, and the protein kinases casein kinase-1 (CK1) andglycogen synthase kinase-3 and is then degraded by the proteasome. In this sit-uation, the level of β-catenin in the cytoplasm is kept to a low level. When cellsare exposed to Wnt signals, activation of Wnt signaling inhibits β-cateninphosphorylation and, hence, its degradation. As a result, β-catenin accumulates inthe cytoplasm and enters into the nucleus, where it interacts with T-cell factor/lymphoid enhancer factor (LEF/TCF) transcription factor to activate Wnt targetgenes (5,6). In this way, the amount of β-catenin changes depending on the Wntsignaling and its localization within a cell intimately relates to its function. Usingconfocal laser microscopy, we have demonstrated that abundant nuclear accu-mulation of β-catenin and upregulation of P-cadherin simultaneously take placein the enamel knot, the signaling center in the developing tooth germ (9). The useof primary antibodies from different species allows simultaneous detection oftwo or three antigens in general. Provided that the appropriate fixatives and anti-bodies are used, cadherins and β-catenin can be detected at the same time on afixed and frozen tissue section, which has the advantage of providing tissue mor-phology of good quality. For this purpose, we have used periodate-lysine 2%paraformaldehyde (PLP) fixative solution (10). β-catenin colocalized at the cellsurface along with cadherins most likely participates in cadherin-mediatedcell–cell adhesion, whereas the same molecule accumulated in the cytoplasm ornucleus probably plays another role. Nuclear localization of β-catenin can be dis-tinguished from the cytoplasmic one by use of nuclear counterstaining.
2. Materials2.1. Preparation of Frozen Tissues
1. PLP fixative solution: To 50 mL of 200 mM lysine-HCl, add 100 mM dibasicsodium phosphate (Na2HPO4) until the pH has been adjusted to 7.4 and then adjustthe volume to 100 mL with 100 mM sodium phosphate buffer, pH 7.4 (stock solu-tion A). Suspend 8 g of paraformaldehyde (extra pure, Merck) in 100 mL of distilledwater and heat in a fume hood on a stirring hot plate at 60°C. Add a few drops of1 N NaOH to the solution and stir until it clears (stock solution B). Both stocksolutions should be stored at 4°C and used within 10 d (solution A) or 1 mo (stocksolution B). Just before use, mix three volumes of stock solution A and 1 volume of
198 Obara

stock solution B, and add solid sodium m-periodate (Na IO4) to achieve a 10 mMconcentration (do not re-adjust the pH).
2. NH4Cl-PB: Prepare a solution of 100 mM sodium phosphate buffer (pH 7.4) con-taining 50 mM NH4Cl. Store at 4°C.
3. 20% sucrose–phosphate-buffered saline (PBS): To prepare PBS containing 20%sucrose, dissolve 20 g of sucrose in 80 mL of PBS (150 mM NaCl in 10 mMsodium phosphate buffer, pH 7.4), and add more PBS to make a volume of100 mL. Store at 4°C. To make 10 and 15% sucrose–PBS solutions, mix this solu-tion with PBS (see Note 1).
4. Embedding medium for tissue freezing: Tissue-Tek O. C. T. Compound (SakuraFinetek).
5. Tissue-embedding molds (see Note 2).6. Spray freezers (see Note 3).
2.2. Indirect Immunofluorescence Staining for Cadherin, β-Catenin, and the Nucleus
1. Glass slides coated with silane (see Note 4).2. Glass cover slips.3. Delimiting pen (Dako Cytomation, Denmark; see Note 5).4. Moist chambers for glass slides (see Note 6).5. Staining jars.6. PBS: 150 mM NaCl in 10 mM sodium phosphate buffer, pH 7.4. Prepare 3 M
NaCl and 200 mM sodium phosphate buffer, pH 7.4 (200 mM PB), and store atroom temperature. To prepare PBS, mix 50 mL of 3 M NaCl, 50 mL of 200 mMPB, and 900 mL of distilled water.
7. PBS containing 0.1 % Triton X-100 (PBS-TX): prepare 10 % (v/v) Triton X-100in distilled water. Mix 50 mL of 5 M NaCl, 50 mL of 200 mM PB, 10 mL of 10%Triton X-100, and 890 mL of distilled water.
8. Primary antibody dilution buffer: prepare Tris-buffered saline (150 mM NaCl in20 mM Tris-HCl, pH 7.4) and supplement it with 1% bovine serum albumin (fraction V) and 0.1 % Triton X-100. Store at −20°C (see Note 7).
9. Rat monoclonal antibody against mouse E-cadherin (clone no. ECCD-2, TakaraBio, Otsu, Japan): reconstitute the lyophilized material according to the manu-facturer’s instruction, aliquot and store at −20°C. Avoid repeated freeze–thawcycles to prevent denaturing the antibody (see Note 8).
10. Rabbit polyclonal anti-human β-catenin (BioSource International, Camerillo, CA,cat. no. AHO0462). Store at 4°C (see Note 9).
11. Goat anti-rat immunoglobulin (Ig)G conjugated with Alexa Fluor 488 (MolecularProbes, Eugene, OR): protect from light and store at 4°C (see Note 9).
12. Goat anti-rabbit IgG conjugated with Alexa Fluor 568, highly cross-adsorbed(Molecular Probes, Eugene, OR): protect from light and store at 4°C (see Note 9).
13. Igs for negative control staining: normal rat IgG and normal rabbit IgG. Aliquotand store at −20°C (see Note 10).
14. Normal goat serum. Aliquot and store at −20°C (see Note 10).
Immunolocalization of Cadherin and β-Catenin 199

15. DAPI: make 100 µM solution in distilled water (stock solution). Protect fromlight and store at 4°C. To make a working solution, add 3 µL of stock solution to1 mL of PBS just before use (working concentration is 300 nM).
16. PermaFluor, aqueous mounting medium (Shandone, Pittsburg, PA): store at 2 to 8°C.
3. MethodsIn general, fixation before tissue freezing makes it easier to cut frozen
sections and preserve tissue morphology of good quality in the sections. In somecases, however, fixation may lead to the loss of antigenicity. The conditions oftissue preparation suitable for immunohistochemistry depend on the nature ofthe individual antigen determinants. Furthermore, several antibodies are com-mercially available for a particular molecule and sometimes they react withdifferent antigen determinants. It is thus crucial to choose an appropriate com-bination of tissue preparation procedures and antibodies to obtain good results.Both of the primary antibodies used here react with the antigens in frozen sec-tions of mouse tissues fixed with the PLP fixative solution without any antigenretrieval procedures.
3.1. Preparation of Frozen Sections
1. To obtain mouse embryos, mother mice are anesthetized with ether and killed bycervical dislocation. After sacrifice of the mother, embryonic tissues are dissectedand immediately immersed in the ice-cold PLP fixative solution and fixed for 6 hin the same solution at 4°C. For sufficient penetration of the fixative solution, thesize of the dissected tissues should be as small as possible (see Note 11).
2. To inactivate residual aldehyde groups, wash the fixed specimens three times for30 min each in NH4Cl-PB at 4°C and then overnight in the same solution.Immerse the specimens sequentially in 10, 15, and 20% sucrose–PBS solutions,for 2 h for each concentration, at 4°C (see Note 12).
3. Pour a small amount of Tissue-Tek O. C. T. Compound in the embedding moldand put the specimen in it. If necessary, information on the specimens (name ofthe tissue, date of preparation, orientation of the tissue, and so on) can be markedon the mold before embedment.
4. Quickly freeze the tissues with a spray freezer. Spray the freezing solution in aPetri dish until the bottom of the dish is covered with the solution, and place theembedding mold containing the specimen and Tissue-Tek O. C. T. Compound init. The clear Tissue-Tek O. C. T. Compound turns white when it is frozen. Imme-diately put the frozen tissues into a freezer at −80°C and store them at the sametemperature before use (see Note 13).
3.2. Indirect Immunofluorescence Staining and Observation
1. Cut frozen sections at 8 µm with a cryostat at a temperature from −25 to −28°C(see Note 14). When the tissues stored at −80°C are used, they should be placed fora while in the cryostat before cutting to allow equilibration of their temperature.
200 Obara

2. Pick up the sections on silane-coated glass slides, and air-dry them for 30 min atroom temperature (see Note 15).
3. Draw a circle around the sections with a delimiting pen and wait until the drawn linebecomes dry. To rehydrate the sections, immerse the glass slides in PBS for 10 min.
4. Blocking: to make blocking solution, dilute normal goat serum to 10% with PBS-TX. Remove remaining PBS in the circles on the glass slides, and cover the sec-tions with the blocking solution. Place the glass slides in a moisture chamber andincubate them for 10 min at room temperature.
5. Make a mixture of diluted primary antibodies as follows: Add 0.5 µL of rat anti-mouse E-cadherin monoclonal antibody (see Note 16) and 1 µL of rabbit anti-humanβ-catenin polyclonal antibody (see Note 17) to 100 µL of primary antibody dilutionbuffer. The final concentration of each antibody is 10 µg/mL. For control staining,make a mixture of purified normal rat IgG and normal rabbit IgG in the same way.
6. Remove the blocking solution from the glass slides and carefully wipe the remain-ing blocking solution from the line drawn with the delimiting pen (see Note 18).
7. Cover the sections on the glass slides with the mixture of diluted primary antibod-ies (or for control staining, with that of normal Igs) and incubate them for either2 h at room temperature or overnight at 4°C. In either case, the glass slides shouldbe kept in moist chambers to avoid drying of the sections.
8. Make a mixture of secondary antibodies, Alexa Fluor-conjugated goat anti-rat IgGand anti-rabbit IgG, at a dilution of 1/500 in PBS-TX (see Note 19).
9. Wash the sections twice with PBS-TX and then once with PBS for 5 min each time.10. Incubate the sections with the mixture of secondary antibodies at room tempera-
ture for 2 h. The glass slides should be kept in a moisture chamber and protectedfrom the light.
11. Wash the sections twice with PBS-XT for 5 min each time.12. Cover the sections with DAPI working solution (300 nM in PBS) and incubate for
10 min at room temperature.13. After a brief wash with PBS, apply mounting medium to the sections and mount
cover slips. Because the aqueous mounting medium PermaFluor solidifies andimmobilizes the cover slip, sealing with nail varnish is not necessary.
14. The stained sections are examined under a confocal microscope to acquire digitalimages. Blue, green, and red fluorescence channels give the images of DAPI,E-cadherin, and β-catenin, respectively. Images for each of the three channels canbe merged with software when necessary. An example of a triple-stained sectionillustrating both membrane-associated and nucleus-localized β-catenin is shownin Fig. 1.
4. Notes1. For long-term storage, autoclave the solution at 121°C for 15 min. 2. Instead of commercial embedding molds, cups made from aluminum foil can
alternatively be used for the same purpose (Fig. 2).3. Spray freezers used for cutting sections in a cryostat are available from many
suppliers dealing in materials for histology and pathology.
Immunolocalization of Cadherin and β-Catenin 201
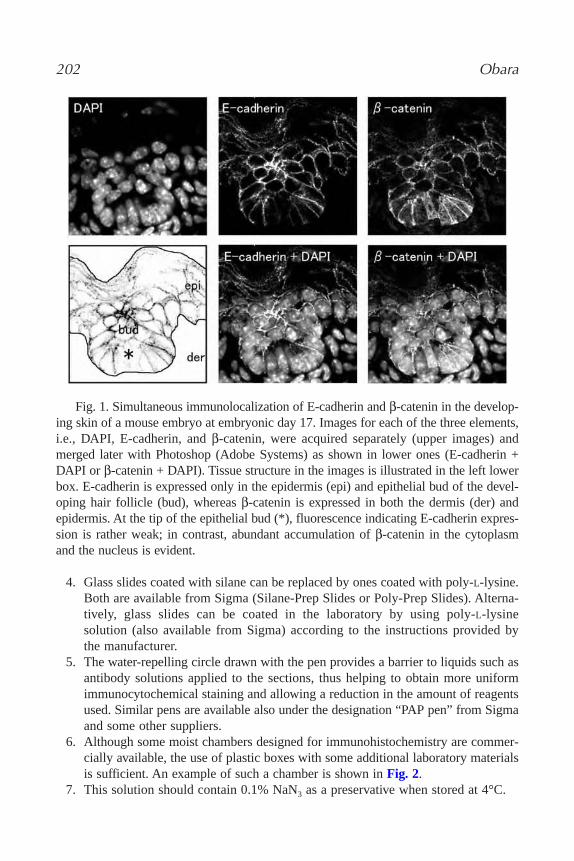
4. Glass slides coated with silane can be replaced by ones coated with poly-L-lysine.Both are available from Sigma (Silane-Prep Slides or Poly-Prep Slides). Alterna-tively, glass slides can be coated in the laboratory by using poly-L-lysine solution (also available from Sigma) according to the instructions provided bythe manufacturer.
5. The water-repelling circle drawn with the pen provides a barrier to liquids such asantibody solutions applied to the sections, thus helping to obtain more uniformimmunocytochemical staining and allowing a reduction in the amount of reagentsused. Similar pens are available also under the designation “PAP pen” from Sigmaand some other suppliers.
6. Although some moist chambers designed for immunohistochemistry are commer-cially available, the use of plastic boxes with some additional laboratory materialsis sufficient. An example of such a chamber is shown in Fig. 2.
7. This solution should contain 0.1% NaN3 as a preservative when stored at 4°C.
202 Obara
Fig. 1. Simultaneous immunolocalization of E-cadherin and β-catenin in the develop-ing skin of a mouse embryo at embryonic day 17. Images for each of the three elements,i.e., DAPI, E-cadherin, and β-catenin, were acquired separately (upper images) andmerged later with Photoshop (Adobe Systems) as shown in lower ones (E-cadherin +DAPI or β-catenin + DAPI). Tissue structure in the images is illustrated in the left lowerbox. E-cadherin is expressed only in the epidermis (epi) and epithelial bud of the devel-oping hair follicle (bud), whereas β-catenin is expressed in both the dermis (der) andepidermis. At the tip of the epithelial bud (*), fluorescence indicating E-cadherin expres-sion is rather weak; in contrast, abundant accumulation of β-catenin in the cytoplasmand the nucleus is evident.

8. Reconstituted solution should be supplemented with 0.1% NaN3 as a preservativewhen stored at 4°C.
9. For long-term storage, aliquot and store at −20°C.10. Both purified normal immunoglobulins for negative control staining and normal
sera for immunohistochemical blocking applications are available from manysuppliers (Santa Cruz, Dako Cytomation, and so on).
11. The length of fixation should be changed depending on the size and the kind oftissues to be examined. Homogeneous and high-quality fixation can be achievedwhen the tissue is small enough to allow penetration of the fixative solution withina short time. A thickness of less than 2 mm may be appropriate for most kinds oftissues when they are fixed only by immersion in PLP solution. Alternatively,tissues of postnatal animals can be prepared by perfusion with PLP solutionfollowed by excision and post-fixation with the same solution.
12. The time required for this treatment may depend on the size and the kind of tissues.13. Alternatively, liquid nitrogen can be used for freezing samples. Pour a small amount
of liquid nitrogen into a box made of styrene foam to fill the box with the vapor ofliquid nitrogen. Put the embedding molds containing the specimens and Tissue-TekO. C. T. Compound on a small styrene foam plate, place the plate in the vapor-filledbox, and keep it there until the Tissue-Tek O. C. T. Compound has turned white.
14. The appropriate temperature differs depending on the kind of tissues. Also, thetemperature should be changed when sections are cut at a different thickness. Ingeneral, a higher temperature is required when sections are cut thicker.
15. The dried frozen sections can be stored at −20 or −80°C for a few weeks or more.However, the stability of individual antigens may vary greatly from one to another.
16. Original concentration of the rat monoclonal antibody against mouse E-cadherinis 2 mg/mL when it is reconstituted according to the manufacturer’s instructions;
Immunolocalization of Cadherin and β-Catenin 203
Fig. 2. (A) Tissue-embedding molds and (B) a moisture chamber. (A) A commercialtissue-embedding mold (left) and two examples for cups made from aluminum foil (right)are depicted. (B) An example for a homemade moisture chamber. In a plastic box with acover, a piece of wet paper wiper is placed, and two glass tubes are aligned in parallel onit. For incubation with antibodies, glass slides bridge the glass tubes, as shown.

and the recommended working concentration for immunohistochemistry indicatedin these instructions is 10 µg/mL.
17. Concentration of the undiluted antibody is 1 mg/mL, and the recommended work-ing concentration for immunohistochemistry is 10 to 20 µg/mL according to themanufacturer’s instructions.
18. The water-repelling line drawn with the pen is ineffective if it is covered withliquid containing detergent (e.g., Triton X-100).
19. The original concentration of Alexa Fluor-conjugated secondary antibodies is2 mg/mL, and the recommended working concentration is 10 to 20 µg/mL accord-ing to the manufacturer’s instructions.
AcknowledgmentThe author thanks Dr. Hervé Lesot, Institut de Biologie Médicale, Université
Louis Pasteur, for critically reviewing the manuscript.
References1. Gumbiner, B. M. (1996) Cell adhesion: the molecular basis of tissue architecture
and morphogenesis. Cell 84, 345–357.2. Takeichi, M. (1988) The cadherins: cell–cell adhesion molecules controlling
animal morphogenesis. Development 102, 639–655.3. Wheelock, M. J. and Johnson, K. R. (2003) Cadherins as modulators of cellular
phenotype. Annu. Rev. Cell Dev. Biol. 19, 207–235.4. Ozawa, M., Baribault, H., and Kemler, R. (1989) The cytoplasmic domain of the
cell adhesion molecule uvomorulin associates with three independent proteinsstructurally related in different species. EMBO J. 8, 1711–1717.
5. Nelson, W. J. and Nusse, R. (2004) Convergence of Wnt, beta-catenin, and cad-herin pathways. Science 303, 1483–1487.
6. Logan, C. Y. and Nusse, R. (2004) The Wnt signaling pathway in developmentand disease. Annu. Rev. Cell Dev. Biol. 20, 781–810.
7. Vleminckx, K. and Kemler, R. (1999) Cadherins and tissue formation: integratingadhesion and signaling. Bioessays 21, 211–220.
8. Jamora, C. and Fuchs, E. (2002) Intercellular adhesion, signalling and thecytoskeleton. Nat. Cell Biol. 4, E101–E108.
9. Obara, N. and Lesot, H. (2004) Subcellular localization of beta-catenin and cad-herin expression in the cap-stage enamel organ of the mouse molar. Histochem.Cell Biol. 121, 351–358.
10. McLean, I. W. and Nakane, P. (1974) Periodate-lysine-paraformaldehyde fixative:A new fixative for immunoelectron microscopy. J. Histochem. Cytochem. 22,1077–1083.
204 Obara

205
From: Methods in Molecular Biology, vol. 341: Cell−Cell Interactions: Methods and ProtocolsEdited by: S. P. Colgan © Humana Press Inc., Totowa, NJ
17
In Vitro Neutrophil Transepithelial Migration
Winston Y. Lee, Alex C. Chin, Susan Voss, and Charles A. Parkos
SummaryPolymorphonuclear leukocyte (PMN) transmigration into tissues is a highly regulated process
and plays a central role in host defense. In inflammatory human diseases such as ulcerative coli-tis and Crohn’s disease, the infiltration of intestinal mucosa by large numbers of PMNs con-tributes to epithelial pathophysiology. The sequence of events that fine-tune PMN migration acrossepithelial cells is not well-understood. In this chapter, we describe a method to study PMN trans-migration across intestinal epithelial T84 monolayers using a modified Boyden chamber system.This in vitro model system consists of three main components: the epithelium, purified PMN,and a chemoattractant gradient. Intestinal epithelial cells are cultured as inverted monolayers onpermeable filter supports to facilitate the study of PMN transmigration in the physiologically rel-evant basolateral-to-apical direction. PMNs are isolated from human blood using dextran sedimen-tation followed by Ficoll density gradient centrifugation. PMN transmigration is elicited usingN-formyl-methionyl-leucyl-phenylalanine gradients and is quantified by assaying for myeloperox-idase activity. The advantages of this model are its reductionist approach and the fact that thesystem can be easily manipulated. Studies using this model system will shed more light on themechanisms regulating PMN responses in acute inflammatory diseases.
Key Words: Neutrophil; PMN; intestinal epithelial cells; T84; chemotactic gradients; fMLP;Boyden chamber; myeloperoxidase; transmigration.
1. IntroductionAs a first line of defense, polymorphonuclear leukocytes (PMNs) play a
critical role in many inflammatory processes. For example, in acute illnessessuch as bronchial pneumonia and bacterial enterocolitis and in chronic dis-eases such as inflammatory bowel disease and asthma, large numbers of PMNsinfiltrate through tissues and across mucosal surfaces at sites of inflammation(1–4). Furthermore, in ischemic injuries of the heart, kidney, and intestine,subsequent PMN infiltration can result in reperfusion injury (5–8). In these

examples, the severity of symptoms correlates with the degree of PMN infil-tration. In mucosal organs, the presence of PMN transepithelial migration cor-relates strongly with disease pathophysiology.
For PMNs to exit the circulation and migrate across mucosal surfaces, theymust cross vascular endothelium, interstitial matrix (including mesenchymaltissue) and, finally, the epithelium. This process involves a complex series ofsignaling events between PMN and other cells within the tissue. At sitesof inflammation, activated vascular endothelial cells secrete mediators, such astumor necrosis factor-α and interleukin-8, that are important in PMN recruit-ment. In addition, the endothelium also expresses surface adhesion moleculesthat facilitate adhesion of activated PMN (9,10). Selectin-mediated rolling ofPMN along the vascular endothelium within the microcirculation at inflamma-tory sites precedes firm, integrin-mediated adhesion that is followed byextravasation either transcellularly or paracellularly through the vascularendothelium (11,12). Afterward, the movement of subendothelial PMN in theinterstitial matrix is guided by gradients of signals derived from invadingmicroorganisms such as bacterial peptides, or agents elicited as cellularresponses to injury/invasion such as interleukin-8 (13–16). To migrate acrossmucosal epithelia, PMNs must first adhere to the basolateral membrane, anevent mediated by β2-integrins (17–19). Subsequently, PMNs migrate alongthe paracellular space between epithelial cells where a series of ill-definedsignaling events facilitate the passage of the PMN across tight junctions andinto the lumen. Recent studies have highlighted the importance of junctionaladhesion molecule protein family members (20) and CD47-SIRPα interac-tions (21,22) as mediators of PMN migration across the epithelial paracellularspace.
Most of what is known about PMN recruitment, extravasation, and transmi-gration is derived from studies conducted with modified Boyden chambersystems (Fig. 1). This in vitro model of transepithelial or transendothelialmigration consists of three components: an epithelial or endothelial mono-layer cultured on a permeable support of defined pore size, purified PMNs, anda chemotactic gradient. For epithelial monolayers, cells are grown on suchpermeable filter supports until confluency is reached, as determined by a numberof methods. Freshly isolated PMNs are added to one side of the monolayerand stimulated to transmigrate across the monolayer/filter in the presence of achemotactic gradient. The utility of this model is its reductionist nature, where theminimal necessary components are assembled to interact under simple condi-tions. Another utility is the ease with which this system can be manipulated. Forinstance, antibodies or pharmacological agents can be added to the system tosee their effects on transmigration (17,20–23). Cell monolayers can also bestimulated with cytokines and evaluated for alterations in characteristics of PMN
206 Lee et al.

transepithelial migration (24). Although many variations of this system exist, thisdiscussion will focus on the most commonly used transwell setup, in whichfreshly isolated human PMN transmigrate across T84 intestinal epithelial mono-layers in response to N-formyl-methionyl-leucyl-phenylalanine (fMLP) gradients.
2. Materials2.1. Plating T84 Monolayers
1. Transwell inserts with surface areas of 0.33 cm2 and pore size of 5 µm placed ina 24-well flat bottom cell culture plate (Costar).
In Vitro Neutrophil Transepithelial Migration 207
Fig. 1. Illustrations of different setups of the PMN transepithelial migration assay.(A) In this inverted configuration, the apical sides of epithelial monolayer are grownfacing the bottom of the well. The different shades of gray represent the chemotacticgradients of fMLP, which dictates the directionality of PMN migration. Therefore, inthis setup, PMN will migrate from basolateral side to the apical side of the monolayer(B→A), then detach and settle at the bottom of the well. This setup recapitulates PMNmigration across the mucosal surfaces during inflammation. (B) In this “standard”configuration, the apical side of the monolayer is facing away from the bottom of thewell. PMN will migrate from the apical side to the basolateral side of the monolayer(A→B), then detach and settle at the bottom of the well. (C) To perform a kineticassay of PMN transmigration across the epithelial monolayer, the transwell is seriallytransferred into new wells containing chemotactic gradients of fMLP for each timepoint needed.

2. T84 cell medium is a 11 mixture of Dulbecco’s Modified Eagle’s Medium andF-12 Nutrient Mixture, supplemented with 0.014 M NaHCO3, 0.015 M HEPES,penicillin, streptomycin, and 6% fetal calf serum (Life Technologies/Gibco).
3. 0.05% Trypsin–EDTA (Cellgro).4. Transepithelial resistance is measured by using an EVOM™ Epithelial Voltohmeter
(World Precision Instruments).5. Collagen stock can be prepared from rat tail tendon using methods modified
from Cereijido and others (25). Dissect the rat tail tendon by pealing off theshiny white layer underneath skin with a hemostat. The tendon is then mincedand divided into 75-mg aliquots. At this point, the tendon can be stored at–80°C. Dehydrate the 75 mg of tendon in 70% ethanol for 15 minutes.Solubilize tendons in 100 mL of 1% (v/v) acetic acid at 4°C. Stir the mixture at4°C overnight. The next morning, the mixture will be viscous, and someundissolved materials will remain. Spin the collagen at 25,000g for 30 min.Dialyze the spun collagen solution against at least 2 L of cold distilled waterwith two to three changes. The dialyzed collagen will be referred to as thecollagen stock and stored at 4°C.
2.2. PMN Isolation From Human Blood
1. Sterile 10-mL and 30-mL plastic syringes and 21- and 20.5-gage needles (Becton,Dickinson, and Company).
2. Cell culture grade distilled and deionized water (ddH2O) with impedance greaterthan 18Ω.
3. Anti-coagulation buffer: 4% sodium citrate (Sigma) w/v in ddH2O.4. Normal saline: 0.9% sodium chloride (Sigma) w/v in ddH2O.5. Sedimentation buffer: 2% dextran 500 (Amersham Bioscience) w/v in normal
saline.6. Chilled Ficoll-Paque™ Plus (Amersham Bioscience).7. Lysis buffer: 0.8% ammonium chloride supplemented with 1.9 mg of EDTA and
0.05 g of sodium bicarbonate per 50 mL of buffer.8. Hank’s balanced buffered saline (HBSS) with calcium (HBSS+) and without
calcium (HBSS–; Sigma).
2.3. Transmigration and Myeloperoxidase Assay
1. 10–2 M fMLP (Sigma) stock dissolved in dimethyl sulfoxide. Subsequent dilu-tions of the stock are done in HBSS+.
2. 1 M sodium citrate in water, pH 4.5.3. 10% Triton-X 100 in water.4. 2,2′-azino-bis(3-ethylbenzthiazoline-6-sulfonic acid) (ABTS) buffer: for every
50 mL, add 0.036 g of ABTS, 5 mL of 1 M sodium citrate, 45 mL of water, and100 µL of 30% w/v H2O2.
5. Flat bottom 96-well plates (Falcon).6. Microplate reader with 405 nm filter (Molecular Devices).
208 Lee et al.

3. Methods
3.1. Culturing T84 Intestinal Epithelial Cell Monolayers on Transwell Filter Supports
1. The night before seeding T84 cells on transwells, coat the sides of transfilters (seeNote 1) onto which cells will be seeded with collagen in a 150 × 25-mm Petri dishin a laminar flow hood (see Note 2). To do so, dilute collagen stock 100-fold in60% (v/v) ethanol in water, and transfer 50 µL to each filter. Let the filters dryovernight.
2. As T84 cells reach near confluency in a T162 flask, the cells are first washedwith phosphate-buffered saline then detach with trypsin–EDTA. One T162 flaskshould be treated with 1 mL of trypsin–EDTA and incubated at 37°C for 30 min.To culture monolayers in a normal configuration, in which the apical membranesof epithelial cells face upward, trypsin–EDTA-treated cells are diluted 120 inmedia and 162 µL of the cell suspension is seeded on the collagen coated filtersupport, which is placed in a 24-well tissue culture dish containing 1 mL of mediain each well. To culture monolayers in an inverted configuration, in which theapical membranes of the cells will be facing downward, the trypsin–EDTA elicitedcells are diluted 110 in media and 81 µL of the suspension is placed on theunderside of collagen coated transfilters that are resting upside down in a 15-cm2
sterile Petri dish (see Note 2). The cells are incubated at 37°C overnight to allowfor adhesion. Afterwards, the inverted transwells are simply “flipped” and placedinto 24-well tissue culture wells filled with 1 mL of fresh T84 medium. The upperchamber is then supplemented with 162 µL of medium.
3. Like many other epithelial cell lines that are maintained in the laboratory, T84 cellswill, over time, begin to exhibit aberrant phenotypes, presumably because ofgenetic drift. To monitor for such “drift,” we routinely measure transepithelialresistance (TER) as T84 cells are becoming confluent in transwells (Fig. 2A).Typically, TER increases over time after plating of cells and plateaus between days7 and 10. For T84 cells, during this 3-d window, TER typically ranges from 800 to2500 Ω·cm2, which is considered satisfactory (see Note 3).
3.2. Isolation of PMNs
1. From experience, we have observed that substantial care must be taken to avoidpreactivation of PMNs during the process of isolation. Such preactivation islikely to occur secondary to exposure to trace amounts of microbial-derivedproducts in buffers, glassware, and so on. Assays with preactivated PMNstypically yield altered results. It is recommended to make fresh solutions withsterile water and reagents from dedicated chemical sources each time beforeisolation.
2. Blood collection and plasma separation: fill a syringe with enough 3.8%sodium citrate so that the final concentration after blood collection will be0.38%. For example, to collect 27 mL of blood, fill the syringe with 3 mL of3.8% sodium citrate. After drawing blood, invert the syringe several times, and
In Vitro Neutrophil Transepithelial Migration 209

transfer the blood to a 50-mL conical tube. Centrifuge blood at 162g for 10 minwithout braking at room temperature, which will separate the blood into threelayers: a yellow plasma layer, a thin white buffy coat, and a dark layer of redblood cells at the bottom.
3. Dextran sedimentation of red blood cells (RBCs): from the aforementionedcentrifuged blood sample, remove the plasma layer with a clean plastic pipet,taking care not to disturb the white buffy coat. It is not a problem if a small amountof plasma remains on top of the buffy coat. Then, add an equal volume of chilledsedimentation solution and gently invert the tube several times until the dark redlayer becomes suspended. Place the conical tube upright at 4°C for 45 min. Asthe RBCs sediment, forming a thick red layer at the bottom, a pink turbid fluidphase will appear on top. Transfer the pink upper phase to a new 50-mL conicaltube and centrifuge at 162g for 10 min at 4°C with the brake turned on. At thesame time, aliquot 3 mL of chilled Ficoll into a 15-mL conical tube. Aftercentrifugation, remove the supernatant with a sterile pipet and gently resuspendthe pellet in 10 mL of normal saline.
4. Separation of PMN/RBC from monocytes/lymphocytes with a Ficoll gradient:carefully layer the resuspended cell pellet onto the 3 mL of Ficoll using a syringewith a 21-gage needle. After centrifugation at 162g for 30 min at 4°C, fourdistinct layers will appear. On top there will be a clear fluid phase of approx8 mL. Immediately below will be a thin cloudy layer consisting of monocytesand lymphocytes. Underneath the thin cloudy layer is a clear Ficoll phase, whichoverlies a red pellet consisting of RBCs and PMNs.
210 Lee et al.
Fig. 2. Measuring TER to monitor the growth of epithelial monolayers. (A) TER wasmeasured from the day of seeding epithelial cells onto the permeable support (day 0) today 10 in the inverted configuration. From day 3 to 7, TER increased rapidly, indicatingthat epithelial cells were growing rapidly. Then, TER stabilized as the monolayerbecomes confluent. It was during the 3-d window that we performed the transmigrationassay. (B) TER was monitored every 30 min for 90 min after washing epithelial mono-layers with HBSS+. Notice how the TER decreased during the first 30 min and thenrecovered in the next hour. It is recommended to let the monolayers “recover” beforeperforming the transmigration assay.
5. RBC lysis: from the aforementioned Ficoll separation, remove all layers except thered pellet. Gently resuspend the pellet in 50 mL of cold lysis buffer and incubate onice for no more than 2 min. As RBCs undergo lysis, the suspension will become lessturbid. Immediately centrifuge the lysis suspension at 162g for 10 min at 4°Cfollowed by a wash with 50 mL of cold HBSS–.
6. Calculating the yield of PMNs: For each 30 mL of blood drawn, resuspendwashed PMN in 1 mL of HBSS–. Mix 10 µL of PMN with 990 µL of 2% aceticacid. The acetic acid will facilitate in the counting of PMN nuclei, which lookmulti-lobular, whereas the nuclei of monocytes and lymphocytes will be round(see Note 4). Estimate the yield of the cells with a hemacytometer (see Note 5).
7. Assessing the state of activation of PMNs: PMNs can easily become primed if at anypoint during the preparation they are exposed to microbial product contaminants.PMNs from contaminated preparations will migrate across collagen coated filters insignificant numbers within the first 30 min of exposure to an fMLP gradient, whereaswe have observed that unprimed PMN barely migrate. However, over a time courseof 2 h, primed PMNs will migrate significantly less than unprimed PMNs. To per-form this assay, place a collagen-coated 5-µm pore-sized transwell filter in a 24-welltissue culture plate. Transfer 100 µL of HBSS+ and 106 PMNs in 20 µL of HBSS–into the upper chamber; then place 500 µL of 10-7 M fMLP in HBSS+ in the lowerchamber. Incubate for 25 min at 37°C and visually inspect the number of PMNsmigrated using a ×50 field of view. We routinely use this assay before major exper-iments as a way to evaluate whether PMN preparations are primed or not.
3.3. Transmigration of PMNs Across Intestinal Epithelial Cell Monolayers
1. Because epithelial cells are known to secrete growth factors and other cytokinesthat may modulate transepithelial migration of PMNs, it is important to washepithelial monolayers with 200 µL of warm HBSS+ in the upper chamber and1 mL in the lower chamber. Immediately after washing, we have observed thatthe TER may fluctuate; therefore, allow monolayers to “recover” from washingfor 45 min at 37°C. Measure the TER (Fig. 2B). At this point, the TER shouldhave equilibrated, usually to a lower resistance (see Note 6). If kinetic assays aredesired, one additional well filled with 1 mL of 10–6 M fMLP in HBSS+ shouldbe added per time point for each monolayer. For example, if the experimentinvolves a kinetic assay with a 30-min time-point over 2 h, it will be necessaryto fill four additional wells with chemoattractant.
2. After equilibration of T84 monolayers, remove the HBSS+ from the upper andlower chambers and replace with 100 µL and 500 µL of HBSS+, respectively.Then, apply the number of PMN needed in a volume of 20 µL of HBSS–.For example, if applying 106 PMNs, add 20 µL of PMN suspension at the densityof 5 × 10⁷ cells/mL. If desired, one can add antibodies or pharmacological agentsinto the top chamber (see Note 7). It is important not to vary volumes of buffersused in upper and lower chambers between experiments. Differences in volumesused can change chemotactic gradients and result in different hydrostatic pres-sures, which can alter the pattern of transmigration. To initiate transmigration,
In Vitro Neutrophil Transepithelial Migration 211

add 5 µL of 10–4 M fMLP to all bottom chambers so that the final concentrationof fMLP in the bottom chambers will be 10–6 M. Incubate the transwells at 37°Cand serially transfer the monolayers at each time-point into one of the chemo-attractant containing wells that have been prepared for the assay. Swirl the trans-well plate lightly before transferring. After the last time point, place the insert ina well with 500 µL of HBSS+ (Fig. 1).
3. To quantify migrated PMN, the azurophil granule enzyme myeloperoxidaseactivity is assayed using a simple colorimetric assay. To prepare the standardcurve, serially dilute PMN suspension before transmigration (see Note 8). Thestandard curve should range from 1.5 × 10⁶ to 2 × 10⁵ PMNs/mL (see Note 9).Add 1 M sodium citrate buffer and 10% Triton-X100 solution in a 110 ratio toeach well and dilution of the standard. Puncture the filter supports with 100-µLpipet tips to solubilize migrated PMNs. Place the plates on a rocking or swirlingplatform for 15 min at room temperature to permeablize the cells. Transfer 100 µLof PMN lysate from each transwell to a well in a flat bottom 96-well plate. Witha multi-channel pipet, aliquot 100 µL of ABTS solution to the PMN lysate in theplate. Allow color to develop until the highest OD405 reading in the standard isapprox 2.5. With an OD of 2.5 for the highest reading, the standard curve shouldbe linear. Standard software such as MS Excel® can be used to perform calcula-tions. The standard curve allows both calculation of cell numbers from OD read-ings and normalization among samples (Fig. 3).
4. Notes1. The pore size of transwell filters should be no less than 3 µm in diameter.
Otherwise, PMNs will not be able to migrate through the filters.2. T84 intestinal epithelial cells can be seeded either on the top or bottom sides of
transwell filters. If T84 cells are seeded on top, the apical membranes will face
212 Lee et al.
Fig. 3. Using myeloperoxidase assay to quantify PMN in transmigration assay.(A) Serial dilutions of PMNs are quantified using myeloperoxidase assays. The OD405
correlates with the PMN concentration linearly. This linear correlation (r2 = 0.987)allows us to calculate unknown concentrations of PMNs. (B) A typical 2-h course ofPMN transepithelial migration quantified using myeloperoxidase assays.
upwards resulting in a “standard” configuration. However, with the standardconfiguration, PMNs will transmigrate across the epithelial monolayers in anapical-to-basolateral direction which is opposite to what occurs in vivo. To recapit-ulate transmigration in a physiologically relevant direction, T84s can be cultured onthe underside of filters in an “inverted” configuration in which the basolateralaspect of the monolayer is facing upwards. Using such inverted monolayers, PMNswill migrate in a basolateral-to-apical direction which is consistent with the direc-tion of PMN transmigration in vivo.
3. When T84 cells or other epithelia are cultured for many passages (typically morethan 15 or 20 passages), monolayer properties commonly change as manifested bya faster growth rate and altered barrier function. Epithelial cells may grow anddivide through the filter pores and form monolayers on both sides of the tran-swell filters resulting in artificially high TER (>3000 Ω·cm2). Conversely, cellscan form poor barriers with low TER values. Thus, when culturing monolayers onpermeable supports, if TER values start to drift, it may be worth consideringbringing up a new batch of cells.
4. A Trypan Blue exclusion test also can be used to determine the viability ofthe cells in addition to estimating the yield of the cells in the preparation. How-ever, it is more difficult to distinguish monocytes from PMNs with Trypan Blue.Typically, we obtain more than 99% viability of cells isolated by these methods.
5. For every 30 mL of blood, the yield is generally in the range of 5 × 10⁷ PMNs.However, it may be worth considering to maintain a donor log to obtain areasonable prediction of the expected PMNYield among individual donors.
6. After the initial wash, TER often will increase by 10% and subsequently decreaseas the cells are equilibrating.
7. To test the effects of antibodies on transmigration, generally it is sufficient to addantibody at a concentration of 10 to 20 µg/mL in the upper chamber. The diffu-sion of antibody to the lower chamber can be assumed to be minimal during thetime course of the transmigration assay. However, for pharmacological agents,one should consider adding the agent in both upper and lower chambers. It maybe necessary to optimize the assay for each antibody or agent.
8. Once PMNs are exposed to calcium in HBSS+, they are often more difficultto handle because of cell clumping and aggregation. Therefore, it is better toserially dilute PMN in cold calcium free HBSS– before use in transmigrationassays.
9. After subtracting the blank OD values from the standard wells, the OD readings ofthe standards should be proportional to the dilution factor used for the samples. Forinstance, if 106 cells give an OD reading of 2.2, then the OD reading of 5 × 10⁵
cells should be 1.1.
References1. Weiland, J. E., Davis, W. B., Holter, J. F., Mohammed, J. R., Dorinsky, P. M., and
Gadel J. E. (1986). Lung neutrophils in the adult respiratory distress syndrome.Clinical and pathophysiologic significance. Am. Rev. Respir. Dis. 133, 218–225.
In Vitro Neutrophil Transepithelial Migration 213
2. Hawker, P. C., McKay, J. S., and Turnberg, L. A. (1980) Electrolyte transport acrosscolonic mucosa from patients with inflammatory bowel disease. Gastroenterology79, 508–511.
3. Nusrat, A., Parkos, C. A., Liang, T. W., Carnes, D. K., and Madara, J. L. (1997)Neutrophil migration across model intestinal epithelia: monolayer disruption andsubsequent events in epithelial repair. Gastroenterology 113, 1489–1500.
4. Koyama, S., Rennard S. I., Leikauf, G. D., et al. (1991) Endotoxin stimulatesbronchial epithelial cells to release chemotactic factors for neutrophils. A potentialmechanism for neutrophil recruitment, cytotoxicity, and inhibition of proliferationin bronchial inflammation. J. Immunol. 147, 4293–4301.
5. Winn, R. K., Vedder, N. B., Sharar, S. R., and Harlan, J. M. (1997) Leukocyte-endothelial cell interactions in ischemia-reperfusion injury. Ann. NY Acad. Sci.832, 311–321.
6. Kakkar, A. K. and Lefer, D. J. (2004) Leukocyte and endothelial adhesion mole-cule studies in knockout mice. Curr. Opin. Pharmacol. 4, 154–158.
7. Jordan, J. E., Zhao, Z.-Q., and Vinten-Johansen, J. (1999) The role of neutrophilsin myocardial ischemia-reperfusion injury. Cardiovasc. Res. 43, 860–878.
8. Frangogiannis, N. G., Smith, C. W., and Entman, M. L. (2002) The inflammatoryresponse in myocardial infarction. Cardiovasc. Res. 53, 31–47.
9. Liu, Y., Shaw, S. K., Ma, S., Yang, L., Luscinskas, F. W., and Parkos, C. A. (2004)Regulation of leukocyte transmigration: cell surface interactions and signalingevents. J. Immunol. 172, 7–13.
10. Bianchi, E., Bender, J. R., Blasi, F., and Pardi, R. (1997) Through and beyond thewall: late steps in leukocyte transendothelial migration. Immunol. Today 18, 586–591.
11. Feng, D., Nagy, J. A., Pyne, K., Dvorak, H. F., and Dvorak, A. M. (1998)Neutrophils emigrate from venules by a transendothelial cell pathway in responseto FMLP. J. Exp. Med. 187, 903–915.
12. Carman, C. V. and Springer, T. A. (2004) A transmigratory cup in leukocytediapedesis both through individual vascular endothelial cells and between them.J. Cell Biol. 167, 377–388.
13. McCormick, B., Hofman, P., Kim, J., Carnes, D., Miller, S., and Madara, J. (1995)Surface attachment of Salmonella typhimurium to intestinal epithelia imprints thesubepithelial matrix with gradients chemotactic for neutrophils. J. Cell Biol. 131,1599–1608.
14. Loike, J. D., el Khoury, J. Cao, L., et al. (1995) Fibrin regulates neutrophil migrationin response to interleukin 8, leukotriene B4, tumor necrosis factor, and formyl-methionyl-leucyl-phenylalanine. J. Exp. Med. 181, 1763–1772.
15. Loike, J. D., Cao, L., Budhu, S., et al. (1999) Differential regulation of beta 1integrins by chemoattractants regulates neutrophil migration through fibrin. J. CellBiol. 144, 1047–1056.
16. Loike, J. D., Cao, L., Budhu, S., Hoffman, S., and Silverstein, S. C. (2001) Block-ade of α5β1 integrins reverses the inhibitory effect of tenascin on chemotaxis ofhuman monocytes and polymorphonuclear leukocytes through three-dimensionalgels of extracellular matrix proteins. J. Immunol. 166, 7534–7542.
214 Lee et al.

17. Parkos, C. A., Delp, C., Arnaout, M. A., and Madara, J. L. (1991) Neutrophilmigration across a cultured intestinal epithelium. Dependence on a CD11b/CD18-mediated event and enhanced efficiency in physiological direction. J. Clin. Invest.88, 1605–1612.
18. Tosi, M., Hamedani, A., Brosovich, J., and Alpert, S. (1994) ICAM-1-independent,CD18-dependent adhesion between neutrophils and human airway epithelial cellsexposed in vitro to ozone. J. Immunol. 152, 1935–1942.
19. Agace, W., Patarrayo, M., Svensson, M., Carlemalm, E., and Svanborg, C. (1995)Escherichia coli induces transuroepithelial neutrophil migration by an intercellularadhesion molecule-1-dependent mechanism. Infect. Immun. 63, 4054–4062.
20. Zen, K., Babbin, B. A., Liu, Y., Whelan, J. B., Nusrat, A., and Parkos, C. A. (2004)JAM-C is a component of desmosomes and a ligand for CD11b/CD18-mediatedneutrophil transepithelial migration. Mol. Biol. Cell 15, 3926–3937.
21. Liu, Y., Buhring, H. -J., Zen, K., et al. (2002) Signal regulatory protein (SIRPalpha),a cellular ligand for CD47, regulates neutrophil transmigration. J. Biol. Chem. 277,10,028–10,036.
22. Liu, Y., Merlin, D., Burst, S. L., Pochet, M., Madara, J. L., and Parkos, C. A.(2001) The Role of CD47 in neutrophil transmigration. Increased rate of migrationcorrelates with increased cell surface expression of CD47. J. Biol. Chem. 276,40,156–40,166.
23. Parkos, C., Colgan, S., Liang, T., et al. (1996) CD47 mediates post-adhesive eventsrequired for neutrophil migration across polarized intestinal epithelia. J. Cell Biol.132, 437–450.
24. Colgan, S., Parkos, C., Delp, C., Aranaout, M., and Madara, J. (1993) Neutrophilmigration across cultured intestinal epithelial monolayers is modulated by epithe-lial exposure to IFN-gamma in a highly polarized fashion. J. Cell Biol. 120,785–798.
25. Cereijido, M., Robbins, E., Dolan, W., Rotunno, C., and Sabatini, D. (1978) Polarizedmonolayers formed by epithelial cells on a permeable and translucent support. J. CellBiol. 77, 853–880.
In Vitro Neutrophil Transepithelial Migration 215


217
18
The Blot Rolling Assay
A Method for Identifying Adhesion Molecules Mediating Binding Under Shear Conditions
Robert Sackstein and Robert Fuhlbrigge
SummaryAdhesive interactions of cells with blood vessel walls under flow conditions are critical to a
variety of processes, including hemostasis, leukocyte trafficking, tumor metastasis, and athero-sclerosis. We have developed a new technique for the observation of binding interactions undershear, which we have termed the “blot rolling assay.” In this method, molecules in a complexmixture are resolved by gel electrophoresis and transferred to a membrane. This membrane canbe rendered semitransparent and incorporated into a parallel-plate flow chamber apparatus. Cellsor particles bearing adhesion proteins of interest are then introduced into the chamber undercontrolled flow, and their interactions with individual components of the immobilized substratescan be visualized in real time. The substrate molecules can be identified by staining with specificantibodies or by excising the relevant band(s) and performing mass spectrometry or microse-quencing of the isolated material. Thus, this method allows for the identification, within a com-plex mixture and without previous isolation or purification, of both known and novel adhesionmolecules capable of binding under shear conditions.
Key Words: Adhesion molecules; shear stress; shear conditions; flow conditions; parallel plateflow chamber; Western blot; selectins; selectin ligands; blot rolling assay; gel electrophoresis.
1. IntroductionThe adhesion of cells to blood vessel walls under shear stress is central to many
important physiological and pathological processes. Importantly, shear forces crit-ically influence the adhesion of circulating cells and platelets to vessel walls inphysiological cell migration and hemostasis, as well as in inflammatory andthrombotic disorders, cancer metastasis, and atherosclerosis. Although varioustechniques for analyzing cell adhesion have been described, most involve binding
From: Methods in Molecular Biology, vol. 341: Cell−Cell Interactions: Methods and ProtocolsEdited by: S. P. Colgan © Humana Press Inc., Totowa, NJ
assays under static conditions and thus do not assess dynamic function. Thislimitation can introduce bias and exaggerate the relative role(s) of specific adhe-sion molecules. Notably, certain adhesive receptor–ligand interactions occur pref-erentially if not exclusively under physiological shear stress (e.g., binding ofL-selectin to its ligands) or depend on low affinity and rapidly reversible interac-tions to serve their functions (e.g., rolling of leukocytes via selectins). Under staticbinding assay conditions, these types of interactions may be overtly neglected orovershadowed by molecules specialized to form more stable adhesions.
Methods for in vitro study of adhesion under shear conditions have beendescribed, including the Stamper-Woodruff (1) and the parallel plate flowchamber (2) assays. However, these methods are constrained in that theyrequire the availability of reagents (e.g., antibodies) that can specifically inter-fere with the activity of relevant receptors and/or ligands or require purifiedsubstrate materials that can be immobilized on the chamber wall. Thus, theapplicability of these methods to examine the structure or function of previ-ously uncharacterized ligands is highly limited.
To address these issues, we developed a method for direct real-time observationof adhesive interactions between cells or particles in flow and proteins separatedby sodium dodecyl sulfate polyacrylamide gel electrophoresis (SDS-PAGE) andimmobilized on membranes (3). This technique, called the “blot rolling assay,”has allowed for the identification of several new glycoprotein ligands for selectins(4,5), and this approach recently has been extended to the study of glycolipidselectin ligands (6). This method allows the real-time assessment and measure-ment of interaction parameters (e.g., rolling vs firm attachment, specificity, andreversibility with inhibitors) in both physiological and nonphysiological shear con-ditions, thus permitting a unique user interface for the observation of adhesiveevents on membrane-immobilized materials. Ligands under investigation can beimmobilized directly or segregated by gel electrophoresis (e.g., SDS-PAGE, iso-electric focusing) or other methods before transfer to the membrane. This methodalso provides for the real-time manipulation of interaction conditions, includingwall shear stress, ion requirements, temperature, the influence of metabolicinhibitors, and the presence of activating agents or inhibitors of cell function. Blot-immobilized substrates can be used repeatedly, allowing the in situ manipulationof the substrate under continuous direct visualization or direct comparison of dif-ferent conditions or different cell populations in shear flow. The capacity toobserve sequential experimental and control conditions on a single substrate andto observe physiological behaviors and responses to manipulations in real time,provides particularly powerful advantages of this method over conventional staticbinding assays. Similarly, the ability to observe interaction with individual compo-nents of a complex mixture without requiring purification or previous knowledge
218 Sackstein and Fuhlbrigge

of the nature of the components provides advantages over conventional flow basedassays. In this chapter, we describe a detailed protocol for performing blot rollingassays of membrane proteins. A video recording of a representative experiment isavailable at http://dermatology.bwh.harvard.edu/leukocyte.html.
2. Materials1. The required components for performing blot rolling assays include an inverted
microscope and a parallel plate flow chamber apparatus. Figure 1 shows the setupused in our laboratories. The parallel plate device we use has internal chamberdiameters of 2 × 0.5 × 0.025 cm. A commercial product with similar properties isavailable (Circular flow chamber, GlycoTech Corp., Rockville, MD, productno. 31-001). Flow is adjusted by negative pressure regulated by a high-precision,programmable syringe pump (Harvard Apparatus). Wall shear stress (dyne/cm2) is calculated according to the formula: wall shear stress = 6 µQ/wh2, wherew = chamber width (cm), h = chamber height (cm), and Q = volumetric flow rate(mL/s). µ = viscosity (poise, or dyne × s/cm2; for water at 25°C, µ = 0.009), whichis adjusted for contribution of 10% glycerol (see step 8), according to the equa-tion µ = 1.37 × medium (µ = 0.0123 at 25°C; see Subheading 3.4., step 8, forcalculations based on our chamber dimensions). Interaction events can be cap-tured on videotape by using a standard videomicroscopy camera and video record-ing assembly (Fig. 1), for later off-line analysis.
Blot Rolling Assay 219
Fig. 1. Diagram of blot rolling assay assembly. The components of the blot rollingassay are shown, including the inverted microscope, flow chamber, CCD camera,syringe pump, vacuum source, video monitor and blot membrane (resting on a Petridish located on the microscope stage, with the flow chamber positioned on top of it).

2. PAGE gel system.3. Sequi-Blot™ polyvinylidene difluoride (PVDF) membrane (Bio-Rad, cat. no.
162-0184).4. Fetal bovine serum.5. 0.1% Tween-20–phosphate-buffered saline (PBS) solution.6. Prestained molecular weight markers.7. Western Blue stabilized substrate for alkaline phosphate (Promega, cat. no.
S3841).8. Blot rolling medium (H/H medium): Hank’s balanced salt solution (Gibco, cat. no.
14170-112) with 10 mM HEPES, pH 7.4. Additions to H/H medium: 2 mM CaCl2,5 mM Na2 EDTA, and 10% glycerol (American BioAnalytical).
9. Monoclonal or polyclonal antibody reagents for identifying any epitope(s) ofinterest.
3. Methods3.1. Preparation of Western Blots/Visualization of Protein Bands
1. Material of interest can be prepared for PAGE (with or without SDS) using standardmethods. In general, we prepare lysates of cells at 4 × 10⁸ cell equivalents permilliliter of lysate buffer. A number of standard detergents have been used forthe preparation of lysates, although we have found 1% n-octylglucoside (RocheMolecular Biochemicals, Indianapolis, IN) to provide low nonspecific backgroundbinding. Acrylamide gradient gels (e.g., Criterion 4–20%; Bio-Rad) provideimproved resolution in higher molecular weight ranges. The amount of proteinrequired will vary with the material under study, but we have found 25 to 100 µg ofprotein per lane to be sufficient for most of our studies. Both reducing and nonre-ducing gel conditions have been utilized with good results. It is helpful to includeprestained molecular weight standards in the lanes adjacent to the material ofinterest to assist in alignment and localization of regions supporting adherence.
2. When gel electrophoresis is complete, the component proteins are transferred toPVDF membrane using standard transfer methods; although other membranematerials may work as well, we have preferred Bio-Rad Sequi-Blot™, which has0.2-µm pore size and minimal surface irregularities, thus promoting laminar flowover the membrane.
3. After transfer, the blot is placed in a blocking solution to block nonspecific inter-actions and incubated with gentle agitation (on a rocker platform or rotating plat-form) for 1 h at room temperature. It is important to place the blot in the dish withthe protein side facing up (i.e., the side of the membrane that was facing the gel).The blot is then washed in PBS–0.1% Tween-20 twice for 5 min each with gentleagitation.
4. Immunostaining, if desired, can be performed using standard procedures. Mem-branes typically are stained with primary antibody for 1 h under gentle agitation,washed twice in PBS–0.1% Tween-20 for 5 min, and then incubated with secondaryalkaline phosphatase-conjugated antibody in Tris-buffered saline for 1 h under gentleagitation. The blot is again washed twice in PBS–0.1% Tween-20 for 5 min, rinsed
220 Sackstein and Fuhlbrigge

in PBS followed by Tris-buffered saline (to remove residual PBS and Tween-20),and then developed with alkaline phosphate substrate (i.e., Western Blue™). Afterdeveloping blots to an appropriate signal-to-background perspective, reactions arestopped with PBS and the blot is washed with PBS twice. Blots to be used for flowexperiments may be stored at 4°C. They should be kept in buffer until use. Blotswill maintain binding fidelity for several days, though best results are obtained withfreshly prepared materials.
5. The membranes are again blocked by incubation in 50% newborn calf serum orfetal bovine serum in binding media for at least 1 h at 4°C and equilibrated inbinding media before use in the flow assay.
3.2. Preparation of Selectin-Expressing Cells
To assay blots for selectin ligand activity, we typically use human peripheralblood lymphocytes (PBLs) expressing L-selectin or Chinese hamster ovary(CHO) cells permanently transfected to express P-selectin or E-selectin.
1. Human PBLs can be prepared from whole blood by Ficoll density gradient sep-aration. For analysis of L-selectin function on lymphocytes, monocytes may beremoved by plastic adherence or other methods to reduce nonspecific binding(e.g., magnetic bead separation). Murine spleen and lymph node T-cells and ratthoracic duct lymphocytes also have been used in the same fashion. E-selectinand P-selectin transfected cell lines are typically split the day before use toachieve log phase growth and are harvested by replacing the media with H/H5 mM EDTA. The cells can then be released from the flask by manual agitation orscraping. We do not use trypsin to release the cells as this may alter the functionof surface adhesion molecules.
2. After counting, the cells are suspended at 10X the concentration desired for use inthe flow chamber (e.g., 10–20 × 106 cells/mL in H/H without Ca2+ or Mg2+ andwithout glycerol) and stored on ice. Clumping of adherent cell populations (i.e.,CHO cells) may develop after prolonged storage on ice. This can be remedied bywashing again in H/H 5mM EDTA before use.
3. Controls to confirm specificity for selectin binding to blots include use of mocktransfected CHO cells and/or preincubation of cell aliquots with function-blockinganti-selectin MAb.
3.3. Inverted Microscope Setup
1. Setup will vary with type of microscope. In general, we do not use any filters.2. Figure 2 shows the alignment of the parallel plate chamber onto the blot. Begin
visualization at low power to align the chamber and identify the area of interest.Many observations are best performed at relatively low magnification (e.g., ×10objective) to allow observation of larger areas and numbers of cells. Observationunder increased magnification can be performed to observe individual cell char-acteristics. Adjust the shutter arm so that the light narrows specifically over areaof interest on the blot through the chamber.
Blot Rolling Assay 221

3.4. Blot Rolling Assay
1. All media should contain 10% glycerol. Equilibration in dilute glycerol alters theopacity of the PVDF membrane sufficiently to allow transmission of light and thedirect visualization of cells interacting with the surface of the blot by standardlight microscopy. Assessment of some functions (e.g., integrin activation) requiresmaintaining the chamber and media at 37°C. This can be achieved with a stagewarming device and placement of supply media in water baths adjacent to theapparatus.
2. The chamber should be mounted onto the blot so that the flow channel aligns inparallel over the lane of interest. The flow chamber is secured by applicationof low vacuum pressure in the same fashion as is used for attachment to glass orplastic surfaces. We have not found it necessary to perform any special maneuversto maintain an adequate seal on Sequi-Blot PVDF membrane.
3. The flow field is rinsed with media introduced through the 20-mL syringe,attached to the three-way stopcock, to remove bubbles and prepare the blot surfacefor cell input.
222 Sackstein and Fuhlbrigge
Fig. 2. Blot rolling apparatus. Western blots stained for components of interest areequilibrated in binding media containing 10% glycerol and placed in a Petri dish. A par-allel plate flow chamber mounted over the area of interest is held in place by low contin-uous vacuum pressure (Vac). The inlet (In) is connected to a buffer reservoir and theoutlet (Out) to a high precision syringe pump. The apparatus is mounted on the stage ofan inverted phase-contrast microscope equipped for video microscopy. Molecularmass(es) of interacting protein(s) resolved in the polyacrylamide gel are estimated byalignment with colored mass standards in adjacent lanes. (From ref. 3 with permission.)

4. Immediately before use, aliquots of cells (e.g., PBL or transfected CHO cells) arediluted 10-fold into binding medium (H/H w/ Ca2+ with 10% glycerol; final con-centration is typically 1–2 × 10⁶ cells/mL) at room temperature (or 37°C as indi-cated). This minimizes exposure to glycerol and divalent cations, as these mayaffect cell viability and promote the formation of cell aggregates, respectively.
5. The cell input line is flushed with assay medium and placed into the tube contain-ing cells. Flow is regulated by function of a downstream syringe pump. The useof a programmable pump allows for automation of the assay technique and morereproducible results. We typically initiate flow at a high rate of flow (2 mL/min orapprox 7.5 dyne/cm2) to bring cells through the sample tubing and into the cham-ber. Upon arrival of cells in the field of view, the flow rate is reduced (typicallyto 0.5–1 dyne/cm2) to allow cells to interact with the blot surface. The flow ratecan be adjusted up or down to increase or decrease, respectively, the stringency ofbinding interactions. One can program step-wise increases in flow (shear stress)without interruption. Maintaining continuous flow while cells are in the chamberminimizes nonspecific binding to the blot surface. This is critical with adherentcell populations, such as CHO cells or monocytes, although lymphocytes typi-cally do not bind when flow is stopped for brief periods (<30 s).
6. Observation of cell interactions with substrate molecule(s) are made in real timeand recorded via the camera/video camera record for later analysis. Typically, twotypes of analyses are performed. First, a “scanning” analysis is performed bymoving the microscope stage to view the entire length of the lane in which pro-teins have been resolved while maintaining a constant shear rate. Typically, teth-ering and rolling interactions are observed at the leading edge of a “band” on theblot, with rolling in the middle and discontinuation of rolling interactions observedat the trailing edge. Once bands or areas of the blot of interest are identified, wetypically perform additional studies comparing control cell preparations (mock-transfected or cells incubated with function blocking antibodies) and varying shearconditions while viewing a fixed area of the blot. In this analysis, tethering isobserved at low physiological wall shear stresses (0.5–1.5 dyne/cm2) for shortperiods (one to several minutes). Bound cells are then subjected to timed stepwiseincreases in wall shear stress to assess shear resistance as an estimate of relativestrength of binding. The dependence of interactions on the presence of calcium(typical of selectin-mediated binding) can be confirmed by perfusion of the cham-ber with H/H with 10% glycerol and 5 mM EDTA and observing release of boundcells, or by repeating the analysis using H/H with 10% glycerol and 5 mM EDTAfor both dilution of the cells and perfusion through the chamber.
7. Antibody inhibition experiments using antibodies to the membrane-bound ligandcan be performed in situ by first observing interactions on an area of defined inter-est, then perfusing the chamber with a solution of antibody (e.g., 1–10 µg/mL for30 min) and repeating the observation on the same site. If the antibody blocks bind-ing interactions, the blot is unusable for further studies of that ligand. However, ifthe applied antibody does not block adhesive interactions, the blot may be reused,i.e., successive rounds of antibodies or reagents may be screened in this fashion.
Blot Rolling Assay 223

224 Sackstein and Fuhlbrigge
Fig. 3. Cutaneous lymphocyte antigen (CLA) immobilized on Western blots sup-ports both E-selectin- and P-selectin-mediated rolling. (A) Western blots of T-celllysates stained for CLA expression. Fifty micrograms of cell lysate protein fromCLA-positive (left panel) or CLA-negative (right panel) T-cells were subjected toSDS-PAGE, electroblotted onto PVDF membranes, and immunostained with HECA-452 MAb. The single major reactive glycoprotein identified at approx 140 kDa inCLA-positive cells (lane 2) corresponds to the monomer form of CLA/PSGL-1.

8. For selectin-mediated binding, cells must tether and roll in shear flow to beconsidered specific. Tethering in our studies is defined as reduction of forwardmotion below the hydrodynamic velocity lasting a minimum of two video frames(0.07 s), and rolling is defined as more than 5 cell diameters of lateral translationbelow the hydrodynamic velocity. The majority of tethered cells in such studies areobserved to roll smoothly across the entire field of view. Nonspecific interactions(i.e., cellular collisions with the substrate that did not lead to tethering and/orrolling) are defined as interactions lasting less than 0.07 s and are not included in theanalysis. Nonspecifically bound cells (not rolling and/or not released by perfusionwith EDTA) also are discounted from analysis. In general, there is a time-dependentincrease in nonspecific (nonrolling) attachments in the absence of flow, though veryfew cells formed firm (nonrolling) attachments to the blot in continuous shear flow.Tethering rate is calculated as the number of cells that tether per field per time (usually 30–60 s) at a defined shear stress and adjusted to per minute values. Asstated above, wall shear stress (τ) values are calculated according to the formulaτ (dynes/cm2) = 6 µQ/wh2, where µ is the viscosity of the solution in the chamber(poise), Q is the volumetric flow rate (mL/s), w is the channel width (e.g., 0.5 cmfor chamber we use), and h is the channel height (e.g., 0.025 cm for chamber weuse [7]). A value of 0.009 poise is used for the viscosity (µ) of water at 25°C (8) anda value of 0.0123 poise is used for the viscosity of 10% glycerol (v/v) in water at25°C (9). By these values, wall shear stress in 10% glycerol at 25°C is approx 1.37-fold greater than in water at the same temperature.
9. Regions (bands) of interest can be aligned against the molecular weight markersrun in adjacent lanes to estimate molecular weight. Additionally, one may subse-quently probe the blot with antibody to specific proteins of interest to determinewhether band(s) supporting binding represent known proteins. One can exciseregions of blot supporting binding and send sample for mass spectrometry and/orprotein micro sequencing. This approach was used to identify HCELL, a glycoform
Blot Rolling Assay 225
Fig. 3. (continued) Similar blots stained with anti-PSGL-1 mAb show approx equalquantities of 140-kDa PSGL-1 protein in each sample (data not shown). (B,C) Rollingcells per visual field (×10 objective) at 1.75 dyne/cm2 wall shear stress. The number ofcells observed to bind and roll was observed in overlapping fields of view extendingfrom approx 250 kDa to 40 kDa (identified alongside blot images in A). Both CHO-Eand CHO-P cells are observed to tether and roll across the area of the Western blot cor-responding to CLA/PSGl-1 from CLA-positive T-cells (B), whereas only CHO-P cellsare noted to form significant rolling adhesions on PSGL-1 from CLA-negative T-cells(C). Both CHO-E and CHO-P cells were noted to tether primarily over the area corre-sponding to CLA/PSGL-1. Mock-transfected CHO cells did not form rolling tethers onany areas of the blots observed (data not shown). Results presented are the means oftwo independent experiments on a single substrate and are representative of observa-tions on numerous blots of CLA-positive and CLA-negative T-cell. (From ref. 3 withpermission.)

of CD44 that functions as a high affinity L-selectin and E-selectin ligand (4–6). Wehave also used this method to examine human T-lymphocyte glycoprotein(s) thatsupport E-selectin and P-selectin binding under shear flow (3). Figure 3 is a rep-resentative histogram of a blot rolling assay of T-cell lysates probed with stablytransfected CHO cells expressing P-selectin (CHO-P) and E-selectin (CHO-E).A videotape of these studies is available for viewing on the Harvard Skin DiseaseResearch Center web page, under the Leukocyte Migration Core subheading(http://dermatology.bwh.harvard.edu/leukocyte.html).
AcknowledgmentsThis work was supported by National Institutes of Health grants HL60528
(RS), CA84156 (RS), and AR02115 (RCF). The authors thank Drs. SandraL. King and Monica M. Burdick for critical review of the manuscript.
References1. Stamper, H. B. and Woodruff, J. J. (1976) Lymphocyte homing into lymph nodes:
in vitro demonstration of the selective affinity of recirculating lymphocytes forhigh-endothelial venules. J. Exp. Med. 144, 828–833.
2. Lawrence, M. B. and Springer, T. A. (1991) Leukocytes roll on P-selectin at physi-ologic flow rates: distinction from and prerequisite for adhesion through integrins.Cell 65, 859–873.
3. Fuhlbrigge, R. C., King S. L., Dimitroff, C .J., and Sackstein, R. (2002) Direct,real-time observation of E- and P-selectin mediated rolling on cutaneous lympho-cyte-associated antigen immobilized on Western blots. J. Immunol. 168, 5645–5651.
4. Dimitroff, C. J., Lee, J. Y., Fuhlbrigge, R. C., and Sackstein, R. (2000) A distinctglycoform of CD44 is an L-selectin ligand on human hematopoietic cells. Proc.Natl. Acad. Sci. USA 97, 13,841–13,846.
5. Dimitroff, C. J., Lee, J. Y., Rafii, S., Fuhlbrigge, R. C., and Sackstein, R. (2001)CD44 is a major E-selectin ligand on human hematopoietic progenitor cells. J. CellBiol. 153, 1277–1286.
6. Hanley, W. D., Burdick, M. M., Konstantopoulos, K., and Sackstein, R. (2005)CD44 on LS174T colon carcinoma cells possesses E-selectin ligand activity.Cancer Res. 65, 5812–5817.
7. Glasby, M. A. (1995) Principles of haemodynamics, in Applied Physiology forSurgery and Critical Care (M. A. Glasby and C. L.-H. Huang, eds.), Oxford,Boston, MA, p. 131.
8. Sengers, J. V. and Watson, J. T. R. (1986) Improved international formulations forthe viscosity and thermal conductivity of water substance. J. Phys. Chem. Ref.Data 15, 1291–1314.
9. Borchers, H. (ed.) Material values and mechanical behaviour of non-metals (1995)Landolt-Bornstein Numerical Data and Functional Relationships in Physics,Chemistry, Astronomy, Geophysics, and Technology, Vol. 4 (Part 1).
226 Sackstein and Fuhlbrigge
227
19
Cell–Cell Interaction in the Transcellular Biosynthesis of Novel ω -3-Derived Lipid Mediators
Nan Chiang and Charles N. Serhan
SummaryOmega-3 polyunsaturated fatty acids (PUFAs) such as eicosapentaenoic acid (EPA) and docosa-
hexaenoic acid (DHA) display beneficial actions in human diseases. The molecular basis for theseactions remains of interest. We recently identified novel mediators generated from ω-3 PUFAduring cell–cell interactions that displayed potent anti-inflammatory and proresolving actions.Compounds derived from EPA are designated resolvins of the E series (RvE1), and thosebiosynthesized from DHA are denoted resolvins of the D series (RvD) and docosatriene, such asprotectin D1 (PD1), which belongs to the family of protectins. In addition, treatment using aspirininitiates a related epimeric series by triggering endogenous formation of the 17R-RvD series,denoted as aspirin-triggered (AT)-RvDs. These compounds possess potent anti-inflammatory actionsin vivo that essentially are equivalent to their counterpart generated without aspirin, namely the17S-RvDs. In this chapter, we provide an overview and detail protocols of the biosynthesis andbioactions of these newly uncovered pathways and products that include three distinct series: 18R-resolvins of the E series derived from EPA (i.e., RvE1); 17R-resolvins of the D series from DHA(AT-RvD1 through RvD4); and 17S-resolvins of the D series from DHA (RvD1 through RvD4).
Key Words: Resolvin; aspirin; neuroprotectin; resolution; ω-3; lipid mediator; inflammation.
1. IntroductionInflammation has emerged as playing a central role in many prevalent dis-
eases, including Alzheimer’s disease, cardiovascular disease (1), and cancer (2,3)in addition to those chronic disorders that are well known to be associated withinflammation, such as arthritis and periodontal disease (4,5). In parallel, the bene-ficial impact of essential ω-3 fatty acids was uncovered as early as 1929 (6) andwas consistently observed in many human diseases for the next several decades(7–10). Recently, we identified novel oxygenated products generated from theprecursors eicosapentaenoic acid (EPA) and docosahexaenoic acid (DHA) that
From: Methods in Molecular Biology, vol. 341: Cell−Cell Interactions: Methods and ProtocolsEdited by: S. P. Colgan © Humana Press Inc., Totowa, NJ

possess potent biological activities within resolving inflammatory exudates(11–13). Hence, the terms Resolvin (Rv; resolution phase interaction products)and docosatrienes were introduced because the new compounds displayed bothpotent anti-inflammatory and immunoregulatory properties.
These compounds include Rvs of the E series (RvE1) derived from EPA thatcarry potent biological actions and Rvs of the D series (RvD) from DHA, aswell as bioactive members from these biosynthesis pathways carrying conjugatedtriene structures denoted as docosatrienes (DTs). DTs recently were termedprotectin D1 (PD1) because they are both anti-inflammatory (12,13) and neuro-protective (14,15). Unlike other products identified earlier from ω-3 fatty acidsthat are similar in structure to eicosanoids but less potent or devoid of bioac-tions, these Rvs, DTs, and neuroprotectins evoke potent biological actions invitro and in vivo (11–15). In this chapter, we focus on the novel compoundsderived from cell–cell interactions (i.e., RvE1, RvDs, and aspirin-triggered [AT]-RvDs) and provide detailed protocols for their biosynthesis as well as bioassays.
1.1. Novel Lipid Mediators Identified During Resolution of AcuteInflammation: Arachidonic Acid vs EPA and DHA
We now appreciate that intimate cell–cell interactions within vessel walls, thatis, adherent platelets that are studied with polymorphonuclear leukocytes (PMNs),converge on the endothelium and can be visualized by intravital microscopy(16,17) and promote transcellular lipid mediator biosynthesis (18–20). Duringplatelet–leukocyte interactions, arachidonic acid is converted to lipoxins (LX),which are generated to “stop” PMN and stimulate monocytes (21) andmacrophages to promote resolution (22). These forms of cell–cell interactions inthe vasculature are impinged on by aspirin (23,24). Aspirin inhibits thromboxaneproduction by platelets and prostacyclin biosynthesis in vascular endothelial cells(25,26). During PMN–endothelial and/or PMN–epithelial interactions, aspirintriggers the biosynthesis of 15-epi-lipoxins (aspirin-triggered lipoxin [ATL];Fig. 1; [23]). Both LX and ATL and their respective stable analogs are potent reg-ulators of transendothelial–transepithelial migration of PMN across these cellsand endothelial cell proliferation in vitro and in vivo (27–29).
LX and ATL act in the nanomolar range via specific receptors we identified(30,31) and confirmed by others (32,33), namely LXA4 receptor. Transgenicmice overexpressing the LXA4 receptor with myeloid-specific promoter displayreduced PMN infiltration in peritonitis and heightened sensitivity to LXA4 andATL (34). Transgenic rabbits overexpressing 15-lipoxygenase (LOX) type Igenerate enhanced levels of LXA4, have an enhanced anti-inflammatory status,and are protected from the inflammatory bone loss of periodontal disease (35).Hence, the results of these studies have heightened our awareness that PMN,in addition to their host defense position and the possibility that they can spill
228 Chiang and Serhan

pro-inflammatory agents (36) and mediators such as the classic eicosanoids,prostanoids, and leukotrienes (37,38), which amplify inflammatory responses,also can produce novel protective lipid mediators that actively counter-regulatethe inflammation (Fig. 1).
It often is questioned whether essential fatty acids, such as the ω-3 EPA orDHA, are converted to potent lipid mediators, as is the case with arachidonicacid. In short, both DHA and EPA are important precursors. In view of thecompelling results from the GISSI study, which showed improvements in morethan 11,000 cardiovascular patients (39,40), namely, reduction in sudden deathby approx 45% by taking almost 1 g of ω-3 per day, we recently addressed apotential role of ω-3 polyunsaturated fatty acids (PUFAs). The inspection oftheir methods indicated that all the patients also took daily aspirin, which wasunaccounted for in the authors’ analysis. Despite very large doses (milligramsto grams daily), most literature regarding ω-3 PUFAs suggests beneficialactions in many human diseases, including periodontal (41), anti-inflammatory,and antitumor actions (7,42).
The three major lipoxygenase activities (5-LOX, 12-LOX, 15-LOX) can eachconvert DHA to various monohydroxy-containing products; however, at thetime their in vivo functions were either not apparent or they did not displaybioactivity (43,44). Also, DHA can be nonenzymatically oxygenated toisoprostane-like compounds termed neuroprostanes that reflect oxidative stressin the brain (45) or autooxidized to products that are monohydroxy racemates(46) of the compounds that are now known to be enzymatically produced duringbiosynthesis of the Rvs and DT (12–15). Overall, it is noteworthy that themolecular basis and mechanisms underlying ω-3 PUFA’s immunoprotective
Novel Mediators Generated From ω-3 PUFA 229
Fig. 1. Essential polyunsaturated fatty acids are precursors to bioactive lipid mediators.

actions remained to be established and appreciated, and their direct connectionto human disease and treatment are still important biomedical challenges (47).
1.2. Aspirin Unveils New Directions: AT Lipid Mediators
Aspirin is an active ingredient in more than 60 over-the-counter remedies,making it a difficult substance to control for in some human studies. What is themolecular basis for the protective action of ω-3, and is there overlap(s) in itsactions? To address this in an experimental setting, we used murine dorsal skinpouches (11,12). This model of inflammation is known to spontaneously resolvein rats (48). We adapted this for mice to include both genetics and to set uplipidomics, using liquid chromatography-ultraviolet-tandem mass spectrometry(LC-UV-MS-MS)-based analyses geared to evaluating whether potentialnovel lipid mediators are indeed generated during the resolution phase of inflam-mation (11,12). In this pouch (experimental contained inflammation) after 4 h,PMN numbers begin to decrease within exudates (11,12). Exudates were takenat timed intervals, focusing on the period of “spontaneous resolution,” and lipidmediator profiles were determined using tandem LC-UV-MS-MS. We con-structed lipid mediator libraries with physical properties (i.e., MS and MS/MSspectra, elution times, ultraviolet spectra, and so on) for matching and to assesswhether known and/or potential novel lipid mediators were present withinthe exudates, and are presently expanding these libraries and the software fortheir matching (49). If novel lipid mediators were encountered, their structureswere elucidated by conducting retrograde analysis for both biogenic enzymaticsynthesis and total organic synthesis. This approach permitted assessment ofstructure–activity relationships as well as the scale-up required to confirm thebioactions of novel compounds identified (11,12).
1.3. Anti-Inflammatory and Proresolving Properties
The main bioactive resolvins and docosatrienes as representative members areshown in Figs. 2–4. The bioactions of Rv and DT are listed in Table 1. Directcomparisons of Resolvin E vs the D series (17R and 17S epimer series) for theirability to regulate PMN in vivo were conducted (12,13,35). Both the D and Eclasses of Rvs are potent regulators of PMN infiltration. 17R-RvD series, trig-gered by aspirin, and 17S-RvD series give essentially similar results, indicatingthat the S to R switch does not diminish their bioactions. When injected intra-venously at 100 ng/mouse, they both gave approx 50% inhibition, and the RvE1gave approx 75 to 80% inhibition. In comparison, indomethacin at 100 ng/mouse(or ∼3 µg/kg) gave roughly 25% inhibition (see refs. 12 and 13). In addition,with microglial cells that liberate cytokines in the brain, the Rv D series blocktumor necrosis factor (TNF)-α-induced interleukin (IL)-1β transcripts and arepotent regulators of PMN infiltration in brain, skin, and peritonitis in vivo (13,14).
230 Chiang and Serhan
(text continued on p. 237)

231

Fig. 2. EPA conversion to RvE1. Biosynthesis of AT 18R-RvE-series. Human endothelial cells expressing COX-2 treated with aspirintransform EPA by abstracting hydrogen at C16 to give R insertion of molecular oxygen to yield 18R-hydroperoxy-EPE, which is reducedto 18R-HEPE. They are further converted via sequential actions of leukocyte 5-LO and lead to formation of RvE1 (12,50). MS-MS analy-sis of RvE1:murine inflammatory exudate. Selected ion monitoring at m/z 349.5 [M-H]. Structure depicted in the inset giving diagnosticions at m/z 305, 233, 195, and 291. Inhibition of PMN transendothelial migration. PMN were incubated with isolated compounds [10−11
to 10–6 M] 17R-HDHA, ; RvE1, ; or ATL analog used for reference, ; transmigration was initiated using an optimal amount of LTB4
[10 nM] (100%) and HUVEC coincubations (90 min, 37°C). Results are the mean ± SEM; n = 3.

233

Fig. 3. DHA conversion to AT 17R-RvD-series. Biosynthesis of AT 17R-RvD-series. The 17R series Rvs are produced from DHA in the presence ofaspirin. Human endothelial cells expressing COX-2 treated with aspirin transform DHA to 17R-HDHA. Human PMNs convert 17R-HDHA to two compoundsvia 5-lipoxygenation (5LO [11,12]) that are each rapidly transformed into two epoxide intermediates: a 7(8)-epoxide (left) and the other a 4(5)-epoxide. Thesetwo novel epoxide intermediates open to bioactive products denoted 17R series AT-RvD1 through AT-RvD4. Note: stereochemistry depicted in likely con-figuration based on results with recombinant enzymes (see refs. 12 and 13). MS-MS of (AT) 17R-RvD1. Selected ion monitoring at m/z 375 [M-H]. Struc-ture depicted in the inset giving diagnostic ions at m/z 357 [M-H-H2O], 339 [M-H-2H2O], 331 [M-H-CO2], 313 [M-H-CO2-H2O], 306, 303, 276, 273, 255[273-H2O], 210, 195, and 180. Inhibition of IL-1β in human glioma cells. DBTRG-05MG cells (1 × 10⁶/mL) were stimulated with 50 ng/mL of humanrecombinant TNF-α for 16 hours to induce expression of IL-1β transcripts. Concentration dependence with COX-2 products: 17-HDHA (), 13-HDHA (),and di-/tri-HDHA (). Results are representative of reverse transcription polymerase chain reaction gels of MG cells exposed to 100 nM of 13-HDHA or17-HDHA and graphed after normalization of the IL-1β transcripts using GAPDH.

235
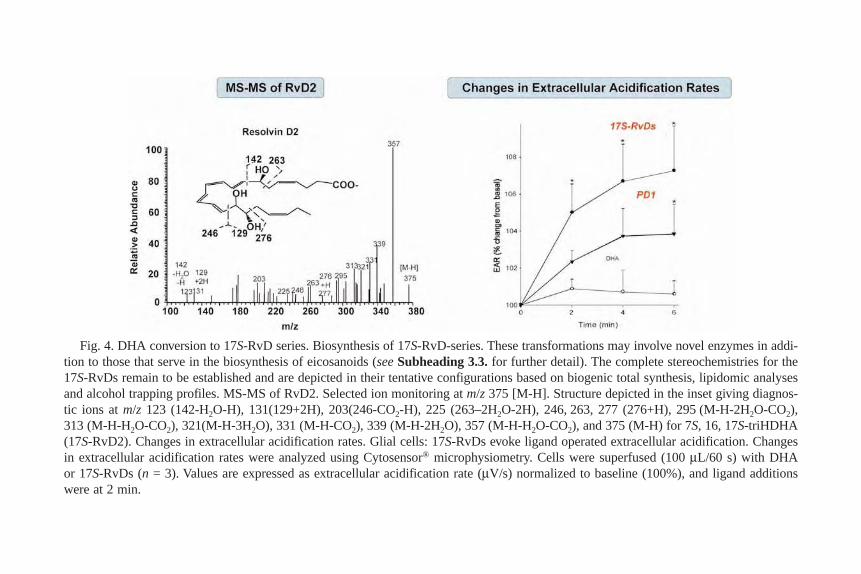
Fig. 4. DHA conversion to 17S-RvD series. Biosynthesis of 17S-RvD-series. These transformations may involve novel enzymes in addi-tion to those that serve in the biosynthesis of eicosanoids (see Subheading 3.3. for further detail). The complete stereochemistries for the17S-RvDs remain to be established and are depicted in their tentative configurations based on biogenic total synthesis, lipidomic analysesand alcohol trapping profiles. MS-MS of RvD2. Selected ion monitoring at m/z 375 [M-H]. Structure depicted in the inset giving diagnos-tic ions at m/z 123 (142-H2O-H), 131(129+2H), 203(246-CO2-H), 225 (263–2H2O-2H), 246, 263, 277 (276+H), 295 (M-H-2H2O-CO2),313 (M-H-H2O-CO2), 321(M-H-3H2O), 331 (M-H-CO2), 339 (M-H-2H2O), 357 (M-H-H2O-CO2), and 375 (M-H) for 7S, 16, 17S-triHDHA(17S-RvD2). Changes in extracellular acidification rates. Glial cells: 17S-RvDs evoke ligand operated extracellular acidification. Changesin extracellular acidification rates were analyzed using Cytosensor® microphysiometry. Cells were superfused (100 µL/60 s) with DHAor 17S-RvDs (n = 3). Values are expressed as extracellular acidification rate (µV/s) normalized to baseline (100%), and ligand additionswere at 2 min.

Novel Mediators Generated From ω-3 PUFA 237
2. Materials2.1. Cell Culture
Human glioma cells (DBTRG-05MG cells) and Sf 9 (Spodoptera frugiperda)insect cells are from American Type Culture Collection (ATCC; Rockville, MD).Cell culture media and reagents are from Cambrex Biosciences (Walkersville,MD).
2.2. Biosynthesis
1. Aspirin and A23187 were from Sigma (St. Louis, MO). EPA was from CaymanChemical Co. (Ann Arbor, MI) and other synthetic standards, hydroxy fatty acids,and intermediates used for identification were purchased from Cascade BiochemLtd. (Reading, UK).
2. 17R/S-hydroxy-DHA (HDHA) from Penn Bio-Organics (Bellefonte, PA).3. IL-1β is from PeproTech (Rocky Hill, NJ).4. Extract-clean C18 cartridges were purchased from Alltech Associates (Deerfield, IL).
2.3. In Vitro Bioassays
1. Recombinant murine and human TNF-α from R&D Systems (Minneapolis, MN).
Table 1Biosynthesis and Biological Activity of Resolvins
Compound Biosynthesis Biological activity
RvE1 Murine exudates (11) Inhibit PMN transmigrationHuman blood (50) Inhibit PMN infiltration
(air pouch and peritonitis)Coincubations of human Inhibit IL-12 production in
endothelial cells and PMN (11) dendritic cellsAT-RvDs Murine inflammatory Inhibit PMN infiltration
exudates (12) (air pouch and peritonitis)Murine brain stroke (14) Inhibit TNF-α-induced IL-1β
in human glioma cellsInhibit PMN transmigration
RvD2-4 Human whole blood (13) Inhibit PMN infiltration (air pouch and peritonitis)
Murine exudates Inhibit TNF-α-induced IL-1βin human glioma cells
Changes in extracellular acidification rate
PMN, polymorphonuclear leukocyte; IL, interleukin; TNF, tumor necrosis factor; AT, aspirin-triggered 17R-containing series.

2. Trizol reagent is from GIBCO BRL Life Technologies (Grand Island, NY).3. Cytosensor® microphysiometer is from Molecular Devices (Sunnyvale, CA).
2.4. Murine Models of Acute Inflammation
1. Male mice of FVB strain (6 to 8 wk) were from Charles River (Wilmington, MA).2. Zymosan A was from Sigma (St. Louis, MO).
3. Methods3.1. 18R-Resolvin E Series
Resolving exudates in mice contain 18R-hydroxy-eicosapentaenoic acid(HEPE) as well as several related bioactive compounds (11). These novelcompounds are produced from EPA by at least one biosynthetic pathway operativein human cells. This pathway is shown in Fig. 2; blood vessel-derived vascularendothelial cells treated with aspirin convert EPA to 18R-hydro (peroxy)-EPE thatis reduced to 18R-HEPE. 18R-HEPE is then released from endothelium andrapidly converted by activated human PMN in the proximity to a 5(6) epoxide-containing intermediate that is further transformed to the bioactive 5,12,18R-tri-HEPE, termed RvE1.
Organic synthesis was achieved and its complete stereochemical assign-ment was recently established as 5S,12R,18R-trihydroxy-6Z,8E,10E,14Z,16E-eicosapentaenoic acid (50). RvE1 was identified in the resolution phase in miceand appeared as a transcellular biosynthetic product during cell–cell interactionwith isolated human cells. More importantly, it proved to be a potent regulatorof PMN transendothelial migration and infiltration in vivo. Recent results indi-cate that ChemR23 is a specific receptor for RvE1 (50).
3.1.1. Biosynthesis In Vitro and In Vivo3.1.1.1. HUMAN ENDOTHELIAL CELL INCUBATION WITH PMN
1. Human endothelial cells are incubated with IL-1β (1 ng/mL, 24 h; see Note 1) toinduce COX-2 (see Note 2).
2. Cells are then washed in Hank’s balanced salt solution and treated with ASA(500 µM; see Note 3) for 20 min at 37°C, followed by EPA (20 µM).
3. Incubations are terminated with two volumes of ice-cold methanol and thenextracted (see Note 4) for LC/MS/MS analysis (see Note 5) and further incubation.
4. Selected ion monitoring (i.e., at m/z 317 and 259) revealed that human umbilicalvein endothelial cells (HUVECs) treated with ASA converted EPA to 18R-HEPE.Also, human microvascular endothelial cells (HMVECs) treated with ASA andEPA generated 18-HEPE (10.6 ng/106 cells).
5. Human PMNs (30 × 106 cells/mL; see Note 6) are then incubated (30 min, 37°C)with serum-treated zymosan A (100 ng/mL) and ASA-acetylated-COX-2-derivedproducts from EPA (from step 3).
238 Chiang and Serhan

6. Incubations are terminated with two volumes of ice-cold methanol and thenextracted for LC/MS/MS analysis.
7. Selected ion monitoring at [M-H] = m/z 349.5 revealed that PMN converted 18R-HEPE to RvE1 (see Fig. 2).
3.1.1.2. FORMATION OF RVE1 IN INFLAMMATORY EXUDATES
1. Murine dorsal air pouches are raised on day 0 (see Note 7).2. On day 6, inflammation is initiated by intrapouch injection of recombinant mouse
TNF-α (100 ng/pouch).3. ASA (500 µg) is injected at 3.5 h followed by injection of 300 µg of EPA (see
Note 8) per pouch at 4 h.4. At 6 h, pouches are lavaged twice with 3 mL of phosphate-buffered saline (PBS)
and the exudate cells enumerated.5. Exudate cells are then activated by calcium ionophore A23187 (4 µM) at 37°C for
20 min.6. The supernatants are collected and extracted for LC-MS-MS analysis.
3.1.2. Biological Activity In Vitro
3.1.2.1. PMN TRANSENDOTHELIAL MIGRATION
1. HUVECs were used at passages 1 and 2 and isolated by collagenase digestion(0.1% collagenase) and propagated on gelatin-coated (1%) tissue culture plates inRPMI 1640 cell culture medium supplemented with 15% bovine calf serum, 15%NU-serum, 50 µg/mL endothelial mitogen, 8 units/mL heparin, 50 units/mL peni-cillin, and 50 µg/mL streptomycin.
2. Human PMN are exposed to RvE1 (10−11 to 10−6 M at 37°C for 15 min), washedtwice with Dulbecco’s phosphate-buffered saline (DPBS), and coincubated withconfluent endothelial monolayers grown on 96-well plates (4 × 10⁵ cells in0.2 mL of DPBS supplemented with 1% BCS) in the presence of agonist LTB4(10−7 M, 30 min).
3. After incubation, the medium is aspirated and monolayers washed gently with1 mL of DPBS to remove adherent cells.
4. The contents of each well are solubilized with 0.1% sodium dodecyl sulfate/0.025 MNaOH.
5. Fluorescence is assessed in a Cytofluor 2300 fluorescence plate reader, and thenumber of adherent PMN is calculated from the fluorescence of the original PMNsuspension.
3.1.3. Bioactions In Vivo
3.1.3.1. MURINE DORSAL AIR POUCH: INHIBITION OF PMN INFILTRATION
1. Murine dorsal air pouches are raised on day 0 with male FVB mice.2. On day 6, mice are anesthetized with isoflurane. Compounds (RvE1 or RvE2,
100 ng; see Note 8 for handling Rvs) or vehicle (0.1% ethanol; see Note 9) weredelivered as a bolus injection either into the tail vein in 100 µL of sterile saline orlocally into pouches in 200 µL of sterile saline.
Novel Mediators Generated From ω-3 PUFA 239

3. TNF-α (100 ng/pouch) is then injected locally into pouches to stimulate PMNinfiltration.
4. Inflammatory pouch exudates are collected at 4 h and cells enumerated.
3.1.3.2. MURINE PERITONITIS (SEE NOTE 10)
1. Male FVB mice (6–8 wk) are anesthetized with isoflurane.2. RvE1 (300 ng) or vehicle (0.1% ethanol) alone is administered intraperitoneally in
200 µL of sterile saline.3. Zymosan A (1 mg in 1 mL of normal saline) is then administrated intraperitoneally
5 min later.4. Mice are euthanized with an overdose of isoflurane 2 h later and peritoneal exudates
collected by lavaging with 5 mL of sterile saline.5. Exudate cells are collected and enumerated.
3.2. 17R-Series RvDs
In resolving exudates from mice given aspirin and DHA, we found novel17R-HDHA and several related bioactive compounds (Fig. 3). HMECs, alsoaspirin-treated in hypoxia, generate 17R-HDHA. DHA is converted by humanrecombinant COX-2, which was surprising, because earlier literature indicatedthat DHA is not a substrate of cyclooxygenase (51,52). However, theseinvestigations were before knowledge of the COX-2 isoform and used organsrich in COX-1. Human recombinant COX-2 converts DHA to 13-HDHA. Withaspirin, this switches to 17R-oxygenation to give epimeric AT forms, also inbrain (12,13), of Rvs (AT-RvD1 through RvD4; see Fig. 3).
3.2.1. Biosynthesis
3.2.1.1. INCUBATION OF DHA AND ASA WITH ENDOTHELIAL CELLS
1. HUVECs or HMVECs are cultured for transendothelial migration.2. HUVEC or HMVEC monolayers (1, 2, or 3 passages) are seeded (∼2 ×10⁵ cells/cm2)
on polycarbonate permeable supports precoated with 0.1% gelatin.3. For hypoxia experiments, plates of HUVEC are treated with TNF-α and IL-1β
(both 1 ng/mL), placed in a hypoxic chamber (3 h, 37°C) and returned to nor-moxia (21 h, 37°C).
4. ASA (500 µM, 30 min) was added followed by DHA (∼5 µM) and calciumionophore A23187 (2 µM; 60 min, 37°C).
5. Incubations are terminated and extracted for LC-MS-MS analyses. Selected ionmonitoring at [M-H] = m/z 343 revealed that endothelial cells treated with ASAconverted DHA to 17R-HDHA (see Fig. 3).
3.2.1.2. INCUBATION OF DHA AND ASA WITH RECOMBINANT COX-2
1. Human recombinant COX-2 is overexpressed in Sf 9 insect cells.2. The microsomal fractions (∼8 µL) are suspended in 100 mM Tris-HCl, pH 8.0.
240 Chiang and Serhan

3. ASA is incubated (∼2 mM, 37°C, 30 min) with COX-2 before addition of DHA(10 µM).
4. Incubations are terminated and extracted with deuterium-labeled internal stan-dards for LC-MS-MS analysis (see Note 11).
5. Selected ion monitoring at [M-H] = m/z 343 revealed that recombinant COX-2treated with ASA converts DHA to 17R-HDHA (see Fig. 3).
3.2.1.3. INCUBATION OF 17-HDHA WITH HUMAN PMNS
1. Human PMNs are freshly isolated from venous blood of healthy volunteers (whodeclined taking medication for approx 2 wk before donation; BWH protocolno. 88-02642) by Ficoll gradient and enumerated.
2. Cells are divided into 50 × 106 cells/1 mL DPBS with Ca2+ and Mg2+ (DPBS+/+),and incubations (40 min, 37°C) performed with either 17R/S-HDHA or 17R-HDHAwith zymosan A (100 ng/mL).
3. Incubations are terminated and extracted with deuterium-labeled internal stan-dards (15-HETE and C204) for LC-MS-MS analysis.
4. Selected ion monitoring at [M-H] = m/z 359 and 375 revealed that human PMNconverts 17R-HDHA to di- and tri-HDHA (AT-RvDs), respectively (see Fig. 3).
3.2.1.4. INCUBATION WITH MURINE WHOLE BRAIN
1. Mouse whole brains are rapidly isolated from sacrificed mice immediately beforeincubations.
2. Mouse brains are washed with cold DPBS+/+ and incubated with ASA (45 min,37°C, 500 µM).
3. Incubations are terminated with 5 mL of cold methanol; brain is homogenizedand extracted for LC-MS-MS analyses.
3.2.1.5. FORMATION OF 17R-CONTAINING ASPIRIN-TRIGGERED RVDS
IN INFLAMMATORY EXUDATES
1. Inflammatory exudates are initiated with intrapouch injection of recombinantmouse TNF-α into dorsal air pouches of 6- to 8-wk-old male FVB mice.
2. ASA (500 µg) is injected locally at 3.5 h followed by injection of 300 µgDHA/pouch at 4 h after the injection of TNF-α.
3. At 6 h (within the resolution phase), pouches were lavaged (using 3 mL of saline)and exudate cells were enumerated.
4. Cell-free supernatants are collected and extracted for LC-MS-MS analyses.
3.2.2. Biological Activity In Vitro
3.2.2.1. REGULATION OF IL-1β IN HUMAN GLIOMA CELLS
1. Human glioma cells (DBTRG-05MG cells) are cultured as recommended by ATCC.2. 1 × 10⁶ cells per well in six-well plates are stimulated for 16 h with 50 ng/mL of
human recombinant TNF-α in the presence of test compounds (i.e., 17R-HDHAand di-/tri-HDHA, 10−12 to 10−7 M) or vehicle (0.04% ethanol).
Novel Mediators Generated From ω-3 PUFA 241

3. Cells are washed in DPBS+/+ and harvested in 1 mL of Trizol reagent.4. RNA is purified and reverse transcription polymerase chain reaction is performed.
Primers used in amplifications are: 5′-GGAAGATGCTGGTTCCCTGC-3′ and 5′-CAACACGCAGGACAGGTACA-3′ for IL-1β; 5′-TCCACCACCGTGTTGCTGTAG-3′ and 5′-GACCACAGTCCATGACA TCACT-3′ for glyceraldehydephosphate dehydrogenase (GAPDH).
5. PCR products obtained with these primers are confirmed by sequencing. Analysesare performed for both genes (i.e., GAPDH and IL-1β) in the linear range of thereaction. Results were analyzed using the NIH Image program (http://rsb.info.nih.gov/nih-image).
3.2.2.2. PMN TRANSMIGRATION
Protocols in this subheading are essentially identical to Subheading 3.1.2.1.
3.2.3. Bioactions In Vivo
3.2.3.1. MURINE DORSAL AIR POUCH AND PERITONITIS
Protocols in this subheading are essentially identical to Subheadings 3.1.3.1.and 3.1.3.2.
3.3. 17S-Series RvDs
DHA (C22: 6) is highly enriched in brain, synapses, and retina and is a majorω-3 fatty acid. Deficiencies in this essential fatty acid are reportedly associatedwith neuronal function, cancer, and inflammation. Using new lipidomic analysesusing tandem LC-PDA-MS-MS, a novel series of endogenous mediators wasidentified in blood, leukocytes, brain, and glial cells as 17S hydroxy-containingdocosanoids, which were denoted protectins (PD) that also contain docosatrienes(the main bioactive member of the series was 10,17S-docosatriene; the completestereochemistry was recently established [see ref. 53]) and 17S series resolvins.These novel mediators were biosynthesized via epoxide-containing intermedi-ates and proved potent (pico- to nanomolar range) regulators of both leukocytes,reducing infiltration in vivo, and glial cells, blocking their cytokine production.These results indicate that DHA is precursor to potent protective mediators gen-erated via enzymatic oxygenations to novel docosatrienes and 17S series resolvinsthat each regulates events of interest in inflammation and resolution.
3.3.1. Biosynthesis
3.3.1.1. INCUBATION OF DHA WITH HUMAN WHOLE BLOOD
1. Human whole (venous) blood is collected from healthy volunteers (whodeclined taking medication for approx 2 wk before donation; BWH protocolno. 88-02642).
242 Chiang and Serhan

2. After collection, whole blood was immediately incubated with DHA (10 µg) in acovered water bath for 40 min (37°C).
3. Incubations are terminated and extracted for lipidomic and lipid mediator profileanalyses by LC-MS-MS.
4. Selected ion monitoring at [M-H] = m/z 343, 359 and 375 revealed that humanwhole blood converts DHA to mono-, di-and tri-HDHA, respectively (see Fig. 4).
3.3.1.2. INCUBATION OF DHA WITH HUMAN PMN
1. Human PMN are freshly isolated from the whole blood by Ficoll gradient.PMN (30–50 × 106 cells/mL) are exposed to zymosan A (100 µg/mL) followed byaddition of either 17S-HDHA (3 µg/mL) or DHA (3 µg/mL).
2. Cell suspensions are incubated for 40 min at 37°C in a covered water bath.3. Incubations are terminated and lipidomic analyses carried out by LC-MS-MS.4. Selected ion monitoring at m/z 359 and 375 revealed that human whole blood
converts 17S-HDHA to di- and tri-HDHA (see Fig. 4).
3.3.2. Biological Activity In Vitro
3.3.2.1. CYTOSENSOR ANALYSES
1. Changes in extracellular acidification rate are evaluated using a Cytosensor®
microphysiometer and computer workstation.2. Glial cells are equilibrated for 30 min in Dulbecco’s Modified Eagle’s Medium.3. Extracellular acidification rates are determined by 30-s potentiometric rate mea-
surements (µV/s; pump off cycle) after an 80-s pump cycle with a 10-s delay(120 s total cycle time).
4. Cells are perfused (100 µL/60 s) with agonist (DHA or 17S RvD series compounds,100 nM) or vehicle (0.1% vol/vol ethanol) alone before the first rate measurements.
5. Perfusion duration depends on the ligand being evaluated and ranged from 5 to15 min. Acidification rates (µV/s) are normalized to basal rates (100%) threecycles before agonist addition.
3.3.2.2. TNF-α-INDUCED IL-1βProtocols in the subheading are identical to Subheading 3.2.2.1.
3.3.3. Bioactions In Vivo
3.3.3.1. ACUTE INFLAMMATION: MURINE DORSAL AIR POUCH AND PERITONITIS
Protocols in the subheading are identical to Subheadings 3.1.3.1. and3.1.3.2. (see Fig. 5 for the bioaction of 17S- and 17R-series RvDs).
3.4. Summary
Rvs are comprised of five separate chemical series of lipid-derived mediators,each with unique structures and apparent complementary anti-inflammatoryproperties and actions. Rvs are also generated in their respective epimeric forms
Novel Mediators Generated From ω-3 PUFA 243

when aspirin is given in mammalian systems (11,12). The Rvs each dampeninflammation and PMN-mediated injury from within, key culprits in manyhuman diseases. The results of these initial studies underscore a role in resolu-tion as well as catabasis and give a possible therapeutic potential for this newarena of immunomodulation and host protection. Hence it is likely that the Rvand their AT-related forms may play roles in other tissues and organs involvedin physiological and pathological processes as host-protective mediators. In viewof the important roles of DHA and EPA in human biology and medicine uncov-ered to date (7–11), the physiological relevance of the Rvs is likely to extendwell beyond our current appreciation (11–15).
244 Chiang and Serhan
Fig. 5. Anti-inflammatory properties of 17R- and 17S-containing RvD series. Murineperitonitis and dorsal skin pouch after systemic and topical application. Peritonitis: RvDs(100 ng) or indomethacin (100 ng) was injected intravenously into mouse tail followed byzymosan A into the peritoneum. For direct comparison, mice were treated with 17R-RvDsvia intravenous injection followed by zymosan A. Mice were sacrificed and peritoneallavages were collected (2 h) and cells enumerated. Air pouch: RvDs (100 ng) wereinjected intrapouch or intravenously followed by intrapouch injection of TNF-α. At 4 h,air pouch lavages were collected and enumerated. Values represent mean ± SEM fromthree to four different mice; all gave p < 0.05 when infiltrated PMN was compared withvehicle control.

4. Notes1. Handling cytokines: It usually is advisable to aliquot cytokines because they are
in general dissolved in water and kept at –20°C. Keep and dissolve cytokinestocks according to the manufacturer’s instructions. Repeated freezing andthawing can lead to degradation of these protein mediators.
2. COX-2 expression: expression of COX-2 should be verified in the currentexperimental conditions. COX-2-specific antibodies as well as COX-2 nucleotideprimers are available from most vendors that supply eicosanoids. Thus, verifica-tion of cytokine COX-2 induction by either Western blot or reverse transcriptionpolymerase chain reaction is recommended.
3. Handling aspirin: aspirin hydrolyses rapidly in an aqueous environment. There-fore, prepare aspirin stocks in ethanol immediately before each experiment andstore solid aspirin in a desiccator to prevent decomposition. Note that aspirin is theonly known non-steroidal anti-imflammatory drug that acetylates COX-2.
4. Extraction protocol optimized for LX and RV: Terminate the incubation by addingtwo volumes of ice-cold methanol and place the mixture at –20°C for at least20 min for protein precipitation. Centrifuge at 800g for 20 min at 4°C. Collect thesupernatant in a 50-mL tube and dilute the sample with at least five volumes ofpure water. Rapidly adjust the pH of this aqueous suspension to pH 3.5 withHCL (1 N). Load the acidified samples into solid-phase extraction cartridges (C18 Sep-Pak), wash the cartridge with 10 mL of water, and elute compounds with8 mL of hexane, followed by 8 mL of methyl formate, and a final elution with8 mL of methanol. LX, RV, HETEs, and most leukotrienes elute in the methylformate fraction, whereas peptide leukotrienes (LTC4, LTD4, LTE4, etc.) elute inthe methanol fraction. Take the methyl formate fraction to dryness under a gentlestream of nitrogen and then resuspend compounds in a small volume of methanol(i.e., 100 µL).
5. LC-MS-MS analyses: LC/MS/MS analysis is conducted on an LCQ (FinniganMAT, San Jose, CA) quadrupole ion trap mass spectrometer system equipped withan electrospray atmospheric pressure ionization probe. Compounds were dissolvedin methanol and injected into the high-performance liquid chromatography (HPLC)component, which consisted of a Spectra SYSTEM P4000 quaternary gradientpump (Thermo Separation Products, San Jose, CA), LUNA C18-2 (150 × 2 mm,5 µm) or C18-2 (100 × 2 mm, 5 µm) columns (Phenomenex, Torrance, CA), and arapid spectra scanning SpectraSYSTEM UV2000 UV/VIS absorbance detector(Thermo Separation Products). The column is eluted at 0.2 mL/min isocratically for20 min with methanol/water/acetic acid (65/35/0.01, v/v/v) followed by a 20 minlinear gradient to 99.99/0.01 methanol/acetic acid (v/v). The spray voltage is set to8 kV and the heated capillary to 250°C, and a maximum ion injection time of350 ms. Over a 2.4 s scan cycle, full-scan MS are acquired by scanning betweenm/z 95-450 in the negative ion mode, followed by the acquisition of product ionMS/MS of the most intense molecular anions (e.g., [M-H] = m/z 349.5 for RvE1,[M-H] = m/z 343, 359 and 375 for mono-, di- and tri-HDHA, respectively). Also,
Novel Mediators Generated From ω-3 PUFA 245

a Chiralcel OB-H column (J. T. Baker) was used to determine R and S alcoholconfigurations of monohydroxy-PUFA using isocratic (hexaneisopropanol;964 volvol).
6. Human PMNs: PMNs should be used immediately after isolation (i.e., ∼3 h aftervenipuncture, accounting for isolation) or placed in an ice bath (4°C). This willslow the decrease of enzymatic activity that starts once the cells are removed fromblood. Note that careful records should be kept on the blood donors. Unlike cul-tured cells, peripheral blood cells are exposed to a diverse environment that caninclude cytokines and mono-HETEs that “prime” leukocytes. Such diversityresults in noticeable donor variations in the data. For example, in endogenously“primed” PMN such as from asthmatic patients, 5S,15S-diHETE and LX, whichnormally are associated with transcellular biosynthesis, are generated endoge-nously from a single cell type (PMN).
7. TNF-α-initiated murine air pouches. Male FVB mice (6 to 8 wk) fed with labo-ratory rodent diet 5001 (Lab Diet, Purina Mills; containing less than 0.25%arachidonic acid, 1.49% EPA and 1.86% DHA) were anesthetized with isoflu-rane. Dorsal air pouches were raised by injecting 3 mL of sterile air subcuta-neously on day 0 and 3. On day 6, inflammation in the air pouch was induced bylocal injection of recombinant murine TNF-α (20 ng) dissolved in 100 µL ofsterile PBS. At indicated times, air pouches were lavaged twice with 3 mL of PBS. Lavage cells were collected by centrifugation and enumerated by lightmicroscopy. Cell-free lavage fluids were used for determination of lipid mediatorsby lipidomic analysis.
8. Handling lipid mediators: RVs are sensitive to light, oxygen, and heat and shouldbe stored at 20 to −80°C. This is especially critical for native EPA and DHA, whichupon exposure to oxidative conditions will degrade to a variety of compounds.Thus, prepare a concentrated stock and a “working or daily stock” that you will useas reference materials for the experiments. As a general rule, each time a stock isused, pass a gentle stream of nitrogen into the vial before closing. This will slowthe oxidative degradation. Determine the concentration of RV stocks by measuringthe ultraviolet absorbance and using the specific extinction coefficient. This is espe-cially important if stocks are used on a regular basis. If possible, HPLC analysis ofyour stocks is an invaluable tool to determine the purity and, for example, percentisomerization.
9. Vehicle controls: the total amount of vehicle (ethanol) added to your cell incuba-tion or coincubations should not exceed 0.1%. Higher concentrations of alcoholcan affect cell integrity (i.e., enzyme activity and membrane integrity). It is there-fore desirable to prepare stocks of compounds at 1000 to 5000 times the finalconcentration so that only small aliquots are added directly to cell suspensions.
10. Zymosan A-initiated murine peritonitis: Male FVB mice (6–8 wk old) were anes-thetized with isoflurane. Compounds were delivered as a bolus injection eitherinto the tail vein in 100 µL of sterile saline or intraperitoneally in 200 µL of ster-ile saline and followed by intraperitoneal injection of zymosan A (1 mg/mL). Vehi-cle controls were performed in parallel. At indicated time points, mice were
246 Chiang and Serhan

euthanized with an overdose of isoflurane, peritoneal lavages collected andcentrifuged. Aliquots of the cells were stained with Trypan blue and numerated bylight microscopy.
11. Internal standards: it is essential to terminate incubations with solutions contain-ing an internal standard since this will serve as an invaluable tool for correction ofproduct profiles (e.g., HPLC retention times) and for calculating recoveries of LXand Rv after extraction and sample workup. The internal standard should be astable measurable compound that is not generated during the cell incubations anddoes not interfere with the product analysis. PGB2 usually meets those criteriafor analysis of LX and Rv. Depending on the sensitivity of the analytical systemsto be used (i.e., LC-MS, GC-MS, or PDA-UV-HPLC), 50 pg to 200 ng are addedto the incubations.
AcknowledgmentsWe thank Mary Halm Small for assistance in preparing the manuscript. This
work was supported in part by National Institutes of Health grants GM38675,P01-DE13499, and P50-DE016191.
References1. Helgadottir, A., Manolescu, A., Thorleifsson, G., et al. (2004) The gene encoding
5-lipoxygenase activating protein confers risk of myocardial infarction and stroke.Nat. Genet. 36, 233–239.
2. Erlinger, T. P., Platz, E. A., Rifai, N., and Helzlsouer, K. J. (2004) C-reactiveprotein and the risk of incident colorectal cancer. JAMA 291, 585–590.
3. Pasche, B. and Serhan, C. N. (2004) Is C-reactive protein an inflammation opsoninthat signals colon cancer risk? JAMA 291, 623–624.
4. Gallin, J. I., Snyderman, R., Fearon, D. T., Haynes, B. F., and Nathan, C. (eds.)(1999) Inflammation: Basic Principles and Clinical Correlates. Lippincott Williams& Wilkins, Philadelphia.
5. Van Dyke, T. E. and Serhan, C. N. (2003) Resolution of inflammation: a newparadigm for the pathogenesis of periodontal diseases. J. Dent. Res. 82, 82–90.
6. Burr, G. O. and Burr, M. M. (1929) A new deficiency disease produced by therigid exclusion of fat from the diet. J. Biol. Chem. 82, 345–367.
7. Lands, W. E. M. (ed.) (1987) Proceedings of the AOCS Short Course on Polyunsat-urated Fatty Acids and Eicosanoids. American Oil Chemists’ Society, Champaign, IL.
8. Bazan, N. G. (1990) Supply of n-3 polyunsaturated fatty acids and their signifi-cance in the central nervous system, in Nutrition and the Brain (Wurtman, R. J.and Wurtman, J. J., eds.), Vol. 8, Raven Press, New York, pp. 1–22.
9. Simopoulos, A. P., Leaf, A., and Salem, N., Jr. (1999) Workshop on the essential-ity of and recommended dietary intakes for omega-6 and omega-3 fatty acids.J. Am. Coll. Nutr. 18, 487–489.
10. Salem, N., Jr., Litman, B., Kim, H.-Y., and Gawrisch, K. (2001) Mechanisms ofaction of docosahexaenoic acid in the nervous system. Lipids 36, 945–959.
Novel Mediators Generated From ω-3 PUFA 247
11. Serhan, C. N., Clish, C. B., Brannon, J., Colgan, S. P., Chiang, N., and Gronert, K.(2000) Novel functional sets of lipid-derived mediators with antiinflammatoryactions generated from omega-3 fatty acids via cyclooxygenase 2-nonsteroidalantiinflammatory drugs and transcellular processing. J. Exp. Med. 192, 1197–1204.
12. Serhan, C. N., Hong, S., Gronert, K., Colgan, S. P., Devchand, P. R., Mirick, G.,and Moussignac, R.-L. (2002) Resolvins: a family of bioactive products of omega-3 fatty acid transformation circuits initiated by aspirin treatment thatcounter pro-inflammation signals. J. Exp. Med. 196, 1025–1037.
13. Hong, S., Gronert, K., Devchand, P., Moussignac, R.-L., and Serhan, C. N. (2003)Novel docosatrienes and 17S-resolvins generated from docosahexaenoic acid inmurine brain, human blood and glial cells: autacoids in anti-inflammation. J. Biol.Chem. 278, 14,677–14,687.
14. Marcheselli, V. L., Hong, S., Lukiw, W. J., et al. (2003) Novel docosanoids inhibitbrain ischemia-reperfusion-mediated leukocyte infiltration and pro-inflammatorygene expression. J. Biol. Chem. 278, 43,807–43,817.
15. Mukherjee, P. K., Marcheselli, V. L., Serhan, C. N., and Bazan, N. G. (2004)Neuroprotectin D1: a docosahexaenoic acid-derived docosatriene protects humanretinal pigment epithelial cells from oxidative stress. Proc. Natl. Acad. Sci. USA101, 8491–8496.
16. Lehr, H.-A., Olofsson, A. M., Carew, T. E., et al. (1994) P-selectin mediates theinteraction of circulating leukocytes with platelets and microvascular endotheliumin response to oxidized lipoprotein in vivo. Lab. Invest. 71, 380–386.
17. Mora, J. R., Bono, M. R., Manjunath, N., et al. (2003) Selective imprinting of gut-homing T cells by Peyer’s patch dendritic cells. Nature 424, 88–93.
18. Serhan, C. N., Hamberg, M., and Samuelsson, B. (1984) Lipoxins: novel series ofbiologically active compounds formed from arachidonic acid in human leukocytes.Proc. Natl. Acad. Sci. USA 81, 5335–5339.
19. Serhan, C. N. and Sheppard, K. A. (1990) Lipoxin formation during humanneutrophil-platelet interactions. Evidence for the transformation of leukotriene A4
by platelet 12-lipoxygenase in vitro. J. Clin. Invest. 85, 772–780.20. Marcus, A. J. (1999) Platelets: their role in hemostasis, thrombosis, and inflamma-
tion, in Inflammation: Basic Principles and Clinical Correlates (Gallin, J. I. andSnyderman, R., eds.), Lippincott Williams & Wilkins, Philadelphia, pp. 77–95.
21. Maddox, J. F. and Serhan, C. N. (1996) Lipoxin A4 and B4 are potent stimuli forhuman monocyte migration and adhesion: selective inactivation by dehydrogena-tion and reduction. J. Exp. Med. 183, 137–146.
22. Godson, C., Mitchell, S., Harvey, K., Petasis, N. A., Hogg, N., and Brady, H. R.(2000) Cutting edge: lipoxins rapidly stimulate nonphlogistic phagocytosis of apop-totic neutrophils by monocyte-derived macrophages. J. Immunol. 164, 1663–1667.
23. Clària, J. and Serhan, C. N. (1995) Aspirin triggers previously undescribed bio-active eicosanoids by human endothelial cell-leukocyte interactions. Proc. Natl.Acad. Sci. USA 92, 9475–9479.
24. Perretti, M., Chiang, N., La, M., Fierro, I. M., Marullo, S., Getting, S. J., Solito, E.,and Serhan, C. N. (2002) Endogenous lipid- and peptide-derived anti-inflammatory
248 Chiang and Serhan

pathways generated with glucocorticoid and aspirin treatment activate the lipoxinA(4) receptor. Nat. Med. 8, 1296–1302.
25. Vane, J. R. (2002) Back to an aspirin a day? Science 296, 474–475.26. Cheng, Y., Austin, S. C., Rocca, B., et al. (2002) Role of prostacyclin in the cardio-
vascular response to thromboxane A2. Science 296, 539–541.27. Fierro, I. M., Colgan, S. P., Bernasconi, G., Petasis, N. A., Clish, C. B., Arita, M.,
et al. (2003) Lipoxin A4 and aspirin-triggered 15-epi-lipoxin A4 inhibit human neu-trophil migration: comparisons between synthetic 15 epimers in chemotaxis andtransmigration with microvessel endothelial cells and epithelial cells. J. Immunol.170, 2688–2694.
28. Fierro, I. M., Kutok, J. L., and Serhan, C. N. (2002) Novel lipid mediator regulatorsof endothelial cell proliferation and migration: Aspirin-triggered-15R-lipoxin A4
and lipoxin A4. J. Pharmacol. Exp. Ther. 300, 385–392.29. Kieran, N. E., Doran, P. P., Connolly, S. B., et al. (2003) Modification of the tran-
scriptomic response to renal ischemia/reperfusion injury by lipoxin analog. KidneyInt. 64, 480–492.
30. Fiore, S., Ryeom, S. W., Weller, P. F., and Serhan, C. N. (1992) Lipoxin recogni-tion sites. Specific binding of labeled lipoxin A4 with human neutrophils. J. Biol.Chem. 267, 16,168–16,176.
31. Fiore, S., Maddox, J. F., Perez, H. D., and Serhan, C. N. (1994) Identification ofa human cDNA encoding a functional high affinity lipoxin A4 receptor. J. Exp.Med. 180, 253–260.
32. Bae, Y.-S., Park, J. C., He, R., et al. (2003) Differential signaling of formyl peptidereceptor-like 1 by Trp-Lys-Tyr-Met-Val-Met-CONH2 or lipoxin A4 in human neu-trophils. Mol. Pharmacol. 63, 721–730.
33. Gewirtz, A. T., Collier-Hyams, L. S., Young, A. N., et al. (2002) Lipoxin A4
analogs attenuate induction of intestinal epithelial proinflammatory gene expres-sion and reduce the severity of dextran sodium sulfate-induced colitis. J. Immunol.168, 5260–5267.
34. Devchand, P. R., Arita, M., Hong, S., et al (2003) Human ALX receptor regulatesneutrophil recruitment in transgenic mice: Roles in inflammation and host-defense.FASEB J. 17, 652–659.
35. Serhan, C. N., Jain, A., Marleau, S., et al. (2003) Reduced inflammation and tissuedamage in transgenic rabbits overexpressing 15-lipoxygenase and endogenous anti-inflammatory lipid mediators. J. Immunol. 171, 6856–6865.
36. Weissmann, G., Smolen, J. E., and Korchak, H. M. (1980) Release of inflamma-tory mediators from stimulated neutrophils. N. Engl. J. Med. 303, 27–34.
37. Samuelsson, B. (1982) From studies of biochemical mechanisms to novel biologi-cal mediators: prostaglandin endoperoxides, thromboxanes and leukotrienes, in Les Prix Nobel: Nobel Prizes, Presentations, Biographies and Lectures, Almqvist & Wiksell, Stockholm, pp. 153–174.
38. Vane, J. R. (1982) Adventures and excursions in bioassay: the stepping stones toprostacyclin, in Les Prix Nobel: Nobel Prizes, Presentations, Biographies andLectures, Almqvist & Wiksell, Stockholm, pp. 181–206.
Novel Mediators Generated From ω-3 PUFA 249

39. GISSI-Prevenzione Investigators (1999) Dietary supplementation with n-3 polyun-saturated fatty acids and vitamin E after myocardial infarction: results of the GISSI-Prevenzione trial. Gruppo Italiano per lo Studio della Sopravvivenza nell’Infartomiocardico. Lancet 354, 447–455.
40. Marchioli, R., Barzi, F., Bomba, E., et al. (2002) Early protection against suddendeath by n-3 polyunsaturated fatty acids after myocardial infarction: time-courseanalysis of the results of the Gruppo Italiano per lo Studio della Sopravvivenzanell’Infarto Miocardico (GISSI)-Prevenzione. Circulation 105, 1897–1903.
41. Rosenstein, E. D., Kushner, L. J., Kramer, N., and Kazandjian, G. (2003) Pilotstudy of dietary fatty acid supplementation in the treatment of adult periodontitis.Prostaglandins Leukot. Essent. Fatty Acids 68, 213–218.
42. Bazan, N. G. (1992) Supply, uptake, and utilization of docosahexaenoic acidduring photoreceptor cell differentiation. Nestle Nutrition Workshop Series 28,121–133.
43. Lee, T. H., Mencia-Huerta, J.-M., Shih, C., Corey, E. J., Lewis, R. A., andAusten, K. F. (1984) Effects of exogenous arachidonic, eicosapentaenoic, anddocosahexaenoic acids on the generation of 5-lipoxygenase pathway products byionophore-activated human neutrophils. J. Clin. Invest. 74, 1922–1933.
44. Sawazaki, S., Salem, N., Jr., and Kim, H.-Y. (1994) Lipoxygenation of docosa-hexaenoic acid by the rat pineal body. J. Neurochem. 62, 2437–2447.
45. Reich, E. E., Zackert, W. E., Brame, C. J., et al. (2000) Formation of novel D-ring and E-ring isoprostane-like compounds (D4/E4-neuroprostanes) in vivo fromdocosahexaenoic acid. Biochemistry 39, 2376–2383.
46. VanRollins, M., Baker, R. C., Sprecher, H. W., and Murphy, R. C. (1984) Oxida-tion of docosahexaenoic acid by rat liver microsomes. J. Biol. Chem. 259,5776–5783.
47. Lands, W. E. M. (2003) Diets could prevent many diseases. Lipids 38, 317–321.48. Winyard, P. G. and Willoughby, D. A. (eds.) (2003) Inflammation Protocols.
Humana, Totowa, NJ.49. Lu, Y., Hong, S., Tjonahen, E., and Serhan, C. N. (2003) Lipid mediator
lipidomics: databases and search algorithms of electric spray ionization/tandemmass and ultraviolet spectra for structural elucidation, in 5th Winter EicosanoidConference, Baltimore.
50. Arita, M., Bianchini, F., Aliberti, J., et al. (2005) Stereochemical assignment,anti-inflammatory properties, and receptor for the omega-3 lipid mediator resolvinE1. J. Exp. Med., 201, 713–722.
51. Corey, E. J., Shih, C., and Cashman, J. R. (1983) Docosahexaenoic acid is a stronginhibitor of prostaglandin but not leukotriene biosynthesis. Proc. Natl. Acad. Sci.USA 80, 3581–3584.
52. Serhan, C. N. and Oliw, E. (2001) Unorthodox routes to prostanoid formation:new twists in cyclooxygenase-initiated pathways. J. Clin. Invest. 107, 1481–1489.
53. Serhan, C. N., Gotlinger, K., Hong, S., et al. (2006) Anti-inflammatory actionsof neuroprotectin D1/protectin D1 and its natural stereoisomers: assignments ofdihydroxy-containing docosatrienes. J. Immunol. 176, 1848–1859.
250 Chiang and Serhan

251
20
Isolation and Analysis of Lipid Rafts in Cell–Cell Interactions
Aimee Landry and Ramnik Xavier
SummaryLipid rafts are dynamic structures made up of proteins and lipids that float freely within the
liquid-disordered bilayer of cellular membranes and have the ability to cluster to form larger,more-ordered platforms. These clustered structures have been identified in all cell types and havebeen shown to play critical roles in signal transduction, cellular transport, and cell–cell commu-nication. Lipid rafts also have been implicated in facilitating bacterial/viral entry into host cells andin human disease, highlighting the significance of understanding the role lipid rafts play in phys-iological and pathological signaling outcomes. In this chapter, we provide protocols to isolatelipid rafts from polarized and nonpolarized cells and outline novel technologies to analyze signaltransduction cascades in vivo.
Key Words: Lipid rafts; detergent-insoluble membranes; cholesterol; signal transduction; bio-chemical fractionation; microscopy; proteomics; FRET; FRAP; flow cytometry; lymphocytes;polarized epithelial cells.
1. IntroductionLipid rafts are membrane microdomains enriched in cholesterol and sphingo-
lipids, and are associated with specific microanatomic features of cells fromdiverse lineages. They float freely in the resting state, carrying a few passengerproteins, but aggregate to form functional platforms mediating diverse signalingcascades when activated (1–4). Lipid rafts have been described in all cell typesto date. Cholesterol content and sphingolipids play a central role in the genesisof these of these microdomains. Analysis of the consequences of directed muta-tions in mice have established a role for lipid rafts in signal transduction (5,6).Caveolae, characteristic flask-shaped invaginations of endodermal cells are one class of lipid raft structure; another is the lumenal surface of polarized
From: Methods in Molecular Biology, vol. 341: Cell−Cell Interactions: Methods and ProtocolsEdited by: S. P. Colgan © Humana Press Inc., Totowa, NJ
From: Methods in Molecular Biology, vol. 341: Cell−Cell Interactions: Methods and ProtocolsEdited by: S. P. Colgan © Humana Press Inc., Totowa, NJ
epithelium, which is highly enriched in raft-like structures. In other cells,such as lymphocytes and neurons, rafts are isolated structures 50 nm indiameter and do not appear to be associated with any specific ultrastructuralfeatures. In lymphocytes, rafts are estimated to represent 40% of total mem-brane as determined by fluorescence anisotrophy measurements. For thepurposes of this overview we will refer to lipid rafts as detergent-insolublemembranes (DIMs). Both phospatidylinositol-linked proteins and palmitoy-lated transmembrane proteins are concentrated in rafts, as well as nearly alllipidated intracellular proteins, including myristoylated, palmitoylated, andprenylated molecules.
A protein’s affinity to lipid rafts can be modified by enzymatic reactions,which alter the biochemical properties of the given protein, allowing the cellto dynamically regulate molecular mechanics which govern cellular function.Glycosylphospatidylinositol (GPI)-linked proteins often are found located withinlipid rafts and can be cleaved by phospholipase. Rab GTPases, key regulators ofmembrane targeting and fusion, require the covalent attachment of geranyl-geranylisoprenes near their C terminus in a multi-step process, which can subsequentlyincrease lipid affinity (7). Src family kinases, which are responsible for plasmamembrane targeting, contain a unique domain in the N-terminus that is modifiedby dual acylation and palmitoylation (8).
The ability of lipid rafts to isolate protein receptors from the majority of theplasma membrane enables the compartmentalization of signaling components,concentrating certain elements within lipid rafts while excluding others (9,10).HaRas, which is palmitoylated and farnesylated, is localized to lipid richmicrodomains. In contrast, KiRas, which is farnesylated but not palmitoylated,associates with the inner leaflet of the plasma membrane and is excluded fromlipid rafts. Thus, a posttranslational addition of palmitate effectively segregatesthese two GTPases in the plasma membrane (11). Recent studies have suggestedthat an equivalent domain organization is present in the cytoplasmic leaflet aswell. In polarized epithelial cells, lipid rafts are distributed asymmetrically at theapical surface and play a role in protein localization, trafficking, internalization,and proteosomal degradation (12,13).
Proteins are thought to target lipid-rich domains resulting from the fact thatthe number of lipid sites exceeds the number of binding sites; this systemallows lipid rafts to recruit many different proteins to a membrane withoutsaturating protein-binding sites. Lipids also can be produced and degradedrapidly by enzymes in a matter of seconds, allowing the characteristics of amembrane to be rapidly remodeled based on the physiological need of thecell at a given time point. In addition, lipid-binding interactions often occurat a low affinity, enabling rapid protein equilibration and movement insidethe cell.
252 Landry and Xavier

Microdomains also play key roles in the life cycle of microbes by facilitatingaccess to cellular receptors, influencing trafficking to appropriate subcellularsites, and play a critical role in the assembly of enveloped viruses during repli-cation (14). Lipid rafts also have an important function in the organizationof signal transduction during lymphocyte activation (15,16). It appears that dif-ferential partitioning of signaling proteins within the lipid rafts is an importantmechanism by which integration of signal transduction pathways is achieved.In T- and B-cells, lipid rafts appear to play an important role in development,signaling and differentiation.
Understanding raft-mediated membrane trafficking is important to cell com-munication. Lipid rafts have been shown to be involved in fundamental pro-cesses of all eukaryotic cells, and 30% of all cellular proteins are membraneproteins. Lipid rafts have drawn the attention of a variety of investigators withbroad range of research interests. Neurobiologists have identified lipid rafts asthe basis of synaptic transmission (17). Lipid rafts have also been shown to beessential for antigen presentation and processing and have been implicated inseveral immunological disorders such as systemic lupus erythematosus (18).An expanding list of monogenic diseases can traced to altered lipid raft func-tion (19,20). In addition, lipid rafts play a central role in the pathogenesis ofnumerous common and complex diseases, such as diabetes, atherosclerosis,cancer, and neurodegenerational disorders such as Alzheimer’s disease (21).Lipid rafts are thought to serve as specific targets for entry of immunomodu-lators (e.g., toxins or lipopolysaccharides) of bacterial origin into host cells orviruses (e.g., human immunodeficiency and influenza viruses).
Persuasive evidence for the existence of lipid rafts comes from analysis ofmodel membranes, liposomes, and biophysical methods such as fluorescenceenergy transfer and single particle tracking experiments (22). Considerableprogress has been made in studying and understanding the role lipid rafts playin receptor-mediated signal transduction. Here, we briefly review the role ofrafts in a model system familiar to our laboratory and provide protocols to iso-late and analyze rafts in nonpolarized and polarized cell signaling.
2. Materials2.1. Cell Stimulation
1. Purified antibodies of interest.
2.2. Cholesterol Depletion and Enrichment
1. Methyl-β-cyclodextrin (MβCD; Sigma, St. Louis, MO, cat. no. C-4555). Stocksolutions made in dH2O and stored at –20°C.
2. Cholesterol complexed to MβCD (Sigma, cat. no. C-4951). Stock solutions madein dH2O and stored at –20°C.
Lipid Rafts in Cell–Cell Interactions 253

2.2.1. Sucrose Gradient
1. Refrigerated ultracentrifuge capable of reaching speeds of 200,000g and appro-priate rotor.
2. Glass Dounce homogenizer (Bellco Glass Inc.; cat. no. 1984-10007).3. SW-40 polyalomer tubes (Beckman, cat. no. 331372).4. Mes-buffered saline (MBS): 25 mM Mes (pH 6.5), 150 mM NaCl. Store at 4°C.5. MBS lysis buffer: 22 mM MES (pH 6.5), 150 mM NaCl, 0.5% Triton X-100,
1 mM Na3VO4, 2 mM EDTA, 1 mM phenylmethyl sulfonyl fluoride, and 1 µg/µLaproptintin. Store at 4°C.
6. Sucrose solutions: 80% (w/v) sucrose (80 g of ultra pure sucrose into a finalvolume of 100 mL of MBS). Heat approx 50 mL of MBS while stirring and grad-ually add sucrose until dissolved. Do not boil. Increase volume to 100 mL withadditional MBS. 35% (w/v) and 5% (w/v) sucrose solutions can be made by dilut-ing 85% stock. Store at 4°C.
7. Apparatus for sodium dodecyl sulfate polyacrylamide gel electrophoresis andWestern transfer (Bio-Rad, cat. no.165-3318).
8. Polyvinylidene difluoride membrane (Millipore, cat. no. IPVH20200).
2.2.2. Linear Gradient
1. Buffer A: 0.25 M sucrose, 1 mM EDTA, 20 mM Tris-HCl, pH 7.8.2. Buffer A+: Buffer A+ 0.2 mM AEBSF, 1 µg/mL aprotinin, 10 µM bestatin, 3 µM
E-64, 10 µg/mL leupeptin, 2 µM pepstatin, and 50 µg/mL calpain inhibitor I. 3. Percoll (Sigma, cat. no. P-1644).
2.2.3. Sodium Carbonate Gradient
1. SCB: 50 mM sodium carbonate, pH 11.0.2. SCB+: SCB + 0.2 mM AEBSF, 1 µg/mL aprotinin, 10 µM bestatin, 3 µM E-64,
10 µg/mL leupeptin, 2 µM pepstatin, and 50 µg/mL calpain inhibitor I.3. Branson Sonifier 250, or similar.
2.2.4. OptiPrep Gradient
1. Base buffer: 20 mM Tris-HCl, pH 7.8, 250 mM sucrose, 1 mM CaCl2, 1 mMMgCl2.
2. Base buffer+: Base buffer + 0.2 mM AEBSF, 1 µg/mL aprotinin, 10 µM bestatin,3 µM E-64, 10 µg/mL leupeptin, 2 µM pepstatin, and 50 µg/mL calpain inhibitor I.
3. OptiPrep (Granier BioOne, cat. no. No. 1030061; www.gbo.com).
2.3. Protein Localization and Aggregation of Lipid Rafts
1. Glass slides and cover slips.2. Clear nail polish. 3. PAP Pen (Sigma, cat. no. Z377821).4. 0.01% poly-l-lysine (Sigma, cat. no. P-4707).
254 Landry and Xavier

5. 4% (w/v) paraformaldehyde (PFA): add 4 g of PFA powder to approx 80 mL ofdH2O. Stir and heat solution until solution reaches 60 to 70°C (but do not allowto boil). Add 10 N NaOH drop-wise until solution clears. Remove from heat andallow to cool. Add 10 mL of 10X phosphate-buffered saline (PBS) and adjustfinal volume to 100 mL. Adjust pH to 7.4, filter, and store at 4°C for up to 1 mo.Note: PFA powder is toxic if inhaled. Work in a fume hood or wear a mask whilemeasuring out the powder to avoid inhalation.
6. Tween-20 (Sigma, cat. no. P-9416).7. Bovine serum albumin (BSA; Sigma, cat. no. A-3059).8. Primary antibodies of interest.9. Fluorescent secondary antibodies.
10. VectaMount (Vector Laboratories, cat. no. H-5000, www.vectorlabs.com).
2.4. Molecular Probes and Fluorescent Microscopy
1. Vybrant Lipid Raft Labeling Kit (Molecular Probes; www.probes.com).2. Bodipy sphingomyelin analog (C5 DMB-SM; Molecular Probes; www.probes.
com).
2.5. Immunoisolation
1. Goat-anti-mouse IgG Dynabeads, M-450 4 × 10⁸ beads/mL (Dynal, Oslo, Norway;www.dynalbiotech.com).
2. MPC-E magnet for 1.5-mL microcentrifuge tubes (Dynal).3. Dynal MPC-1 magnetic partial concentrators for 15- or 50-mL centrifuge tubes
(Dynal). 4. Rotating wheel.5. 100 mM sodium vanadate: dissolve 9.5 g of sodium orthovanadate in approx
400 mL of dH2O. Adjust pH to 10.2 with HCl. Heat in microwave until solutionstarts to boil. Adjust pH to 10.2 with 1 M NaOH. Heat in microwave until solu-tion starts to boil. Check pH is between 9.9 and 10.1. Repeat with new reagentsif pH is not correct.
6. 10 mM pervanadate: 10 µL of 100 mM sodium vanadate stock solution, 10 µL of30% H2O2, and 80 µL of dH2O. Incubate solution at room temperature (RT) for10 min before preparing HB+ buffer.
7. 1000X CLAP: 5 mg of chymostatin, 5 mg of leupeptin, 5 mg of antipain, and5 mg of pepstatin. Dissolve in 500 µL of dimethyl sulfoxide. Store in 50-µLaliquots at –20°C.
8. HB buffer: 250 mM sucrose, 10 mM Na–HEPES, pH 7.2, 1 mM MgCl2, 10 mMNaF, and 1 mM sodium vanadate. Adjust to a final volume of 500 mL with dH2O.
9. HB+ buffer: add 11500 of 10 mM pervandate and 11000 of 1000X CLAP to HB.10. Laemmeli sample buffer (BioRad; cat. no. 161-0737).
2.6. Electron Microscopy
1. 5-mm copper wire loops.2. Mesh copper grids (Agar Scientific, UK).
Lipid Rafts in Cell–Cell Interactions 255

3. Filter paper (Whatman).4. Fish skin gelatin, 45% aqueous solution (Sigma, cat. no. G-7765).5. Glutaraldehyde, EM grade, 25% stock (Agar Scientific, UK, cat. no. R1020).6. Methyl cellulose (Sigma, cat. no. M-6385).7. Parafilm.8. Paraformaldehyde, EM grade, 16% stock (Agar Scientific, cat. no. R1026).9. Adobe Photoshop (San Jose, CA).
10. Image J 1.26 (http://rsb.info.nih.gov/ij/) or NIH Image 1.82 (http://rsb.info.nih.gov/nih-image).
11. Affinity-purified antibodies of interest.12. Commercially available K-function analysis program.13. Transmission electron microscope (JEOL 1010 or similar).14. 1% trisodium citrate: dissolve 0.5 g of sodium citrate in 50 mL of dH2O. Store
at RT.15. 1% tannic acid: dissolve 0.5 g of tannic acid in 50 mL of dH2O. Store at RT.16. 25 mM potassium carbonate: dissolve 0.173 g of potassium carbonate in 50 mL of
dH2O. Store at RT.17. Reducing solution: 2 mL of 1% trisodium citrate, X mL of 1% tannic acid, and
X mL of 25 mM potassium carbonate (see Table 1 for quantities). Add dH2O fora final volume of 10 mL. Make fresh for each use.
18. 1% gold chloride: dissolve 1 g of gold chloride in 100 mL of dH2O. Store at 4°C.Stable for up to 2 yr.
19. Gold solution: add 0.5 mL of 1% gold chloride to 39.5 mL of dH2O. Make freshfor each use.
20. 10% BSA: dissolve 2 g of BSA in 20 mL of PBS. (For use in electron microscopy[EM], centrifuge at 100,000g for 1 h at 4°C to remove any remaining particles.Store at 4°C for 5 mo.)
21. 0.1% BSA: add 0.5 mL of 10% BSA to 50 mL of PBS. Make fresh for each use.22. 2% methyl cellulose: dissolve 2 g of methyl cellulose in 98 mL of dH2O heated to
90°C. Cool on ice while continuing to stir. Store in a sealed container for 72 h at 4°C.23. Centrifuge at 100,000g for 1 h. Decant supernatant and store at 4°C.24. 10X potassium acetate (KOAc) buffer: add 11.92 g of HEPES, 22.58 g of potassium
acetate, and 1.02 g of magnesium chloride to 180 mL of dH2O. Add six pellets ofKOH and continue to adjust pH using additional KOH (1 M) to 7.4. Add additionalwater for a final volume of 200 mL. Aliquot and store at −20°C.
256 Landry and Xavier
Table 1Volumes for Preparing Reducing Solution for Various-Sized Gold Particles
Gold size (nm) 2–3 4 4.5 5.5 6 7.51% tannic acid (mL) 2.5 1.25 0.75 0.5 0.25 0.1325 mM potassium 2.5 1.25 0.75 0.5 0.25 0.13
carbonate (mL)

25. 1X KOAc buffer: thaw and add 2 mL of 10X KOAc buffer (above) to 18 mL ofPBS. Make fresh for each use.
26. Fixative: add 2 mL paraformaldehyde (16% stock), 32 µL of glutaraldehyde (25%stock), and 0.8 mL of 10X KOAc buffer to 5.17 mL of dH2O in a fume hood.Store at 4°C for up to 2 wk.
27. 25 mM glycine: dissolve 93.8 mg of glycine in 50 mL of PBS. Aliquot (1 mLeach) and store at –20°C.
28. Fish skin gelatin: add 3 mL of fish skin gelatin (45% aqueous solution) to 11.5 mLof PBS. Store at 4°C for up to 6 mo.
29. Blocking solution: add 200 µL of 10% fish skin gelatin and 200 µL of 10% BSAto 10 mL of PBS. Make fresh for each use.
30. 3% uranyl acetate: dissolve 1.5 g of uranyl acetate in 50 mL of dH2O. Aliquot andstore at 4°C for 1 yr.
2.7. Fluorescence Resonance Energy Transfer
1. Lipid-based delivery system, such as TransFection (Bio-Rad, cat. no. 170-3250). 2. Donor/acceptor antibodies for FRET (Table 2).3. Normal serum from secondary antibody host diluted in PBS (as recommended
by manufacturer).4. NaBH4 (1 mg/mL).5. 100% methanol (–20°C) or 0.1% Triton X-100 (4°C) for fixation (if necessary).
Lipid Rafts in Cell–Cell Interactions 257
Table 2Donor/Acceptor Antibodies for FRET
Donor Imaging Path Acceptor Imaging Path
Excitation Emission Excitation EmissionFRET Pair Filter Dichroic Filter Filter Dichroic Filter
FITC-TRITC 480/40 505 LP 535/40 545/30 565 LP 610/60FITC-Cy3 480/40 505 LP 535/40 540/25 565 LP 605/55Cy3-Cy5 540/25 565 LP 605/55 640/20 660 LP 680/30BFP-GFP 390/20 420 LP 460/50 475/40 460 LP 535/50GFP-Cy3 475/40 460 LP 505/40 540/25 565 LP 605/55CFP-YFP 436/20 455 LP 480/40 500/20 515 LP 535/30CFP-DsRed 436/20 455 LP 480/40 546/12 560 LP 620/20
All values are expressed as center wavelengths (in nm) with the spread on either side of thepeak value. Donor- and acceptor-only images are acquired separately with donor and acceptorfilter sets, respectively. FRET images are acquired with donor excitation filter, donor dichroic andacceptor emission filters. These filter combinations were adapted from the catalog of filter setspublished by Chroma Technology Corporation. FRET, fluorescence resonance energy transfer;TRITC, tetramethylirhodamine isothiocyanate; BFP, blue fluorescent protein; GFP, green fluo-rescent protein; CFP, cyan fluorescent protein; YFP, yellow fluorescent protein.

6. Confocal laser scanning imaging system with appropriate lasers for excitation ofdonor–acceptor fluorescence resonance energy transfer (FRET) pairs.
2.8. Fluorescence Recovery After Photobleaching
1. Polybead polystyrene beads (6.0 µm in diameter; Polyscience, cat. no. 07312).2. Purified antibodies of interest.3. Blocking Solution: 10 mg/mL in PBS. Filter-sterilize and store at 4°C for several
months.4. Confocal microscope (Carl Zeiss, LSM 510, or similar) and with a 25 mW Argon
laser.
2.9. Proteomics
1. Leucine-deficient media with serum.2. Leucine-deficient media without serum.3. L-Leucine (Sigma, cat. no. L-8912).4. L-Leucine-3,3,3-D3 (Sigma, cat. no. 48,682-5).5. Protein concentration determination kit.6. 6 M urea–2 M thiourea (in 10 mM HEPES, pH 8.0).7. 2.5 M sodium acetate, pH 5.0.8. 1,4-dithio-dl-threoitol (DTT; Fluka, cat. no. 43817).9. Iodoacetamide (Sigma, cat. no. I-1149).
10. LysC enzyme (Sigma, cat. no. A-3422).11. 50 mM ammonium bicarbonate.12. Trypsin (Promega, cat. no. V5113).13. Empore disks (3M, Minneapolis, MN, cat. no. 2215).14. Reverse-phase analytical columns (various manufacturers).15. 5.6 to 64% acetonitrile (Fluka cat. no. 00682).16. Mass spectroscopy (MS) (QSTAR-Pulsar quadrupole time-of-flight hybrid;
PE-Sciex, Thornhill, Ontario, Canada), or similar.
2.10. Analysis Using the Fluorescence-Activated Cell Sorter
1. Fluorescent antibodies specific against membrane antibodies.2. Fluorescence-activated cell sorting (FACS) machine (FACSCalibur or similar),
corresponding software program (i.e., CellQuest).
3. Methods3.1. Cell Preparation
3.1.1. Cell Stimulation
Lipid rafts are most commonly isolated from cells based on their differen-tial solubility in nonionic detergents. Raft size is increased by clustering, lead-ing to a new mixture of molecules. This clustering can be triggered at the
258 Landry and Xavier

extracellular side by ligands, antibodies, or lectins (23); within the membraneby oligomerization (24); or by cytosolic agents (cytoskeletal elements, adapters,scaffolds [25,26]). Raft clustering occurs at the plasma membrane as well asintracellularly, such as in the endosomal lumen. Ligand binding or oligomer-ization can alter the partitioning of proteins in and out of rafts. Increased raftaffinity of a given protein and its activation within rafts (e.g., phosphorylation bySrc-family kinases can initiate a cascade of signaling events, leading to furtherincrease of raft size by clustering (27). In the example presented below, Jurkatcells are stimulated with anti-CD3 and CD28 antibodies to activate the T-cellreceptor (TCR) complex. This method can easily be adapted to other cells.
1. Count cells and determine the total number needed for the experiment (see Note 1). 2. Collect required cells by centrifugation (800g for 5 min at 4°C) and wash once in
1 mL ice-cold PBS. Resuspend in 200 µL of PBS per sample.3. Transfer cells to labeled microcentrifuge tubes and add 1 µg of both CD3 and CD28
antibodies and incubate in a 37°C water bath for various time points (see Note 2).If the samples will be in the water bath for more than 5 min, agitate intermittently.
4. Stop the reaction by adding 1 mL of ice-cold PBS to each tube and wash twice(800g for 5 min at 4°C).
3.1.2. Cholesterol Depletion and Enrichment
Because of the important role cholesterol plays in the stabilization of lipidrafts, reversible depletion or enrichment of plasma membrane cholesterol are twouseful techniques that can be used to examine the biological roles of functionaland non-functional lipid rafts. If a protein is found to be associated with DIM,treatment with cyclodextrin, saponin, and sphingomyelinase may be applied totest whether the association depends on cholesterol and sphingomyelin. MβCDextracts cholesterol from membranes and disrupts domains whose integritydepends on cholesterol. Saponin complexes cholesterol and is thought tosequester it away from other interactions.
3.1.2.1. CHOLESTEROL DEPLETION
1. Collect cells by centrifugation and wash once in MBS. Incubate cells with 10 mMMβCD at 37°C for 30 min.
2. Cells can now be used in functional studies, or washed, repelleted, lysed, andsubjected to sucrose-gradient fractionation.
3.1.2.2. CHOLESTEROL ENRICHMENT
When precomplexed with cholesterol, cyclodextrins can deliver cholesterolback into the plasma membrane and restore cellular functions previously inter-rupted by cholesterol depletion.
Lipid Rafts in Cell–Cell Interactions 259

1. Wash cholesterol-depleted cells. Resuspend cells in MBS containing 3 mMMβCD: cholesterol and incubate at 37°C for 30 min.
2. Wash cells once and use in subsequent studies (see Notes 3–5).
3.2. Gradient Isolation of DIM Fractions
3.2.1. Isolation of DIM Fractions
This protocol takes advantage of the differential solubilization of lipid raftsand the plasma membrane to isolate populations of DIMs. In our experience,Triton X-100 is the most effective detergent in membrane solubilization andrecovery of proteins enriched in lipid microdomains. Composition of isolatedDIMs depends on the temperature and on the nature and concentration of deter-gent used. An elegant study recently demonstrated that DIMs can be isolated at37°C in the presence of Brij 98 (28). Commonly used detergents are TritonX-100, Brij 58, Brij 96, LubrolWX, CHAPS, and Brij 98. Composition of lipidrafts depends on the detergent used. Recent studies have suggested that all raftsisolated do not reflect the same aspect of membrane organization (28,29). Keepin mind that proper controls for incomplete solubilization of membrane frac-tions are important for each experiment. A common problem with this methodin to analyze lipid rafts organization in cells is that lipid reorganization occursduring solubilization so that detergent-resistant membrane structures may differfrom membranes before detergent extraction. Despite this caveat, however, theisolation of DIMs will remain a valuable tool for the analysis of biologicalmembranes.
3.2.1.1. SUCROSE GRADIENT
1. Precool the ultracentrifuge, rotor, and all solutions to 4°C (see Note 6).2. Resuspend the pellet in 2 mL of MBS buffer. Incubate the cells on ice for 30 min.
Disrupt cell membranes by homogenizing for ten strokes in a glass Dounce homog-enizer at 4°C.
3. Transfer 2 mL of the total cell homogenate to the bottom of a SW-40 centrifugetube and add 2 mL of 80% sucrose; mix well.
4. Slowly layer 6 mL of the 35% sucrose solution on top of the sample layer; toprevent the disruption of the sucrose gradient, hold the pipet at a 45° angle on theside of the centrifuge tube.
5. Layer 4 mL of the 5% sucrose solution on top of previous two layers. Make surethat the tube is filled to within 2 mm of the top.
6. Balance the tubes to within 0.01 g and place them in the rotor. Centrifuge samplesfor 16 h at 200,000g at 4°C.
7. Using a pipet, carefully collect 12 fractions of 1 mL each, starting from the top ofthe gradient. Alternatively, extract the visible band at the 35%: 5% sucrose inter-face with a syringe. Proteins localized to lipid rafts are usually recovered in thelow-density sucrose gradient fractions of two, three, and four (see Notes 7–9).
260 Landry and Xavier

8. Prepare aliquots for sodium dodecyl sulfate polyacrylamide gel analysis andseparate the proteins by electrophoresis. Transfer to a polyvinylidene difluoridemembrane. Identify proteins of interest by immunoblotting with antibodies accord-ing to manufacture’s directions (see Note 10).
3.2.1.2. DETERGENT-FREE ISOLATION OF LIPID RAFTS
Detergents have routinely been used to isolate lipid rafts over the pastseveral years, although questions have recently been raised surrounding thistechnique. It is thought by some that the extraction of lipid rafts with deter-gent may generate artificial clusters of lipid rafts that do not exist in vivo.The following is a list of three protocols that avoid the use of detergents,but care should be taken in deciding which protocol will best serve yourresearch needs.
3.2.1.3. LINEAR GRADIENT
Originally developed to isolate caveolae from cells or tissues, this protocoluses sonication to disrupt the cell membrane and was used to identify novel pro-teins associated with lipid rafts based on their unique buoyant density (28,30).The main advantage of this protocol is the purified lipid rafts obtained withoutthe use of harsh detergents. This purity, however, also results in low overallyields.
1. Wash four confluent 10-cm plates of cultured adherent cells (∼7–8 mg of totalprotein) with PBS. Remove PBS and scrape cells into Buffer A+. Transfer into a15-mL centrifuge tube.
2. Centrifuge cells (1000g for 5 min at 4°C) and resuspended in an additional 1 mLof Buffer A+.
3. Lyse cells with 10 strokes of a Dounce homogenizer using a tight-fitting pestle.4. Follow homogenization by shearing, passing lysates through a 23-gage needle
10 times.5. Centrifuge cells (1000g for 5 min at 4°C). Collect the supernatant and transfer to
a separate tube.6. Repeat lysing of the remaining pellet with 1 mL of additional Buffer A+. Lyse
cells with 10 strokes of a Dounce homogenizer using a tight-fitting pestle.7. Follow homogenization by shearing by passing lysates through a 23-gage needle
10 times.8. Centrifuge cells (1000g for 10 min at 4°C). Combine both cleared lysates.9. Carefully layer the combined lysates on top of 8 mL of 30% Percoll and cen-
trifuge for 30 min at 84,000g.10. A visible band should be seen one-third of the way down the gradient. Collect
band with a needle and syringe.11. Adjust total volume of the plasma membrane fraction to 2 mL with additional
Buffer A+.
Lipid Rafts in Cell–Cell Interactions 261

12. Sonicate fraction with six pulses at 50% duty cycle using a Branson Sonifier 250.Allow the sample to settle for 1 min. Repeat sonification two more times for atotal of 18 pulses.
13. Mix sonicate with 2 mL of Buffer A+ containing 50% OptiPrep. 14. Carefully layer an 8 mL OptiPrep gradient (10–20%) on top of the 25% sonicate
and centrifuge for 90 min at 52,000g.15. Isolate fractions of equal volume as above (see Subheading 3.2.1.1.) and deter-
mine the distribution of key lipid raft proteins via Western blotting.
3.2.1.4. SODIUM CARBONATE GRADIENT
The following is another detergent-free method of isolating lipid rafts thatpreserves the interactions between resident prenylated caveolin-associatedproteins while generating a purified population of caveolin-rich membranedomains; using this protocol, Song et al. (28,31) were first to identify novelinteractors of caveolin, including Ras. The main advantage of this protocol is itssimplicity; disadvantages include a long spin time and potentially significantcontamination of the isolated raft fraction with other membranes.
1. Wash two 10-cm plates of cultured adherent cells with PBS. Scrape cells andtransfer into a 15-mL centrifuge tube.
2. Centrifuge cells (800g for 5 min at 4°C) and resuspended in 2 mL of SCB+.3. Lyse cells with 20 strokes of a Dounce homogenizer using a tight fitting pestle. 4. Follow homogenization by shearing by passing lysates through a 23-gage needle
10 times.5. Sonicate lysate three times 15 s using a Branson Sonicator 250.6. Combine lysate with 2 mL of MES buffer containing 90% sucrose. Transfer mix-
ture to the bottom of a 12-mL centrifuge tube. 7. Carefully layer 4 mL of MES buffer containing 35% sucrose on top of previous
layer.8. Add an additional 4 mL of MES buffer containing 5% sucrose and centrifuge for
16 to 20 h at 175,000g.9. Take twelve 1-mL fractions and determine the distribution of key lipid raft proteins
via Western blotting.
3.2.1.5. OPTIPREP GRADIENT
Here, we outline a recent isolation method for the preparation of detergent-freelipid rafts where the lysis of cells by shearing in an isotonic buffer containingcalcium and magnesium yields a highly purified raft fraction and optimal proteinyield (28).
1. Wash four 10-cm plates of cultured adherent cells (∼7–8 mg of total protein) withPBS. Remove PBS and scrape into 3 mL of Base Buffer+. Transfer into a 15-mLcentrifuge tube.
2. Centrifuge cells (1000g for 5 min at 4°C) and resuspended in 1 mL of Base Buffer+.
262 Landry and Xavier

3. Lyse cells by passing through a 23-gage needle 10 times, being careful to avoid airbubbles.
4. Centrifuge cells (1000g for 10 min at 4°C). Transfer the cleared lysate to a sepa-rate tube.
5. Lyse the remaining pellet for a second time with 1 mL of additional Base Buffer+.6. Lyse cells by passing through a 23-gage needle 10 times, being careful to avoid air
bubbles.7. Centrifuge cells (1000g for 10 min at 4°C). Combine both cleared lysates.8. Add 2 mL of Base Buffer + 50% OptiPrep to the combined post-nuclear (now
25% OptiPrep) supernatants and place in the bottom of a 12-mL centrifuge tube.9. Carefully layer an 8 mL of OptiPrep gradient (0–20%) on top of the combined
lysates.10. Centrifuge for 90 min at 52,000g.11. After centrifugation, a diffuse band will appear one-third of the way down the
gradient and a distinct band will be apparent at the 2025% interface.12. Isolate 0.67-mL fractions as mentioned previously (see Subheading 3.2.1.1.) and
determine the distribution of key lipid raft proteins via Western blotting.
3.3. Useful Protocols for DIM Analysis
3.3.1. Protein Localization and Aggregation of Lipid Rafts
Lipid-enriched microdomains are principally composed of sphingolipids andcholesterol. The operational definition of rafts is solubility in cold detergentand the functional definition of lipid raft-dependent signaling has been tradi-tionally based on cholesterol depletion studies. However, cholesterol depletion,in addition to affecting lipid rafts structure, can also alter cellular processessuch as actin reorganization, receptor mediated signaling and endocytosis.Introducing fluorescent tags to proteins is a valuable way of assessing the sub-cellular distribution of proteins in response to receptor activation (32,33). Thispermits one to assess both the spatial and temporal aspects of protein expres-sion. Two different approaches have been used to identify lipid rafts in cellmembranes. One is to observe the random or directed motion of membranelipids and lipid-anchored proteins in the plane of a bilayer. This approach isuseful to identify the size of DIMs. Further microscopic probes can track mol-ecule mobility on the nanometer scale and following lipid raft associationinduced by ligand receptor interaction. The second approach is to measure theproximity of molecules in rafts by FRET. In addition, fluorescent lipid analogshave been used to define rafts in other lipid microdomains in cells in culture.
The use of fusion proteins, such as green fluorescent protein (GFP), allowsan investigator to examine protein distribution in live cells while avoiding thepotential artifacts of cell fixation and permeabilization. However, the concernsinclude the fact that GFP-tagged proteins are often expressed in levels higherthan the endogenous protein, and could have an effect on protein localization.
Lipid Rafts in Cell–Cell Interactions 263

Furthermore, the GFP tag is large, approx 27 kDa in size, and could interferewith tracking recruitment to microdomains. This is further compounded byGFP-dependent dimerization. Despite these limitations, fluorescent tags are avery useful approach to monitor lipid domain based signaling events. It isessential to ensure that the fluorescent-tagged protein co-localizes to the samecompartment as the endogenous protein. The availability of different fluores-cent proteins (yellow fluorescent protein and cyan fluorescent protein) allowstwo proteins to be tagged with distinct spectral variants. In these studies,expressed proteins are visualized before and after activation by digital imagingusing confocal and low light charge-coupled device (CCD) camera-basedmicroscopes. In addition to live imaging, cells can be visualized after fixationand staining with Cy3-labeled cholera toxin B-subunit.
Lipid rafts in the plasma membrane outer leaflet are enriched in sphin-golipids and cholesterol, but the exact lipid composition of the inner mem-brane raft is unknown. To determine the segregation and kinetics ofrecruitment of proteins to the outer and inner layer lipid enriched domains,Zacharias et al. generated fusion of GFP spectral variants linked to consensussequence of different lipids (34). In an elegant series of experiments, theauthors demonstrated that lipid acyl (myristoylated and palmitoylated) pro-teins were localized to the outer membrane, whereas proteins containing thegeranyl-geranyl tail were excluded from the outer lipid enriched caveolae. Infollow-up experiments the authors were able to recover the acylated proteinsfrom the DIM fraction. Zacharias found that premylated proteins were insen-sitive to cholesterol depletion, demonstrating that this approach is a valuabletool to monitor the differential recruitment of proteins to lipid enrichedmicrodomains (35).
The following is a protocol for a conjugation assay, which enables one toidentify physiological events that take place at the point of contact betweentwo cells, such as the site of the immune synapse between T-cells and antigen-presenting cells (APCs). It is also helpful to track the migration of variousproteins within the cells with the aid of GFP-tagged proteins or proteins stainedwith fluorescence antibodies. Here, we outline an experiment using Jurkat T-cells and a cultured Raji B-cell line loaded with staphylococcal enterotoxin E(SEE; Toxin Technology, Sarasota, FL) toxin to investigate the activity of pro-teins before, during, and after stimulation with TCR. It is important to keep inmind that the protocol can be easily adapted to other cells lines to best suit yourown specific research needs.
3.3.1.1. SLIDE PREPARATION
1. Encircle a dime-sized area on a glass microscope slide with a PAP Pen to definethe experimental area. Add approx 100 µL of 0.01% poly-L-lysine to center of the
264 Landry and Xavier

circle and incubate in a moist chamber for 30 min at RT. Wash the slides fourtimes with deionized (d)H2O before use.
3.3.1.2.CELL PREPARATION
1. Count cells and determine the total number needed for the experiment (see Note 11). 2. Resuspend the APC cells (∼1 × 10⁵ cells/50 µL; see Note 12).3. Resuspend the T-cells (∼1 × 10⁵ cells/50 µL; see Note 13).4. Mix the T-cells and APCs ± SEE in a 11 ratio and centrifuge briefly to ensure
proper conjugate formation.5. Incubate cell lines together for various time points at 37°C (see Note 14). 6. Resuspend the cell mixture well and spot 100 µL of on lysine-coated slides.
Incubate at RT for 10 min to allow complexes to adhere to the lysine. Carefullyaspirate media.
7. Check for conjugation efficiency under bright light microscopy.8. Fix the conjugates by adding approx 150 µL of 4% paraformaldehyde–0.1%
Tween-20 in PBS to the slide.9. Incubate the slides at RT for an additional 10 min.
10. Wash the slides twice in a large volume of PBS at RT for 10 min.11. Block the cells by adding approx 150 µL of 1% BSA in PBS and incubate for
30 min at RT.12. Dilute the primary antibody as recommended by manufacturer in a total volume
of 100 µL of PBS. Add antibody solution to slides and incubate for 1 h at RT orovernight at 4°C.
13. Wash cells twice in a large amount of PBS at RT for 10 min.14. Dilute the fluorescent-conjugated secondary antibody 15000 in 100 µL of PBS
and incubate for 1 h at RT (see Note 15).15. Wash cells twice in a large amount of PBS at RT for 10 min.16. Aspirate the majority of the PBS and add a small amount of VectaMount to the
cells. Add the cover slip and seal edges with nail polish to prevent the samplesfrom drying out.
17. Wait at least 30 min before viewing lipid raft aggregates and protein localizationunder the microscope (see Note 16).
18. Use confocal laser scanning microscopy to visualize lipid rafts in T-cell mem-branes before and after cross linking with anti-TCR.
3.3.2. Molecular Probes and Fluorescent Microscopy
Commercially available kits allow for convenient labeling and crosslinking oflipid rafts, such as Molecular Probe’s Vybrant Lipid Raft Labeling Kit, whichuses a fluorescent cholera toxin subunit B conjugate (in one of three colors toaccommodate multiple staining parameters) to selectively bind to the GM1proteins embedded with lipid rafts. An antibody specific for cholera toxin sub-unit B then crosslinks the labeled lipid rafts into distinct patches that are theneasily visualized by fluorescence microscopy. These kits allow an investigator to
Lipid Rafts in Cell–Cell Interactions 265

identify physiologically significant membrane proteins that associate with lipidrafts. Detailed instructions are included with each kit and can vary from onemanufacture to another; it is highly recommended that you familiarize yourselfwith the directions for the particular kit you will be using before starting yourexperiments. Another fluorescent microscopic technique uses changes in theemission spectrum of a bodipy sphingomyelin analog (C5 DMB-SM) to iden-tify where lipid probes concentrate within the plasma membrane. When theprobe becomes more concentrated, its emissions shifts from green to red; there-fore, the existence of lipid rafts would have been expected to lead to smallregions of red fluorescence superimposed on the green emission. Unfortunately,some studies have proven the ineffectiveness of this particular probe, wherewith low concentrations of C5 DMB-SM, the plasma membrane appearsentirely green, indicating the absence of highly concentrated sphingolipiddomains (36). On the other hand, it is entirely possible that the presence of thebodipy moiety on the end of a shortened acyl chain of this sphingolipids ana-logue creates a bulky probe that does not pack well into the ordered environ-ment suggested for lipid rafts (37). In an attempt to circumvent such technicallimitations, Kuerschner et al. recently has devised a method of labeling lipidsfor fluorescent microscopy that closely mimics the natural conformation (38).This new reporter lipid is a product of a modified Wittig olefination reaction andconsists of five conjugated double bonds in the long chain of the fatty acid andhas excitation and emission wavelengths of 350 nm and 470 nm, respectively.This molecule is also able to incorporate into the structure of membrane lipidssuch as sphingomyelin and have been shown to have no drastic effects on thephase behavior, making it ideal for in vivo studies (39).
3.3.3. Immunoisolation of Proteins Associated With Lipid Rafts
An elegant approach to isolate raft-associated proteins was first put forwardby Harder et al. (9). Here, DIM fractions from unstimulated and stimulatedJurkat cells were coupled with magnetic beads coated in specific antibodies.The proteins are isolated with a magnet and the raft-associated proteins withinthe resulting lysates were identified via immunoblotting. This protocol is pre-sented as a technique for isolating lipid rafts in lymphocytes and it can beeasily modified for other cell–cell interactions. The interested reader is alsoreferred to Harder et al. for more detailed information (9).
3.3.3.1. COATING THE DYNABEADS
1. Determine the number of cells needed. Aliquot half that number of M-450 goat-anti-mouse Dynabeads into a sterile microcentrifuge tube (see Note 17).
2. Collect beads on an MPC magnet for 1 min. Remove the supernatant and washthe beads twice by resuspending in 1 mL of serum-containing media.
266 Landry and Xavier

3. Resuspend in 1 mL serum-containing media + 50 mM HEPES buffer for up to 4 × 10⁸ beads.
4. Add anti-CD3 and anti-transferrin receptor antibodies at 2 µg per 107 beads andincubate for 1 h at RT on a rotating wheel.
5. Collect the beads on the magnet and remove supernatant.6. Wash the beads twice by resuspending in 1 mL of serum-containing media.7. Resuspend the beads at a concentration of 4 × 10⁸ beads per milliliter in serum-
containing media + 50 mM HEPES buffer.
3.3.3.2. ISOLATION OF TCR COMPLEXES
1. Collect the number of cells needed for the experiment by centrifugation (∼1–2 ×10⁷ cells per data point).
2. Resuspend the cells in 1 mL of serum-containing media + 50 mM HEPES bufferper data point and pellet in a microcentrifuge tube. Loosen the cell pellet bygently flicking the tube.
3. Add the antibody-coated Dynalbeads at a ratio of 12 (e.g., 0.5 × 10⁷ beads:1 × 10⁷
cells), mix well, and rotate on a lab wheel for 5 to 10 min.4. Transfer samples to a 37°C water bath for the desired time points.5. Add 1 mL of ice-cold HB buffer to stop reaction, and pellet cells in a refrigerated
microcentrifuge tube for 2 min at 800g.
3.3.3.3. DISRUPTION OF CELLS
1. Harder et al. use a nitrogen cavitation procedure to disrupt the cell sample; formore information, the interested reader is referred to Harder and Kuhn. (9).
3.3.3.4. SAMPLE PREPARATION
1. Collect the beads with the magnet for 5 min, on ice. 2. Aspirate supernatant and wash samples twice by resuspending in 1 mL of ice-
cold HB buffer.3. Resuspend beads in 1 mL of HB + buffer and transfer to microcentrifuge tubes.4. Retrieve beads magnetically and remove supernatant.5. Add an appropriate amount of 2X Laemmeli sample buffer to the beads and heat
samples for 5 min at 95°C.6. Separate proteins by electrophoresis and transfer onto a polyvinylidene difluoride
membrane. Identify proteins of interest by immunoblotting.
3.3.4. Electron Microscopy
In contrast with light microscopy, EM can only provide a snap shot of the cellat one particular time. The resolution of EM, however, is much greater thanlight microscopy, and particulate markers can provide the means to quantita-tively study lipid raft organization at the molecular level (40). Recently, Prioret al. (41) developed a novel methodology to examine lipid raft markers on theinner leaflet of the plasma membrane using a combination of EM studies and
Lipid Rafts in Cell–Cell Interactions 267

statistical analysis to screen proteins associated with, and colocalizing within,lipid rafts. This approach has potential to further examine plasma membraneorganization and the spatial dynamics of regulated signaling and membrane traf-ficking events associated with the cell surface. However, it is important to keepin mind that there are limitations with this method; labeling methods for electronmicroscopy are often harsh and can damage delicate cellular ultrastructures anddisrupt lipid organization.
3.3.4.1. PREPARING ANTIBODY-CONJUGATED COLLODIAL GOLD
Immunogold electron microscopy allows one to directly visualize membrane-anchored proteins at high resolution. It has been used to determine the sizeand distribution of lipid rafts, to monitor colocalization, and to observe Rassignaling domains (41). Briefly, plasma membranes are fixed, labeled withgold-conjugated antibodies, and viewed on a transmission electron microscope.Once the x,y coordinates are extracted from the images, Ripley’s K function isused to determine whether the observed gold pattern is random or clusteredinto lipid rafts. A modification of the K-function also can be used to measurethe co-localization of two proteins, each labeled with a different-sized goldparticle (i.e., 2 nm and 5 nm).
1. Heat 40 mL of the reducing solution and 10 mL of Gold Solution to 60°C andcombine, stirring vigorously. Boil for 5 min (the solution will turn a deep redonce colloids form).
2. Cool the solution on ice and adjust the pH to 8.5 with 5 N NaOH using pH paper.3. Identify the optimal antibody concentration by adding 0 to 5 µg of the affinity-
purified antibody of interest (diluted in a total volume of 20 µL) to 250 µL of thegold colloid solution made in the previous two steps. Incubate at RT for 5 min.
4. Add 100 µL of 10% NaCl. Titrate for the smallest amount of antibody that stabi-lizes the gold (where no color change occurs).
5. Incubate this gold-antibody solution for 10 min at RT.6. Add 10% BSA to a final concentration of 0.1%.7. To concentrate gold and remove unbound antibody, centrifuge at 120,000g for
2–3 nm gold or 100,000g for 5 nm gold for 1 h at 4°C.8. Collect the loose portion of the pellet and store at 4°C.
3.3.4.2. PREPARING PLASMA MEMBRANE SHEETS
1. Incubate pioloform-coated grids with 1 mg/mL poly-l-lysine for 10 min. Wash twicein 1 mL of distilled water for 1 min. Air-dry and store in a dust-free container.
2. Culture cells on 10-mm glass cover slips as below (fluorescence recovery afterphotobleaching (FRAP) assay protocol); wash cells with PBS to remove cellulardebris.
3. Place groups of poly-l-lysine-coated grids onto filter paper with the coated sidefacing up.
268 Landry and Xavier

4. Remove cover slip from culture dish and remove excess solution by touching theedge of the cover slip to the filter paper. Place the cover slip face down on the grids.
5. Place filter paper on top of the cover slip and press down using a silicone bung for1 to 2 s.
6. Remove the filter paper and turn the cover slip over so the grids are on top.7. Carefully add 1X KOAc buffer around the grids until they float up onto the top of
the drop.8. Wash the grids by transferring them to new drops of 1X KOAc buffer on Parafilm.9. Fix for 15 min with fixative. Wash twice by transferring the grids to fresh drops
of PBS for 1 min each.10. Quench free aldehyde groups with 25 mM glycine for 10 min.11. Block for 10 min with blocking solution to prevent the antibodies from binding to
nonspecific sites.12. Centrifuge the gold-conjugated antibody at maximum speed in a microcentrifuge
for 2 min and dilute in additional blocking solution. Float the grids on top ofdrops of the diluted antibody for 30 min.
13. Wash the labeled grids with blocking solution five times for 4 min each.14. Wash the grids with dH2O five times for 2 min.15. Incubate the grids in a mixture of nine parts 2% methyl cellulose and one part 3%
uranyl acetate for 10 min on ice.16. Pick up the grids in 5-mm wire loops, drain the excess solution on filter paper, and
leave to dry in the loops for 10 min.
3.3.4.3. IMAGING AND ANALYSIS
1. Using a transmission electron micrograh, scan plasma membrane sheets at lowmagnification (×4–6000), adjusting field brightness to maximize the contrastbetween the plasma membrane and background; take micrographs at higher magni-fication (×20,000).
2. Scan negatives at 1 in. width, 1500 dpi resolution, and 8-bit depth using the imag-ing software program, and save files as TIFF formats.
3. Using Adobe® Photoshop® or a similar software program, select an area of thenegative approx 800 × 800 pixels and paste into a new file.
4. Remove the background from the image using the curves and brightness/contrasttools. Save as a new TIFF file.
3.3.4.4. CALIBRATION AND ANALYSIS
1. Identify from an area containing 200 to 400 gold particles; open the file usingImage J software or other similar program.
2. Set the image’s threshold between 0 and 170.3. Modify “set measurements” to record center of mass to eight decimal places.4. Modify “analyze particles” to count the number of gold particles at different sizes
from a minimum of 2 pixels to a maximum of 75 pixels for 5 nm of gold.5. Record the number of particles after each step and repeat the threshold adjustments.
Lipid Rafts in Cell–Cell Interactions 269

6. Modify “analyze particles” to locate the center of mass of all gold particles withinthe required pixel range to eight decimal places. Save as a text file.
7. Using Microsoft Excel®, convert the coordinates from pixels (the units generatedin the previous step) into nanometers (the conversion factor is determined by thescale bar included with each micrograph or from images of calibrating spheres).
8. At this point, the x,y data points can be entered into any commercially availableK-function analysis program to assess protein colocalization; for a more in-depthanalysis protocol, the interested reader is referred to Prior (41).
3.4. Biophysical Analysis
Because lipid rafts are less than 50 nm in size, it is impossible to visualizeindividual rafts on standard fluorescent microscopes. However, various meth-ods exist that can detect lipid raft aggregates and associated proteins, and thesewill be explained in detail below. Such experiments provide important informa-tion regarding the colocalization of lipid rafts with raft proteins (localized andexcluded) and should be used to confirm biochemical data based on detergentinsolubility. However, it is essential to keep in mind that not all microscopicevidence clearly supports the theory of lipid rafts. Recently, Glebov and Nicholsused FRET analysis to measure the proximity of two different GPI-anchoredfluorescent proteins in T-cells. The signal they detected was density-dependent,cholesterol-independent, and similar to data from non-raft proteins, suggestingthat resting T-cells do not contain lipid rafts (42). These findings strengthenwork previously performed by Kenworthy and Edidin, who found diffusedistribution, and hence little evidence of clustering, of overexpressed 5′ nucleoti-dase, a GPI-anchored protein, in polarized MDCK cells; this suggests that thisprotein is randomly dispersed across the apical plasma membrane and is notfound in organized clusters as would be expected with lipid rafts (43). It is pos-sible, however, that these cells do in fact contain lipid rafts but these rafts aresmaller than originally thought (<10 nm in diameter), and contain very few GPI-anchored proteins, making it doubtful that any one raft would contain both theFRET donor and acceptor proteins (44). With these points in mind, it is essen-tial that all biophysical experiments performed on lipid rafts contain properpositive and negative controls to best analyze ensuing data.
3.4.1. Fluorescence Resonance Energy Transfer
FRET detects the energy transfer between two molecules only a few nanome-ters apart and is a powerful technique that can be used to identify intermolecularinteractions within living cells. Energy transfer from an excited donor fluorophoremolecule to an acceptor fluorophore results in quenching of the donor channelsignal and an increase in the acceptor signal; because FRET only occurs betweenmolecules in very close proximity; it is an excellent technique to study clustering
270 Landry and Xavier

and co-association of fluorescently-tagged proteins (45–47) and, although promis-ing, it must be stressed that the absence of interactions is not always indicative ofthe lack of interaction. Steric constraints between the donor and acceptor couldresult in a false-positive result (44). Summarized herein is a simplified outline toFRET assays; for a more in-depth exploration of the theory behind this technique,please refer to the excellent reviews by Gordon (45) and Herman (47).
3.4.1.1. SAMPLE PREPARATION
1. Plate 293 human embryonic kidney cells onto glass cover slips in suitable grow-ing media. Incubate cells at 37°C with 5% CO2 until the cells are approx 50%confluent.
2. Transfect 1 to 2 µg of plasmid DNA into the cells using a lipid-based deliverysystem, such as TransFection (Bio-Rad). Overexpressed fluorescent signals can bevisualized between 6 and 24 h after transfection.
3. If staining for endogenous or nonfluorescent ove-expressed proteins, wash cells inPBS and choose appropriate donor–acceptor antibody concentrations for labeling(i.e., fluorescein isothiocyanate, Cy3, or Cy5). Typical donor–acceptor molarratios range from 11 to 15. Normal serum from the secondary antibody hostdiluted in PBS should be used as a blocking agent.
4. Prepare the primary antibody in blocking reagent and incubate according to man-ufacture’s instructions (see Note 18).
3.4.1.2. CELL FIXATION AND MOUNTING
1. Wash cells in a large volume of PBS to remove all traces of serum which couldinterfere with antibody binding.
2. Fix cells in 4% PFA for 30 min at RT.3. Wash cells twice with additional PBS after fixation.4. To decrease autofluorescence, incubate the cells with 1 mg/mL NaBH4 for 5 min.5. Wash cells in PBS. Aspirate most of the excess fluid from the cover slip, and add
a drop of Vectashield directly onto the cells.6. Cover and seal the edges with nail polish to prevent the samples from drying out.
Store at 4°C if not viewed on a confocal laser scanning microscope immediately.
3.4.1.3. IMAGING PARAMETERS AND DATA ACQUISITION
FRET is detected by exciting labeled specimens with light at a correspond-ing wavelength to the absorption spectrum of the donor and detecting lightemitted at the wavelength corresponding to the absorption spectrum of theacceptor (45). Energy transfer between the two proteins of interest is visible byboth the quenching the donor fluorescence signal in the presence of the accep-tor and in the sensitized emission spectrum of the acceptor.
1. Three individual samples of each specimen must be prepared to collect FRET mea-surements. Cells containing only the signal from the donor (d); cells containing
Lipid Rafts in Cell–Cell Interactions 271

only the signal from the acceptor (a); and cells containing signals from both donorand acceptor (f). Each sample is imaged with a donor filter set (D); an acceptorfilter set (A), and a FRET filter set (F). This approach will identify the FRETsignal that results from energy transfer that has been transferred from the donor toacceptor molecules while reducing signal bleeding and crosstalk (47).
2. Exposure time, light intensity, and camera settings for each of the filter sets, orimaging pathways, are determined by scanning a representative area of d with D,a with A, and f with F.
3. Once the imaging parameters are determined for each filter set, they must not bealtered during data acquisition. Computer macros can be used to automate acqui-sition once the parameters are set.
4. Collect at least 10 fields for every specimen with each of the three filter sets.
3.4.1.4. QUANTIFICATION AND ANALYSIS
1. Identify regions on the cover slip that are not covered in cells (background) andcalculate the average fluorescence signal from this area.
2. Identify signals emitted from the cells (foreground) and calculate average fluo-rescence signal from these areas.
3. Normalize results by subtracting background signals from foreground signals foreach FRET measurement.
3.4.2. FRAP Analysis
FRAP is an important technique used to measure the diffusion mobility ofmembrane components labeled with fluorophores, fluorescent antibodies, orGFP fusion proteins. In FRAP assays, a short pulse of intense laser light irre-versibly destroys (photobleaches) fluorescence in a defined area of the cell.Recovery of fluorescence into the photobleached area occurs as a result of dif-fusional exchange between bleached and unbleached molecules. This techniqueis useful in the study of the dynamics of signaling molecules in Jurkat cellsafter lipid raft activation as described by Tanimura et al. (46).
3.4.2.1. BEAD PREPARATION
1. Wash 1 × 10⁷ Polybead polystyrene beads (6.0 µm in diameter) with 1 mL ofPBS and resuspend in a final volume of 1 mL of PBS. Add 10 µg of the purifiedantibody to the beads. Poly-l-lysine-coated beads can be used as a negative con-trol in these experiments.
2. Incubate beadantibody mixture at RT for 90 min on a rotating wheel.3. Centrifuge in a microcentrifuge at maximum speed for 30 s.4. Remove supernatant and discard. Wash the beads three additional times with PBS.5. Add 1 mL of blocking solution to the beads and incubate at RT for 30 min on a
rotating wheel.6. Centrifuge in a microcentrifuge at maximum speed for 30 s.7. Remove supernatant and discard. Wash the beads three additional times with PBS.8. Resuspend the coated beads in 1 mL of PBS and store at 4°C for up to 3 wk.
272 Landry and Xavier

3.4.2.2. CONJUGATE FORMATION
1. The cells used in these experiments will need to express a GFP fusion protein.Both stable cell lines and transiently transfected cells can be used.
2. Determine the number of cells needed for the experiment. Harvest by centrifuga-tion and wash once in 10 mLof serum-free media.
3. Resuspend the cells in media at a concentration of 1 × 10⁷ cells per milliliter andtransfer 10 µL of the cell suspension (1 × 10⁵ cells) to a microcentrifuge tube.
4. Add 10 µL of antibody-coated beads in PBS (1 × 10⁵ beads for a 11 cellbeadratio) and mix.
5. Incubate the cellbead mixture at 37°C for 20 min.
3.4.2.3. SAMPLE PREPARATION FOR FRAP
1. During the cellbead conjugate incubation (above), encircle a dime-sized area ona glass microscope slide with a PAP Pen.
2. Add 3 µL of the cellbead mixture into the center of the circle and place a coverslip on top. Seal edges with nail polish to prevent the media from evaporating.
3.4.2.4. FRAP ASSAY
FRAP assays are conducted at RT using a confocal microscope with a ×63objective lens and the 488-nm line of a 25-mW Argon laser. Before data col-lection can begin, it is necessary to determine how often the bleaching processshould be performed with full laser power to reduce the fluorescence in theregion of interest to background levels. It is also important to perform prelimi-nary experiments to determine how long recovery of fluorescence takes toreach a plateau after bleaching. A whole cell scan at low laser power (75%power, 10% transmission) before the bleach and photobleach the cell with fulllaser power (100% power, 100% transmission) 40 times (2 s) is a recommendedstarting point. Recovery is followed after 2 s with low-laser power at 2-s inter-vals for 30 s, at 10-s intervals for 120 s, and then 60-s intervals for 6 min.
1. Place the sample on the stage and the scan slide to detect a cell of interest atimaging laser intensity.
2. Define the region of interest for the photobleach with an area of approx 1 µm ×1 µm for bleaching. Program the computer’s software to automatically change set-tings quickly for the photobleaching routine. It should record the image of the cellbefore photobleaching, execute the bleach, and record an image after the photo-bleaching and throughout the recovery.
3. Begin the FRAP cycle by executing the program and monitor recovery on the screen.4. Check the cell during and after completion of the FRAP cycle to ensure that the
region of interest has not changed.5. Save the image as an image database file and calculate fluorescent intensities in
the region of interest for the bleached region (Ib) and a nonbleached region (Ir) foreach time point.
Lipid Rafts in Cell–Cell Interactions 273
6. Calculate the relative intensity (rI) for each time point: rI(t) = Ib(t) – Ir(t)7. Calculate the percentage recovery as follows: % recovery = [rI(t) – rI(post)/rI(pre) –
rI(post)], where rI(pre) = initial (prebleach) relative intensity; rI(post) = post-bleachrelative intensity; rI(t) = relative intensity at each time point.
8. Draw a FRAP curve using a calculation software, such as Microsoft Excel (% recov-ery vs time in min (see Note 19).
3.4.3. Proteomics
Proteomics, the large-scale study of the protein complement of a given cell,has proven to be an invaluable technique in the identification of novel proteinsassociated with lipid rafts. von Haller et al. were the one of the first to use MSto identify proteins that co-purified with DIM fractions of T-cells and found thatthe proteins identified in the screen essentially fell into one of two categories:cytoskeletal proteins and proteins involved in signal transduction (48). Sincethen, proteome analysis has offered evidence that several additional classes ofproteins associate with DIM fractions isolated from stimulated T-cells (celladhesion, heat shock, and GTP-binding proteins [49,50]). Foster et al. (51) havetaken this approach one step further by classifying proteins as “raft” proteins or“raft-associated” proteins based on biochemical properties such as their sus-ceptibility to cholesterol depletion and detergent solubilization. This screenuses stable isotope encoding to add a functional dimension that significantlyimproves specificity of the data, providing strong evidence that their groupingsare real and are not statistical artifacts (51). Stable isotope labeling by amino acidsin cell culture (SILAC) entails the addition of labeled, essential amino acids toamino acid-deficient cell culture media; these labeled amino acids are incorpo-rated into all newly synthesized proteins, or “encoded into the proteome” (52).The advantages of this technique include the fact that no chemical labeling oraffinity purification is required, and the method is convenient and inexpensive toperform on a large scale. This method also allows investigators to identify largenumbers of proteins from a single experiment in an unbiased manner.
3.4.3.1. SILAC
1. Culture cells in leucine-deficient media. Supplement one population with normalisotopic abundance L-Leucine (Leu, 105 mg/L) and the other with 99% isotropicabundance L-Leucine-5,5,5-D3 (LeuD3; 107.5 mg/L).
2. Passage cells three times for a minimum of seven population doublings.
3.4.3.2. CHOLESTEROL DEPLETION AND ISOLATION
OF DETERGENT-RESISTANT FRACTIONS
1. Serum-starve 10-cm plates of each cell population (Leu, LeuD3) for 18 h beforecholesterol depletion.
274 Landry and Xavier

2. Disrupt membrane cholesterol in one population (Leu) of cells with 10 mMMβCD for 30 min at 37°C (see Subheading 3.1.2.1.). Treat the second populationof cells (LeuD3) with a carrier control only (see Note 20).
3. Lyse Leu, LeuD3 cells for 1 h at 4°C in MBS lysis buffer.4. Clear lysates by centrifuging at 10,000g for 10 min at 4°C.5. Determine protein concentration of each sample using a commercially available kit.6. Equal amounts of protein from the Leu (treated) and LeuD3 (untreated) cell pop-
ulations were combined and mixed with an equal volume of 90% sucrose in MBSfor a final concentration of 45%.
7. Transfer the solution to the bottom of an ultracentrifuge tube. Carefully add addi-tional layers of 35 and 5% sucrose on top.
8. Balance the tubes to within 0.01 g and place them in the rotor. Centrifuge samplesfor 16 h at 200,000g at 4°C.
9. Extract the low-density band (at ∼18% sucrose) with a needle and syringe. Dilutethe band with four volumes of additional MBS. Centrifuge samples for an addi-tional 2 h at 200,000g at 4°C to pellet the detergent-resistant material.
3.4.3.3. HIGH-PERFORMANCE LIQUID CHROMATOGRAPHY AND TANDEM MS
1. Solubilize the pellet from the second centrifugation step in a small volume of 6 Murea/2 M thiourea (in 10 mM HEPES, pH 8.0). Precipitate proteins by diluting infive volumes of absolute ethanol. Adjust to 50 mM sodium acetate with a 2.5 Mstock solution, pH 5.0.
2. Allow the solution to stand at RT for 2 h. Centrifuge at 12,000g for 10 min at RT.3. Resolubilize the pellet in additional urea/thiourea. Reduce the solution by adding
1 µg of DTT per 50 µg of estimated total protein. Incubate for 30 min at RT. 4. Alkylate the solution by adding 5 µg of iodoacetamide per 50 µg of estimated
total protein. Incubate for 30 min at RT. 5. Digest the solution by adding 1 µg of LysC per 50 µg of estimated total protein.
Incubate for 3 h at RT. 6. Dilute the sample in four volumes of 50 mM NH4HCO3. Digest with 1 µg of
trypsin per 50 µL of estimated total protein. Incubate for 12 h at RT.7. Prepare the stop and go extraction (STAGE) tips by punching out small disks of
C18 Empore filters using a 22-gage flat syringe and plugging the disks into P200pipet tips.
8. Equilibrate column by forcing approx 100 µL of methanol through the Emporedisk with a syringe fitted to the end of the pipet tip.
9. Remove any remaining organic solvent in the column by forcing a small volumeof 0.5% acetic acid through twice.
10. De-salt peptide mixture with the STAGE tips and bomb-load onto reverse-phaseanalytical columns for liquid chromatography (LC). Elute peptides from thecolumns with three-step linear 2.5-h gradients running from 5.6 to 64% acetoni-trile and sprayed directly into the orifice of a MS.
11. Identify peptides by LC/MS/MS by information-dependent acquisition of frag-mented spectra for multiply charged peptides.
Lipid Rafts in Cell–Cell Interactions 275

12. Search acquired proteins against a known database, such as the Human Interna-tional Protein Index database (http://www.ensembl.org/IPI/), using MASCOT(Matrix Science, London, UK, http://www.matrixscience.com).
3.4.4. Flow Cytometry
Gombos et al. (53) recently outlined a novel flow cytometry based assaythat characterizes surface proteins and raft association by utilizing two definingcharacteristics of lipid rafts, cholesterol dependency, and detergent resistance.Here, the authors stained specific surface protein and compared treated anduntreated groups (MβCD, nonionic detergent, or both); raft-associated proteinswill be significantly affected by cholesterol depletion and/or detergent solubi-lization show dramatic differences in fluorescence in treated groups versusuntreated groups. Raft-independent proteins will not be affected by cholesteroldepletion and/or detergent solubilization and will therefore show very little dif-ference between treated and untreated groups. This method is easy to performand allows for rapid screening of multiple surface proteins.
1. Count and pellet cells by centrifugation (see Note 21).2. Divide the total number of cells into two populations. Treat one half of the cells
with MβCD to disrupt cholesterol in the plasma membrane (see Subheading3.1.2.1.). The remaining (untreated) cells will serve as a control population forcholesterol dependence.
3. Divide both MβCD-treated and untreated cell populations into half again. Treatone half of the cells with either 0.5% Triton X-100 or NP-40 for 5 min on ice.Wash with PBS. The remaining cells will serve as a control population for deter-gent sensitivity.
4. Label all cells with fluorescent antibodies specific against surface markers (seeNotes 22 and 23).
5. Collect the following data for each sample on a flow cytometer:Forward scatter (FSC) and Side scatter (SSC).Fluorescence intensity (FL1, FL2, or FL3 histograms, depending on the color ofthe antibody).
6. Analyze FACS data by using the following histograms:Autofluorescence of untreated, unlabeled cells (background) (FLBg).Fluorescence of labeled, untreated cells, proportional to total protein expression(FLMax).Autofluorescence of detergent-treated, unlabeled cells (FLBg-Det).Fluorescence of cells treated after detergent for 5 min (FLDet).Calculate the extent of detergent resistance (FCDR) as follows: FCDR = (FLDet –FLBg-Det) / (FLMax – FLBg).
The closer the FCDR value is to 1, the less soluble a given protein is in thedetergent. Likewise, a low FCDR value is indicative of a highly-soluble protein.
276 Landry and Xavier

A significant decrease in the FCDR value after cholesterol depletion (lipidraft disruption) indicates that the observed resistance is a result mainly due tolocalization of the protein in lipid rafts.
When a high FCDR value does not change significantly after MßCD treat-ment, it can be assumed that the protein does not bind directly to lipid rafts(e.g. cytoskeletal anchorage only).
4. Notes1. Both cultured cell lines and primary cells can be used in stimulation experiments.
As with all experiments, experimental design is critical, and the inclusion of a neg-ative control (unstimulated cells) is essential. Start with a minimum of 1 × 10⁶
cells per sample. 2. Try 0, 1, 2, 5, 10, and 15 min; if the number of cells is limited, select the critical
time points.3. The use of positive and negative controls is recommended strongly. For example,
Src family kinases that are palmitoylated do not associate with DIMs after thedepletion of cholesterol.
4. Cyclodextrins also can remove other lipid components from membranes; there-fore, it is useful to check that any effects can be reversed by using cholesterol-loaded cyclodextrin carrier to deliver cholesterol back to cells.
5. Not all lipid rafts appear to be equally sensitive to the depletion of cholesterol.Recent studies have suggested that the depletion of cholesterol reduces lateralmobility of membrane proteins because it disrupts the highly regulated interac-tions of PIP2 with molecules controlling actin cytoskeleton (54).
6. It is essential that while extracting proteins associated with DIM fractions that allreagents and buffers be kept at 4°C and the experiments themselves be carriedout on ice or in a cold room. It has been shown that the DIM fractions them-selves can be lysed by detergents at higher temperatures.
7. Milder detergents such as the Brij family of detergents produce larger raft frac-tions, whereas 1% Triton X-100 produces less buoyant fractions containing lessthan 50% of the typical raft molecules and only a few nonpalmitoylated trans-membrane proteins.
8. If two proteins that reside in the same membrane float to different densities duringDIM preparation it can be concluded that they had different lipid environmentsbefore detergent extraction.
9. Regardless of the conditions for detergent treatment, a completely soluble mem-brane protein localized to the same membrane as the protein of interest should beincluded in the analysis.
10. For a comprehensive list of proteins associated with DIM fractions from T-cells,please refer to Razzaq et al. (55); such proteins can be used as markers for cellbiological studies.
11. Both cultured cell lines and primary cells can be used in conjugation assays. In theexample given here, Jurkat T-cells are conjugated to SEE-loaded B-cells to investigate
Lipid Rafts in Cell–Cell Interactions 277

the effects of TCR stimulation. This protocol, however, can easily be adapted to othercell systems. An important consideration for these particular experiments is the useof a negative control (Raji B-cells without SEE).
12. To prepare the APC cell population, use 1 × 10⁶ cells per sample. Significant cellloss will occur through subsequent washing steps. Aliquot the cells needed forthe negative control and set aside. Resuspend the remaining cells in 500 µL ofmedia + 5 µg/mL (SEE) and incubate at 37°C for 30 min. Resuspend the twocell populations in 50 µL per sample and keep cells on ice.
13. Count the cells needed for the T-cell population (∼5 × 10⁵ cells/50 µL) and pellet.Wash once in additional media and resuspend for a final cell count of 1 × 10⁵
cells/50 µL. Keep on ice.14. The time points used in conjugation assays depend on whether the protein of
interest migrates early after activation or not. When in doubt, begin with varioustime points, such as 0, 1, 2, 5, 10, and 15 min.
15. Fluorescence antibodies are sensitive to light. The signal fades as a result (photo-bleaching). Be sure to keep slides covered from this point onward
16. For a detailed discussion on conjugate quantification, see Burack et al. (24).17. Use 1 × 10⁶ cells per sample. Before working with Dynalbeads, read the literature
provided with the reagents and become familiarized with the technical aspects ofthe beads.
18. If cytoplasmic labeling is required, permeablize the plasma membrane to allowantibodies into the cell; 100% methanol at –20°C or 0.1% Triton X-100 at 4°C areboth effective techniques.
19. For an excellent review that explains how to interpret FRAP data, see Sprague (56).20. Total cholesterol content can be measured from a 10-µg aliquot using Amplex
red kit (Molecular Probes), according to the manufacturer’s instructions.21. Approximately 1 × 10⁶ cells per sample will be needed.22. It is important to include proper positive and negative controls in the FACS analy-
sis. In addition to any other proteins of interest, stain cells for GM1 or CD48 aspositive controls (both markers are raft residents) and CD2 or CD71 as a negativecontrol (both markers are excluded from lipid rafts).
23. For an excellent protocol on FACS sample preparation and analysis, see Vacchioand Shores (57).
References1. Horejsi, V. (2005) Lipid rafts and their roles in T-cell activation. Microbes Infect.
7, 310–316.2. Mayor, S. and Rao, M. (2004) Rafts: scale-dependent, active lipid organization at
the cell surface. Traffic 5, 231–240.3. Mukherjee, S. and Maxfield, F. R. (2004) Membrane domains. Annu. Rev. Cell
Dev. Biol. 20, 839–66.4. Rajendran, L. and Simons, K. (2005) Lipid rafts and membrane dynamics. J. Cell
Sci. 118, 1099–1102.
278 Landry and Xavier

5. Demetriou, M., Granovsky, M., Quaggin, S., and Dennis, J. W. (2001) Negativeregulation of T-cell activation and autoimmunity by Mgat5 N-glycosylation. Nature409, 733–739.
6. Sillence, D. J. (2001) Apoptosis and signalling in acid sphingomyelinase deficientcells. BMC Cell Biol. 2, 24.
7. Watzke, A., Brunsveld, L., Durek, T., et al. (2005) Chemical biology of proteinlipidation: semi-synthesis and structure elucidation of prenylated RabGTPases.Org. Biomol. Chem. 7, 1157–1164.
8. van’t Hof., W. and Resh, M.D. (1999) Dual Fatty Acylation of p59Fyn is requiredfor association with the T-cell receptor z chain through phosphotyrosine-Srchomology domain-2 interactions. J. Cell Biol. 145, 277–389.
9. Harder, T. and Khun, M. (2001) Immunoisolation of TCR signaling complexesfrom Jurkat T leukemic cells. SciSTKE 71, pI1–pI18.
10. Thomas, S., Preda-Pais, A., Casares, S., and Brumeanu, T. D. (2004) Analysis oflipid rafts in T-cells. Mol. Immunol. 41, 399–409.
11. Parton, R. G. and Hancock, J. F. (2004) Lipid rafts and plasma membrane micro-organization: insights from Ras. Trends Cell Biol. 14, 141–147.
12. Paladino, S., Sarnataro, D., Pillich, R., Tivodar, S., Nitsch, L., and Zurzolo, C.(2004) Protein oligomerization modulates raft partitioning and apical sorting ofGPI-anchored proteins. J. Cell Biol. 167, 699–709.
13. Harder, T. and Kuhn, M. (2000) Selective accumulation of raft-associated membraneprotein LAT in T-cell receptor signaling assemblies. J. Cell Biol. 151, 199–207.
14. Simons, K. and Vaz, W. L. (2004) Model systems, lipid rafts, and cell membranes.Annu. Rev. Biophys. Biomol. Struct. 33, 269–295.
15. Lafont, F., Abrami, L., and van der Goot, F. G. (2004) Bacterial subversion oflipid rafts. Curr. Opin. Microbiol. 7, 4–10.
16. Harder, T. (2004) Lipid raft domains and protein networks in T-cell receptor signaltransduction. Curr. Opin. Immunol. 16, 353–359.
17. Golub, T., Wacha, S., and Caroni, P. (2004) Spatial and temporal control of signal-ing through lipid rafts. Curr. Opin. Neurobiol. 14, 542–550.
18. Krishnan, S., Nambiar, M. P., Warke, V. G., et al. (2004) Alterations in lipid raftcomposition and dynamics contribute to abnormal T-cell responses in systemiclupus erythematosus. J. Immunol. 172, 7821–7831.
19. Aridor, M. and Hanna, L. A. (2000) Traffic jam: a compendium of human diseasesthat affect intracellular transport processes. Traffic 1, 836–851.
20. Pagano, R. E., Puri, V., Dominguez, M., and Marks, D. L. (2000) Membrane traf-fic in sphingolipid storage diseases. Traffic 1, 807–815.
21. Simons, K. and Ehehalt, R. (2002) Cholesterol, lipid rafts, and disease. J. Clin.Invest. 110, 597–603.
22. Henderson, R. M., Edwardson, J. M., Geisse, N. A., and Saslowsky, D. E. (2004)Lipid rafts: feeling is believing. News Physiol. Sci. 19, 39–43.
23. Horejsi, V. (2003) The roles of membrane microdomains (rafts) in T-cell activation.Immunol. Rev. 191, 148–164.
Lipid Rafts in Cell–Cell Interactions 279

24. Burack, W. R., Lee, K. H., Holdorf, A. D., Dustin, M. L., and Shaw, A. S. (2002)Cutting edge: quantitative imaging of raft accumulation in the immunologicalsynapse. J. Immunol. 169, 2837–2841.
25. Maine, G. N. and Mule, J. J. (2002) Making room for T-cells. J. Clin. Invest. 110,157–159.
26. He, H. T., Lellouch, A., and Didier, M. (2005) Lipid rafts and the initiation of T-cell receptor signaling. Semin. Immunol. 17, 23–33.
27. Drevot, P., Langlet, C., Guo, X. J., et al. (2002) TCR signal initiation machinery ispre-assembled and activated in a subset of membrane rafts. EMBO J. 21, 1899–1908.
28. Macdonald, J. L. and Pike, L. J. (2005) A simplified method for the preparation ofdetergent-free lipid rafts. J. Lipid Res. 46, 1061–1067.
29. Pike, L. J. (2004) Lipid rafts: heterogeneity on the high seas. Biochem. J. 378,281–292.
30. Smart, E. J., Ying, Y. S., Mineo, C., and Anderson, R. G. W. (1995) A detergent-freemethod for purifying caveolae membrane from tissue culture cells. Proc. Natl. Acad.Sci. USA 92, 10,104–10,108.
31. Song, K. S., Li, S., Okamoto, T., Quilliam, L. A., Sargiacomo, M., and Lisanti,M. P. (1996) Co-purification and direct interaction of Ras with Caveolin, an inte-gral membrane protein of caveolae microdomains. J. Biol. Chem. 271, 9690–9697.
32. Du, G., Altshuller, Y. M., Vitale, N., et al. (2003) Regulation of phospholipase D1subcellular cycling through coordination of multiple membrane association motifs.J. Cell Biol. 162, 305–315.
33. Stauffer, T. P. and Meyer, T. (1997) Compartmentalized IgE receptor-mediatedsignal transduction in living cells. J. Cell Biol. 139, 1447–1454.
34. Zacharias, D. A., Violin, J. D., Newton, A. C., and Tsien, R. Y. (2002) Partitioningof lipid-modified monomeric GFPs into membrane microdomains of live cells.Science 296, 913–916.
35. van Meer, G. (2002) The different hues of lipid rafts. Science 296, 855–856.36. Chen, C. S., Martin, O. C., and Pagano, R. E. (1997) Changes in the spectral prop-
erties of a plasma membrane lipid analog during the first seconds of endocytosisin living cells. Biophys. J. 72, 37–50.
37. Jacobson, K. and Dietrich, C. (1999) Looking at lipid rafts? Trends Cell Biol. 9,87–91.
38. Kuerschner, L., Ejsing, C. S., Ekroos, K., Shevchenko, A., Anderson, K. I., andThiele, C. (2005) Polyene-lipids: a new tool to image lipids. Nat. Methods 2, 39–45.
39. van Meer, G. and Liskamp, R. M. J. (2005) Brilliant lipids. Nat. Methods 2, 14–15.40. Prior, I. A., Parton, R. G., and Hancock, J. F. (2003) Observing cell surface sig-
naling domains using electron microscopy. SciSTKE 177, pI9–pI23.41. Prior, I. A., Muncke, C., Parton, R. G., and Hancock, J. F. (2003) Direct visualization
of Ras proteins in spatially distinct cell surface domains. J. Cell Biol. 160, 165–170.42. Glebov, O. O. and Nichols, B. J. (2004) Lipid raft proteins have a random distribu-
tion during localized activation of the T-cell receptor. Nat. Cell Biol. 6, 238–243.43. Kenworthy, A. K. and Edidin, M. (1998) Distribution of a glycosylphosphatidyl-
inositol-anchored protein at the apical surface of MDCK cells examined at a
280 Landry and Xavier

resolution of <100 A using imaging fluorescence resonance energy transfer. J. CellBiol. 142, 69–84.
44. Pierce, S. K. (2004) To cluster or not to cluster: FRETting over rafts. Nat. CellBiol. 6, 180–181.
45. Gordon, G. W., Berry, G., Liang, X. H., Levine, B., and Herman, B. (1998) Quan-titative fluorescence resonance energy transfer measurements using fluorescencemicroscopy. Biophysical J. 74, 2702–2713.
46. Tanimura, N., Nagafuku, M., Liddicoat, D. R., Hamaoka, T., and Kosugi, A. (2003)Analysis of the mobility of signaling molecules in lymphocytes using fluorescencephotobleaching techniques. SciSTKE 185, pI10–pI18.
47. Herman, B., Krishnan, R. V., and Centonze, V. E. (2004) Microscopic analysis of flu-orescence resonance energy transfer (FRET), in Protein–Protein Interactions: Methodsand Applications (Fu, H., ed.), Vol. 261, Humana Press, Totowa, NJ, pp. 351–370.
48. von Haller, P. D., Donohoe, S., Goodlett, D. R., Aebersold, R., and Watts, J. D.(2001) Mass spectrometric characterization of proteins extracted from Jurkat T-cell detergent-resistant membrane domains. Proteomics 1, 1010–1021.
49. Pompach, P., Man, P., Novak, P., Havlicek, V., Fiserova, A., and Bezouska, K.(2004) Mass spectrometry is a powerful tool for identification of proteins associ-ated with lipid rafts of Jurkat T-cell line. Biochem. Soc. Trans. 32, 777–779.
50. Tu, X., Huang, A., Bae, D., et al. (2004) Proteome analysis of lipid rafts in Jurkatcells characterizes a raft subset that is involved in NF-kappaB activation. J. Pro-teome Res. 3, 445–454.
51. Foster, L. J., de Hoog, C. L., and Mann, M. (2003) Unbiased quantitative pro-teomics of lipid rafts reveals high specificity for signaling factors. Proc. Natl.Acad. Sci. USA 100, 5813–5818.
52. Ong, S. E., Blagoev, B., Kratchmarova, I., Kristensen, D. B., Steen, H., Pandey, A.,et al. (2002) Stable isotopic labeling by amino acids in cell culture, silac, as a simpleand accurate approach to expression proteomics. Mol. Cell Proteom. 1, 373–386.
53. Gombos, I., Basco, Z., Detre, C., Nagy, H., Goda, K., Andrasfalvy, M., et al.(2004) Cholesterol sensitivity of detergent resistance: a rapid flow cytometric testfor detecting constitutive or induced raft association of membrane proteins. Cytom-etry 61A, 117–126.
54. Kwik, J., Boyle, S., Fooksman, D., Margolis, L., Sheetz, M. P., and Edidin, M.(2003) Membrane cholesterol, lateral mobility, and the phosphatidylinositol 4,5-bisphosphate-dependent organization of cell actin. Proc. Natl. Acad. Sci. USA100, 13,964–13,969.
55. Razzaq, T. M., Ozegbe, P., Jury, E. C., Sembi, P., Blackwell, N. M., and Kabourids,P. S. (2004) Regulation of T-cell receptor signalling by membrane microdomains.Immunology 113, 413–426.
56. Sprague, B. L. and McNally, J. G. (2004) FRAP analysis of binding: proper andfitting. Trends Cell Biol. 15, 84–91.
57. Vacchio, M. S. and Shores, E. W. (2000) Flow cytometric analysis of murineT lymphocytes, in T Cell Protocols (Kearse, K., ed.), Vol. 134, Humana Press,Totowa, NJ, pp. 153–176.
Lipid Rafts in Cell–Cell Interactions 281


Index 283
283
Index
AAdenosine, 77, 79, 83, 84Adhesion molecule(s), 149–151
ICAM-2 (CD102), 150PECAM-1, 150VE-cadherin, 150on HUVEC, 44selectin 221, 225, 226
Antibacterial peptides and proteins,bactericidal/permeability-increasing
protein (BPI), 23Antibiotic resistance,
in biofilms, 120Apoptosis, 155, 156, 159Astrocyte-conditioned media, 7ATP-binding cassette (ABC), 1, 2, 7
BBacteria, 18
bacterial probes, 19, 20biofilm formation by, 119–121colony forming units, 30epithelial cell killing assay, 29, 30growth medium, 22, 26invasion into epithelial monolayers,
27, 28quantification, 30, 32Salmonella typhimurium, 27, 29, 30
Bactericidal/permeability-increasingprotein (BPI), 23
β-catenin, 197, 198antibody against human β-catenin, 199cell surface, 198nuclear localization, 198
Bcl-2, 155, 156, 158–160Biofilm, 119Bioparticles, 112
Escherichia coli, 115Biotinylation, 77Bit-1, 155, 156, 159Blood–brain barrier, 2
models, 2Blot rolling assay,
apparatus, 220–222diagram, 219
CCadherin, 197, 198
antibody against mouse E-cadherin, 199cDNA libraries, 157–159, 163CD44, 225, 226Cell culture,
co-culture,epithelial–endothelial, 53epithelial–mononuclear cell, 55, 56
cultured,human microvascular endothelial
cells (HMEC), 50, 55T84 intestinal epithelial cells, 50
plating,ampicillin, 50attachment factor, 50media,
DMEM, 50epidermal growth factor, 50fetal bovine serum (FBS), 50Hams F-112, 50hydrocortisone, 50
penicillin, 50streptomycin, 50supports, 57
collagen, 57inserts, 53, 57, 58inverts, 53, 55, 57
Cell culture, 63, 65Chinese hamster ovary (CHO) cells,
223, 226Cholera, 127–129
antibody, 131, 134toxin subunits, 127–129trypsin nicking, 135
Cholesterol depletion, 253, 254, 259Claudin, 185, 187, 188, 191, 194Cloning,
sub-selection of clones, 157, 159,161–164
Confocal microscopy, 185, 188, 194bacterial biofilms, 123–125
Contraction assay,collagen gel contraction assay, 103–109
Cutaneous lymphocyte antigen (CLA), 224

284 Index
DDAPI, see ImmunofluorescenceDesmoplakin, 173, 174, 177, 178Desmosome,
calcium switch, 172–174Device-related infections, 190Differential detergent extraction, 187,
191, 192
EEfflux pump, 6, 7EGFP, 155, 157–162, see also flow
cytometryElectron microscopy, 170, 171, 255, 256,
266–270Electroporation, 161–163
bacteria, 161–163Enzyme-linked immunosorbent
assay (ELISA),ligand–receptor interactions, 42
Endothelia,interactions with leukocytes, 74, 76, 79permeability, 77, 79
fluorescein isothyocyanate(FITC)-labeled dextran, 77, 81
Endothelial cells, 141, 142characterization, 148–152isolation, 142–148lineage, 147morphological appearance, 149
Endothelium, 35, 36HUVEC, 36, 37, 46
Eosinophils, 103Epidermis, 169, 173, 175, 181Epithelial cells, 185, 186, 188–190Epithelium, 103
Caco2-collagen hydrogels, 105, 106Exopolysaccharide,
bacterial adhesions, 119–125Expression cloning, 155–166
strategy, 155, 158, 159, 163Extracellular matrix, 155–156, 158
collagen,hydrogels, 103–109
fibronectin, 158thrombospondin-1, 156
FFertilization, 90, 91Fibroblasts, 103
fibroblast-collagen hyrogels,107, 108
Fixative solution, periodate-lysineparaformaldehyde (PLP), 198, 200
Flow cytometry, 157–163, 258, 276, 277EGFP, 157–162fluorescence-activated cell sorting,
157–163Fluorescent, 112
bacteria, 114isothiocyanate, 114
Fluorescence in situ hybridization, 19fixation, 31hybridization, 19, 21, 24post-hybridization washes and
buffer, 21, 24probes, 20, 21, 32
Fluorescent microscopy, 255, 265, 266Fluorescence resonance after photo-
bleaching (FRAP), 258, 272–275Fluorescence resonance energy transfer
(FRET), 257, 258, 270–272Frozen sections, preparation of, 200, 201
sprey freezers, 199, 200tissue-embedding medium, 199tissue-embedding molds, 199
G
Ganglioside GM1, 127Gel electrophoresis, 63, 64
heterotrimeric G proteins, 68materials, 63, 64methods, 68
Glass slides,coated with poly-L-lysine, 202coated with silane, 201, 202moist chambers for, 202
Gonadotropins, 92
HHeterotrimeric G proteins,
gel electrophoresis, 68tight junction, 62Western blot, 68, 69
High-performance liquid chromatography(HPLC), 79, 275, 276
Hirt supernatant, 158, 161HPLC, 79, 275, 276

Index 285
IInducible expression system, 64
doxycycline, 63, 67tet-off, 64
Integrins, 155, 156, 159Interferon (IFN) 185, 186, 188, 189,
193, 194Intestinal epithelial cells,
bacterial invasion of, 27, 28cell culture, 21, 22, 25, 26killing of bacteria, 29, 30
In vitro fertilization, 89, 91, 96, 97, 98Immunoblotting, 120–122Immunofluorescence, 36, 90, 94, 96,
99–101, 169, 173, 174, 185,188, 192, 194
junctional distribution, 36, 37, 41Immunogold labeling, 170, 171,
177–179Immunoprecipitation, 77, 134
anti-cholera toxin antibody, 134concanavalin A and GM1, 136
JJunctional adhesion molecules (JAM),
185, 187, 188, 191, 193, 194adhesion to, 38expression, 35, 36homophilic interactions, 36heterophilic interactions, 36JAM-A, JAM-B, JAM-C, 35localization, 41, 42
LLeukocyte adhesion, 38–43
to JAM-C, 38, 43Leukocyte–endothelial interactions, 36Leukocyte integrins, 38, 42Leukocyte transendothelial migration,
39, 44transwell filter, 44
Ligation, 63Lipid mediator,
resolvin,bioactions in vivo, 240, 243, 244biological activity in vitro, 240,
242, 244biosynthesis, 237, 241, 244formation of RvE1, 239, 24217R-RvD Series, 24117S-RvD Series, 243
Lipid raft, 251–281
MMadin-Darby canine kidney (MDCK) cells,
167, 171, 172–174, 176cell lysis, 68culture, 65splitting, 65, 67TEER methods, 70tet-off, 64transfection, 66, 67
Microvessels, 8–10Miles, 112
Evan’s blue, 112formamide, 114
Mounting medium, aqueous, 201
NNeutrophils, 18
isolation of, 22, 23, 26, 27, 76–79acid-citrate-dextrose (ACD), 53ammonium chloride lysis buffer, 53density centrifugation, 55gelatin, 53, 55Hank’s Balanced Salt Solution
(HBSS), 50, 55, 57HEPES, 50Histopaque 109, 53
myeloperoxidase assay, 23, 29quantitation,
2,2'-azino-bis-(3-ethylbenzothiazo-line-6-sulfonic acid) (ABTS), 53
citrate buffer, 53, 55hydrogen peroxide (H2O2), 53myeloperoxidase, 55
transepithelial migration, 18, 28, 29transmigration,
dimethyl sulfixide (DMSO), 53N-formyl-methionyl-leucyl-
phenylalanine (fMLP), 53, 55Nucleotidase,
CD39, 77, 83, 84CD73, 77, 83, 84
inhibition by αβ-methylene ADP,83, 84
N-Glycosylation, 134assay, 134motif, 128, 133

286 Index
OOccludin, 185, 187, 188, 191, 194Ovulation, 89–91
superovulation of mice 94, 95
PParaffin-embedded sections,
preparation of, 21, 23, 24preservation of, 31, 32
Paracellular flux, 185, 191Paracellular permeability, 185, 188PDZ domain, 36
binding motif, 36PEA-15, 156P-glycoprotein, 2, 6, 7Phosphoimaging, 135PNGase, 132
digesting cholera toxin mutant,136, 137
Protein kinase C, 167, 168, 171, 175,179, 180
Proteomics, 258, 274
RRadioactive,
containment box, 134, 138Rat brain endothelial cells 4 (RBE4), 2–5Resolvin E series, 231, 232
bioactions in vivo, 240, 243, 244biological activity in vitro, 240,
242, 244biosynthesis, 237, 241, 243formation of RvE1, 239, 24217R-RvD series, 24117S-RvD series, 243
Retro-translocation, 128, 129
SSDS-PAGE, 120–122, 135, 137, 187,
191, 192, 220, 221Shear stress, 225Signal transduction, 155, 156, 158–160Sperm, 91, 94–98, 101
preparation from mice, 95Sperm–egg membrane interactions, 91,
96, 97, 101
Staphylococcus, 120Sulfation, 134
assay, 13435S-sodium sulfate, 131–138tyrosine-sulfation motif, 128, 133
T
Tight junction, 62, 185–187, 191–194adhesion to, 38expression, 35, 36homophilic interactions, 36heterophilic interactions, 36JAM-A, JAM-B, JAM-C, 35localization, 41, 42resistance methods, 70, 188–190, 194
Transcellular transport, 5Transcription, 156, 159Transepithelial electrical resistance
(TEER) 188–190, 194Transepithelial resistance, 58, 64
Evohm, 50method, 70short circuit current, 58voltage clamp, 50, 58
Transfection, 63, 157–159colony selection, 66, 67G418, 66, 67hygromycin, 66, 67MDCK cells, 66, 67puromycin, 66, 67
Transport, retrograde, 127–131
W
Whitten’s medium, 92Wound healing, 103
assays, 169, 172–174, 179, 181Water,
tissue content, 113edema, 115
Wheat germ agglutinin,biofilm analysis, 119–125confocal microscopy, 123–125immunoblotting, 120–122
Western Blot, 137, 187, 191, 192, 220, 221