Methods for Intelligent Systems -...
35
Methods for Intelligent Systems Lecture Notes on Clustering (VI) 2009-2010 Davide Eynard [email protected] Department of Electronics and Information Politecnico di Milano – p. 1/23
Transcript of Methods for Intelligent Systems -...
Methods for Intelligent SystemsLecture Notes on Clustering (VI)
2009-2010
Davide Eynard
Department of Electronics and Information
Politecnico di Milano
– p. 1/23

Course Schedule [Tentative]
Date Topic
11/03/2010 Clustering: Introduction
18/03/2010 Clustering: K-means & Hierarchical
25/03/2010 Clustering: Fuzzy, Gaussian & SOM
08/04/2010 Clustering: PDDP & Vector Space Model
15/04/2010 Clustering: Limits, DBSCAN & Jarvis-Patrick
29/04/2010 Clustering: Evaluation Measures
– p. 2/23
Lecture outline
• Cluster Evaluation◦ Internal measures◦ External measures
• Finding the correct number of clusters• Framework for cluster validity
– p. 3/23
Cluster Evaluation
• Every algorithm has its pros and cons◦ (Not only about cluster quality: complexity, #clusters in advance, etc.)
• For what concerns cluster quality, we can evaluate (or, better,validate) clusters
• For supervised classification we have a variety of measures toevaluate how good our model is◦ Accuracy, precision, recall
• For cluster analysis, the analogous question is: how can weevaluate the "goodness" of the resulting clusters?
• But most of all... why should we evaluate it?
– p. 4/23
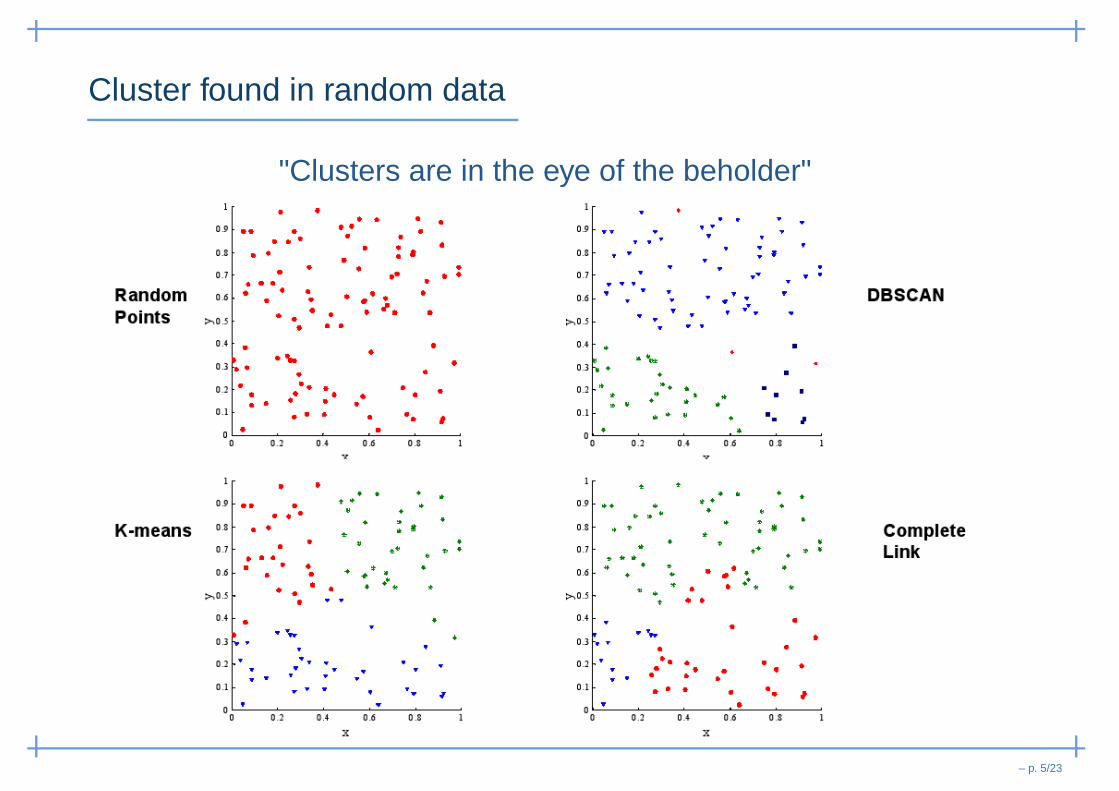
Cluster found in random data
"Clusters are in the eye of the beholder"
– p. 5/23

Why evaluate?
• To determine the clustering tendency of the dataset, that isdistinguish whether non-random structure actually exists in thedata
• To determine the correct number of clusters• To evaluate how well the results of a cluster analysis fit the data
without reference to external information• To compare the results of a cluster analysis to externally known
results, such as externally provided class labels• To compare two sets of clusters to determine which is better
Note:• the first three are unsupervised techniques, while the last two require external info
• the last three can be applied to the entire clustering or just to individual clusters
– p. 6/23

Open challenges
Cluster evaluation has a number of challenges:
• a measure of cluster validity may be quite limited in the scopeof its applicability◦ ie. dimensions of the problem: most work has been done
only on 2- or 3-dimensional data• we need a framework to interpret any measure
◦ How good is "10"?• if a measure is too complicated to apply or to understand,
nobody will use it
– p. 7/23

Measures of Cluster Validity
Numerical measures that are applied to judge various aspects ofcluster validity are classified into the following three types:
• Internal (unsupervised) Indices: Used to measure thegoodness of a clustering structure without respect to externalinformation◦ cluster cohesion vs cluster separation◦ i.e. Sum of Squared Error (SSE)
• External (supervised) Indices: Used to measure the extent towhich cluster labels match externally supplied class labels◦ Entropy
• Relative Indices: Used to compare two different clusterings orclusters◦ Often an external or internal index is used for this function,
e.g., SSE or entropy
– p. 8/23
External Measures
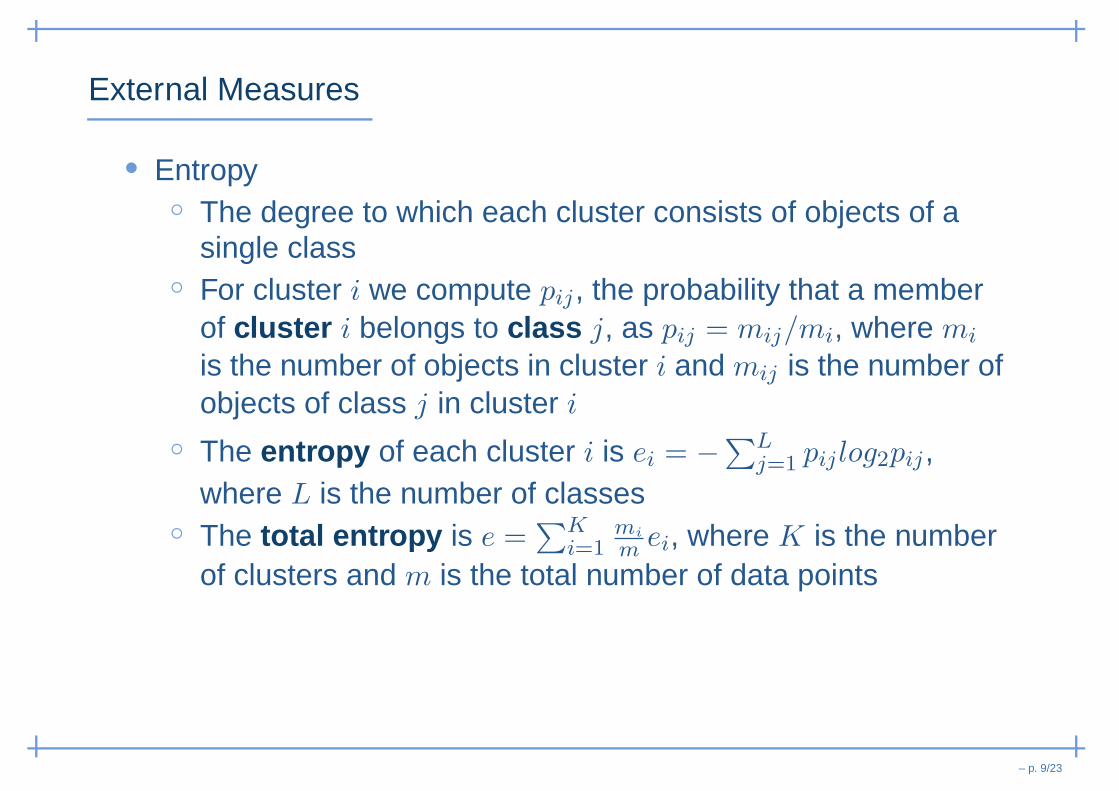
• Entropy◦ The degree to which each cluster consists of objects of a
single class◦ For cluster i we compute pij , the probability that a member
of cluster i belongs to class j, as pij = mij/mi, where mi
is the number of objects in cluster i and mij is the number ofobjects of class j in cluster i
◦ The entropy of each cluster i is ei = −∑L
j=1 pijlog2pij ,where L is the number of classes
◦ The total entropy is e =∑K
i=1mi
m ei, where K is the numberof clusters and m is the total number of data points
– p. 9/23

External Measures
• Purity◦ Another measure of the extent to which a cluster contains
objects of a single class◦ Using the previous terminology, the purity of cluster i is
pi = max(pij) for all the j
◦ The overall purity is purity =∑K
i=1mi
m pi
– p. 9/23
External Measures
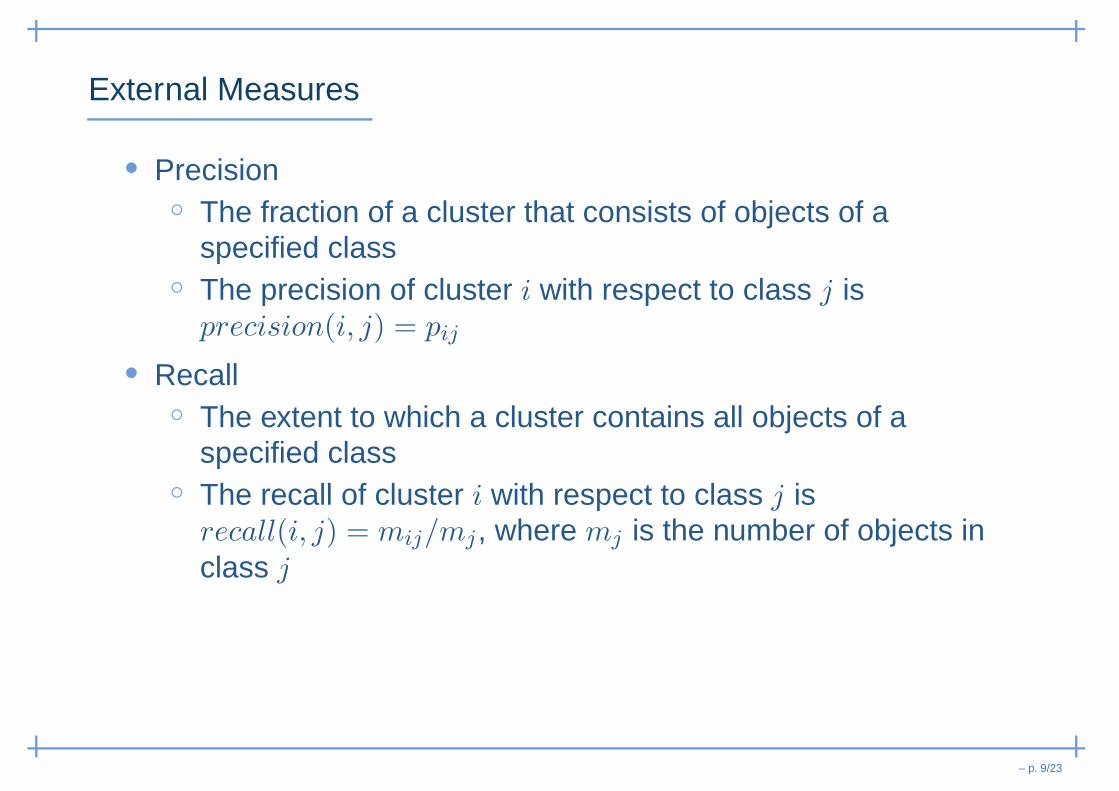
• Precision◦ The fraction of a cluster that consists of objects of a
specified class◦ The precision of cluster i with respect to class j is
precision(i, j) = pij
• Recall◦ The extent to which a cluster contains all objects of a
specified class◦ The recall of cluster i with respect to class j is
recall(i, j) = mij/mj , where mj is the number of objects inclass j
– p. 9/23

External Measures
• F-measure◦ A combination of both precision and recall that measures
the extent to which a cluster contains only objects of aparticular class and all objects of that class
◦ The F-measure of cluster i with respect to class j is
F (i, j) = 2×precision(i,j)×recall(i,j)precision(i,j)+recall(i,j)
– p. 9/23
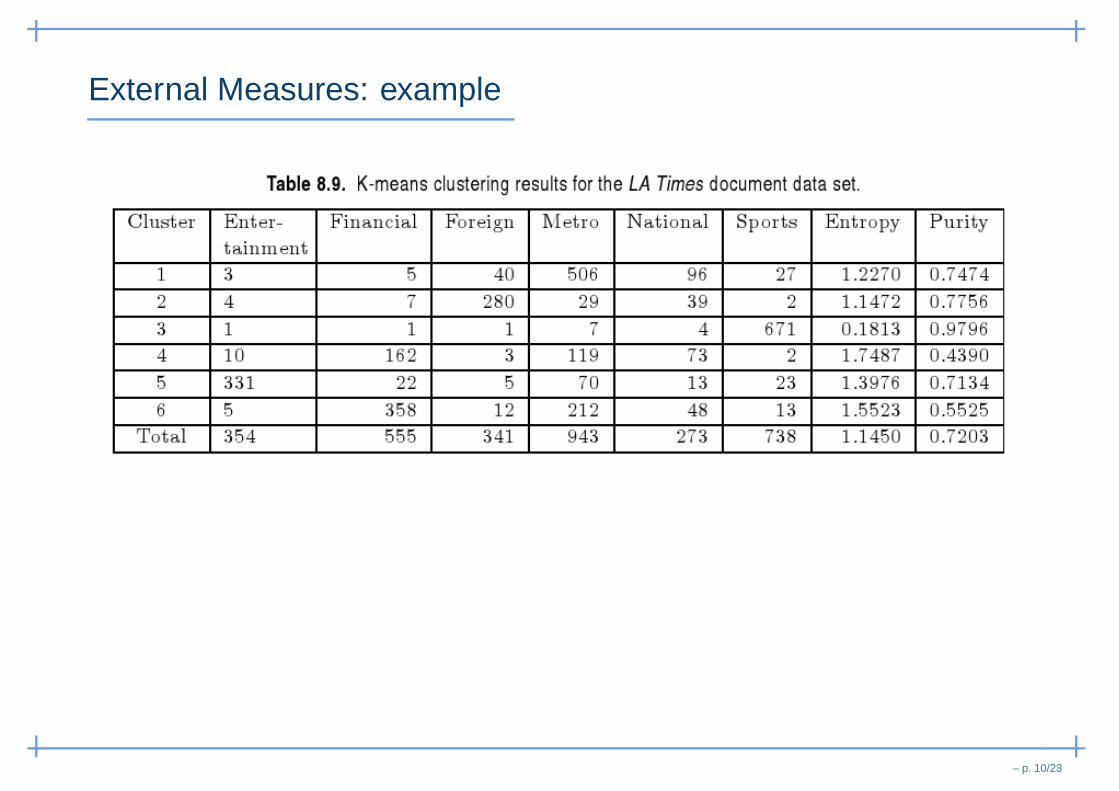
External Measures: example
– p. 10/23
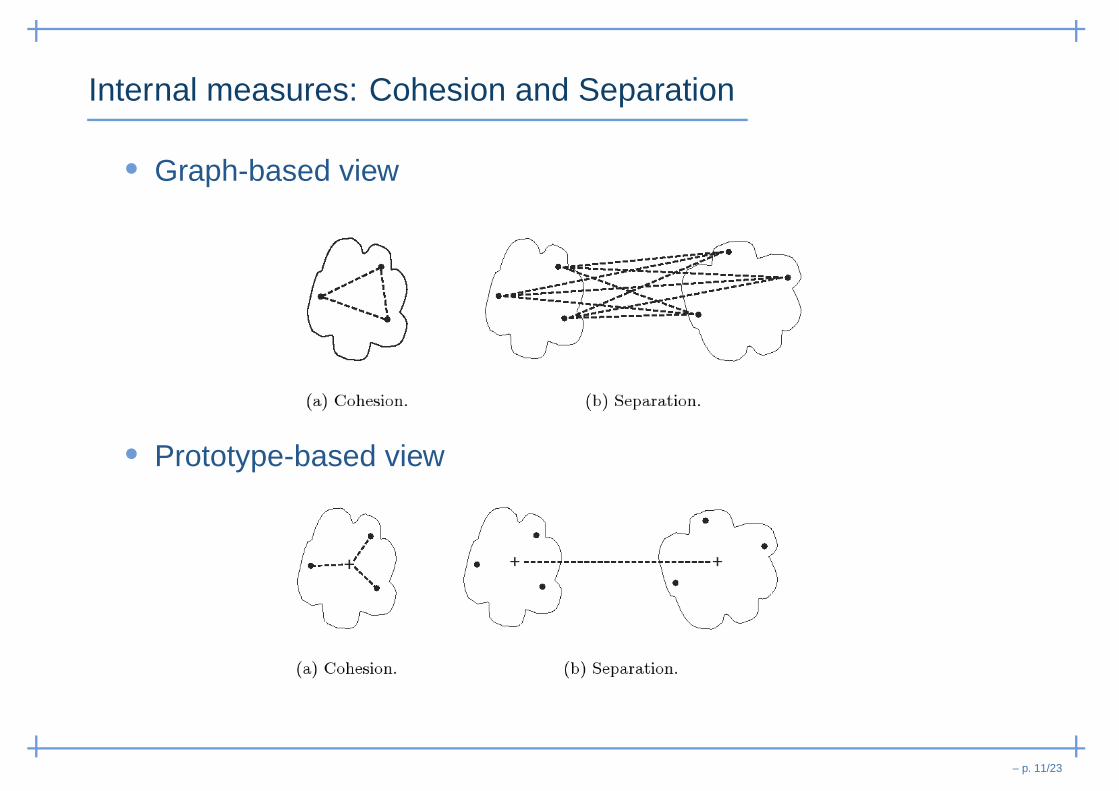
Internal measures: Cohesion and Separation
• Graph-based view
• Prototype-based view
– p. 11/23

Internal measures: Cohesion and Separation
• Cluster Cohesion: Measures how closely related are objectsin a cluster
cohesion(Ci) =X
x∈Ci,y∈Ci
proximity(x, y)
cohesion(Ci) =X
x∈Ci
proximity(x, ci)
• Cluster Separation: Measure how distinct or well-separated acluster is from other clusters
separation(Ci, Cj) =X
x∈Ci,y∈Cj
proximity(x, y)
separation(Ci, Cj) = proximity(ci, cj)
separation(Ci) = proximity(ci, c)
– p. 11/23

Cohesion and separation example
• Cohesion is measured by the within cluster sum of squares(SSE)
WSS =∑
i
∑
x∈Ci
(x − mi)2
• Separation is measured by the between cluster sum of squares
BSS =∑
i
|Ci|(m − mi)2
where |Ci| is the size of cluster i
– p. 12/23
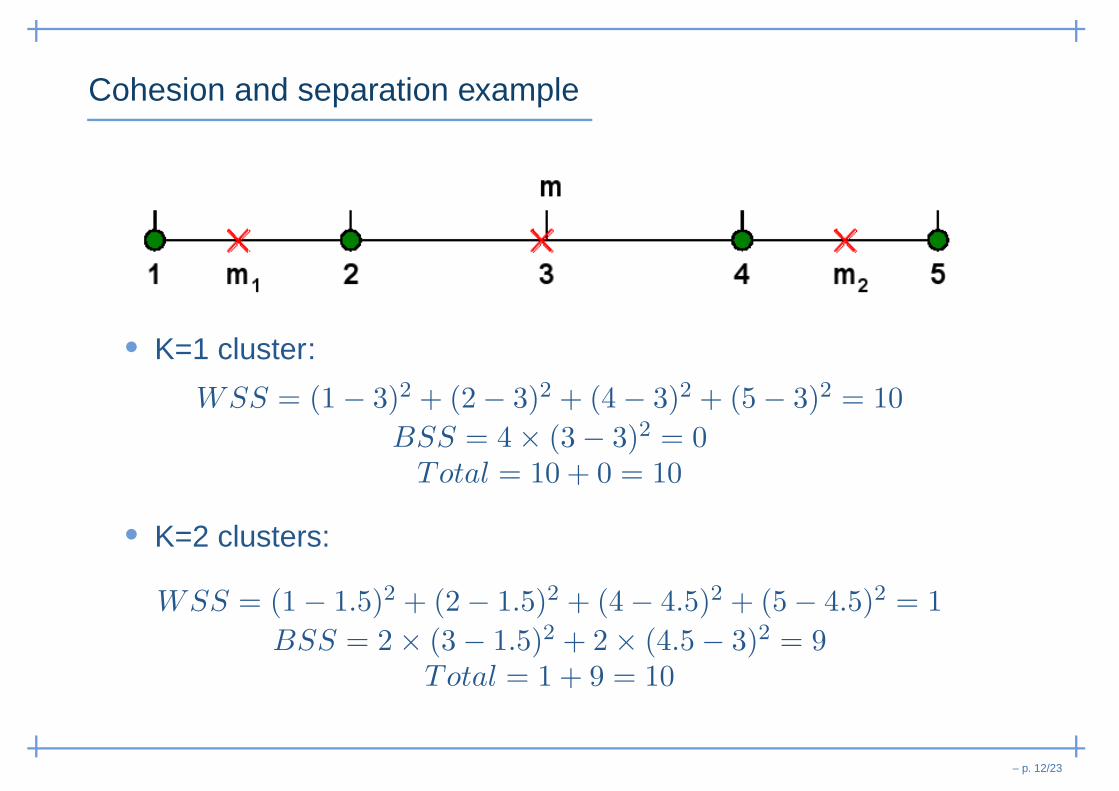
Cohesion and separation example
• K=1 cluster:
WSS = (1 − 3)2 + (2 − 3)2 + (4 − 3)2 + (5 − 3)2 = 10
BSS = 4 × (3 − 3)2 = 0Total = 10 + 0 = 10
• K=2 clusters:
WSS = (1 − 1.5)2 + (2 − 1.5)2 + (4 − 4.5)2 + (5 − 4.5)2 = 1
BSS = 2 × (3 − 1.5)2 + 2 × (4.5 − 3)2 = 9Total = 1 + 9 = 10
– p. 12/23

Evaluating individual clusters and Objects
• So far, we have focused on evaluation of a group of clusters• Many of these measures, however, also can be used to
evaluate individual clusters and objects◦ For example, a cluster with a high cohesion may be
considered better than a cluster with a lower one• This information often can be used to improve the quality of the
clustering◦ Split not very cohesive clusters◦ Merge not very separated ones
• We can also evaluate the objects within a cluster in terms oftheir contribution to the overall cohesion or separation of thecluster
– p. 13/23
The Silhouette Coefficient
• Silhouette Coefficient combine ideas of both cohesion andseparation, but for individual points, as well as clusters andclusterings
• For an individual point, i
◦ Calculate ai = average distance of i to the points in itscluster
◦ Calculate bi = min (average distance of i to points in anothercluster)
◦ The silhouette coefficient for a point is then given bysi = (bi − ai)/max(ai, bi)
– p. 14/23
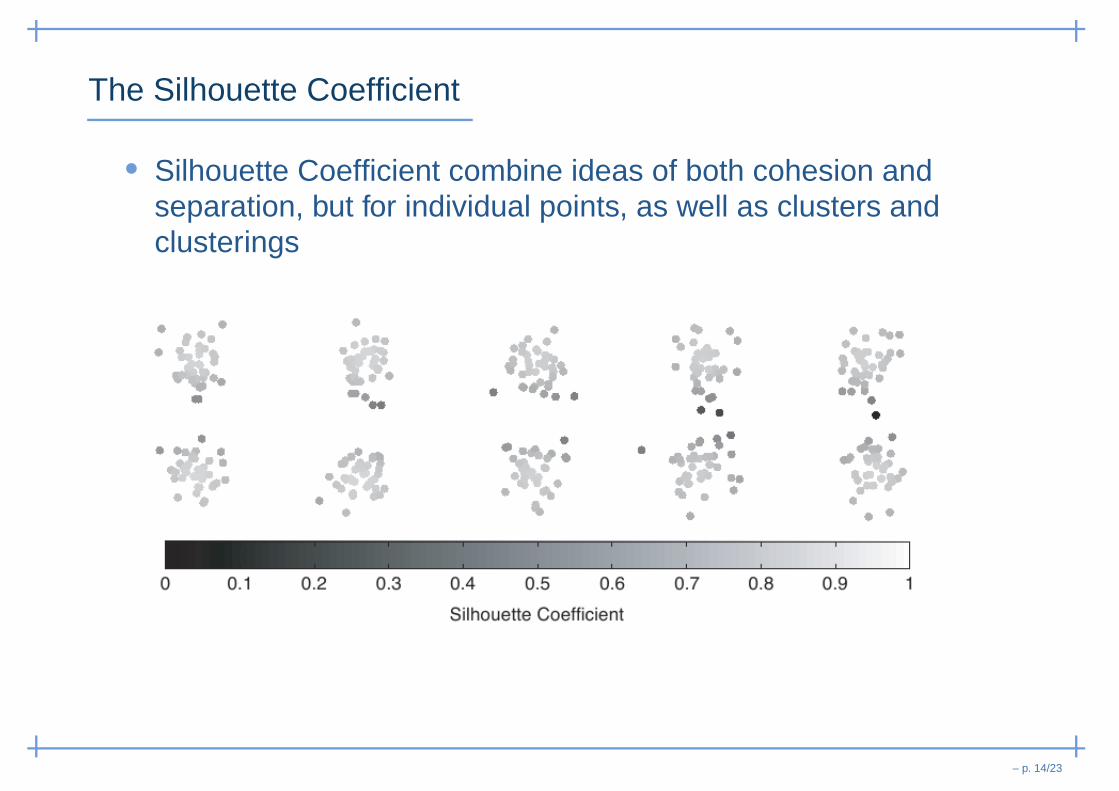
The Silhouette Coefficient
• Silhouette Coefficient combine ideas of both cohesion andseparation, but for individual points, as well as clusters andclusterings
– p. 14/23
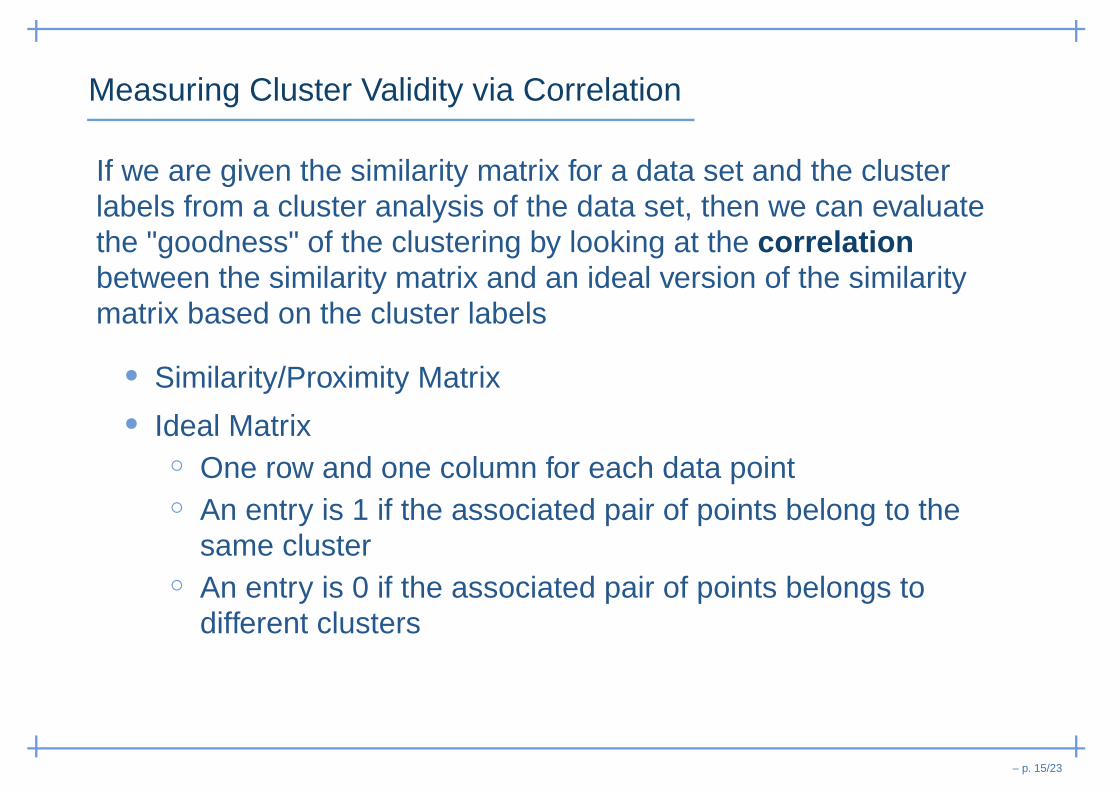
Measuring Cluster Validity via Correlation
If we are given the similarity matrix for a data set and the clusterlabels from a cluster analysis of the data set, then we can evaluatethe "goodness" of the clustering by looking at the correlationbetween the similarity matrix and an ideal version of the similaritymatrix based on the cluster labels
• Similarity/Proximity Matrix• Ideal Matrix
◦ One row and one column for each data point◦ An entry is 1 if the associated pair of points belong to the
same cluster◦ An entry is 0 if the associated pair of points belongs to
different clusters
– p. 15/23

Measuring Cluster Validity via Correlation
• Compute the correlation between the two matrices◦ Since the matrices are symmetric, only the correlation between n(n − 1)/2 entries
needs to be calculated
• High correlation indicates that points that belong to the samecluster are close to each other
– p. 15/23

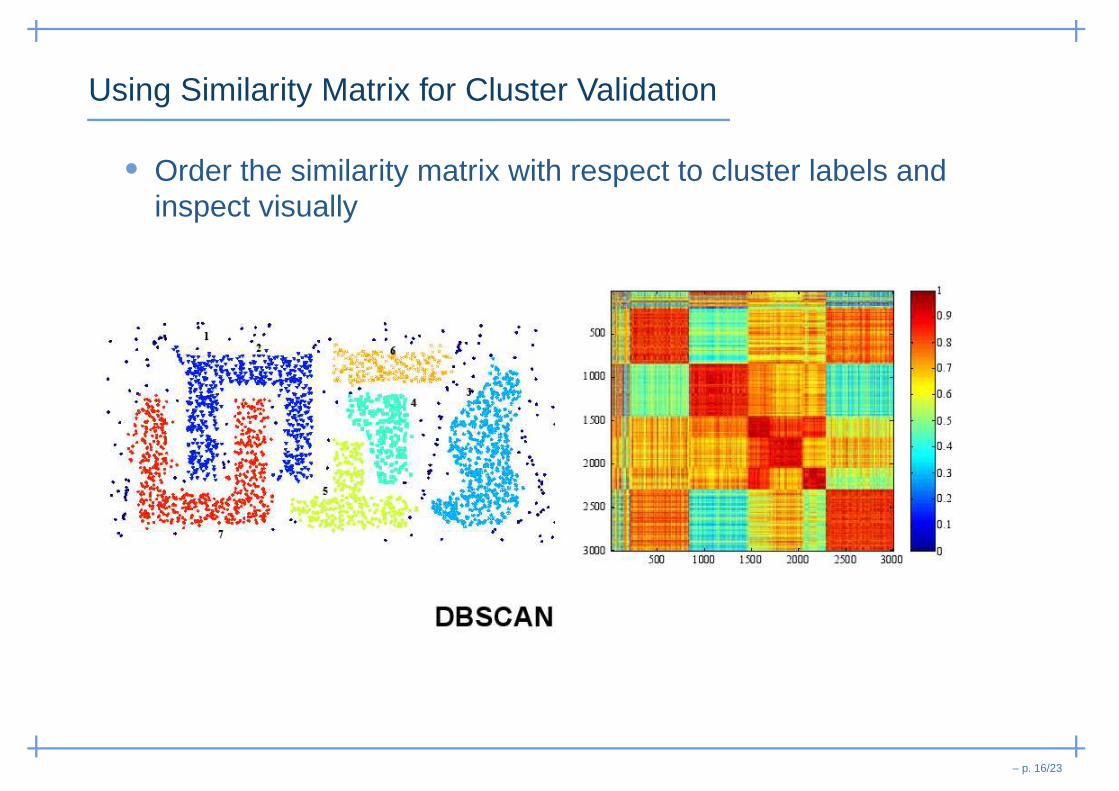
Using Similarity Matrix for Cluster Validation
• Order the similarity matrix with respect to cluster labels andinspect visually
– p. 16/23
Using Similarity Matrix for Cluster Validation
• Order the similarity matrix with respect to cluster labels andinspect visually
– p. 16/23
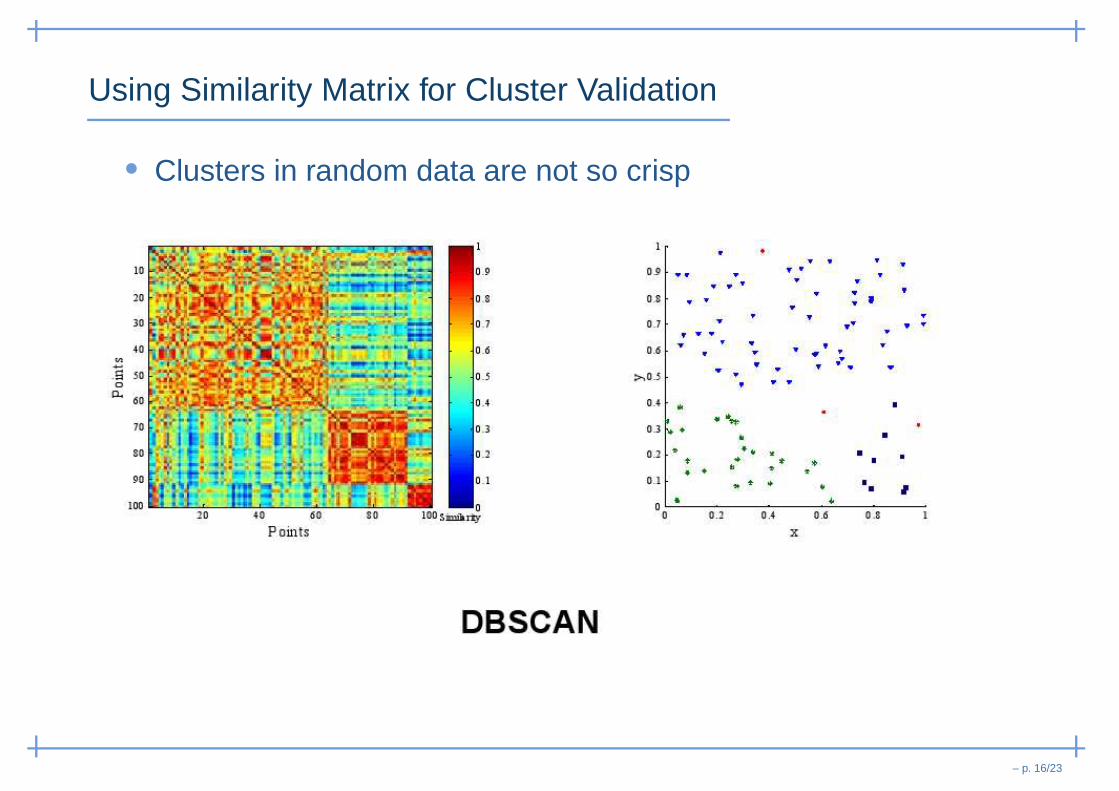
Using Similarity Matrix for Cluster Validation
• Clusters in random data are not so crisp
– p. 16/23

Using Similarity Matrix for Cluster Validation
• Clusters in random data are not so crisp
– p. 16/23
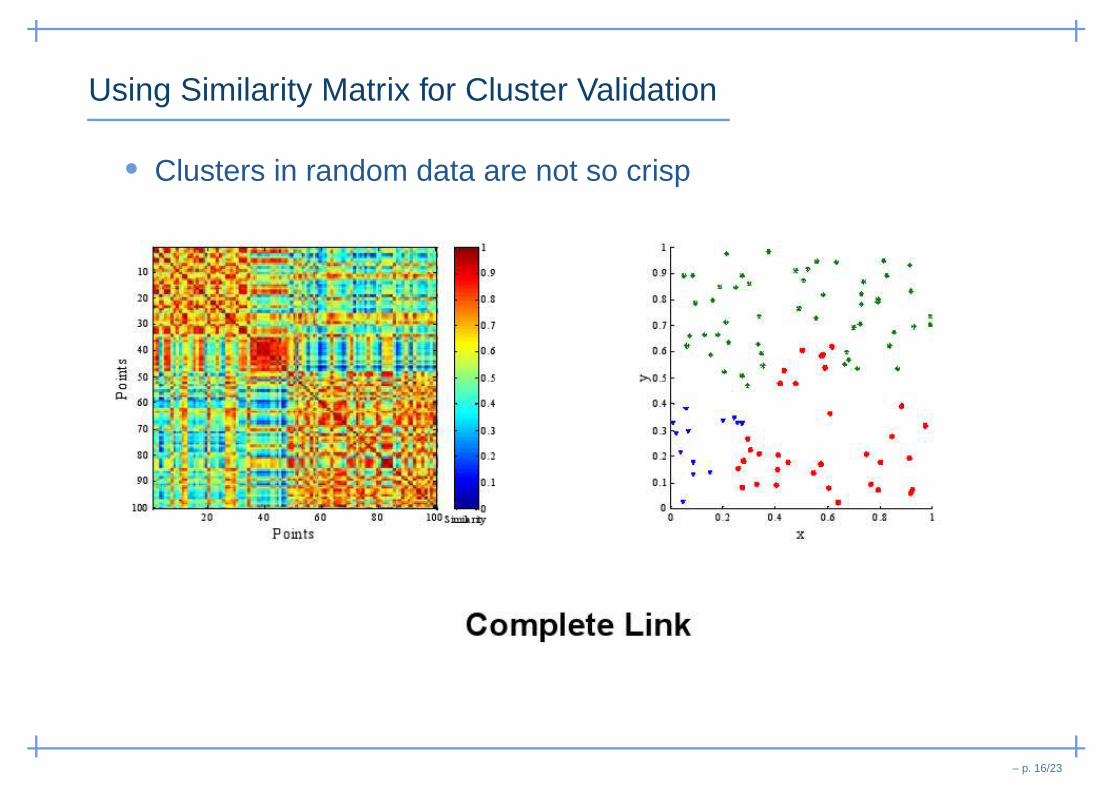
Using Similarity Matrix for Cluster Validation
• Clusters in random data are not so crisp
– p. 16/23

Finding the Correct Number of Clusters
• Look for the number of clusters for which there is a knee, peak,or dip in the plot of the evaluation measure when it is plottedagainst the number of clusters
– p. 17/23
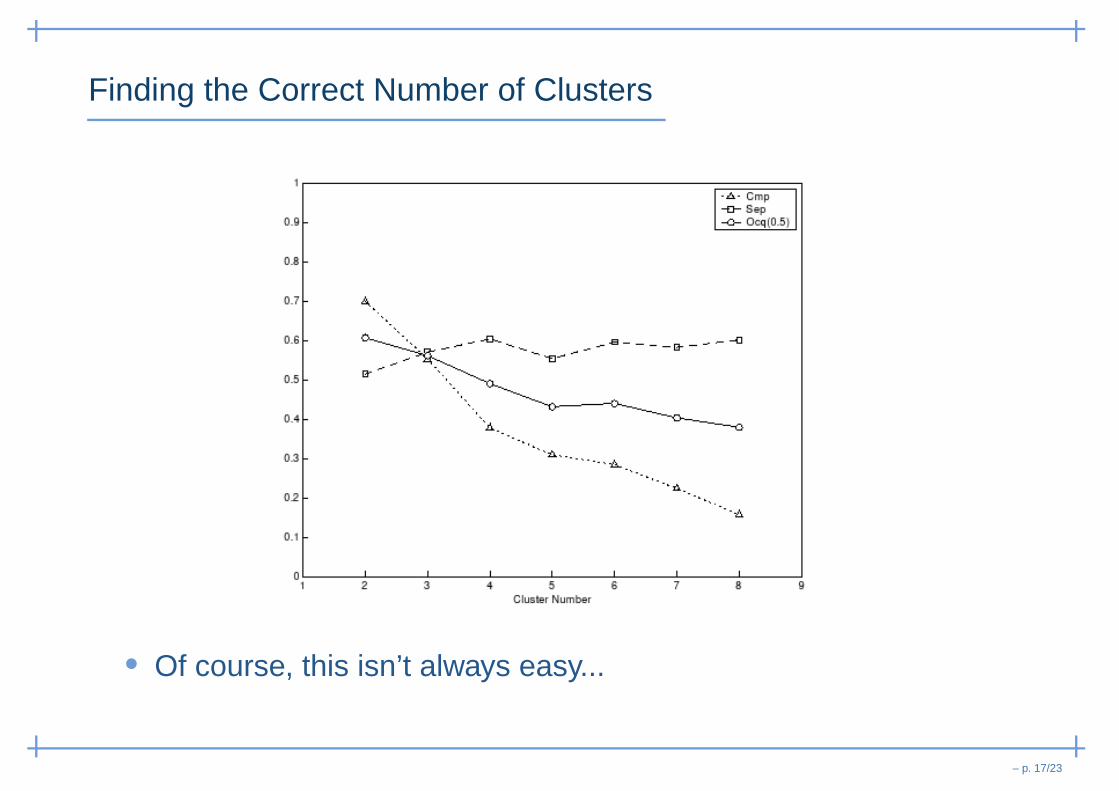
Finding the Correct Number of Clusters
• Of course, this isn’t always easy...
– p. 17/23

Framework for Cluster Validity
• Need a framework to interpret any measure.◦ For example, if our measure of evaluation has the value "10", is that good, fair, or
poor?
• Statistics provide a framework for cluster validity◦ The more atypical a clustering result is, the more likely it represents valid structure
in the data◦ Can compare the values of an index that result from random data or clusterings to
those of a clustering result: if the value of the index is unlikely, then the clusterresults are valid
◦ These approaches are more complicated and harder to understand
• For comparing the results of two different sets of clusteranalyses, a framework is less necessary◦ However, there is the question of whether the difference between two index values
is significant
– p. 18/23
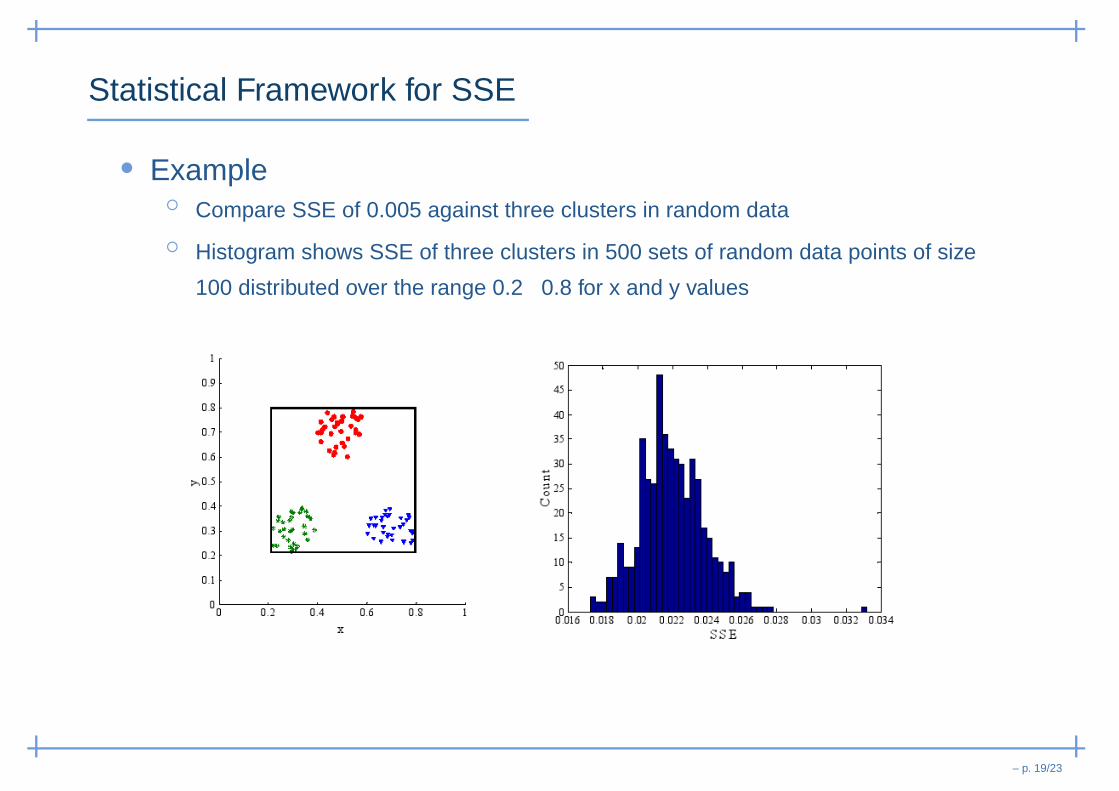
Statistical Framework for SSE
• Example◦ Compare SSE of 0.005 against three clusters in random data
◦ Histogram shows SSE of three clusters in 500 sets of random data points of size
100 distributed over the range 0.2 0.8 for x and y values
– p. 19/23

Statistical Framework for Correlation
• Correlation of incidence and proximity matrices for the K-meansclusterings of the following two data sets
– p. 20/23

Final Comment on Cluster Validity
"The validation of clustering structures is the most difficult andfrustrating part of cluster analysis. Without a strong effort in this
direction, cluster analysis will remain a black art accessible only tothose true believers who have experience and great courage."
Algorithms for Clustering Data, Jain and Dubes
– p. 21/23
Bibliography
• Slides about clustering for the Data Mining courseprof. Salvatore Orlando (link)
• Tan, Steinbach, Kumar: "Introduction to Data Mining", Ch. 8http://www-users.cs.umn.edu/ kumar/dmbook/index.php
• As usual, more info on del.icio.us
– p. 22/23
• The end (really!)
– p. 23/23


![Multi-column Deep Neural Networks for Image Classification · supervised pattern classification [2,10]. Here we train such nets by simple online back-propagation, setting new, greatly](https://static.fdocuments.in/doc/165x107/5fc72c844784155e3f683598/multi-column-deep-neural-networks-for-image-classiication-supervised-pattern-classiication.jpg)


![Semi-supervised Learning with Ladder Networkspapers.nips.cc/...semi-supervised-learning-with-ladder-networks.pdf · Semi-Supervised Learning with Ladder Networks ... 3] or classification](https://static.fdocuments.in/doc/165x107/5af9e4237f8b9ae92b8cfd03/semi-supervised-learning-with-ladder-learning-with-ladder-networks-3-or-classication.jpg)
