Methods for Binary Symbolic Execution - Stacksss149tg6315/... · binary symbolic execution....
211
METHODS FOR BINARY SYMBOLIC EXECUTION A DISSERTATION SUBMITTED TO THE DEPARTMENT OF COMPUTER SCIENCE AND THE COMMITTEE ON GRADUATE STUDIES OF STANFORD UNIVERSITY IN PARTIAL FULFILLMENT OF THE REQUIREMENTS FOR THE DEGREE OF DOCTOR OF PHILOSOPHY Anthony Romano December 2014
Transcript of Methods for Binary Symbolic Execution - Stacksss149tg6315/... · binary symbolic execution....

METHODS FOR BINARY SYMBOLIC EXECUTION
A DISSERTATION
SUBMITTED TO THE DEPARTMENT OF COMPUTER SCIENCE
AND THE COMMITTEE ON GRADUATE STUDIES
OF STANFORD UNIVERSITY
IN PARTIAL FULFILLMENT OF THE REQUIREMENTS
FOR THE DEGREE OF
DOCTOR OF PHILOSOPHY
Anthony Romano
December 2014
http://creativecommons.org/licenses/by-nc/3.0/us/
This dissertation is online at: http://purl.stanford.edu/ss149tg6315
© 2014 by Anthony Joseph Romano. All Rights Reserved.
Re-distributed by Stanford University under license with the author.
This work is licensed under a Creative Commons Attribution-Noncommercial 3.0 United States License.
ii

I certify that I have read this dissertation and that, in my opinion, it is fully adequatein scope and quality as a dissertation for the degree of Doctor of Philosophy.
Dawson, Engler, Primary Adviser
I certify that I have read this dissertation and that, in my opinion, it is fully adequatein scope and quality as a dissertation for the degree of Doctor of Philosophy.
Alex Aiken
I certify that I have read this dissertation and that, in my opinion, it is fully adequatein scope and quality as a dissertation for the degree of Doctor of Philosophy.
David Mazieres
Approved for the Stanford University Committee on Graduate Studies.
Patricia J. Gumport, Vice Provost for Graduate Education
This signature page was generated electronically upon submission of this dissertation in electronic format. An original signed hard copy of the signature page is on file inUniversity Archives.
iii

Abstract
Binary symbolic execution systems are built from complicated stacks of unreliable
software components, process large program sets, and have few shallow decisions.
Failure to accurately symbolically model execution produces infeasible paths which
are difficult to debug and ultimately inhibits the development of new system features.
This dissertation describes the design and implementation of klee-mc, a novel binary
symbolic executor that emphasizes self-checking and bit-equivalence properties.
This thesis first presents cross-checking for detecting causes of infeasible paths.
Cross-checking compares outputs from similar components for equivalence and reports
mismatches at the point of divergence. This approach systematically finds errors
throughout the executor stack from binary translation to expression optimization.
The second part of this thesis considers the symbolic execution of floating-point
code. To support floating-point program instructions, klee-mc emulates floating-
point operations with integer-only off-the-shelf soft floating-point libraries. Symbol-
ically executing these libraries generates test cases where soft floating-point imple-
mentations and floating-point constraint solvers diverge from hardware results.
The third part of this thesis discusses a term rewriting system based on program
path derived expression reduction rules. These reduction rules improve symbolic
execution performance and are machine verifiable. Additionally, these rules generalize
through further processing to optimize larger classes of expressions.
Finally, this thesis describes a flexible mechanism for symbolically dispatching
memory accesses. klee-mc forwards target program memory accesses to symbolically
executed libraries which retrieve and store memory data. These libraries simplify
access policy implementation and ease the management of rich analysis metadata.
iv

Acknowledgements
Foremost, I would like to thank my thesis advisor Dawson Engler for his often frustrat-
ing but invariably insightful guidance which ultimately made this work possible. His
unwaning enthusiasm for developing neat system software is perhaps only matched
by his compulsion to then break said software in new and interesting ways.
The other two-thirds of my reading committee, Alex Aiken and David Mazieres,
helpfully and recklessly agreed to trudge through over a hundred pages of words about
binary symbolic execution.
Although the vast majority of this work was my own, several people did contribute
some code in one way or another. klee-mc depends on a heavily modified derivative
of the klee symbolic executor, originally developed by Daniel Dunbar and Cristi
Cadar in Dawson’s lab shortly before my time at Stanford.T.J. Purtell helped develop
an early version of the machine code to LLVM dynamic binary translator. James
Knighton assisted in creating a public web interface for the system. David Ramos
wrote a few klee patches that I pulled into klee-mc early on; he once casually
remarked the only way to check these systems is mechanically.
This research was partially supported by DARPA award HR0011-12-2-009 and the
DARPA Clean-slate design of Resilient, Adaptive, Secure Hosts (CRASH) program
under contract N66001-10-2-4089. This work was also supported in part by the US
Air Force through contract AFRL-FA8650-10-C-7024. Any opinions, findings, con-
clusions, or recommendations expressed herein are those of the author, and do not
necessarily reflect those of the US Government, DARPA, or the Air Force.
v

Contents
Abstract iv
Acknowledgements v
1 Introduction 1
1.1 Motivation . . . . . . . . . . . . . . . . . . . . . . . . . . . . . . . . . 1
1.2 Challenges in Symbolic Execution . . . . . . . . . . . . . . . . . . . . 3
1.2.1 Accuracy and Integrity . . . . . . . . . . . . . . . . . . . . . . 4
1.2.2 Floating-Point Code . . . . . . . . . . . . . . . . . . . . . . . 5
1.2.3 Expression Complexity . . . . . . . . . . . . . . . . . . . . . . 5
1.2.4 Memory Access Analysis . . . . . . . . . . . . . . . . . . . . . 6
1.3 Contributions . . . . . . . . . . . . . . . . . . . . . . . . . . . . . . . 7
2 The klee-mc Binary Program Symbolic Executor 10
2.1 Introduction . . . . . . . . . . . . . . . . . . . . . . . . . . . . . . . . 10
2.2 Background . . . . . . . . . . . . . . . . . . . . . . . . . . . . . . . . 11
2.2.1 Symbolic Execution . . . . . . . . . . . . . . . . . . . . . . . . 11
2.2.2 Binary Symbolic Execution . . . . . . . . . . . . . . . . . . . 14
2.3 Generating Tests with klee-mc . . . . . . . . . . . . . . . . . . . . . 16
2.4 Design of klee-mc . . . . . . . . . . . . . . . . . . . . . . . . . . . . 18
2.4.1 Program Snapshots . . . . . . . . . . . . . . . . . . . . . . . . 18
2.4.2 Dynamic Binary Translation . . . . . . . . . . . . . . . . . . . 21
2.4.3 Expressions and Solving . . . . . . . . . . . . . . . . . . . . . 27
2.4.4 Scheduling . . . . . . . . . . . . . . . . . . . . . . . . . . . . . 32
vi

2.4.5 Runtime Libraries . . . . . . . . . . . . . . . . . . . . . . . . . 33
2.4.6 Limitations . . . . . . . . . . . . . . . . . . . . . . . . . . . . 39
2.5 Experiments . . . . . . . . . . . . . . . . . . . . . . . . . . . . . . . . 41
2.5.1 Snapshots . . . . . . . . . . . . . . . . . . . . . . . . . . . . . 41
2.5.2 Program Tests and Bugs . . . . . . . . . . . . . . . . . . . . . 43
2.5.3 Coverage . . . . . . . . . . . . . . . . . . . . . . . . . . . . . . 45
2.6 Conclusions . . . . . . . . . . . . . . . . . . . . . . . . . . . . . . . . 47
3 Machine Cross-Checking 49
3.1 Introduction . . . . . . . . . . . . . . . . . . . . . . . . . . . . . . . . 49
3.2 Motivation . . . . . . . . . . . . . . . . . . . . . . . . . . . . . . . . . 50
3.2.1 Bad Paths . . . . . . . . . . . . . . . . . . . . . . . . . . . . . 51
3.2.2 System Complexity . . . . . . . . . . . . . . . . . . . . . . . . 52
3.3 Cross-Checking in klee-mc . . . . . . . . . . . . . . . . . . . . . . . 54
3.3.1 Deterministic Executor Data . . . . . . . . . . . . . . . . . . . 54
3.3.2 Operating System Differencing on the System Model . . . . . 59
3.3.3 Execution Testing with Deterministic Test Replay . . . . . . . 61
3.3.4 Host CPU and the Machine Code Front-End . . . . . . . . . . 63
3.3.5 Constraint Validity for Expressions and Solvers . . . . . . . . 65
3.4 Implementation . . . . . . . . . . . . . . . . . . . . . . . . . . . . . . 68
3.4.1 Static Non-determinism . . . . . . . . . . . . . . . . . . . . . 68
3.4.2 Dynamic Non-determinism . . . . . . . . . . . . . . . . . . . . 68
3.5 Experiments and Evaluation . . . . . . . . . . . . . . . . . . . . . . . 69
3.5.1 Linux Program Test Cases . . . . . . . . . . . . . . . . . . . . 70
3.5.2 Machine Code Front-End . . . . . . . . . . . . . . . . . . . . . 73
3.5.3 System Model . . . . . . . . . . . . . . . . . . . . . . . . . . . 76
3.5.4 Expressions . . . . . . . . . . . . . . . . . . . . . . . . . . . . 78
3.6 Related Work . . . . . . . . . . . . . . . . . . . . . . . . . . . . . . . 81
3.7 Conclusion . . . . . . . . . . . . . . . . . . . . . . . . . . . . . . . . . 82
4 Off-the-Shelf Symbolic Floating-Point 84
4.1 Introduction . . . . . . . . . . . . . . . . . . . . . . . . . . . . . . . . 84
vii

4.2 Related Work . . . . . . . . . . . . . . . . . . . . . . . . . . . . . . . 86
4.3 Soft Floating-Point . . . . . . . . . . . . . . . . . . . . . . . . . . . . 88
4.3.1 Floating-Point Operations . . . . . . . . . . . . . . . . . . . . 88
4.3.2 Runtime Libraries . . . . . . . . . . . . . . . . . . . . . . . . . 90
4.4 Operation Integrity . . . . . . . . . . . . . . . . . . . . . . . . . . . . 93
4.4.1 Gathering Test Cases . . . . . . . . . . . . . . . . . . . . . . . 95
4.4.2 Cross-Checking for Consistency: Interpreter × JIT . . . . . . 97
4.4.3 Cross-Testing for Underspecification Bugs . . . . . . . . . . . 98
4.4.4 Common Pitfalls . . . . . . . . . . . . . . . . . . . . . . . . . 102
4.4.5 Coverage . . . . . . . . . . . . . . . . . . . . . . . . . . . . . . 103
4.5 Floating-Point SMT Solvers . . . . . . . . . . . . . . . . . . . . . . . 104
4.6 Bugs in Linux programs . . . . . . . . . . . . . . . . . . . . . . . . . 106
4.7 Conclusion . . . . . . . . . . . . . . . . . . . . . . . . . . . . . . . . . 108
5 Expression Optimization from Program Paths 109
5.1 Introduction . . . . . . . . . . . . . . . . . . . . . . . . . . . . . . . . 109
5.2 Symbolic Execution and Expressions . . . . . . . . . . . . . . . . . . 111
5.3 Rules from Programs . . . . . . . . . . . . . . . . . . . . . . . . . . . 113
5.3.1 Reductions on Expressions . . . . . . . . . . . . . . . . . . . . 114
5.3.2 EquivDB . . . . . . . . . . . . . . . . . . . . . . . . . . . . . 115
5.3.3 Rewrite Rules . . . . . . . . . . . . . . . . . . . . . . . . . . . 118
5.4 Rule-Directed Optimizer . . . . . . . . . . . . . . . . . . . . . . . . . 120
5.4.1 Pattern Matching . . . . . . . . . . . . . . . . . . . . . . . . . 120
5.4.2 β-reduction . . . . . . . . . . . . . . . . . . . . . . . . . . . . 122
5.5 Building Rule Sets . . . . . . . . . . . . . . . . . . . . . . . . . . . . 122
5.5.1 Integrity . . . . . . . . . . . . . . . . . . . . . . . . . . . . . . 123
5.5.2 Transitive Closure . . . . . . . . . . . . . . . . . . . . . . . . 124
5.5.3 Normal Form Canonicalization . . . . . . . . . . . . . . . . . . 124
5.6 Rule Generalizations . . . . . . . . . . . . . . . . . . . . . . . . . . . 125
5.6.1 Subtree Elimination . . . . . . . . . . . . . . . . . . . . . . . 125
5.6.2 Constant Relaxation . . . . . . . . . . . . . . . . . . . . . . . 126
viii
5.7 Evaluation . . . . . . . . . . . . . . . . . . . . . . . . . . . . . . . . . 128
5.7.1 Implementation . . . . . . . . . . . . . . . . . . . . . . . . . . 129
5.7.2 Test System . . . . . . . . . . . . . . . . . . . . . . . . . . . . 129
5.7.3 Performance . . . . . . . . . . . . . . . . . . . . . . . . . . . . 130
5.7.4 EquivDB . . . . . . . . . . . . . . . . . . . . . . . . . . . . . 132
5.7.5 Rules . . . . . . . . . . . . . . . . . . . . . . . . . . . . . . . . 134
5.8 Related Work . . . . . . . . . . . . . . . . . . . . . . . . . . . . . . . 136
6 Symbolically Executed Memory Management Unit 137
6.1 Introduction . . . . . . . . . . . . . . . . . . . . . . . . . . . . . . . . 137
6.2 Background . . . . . . . . . . . . . . . . . . . . . . . . . . . . . . . . 139
6.2.1 Related Work . . . . . . . . . . . . . . . . . . . . . . . . . . . 139
6.2.2 Symbolic Execution and Memory Accesses . . . . . . . . . . . 140
6.3 A Symbolically Executed MMU . . . . . . . . . . . . . . . . . . . . . 142
6.3.1 Address Space Structures . . . . . . . . . . . . . . . . . . . . 142
6.3.2 Soft Handlers . . . . . . . . . . . . . . . . . . . . . . . . . . . 142
6.4 Access Policies and Analysis . . . . . . . . . . . . . . . . . . . . . . . 146
6.4.1 Symbolic Access Translation . . . . . . . . . . . . . . . . . . . 146
6.4.2 Shadowing Memory . . . . . . . . . . . . . . . . . . . . . . . . 150
6.4.3 Unconstrained Pointers . . . . . . . . . . . . . . . . . . . . . . 154
6.5 Evaluation . . . . . . . . . . . . . . . . . . . . . . . . . . . . . . . . . 158
6.5.1 Implementation Complexity . . . . . . . . . . . . . . . . . . . 158
6.5.2 Dispatch Mechanism . . . . . . . . . . . . . . . . . . . . . . . 158
6.5.3 Policy Microbenchmarks . . . . . . . . . . . . . . . . . . . . . 159
6.5.4 Memory Faults in Linux Programs . . . . . . . . . . . . . . . 160
6.5.5 Profiler . . . . . . . . . . . . . . . . . . . . . . . . . . . . . . . 161
6.5.6 Heap Violations . . . . . . . . . . . . . . . . . . . . . . . . . . 162
6.5.7 Unconstrained Pointers . . . . . . . . . . . . . . . . . . . . . . 164
6.6 Conclusion . . . . . . . . . . . . . . . . . . . . . . . . . . . . . . . . . 167
7 Conclusion 168
7.1 Summary of Contributions . . . . . . . . . . . . . . . . . . . . . . . . 168
ix
7.2 Future Work . . . . . . . . . . . . . . . . . . . . . . . . . . . . . . . . 169
7.2.1 Programs and Modeling . . . . . . . . . . . . . . . . . . . . . 170
7.2.2 Scaling . . . . . . . . . . . . . . . . . . . . . . . . . . . . . . . 171
7.2.3 Coverage . . . . . . . . . . . . . . . . . . . . . . . . . . . . . . 172
7.2.4 Types of Analysis . . . . . . . . . . . . . . . . . . . . . . . . . 173
7.3 Final Thoughts . . . . . . . . . . . . . . . . . . . . . . . . . . . . . . 174
A Glossary 175
Bibliography 179
x
List of Tables
2.1 Number of experimental programs for symbolic execution systems. . . 14
2.2 Selected interpreter intrinsic extensions for runtime libraries. . . . . . 35
2.3 Snapshot counts for binary program collections . . . . . . . . . . . . 41
2.4 Selected command lines triggering memory access faults . . . . . . . . 45
2.5 Selected file inputs triggering memory access faults . . . . . . . . . . 46
2.6 Amount of machine code covered by klee-mc . . . . . . . . . . . . . 46
3.1 Mass checking and cross-checking results on Ubuntu Linux programs. 71
3.2 Valid x86-64 code causing VEX to panic, corrupt register state, or
invoke divergent behavior. . . . . . . . . . . . . . . . . . . . . . . . . 74
3.3 VEX decoder errors found with a static register file. . . . . . . . . . . 75
3.4 Comparison between model and operating system with LTP suite. . . 77
4.1 Rewritten LLVM instructions with corresponding SoftFloat functions 92
4.2 Floating-point operation test cases from symbolic execution. . . . . . 96
4.3 JIT register log cross-checking failures on floating-point library self-tests 98
4.4 Selected library bugs from soft floating-point library consistency tests 99
4.5 Hardware cross-check errors from all distinct floating-point tests . . . 101
4.6 Conformance and library test cases applied to several FPA solvers . . 106
4.7 Bugs found in Linux programs following floating-point computation . 107
5.1 Lines of code for expression optimization . . . . . . . . . . . . . . . . 129
6.1 Trap handler functions for a handler named m with access bit-widths
w = {8, 16, 32, 64, 128}. . . . . . . . . . . . . . . . . . . . . . . . . . . 144
xi

6.2 Runtime primitives for memory access . . . . . . . . . . . . . . . . . 145
6.3 Lines of code for MMU components. . . . . . . . . . . . . . . . . . . 158
6.4 Access faults found with symMMU . . . . . . . . . . . . . . . . . . . 161
6.5 symMMU-derived Heap Violations . . . . . . . . . . . . . . . . . . . 163
6.6 Mismatches against glibc involving unconstrained pointers . . . . . . 167
xii

List of Figures
2.1 A symbolically executed program and its decision tree. . . . . . . . . 11
2.2 Stages of translation annotated by propagation of symbolic state. . . 22
2.3 A solver stack with query serialization isolation. . . . . . . . . . . . . 30
2.4 A library intrinsic to enumerate predicated values . . . . . . . . . . . 36
2.5 Function entry hooks for process exit functions . . . . . . . . . . . . . 39
2.6 Snapshot storage overhead before and after deduplication . . . . . . . 42
2.7 Test cases and paths found during mass testing . . . . . . . . . . . . 43
2.8 Bugs found during mass testing . . . . . . . . . . . . . . . . . . . . . 44
2.9 Observed system call frequency over all programs . . . . . . . . . . . 47
3.1 A user’s limited perspective of a bad path. . . . . . . . . . . . . . . . 51
3.2 A binary symbolic execution stack with multiple replay facilities. . . . 53
3.3 Building a test log during symbolic execution . . . . . . . . . . . . . 57
3.4 Test case log record structures for system calls . . . . . . . . . . . . . 58
3.5 The process for comparing model and operating system side effects. . 61
3.6 Symbolic decoder cross-checking data flow. . . . . . . . . . . . . . . . 63
3.7 Symbolic register file derived constraints to trigger a conditional jump. 65
3.8 Cross-checking two expression builders. . . . . . . . . . . . . . . . . . 67
3.9 A broken floating-point division sequence. . . . . . . . . . . . . . . . 72
3.10 Cumulative time distribution to build register logs for each test case. 73
3.11 Number of basic blocks checked against register log as a function of time. 74
3.12 Time to verify machine-derived rewrite rules. . . . . . . . . . . . . . . 78
3.13 Translation rule test with undefined result. . . . . . . . . . . . . . . . 79
3.14 Bad multiply caught by cross-checking. . . . . . . . . . . . . . . . . . 80
xiii

3.15 A faulty hard-coded optimization . . . . . . . . . . . . . . . . . . . . 80
4.1 IEEE-754 format for single and double precision floating-point data . 88
4.2 Generating program tests and cross-checking soft floating-point . . . 95
4.3 Floating-point test case distribution . . . . . . . . . . . . . . . . . . . 100
4.4 Mistranslation of the cvtsi2ss instruction in the VexIR . . . . . . . 102
4.5 Soft floating-point library code coverage and total covered instructions 104
4.6 A Z3 test case query for checking a single-precision division result . . 106
5.1 Percent time for queries . . . . . . . . . . . . . . . . . . . . . . . . . 110
5.2 Total external solver calls . . . . . . . . . . . . . . . . . . . . . . . . 110
5.3 klee Expression Language Grammar . . . . . . . . . . . . . . . . . . 111
5.4 Storing and checking an expression against the EquivDB . . . . . . . 115
5.5 An example translation verification query . . . . . . . . . . . . . . . 117
5.6 Expression reduction rule grammar . . . . . . . . . . . . . . . . . . . 119
5.7 Acceptance of constant widths on expression equivalence class hits . . 126
5.8 Percentage of queries submitted using rule sets over baseline . . . . . 131
5.9 Percent time for expression optimization over baseline . . . . . . . . . 131
5.10 Query time distribution for baseline and rule test cases . . . . . . . . 133
5.11 Distribution of expressions by node count and bitwidth in EquivDB . 134
5.12 Program rule sharing. . . . . . . . . . . . . . . . . . . . . . . . . . . . 135
5.13 Rules for measured programs. . . . . . . . . . . . . . . . . . . . . . . 135
6.1 Symbolic memory access example code and its intermediate expressions.138
6.2 A memory object shared among three states, an object state shared
between two states, and an unshared object state. . . . . . . . . . . . 142
6.3 The symMMU pointer handling path. . . . . . . . . . . . . . . . . . . 144
6.4 Range checking handler for 8-bit loads. . . . . . . . . . . . . . . . . . 147
6.5 Address concretization for 8-bit loads. . . . . . . . . . . . . . . . . . . 148
6.6 Retrieving a disjunction of shadow values for a symbolic address. . . . 151
6.7 The memcheck shadow state machine. . . . . . . . . . . . . . . . . . 153
6.8 Unconstrained pointer structures. . . . . . . . . . . . . . . . . . . . . 155
xiv

6.9 String microbenchmark testing speed-up. . . . . . . . . . . . . . . . . 161
6.10 Profiler benchmark performance. . . . . . . . . . . . . . . . . . . . . 162
6.11 A tortuous heap read violation in cpio. . . . . . . . . . . . . . . . . . 164
6.12 Simplified IP address parser from musl. . . . . . . . . . . . . . . . . . 166
xv

Chapter 1
Introduction
Complex software rarely functions as intended without going through considerable
testing. Designing and implementing sufficient tests by hand is an arduous task;
automated program analysis tools for finding software bugs promise to help shift
this burden to machines. Unfortunately, such tools are no different from any other
software; they are difficult to correctly construct, test, and debug. This work argues
these challenges become tractable for at least one analysis technique, dynamic binary
symbolic execution, by lacing self-testing capabilities and interchangeable components
throughout the execution stack.
1.1 Motivation
Software defects, despite decades of experience and error, still continue to pose se-
rious risk. Complex computer-controlled systems such as rockets [16] and medical
devices [85] infamously demonstrate two instances of historically catastrophic soft-
ware flaws. Failure to account for coding mistakes and undesirable edge cases means
more than crashed computers and lost work, but also malicious destruction of nu-
clear centrifuges [83], loss of virtual assets [62] and global disruption of public key
encryption infrastructure [112].
Standard software engineering uses a variety of processes and practices to im-
prove code quality. These processes cover an extensive range of techniques, spanning
1

CHAPTER 1. INTRODUCTION 2
from unit tests for dynamically validating software component functionality to static
verification that program properties unconditionally hold. Testing [56], in general,
can describe errors in deployed software, detect functional regressions introduced by
code updates, or assist when creating new features, such as with test-driven devel-
opment [14]. Such test cases challenge the target code with a sequence of inputs
then comparing the computed results against an expected result. Although testing
is commonly automated, test cases are typically developed by a programmer, incur-
ring additional development costs. Worse, testing rarely proves the absolute absence
of errors. Likewise, verification systems cannot infer all intended behavior, hence
requiring programmer-defined specifications or code annotations to guide analysis.
Ideally, there would be a software tool that could generate complete test case
suites capable of covering all distinct behavior in any given program. A software
developer would then simply review these test cases, checking for intended behavior,
and repair all critical bugs. Unfortunately, Rice’s theorem [111] proves the unde-
cidability of discovering non-trivial software defects, such as memory access faults,
buffer overflows, and division by zero, for arbitrary programs. Instead, approaches to
automating program analysis must compromise.
Traditionally these approaches are broadly categorized as either static or dynamic.
A static analysis processes code structure, and therefore has excellent coverage, but
must overapproximate program state to complete in finite time. A dynamic analysis
executes code, and therefore struggles to achieve adequate coverage, but its knowledge
of program state can be precise. In both cases, these algorithms must occasionally
either overlook or misreport program errors.
Despite the intrinsic limits, systems built to analyze programs are effective enough
to be useful in practice [17]. However, a fundamental syllogism still remains: soft-
ware has bugs and program analysis systems are software, therefore these systems
have bugs; a poor implementation promptly undermines any theoretical guarantees.
First, if there is a bug in the system, the exact point of failure is rarely obvious.
Second, poor or overspecialized optimization from tuning for small benchmarks leads
to performance anomalies over diverse program sets. Third, an incomplete or partial

CHAPTER 1. INTRODUCTION 3
implementation that diverges from a precise machine representation due to techni-
cal limitations (e.g., pure source-based analysis) can ignore important code, casting
aside potential sources of defects. Finally, new analysis passes must undergo a lengthy
debugging phase when the system is poorly constructed or pathologically coupled.
In the past, users could be expected to file detailed tool bug reports. As program
analysis systems become more sophisticated and deployments begin to analyze thou-
sands of programs at a time, such a mindset is no longer adequate; too few people
understand the system to make sense of the vast amount of data by hand. To realis-
tically advance the state of the art, a program analysis tool should now be designed
to identify and minimize its own defects.
1.2 Challenges in Symbolic Execution
Symbolic execution systems are especially well-suited to identifying their own errors.
They are dynamic so it is possible to compare intermediate computations against a
baseline execution. They generate their own test cases so they need minimal, if any,
application-specific customization and can therefore process a large class of programs
with little effort. They are sophisticated enough to be interesting.
This thesis primarily deals with correctness and performance for a binary symbolic
execution. Although most of this work applies to symbolic execution in general, a
binary symbolic executor has the convenient property in that its expected ground
truth directly corresponds to a readily available machine specification: physical hard-
ware. Coincidentally, machine code is a popular distribution format for programs;
a great deal of software is already packaged for the executor. Analyzing very large
program sets compounds the problem of dealing with the complicated inner-workings
of a binary symbolic executor to such an extent that debugging and tuning such a
system by hand quickly becomes impractical.
Addressing all open problems for symbolic execution is outside the scope of this
dissertation; we focus on a small but tractable subset. Namely, we observe that a
straightforward binary symbolic execution system on its own is naturally unreliable
and rife with performance pitfalls. First, correctly interpreting code symbolically is

CHAPTER 1. INTRODUCTION 4
rather difficult; since so much state is kept symbolic, an errant computation poten-
tially first manifests far from the point of error. Second, even running common types
of code symbolically, such as floating-point instructions, remains a subject of sus-
tained research. Third, symbolic overhead tends to create very complex expressions
that ruin performance. Finally, building rich metadata describing state, necessary
for many dynamic analysis algorithms, directly into the executor demands onerous
changes to the core system.
1.2.1 Accuracy and Integrity
A symbolic executor runs program code over symbolic inputs to discover paths for
test cases. This involves interpreting the program using symbolic data, symbolically
modeling environment inputs, managing path constraints, and constructing tests by
solving for symbolic variable assignments. For every test case, replacing all symbolic
inputs with a concrete variable assignment should reproduce the followed path.
However, symbolic execution systems are imperfect. An executor may misinterpret
the code. Its symbolic system model, whether emulating system calls or standard
libraries, may diverge from the target environment. Expressions may be misoptimized
and constraints may be corrupted. With this in mind, there is no guarantee a test
case will accurately reflect the derived path when run through the program on a
physical machine.
In light of executor flaws, there are a few options. If a test case fails to replay
its path, the result may simply be thrown away as a false positive; the user never
sees a bad result. If the problem is found to be in the executor itself, the tool author
may be alerted to the problem. However, if the bug is only observed in one or two
programs, it will be marked low priority; determining the cause of the tool bug can be
prohibitive. Worse, if the false positive depends on non-determinism in the executor,
it may be impossible to reliably reproduce the error.

CHAPTER 1. INTRODUCTION 5
1.2.2 Floating-Point Code
User-level programs commonly include floating-point code. If a symbolic executor
supports a wide class of programs then it must handle floating-point instructions.
When floating-point code is symbolically modeled, it should model floating-point
data symbolically by precisely tracking floating-point path constraints. Likewise, the
paths and values should match hardware.
Integer code is necessary for symbolic execution but floating-point is an enhance-
ment. Compared to integers, floating-point operations have complicated semantics
which are more difficult to model correctly. From a design standpoint, treating all
data as integers simplifies the executor implementation by limiting expression types.
Finally, although there are plenty of integer constraint solvers, there are compara-
tively fewer, let alone efficient, floating-point solvers.
Hence the challenge to supporting floating-point code involves striking a balance
among performance, analysis precision, and system complexity. While concretizing
floating-point data [28] avoids symbolic computation entirely, achieving good perfor-
mance with few system modifications, the state becomes underapproximated, losing
paths. Conversely, fully modeling floating-point data precisely [6, 10, 20] keeps all
paths at the cost of additional system complexity and floating-point solver overheads.
Strangely, considering floating-point’s infamous peculiarities [61], testing the correct-
ness of floating-point symbolic execution itself is given little attention.
1.2.3 Expression Complexity
In order to maintain symbolic state, a symbolic executor translates operations from
instructions into symbolic expressions. When there is significant live symbolic data,
the executor generates a great deal of expressions. By keeping expressions small, the
executor reduces overall constraint solver overhead, a main performance bottleneck.
Ideally, expressions would be internally represented using the fewest nodes possible.
These expressions tend to grow quite large despite having logically equivalent,
smaller representations. In essence, building expressions strictly according to the
instruction stream ignores opportunities to fold operations into smaller expressions.

CHAPTER 1. INTRODUCTION 6
Binary symbolic execution magnifies this problem; the most efficient machine code
can induce expression dilation under symbolic execution. Therefore it is important
for a symbolic executor to include an expression optimization component.
Expression optimizations are often coded into the executor as needed. Typically,
the system author observes a program symbolically executes poorly, manually inspects
the expressions, then hand-codes an expression rewrite rule to fix the problem. Even
if this ad-hoc approach could scale to thousands of programs, simply changing a
compiler optimization level would call for a fresh set of rewrite rules. More worrying,
these rules often rely on subtle two’s complement properties, but, since they are
hand-coded, their correctness is difficult to verify.
1.2.4 Memory Access Analysis
Like other dynamic analysis techniques, dynamic symbolic execution can infer extra
semantic information from program memory access patterns. Since pointers may be
symbolic expressions in addition to classical concrete values, the symbolic executor has
the opportunity to apply policy decisions that extend beyond a traditional concrete
dynamic analysis approach. Such policies range from precise symbolic access tracking
to symbolically shadowing program memory with rich metadata.
There is no obviously superior way to handle symbolic memory accesses. Ul-
timately, the access policy and workload greatly affects symbolic execution perfor-
mance, making both underapproximation and overapproximation attractive options.
Although supporting a multitude of policies would be advantageous, symbolic ac-
cesses introduce new edge cases that can easily corrupt state; new policies must be
thoroughly tested. Likewise, built-in reasoning over symbolic state at the executor
level quickly obscures the meaning of any sufficiently sophisticated access analysis.
Contemporary systems disagree on symbolic access policy, suggesting it should
be configurable and tunable. These systems may underapproximate by concretiz-
ing pointers [58, 92], thus losing symbolic state, or precisely reason about accesses by
maintaining symbolic state and possibly forking [28, 29, 52], incurring significant run-
time overhead in the worst case. More complicated runtime policies that manipulate

CHAPTER 1. INTRODUCTION 7
or analyze accesses require deep changes to the executor’s memory subsystem [110],
making development prohibitively difficult. All the while, there is no clean and iso-
lated mechanism for dispatching memory accesses; all policies are directly coded into
the interpreter, cluttering and destabilizing the core system.
1.3 Contributions
This dissertation applies methods for self-testing and validation to the issues outlined
in Section 1.2. The core idea relies on the observation that executor components
are interchangeable, have comparable results, rarely fail in the same way, and hence
can test themselves; checking unreliable components against one another, or cross-
checking, accurately narrows down intricate system bugs. Cross-checking the system
establishes a solid base to build higher-order features with additional self-testing
functionality.
The main contributions of this dissertation are:
1. The design, implementation, and evaluation of a cross-checked dynamic binary
symbolic executor. The system uses a combination of deterministic replay,
intermediate state logging, and model checking to automatically piecewise val-
idate the correctness of symbolically executed paths. Validating correctness
with cross-checking mechanically detects corrupted computation both near the
point of failure in the target program path and close to the failing executor
component. Cross-checking simplifies the tool debugging process by succinctly
describing bugs otherwise missed in the deluge of data from analyzing programs
by the thousand. Aside from detecting tool bugs, this is the first binary sym-
bolic executor which can confirm the correctness of symbolically derived paths
from the symbolic interpreter down to the hardware.
2. A self-testing system for symbolically executing floating-point code with soft
floating-point libraries. To support symbolic floating-point data using only a
bit-vector arithmetic constraint solver, the executor rewrites floating-point in-
structions to call into integer-only soft floating-point libraries. This approach

CHAPTER 1. INTRODUCTION 8
dramatically lessens the effort necessary for symbolically evaluating floating-
point data over prior work by reusing code meant for emulating floating-point in-
structions on integer-only computer architectures. Furthermore, this approach
is self-testing; since the underlying implementation is no different from any other
code; symbolically executing each library with symbolic inputs produces high-
coverage test cases for floating-point operations. Applying these tests against
all soft floating-point libraries, floating-point constraint solvers, and hardware,
uncovers serious library and floating-point constraint solver bugs.
3. An expression optimizer which automatically discovers and generates useful re-
duction rules. The optimizer exercises the hypothesis that programs are locally
similar and therefore symbolically executing a large set of distinct programs
will produce structurally different but semantically equivalent expressions. To
this end, the optimizer learns reduction rules for rewriting large expressions to
smaller expressions by searching a novel fingerprint based global store of ex-
pressions observed during symbolic execution. These rules are compatible with
cross-checking and can be validated as they are applied at runtime. Unlike
ad-hoc hand-written rewrite rules, every rule translates to a constraint satisfac-
tion query for proving the rule’s correctness offline. Finally, the learned rules
demonstrably reduce the number of constraint solver calls and total solver time
when applied to a set of thousands of binary programs.
4. An efficient symbolically executed memory access mechanism and set of symbol-
ically executed memory access policies. A novel memory dispatch mechanism,
termed the symMMU, forwards target program memory accesses to special run-
time code. This shifts otherwise expensive and complicated memory access
policies away from executor scope to the target program scope which is better
suited for reasoning about symbolic data. Policies become easier to implement
and less susceptible to performance anomalies; the symMMU reimplementation
of the default access policy both detects more program bugs and reports fewer
false positives. Furthermore, multiple policies can be stacked to seamlessly com-
pose new policies. Finally, new policies written against the symMMU extend the

CHAPTER 1. INTRODUCTION 9
symbolic executor’s functionality to use heavy-weight metadata without inva-
sive executor changes; these policies include an access profiler, a heap violation
checker, and lazy buffer allocation.

Chapter 2
The klee-mc Binary Program
Symbolic Executor
2.1 Introduction
This chapter outlines the background for symbolic execution along with the design of
klee-mc, a machine code revision of the klee symbolic executor and the basis of this
dissertation. The intent is to provide a context for the next chapters’ topics under
one coherent overview. This chapter also describes and justifies important klee-mc
features in detail which, although integral to the system’s operation as a whole, are
primarily incidental to the content of other chapters.
The rest of this chapter is structured as follows. First, Section 2.2 provides a
primer on symbolic execution and a survey of systems from past to present. Sec-
tion 2.3 follows an example symbolic execution of a binary program using klee-mc.
Section 2.4 highlights significant design choices made in the klee-mc system. Sec-
tion 2.5 gives results from applying klee-mc to a large set of programs across three
architectures. Finally, Section 2.6 makes a few concluding remarks.
10

CHAPTER 2. THE KLEE-MC BINARY PROGRAM SYMBOLIC EXECUTOR 11
1 i n t main ( void ) {2 i n t x = 0 , y = 0 ;3 read (0 , &x , 4 ) ;4 read (0 , &y , 4 ) ;5 i f ( x > 10)6 re turn 2 ;7 e l s e i f ( y > 7)8 re turn 3 ;9 re turn 0 ; }
Figure 2.1: A symbolically executed program and its decision tree.
2.2 Background
Conceivably, dynamic symbolic execution is a straightforward extension to normal
program execution. Systems that mark inputs as symbolic then explore the feasible
program paths have been known since at least the 1970s, but research stagnated, likely
due to a combination of hardware limitations and high overheads. However, within
the past decade there has been a flurry of developments in source-based symbolic
execution systems [108]. Following this trend, many symbolic executors now target
machine code (i.e., “binary”) programs, although with considerable difficulty.
2.2.1 Symbolic Execution
Symbolic execution is a dynamic analysis technique for automated test-case gener-
ation. These test cases describe paths to bugs or interesting program properties in
complicated or unfamiliar software. Conceptually, inputs (e.g., file contents, net-
work messages, command line arguments) to a program are marked as symbolic and
evaluated abstractly. When program state reaches a control decision, such as an if
statement, based on a symbolic condition, a satisfiability query is submitted to a the-
orem prover backed solver. For an if, when the symbolic condition is contingent the
state forks into two states, and a corresponding predicate becomes a path constraint
which is added to each state’s constraint set. Solving for the state’s constraint set
creates an assignment, or test case, which follows the state’s path.
Figure 2.1 illustrates symbolic execution on a simple C program. On the left, a

CHAPTER 2. THE KLEE-MC BINARY PROGRAM SYMBOLIC EXECUTOR 12
program reads integers x and y from file descriptor 0 (conventionally, the “standard
input”), then exits with a return code which depends on the input values. Assuming
the read succeeds, the symbolic executor marks the inputs x and y as symbolic.
Based on these symbolic inputs and given enough time, the executor follows every
feasible program path, illustrated by complete decision tree on the right. Each internal
node represents a control decision, each edge describes a path constraint imposed by
making a control decision, and each leaf is a path termination point. At the root of
the tree is the first control decision, whether x > 10. Since x is unconstrained, the
executor forks the program into two states, adding the path constraint {x > 10} to
one and its negation, {x ≤ 10}, to the other. The nodes in gray highlight a single
complete path through the decision tree; the union of edges in the path define the
path’s unique constraint set, {x ≤ 10, y > 7} in this case. Solving for a satisfying
variable assignment of the constraint set gives concrete inputs which reproduce that
path (e.g., {x = 10, y = 8}); this is the path’s test case. By completely traversing
the decision tree the executor follows all possible control decisions for the program
given inputs x and y. By solving for the constraints leading to each leaf, the executor
produces tests for every possible program path.
Unlike more established systems software such as databases, operating systems,
or compilers, a complete design philosophy for symbolic executors remains somewhat
ill-defined. Still, common themes and patterns emerge; these are reflected in the
klee-mc description in Section 2.4. First, symbolic executors have a fundamental
data type of expressions over symbolic variables (§ 2.4.3) which precisely describe
operations over symbolic inputs. The sources of these inputs, such as file or network
operations, must be defined with a system model (§ 2.4.5) to mark data symbolic
when appropriate for the target program’s platform. When used in control decisions,
such inputs form path constraints with solutions derived by a constraint solver based
on some satisfiability decision procedure. From the solver’s solutions, a symbolic
executor must generate test cases. Since the number of paths in a program may
be infinite, a symbolic executor must choose, or schedule (§ 2.4.4), some paths to
evaluate first before others.
Historically, the first symbolic execution systems appeared in the late 1970s [21,

CHAPTER 2. THE KLEE-MC BINARY PROGRAM SYMBOLIC EXECUTOR 13
39, 69, 77, 109]. The genesis of symbolic execution is most often attributed to King’s
EFFIGY [77] system, perhaps due to his earlier work on program verification. On the
other hand, several contemporary projects were similar in that they symbolically ex-
ecuted FORTRAN source code [39, 69, 109]. The SELECT [21] system, whose group
equally acknowledged King (seemingly sharing preprints) but published slightly ear-
lier, has the distinction of processing LISP. Regardless, due to the weaknesses of
hardware and constraint solvers of the time, these systems were typically cast as en-
hanced interactive proof systems and were limited to analyzing small programs. The
authors of CASEGEN [109], for instance, note execution rates of 10 statements per
CPU-second and processing times of half a second for each constraint (limit 10 con-
straints). At a high level, all shared the basic concept of assigning states constraints by
way of control decisions predicated on symbolic data. Likewise every system acknowl-
edged modern problems in symbolic execution, such as handling language primitives,
environment modeling, path explosion by loops, and indexing symbolic arrays.
Since the early 2000’s, symbolic execution has undergone a period of intense
renewed interest. A large variety of new systems have emerged, most processing
source code or intermediate representation code. These systems include support
.NET [127], C [29, 58, 119], C++ [86], Java [75, 133], Javascript [4], LLVM [28],
PHP [5], and Ruby [31] to name a few. Usually the aim of this research is di-
vided between targeting symbolic execution of new types programs (e.g., through
a different language or modeling new features), possibly detecting new types of
bugs [10, 45, 87, 116, 122] and new algorithms for improving performance on ex-
pensive workloads [27, 35, 81, 121, 130, 134].
Certainly the technology behind symbolic execution has vastly improved, but it
is unclear to what extent. In essence, too few programs are analyzed, it is difficult to
verify the bugs in these programs, and the programs require significant manual con-
figuration. Table 2.1 lists a small survey of the total programs tested under a variety
of published symbolic execution systems. Although the average dearth of tested pro-
grams in practice may be justifiable due to type of code being tested (e.g., there are
only so many operating system kernels), it raises serious questions regarding whether
many techniques are effective overall or merely reflect considerable fine-tuning.

CHAPTER 2. THE KLEE-MC BINARY PROGRAM SYMBOLIC EXECUTOR 14
Project ProgramsApollo [5] 6Artemis [4] 10BitScope [23] 8CatchConv [96] 7Cloud9 [37] 107CREST [27] 3CUTE [119] 8DART [58] 3EXE [29] 8FuzzBall [92] 4GKLEE [87] 22KLEE [28] 440KLOVER [86] 9
Project ProgramsMACE [35] 4ParSym [121] 2PathFinder [75] 2Pex [127] 9S2E [34] 8SAGE [59] “100s”SCORE [76] 6Splat [134] 4TaintScope [130] 19Thresher [18] 7VexSym [65] 4Woodpecker [44] 136zesti [91] 91
Table 2.1: Number of experimental programs for symbolic execution systems.
2.2.2 Binary Symbolic Execution
Since this work concerns dynamic binary symbolic execution, we pay special attention
to its development. These systems hold the promise of supporting a large class of
programs without the need for hand tuning. At its core, a binary symbolic execu-
tor combines the two well-established disciplines of symbolic execution and dynamic
binary translation to run machine code programs. On the other hand, the exten-
sive range of software compatible with a binary symbolic executor can make it a
victim of its universality; obscure programs pave way for obscure executor bugs (of-
ten exacerbated by additional system complexity), the flood of new analysis data is
unmanageable by hand, and designing optimizations on a per-program basis rapidly
yields diminishing returns.
The convenience of applying dynamic analysis to unmodified program binaries led
to binary symbolic execution [30, 34, 59, 92, 96, 124, 131]. Under binary symbolic ex-
ecution, compiled executables are symbolically processed as-is and unmodified; there
is no intrinsic need for recompilation, annotations, or special linking. If a program
can run on its host system, it should be possible to subject it to binary symbolic
execution provided a suitable symbolic system model to simulate host inputs.

CHAPTER 2. THE KLEE-MC BINARY PROGRAM SYMBOLIC EXECUTOR 15
Dynamic binary translators (DBTs) heavily influenced the design of dynamic bi-
nary symbolic executors. Unlike a static binary translator, a DBT translates machine
code on demand as a target program runs; all relevant code falls under a DBT’s
purview. A DBT translates machine code instructions into a simplified intermedi-
ate representation, possibly modifying the code’s semantics, before recompiling the
data to the host’s instruction format. In practice, DBTs are deployed to transpar-
ently optimize programs [7] emulate code across computer architectures [15, 33], and
dynamically instrument code for program analysis [89, 100, 125].
A typical binary symbolic execution system pairs a traditional symbolic executor
with a dynamic binary translation front-end; the DBT converts a program’s ma-
chine code to simpler instructions suitable for symbolic execution. Many dynamic
binary symbolic executors reuse off-the-shelf DBT software (machine decoding is
non-trivial [103]) such as Pin [32], QEMU [34], and Valgrind [65, 92, 96]. On the
other hand, it is possible to build a binary symbolic executor using static disassem-
bly [131], but at the cost of some system flexibility. Similarly, some systems use
custom decoders [30, 59], although admittedly still with some trouble [60].
The thousands of arbitrary machine code programs immediately available for bi-
nary symbolic execution presents a fresh set of challenges. A dynamic binary symbolic
executor intrinsically comprises a complicated, sophisticated stack of unreliable com-
ponents; it will break in unexpected ways. Worse, the complexity and depth of execu-
tion within such a system leaves little recourse for swiftly repairing observed defects.
Even if the executor appears to perform as intended, understanding results from thou-
sands of programs requires considerable expertise. Similarly, shortcuts for improving
the executor, whether by focusing on several programs or piling on highly-coupled fea-
tures that brazenly cut across separated concerns, either attains imperceivable gains
across many programs or leaves the system incomprehensible and unworkable. This
dissertation demonstrates that addressing these challenges directly makes it possible
to rapidly develop a stable, novel, and mature binary symbolic executor.

CHAPTER 2. THE KLEE-MC BINARY PROGRAM SYMBOLIC EXECUTOR 16
2.3 Generating Tests with klee-mc
Although klee-mc works best as an automated system, using a collection of scripts
for bulk processing, this section is meant to walk through the basic process for running
a binary program under klee-mc. For this example, we will use the LLVM opt
program with a command line argument f.
In most cases, klee-mc reads its initial guest program state and code from a
program process snapshot. We will first acquire a snapshot and save it to disk; this
will make the replay process straightforward. The snapshot loaded by a snapshotter,
pt run. Once opt reaches its entry point, pt run saves the image to the file system:
VEXLLVM SAVE=1 pt run /usr/bin/opt f
Next, we run the symbolic executor klee-mc. The command line flag -guest-type
tells the system to read snapshot data from guest-last, a symlink to the last saved
snapshot in the current directory. Since klee-mc is primarily a research system,
there are a great deal of command line arguments (391 as of writing); the default set-
tings script uses about sixty flags to tune scheduler, solver, expression optimizer,
memory management, and other aspects of the executor. The rest of the flags
in the example control the state scheduler; a running state receives a five second
quanta (-batch-time=5), states are scheduled based on fewest dispatched instructions
(-use-interleaved-MI) and coverage of new branches (-use-fresh-branch-search),
scheduler policy is decided by code coverage rates (-use-ticket-interleave), and
a state’s quanta is reimbursed by covering new code (-use-second-chance).
klee-mc -guest-type=sshot -use-ticket-interleave -use-second-chance
-use-batching-search -batch-time=5
-use-interleaved-MI -use-fresh-branch-search -
klee-mc finds a memory fault on the 115th completed path. The error report
includes a stack trace of the program state at the point of failure, the faulting memory
address, and the nearest valid address:
Error : memory e r r o r : out o f bound po in t e r
Stack :
#0 in ZN4llvm13BitcodeReader17MaterializeModuleEPNS 6ModuleE+0x0
#1 in ZN4llvm6Module14MaterializeAllEPSs+0x9
#2 in ZN4llvm6Module25MaterializeAllPermanentlyEPSs+0x0
#3 in ZN4llvm16ParseBitcodeFileEPNS 12MemoryBufferERNS 11LLVMContextEPSs+0x16
#4 in ZN4llvm7ParseIREPNS 12MemoryBufferERNS 12SMDiagnosticERNS 11LLVMContextE+0xf4

CHAPTER 2. THE KLEE-MC BINARY PROGRAM SYMBOLIC EXECUTOR 17
#5 in ZN4llvm11ParseIRFileERKSsRNS 12SMDiagnosticERNS 11LLVMContextE+0x2b0
#6 in main+0x1c0
#7 in libc start main+0xb1
#8 in start+0x0
address : 0x30
next : ob j e c t at 0x400000 o f s i z e 4096
Next, to confirm the result independently of the symbolic executor, the test is
replayed using kmc-replay. The kmc-replay utility runs the guest snapshot through
a concrete dynamic binary translator, filling in system call data by reading off test
data generated by klee-mc. We show the final 10 lines:
KMC RECONS FILES=1 kmc-replay 115 | tail -n10
[ kmc−r ep lay ] Ret i red : sys=13 ( r t s i g a c t i on ) . xsys=13. r e t=( n i l ) .
[ kmc−r ep lay ] Applying : sys=13 ( r t s i g a c t i on )
[ kmc−r ep lay ] Ret i red : sys=13 ( r t s i g a c t i on ) . xsys=13. r e t=( n i l ) .
[ kmc−r ep lay ] Applying : sys=2 ( open )
[ kmc−sc ] OPEN ” f ” r e t=0x3
[ kmc−r ep lay ] Ret i red : sys=2 ( open ) . xsys=2. r e t=0x3 .
[ kmc−r ep lay ] Applying : sys=5 ( f s t a t )
[ kmc−r ep lay ] Ret i red : sys=5 ( f s t a t ) . xsys=5. r e t=( n i l ) .
[ kmc−r ep lay ] Applying : sys=17 ( pread64 )
Caught SIGSEGV but the mapping was a normal one @ 0x30
Replaying the test with the KMC RECONS FILES set means kmc-replay recon-
structed files symbolically derived in the test case by replaying the test’s system calls
back to the file system (e.g., open creates a file, pread64 writes data). This gives a
file recons.0 which has contents that corresponds to a variable assignment, from a
pread64 system call, in the test as given by the ktest-tool utility:
ob j e c t 4 : name : ’ readbuf 1 ’
ob j e c t 4 : s i z e : 8
ob j e c t 4 : data : ’BC\xc0\xde\n\n\n\n ’
Finally, putting the data back into opt confirms the memory fault natively on the
host by using the gdb debugger to find a matching (demangled) backtrace:
gdb --args opt recons.0
( gdb ) run
Program rec e i v ed s i g n a l SIGSEGV, Segmentation f a u l t .
. . . in l lvm : : BitcodeReader : : Mater ia l izeModule ( l lvm : : Module∗) ( ) from /usr / l i b /libLLVM−3.4. so
( gdb ) bt
#0 . . . in llvm : : BitcodeReader : : Mater ia l i zeModule ( llvm : : Module∗) ( ) from /usr / l i b /libLLVM−3.4. so
#1 . . . in llvm : : Module : : Ma t e r i a l i z eA l l ( std : : s t r i n g ∗) ( ) from /usr / l i b /libLLVM−3.4. so
#2 . . . in llvm : : Module : : Mater ia l i zeAl lPermanent ly ( . . . ) ( ) from /usr / l i b /libLLVM−3.4. so
#3 . . . in llvm : : Par seB i t codeF i l e ( . . . ) ( ) from /usr / l i b /libLLVM−3.4. so
#4 . . . in llvm : : ParseIR ( . . . ) ( ) from /usr / l i b /libLLVM−3.4. so
#5 . . . in llvm : : Parse IRFi le ( . . . ) ( ) from /usr / l i b /libLLVM−3.4. so
#6 . . . in main ( )

CHAPTER 2. THE KLEE-MC BINARY PROGRAM SYMBOLIC EXECUTOR 18
2.4 Design of klee-mc
This section explains and justifies the major design decisions that went into klee-mc.
On one hand, the design is partially motivated by simply having the system run at
all; this highlights the changes necessary to retrofit a symbolic executor with machine
code capabilities. On the other hand, the rest of the design focuses on robustness so
that the system rarely breaks.
2.4.1 Program Snapshots
In order to execute a program, the symbolic executor must first have some way to load
the program into an internal representation. klee-mc uses process snapshots, point-
in-time copies of running program states, as its native initial representation of guest
programs. A snapshot is a copy of all resources from a running process; the reasoning
being that the symbolic executor can load a snapshot as a guest easier than starting
from a bare program. A process snapshot contains the data necessary to reconstruct
the state of a program running on a host system in klee-mcwith minimal processing
and inspection.
Snapshots sidestep many of the issues that would otherwise arise from building a
custom program loader. If a program runs on a host, klee-mc can likely record and
run its snapshot, ultimately giving the system a wide program reach. Furthermore, by
decoupling the snapshotting process from the symbolic execution phase with indepen-
dent snapshotter programs, klee-mc symbolically executes programs from platforms
where it cannot run natively. Since snapshots are immutable, they resist side-effects
and non-determinism from new libraries, different linkers, and address space ran-
domization over multiple runs, which becomes relevant for replay cross-checking in
Chapter 3.
Snapshot Structure
Snapshots save the machine configuration of a running program process from a live
system for later use. The system snapshots a binary program by launching it as a
process and copying out all relevant resources; the snapshot has all data necessary

CHAPTER 2. THE KLEE-MC BINARY PROGRAM SYMBOLIC EXECUTOR 19
to rebuild the state of a running program within klee-mc for symbolic execution.
Likewise, to avoid complicating the executor with many special cases or making snap-
shots too onerous to build without sophisticated infrastructure, snapshots must be
somewhat generic in to support a variety of architectures and system platforms.
Snapshot data is structured as a directory tree of files representing resources loaded
from the process. The format is reasonably platform agnostic and portable; most
snapshot resources describe only the machine configuration information necessary for
programs to run with few, if any, strict assumptions about the host operating system.
These resources include:
Registers. The register file contains the stack pointer, program counter, floating-
point registers, vector registers, and general purpose registers. For processes with
threads, user registers for each thread (sometimes called the thread’s “context”) are
stored as individual files in a thread directory. Additionally, this includes system reg-
isters not directly accessible or modifiable by the program but necessary for program
execution (e.g., segment registers and descriptor tables for thread local storage).
Memory. Code and data from the process image are stored as files in a directory
containing all process memory. Each file represents a contiguous memory range from
the process, thereby keeping total file count low, reducing overhead, while exposing
the logical address space organization at the file system level, simplifying tooling.
These ranges include all libraries, heaps, and stacks and ensures all data remains
consistent from run to run. Memory ranges are disjoint, page-aligned, have access
permissions, and occasionally have names (e.g., memory mapped files); this extra
metadata is kept in a memory map information file.
Symbols. Assigning meaningful names to ranges of memory enhances the read-
ability of the symbolic analysis. Symbols from the program binary give these names
to ranges of memory. Symbol information is extracted from the process either by
analyzing the backing files (e.g., the program binary and its libraries) or through sys-
tem symbol facilities. The symbols are listed by symbol name and address range, and
are stored in a single text file. If no symbol information is available (e.g., stripped
binaries), the snapshot is still valid, but functions will be labeled by memory address.
Platform Specifics. Although snapshots ideally keep process details platform

CHAPTER 2. THE KLEE-MC BINARY PROGRAM SYMBOLIC EXECUTOR 20
agnostic, sometimes it is necessary to store data specific to a particular runtime model.
Information specific to the process host’s operating system is stored to the snapshot’s
platform-specific directory. For instance, the Windows pointer encoding key, which
decodes function pointers in core libraries at runtime, is stored as a platform attribute.
It is the responsibility of the symbolic system model to access the platform files. In the
future, richer models may use additional platform details; keeping platform-specific
information in one place will ease the development of such models.
Snapshotter
Each snapshot is collected by a snapshotting program, the snapshotter. Since snap-
shots have few dependencies on the rest of the klee-mc system, snapshotter code
can run on more systems than klee-mc itself (e.g., 32-bit architectures, non-Linux
operating systems), thus expanding the executor’s program reach without having to
port the system to new hosts. In fact, while snapshots may be portable, the snap-
shotter itself is not; fortunately, the host features necessary to build a snapshotter
correspond with features necessary to build a program debugger and therefore are
common to modern operating systems. Additionally, since points of interest in a pro-
cess’s execution may vary from program to program, the snapshotter has flexibility
in how and when it takes a snapshot.
A snapshotter stops a program and read its resources. In this sense, a snapshotter
is similar to a breakpointing debugger, which must stop a program at user-defined lo-
cations and read off program state when requested. For Linux, a debugger controls the
process with ptrace and reads process information from procfs. For Windows, the
functions DebugActiveProcess, DebugBreakProcess, and so forth control the pro-
cess like ptrace whereas calls to functions like OpenProcess, EnumProcessModules,
and VirtualQueryEx access process information like procfs.
We found several modes for acquiring a snapshot useful in practice:
Program Entry Point. The first snapshot is taken immediately prior to dis-
patching the first system call past the program’s entry point. This captures the entire
program’s system call trace starting from its entry.
Launch and Wait. The snapshotter launches the process and traces system calls.

CHAPTER 2. THE KLEE-MC BINARY PROGRAM SYMBOLIC EXECUTOR 21
Once the process dispatches the specified system call, it is snapshotted. Launching
and waiting helped when snapshotting Linux programs compiled as libraries because
the entry point is chosen by the runtime linker. The snapshotter waits for the first
munmap since the linker only unmaps memory immediately before calling the library
initialization function.
Process Attach. Begin snapshotting an already active program. Attaching is
useful for tracing interactive and long-running programs (e.g., web servers, network
file servers, and graphical user interfaces); the snapshot often begins at a system call
where the program is blocked and waiting for some input (e.g., select).
Attach and Wait. Snapshot an already active program once it encounters a
particular system call. Waiting for a system call is useful for capturing specific runtime
events such as opening new files.
2.4.2 Dynamic Binary Translation
A dynamic binary translator converts a running program’s machine instructions to
a practical intermediate representation (IR) on demand. klee-mc uses a DBT to
translate its guest code from machine instructions, often x86-64 code, to the LLVM
IR for symbolic execution. The system converts machine code to LLVM IR in two
stages: first from machine code to the VEX IR using the valgrind [100] front-end,
then from the VEX IR to LLVM IR using a custom translation pass. In addition to
applying the DBT to the symbolic executor, we developed a just-in-time interpreter
(JIT) which compiles the LLVM IR back to machine code using the LLVM JIT then
runs the code to test the correctness of concrete execution; the JIT independently
confirms symbolically derived test cases to rule out symbolic executor errors when
processing LLVM IR from genuine machine code translation errors. For klee-mc to
work with the DBT, we significantly modify klee’s instruction dispatch system to
support jumping between dynamically generated LLVM functions that model basic
blocks of machine code.

CHAPTER 2. THE KLEE-MC BINARY PROGRAM SYMBOLIC EXECUTOR 22
C Machine (x86-64)
int main(void){ char *bad=NULL;int sym = 0;read(0, &sym, sizeof(sym));if (sym != 0) *bad=1;return 0; }
main:
400450: sub $0x18,%rsp
400454: xor %edi,%edi
400456: mov $0x4,%edx
40045b: lea 0xc(%rsp),%rsi
400560: movl $0x0,0xc(%rsp)
400568: callq read40056d: mov 0xc(%rsp),%eax400571: test %eax,%eax400573: je 40057d400575: movb $0x1,0x0
40057d: xor %eax,%eax
40057f: add $0x18, %rsp
400583: retq
VEX LLVM
IMark(0x40056D, 4)
t6 = 32Uto64(LDle(Add64(GET(32),0xC)))PUT(0) = t6IMark(0x400571, 2)
PUT(128) = 0x13:I64
t12 = 32Uto64(And(64to32(t6),64to32(t6)))PUT(136) = t12PUT(144) = 0x0:I64
IMark(0x400573, 2)
PUT(168) = 0x400573:I64
if (CmpEQ64(Shl64(t12,0x20),0x0))goto 0x40057D
goto 0x400575
define i64 @sb 0x40056d(%regTy*) {%regCtx = bitcast %regTy* %0 to i64*
%RSP = getelementptr %regCtx, i32 4
%1 = load i64* %RSP
%2 = add %1, 12
%loadP = inttoptr %2 to i32*
%3 = load i32* %loadP, align 8...
store 4195699, i64* %RIP
%9 = shl i64 %8, 32%10 = icmp eq i64 %9, 0br i1 %10, %exit then, %exit elseexit then: ret 0x40057d
exit else: ret 0x400575 }
Figure 2.2: Stages of translation annotated by propagation of symbolic state.
VEX-to-LLVM
This section describes the process for translating from machine code to LLVM code
in klee-mc’s VEX-to-LLVM translation layer. As a guiding example, Figure 2.2
illustrates the stages of code translation in the DBT, showing which instructions would
process symbolic data under symbolic execution. The example goes from human-
friendly C source, a snippet of its compiled machine code, the snippet’s VEX IR,
then finally, the LLVM code suitable for symbolically execution.
The C code in the top left of Figure 2.2 is a small program that crashes given
a non-zero input. The program issues a read system call that writes data to the
sym variable. If the read succeeds and stores a non-zero value, the code dereferences
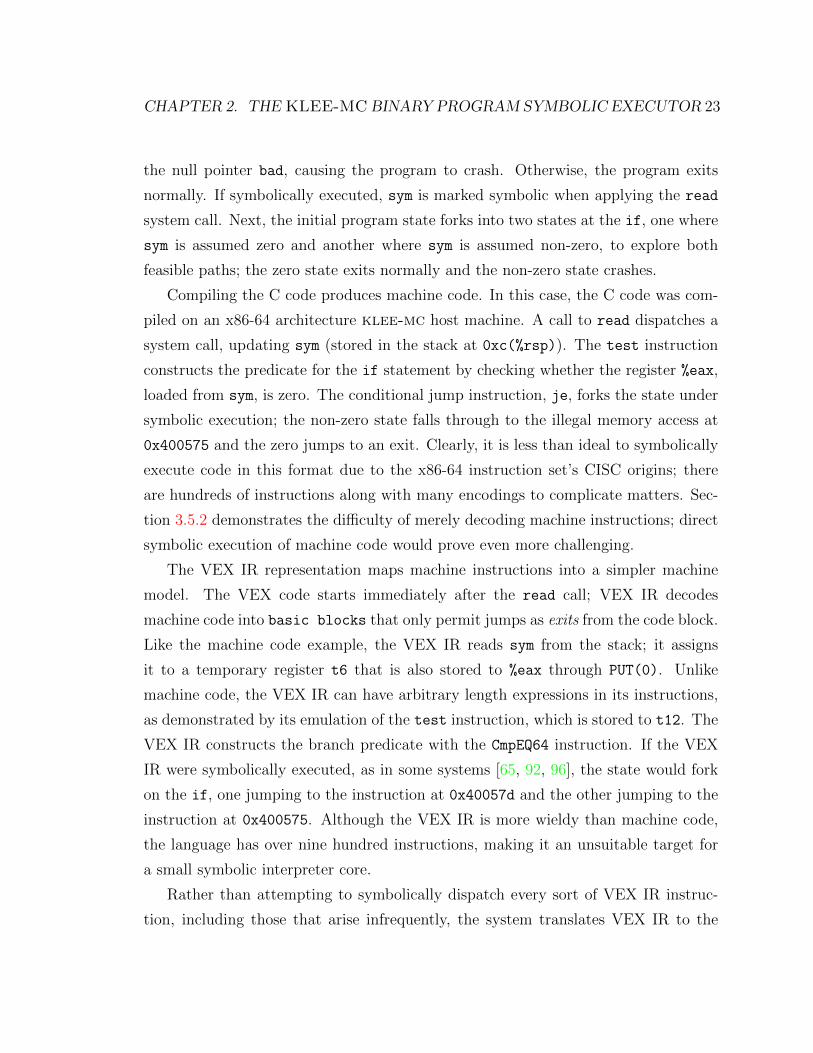
CHAPTER 2. THE KLEE-MC BINARY PROGRAM SYMBOLIC EXECUTOR 23
the null pointer bad, causing the program to crash. Otherwise, the program exits
normally. If symbolically executed, sym is marked symbolic when applying the read
system call. Next, the initial program state forks into two states at the if, one where
sym is assumed zero and another where sym is assumed non-zero, to explore both
feasible paths; the zero state exits normally and the non-zero state crashes.
Compiling the C code produces machine code. In this case, the C code was com-
piled on an x86-64 architecture klee-mc host machine. A call to read dispatches a
system call, updating sym (stored in the stack at 0xc(%rsp)). The test instruction
constructs the predicate for the if statement by checking whether the register %eax,
loaded from sym, is zero. The conditional jump instruction, je, forks the state under
symbolic execution; the non-zero state falls through to the illegal memory access at
0x400575 and the zero jumps to an exit. Clearly, it is less than ideal to symbolically
execute code in this format due to the x86-64 instruction set’s CISC origins; there
are hundreds of instructions along with many encodings to complicate matters. Sec-
tion 3.5.2 demonstrates the difficulty of merely decoding machine instructions; direct
symbolic execution of machine code would prove even more challenging.
The VEX IR representation maps machine instructions into a simpler machine
model. The VEX code starts immediately after the read call; VEX IR decodes
machine code into basic blocks that only permit jumps as exits from the code block.
Like the machine code example, the VEX IR reads sym from the stack; it assigns
it to a temporary register t6 that is also stored to %eax through PUT(0). Unlike
machine code, the VEX IR can have arbitrary length expressions in its instructions,
as demonstrated by its emulation of the test instruction, which is stored to t12. The
VEX IR constructs the branch predicate with the CmpEQ64 instruction. If the VEX
IR were symbolically executed, as in some systems [65, 92, 96], the state would fork
on the if, one jumping to the instruction at 0x40057d and the other jumping to the
instruction at 0x400575. Although the VEX IR is more wieldy than machine code,
the language has over nine hundred instructions, making it an unsuitable target for
a small symbolic interpreter core.
Rather than attempting to symbolically dispatch every sort of VEX IR instruc-
tion, including those that arise infrequently, the system translates VEX IR to the
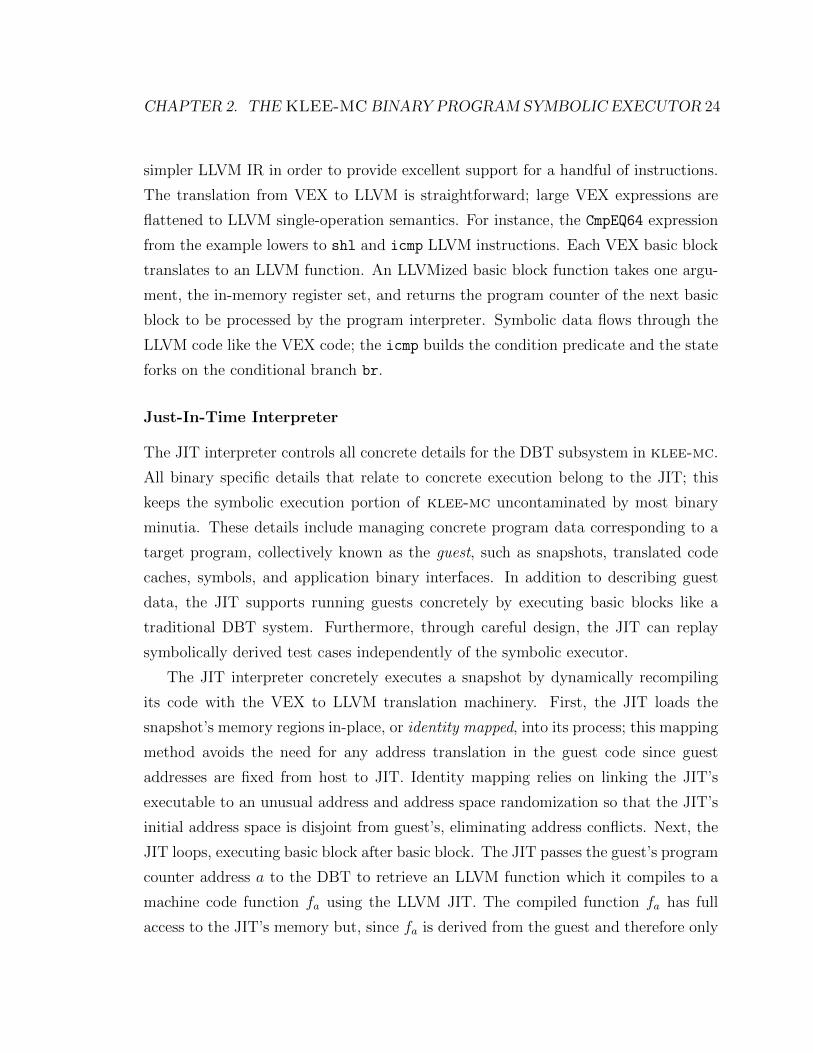
CHAPTER 2. THE KLEE-MC BINARY PROGRAM SYMBOLIC EXECUTOR 24
simpler LLVM IR in order to provide excellent support for a handful of instructions.
The translation from VEX to LLVM is straightforward; large VEX expressions are
flattened to LLVM single-operation semantics. For instance, the CmpEQ64 expression
from the example lowers to shl and icmp LLVM instructions. Each VEX basic block
translates to an LLVM function. An LLVMized basic block function takes one argu-
ment, the in-memory register set, and returns the program counter of the next basic
block to be processed by the program interpreter. Symbolic data flows through the
LLVM code like the VEX code; the icmp builds the condition predicate and the state
forks on the conditional branch br.
Just-In-Time Interpreter
The JIT interpreter controls all concrete details for the DBT subsystem in klee-mc.
All binary specific details that relate to concrete execution belong to the JIT; this
keeps the symbolic execution portion of klee-mc uncontaminated by most binary
minutia. These details include managing concrete program data corresponding to a
target program, collectively known as the guest, such as snapshots, translated code
caches, symbols, and application binary interfaces. In addition to describing guest
data, the JIT supports running guests concretely by executing basic blocks like a
traditional DBT system. Furthermore, through careful design, the JIT can replay
symbolically derived test cases independently of the symbolic executor.
The JIT interpreter concretely executes a snapshot by dynamically recompiling
its code with the VEX to LLVM translation machinery. First, the JIT loads the
snapshot’s memory regions in-place, or identity mapped, into its process; this mapping
method avoids the need for any address translation in the guest code since guest
addresses are fixed from host to JIT. Identity mapping relies on linking the JIT’s
executable to an unusual address and address space randomization so that the JIT’s
initial address space is disjoint from guest’s, eliminating address conflicts. Next, the
JIT loops, executing basic block after basic block. The JIT passes the guest’s program
counter address a to the DBT to retrieve an LLVM function which it compiles to a
machine code function fa using the LLVM JIT. The compiled function fa has full
access to the JIT’s memory but, since fa is derived from the guest and therefore only
CHAPTER 2. THE KLEE-MC BINARY PROGRAM SYMBOLIC EXECUTOR 25
“knows” about guest data, memory accesses rarely, if ever, touch JIT memory; either
fa manipulates the guest state or it crashes the guest. After the JIT runs fa, the
function returns a new address b which is used as the base for the next basic block
to run. This process of dispatching basic blocks continues until the guest crashes or
exits normally and is the basis of executor cross-checking in Section 3.3.3.
Whenever a basic block calls out to the operating system with a system call, the
JIT passes the arguments to a system call dispatcher. For basic execution of program
snapshots, as if they were running on the host system, a pass-through system call
dispatcher passes system calls straight to the host operating system. Snapshots from
other architectures, but still running Linux, use a system call translator based on
the QEMU [15] user-level emulation system call translation layer. The kmc-replay
utility demonstrated in Section 2.3, which concretely replays tests with the JIT, has a
system call dispatcher that fills in system call results based on a log (§ 3.3.1) generated
along with each test case.
Symbolic Execution Model
klee in its original form made several major assumptions based on LLVM bitcode
that interfere with retrofitting a DBT to the system. First, it expects that all code
is loaded up front, which ignores dynamically loaded libraries, self-modifying code,
and problems associated with accurately dissembling variable-length opcode instruc-
tion sets such as x86-64. Next, the memory model relies on precise variable and
buffer information; it cannot generally reason about anonymous data sections from
snapshots without either having expensive and excessively large objects or raising
errors on page-straddling accesses. Finally, the environment assumes programs call
to system model through directly linked functions, rather than an indirect system
call mechanism which needs a custom dispatch path.
klee-mc uses a new basic block aware dispatch model to support dynamic binary
translation. Since the DBT translates machine code basic blocks to LLVM functions
that return the next program counter, klee-mc transfers control from one basic block
to another when it encounters an LLVM ret instruction. When the function is DBT
bitcode, klee-mc inspects the return value to determine the next code block to run

CHAPTER 2. THE KLEE-MC BINARY PROGRAM SYMBOLIC EXECUTOR 26
and uses the block exit code (e.g., call, return, jump, system call), as given by VEX,
to decide how to update the call stack. This separate mode for DBT code is necessary
because the on-demand translation of code forces the system to process basic blocks
individually; DBT basic blocks cannot be stitched together into klee-compatible
LLVM programs in general. To let DBT-generated basic blocks call LLVM bitcode,
klee-mc defaults to klee behavior when the returning function is native LLVM
bitcode and DBT behavior when the returning function is DBT bitcode.
Snapshots represent a program’s address space as a set of disjoint page-aligned
memory regions. This format conflicts with the klee model which accurately tracks
all memory objects (e.g., variables, arrays, heap data), at the byte level. Although
analysis of debugging information and memory heap data could reveal precise mem-
ory object data could potentially provide precise memory object layout information,
there is no guarantee such data will be available in a snapshot. Since totally accurate
memory object modeling is a lost cause and best-effort modeling implies false posi-
tives, klee-mc loads memory regions page-by-page into the initial symbolic state and
relaxes the klee memory model to permit contiguous cross-object memory accesses.
User-level binary programs communicate with the underlying operating system
through system calls whereas the klee model assumes programs communicate with
the system through library calls. While klee links model code with the program and
lets function calls bridge the gap between program and environment model, klee-mc
must explicitly handle system calls due to differing calling conventions. To issue a
system call, per VEX semantics, a basic block function sets its exit code to indicate
its intent to make a system call. The klee-mc basic block dispatcher intercepts this
system call exit code and redirects the state to call out to a symbolically executed
system call emulation bitcode library.

CHAPTER 2. THE KLEE-MC BINARY PROGRAM SYMBOLIC EXECUTOR 27
2.4.3 Expressions and Solving
Constraint solving on expressions is integral to symbolic execution systems from
branch feasibility checks to test case generation. Adapting a symbolic executor to ef-
fectively run machine code means optimizing for new, complex expressions and config-
uring its solver to deal with slow-running queries from difficult constraint sets. Given
the unpredictability of instructions from arbitrary binaries, solver failures should be
somewhat expected, and fallbacks should be available to recover expensive paths.
Expressions
Expressions form the core symbolic data type of the symbolic executor. A symbolic
expression is nearly indistinguishable from the sort of expressions found in math-
ematics or programming languages; an expression represents a sequence of closed
operations (e.g., two’s complement arithmetic) on other expressions, often illustrated
as a tree or described with a grammar (klee’s is in Figure 5.3), working down to a
class of expression atoms, such as numbers or variables, with no further structure.
Effective expression management uses rewrite rules based on operation identities to
keep expressions small and efficient.
Building a new expression provides a convenient opportunity for optimization.
In klee terminology, all expressions are constructed via one of several expression
builders, depending on the system configuration. For instance, a requesting a new
expression (Sub x x) from an optimizing builder may return the constant 0 if the
builder knows to apply the identity x − x = 0. Aside from obvious constant fold-
ing, where operations on constants are folded into a single constant, the optimizing
builder canonicalizes expressions and applies ad-hoc rules based on two’s-complement
identities to reduce expression size when possible.
Most expressions in klee-mc correspond to a sequence of LLVM instructions,
derived from machine code, operating on symbolic data. Due to the sophistication
of modern optimizing compilers and intricacies of modern machine instruction sets,
these instruction sequences can significantly differ from the original source and its in-
termediate bitcode representation. The compiler inserts vector instructions, collapses

CHAPTER 2. THE KLEE-MC BINARY PROGRAM SYMBOLIC EXECUTOR 28
conditions to arithmetic, twiddles bits, and so on to improve performance for a target
architecture. These machine optimizations stress the expression builder in ways never
exercised by LLVM bitcode, making new rules necessary for machine code.
To illustrate the new class of expressions common to machine code, consider a re-
ciprocal multiplication, which replaces an expensive division operation with a cheaper
multiplication operation, observed in practice:
(extract[127 : 67] (bvmul bv14757395258967641293[128] x))
The expression multiplies x by a “magic” constant, the 64-bit reciprocal for 10, then
extracts the bits starting from bit 67 out of the result. On hardware, multipliers
are significantly cheaper than dividers, making this an excellent strength reduction.
On the other hand, to a constraint solver this causes queries to time out since a
128-bit multiply is much more costly than solving for a 64-bit divide. Undoing this
hardware-specific strength reduction by replacing the expression with x/10 halves
the bit-width thereby making the problem easier for the solver so that such queries
complete in reasonable time.
Although slowly adding ad-hoc rules to the expression builder would continue to
work to some extent, it is far from satisfactory for scaling up to tens of thousands of
programs. Early experiments with the expression builder indicated many complicated
boolean expressions were in fact tautologies that could be replaced with constants,
suggesting useful rewrite rules could be discovered automatically. Chapter 5 discusses
a method in this vein that klee-mc uses to derive general rules from program traces to
improve symbolic execution performance. Given that there are many more machine-
generated rules than ad-hoc rules and that these rules may still have subtle bugs,
klee-mc also supports inductive rule optimization checking at runtime to improve
the overall integrity of the expression optimization system (§ 3.3.5).
Solver Stack
All path constraints, as given in Section 2.2.1, are expressions. The set of path con-
straints for each state is called a constraint set; every unique constraint set translates

CHAPTER 2. THE KLEE-MC BINARY PROGRAM SYMBOLIC EXECUTOR 29
to a set of assumptions C that, along with a challenge formula expression q such as
a candidate path constraint, make up a solver satisfiability query (C, q). The sym-
bolic executor’s solver decides whether the conjunction of the query’s assumptions
and formula is satisfiable, computing satisfying assignments as needed.
The executor organizes its solver as a sequence of processing phases pass queries
down to a general purpose constraint solver. Since the constraint solver ultimately
computes solutions to the boolean satisfiable problem, for which there is no known
efficient algorithm, it tends to either finish quickly by exploiting the query’s structure
or time out from exponential blow-up; klee-mc tries to both optimize for the fast
path and robustly recover from failures. Although all solver queries could be directly
sent to a constraint solver, the executor must inefficiently serialize a query to match
the solver’s input format. By caching solutions from prior solver requests, transform-
ing queries with optimizations to reduce overhead, and recognizing trivial solutions to
certain classes of queries, the stack can often avoid making an expensive solver call.
As a solver stack can become quite complicated and new stack components can sub-
tly fail, klee-mc supports cross-checking multiple stacks at runtime for mismatches
(§ 3.3.5).
As a whole, machine code programs need a robust solver stack. When running bi-
naries, we observed klee’s solver stack would hang on cache look ups from traversing
huge expressions, the internal third-party solver would crash with call stack overflows,
and time-outs were too generous for acceptable forward progress. This experience in-
dicated failure should be expected and that robustness is more important than various
performance hacks. Figure 2.3 illustrates the default klee-mc solver organization as
informed by this experience; queries are processed by a few essential passes, then
passed to the solver through a robust, solver independent, conduit. For a query
(C, q), assumptions in C independent from the formula q are removed (as in klee),
query results are cached using a new built-in hashing scheme with constant look up
time, and the executor communicates with the solver through isolated processes.
SMTLIB Serialization. klee-mc communicates with an isolated STP [55]
theorem prover process through a forked copy of its own process and UNIX pipe.
When the executor makes a solver call, it forks itself to create a serialization process
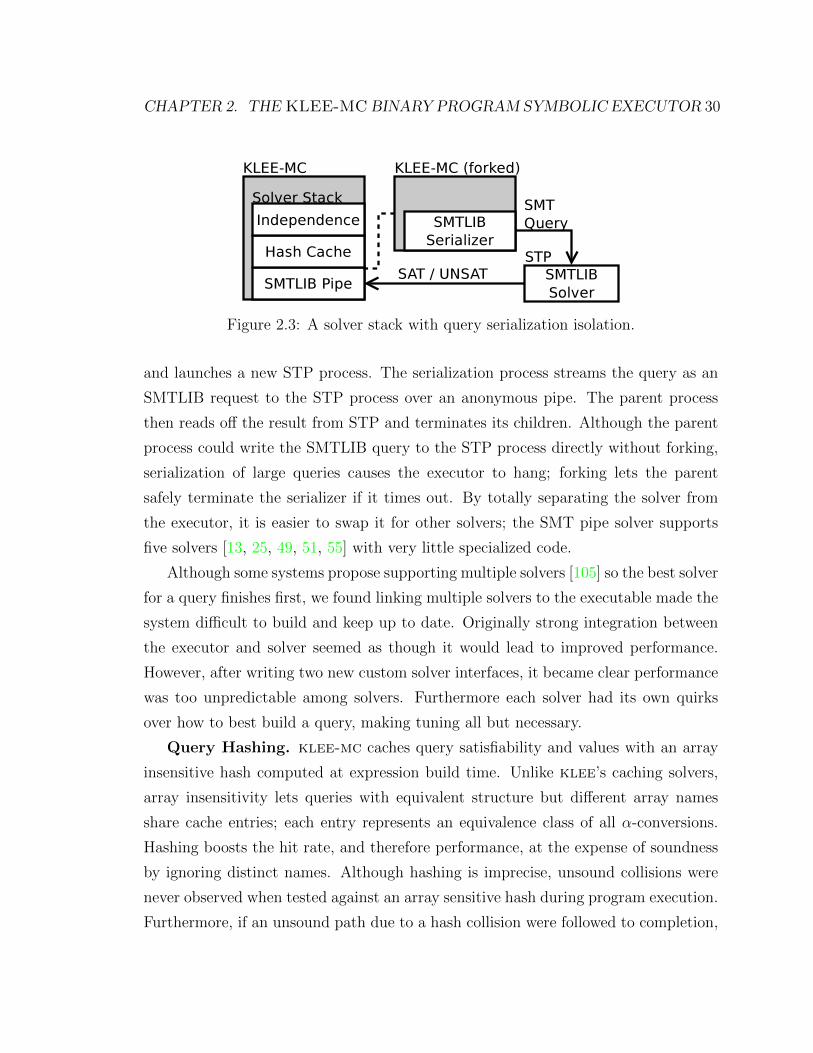
CHAPTER 2. THE KLEE-MC BINARY PROGRAM SYMBOLIC EXECUTOR 30
Figure 2.3: A solver stack with query serialization isolation.
and launches a new STP process. The serialization process streams the query as an
SMTLIB request to the STP process over an anonymous pipe. The parent process
then reads off the result from STP and terminates its children. Although the parent
process could write the SMTLIB query to the STP process directly without forking,
serialization of large queries causes the executor to hang; forking lets the parent
safely terminate the serializer if it times out. By totally separating the solver from
the executor, it is easier to swap it for other solvers; the SMT pipe solver supports
five solvers [13, 25, 49, 51, 55] with very little specialized code.
Although some systems propose supporting multiple solvers [105] so the best solver
for a query finishes first, we found linking multiple solvers to the executable made the
system difficult to build and keep up to date. Originally strong integration between
the executor and solver seemed as though it would lead to improved performance.
However, after writing two new custom solver interfaces, it became clear performance
was too unpredictable among solvers. Furthermore each solver had its own quirks
over how to best build a query, making tuning all but necessary.
Query Hashing. klee-mc caches query satisfiability and values with an array
insensitive hash computed at expression build time. Unlike klee’s caching solvers,
array insensitivity lets queries with equivalent structure but different array names
share cache entries; each entry represents an equivalence class of all α-conversions.
Hashing boosts the hit rate, and therefore performance, at the expense of soundness
by ignoring distinct names. Although hashing is imprecise, unsound collisions were
never observed when tested against an array sensitive hash during program execution.
Furthermore, if an unsound path due to a hash collision were followed to completion,

CHAPTER 2. THE KLEE-MC BINARY PROGRAM SYMBOLIC EXECUTOR 31
then solving for its test case, which must go through the solver, would detect an
inconsistent constraint set.
Array name insensitivity improves performance when a program loops, construct-
ing the same queries, but with new array names (e.g., readbuf 1 and readbuf 2).
Furthermore, when only hash equality matters, cache look ups will not hang on deep
comparison of large expressions. For persistence, query hashes are stored in sorted
files according to query solution: sat, unsat, value, or timed out.
klee itself supports a caching proxy solver, solverd, with a persistent hash store
(likely a descendent of EXE’s cache server [29]). Unfortunately, it suffers from several
design issues compared to an in-process query hash cache. First, communicating with
solverd incurs costly interprocess communication through sockets. Next, the query
must be built up using STP library intrinsics, totally serialized to the SMTLIB format
in memory, then sent through a socket. For large queries, this serialization may crash
STP, take an inordinate amount of time, or use an excessive amount of memory.
Finally, when solverd MD5 hashes the entire SMTLIB string it misses queries that
are equivalent modulo array naming and must create a new entry.
State Concretization
When the solver times out on a query, there are three obvious options. One, the
time limit can be boosted, dedicating disproportionate time to costly states which
may not even exhibit interesting behavior. Two, the system can terminate the state,
throwing away potentially interesting child paths. Three, the system can drop the
state’s symbolics causing the time out, hence salvaging the remaining path. klee-mc
pursues this third option by concretizing state symbolics into concrete data.
Since state concretization is a fall-back mechanism for failed queries, every con-
cretization begins with a failed query (C, q) on a state S. Assuming the executor
did not corrupt any path constraints, the constraint set has a satisfying assignment
σ. Knowing the solver already proved C’s satisfiability, it can be assumed the solver
computes σ without timing out. Likewise, if C succeeds but C ∧ q causes the solver to
fail, then only q needs to be concretized to make forward progress. To concretize q,
the executor constructs a variable assignment for only variables in q , σq = σ∩q, then

CHAPTER 2. THE KLEE-MC BINARY PROGRAM SYMBOLIC EXECUTOR 32
applies this assignment to all symbolic data in S, yielding the partial concretization
Sσq . Note that σq need not satisfy q, only that σq must assign concrete values to all
of q’s variables in addition to satisfying C.Replacing symbolic data in S with σq to get the state Sσq must be exhaustive in
order to eliminate all references to q’s variables. The executor therefore applies σq to
the following parts of the state that may have symbolic data:
• Memory Objects – The executor scans all state data memory for symbolic data
with variables from q. To speed up scanning, the executor only inspects objects
which contain symbolic expressions; concrete pages are ignored.
• LLVM Call Stack – The LLVM call stack for S contains the values for temporary
registers in LLVM code being evaluated by the executor. Usually one of these
values will contain q as the result of an icmp expression.
• Constraints – The state’s constraint set must reflect the concretization of terms
in q or future queries will be underconstrained. The executor applies the as-
signment σq to C to get Cσq , the constraint set for Sσq .
• Arrays – The constraints on elements in q vanish in Cσq but must be recalled
to produce a correct test case. To track concretized constraints, the state Sσqsaves σq as a set of concrete arrays along with any remaining symbolic arrays.
The idea of concretizing state during symbolic execution is common. S2E [34]
uses lazy concretization to temporarily convert symbolic data to concrete on-demand
for its path corseting feature. SAGE [59] concretizes its states into tests and replays
them to discover new states. klee concretizes symbolic data where symbolic modeling
would be costly or difficult to implement. klee-mc is perhaps the first system that
uses partial concretization to recover from solver failure.
2.4.4 Scheduling
A symbolic executor generates many states while exploring a path tree. The number
of states almost always outnumbers the number of CPUs available to the symbolic

CHAPTER 2. THE KLEE-MC BINARY PROGRAM SYMBOLIC EXECUTOR 33
executor; the system must choose, or schedule, a set of states to run for a given
moment. Some states will cover new and interesting program behavior but others
will not; choosing the best states to schedule is the state searching problem.
Constructing good search heuristics for symbolic execution remains an open prob-
lem. Although a search heuristic can conceivably maximize for any metric, the stan-
dard metric is total code coverage. Many heuristics to improve code coverage rely
on overapproximations similar to those developed for static analysis. Unfortunately,
static analysis techniques fare poorly on DBTs since not only is code discovered on-
demand, providing a partial view of the code, but also because recovering control-flow
graphs from machine code demands additional effort [8].
Instead, klee-mc ignores the state searching problem in favor of throughput
scheduling. In this case, klee-mc tries to dynamically schedule states to improve
total coverage based on prior observation. Two policies are worth noting:
Second chances. If a state covers new code, its next scheduled preemption is
ignored. The reasoning is that if a state covers new code, it is likely to continue to
covering new code. If a state is preempted, it is possible it will never be scheduled
again, despite showing promise.
Ticket interleaved searcher. Given several schedulers, an interleaved searcher
must choose one scheduler to query. The ticket interleaved searcher is a lottery
scheduler [129] which probabilistically chooses a scheduler weighted by the number of
tickets a scheduler holds. The searcher assigns tickets to a scheduler when its states
cover new code and takes tickets when the states cover only old code. The reasoning
is that if a scheduler is doing well, it should continue to select states to run.
2.4.5 Runtime Libraries
klee-mc extends the executor with symbolically executed runtime libraries to im-
prove reliability by avoiding hard-coded modifications when possible. Runtime li-
braries are isolated from the executor’s inner-workings so they occasionally need new
interpreter intrinsic calls to communicate with the underlying system. Likewise, run-
time libraries call into convenience library code which builds library intrinsics from

CHAPTER 2. THE KLEE-MC BINARY PROGRAM SYMBOLIC EXECUTOR 34
lower level interpreter primitives. Binary guest programs invoke these libraries in-
directly through intermediate code intrinsics, aspect-like function instrumentation,
system calls, rewritten instructions (§ 4.3.2), or data-dependent instruction paths
(§ 6.3).
Interpreter Intrinsics
A symbolically executed runtime library explicitly communicates with the symbolic
executor through interpreter intrinsics. An interpreter intrinsic, much like an operat-
ing system call, runs in the executor’s context and safely exposes symbolic executor
resources to guest code via an isolated, controlled conduit. Additionally, interpreter
intrinsics serve as simple symbolic execution primitives from which runtime code can
build more complicated operations that reason about symbolic state.
Choosing the right interpreter intrinsics presents challenges similar to designing
any interface. There are two general guiding principles that worked in practice. First,
a good intrinsic is primitive in that it exposes functionality that cannot be replicated
with library code. Second, since the executor implementation is non-preemptible, a
good intrinsic should complete in a reasonable amount of time. Often this reasonable
time constraint implies that calling an intrinsic should execute at most one solver call.
An example bad intrinsic is klee’s malloc call. The malloc intrinsic allocates s bytes
of memory, which requires executor assistance, but also lets s be symbolic, issuing
several solver calls in the executor context (poorly, noting “just pick a size” in the
comments) which could otherwise be handled by runtime code. klee-mc instead has
an interpreter intrinsic malloc fixed, which allocates a constant number of bytes
and uses 5× fewer lines of code, called by a library intrinsic malloc that forks on
symbolic allocation sizes.
Table 2.2 lists some of the more interesting new intrinsics used by klee-mc. None
of these intrinsics inherently reason about machine code, hence the klee prefix, but
were still integral to klee-mcto build library intrinsics (Figure 2.4 gives an exam-
ple). Many of these intrinsics rely on a predicate p argument; these predicates are
constructed explicitly with the mk expr intrinsic. Although instruction evaluation
implicitly builds expressions, the mk expr intrinsic is useful for avoiding compiler

CHAPTER 2. THE KLEE-MC BINARY PROGRAM SYMBOLIC EXECUTOR 35
Intrinsic Call Descriptionklee mk expr(op, x, y, z) Make an op-type expression with terms x, y, zklee feasible(p) Return true when p is satisfiableklee prefer(p) Branch on p, preferring true path when feasible
klee get value pred(e, p) Get concrete value of e assuming predicate pklee report(t) Create test case without terminating stateklee indirectn(s, ...) Call intrinsic s with n argumentsklee read reg(s) Return value for executor resource s
Table 2.2: Selected interpreter intrinsic extensions for runtime libraries.
optimizations (i.e., branch insertion) that might cause unintended forking or to avoid
forking entirely (i.e., if-then-else expressions). The feasible intrinsic tests whether
a predicate p is feasible; prior to introducing this intrinsic, runtime code could branch
on p, thus collapsing p to either true or false. Likewise, prior to get value pred
runtime code could not get a concretization of e without adding p to the state’s con-
straint set. Both indirectn and read reg decouple guest code from the executor;
indirect lets machine code late-bind calls to intrinsics, useful for unit tests, and
read reg lets runtime code query the executor for configuration information, an
improvement over klee’s brittle method of scanning a library’s variable names at
initialization and replacing values.
Library Intrinsics
Whereas interpreter intrinsics expose primitive functionality through a special execu-
tor interface, library intrinsics provide richer operations with runtime code. Library
intrinsics may be thought of the “standard library” for the symbolic executor run-
time; runtime code can independently reproduce library intrinsic functionality but is
better off reusing the code already available. Furthermore, following the guidelines
for interpreter intrinsics, library intrinsics define features that could conceivably be
an interpreter intrinsic, but would otherwise be too costly or difficult to implement
directly in the executor.
Library intrinsics primarily assist symbolic execution by managing symbolic data
when multiple solver calls are needed. Two examples are the klee max value and

CHAPTER 2. THE KLEE-MC BINARY PROGRAM SYMBOLIC EXECUTOR 36
int klee get values pred (uint64 t expr , uint64 t∗ buf ,unsigned n , uint64 t pred )
{ unsigned i ;for ( i = 0 ; i < n ; i++) {
/∗ e x i t i f a l l v a l u e s t ha t s a t i s f y ’ pred ’ are exhaus ted ∗/i f ( ! k l ee f eas ib le ( pred ) ) break ;/∗ ge t next va lue t ha t s a t i s f i e s ’ pred ’ ∗/buf [ i ] = klee get value pred ( expr , pred ) ;/∗ remove current va lue from p o s s i b l e s a t i s f y i n g va l u e s ∗/pred = klee mk and ( pred , klee mk ne ( expr , buf [ i ] ) ) ;
}return i ; }
Figure 2.4: A library intrinsic to enumerate predicated values
klee fork all n intrinsics. The first computes the maximum concrete value for
an expression with binary search driven by solver calls with klee feasible. The
second forks up to n states by looping, making a solver call to get a concrete value
c for an expression e and forking off a new state where c equals e. Additionally,
runtime code can take on a support role for interpreter intrinsics, such as in the case
of malloc: the library intrinsic processes any symbolic sizes then passes a simpler
case with concrete inputs to an interpreter intrinsic.
As a concrete example for how interpreter intrinsics and library intrinsics interact,
Figure 2.4 lists the library intrinsic klee get values pred. This function (used
in Section 6.4.1’s ite policy) enumerates up to n feasible and distinct values of expr
may take assuming the calling state’s path constraints and an initial predicate pred,
storing the results in buf. As the function loops, it issues a solver call testing whether
the predicate is satisfiable (using klee feasible). issues another solver call
through klee get value pred to get a value c for expr, then adds a condition
to the predicate that the next value cannot be c (using klee mk expr convenience
macros klee mk and and klee mk ne). The function returns once all values for
expr are exhausted or n values are computed, which ever comes first. By carefully
intrinsic design, this potentially long-running function is preemptible by other states
and never forks or accrues additional state constraints.

CHAPTER 2. THE KLEE-MC BINARY PROGRAM SYMBOLIC EXECUTOR 37
Intermediate Code Intrinsics
Intermediate representations can lack appropriate expressiveness to succinctly de-
scribe complex code semantics. For instance, LLVM presently has 81 platform inde-
pendent intrinsics that describe variable arguments, garbage collection, stack manage-
ment, bulk memory operations, and so forth that are not part of the LLVM machine
description. Often such intrinsics affect program state and must be handled to cor-
rectly execute the program.
Like LLVM, the VEX intermediate representation has its own set of “helper”
intrinsics. When VEX translates machine code to VEX IR, it emits helper calls
to handle the more complicated instructions. These helpers compute the value of
the eflags register, count bits, and dispatch special instructions such as cpuid and
in/out. Helper calls depend on a sizeable architecture-dependent helper library (2829
lines for x86-64) that performs the computation instead of inlining the relevant code.
klee-mc has a copy of this library compiled as LLVM bitcode. DBT basic blocks
call into this runtime library like any other LLVM code.
System Models
A system model library supplies an interface between the guest program and the
symbolic executor that simulates the guest’s platform. The modeled platform can
range from emulated libc and POSIX calls to a simulated low-level operating system
call interface; klee-mc’s system model replaces system call side effects with symbolic
data. Specialized knowledge of platform semantics encoded in a system model library
defines when and where a state takes on symbolic inputs.
Due to the variability of system libraries, modeling the binary program platform at
the system call level handles the most programs with the least effort. Although there
are opportunities for higher-level optimizations and insights into program behavior
by modeling system libraries instead of system calls, a binary program is nevertheless
free to make system calls on its own, necessitating a system call interface regardless.
Furthermore, since binary programs initiate reading input through system calls, mod-
eling inputs only through system calls is a natural cut. Finally, a model based on

CHAPTER 2. THE KLEE-MC BINARY PROGRAM SYMBOLIC EXECUTOR 38
system calls yields test cases that are system call traces, making the executor appear
from a testing view as an especially violent operating system.
The system model is a small symbolically executed runtime library which describes
system call side effects. When the target program issues a system call, the executor
vectors control to the model library, which marks the side effects with symbolic data.
The model uses interpreter intrinsics to update state properties (e.g., new mappings
for mmap) and to impose additional constraints on symbolic side effects. Variable
assignments for this symbolic data form test cases to reproduce program paths.
The system model in klee-mc can emulate Linux and Windows. The Linux
model supports both 64-bit programs (x86-64) and 32-bit programs (x86, ARM) in
the same code by carefully assigning structure sizes based on the architecture bit-
width. The x86 Windows model is less developed than the Linux model, primarily
due to system call complexity, but is interesting from a portability standpoint (the
problem of correctly modeling an operating system is investigated in Section 3.3.2).
For most system calls, the guest program passes in some buffer, the model marks it
symbolic, then control returns to the program. For calls that do not write to a buffer,
but return some value, the model marks the return value as symbolic.
Both models attempt to overapproximate known system calls. When marking
a buffer of memory passed to through a system call as symbolic, the model will
occasionally permit values which disagree with expected operating system values. For
instance, reads to the same position in a symbolic file will return different symbolic
data, flags can be set to invalid combinations, and system times may go backwards.
The system will not overapproximate when it can lead to an obvious buffer overrun,
such as giving an element count that exceeds a buffer or returning a string without a
nul terminator.
Function Hooks
Instrumenting calls to functions with runtime libraries gives the executor new drop-in
program analysis features. klee-mc’s function hook support lets the user define a list
of bitcode libraries to load on start up that will intercept calls to arbitrary functions
within a state’s symbolic context. In practice, Section 6.4.2 extensively uses function

CHAPTER 2. THE KLEE-MC BINARY PROGRAM SYMBOLIC EXECUTOR 39
void hookpre GI assert fail (void∗ r eg s ){ k lee uer ror ( ( const char∗)GET ARG0( reg s ) , ” ua s s e r t . e r r ” ) ; }
void hookpre GI exit (void∗ r eg s ) { e x i t (GET ARG0( reg s ) ) ; }
Figure 2.5: Function entry hooks for process exit functions
hooks to instrument libc memory heap functions such as malloc and free.
The function hook facility dynamically loads bitcode libraries, as given by a com-
mand line argument, which define function code to be called before entering and
exiting specific functions. The loader uses the library’s function names to deter-
mine which functions to instrument and where to put the instrumentation; functions
named hookpre f are called whenever a state enters f and functions named
hookpost f are called whenever a state leaves f . When the function f is loaded
into klee-mc, the calls to all relevant hook functions are inserted into f ’s code to
ensure the hooks are called on entry and exit.
As an example, Figure 2.5 shows two example function hooks. The functions in-
tercept every entry to glibc’s internal GI assert fail (called on an assertion
failure) and GI exit (called on normal termination) functions. The library func-
tions indicate the program intends to exit following some cleanup code. Instead of
running this cleanup code, the function hooks immediately terminate the calling state
with the failed assert producing an error report and the exit producing a normal test,
saving the executor unnecessary computation.
2.4.6 Limitations
As with any research system, klee-mc has some limitations. These limitations re-
flect intentional omissions to simplify the system in the interest of expediency and
tractability rather than serious architectural deficiencies. Although the lack of certain
features inhibits the analysis of select programs, there are no strict reasons prohibiting
the support in the future.
First, klee-mc lacks support for signals and threads. Bugs caused by signals and
threads tend to be difficult to reproduce (and hence unconvincing without significant

CHAPTER 2. THE KLEE-MC BINARY PROGRAM SYMBOLIC EXECUTOR 40
manual inspection), the symbolic execution overhead can be expensive, and there
are plenty of deterministic bugs already. Currently, the system will register signal
handlers, but never trigger any signals. Similarly, the system immediately fails any
thread-related system calls. However, there is partial support for threads based on
selecting a single thread context from a snapshot to symbolically execute.
The system model does not perfectly simulate its target platform. In most cases,
the system model can ignore specific environment details (e.g., timers, system in-
formation, users and groups, capabilities) by overapproximating with unconstrained
symbolic data. However, system calls such as ioctl rely on program and device-
specific context to define the precise interface; the system model does not know
which arguments are buffers that can be marked symbolic. Ultimately, this leads
to an underapproximation of the operating system which can reduce overall program
coverage.
Programs with large memory footprints, such as browsers, office suites, and media
editors, severely strain klee-mc’s memory system. Large programs do run under
klee-mc but do not run very well. When a program uses over a hundred thousand
pages, the address space structure rapidly becomes inefficient since it tracks each page
as a separate object. Large programs often also have large working sets, making forked
states, even when copy-on-write, cause considerable memory pressure. Conceivably,
better data structures and state write-out to disk would resolve this issue.
Supervisor resources, those that require kernel-level privileges, and devices, are
not supported. While these features necessary to run operating systems, hypervisors,
and other software that must run close to the hardware, which are interesting in
their own right, klee-mc focuses only on user-level programs. The symbolic execu-
tor could certainly model supervisor resources and devices (and some do), but the
limited amount of software that uses these features, the difficulty of modeling ob-
scure hardware quirks, and analysis necessary to efficiently support device interrupts,
makes such a platform too specialized to pursue in the short term.

CHAPTER 2. THE KLEE-MC BINARY PROGRAM SYMBOLIC EXECUTOR 41
Collection Platform Programs Failure SuccessCyanogenMod 10.1.2 ARM Linux 147 0 147 (100%)RaspberryPI 1.3 ARM Linux 3026 528 2498 (83%)Fedora 19 x86 Linux 12415 2713 9702 (78%)Fedora 20 x86-64 Linux 12806 1075 11731 (92%)Ubuntu 13.10 x86-64 Linux 15380 1222 14158 (92%)Ubuntu 14.04 x86-64 Linux 13883 992 12891 (93%)Windows Malware x86 Windows 1887 289 1598 (85%)Total 59544 6819 52725 (89%)
Table 2.3: Snapshot counts for binary program collections
2.5 Experiments
This section demonstrates the characteristics of a single run of klee-mc’s binary
symbolic execution over thousands of programs taken from three architectures (ARM,
x86, x86-64), representing experimental data taken over approximately the course
of a year. Linux binaries were collected from Fedora, Ubuntu, RaspberryPI, and
CyanogenMod distributions. Windows binaries were collected from several malware
aggregation sites. We highlight noticeable properties concerning key aspects of the
system when working with bulk program sets, including snapshotting, testing, and
coverage.
2.5.1 Snapshots
Snapshots let the executor easily load a program by using the program’s host platform
to set up the entire process image. To take a snapshot, it must be possible to run the
program; this is not always the case. Table 2.3 lists the success rates for snapshotting
programs by each named collection or distribution and shows simply launching a
program can be challenging.
Up to 17% of programs for each collection failed to snapshot. For x86 and x86-64
Linux, many binaries had dependencies that were difficult to resolve. Some binaries
would fail when linked against libraries with the correct versions but wrong linkage
flags; we set up several LD PATHs and cycled through them in case one would launch

CHAPTER 2. THE KLEE-MC BINARY PROGRAM SYMBOLIC EXECUTOR 42
0.1
1
10
100
1000
x86-64 x86 ARM Windows
Gig
abyte
s
Snapshot Collection
Memory Segment Storage Utilization
VirtualPhysical
Unshared
Figure 2.6: Snapshot storage overhead before and after deduplication
the binary. For ARM Linux, there were several runtime linkers, linux-rtld, with
the same name but slightly different functionality; using the wrong linker would
crash the program. Normally, only one linker and its associated set of binaries would
be installed to the system at a time. To support multiple linkers on the same ARM
system at once, each linker was assigned a unique path and each binary’s linker string
was rewritten, cycling through linkers until the binary would launch. For Windows,
programs were launched in a virtual machine, but the binaries were often compressed
with runtime packers, making it difficult to extract and run the actual program.
Although snapshots are larger than regular binaries, the design can exploit shared
data, making them space efficient. Figure 2.6 shows storage overhead for the system’s
snapshots in logarithmic scale. Every snapshot memory region is named by hash and
saved to a centralized area; regions for individual snapshots point to this centralized
store with symlinks. The figure shows physical storage usage, which is roughly half
unshared and shared data. The virtual data is the amount of storage that would be
used if all shared data were duplicated for every snapshot. In total, deduplicating
shared data gives a 4.9× reduction in overhead, amounting in 696 gigabytes of savings.
Furthermore, this shared structure helps reduce overhead on single binaries when
snapshot sequencing for system model differencing (§ 3.3.2).

CHAPTER 2. THE KLEE-MC BINARY PROGRAM SYMBOLIC EXECUTOR 43
1e+04
1e+05
1e+06
1e+07
1e+08
x86-64 x86 ARM Windows
# P
ath
s
Snapshot Platform
Paths and Tests Cases from Symbolic Execution
Partial PathsConcrete Tests
Complete Paths
Figure 2.7: Test cases and paths found during mass testing
2.5.2 Program Tests and Bugs
At its core, klee-mc produces tests for programs. To find tests, programs were
symbolically executed for five minutes a piece. All programs were tested beginning at
their entry point with symbolic command line arguments and totally symbolic files.
Figure 2.7 shows the mass checking test case results for all programs from Ta-
ble 2.3. In total, the executor partially explored 24 million program paths and pro-
duced 1.8 million test cases. Only a fraction of all paths become test cases; it is
still unclear how to generally select the best paths to explore. We distinguish be-
tween complete paths, a test that runs to full completion, and concrete tests, a test
which may have concretized its symbolic state early; 14% of test cases were con-
cretized, demonstrating the usefulness of state concretization and the importance
graceful solver failure recovery.
Of course, finding bugs is a primary motivation to testing programs. Figure 2.8
shows the total errors found for each tested platform. By generating over a million test
cases for the programs, we were able to find over ten thousand memory access faults
(pointer errors) and over a thousand other faults (divide by zero and jumps to invalid
code). Divide by zero errors were the rarest faults, possibly on account of divisions
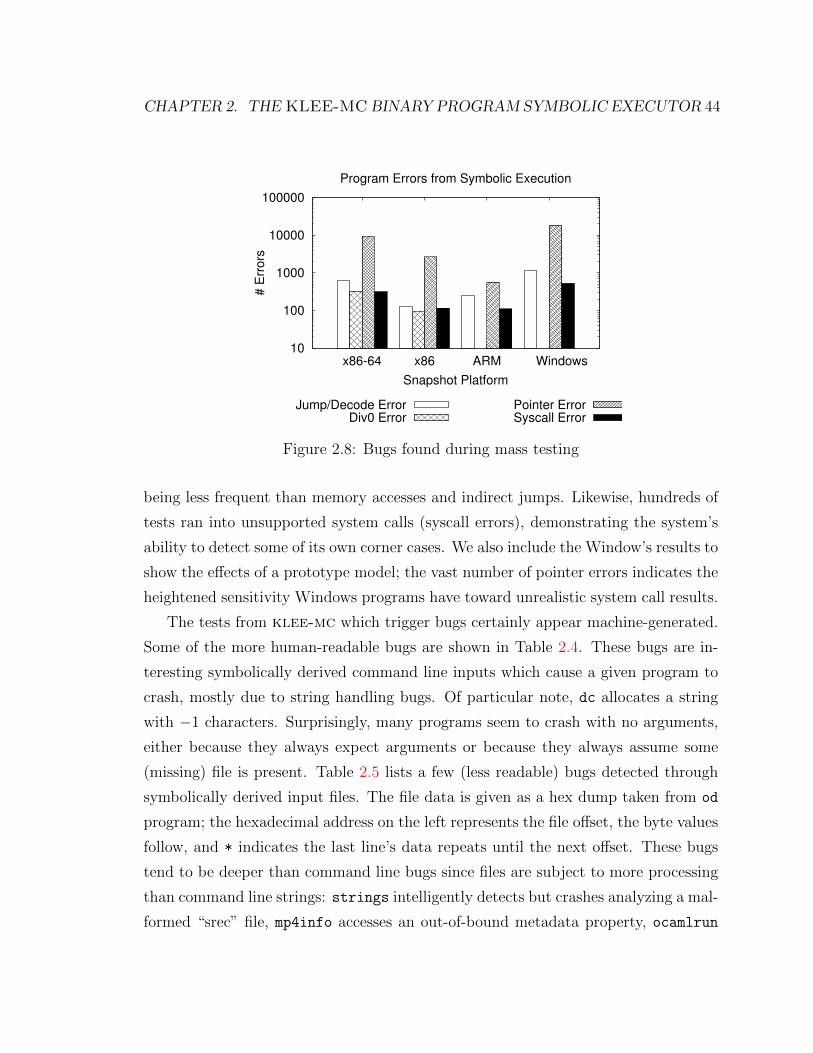
CHAPTER 2. THE KLEE-MC BINARY PROGRAM SYMBOLIC EXECUTOR 44
10
100
1000
10000
100000
x86-64 x86 ARM Windows
# E
rrors
Snapshot Platform
Program Errors from Symbolic Execution
Jump/Decode ErrorDiv0 Error
Pointer ErrorSyscall Error
Figure 2.8: Bugs found during mass testing
being less frequent than memory accesses and indirect jumps. Likewise, hundreds of
tests ran into unsupported system calls (syscall errors), demonstrating the system’s
ability to detect some of its own corner cases. We also include the Window’s results to
show the effects of a prototype model; the vast number of pointer errors indicates the
heightened sensitivity Windows programs have toward unrealistic system call results.
The tests from klee-mc which trigger bugs certainly appear machine-generated.
Some of the more human-readable bugs are shown in Table 2.4. These bugs are in-
teresting symbolically derived command line inputs which cause a given program to
crash, mostly due to string handling bugs. Of particular note, dc allocates a string
with −1 characters. Surprisingly, many programs seem to crash with no arguments,
either because they always expect arguments or because they always assume some
(missing) file is present. Table 2.5 lists a few (less readable) bugs detected through
symbolically derived input files. The file data is given as a hex dump taken from od
program; the hexadecimal address on the left represents the file offset, the byte values
follow, and * indicates the last line’s data repeats until the next offset. These bugs
tend to be deeper than command line bugs since files are subject to more processing
than command line strings: strings intelligently detects but crashes analyzing a mal-
formed “srec” file, mp4info accesses an out-of-bound metadata property, ocamlrun

CHAPTER 2. THE KLEE-MC BINARY PROGRAM SYMBOLIC EXECUTOR 45
Program Argumentscclambda --ran .
dc --e=[
h5stat --ob
pmake !=\xb\x1$\x0\n\x1\x1tao loadmonitor ’\n "’ ’\t’transqt2 -f\x1\x1 .
ttfdump ttc
vgrep x \’-/xrootd --bbbbc \”
Table 2.4: Selected command lines triggering memory access faults
reads missing section descriptors, and fsck.ext2 attempts to fill out a buffer using
a negative length.
2.5.3 Coverage
Test counts tells little about how much distinct program behavior is exercised by the
executor. For instance, a string comparison of length n will generate n test cases but
each test case exercises the same code paths. The total amount of unique machine
code covered and the types of system calls exercised, however, give a crude measure
of code and path variety across all programs.
Table 2.6 lists basic blocks and absolute code covered. The data is divided into
a unique classification, counting the same string of code for a basic block only once
(measuring diversity), and a total classification, counting the same string of code for
every program where it was covered (measuring total coverage). Although there’s
a high degree of code sharing among programs, the klee-mc system still processes
hundreds of megabytes of unique code on account of easily handling large program sets
across several platforms. Of these platforms, one interesting aspect is the particularly
high rate of code sharing for Windows; this is likely due to programs spending most
of their time in the user interface libraries.
The system model can reduce code coverage if it does not accurately model its

CHAPTER 2. THE KLEE-MC BINARY PROGRAM SYMBOLIC EXECUTOR 46
Program File Input
strings-2.24
0000 53 32 30 30
0004 00 00 00 00
*
1000
mp4info-2.0.0
0000 01 00 00 82
0004 63 74 74 73
0008 00 00 00 00
000c 40 00 00 00
0010 00 00 00 00
*
1fff 00 00 00
ocamlrun-4.01.0
0000 20 00 00 00
0004 43 61 6d 6c
0008 31 39 39 39
000c 58 30 30 38
Program File Input
fsck.ext2-1.42.10
0000 00 00 00 00
*
0400 99 ef 1b 08
0404 01 80 c5 0f
0408 00 00 00 00
*
0418 06 00 00 00
041c 14 00 00 00
0420 00 40 00 00
0424 01 00 dc f3
0428 cf f4 d1 46
042c 00 00 00 00
*
0438 53 ef 00 00
043c 00 00 00 00
*
0460 10 00 00 00
0464 00 02 00 00
0468 00 00 00 00
*
0504 a5 9f 00 04
0508 00 00 00 00
*
0800
Table 2.5: Selected file inputs triggering memory access faults
Platform Basic Blocks Machine CodeUnique Total Unique Total
x86-64 Linux 7,498,415 82,724,878 210MB 1517MBx86 Linux 2,304,809 24,016,450 55MB 406MBARM Linux 450,340 5,679,779 8.4MB 104MBx86 Windows 89,494 2,326,051 1.2MB 32MB
Table 2.6: Amount of machine code covered by klee-mc

CHAPTER 2. THE KLEE-MC BINARY PROGRAM SYMBOLIC EXECUTOR 47
1
10
100
1000
10000
50 100 150 200 250
Num
ber
of P
rogra
ms
System Calls Sorted By Frequency
System Call Frequency
x86-64x86
ARMWindows
Figure 2.9: Observed system call frequency over all programs
target platform. However, if a system call is used by only a few programs, the qual-
ity of its implementation has little impact on overall coverage. Figure 2.9 shows
system calls sorted by total number of programs where they were used. The linear
drop-off of calls on the logarithmic scale indicates system call usage follows an expo-
nential distribution, suggesting focusing effort on more popular system calls would
be a good choice. The most common calls for Windows were NtUserCallOneParam,
a unified and complex interface for dozens of User32 system calls (modeled poorly),
and NtUserWaitMessage, a call that suspends a thread until it receives a message
(modeled easily). The most common calls for Linux were exit group, write, and
mmap, which are all modeled accurately. For the long tail, 20 (ARM, Windows), 28
(x86-64), and 48 (x86) calls were only used by a single program.
2.6 Conclusions
This chapter provided a context for symbolic execution and described the design of
klee-mc. The details to the changes necessary to support machine code programs
served as a convenient tour of core system components. Although klee-mc can
analyze huge program sets, finding thousands of unique program faults, the additional

CHAPTER 2. THE KLEE-MC BINARY PROGRAM SYMBOLIC EXECUTOR 48
system complexity suggests robustness and correctness are paramount when analyzing
machine code, which will remain a focus throughout the rest of this dissertation.

Chapter 3
Machine Cross-Checking
3.1 Introduction
The ease of applying dynamic analysis to unmodified program binaries spurred the
development of binary symbolic execution. A binary symbolic executor symbolically
evaluates compiled executables as-is; there is no need for recompilation, annotations,
or special linking. This contrasts with systems [28, 58, 75, 119] built to process source
code or a metadata-rich byte code. A typical system pairs a symbolic interpreter
with a dynamic binary translation (DBT) front-end [30, 34, 59, 92, 96, 124]; the DBT
converts a program’s machine code into instructions for the symbolic interpreter.
However, this convenience comes at the cost of complexity. The executor must
support broad classes of machine code programs to be generally useful. While the
system should closely match the target program as it behaves on hardware, mere
inspection is inadequate to confirm accurate execution; soundness demands near-
flawless interpretation. Few decisions are shallow: almost every result depends on a
long line of prior computations. Mistakes cause both false positives (which at least
can be seen and fixed) and, worse, invisible accumulation of false negatives as it
misses paths, corrupts constraints, and more. It is often difficult or impractical to
confirm these error reports by hand; instead, test cases serve as certificates against
false positives.
We built an ensemble of techniques to achieve bitwise equivalence to program
49
CHAPTER 3. MACHINE CROSS-CHECKING 50
evaluation on hardware with a dynamic binary symbolic executor. These techniques
include co-simulation against hardware, equivalence checking, side-effect analysis,
and hardware fall-backs. The process often compares unreliable data sources (cross-
checking) but correctness arises by working transitively down to physical hardware.
These automated checks proved invaluable when developing klee-mc. Impre-
cise approximations of the program environment are detected by comparing symbolic
execution traces against operating system side-effects. By checking test cases from
symbolic interpreter against an independent JIT interpreter, bugs in the stack which
impact execution can be detected near the point of failure in the guest program. The
JIT is further checked for execution discrepancies through bi-simulation with hard-
ware, ensuring the JIT’s intermediate results when transitioning from basic block to
basic block match hardware. Expression rewrite rules are verified offline for correct-
ness. End-to-end bugs in the expression builder in symbolic expression rewriting rules
are detected at the instruction level. Detailed diagnostic reports are given to the user
whenever execution accuracy becomes suspect.
The rest of this chapter is organized as follows. Section 3.2 discusses the moti-
vation for high-integrity binary symbolic execution. Section 3.3 describes the design
the klee-mc integrity checking features. Section 3.4 outlines specific implementa-
tion details behind the symbolic executor. Section 3.5 shows the results of checking
the symbolic execution system across the stack. Section 3.6 discusses related work.
Finally, Section 3.7 concludes.
3.2 Motivation
Binary symbolic execution closely matches the literal interpretation of a target pro-
gram as on hardware, an advantage over source-based methods, but at the expense of
clarity. Since paths become lengthy and obscured by machine semantics, the executor
must accurately symbolically evaluate the program and produce sound test cases– an
arduous task in light of the system’s complexity. Hence we reduce the problem to
automatically checking the symbolic executor piece by piece.
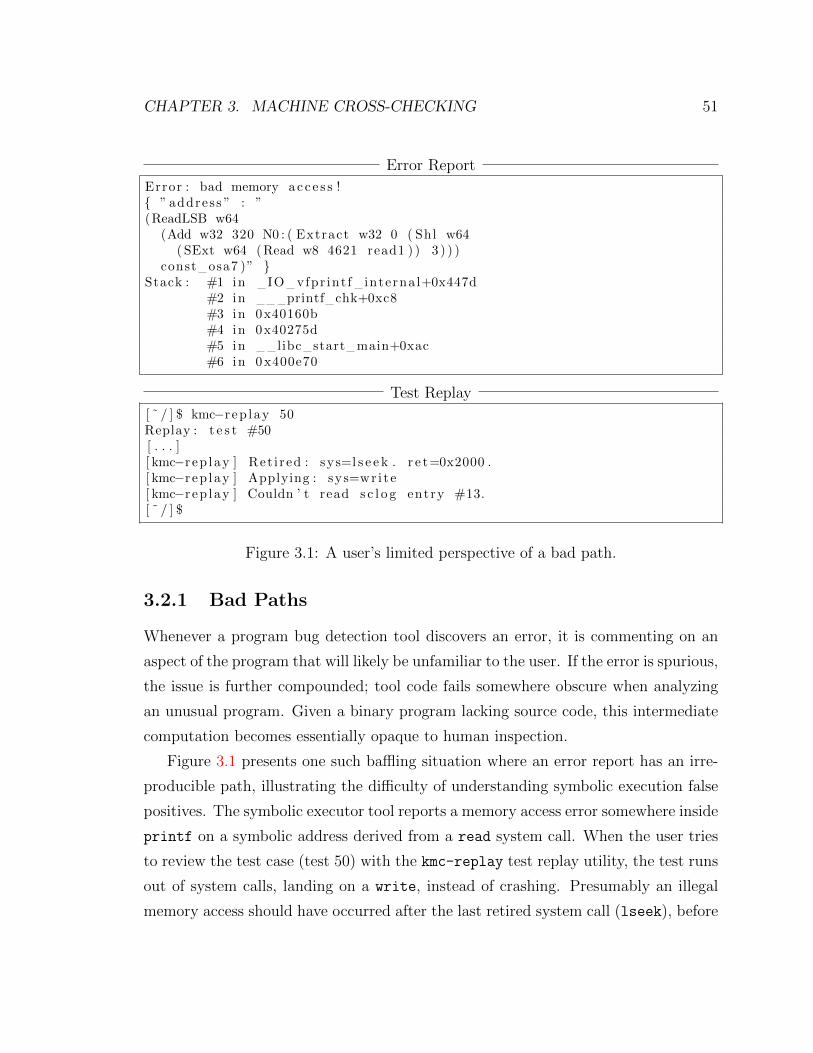
CHAPTER 3. MACHINE CROSS-CHECKING 51
Error Report
Error : bad memory ac c e s s !{ ” address ” : ”(ReadLSB w64
(Add w32 320 N0 : ( Extract w32 0 ( Shl w64( SExt w64 (Read w8 4621 read1 ) ) 3 ) ) )
const osa7 )” }Stack : #1 in IO vfpr int f interna l+0x447d
#2 in printf chk+0xc8#3 in 0x40160b#4 in 0x40275d#5 in libc start main+0xac#6 in 0x400e70
Test Replay
[ ˜ / ] $ kmc−r ep lay 50Replay : t e s t #50[ . . . ][ kmc−r ep lay ] Ret i red : sys=l s e e k . r e t=0x2000 .[ kmc−r ep lay ] Applying : sys=wr i t e[ kmc−r ep lay ] Couldn ’ t read s c l o g entry #13.[ ˜ / ] $
Figure 3.1: A user’s limited perspective of a bad path.
3.2.1 Bad Paths
Whenever a program bug detection tool discovers an error, it is commenting on an
aspect of the program that will likely be unfamiliar to the user. If the error is spurious,
the issue is further compounded; tool code fails somewhere obscure when analyzing
an unusual program. Given a binary program lacking source code, this intermediate
computation becomes essentially opaque to human inspection.
Figure 3.1 presents one such baffling situation where an error report has an irre-
producible path, illustrating the difficulty of understanding symbolic execution false
positives. The symbolic executor tool reports a memory access error somewhere inside
printf on a symbolic address derived from a read system call. When the user tries
to review the test case (test 50) with the kmc-replay test replay utility, the test runs
out of system calls, landing on a write, instead of crashing. Presumably an illegal
memory access should have occurred after the last retired system call (lseek), before

CHAPTER 3. MACHINE CROSS-CHECKING 52
the write, and within printf. It is unclear what exactly went wrong or why, only
that the symbolic executor (or replay facility) is mistaken. Obviously, there must be
some software defect, whether in the target program or the executor; the challenge is
to determine the precise source of the problem.
3.2.2 System Complexity
Binary symbolic executors build from the principles of classical source-based symbolic
executors. Figure 3.2 highlights the important components of a binary symbolic
execution stack. These components must work perfectly in tandem to produce correct
test cases; a binary symbolic executor can fail at numerous points throughout the
stack. The goal of our work is to make these issues tractable. Other projects have
addressed some reliability concerns, but none have combined them under a single
system. In Section 3.6, we will compare klee-mc with this related work.
As given in Chapter 2, the basic process for symbolic execution is as follows. First,
the executor begins by loading a target program. A front-end processes the target
program into a simpler intermediate representation. An interpreter symbolically eval-
uates the intermediate representation by manipulating a mix of symbolic expressions
and concrete data. A state acquires symbolic data through simulated program envi-
ronment features defined by a custom system model. Evaluation forks new states on
feasibly contingent branches decided by a constraint solver; each state accrues path
constraints according to its sequence of branch decisions. When a state terminates,
the executor constructs a test case a variable assignment that satisfies the state’s path
constraints. Finally, replaying the test case reproduces the path.
The executor loads a target program similar to a native program loader. If loader
details diverge from the target system, code paths depending on runtime detected ar-
chitectural features will differ (e.g., string functions, bulk memory operations, codecs).
Unlike a traditional program loader, the executor may support seeded tests that begin
running long after the program entry point, necessitating point-in-time snapshots.
Every binary symbolic executor must handle machine code in its front-end but
machine code decoders are known to be unreliable [60, 92, 104]. Modern instruction

CHAPTER 3. MACHINE CROSS-CHECKING 53
Figure 3.2: A binary symbolic execution stack with multiple replay facilities.
sets are huge, complicated, and new instructions are continually being added; hard-
ware outpaces decoder software. Additionally, the interface between the decoder and
the symbolic executor’s intermediate representation adds another layer of unreliable
abstraction.
The underlying symbolic interpreter evaluates the target program’s instructions.
However, the interpreter can easily diverge from intended execution. It can mis-
apply instructions (e.g., vector instructions). It can apply bogus optimizations on
constraints. It can apply bogus optimizations on state data. It can fail to handle
difficult symbolic cases (e.g., memory dereference, floating-point).
A system environment model inserts symbolic data into the program state. A
model may reimplement libraries [28, 86, 116], simulate system calls [30], or emulate
hardware devices [45]. Regardless of abstraction, if the model misrepresents the
environment then the following path diverges from the set of feasible platform paths.
Like a traditional symbolic executor, klee-mc relies on specialized expression
and constraint solver optimizations for good performance (§ 2.4.3). Expression opti-
mizations, such as strength-reductions and structural simplifications, are often hand-
written. Constraint solving is accelerated by light-weight query processing. The
executor may also rewrite expressions to be palatable to a particular solver imple-
mentation. Keeping data symbolic throughout execution means the consequences of
a broken optimization may not manifest until long after its application.

CHAPTER 3. MACHINE CROSS-CHECKING 54
Replaying a test case should reproduce its respective program path. For binary
programs, the replay mechanism can rely on the interpreter, a just-in-time compiler,
or hardware. Since test cases are generated by the interpreter, replaying through
other executors can expose inconsistencies. Furthermore, if the interpreter is non-
deterministic, the test case can fail to replay at all.
Fortunately, the constraint solver, target environment, and target hardware all
strengthen the system’s faithfulness to native execution. The constraint solver can
check the solver and expressions stacks. The target environment can test the system
model. The hardware can test the binary front-end and final test cases. Checking
the executor with these mechanisms improves the overall integrity of the system.
Furthermore, these components often help improve the robustness of the system such
that it can proceed in light of failures.
3.3 Cross-Checking in klee-mc
In this section we discuss the design and general strategy for improving the integrity
of the klee-mc binary symbolic executor.
3.3.1 Deterministic Executor Data
The executor’s integrity mechanisms primarily depend on two sources of data. First,
the executor needs realistic and deterministically reproducible guest states, given
by program snapshots (§ 2.4.1) and extended to snapshot sequences for system call
side-effect cross-checking. Second, the executor deterministically reproduces various
intermediate path results for bi-simulation using register and system call logs.
Program Process Snapshots
As described in Section 2.4.1, a snapshot is the state of a process image taken from a
live system. The system snapshots a binary program by launching it as a process and
recording the resources with system debugging facilities (e.g., ptrace). The symbolic
executor first loads a target program by its snapshot before symbolically executing

CHAPTER 3. MACHINE CROSS-CHECKING 55
its code. Snapshots eliminate side effects and non-determinism from new libraries,
different linkers, and address space randomization over multiple runs by persistently
storing an immutable copy of process resources.
Snapshot Structure. A snapshotting program (the snapshotter) saves a running
process’s image data to a directory.. Snapshot data is structured as a simple directory
tree of files representing resources loaded from the process. Three resources constitute
the core process image’s machine configuration:
• User Registers – the set of registers for each thread is stored in a thread direc-
tory. These registers include the stack pointer, program counter, floating-point
registers, and general purpose registers.
• System Registers – registers not directly accessible or modifiable by the pro-
gram but necessary for correct program execution (e.g., segment registers and
descriptor tables).
• Memory – all code and data in the process including libraries, heaps, and stacks.
Snapshot Sequences. Detecting system model differences relies on comparing
program traces from the host and the executor. We represent host program traces at
a system call granularity by recording sequences of snapshots. Snapshot sequences
are stored as snapshot pairs pivoted around system calls. A snapshot pair has a
pre-snapshot, taken immediately prior to a system call, and a post-snapshot, taken
immediately after a system call. We write snapshot pairs as tuples (s, s∗) where s is
the pre-snapshot and s∗ is the post-snapshot. The machine configuration difference
from s to s∗ is a system call side effect.
Although a snapshot may be taken at any point, only the moment immediately
preceding and following a system call give fundamentally distinct snapshots. The
executor only introduces symbolic data when dispatching system calls since all input
derives from system calls. This controlled introduction of symbolic data means a
snapshot s′ between system calls is equivalent to a snapshot s immediately following
the last system call because s will always eventually evaluate to s′ due to snapshots
being totally concrete.

CHAPTER 3. MACHINE CROSS-CHECKING 56
Symbolic execution of a snapshot pair begins in the system call model. The pre-
empted system call from the pre-snapshot is processed by the symbolic system model,
symbolic data is created if necessary, the system call completes and the target pro-
gram code is symbolically executed. Assuming the symbolic system model subsumes
the operating system’s behavior, the post-snapshot is a concretized path of the pre-
snapshot system call through the model. A post-snapshot begins with no symbolic
data so symbolic execution should match native execution up to the next system call.
Test Case Logs
Recall from Section 2.3 that for every test case, the symbolic executor generates files
of concrete data suitable for reconstructing a program path. A concrete test case is a
variable assignment which satisfies the path constraints, computed by the solver. To
replay a test, the interpreter replaces all symbolic data with concrete test case data.
Native execution makes system model effects difficult to reproduce when replaying
the test data through the model code. The model cannot run directly in the target
program without additional support code; the model would have to intercept system
calls, use its own heap (e.g., use its own malloc), and use special assembly trampoline
to reflect register updates. If the model runs outside the target program’s address
space, the system must monitor the model’s memory accesses for target addresses.
Regardless of where the model runs, there still must be controls for non-determinism,
such as precisely reproducing addresses for memory allocation must control.
To avoid any dependency on the model code during replay, the executor logs mod-
eled system call side effects in a test case log. In addition to maintaining model side
effect information, the test case log is a general purpose logging facility for traces
from the executor. This general purpose facility is useful for tracking state informa-
tion when debugging the system, such as monitoring memory addresses and stack
modifications. For automated interpreter integrity checking, which is this chapter’s
focus, the log records registers at basic block boundaries for cross-checking against
JIT-computed registers in Section 3.3.3.
Figure 3.3 illustrates the logging process during symbolic execution. Whenever
the executor dispatches a machine code basic block, the executor writes the register

CHAPTER 3. MACHINE CROSS-CHECKING 57
Figure 3.3: Building a test log during symbolic execution
set to the state’s log. Whenever the system model dispatches a system call, the
executor writes the side-effects to the state’s log. In the example, the system call
returns a symbolic value, so the return value register %rax has its concrete mask set
to 0 to indicate the register is symbolic. The executor chooses to follow the OK branch,
implying %rax must be the concrete value 0; the %rax mask value reflects the register
is concrete. When the state terminates, the executor writes the log to the filesystem
along with the concrete test case variable assignments.
System Call Logging. The model code produces a concrete log of information
necessary to replay the system call side effects independent of the system model for
every test case. The log records memory stores and register information similar to
older Unix systems [90], as well as metadata about the system call itself. On test
replay, the program runs on a DBT based on the LLVM JIT and the log is replayed
to recreate the system call’s effects.
Figure 3.4 illustrates the data associated with system call log entry. On the left,
the figure shows a system call record. It begins with a record header, common to

CHAPTER 3. MACHINE CROSS-CHECKING 58
Field Name DescriptionRecord header
bc type Type of recordbc type flags Modifier flagsbc sz Length of record
System Callbcs xlate sysnr Host syscall numberbcs sysnr Given syscall numberbcs ret Return valuebcs op c Update op. count
Field Name Descriptionsop hdr Record header
Memory update operationsop baseptr Base pointersop off Pointer offsetsop sz Update length
Figure 3.4: Test case log record structures for system calls
all log records, which describes the record type, flags that control attributes specific
to that type, and a record length, so unrecognized record types can be skipped.
The system call record type itself holds the system call number, useful for checking
whether replay has gone off course, a translated system call number, for emulation
by the host platform, the call’s return value, provided it’s not symbolic, and the
number of memory updates to expect. These memory updates, following the system
call record, describe a base pointer or system call argument number that should be
updated, along with the length of the update. The update data maps to the concrete
test case’s list of array assignments. If the update length disagrees with the array
length, the test replay reports a system call replay error.
Register Logging. The symbolic executor optionally logs the state’s machine
registers (e.g., rax, xmm0) throughout execution. The logged registers record interme-
diate results for fine-grained integrity checking during test replay to catch interpreter
errors close to the point of failure. For every dispatched basic block, the interpreter
appends the emulated register file and a concrete mask, which indicates whether a
register is symbolic or concrete, to the log. Test replay only checks concrete data
against concrete registers; symbolic bytes are ignored.

CHAPTER 3. MACHINE CROSS-CHECKING 59
3.3.2 Operating System Differencing on the System Model
When a program state enters the system model by making a system call, the set of
states that may exit the model should precisely represent every result the operating
system could possibly return. Otherwise, the system model diverges from the modeled
operating system, either introducing side effects never observed in practice, producing
unrealistic tests, or missing side effects, potentially missing large swaths of program
code. We compare the results of symbolic execution of pre-snapshots with the side
effects reflected in post-snapshots to judge the system model’s accuracy.
Model Fidelity
A system model fails to model the operating system’s side effects in possible two ways.
One, the model is overconstrained when missing side effects. Two, the model is under-
constrained when introducing new side effects. These failure modes are orthogonal:
a model can both introduce new side effects and miss legitimate side effects.
Model quality in this sense is easily formalized. Let S(s) be the set of all possible
configurations that a state s may take immediately following a system call to the
operating system. Let M(s) be the set of all possible configurations that a state s
may take immediately following a system call handled by the system modelM. The
model M is overconstrained when ∃x ∈ S(s) such that x 6∈ M(s). The model is
underconstrained the operating system when ∃x ∈ M(s) such that x 6∈ S(s). For a
snapshot pair (s, s∗), by definition the post-snapshot is a configuration from applying
the operating system, s∗ ∈ S(s).
System Model × Operating System
Every snapshot pair describes side effects of a system call on a process image. To
compare the model with the operating system specification, the pre-snapshot seeds
symbolic execution and the post-snapshot gives expected output. Differences between
the symbolically derived test cases and post-snapshot determine the model’s accuracy.
Figure 3.5 diagrams the process for differencing operating system and model side
effects. First, the pre-snapshot and post-snapshot are differenced to locate system

CHAPTER 3. MACHINE CROSS-CHECKING 60
call side effects. Next, the pre-snapshot is symbolically executed for one system call.
Finally, the side effects from symbolic execution are compared with the side effects
derived from the snapshot pair.
We consider side effects related to register and memory contents. Side effects
are found by differencing snapshot pairs (the pair difference). Pair differencing relies
on the lightweight snapshot structure. Unchanged memory segments are symlinks
and can be skipped. Updated memory segments are byte differenced and modified
addresses are stored in a side effect summary of address ranges A.
Symbolically executing the pre-snapshot produces the model side-effects. The
pre-snapshot is loaded into the symbolic executor with the model configured to exit
immediately after completing a system call. Symbolic execution produces a set of
test cases T . Each test case t ∈ T includes path constraints C(t) (as a set of boolean
bitvector expressions) and a set of updated memory ranges A(t).
The model can be checked for underconstraining and overconstraining through
side effects by A and T , For overconstraining, if for every t ∈ T the operating
system update set contains addresses not in the model update set, ∪(A)∩∪(A(t)) 6=∪(A), then t with the minimal missing locations (A)−∪(A(t)) represents the model
overconstraining. For underconstraining, if every t ∈ T has a update address in the
snapshot’s memory space but not the operating system side effect set, (∪(A(t)) −∪(A)) ∩ s∗ 6= ∅, then that address represents an underconstrained side effect.
Unsupported System Calls
For practical reasons, a subset of system calls are left partially or totally unsupported
in the model. First, modeling system calls that are rarely used, perhaps by a handful
of programs, or never observed, has little pay-off. Second, there is an implemen-
tation gap as new system calls and flags as they are added host operating system.
Therefore the system model gracefully handles unsupported system calls. Whenever
a path reaches an unsupported system call number or feature flag, the system model
generates a missing system call report and the path returns from the model with an
unsupported return code.
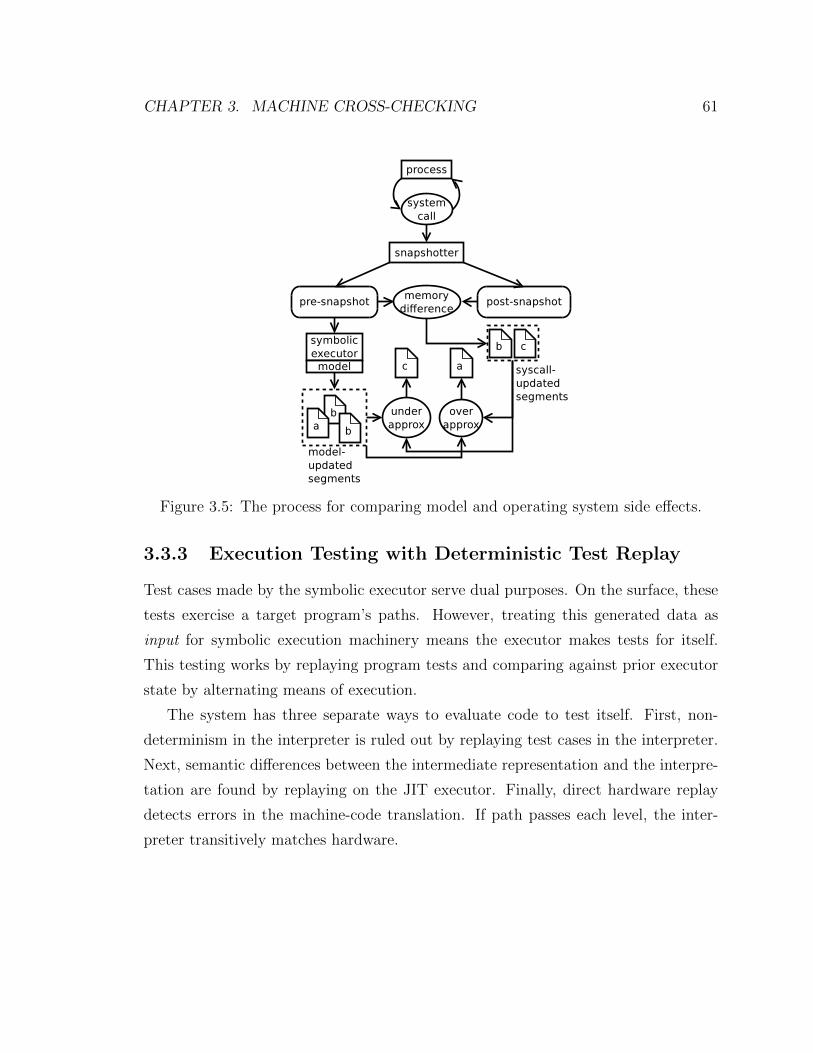
CHAPTER 3. MACHINE CROSS-CHECKING 61
Figure 3.5: The process for comparing model and operating system side effects.
3.3.3 Execution Testing with Deterministic Test Replay
Test cases made by the symbolic executor serve dual purposes. On the surface, these
tests exercise a target program’s paths. However, treating this generated data as
input for symbolic execution machinery means the executor makes tests for itself.
This testing works by replaying program tests and comparing against prior executor
state by alternating means of execution.
The system has three separate ways to evaluate code to test itself. First, non-
determinism in the interpreter is ruled out by replaying test cases in the interpreter.
Next, semantic differences between the intermediate representation and the interpre-
tation are found by replaying on the JIT executor. Finally, direct hardware replay
detects errors in the machine-code translation. If path passes each level, the inter-
preter transitively matches hardware.

CHAPTER 3. MACHINE CROSS-CHECKING 62
Interpreter × Interpreter
Replaying program paths in the interpreter rules out non-determinism bugs. The
replay process uses the test case as a variable assignment log. Whenever the system
model creates a symbolic array, the interpreter applies the variable assignment from
the test case and advances its position in the test case. Non-determinism in the
interpreter can cause the current variable assignment to have a different name from
the symbolic array or a different size, causing the replay to fail. Although this does
not ensure the interpreter follows the path from the test case, it is a good first
pass; differing paths often have separate system call sequences. Regardless, non-
deterministic paths with the same system call sequences are detected through register
logs in the next section.
Interpreter × JIT
The interpreter and LLVM JIT should have equivalent concrete evaluation semantics.
Since the interpreter and JIT are independent LLVM evaluation methods, the two can
be cross-checked for errors. We cross-check the two by comparing the interpreter’s
register log with the JIT’s register values. The heuristic is that an interpretation
error, whether on symbolic or concrete data, eventually manifests as a concrete error
in the register file. On JIT replay, logged registers marked as concrete are compared
with the JIT registers; a mismatch implies the interpreter or JIT is incorrect and is
reported to the user.
JIT × Hardware
Comparing the JIT and hardware finds translation bugs. Starting from the entry
point, the guest and native process run in tandem. The replay process executes code
one basic block at a time: first through the JIT, then through the native process; the
native process is never ahead of the JIT. Once the basic block is retired by the native
process, the JIT state and native state are cross-checked for equivalence. For speed,
only registers are compared at each basic block. On a mismatch, both registers
and memory are differenced and reported to the user for debugging. Occasionally

CHAPTER 3. MACHINE CROSS-CHECKING 63
Figure 3.6: Symbolic decoder cross-checking data flow.
mismatches are expected due to known translation issues (§ 3.4.2); these cases are
ignored by exchanging state between the JIT and hardware.
Hardware is traced by first creating a native process from a program snapshot.
The snapshot is loaded as a native process by forking klee-mc and jumping to the
snapshot’s entry point address. The entry point address is breakpointed so process
control with ptrace starts at the beginning of the program. klee-mc can jump to
the snapshot’s code because it identity maps memory from snapshots; collisions are
rare because the process is mapped to an uncommon address and non-fixed memory
is dispersed by address space layout randomization. Although the native process has
klee-mc in its address space as well as the snapshot, the memory from klee-mc is
never accessed again.
3.3.4 Host CPU and the Machine Code Front-End
Cross-checking third party binaries only finds decoder bugs covered by existing code.
While binaries taken from various environments are one step toward robustness, they
fall short of the darker corners of the decoder — broken opcodes, sequences, and
encodings either rarely or never emitted by compilers. To uncover these aspects of the
decoder, we symbolically generate code fragments then cross-check their computation

CHAPTER 3. MACHINE CROSS-CHECKING 64
between hardware and the JIT.
We generate new programs symbolically as follows. We mark an instruction buffer
as symbolic, feed it to a VEX front-end (denoted guest-VEX) which is interpreted
inside klee-mc. On each path klee-mc explores, the code in guest-VEX transforms
symbolic bytes into constraints that exactly describe all instructions accepted or re-
jected by the path. We call these constraints fragments since they solve to a fragment
of machine code. Fragments follow the validation pipeline in Figure 3.6.
Fragments are generated as follows. A small program, symvex, calls the VEX
decoder with a symbolic buffer. symvex is a standard native binary — it is compiled
with the stock system compiler (gcc in our case) and runs under klee-mc like any
other program. To start fragment generation symvex reads from a symbolic file,
marking a buffer symbolic. symvex then calls the VEX instruction decoder on the
buffer. As the VEX decoder runs (as a guest, under klee-mc ) it mechanically
decodes the buffer into every instruction sequence VEX recognizes.
The length and contents of the buffer were guided by the nature of the x86-64 in-
struction set. It is 64 bytes long with the first 48 bytes marked as symbolic. Since the
maximum length of an x86-64 instruction is 16 bytes, the buffer fills with a minimum
of three symbolically decoded instructions. To keep the decoded instructions from
exceeding buffer capacity, the final 16 bytes are fixed as single-byte trap instructions;
falling through to the tail causes a trap.
We use a small harness program (xchkasm) to natively run the putative code pro-
duced by solving a fragment’s constraints. An optional register file may be provided
by the user to seed the computation (by default, a register file filled 0xfe is used).
To protect itself from errant code, the harness establishes a sandbox by forking a
ptraced process. A small assembly trampoline bootstraps native execution. It loads
the register state from memory into machine registers and jumps to the code frag-
ment. Since few fragments contain jumps, fall-through code is caught by trap opcode
padding. If a fragment makes a system call, it will be trapped by ptrace. Unbounded
execution caused by stray jumps is rarely observed but can be caught with a watchdog
timer if the need ever arises.
Concrete register files are insufficient for testing fragments which contain jumps

CHAPTER 3. MACHINE CROSS-CHECKING 65
x86-64 VEX IR
rol rdi,0x3
rol rdi,0xd
nopsjc 0xffffffffcd0ccd00
PUT(RIP) = 0x40002E
if (64to1(
amd64g calculate condition[mcx=0x13](
0x2,0x28,t27,0x0,t35)))
goto 0xFFFFFFFFCD0CCD00
goto 0x400034
Constraints
(Eq 5 (Read w64 CC OP reg ) )(Or (Extract 0
(Shl w64N0 : (Or w64
(Shl w64 (ReadLSB w64 rd i reg ) 3)(ZExt w64 (Extract w3 5 (Read w8 ( rd i +7) reg ) ) ) )
13) )(Extract 51 N0) )
Figure 3.7: Symbolic register file derived constraints to trigger a conditional jump.
or other value-dependent execution. For example, computing condition flags relies on
an out-call to special, complicated, VEX library bitcode to find the flags on demand.
Figure 3.7 illustrates the effect of conditional coverage. To address this issue, we also
run fragments through the symbolic executor with a symbolic register file to explore
the paths through these helper functions, finding solutions for register files which
satisfy the conditions.
3.3.5 Constraint Validity for Expressions and Solvers
The values that symbolic data can take on a given path are represented using symbolic
expressions, which describe the effects of all operations applied to the data. The
constraint solver ultimately consumes these expressions as queries , typically when
resolving branch feasibility and to find concrete assignments for test cases. klee-mc
serializes queries into the SMTLIB [12] language and so expressions correspond to a
subset of SMTLIB.

CHAPTER 3. MACHINE CROSS-CHECKING 66
Solver × Solver
An efficient solver is a stack of query processing components terminated by a full the-
orem prover. These components include query filters, incomplete solvers, and caches.
Since the stacks are non-trivial, the klee-mc system uses a debugging technique from
klee to cross-check solvers during symbolic execution.
Solvers are checked with a dual solver at the top of the solver stack. The dual
solver passes every query to two separate stacks, then checks the results for equality.
If the results do not match, then one solver stack must be wrong.
Running two separate solvers is expensive. For instance, cross-checking a cache
with a bare theorem prover would recompute every query that the caching would oth-
erwise absorb. Additionally, solver bugs always reappear during path reconstruction,
so checking for solver bugs can be deferred to path replay. In practice, the solver
cross-checker detects unsound reasoning arising when developing solver components
and optimizations.
klee-mc supports arbitrary solvers by piping SMTLIB queries to independent
solver processes. This means klee-mc avoids specific library bindings and therefore
submits text-equivalent queries to distinct SMT solvers. This is important because
subtle differences in bindings and solver-specific optimizations can introduce bugs for
one solver but not another. Although piping SMTLIB queries incurs an IPC penalty,
using a solver as a library can ultimately impact stability of the system (e.g., STP
was notorious for stack overflows), so there is impetus to use independent processes.
Expression × Expression × Solver
klee-mc builds expressions using an expression builder. Given the expense of inter-
acting with the constraint solver, a significant portion of this builder code focuses on
translating expressions to more efficient (typically smaller) but semantically equiv-
alent ones, similar to peephole optimization and strength-reduction in a compiler
backend. The ideal replacement produces a constant.
Expression optimizations are checked for errors at the builder level with a cross-
checked expression builder. Figure 3.8 illustrates the process of cross-checking two
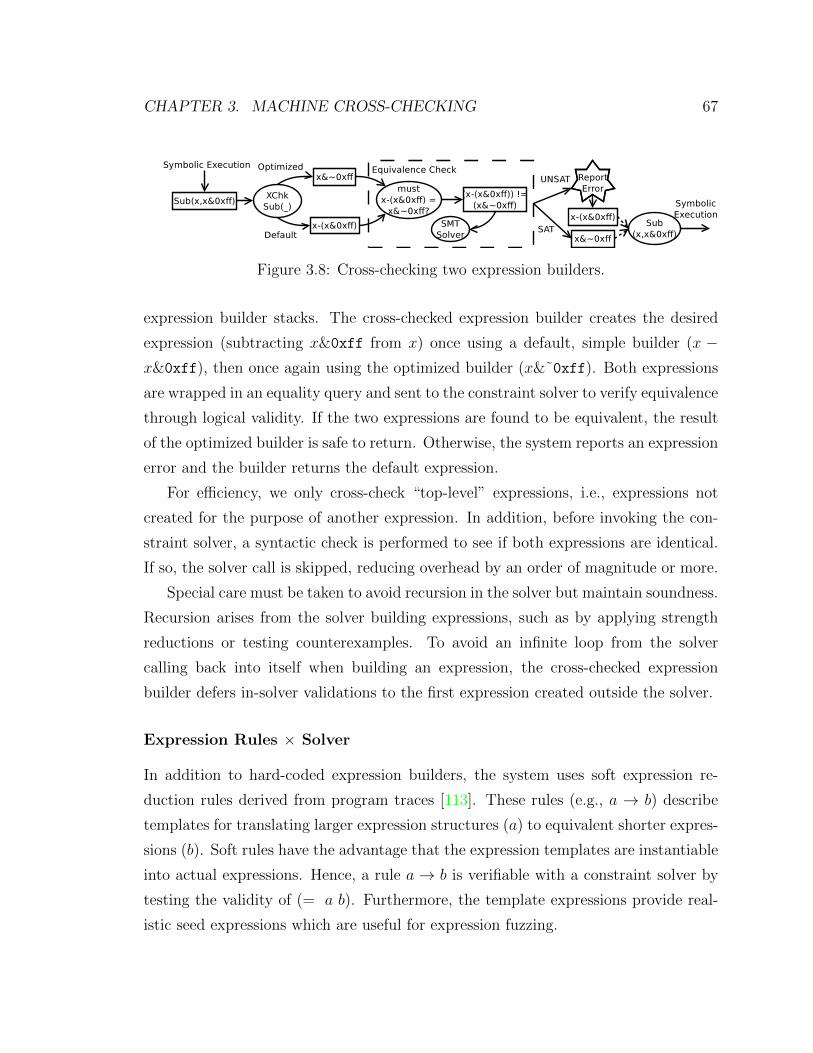
CHAPTER 3. MACHINE CROSS-CHECKING 67
Figure 3.8: Cross-checking two expression builders.
expression builder stacks. The cross-checked expression builder creates the desired
expression (subtracting x&0xff from x) once using a default, simple builder (x −x&0xff), then once again using the optimized builder (x&˜0xff). Both expressions
are wrapped in an equality query and sent to the constraint solver to verify equivalence
through logical validity. If the two expressions are found to be equivalent, the result
of the optimized builder is safe to return. Otherwise, the system reports an expression
error and the builder returns the default expression.
For efficiency, we only cross-check “top-level” expressions, i.e., expressions not
created for the purpose of another expression. In addition, before invoking the con-
straint solver, a syntactic check is performed to see if both expressions are identical.
If so, the solver call is skipped, reducing overhead by an order of magnitude or more.
Special care must be taken to avoid recursion in the solver but maintain soundness.
Recursion arises from the solver building expressions, such as by applying strength
reductions or testing counterexamples. To avoid an infinite loop from the solver
calling back into itself when building an expression, the cross-checked expression
builder defers in-solver validations to the first expression created outside the solver.
Expression Rules × Solver
In addition to hard-coded expression builders, the system uses soft expression re-
duction rules derived from program traces [113]. These rules (e.g., a → b) describe
templates for translating larger expression structures (a) to equivalent shorter expres-
sions (b). Soft rules have the advantage that the expression templates are instantiable
into actual expressions. Hence, a rule a → b is verifiable with a constraint solver by
testing the validity of (= a b). Furthermore, the template expressions provide real-
istic seed expressions which are useful for expression fuzzing.

CHAPTER 3. MACHINE CROSS-CHECKING 68
3.4 Implementation
This section describes implementation details necessary for cross-checking with bit-
equivalent under a binary symbolic executor. Left untended, bit-equivalence breaks
under non-determinism. The system handles this non-determinism through static
and dynamic mechanisms. The static approach models non-deterministic features
with deterministic replacements. The dynamic approach detects and repairs non-
determinism as it is observed.
3.4.1 Static Non-determinism
For bit-level reproducible replay, all sources of non-determinism in a program must
be ruled out. As stated in Section 3.3.1, the system call layer is totally modeled in the
interpreter and side effects are logged. However, several sources of non-determinism
need special care beyond register and memory side effect logging:
rdtsc. Reads from a system timestamp counter. The value is hard-wired to 1
by the JIT. For cross-checking with hardware, the instruction is detected and the
mismatch overwritten through fix-ups (§ 3.4.2).
mmap. Special care is taken to rewrite mmap calls to reuse the addresses given by
the interpreter. Otherwise, the operating system could allocate at a different base
address and violate pointer equivalence.
VDSO. A few Linux system calls (e.g., clock gettime) have a fast-path through
the VDSO library. These system calls access special read-only system pages (the
vsyscall region) with memory mapped timers. No system calls are dispatched so it
is difficult to account for these accesses on hardware or model the side-effects. Instead,
each guest process’s VDSO library is overwritten with a custom VDSO library that
uses slow-path system calls instead.
3.4.2 Dynamic Non-determinism
Machine instruction translation occasionally fails to match hardware in such a way
that is either difficult or impossible to correct a priori. Although the translation
CHAPTER 3. MACHINE CROSS-CHECKING 69
can be plainly wrong by diverging from the architectural specification, some in-
struction results may be undefined, micro-architecture dependent, or defined as non-
deterministic. When the system encounters a problematic instruction, it corrects the
mismatch with fix-ups that replace bad values with expected values. The following is
a partial list of fix-ups:
• rdtsc: In native execution, the opcode is caught by single-stepping instructions,
and a constant is injected into the native register in place of a timestamp.
• cpuid: stores processor information into registers. VEX returns a description
that matches its feature set, but pretends to be a genuine CPU (e.g., an Intel
Core i5). To fix up the native process to match the guest, the opcode is caught
when stepping and overridden to use the VEX description.
• pushf – Stores ptrace control information to the stack. Single stepping the
native process with ptrace is based on a processor feature which requires a
trap flag to be set in the eflags register. VEX, on the other hand, is unaware.
Hence, the two states will never have equal eflags registers. Our solution gives
preference to running applications without single-stepping: the native opcode
is caught and its result overridden to mask away the flag.
• bsf, bsr – The VEX IR overwrites the top half of the 64-bit register for the
32-bit variant of these instructions. The native register value is copied to the
affected JIT register.
3.5 Experiments and Evaluation
This section reports measurements and faulty behaviors from running klee-mc.
First, we show the system’s ability to cope with binary diversity by testing over
ten thousand Linux binaries. Next we find system modeling differences derived by
comparing operating system calls and symbolic system model side-effects from host
execution traces. Finally, we check core interpreter functionality by verifying soft ex-
pression reduction rules and showing run-time bugs in hard-coded expression builders.

CHAPTER 3. MACHINE CROSS-CHECKING 70
3.5.1 Linux Program Test Cases
klee-mc is designed to find bugs in user-level binary programs. The system is mature
enough to construct test inputs that reliably crash programs. Regardless of this initial
success, the integrity mechanisms detect critical bugs which still threaten the quality
of symbolic execution.
Types of Mismatches
We recognize three error modes which roughly correspond to the symbolic interpreter,
machine-code translation, and hardware respectively:
System call mismatch. Either the system call log is depleted early or the
sequence of system calls diverges from the log on replay. This exercises replay deter-
minism and coarsely detects interpreter bugs.
Register log mismatch (Interpreter × JIT). The interpreter’s intermediate
register values conflict with the JIT’s register values. This detects symbolic interpre-
tation bugs at the basic block level.
Hardware mismatch (JIT × HW). The JIT’s intermediate register values
conflict with host hardware register values. This detects machine-code translation
bugs otherwise missed by register logging.
Testing Ubuntu Linux
We tested program binaries from Ubuntu 13.10 for the x86-64 architecture. Each
program was symbolically executed for five minutes, one to a single core of an 8-core
x86-64 machine, with a five second solver timeout. The symbolic execution produced
test cases which exercise many program paths, including paths leading to crashes.
These paths were then checked for computational mismatches against JIT replay,
register logs, and native hardware execution.
Table 3.1 lists a summary of the test results. Crash and mismatch data are given in
terms of total tests along with unique programs in parentheses. In total we confirmed
4410 pointer faults (97%), all divide by zeros, and 38 (30%) decode and jump errors.
Surprisingly, the overlap between mismatch types was very low– 3.8% for hardware
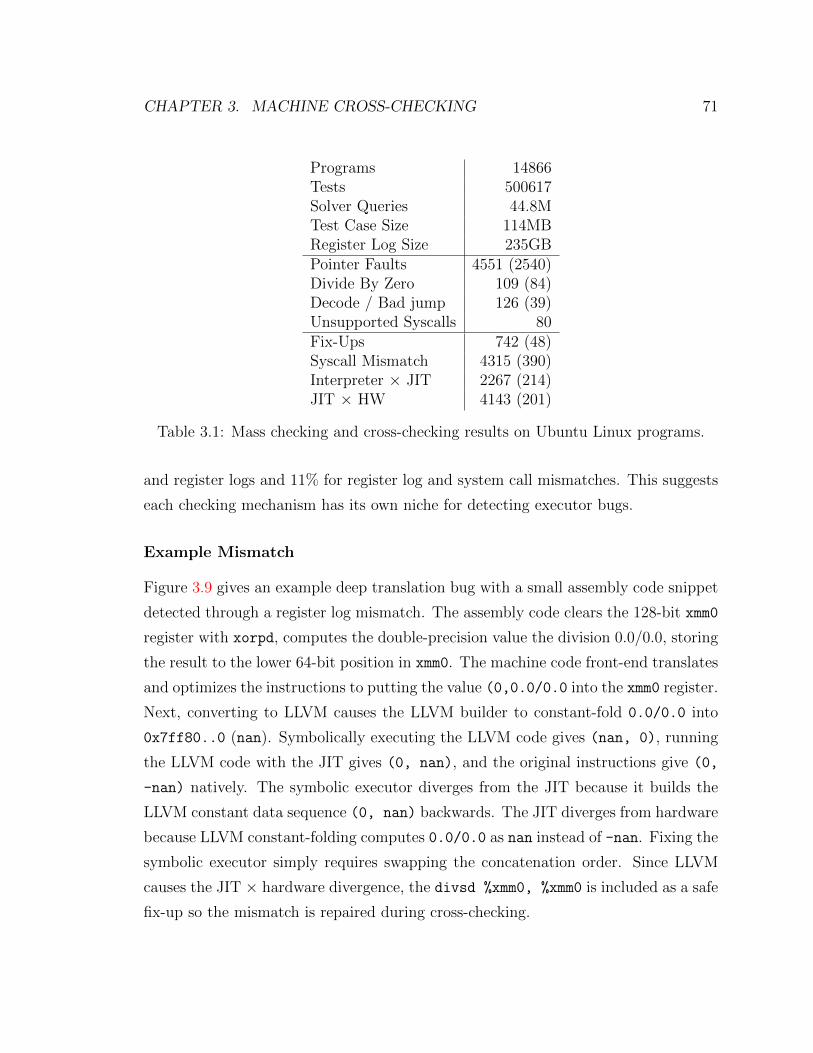
CHAPTER 3. MACHINE CROSS-CHECKING 71
Programs 14866Tests 500617Solver Queries 44.8MTest Case Size 114MBRegister Log Size 235GBPointer Faults 4551 (2540)Divide By Zero 109 (84)Decode / Bad jump 126 (39)Unsupported Syscalls 80Fix-Ups 742 (48)Syscall Mismatch 4315 (390)Interpreter × JIT 2267 (214)JIT × HW 4143 (201)
Table 3.1: Mass checking and cross-checking results on Ubuntu Linux programs.
and register logs and 11% for register log and system call mismatches. This suggests
each checking mechanism has its own niche for detecting executor bugs.
Example Mismatch
Figure 3.9 gives an example deep translation bug with a small assembly code snippet
detected through a register log mismatch. The assembly code clears the 128-bit xmm0
register with xorpd, computes the double-precision value the division 0.0/0.0, storing
the result to the lower 64-bit position in xmm0. The machine code front-end translates
and optimizes the instructions to putting the value (0,0.0/0.0 into the xmm0 register.
Next, converting to LLVM causes the LLVM builder to constant-fold 0.0/0.0 into
0x7ff80..0 (nan). Symbolically executing the LLVM code gives (nan, 0), running
the LLVM code with the JIT gives (0, nan), and the original instructions give (0,
-nan) natively. The symbolic executor diverges from the JIT because it builds the
LLVM constant data sequence (0, nan) backwards. The JIT diverges from hardware
because LLVM constant-folding computes 0.0/0.0 as nan instead of -nan. Fixing the
symbolic executor simply requires swapping the concatenation order. Since LLVM
causes the JIT × hardware divergence, the divsd %xmm0, %xmm0 is included as a safe
fix-up so the mismatch is repaired during cross-checking.

CHAPTER 3. MACHINE CROSS-CHECKING 72
Assembly
xorpd %xmm0, %xmm0divsd %xmm0, %xmm0
VexIR
Put (224) <− Iop Div64F0x2 ( 0 : V128 , 0 : V128 )
LLVM Code
%ctx = b i t c a s t %guestCtxTy∗ %0 to <2 x double>∗%”XMM[ 0 ] ” = gete l ementptr <2 x double>∗ %ctx , i 32 14s t o r e <2 x double><double 0x7FF8000000000000 , double 0 .000000 e+00>,<2 x double>∗ %”XMM[ 0 ] ”
Register ValuesSymEx XMM0: (0x7ff8000000000000, 0)JIT XMM0: (0, 0x7ff8000000000000)Hardware XMM0: (0, 0xfff8000000000000)
Interpreter Bug
r e f<Expr> ConstantExpr : : createSeqData (l lvm : : ConstantDataSequentia l ∗ v )
{ . . .f o r ( unsigned i = 0 ; i < elem c ; i++) {
r e f<ConstantExpr> ce ;. . .cur v = ( i == 0) ? ce : cur v−>Concat ( ce ) ; }
re turn cur v ; }
Figure 3.9: A broken floating-point division sequence.
Register Logs
Register log can consume excessive memory because the executor stores a new register
set for every basic block. In the interpreter, the log is stored in memory until path
termination, where it is written, compressed, to the file system. Since the memory
overhead makes logging impractical during the symbolic execution run, register logs
are recreated through test case replay. Figure 3.10 shows the time it takes to recon-
struct a register log from a test case. Since paths tend to be short, approximately 90%
of test cases can have their register logs reconstructed in under ten seconds. Since
a few missing logs are of little importance, the process memory was limited so the

CHAPTER 3. MACHINE CROSS-CHECKING 73
0
10
20
30
40
50
60
70
80
90
100
0.1 1 10 100 1000
Cum
ula
tive P
erc
ent
Register Log Generation Time (seconds)
Test Register Log Generation Time CDF
Figure 3.10: Cumulative time distribution to build register logs for each test case.
interpreter would terminate, thus losing the log, without exhausting all total mem-
ory. Offline reconstruction is a good trade-off; complicated efficient online logging is
unnecessary because the data can be quickly rebuilt from test cases.
Figure 3.11 plots the number of basic blocks checked for each test case. As ex-
pected, there is a linear relationship between number of basic blocks checked and
time to check the entire test case. The most frequent tests have fewer basic blocks.
The longest logs check more than a million basic blocks, approaching the executor
memory limit with more than a gigabyte of log data.
3.5.2 Machine Code Front-End
We ran klee-mc on 39 cores of a cluster for two hours, where each core explored a
different partial path in the VEX x86-64 instruction decoder. This method generated
a total of 40,270 test fragments (both decodable and undecodable). Conservatively,
this gives 17 code fragments per CPU-minute. Generated code fragments are fed into
the JIT and cross-checked with the native machine using a fixed concrete register file.
The system solves constraints to generate fragments of concrete code, then runs
them natively. If VEX rejects a fragment, no solution should fault. Conversely, if

CHAPTER 3. MACHINE CROSS-CHECKING 74
0
1e6
2e6
3e6
4e6
5e6
6e6
7e6
8e6
0 5 10 15 20 250
2.0e5
4.0e5
6.0e5
8.0e5
1.0e6
1.2e6
Checked B
asic
Blo
ck F
requency
Checked B
asic
Blo
cks in T
est C
ase
Time to Check (seconds)
Times for Checking Register Log with JIT
FrequencyTest Case
Figure 3.11: Number of basic blocks checked against register log as a function of time.
Instruction Bytes Problemnop esp 0f 19 cc vex amd64->IR: unhandled instruction bytes
rex.w popfq 48 9d Assertion ‘sz == 2 || sz == 4’ failed.
fs stosb 66 aa disAMode(amd64): not an addr
rex.w ss sbb eax,0xcccccccc 48 36 1d cc cc cc cc cc Keeps top half of raxrex.w ss mov ch,0xcc 48 36 b5 cc Stores to first byte of rbprol rax, 0x11 48 c1 c0 11 Sets undefined overflow flagshl cl, r9 49 d3 e1 Sets adjust flag
Table 3.2: Valid x86-64 code causing VEX to panic, corrupt register state, or invokedivergent behavior.

CHAPTER 3. MACHINE CROSS-CHECKING 75
Bug Class Occurrences Error TypesCorrupted Register 1739 78Assert Failures 5643 4False Reject 747 3False Accept 145 1Total 8274 86
Table 3.3: VEX decoder errors found with a static register file.
accepting, every solution should run natively without raising an illegal instruction
violation. Further, any non-faulting sequence should yield the same register values at
the end. As expected, we found numerous places where these checks failed, indicating
bugs in VEX. Table 3.2 shows the flavor of opcodes and bugs which come from
symbolically generated fragments.
No special effort is made to support memory accesses, so most trap. When a
fragment makes an access to an invalid pointer, the harness would catch the access,
log the address and value (if a write), patch in a return value (if a read), then return
control to the fragment. To keep results pure, we discard from consideration any
code fragment which causes a memory access violation. Despite this drawback we
find many decoding errors.
Cross-checking symbolically generated code with a concrete register file was sur-
prisingly effective: 8,274 out of the forty-thousand code fragments produced mis-
matches. This number is after filtering errors from bad jumps, bad memory accesses,
and obvious unhandled cases in our JIT dispatcher. We crudely culled duplicate bugs
by binning all errors that had the same unique register values (but different instruc-
tions), which brought the total number down to 86 errors. A gross classification of
the bugs uncovered by the concrete register file is listed in Table 3.3. The bugs are
classified into four categories:
1. Corrupted Registers: A register in the native state disagrees with its guest
counterpart after running the fragment. Mismatches stem from overzealous
truncation, mixed up operands, and nondeterminism.
2. Assert Failures: assert failures thrown within the VEX decoder. The binned

CHAPTER 3. MACHINE CROSS-CHECKING 76
number is very conservative since we only count unique assertion messages (i.e.,
the same error message twice is one error counted); VEX has few messages for
rejections, so distinct opcodes are rejected with the same message.
3. False Reject: VEX rejects an instruction sequence which native hardware
accepts. This number is conservative. Unique occurrences are counted based on
the signal returned by the ptrace’d process (e.g., SIGBUS, SIGTRAP, SIGSEGV); a
correctly rejected instruction would return the illegal instruction signal, SIGILL.
We excluded 1,607 code fragments from the false reject count because raise
SIGSEGV as a consequence of the incomplete memory model.
4. False Accept: VEX accepts an instruction which is illegal on the host machine.
Only SIGILL is expected; this test yields one “unique” mismatch.
Of the four classes, we believe corrupted register errors are most serious. If a
corrupted register is live after completion of the instruction, it will introduce garbage
into the computation. Occasionally the bogus computation will fail fast (e.g., the
corrupted register was a pointer). Without cross-checking, the computation may
proceed unhindered for some time, making the root cause uncertain.
We next evaluate the propensity toward false-negatives in concrete tests by recheck-
ing matching fragments with symbolically derived concrete register files. From 11,379
fragments that cross-checked successfully, klee-mc generated 570,977 register files
designed to exercise all paths in the fragments. Of the 11,379 fragments passed
by concrete checking, 346 failed under symbolic registers. Errors stemmed from new
paths, condition codes, and a mishandled or opcode masked by our choice of concrete
register values.
3.5.3 System Model
Systematically applying model differencing detects both underconstrained and over-
constrained system calls. To strenuously test the symbolic model, we used the system
call test cases from the Linux Test Program [88] project (LTP). Although the system
model occasionally diverged from the host, the differences were modest.

CHAPTER 3. MACHINE CROSS-CHECKING 77
Type System Calls Test CasesUnderconstrained 11 133Overconstrained 34 1586No difference 152 39360Total 201 41079
Table 3.4: Comparison between model and operating system with LTP suite.
Each LTP program was snapshotted for up to one hundred system calls. LTP
program demanding root access were ignored. To test the executor’s system model,
each pre-call snapshot was symbolically executed to path completion for the call. This
covers all possible results the system model could give for the snapshot’s system call.
Next, the side-effects, from the pre and post snapshots and the system model, were
compared for overconstrained and underconstrained modeling. Table 3.4 summarizes
the model differencing data from the LTP programs. The results suggest that the
model tends to be conservative, opting to leave memory untouched. It should be
noted that LTP is not a complete test suite and therefore does not represent a full
set of possible program-operating system interactions. For instance, LTP makes no
attempt to seriously test the notoriously overloaded ioctl call (likewise, klee-mc
makes little attempt to accurately model ioctl).
Overconstrained system model calls, those that left some data untouched com-
pared to the host, typically flagged obviously missing modeling. Most calls were
unimplemented or incomplete with remarks in the comments. In one case (getdents),
the complete system call was commented out in favor of an incomplete version, for rea-
sons unknown. Five system calls (not counted in the table) were accurately modeled
(e.g., getpid), but were occasionally flagged as overconstrained because of system
modifications to the read-only vsyscall page.
Underconstrained system calls, those that touched excess data, flagged environ-
mental differences between the host and the symbolic system model. Often the system
model fills in structures for resources that missing from the host system. As an exam-
ple, the model (as a heuristic) permits failures of lstat only occasionally; otherwise,
the stat structure is unconditionally updated.

CHAPTER 3. MACHINE CROSS-CHECKING 78
0
200
400
600
800
1000
1200
1400
1600
0 5 10 15 20
Cum
ula
tive V
erification T
ime
Time to Verify Individual Rule (seconds)
Expression Rule Verification Duration
Figure 3.12: Time to verify machine-derived rewrite rules.
3.5.4 Expressions
Testing Rules
Thousands of expression reduction rules in klee-mc are verified using the constraint
solver. Although rule verification is offline, it is still important that soft rules can be
verified within a reasonable about of time. Figure 3.12 shows the time to test the soft
rule set currently used by klee-mc. The entire set of 19444 rules took under half an
hour to verify with the STP constraint solver. All rules are verifiable in under thirty
seconds with a median time of less than a tenth of a second.
On the other hand, testing the rules with Z3 [49] led to other conclusions. Indi-
vidual rules could take more than a minute to confirm, far longer than STP’s worst
case; in total, Z3 took 11.6× as long as STP to verify the rule set. Furthermore, Z3
handles undefined division edge cases differently from STP, causing it to reject 27
otherwise acceptable rules. Figure 3.13 shows an example rule verification expression
that is valid in STP but contingent under Z3. The trace-derived rule states the 5th
byte of four 64-bit divides of a zero-extended 32-bit value (x) by any value (c) will
always be zero. Technically, dividing by zero could result in a value greater than the

CHAPTER 3. MACHINE CROSS-CHECKING 79
(Eq 0 (Extract w8 40(UDiv w64 (UDiv w64 (UDiv w64 (UDiv w64
(ZExt w64 (ReadMSB w32 0 x ) )N0 : (ReadMSB w64 0 c ) )
N0) N0) N0) ) )
Figure 3.13: Translation rule test with undefined result.
numerator, but this seems unnecessarily pedantic.
Hard-coded Builders
We generated expressions to cross check both using actual programs and by using
a simple “fuzzer” to construct them synthetically. Cross-checking the former found
errors in both the optimizing and in the naıve builders, cross checking fuzz-produced
expressions found an error in LLVM itself. We discuss a few in detail.
Basic Builder. Although the cross-checker is intended to find bugs in the opti-
mizing expression builder, it still found an error in the simpler builder. Both builders
attempted to replace an equality check of two identical constant values with 1 (true),
the optimizing builder correctly, the simple builder incorrectly. The latter gener-
ated the boolean constant using an optimistically-named helper function, True() .
Unfortunately, True() was an exact copy of its negated counterpart and presumed
paste progenitor, False(). One might assume defining true as false would lead to
immediate errors, but only one line called the function, allowing its effects to go
unnoticed.
Optimizing Builder. The cross-checker immediately found several bugs, in-
cluding a truncation error in the constraint marshaler and unsupported expression
combinations. One of the most serious was a buggy routine to replace multiply op-
erations (expensive in constraint solving) with shifts and adds. Figure 3.14 shows
a subset of the information the cross checker reports — the expression that failed
cross-checking, a concrete assignment which will make both routines differ, and the
concrete values they produce. The broken multiplication algorithm relied on compli-
cated bit tricks broken beyond repair; it was rewritten from scratch to use Booth’s

CHAPTER 3. MACHINE CROSS-CHECKING 80
(Eq (NotOptimized w128(Mul w128 0x1845c8a0ce512957
N0 : (SExt w128 (ReadLSB w64 88 s ta tbu f8 ) ) ) )(Sub w128 0
(Add w128 (Add w128 (Add w128 (Add w128(Shl w128 N0 59)(Shl w128 N0 46))(Shl w128 N0 30))(Shl w128 N0 25))(Shl w128 N0 0 ) ) ) )
Counterexample: statbuf8[95] = 0x1 (N0 = 0x1000000000000000)Oracle Cex Eval: 0x001845c8a0ce51295700000000000000
Test Cex Eval: 0xfff7ffbfffbdffffff00000000000000
Figure 3.14: Bad multiply caught by cross-checking.
const ZExtExpr ∗ zr , ∗ z l ;i f ( ( zr = dyn cast<const ZExtExpr∗>( r ) ) &&
( z l = dyn cast<const ZExtExpr∗>( l ) ) &&zr−>getKid(0)−>getWidth ( ) ==zl−>getKid(0)−>getWidth ( ) ) {return MK SEXT(
MK SUB( z l−>getKid (0 ) , zr−>getKid ( 0 ) ) ,z l−>getWidth ( ) ) ; }
Figure 3.15: A faulty hard-coded optimization
method.
Faulty optimizations occasionally creep into the code, but the cross-checker helps
flag the contamination. Figure 3.15 lists one such optimization. The optimization
is meant to optimize subtraction expressions. When the arguments x and y are
zero-extended to n bits, (− (ZExt x n) (ZExt y n)), the code replaces the two zero-
extensions with a single n-bit sign-extension, (SExt (− x y) n). This reasoning is
clearly incorrect (e.g., for 8-bit values x = 0x80, y = 0, and n = 16). An obvious
mistake, but only arising in very specific circumstances. After being introduced to
the code base, the bug was detected and fixed in time for the next commit.
LLVM. Cross-checking fuzz-produced expressions found a broken corner case in

CHAPTER 3. MACHINE CROSS-CHECKING 81
LLVM’s arbitrary precision integer code. The arithmetic right shift operation is
mishandled for the single-bit case; LLVM incorrectly claims 1 >> 1 = 0. This is
wrong for arithmetic right shift because the shift is defined to round to negative
infinity (i.e. 1). The SMT solver, however, gets it right. Fuzzing expressions loosely
resembles fuzzing constraint solvers [26], although we assume the solver to be correct
but not the expression builder. Since there are multiple SMT solvers, this assumption
may be lifted by submitting queries to several solvers and holding an election.
3.6 Related Work
Much recent work uses symbolic execution to find bugs both on source code [28, 58,
75, 119] and on binaries [30, 34, 59, 65]. In the latter category, S2E uses a QEMU-to-
LLVM translator to convert x86 code into fragments for klee. Another system [65]
uses the valgrind DBT, symbolically running the VEX IR directly. klee-mc shares
code with both: klee is the symbolic executor core and VEX translates. We view our
work as complementary to past efforts, which have been largely unreflective. Success
meant bugs in other code, rather than turning the tool on itself for trustworthy results.
We believe these other tools would benefit from the techniques in this chapter.
FuzzBALL [92] uses a symbolic binary executor to find edge cases in system-
level emulation features and instruction decoding. klee-mc focuses on user-level
code so the checks in klee-mc support self-hosting, whereas FuzzBALL excels at
manipulating system registers. Finally, klee-mc tests its own decoder; FuzzBALL
uses VEX as an internal decoder, but ignores VEX as a target because VEX only
models a user-mode environment.
Validation, or on-demand verification of individual paths, is a practical alterna-
tive to full-fledged verification of program code. Translation validation has been used
to validate compilation by verifying target code for a given source program [107],
intermediate forms in optimizer passes in the GNU C compiler [98], LLVM optimizer
passes [126], and program patches [94]. Instead of targeting compilation, we vali-
date expressions used during symbolic execution; optimized expressions are validated
against unoptimized expressions by reusing the constraint solver infrastructure from

CHAPTER 3. MACHINE CROSS-CHECKING 82
symbolic resolution.
For hardware, co-simulation [48] is a verification heuristic which validates exper-
imental hardware against a simulator oracle. klee-mc uses co-simulation with a
reversal of roles: hardware is an oracle for software.
CSmith [135] generates well-defined C programs to find defects in C compilers.
Both this work and ours share the use of cross-checking to dispense with needing
an oracle for correctness. They use pure concrete execution rather than symbolic,
targeting bugs in compilers rather than their infrastructure. Unlike klee-mc, which
validates against hardware, CSmith lacks a ground truth C compiler (verified C com-
pilers [84] remain experimental).
The verified L4 operating system micro-kernel [120] uses translation validation
to verify C sources match compiled code. L4 translation validation uses a processor
model to decode compiled code and checks it against a specification modeled by the
C code. klee-mc is weaker in that it validates code semantics through tests instead
of verification, but it targets more code; the binary translation models an x86-64
processor which is checked through native execution on the host hardware.
3.7 Conclusion
In our work on building and validating a dynamic binary symbolic execution stack,
we developed cross-checks at points where manual debugging would be intricate and
frustrating. Validating paths in the system boosted our confidence when implement-
ing new, experimental features. Furthermore, flagging mismatches at the basic block
level virtually eliminated many challenges with reproducing runtime bugs.
Engineering a robust bug checker is the next logical step for symbolic execution.
Much progress has been made in systematically finding bugs in third party programs.
However, it is time to detect bugs in the checker for better confidence in the process
itself. We have presented cross-checking in a symbolic executor as a method to find
errors in program evaluation given a complex dynamic program analysis system. The
symbolic executor detected thousands of serious program errors in commodity third
party binaries, all of which can be mechanically confirmed through a high-integrity
CHAPTER 3. MACHINE CROSS-CHECKING 83
test replay system. Likewise, we found many errors in the analysis tool itself by testing
with a generous program set. Considering the results, we believe cross-checking is the
easiest and fastest way to find binary symbolic interpreter bugs and develop a high-
quality binary program analysis tool.

Chapter 4
Off-the-Shelf Symbolic
Floating-Point
4.1 Introduction
To obtain a satisfying variable assignment for a constraint set, a symbolic executor
usually represents constraints as expressions over a theory of bit-vectors and arrays
which is solved by some decision procedure or theorem prover. Deciding satisfiability
modulo the theory of bit-vectors is meant for integer workloads; expressions consist
of two’s complement arithmetic, integer comparisons, and bitwise operators.
Solving for expressions over floating-point operations requires additional effort
and is considered a significant challenge in model checking [1]. There is little agree-
ment on how to best handle symbolic floating-point data in a symbolic executor;
in fact, several classes of floating-point support have been proposed. The simplest
support evaluates only concrete data [28], which is fast and sound, but incomplete.
Another approach, but still incomplete, applies taint analysis [57] and floating-point
expression matching [41] to detect suspicious paths. The most challenging, complete
and accurate symbolic floating-point semantics, relies on the flawless reasoning of a
floating-point solver [6, 10, 20].
Accurate floating-point is essential for checking software. The de facto floating-
point standard, IEEE-754 [71], fully describes a floating-point arithmetic model; it is
84

CHAPTER 4. OFF-THE-SHELF SYMBOLIC FLOATING-POINT 85
subtle and complicated. A cautious software author must account for lurid details [61]
such as infinities, not-a-numbers (NaNs), denormals, and rounding modes. Ignoring
these details is convenient once the software appears to work but defects then arise
from malicious or unintended inputs as a consequence.
Fortunately, IEEE-754 emulation libraries already encode the specifics of floating-
point in software. Namely, a soft floating-point library emulates IEEE-754 operations
with integer instructions. These libraries are a fixture in operating systems; unim-
plemented floating-point instructions trap into software handlers. Elsewhere, soft
floating-point shared libraries assist when the instruction set lacks floating-point in-
structions.
This work presents an integer-only binary symbolic executor augmented to support
floating-point instructions through soft floating-point libraries. Five off-the-shelf soft
floating-point libraries are adapted to the symbolic executor by mapping soft floating-
point library operations to a unified runtime interface. Floating-point instructions are
mapped to integer code by transparently replacing program instructions with calls to
soft floating-point runtime functions, an idea that can apply to nearly any symbolic
executor. Aside from testing floating-point paths in general purpose programs, binary
symbolic execution with soft floating-point provides a novel means for testing floating-
point emulation libraries and floating-point theorem provers.
The rest of this chapter is structured as follows. Section 2 discusses related work,
relevant background, and the motivation behind soft floating-point in a symbolic ex-
ecutor. Section 3 describes the operation and implementation of soft floating-point in
a binary symbolic executor. Section 4 analyzes operation integrity through symbolic
execution of soft floating-point libraries with symbolic operands by comparing the
generated test cases against native evaluation on host hardware. Section 5 continues
by testing floating-point SMT solvers for inconsistencies with hardware. Section 6
considers general purpose applications by examining errors in Linux binaries found
through symbolic execution with soft floating-point. Finally, Section 7 concludes.

CHAPTER 4. OFF-THE-SHELF SYMBOLIC FLOATING-POINT 86
4.2 Related Work
Testing and verification of floating-point software is the topic of much study. At the
most primitive level, finite-width floating-point variables are reconciled with real and
rational arithmetic and are the focus of floating-point decision procedures. Static
analysis of source code leverages these primitives to find floating-point bugs but is
limited to only an approximation of execution. A symbolic executor of floating-point
code dynamically executes programs and must balance performance, completeness,
and soundness with different workload needs. If floating-point data is concrete or un-
interesting symbolically, symbolic execution of floating-point operations may be ex-
clusively concrete [28]. Fast, but unsound, symbolic floating-point, useful for bug find-
ing, applies canonicalization and matching on floating-point expressions [41, 57, 87].
When complete semantics are necessary, precise symbolic floating-point integrates
a floating-point solver into the symbolic execution stack [6, 10, 20, 82]. This work
introduces a new point in this progression: symbolically executed soft floating-point
with integer code.
Many techniques have been developed to handle abstract floating-point data. Ab-
stract domains [43], interval propagation [47], and abstraction refinement [38] are
some influential approaches for computing solutions to value constraints. Such con-
cepts have been extended, improved, and refined for floating-point values through
exact projections [20], filtering by maximum units in the last place [6], interval lin-
ear forms [95], monitor variables [72], saturation with simplex bounding [42], conflict
analysis over lattice abstractions [64], and guided approximation transformations of
formulas [22], among others. For ease of use, decision procedures based on these
strategies may be integrated into a solver back-end [6, 20, 22, 42, 64]. For hard-
ware, formal floating-point specifications have been used to verify the correctness of
a gate-level description of a floating-point unit [102].
Static analysis of source code to find floating-point bugs includes a broad class of
notable abstract interpretation systems. The fluctuat [63] system models floating-
point values in C programs with affine arithmetic over noise symbols to locate sources
of rounding error with respect to real numbers. astree [19] is based on an interval

CHAPTER 4. OFF-THE-SHELF SYMBOLIC FLOATING-POINT 87
abstraction that uses a multi-abstraction, specializable, domain-aware analysis to
prove the absence of overflows and other errors for source programs written in a
subset of the C language.
In the context of symbolic execution, the simplest floating-point tactic discards
symbolic data in favor of processing floating-point operations through concretiza-
tion [28]. To dispatch a floating-point operation on symbolic data, each operand
is constrained to a satisfying variable assignment (concretized) and the operation is
evaluated. As an example, if x is unconstrained and 0 is the default assignment,
computing x+1.0 concretizes to 0.0+1.0. Concretization is fast but it overconstrains
the variable term x and discards most feasible values (in this case, x 6= 0.0).
A symbolic executor with expression matching also avoids the difficulty of support-
ing full floating-point semantics. These symbolic executors broaden the expression
language to include floating-point operators but only impose additional structure on
expressions; the operations are purely superficial. Taint tracking, where data be-
comes “contaminated” according to a taint propagation policy and operations on
tainted data are flagged according to a detection policy, is one instance of expres-
sion analysis on symbolic floating-point; floating-point operations tag expressions as
tainted and dereferences of tagged pointers are flagged [57]. Beyond tainting, com-
parison of expression structure [41, 87] demonstrates equivalence between algorithm
implementations. This analysis is often unsound; spurious errors are possible.
Precise symbolic floating-point reasons about the underlying semantics by using
a floating-point solver. Although explicit reasoning is accurate and often complete
by design, it demands a careful solver implementation (tested in Section 4.5) and
invasive executor modifications [10]. In some cases, authors of these systems use the
symbolic executor as a platform to test their own floating-point decision algorithms
in lieu of a third-party IEEE-754 solver [6, 20, 82].
This chapter proposes symbolically executed soft floating-point, a compromise
between concretization and full symbolic floating-point. Where a floating-point solver
may model a formula as disjunctions of several feasible subformulas, soft floating-
point models that formula with many states. A soft floating-point operation partially
concretizes on program control at contingent branches by forking off multiple states.

CHAPTER 4. OFF-THE-SHELF SYMBOLIC FLOATING-POINT 88
31Sign Exponent Mantissa1 bit 8 bits 23 bits 0
Single Precision
63Sign Exponent Mantissa1 bit 11 bits 52 bits 0
Double Precision
Figure 4.1: IEEE-754 format for single and double precision floating-point data
These states partition floating-point values by disjunction but together represent the
set of all feasible floating-point values. Additional states are costly but soft floating-
point remains attractive because the complicated floating-point component is off-the-
shelf software which requires little support code and no changes to the core symbolic
execution system. Aside from its simplicity, soft floating-point is self-testing in that
tests can be efficiently derived directly from the libraries using symbolic executor, a
property explored in Section 4.4 and applied to floating-point solvers in Section 4.5.
4.3 Soft Floating-Point
This section details the implementation of a soft floating-point extension for an
integer-only symbolic binary executor. First, an abstract soft floating-point library
is defined by its set of floating-point operations. Next, the components for the base
binary symbolic executor are briefly outlined. Finally, a description of a runtime in-
terface and implementation establishes the connection between the symbolic executor
and several soft floating-point libraries.
4.3.1 Floating-Point Operations
A soft floating-point library is a collection of idempotent integer-only operation func-
tions which model an IEEE-754-1985 [71] compliant floating-point unit. The client
code bitcasts floating-point data (single or double precision) into integer operands;
the library unpacks the sign, mantissa, and exponent components (Figure 4.1) with
bitwise operators into distinct integers. Operations evaluate the components, then
pack and return floating-point results in IEEE-754 format.
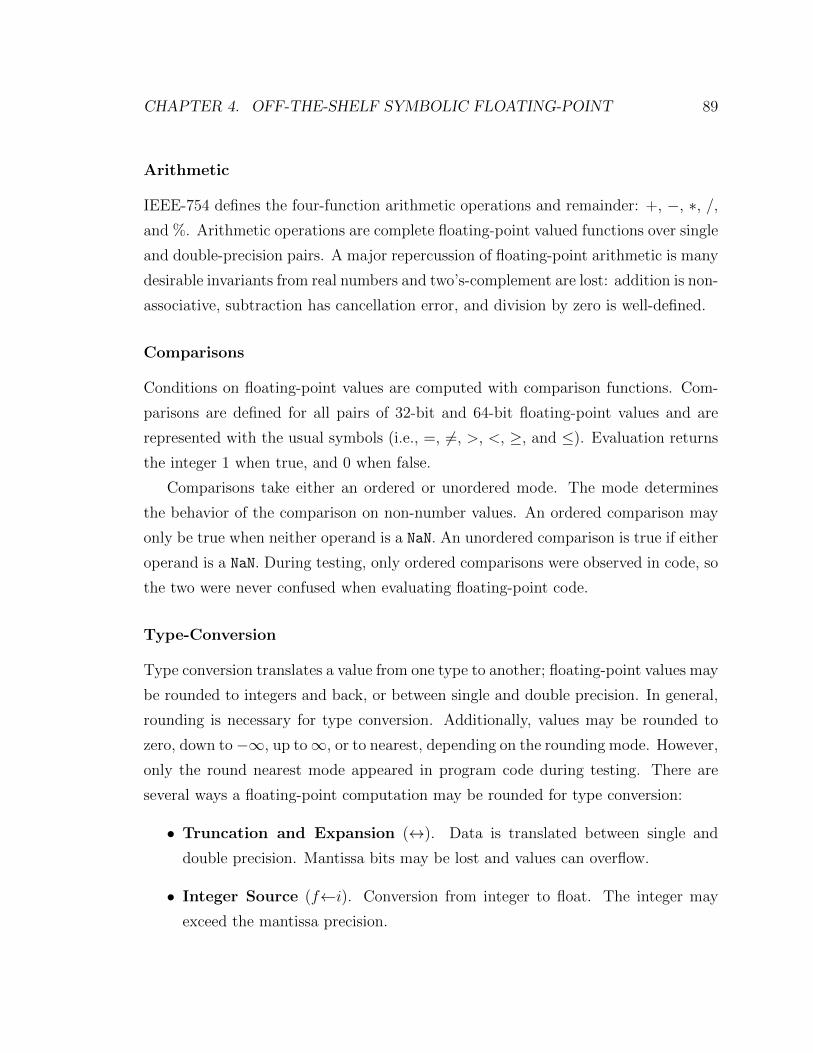
CHAPTER 4. OFF-THE-SHELF SYMBOLIC FLOATING-POINT 89
Arithmetic
IEEE-754 defines the four-function arithmetic operations and remainder: +, −, ∗, /,and %. Arithmetic operations are complete floating-point valued functions over single
and double-precision pairs. A major repercussion of floating-point arithmetic is many
desirable invariants from real numbers and two’s-complement are lost: addition is non-
associative, subtraction has cancellation error, and division by zero is well-defined.
Comparisons
Conditions on floating-point values are computed with comparison functions. Com-
parisons are defined for all pairs of 32-bit and 64-bit floating-point values and are
represented with the usual symbols (i.e., =, 6=, >, <, ≥, and ≤). Evaluation returns
the integer 1 when true, and 0 when false.
Comparisons take either an ordered or unordered mode. The mode determines
the behavior of the comparison on non-number values. An ordered comparison may
only be true when neither operand is a NaN. An unordered comparison is true if either
operand is a NaN. During testing, only ordered comparisons were observed in code, so
the two were never confused when evaluating floating-point code.
Type-Conversion
Type conversion translates a value from one type to another; floating-point values may
be rounded to integers and back, or between single and double precision. In general,
rounding is necessary for type conversion. Additionally, values may be rounded to
zero, down to−∞, up to∞, or to nearest, depending on the rounding mode. However,
only the round nearest mode appeared in program code during testing. There are
several ways a floating-point computation may be rounded for type conversion:
• Truncation and Expansion (↔). Data is translated between single and
double precision. Mantissa bits may be lost and values can overflow.
• Integer Source (f←i). Conversion from integer to float. The integer may
exceed the mantissa precision.

CHAPTER 4. OFF-THE-SHELF SYMBOLIC FLOATING-POINT 90
• Integer Target (f→i). Conversion from float to integer; NaN and ∞ values
may be converted.
Elementary Functions
The only elementary function required by IEEE-754-1985 is the square root function.
Hence, all soft floating-point libraries support it. Transcendental functions, on the
other hand, were deemed too costly to due to the precision necessary for correctness
to the half-unit in the last place (the table-maker’s dilemma [73]); few soft floating-
point libraries support these functions because they are not part of the standard.
Although present in some instruction sets (e.g., x86), transcendental functions are
treated as unsupported non-standard extensions; these extensions can be implemented
as intermediate code intrinsics (§ 2.4.5) using standard floating-point operations if
necessary for instruction emulation.
4.3.2 Runtime Libraries
The soft floating-point extended symbolic interpreter handles floating-point opera-
tions by calling out to a runtime library with a standard interface. All floating-point
instructions are replaced with runtime function calls that manipulate floating-point
data with integer instructions; the target program is essentially dynamically linked
to the floating point library by way of its floating-point instructions. Internally,
the runtime libraries differ on a fundamental level by the data encoding used for
computation. Floating-point emulation code is readily available and easily portable;
open-source operating systems supply many distinct library implementations which
need few modifications to work with the symbolic executor.
A soft floating-point library, loaded as part of the klee LLVM bitcode runtime,
encodes data operations in integer terms with an idempotent function call interface.
If the library is correct and completely specified, then every floating-point operation
is fully modeled; there is no need to re-encode the details. If the library is wrong or
incomplete, it can be detected by testing for faulty inputs and cross-testing with other
implementations (§ 4.4). To map floating-point code to the integer-only interpreter,
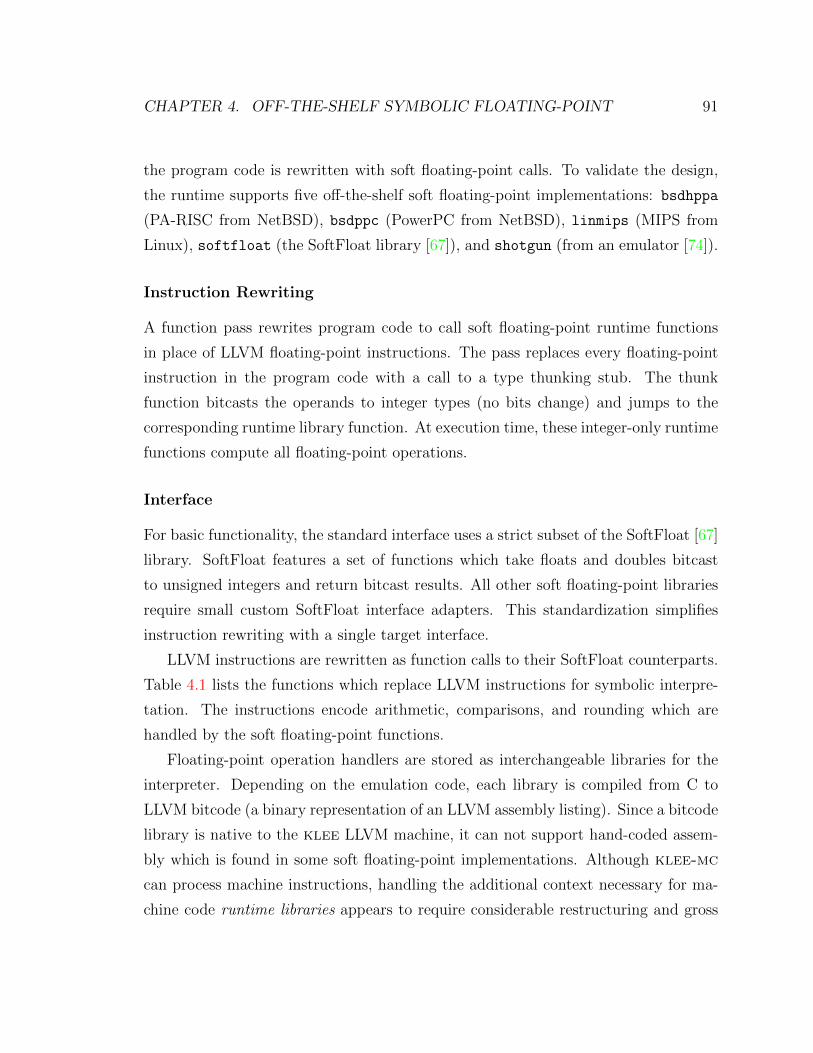
CHAPTER 4. OFF-THE-SHELF SYMBOLIC FLOATING-POINT 91
the program code is rewritten with soft floating-point calls. To validate the design,
the runtime supports five off-the-shelf soft floating-point implementations: bsdhppa
(PA-RISC from NetBSD), bsdppc (PowerPC from NetBSD), linmips (MIPS from
Linux), softfloat (the SoftFloat library [67]), and shotgun (from an emulator [74]).
Instruction Rewriting
A function pass rewrites program code to call soft floating-point runtime functions
in place of LLVM floating-point instructions. The pass replaces every floating-point
instruction in the program code with a call to a type thunking stub. The thunk
function bitcasts the operands to integer types (no bits change) and jumps to the
corresponding runtime library function. At execution time, these integer-only runtime
functions compute all floating-point operations.
Interface
For basic functionality, the standard interface uses a strict subset of the SoftFloat [67]
library. SoftFloat features a set of functions which take floats and doubles bitcast
to unsigned integers and return bitcast results. All other soft floating-point libraries
require small custom SoftFloat interface adapters. This standardization simplifies
instruction rewriting with a single target interface.
LLVM instructions are rewritten as function calls to their SoftFloat counterparts.
Table 4.1 lists the functions which replace LLVM instructions for symbolic interpre-
tation. The instructions encode arithmetic, comparisons, and rounding which are
handled by the soft floating-point functions.
Floating-point operation handlers are stored as interchangeable libraries for the
interpreter. Depending on the emulation code, each library is compiled from C to
LLVM bitcode (a binary representation of an LLVM assembly listing). Since a bitcode
library is native to the klee LLVM machine, it can not support hand-coded assem-
bly which is found in some soft floating-point implementations. Although klee-mc
can process machine instructions, handling the additional context necessary for ma-
chine code runtime libraries appears to require considerable restructuring and gross

CHAPTER 4. OFF-THE-SHELF SYMBOLIC FLOATING-POINT 92
LLVM Instruction SoftFloat FunctionFAdd, FSub float{32,64} {add,sub}FMul, FDiv, FRem float{32,64} {mul,div,rem}FCmp float{32,64} {lt,le,eq}FPExt float32 float64FPTrunc float64 float32FPToSI float{32,64} int{32,64}SIToFP int{32,64} float{64,32}sqrtf, sqrt float{32,64} sqrt
Table 4.1: Rewritten LLVM instructions with corresponding SoftFloat functions
overengineering of both the JIT and symbolic executor basic block dispatch code.
Software Encodings
Floating-point unpacking policies are either selective or unselective. SoftFloat selec-
tively masks components out as needed to local variables. Both bsdhppa and bsdppc,
on the other hand, completely unpack floating-point values into a data structure be-
fore every operation and repack the result into the IEEE-754 format. The best repre-
sentation depends on the circumstance. SoftFloat has a single compilation unit; the
representation likely benefits from interprocedural analysis. BSD has multiple compi-
lation units; mask calculations like SoftFloat’s would repeat at function boundaries.
Operating System Handlers as Libraries
The runtime uses off-the-shelf operating system code ported from one Linux and two
BSD floating-point emulators. The soft floating-point implementations in operating
systems are often quite good and at least heavily tested. This is because on sev-
eral machine architectures (e.g., x86, ARM, MIPS), an operating system may be
expected to emulate a hardware floating-point unit through software. Correctness
and reproducibility demand that the software emulation closely matches hardware,
hence operating systems should have accurate soft floating-point implementations.
In many cases, soft floating-point code can be compiled into LLVM bitcode for the
runtime bitcode library. The floating-point emulation layer is intended to run on the

CHAPTER 4. OFF-THE-SHELF SYMBOLIC FLOATING-POINT 93
target operating system architecture and is usually written in C. After adjusting a few
header files, the code can be compiled independently into a bitcode library. Handlers
accelerated with assembly code (e.g., x86 Linux, ARM BSD), however, must compile
to native machine code.
The soft floating-point library must extract the relevant functionality from the
rest of the operating system code. In contrast to the symbolic executor’s instruction
rewriting pass, an operating system’s native emulation mechanism traps and emulates
missing floating-point instructions. Whenever a user program issues a floating-point
instruction, control is trapped and vectored to the operating system. The trapped
instruction is decoded into a soft floating-point computation; the computation uses
only integer instructions and stores the result to the machine state. Finally, control
returns to the next program instruction. Since the symbolic executor rewrites floating-
point instructions instead of trapping, the executor bypasses the decoding logic and
directly calls the floating-point operations.
Library-specific SoftFloat glue code translates internal floating-point calls to the
standardized SoftFloat interface. The internal functions never trap or decode in-
structions, so those stages are ignored and inaccessible. Porting requires relatively
few lines of code; glue code for linmips, bsdhppa, and bsdppc is between 50 and 150
lines of C source.
4.4 Operation Integrity
Once a floating-point library is in place, it is possible to test the library. Test cases
are gathered by symbolically executing a binary program with a given soft floating-
point library for each floating-point operation. Cross-checking intermediate path data
with the JIT over the host’s hardware floating-point unit detects interpreter and soft
floating-point inconsistencies. Pooling tests by operation across all libraries addresses
the problem of single library underspecification; tests for a single library may cover all
paths with correct results but still have inputs that do not match hardware. The JIT,
with soft floating-point libraries and without, is checked against hardware execution
of the binary on the pool of all test cases. Every library disagrees with hardware; some

CHAPTER 4. OFF-THE-SHELF SYMBOLIC FLOATING-POINT 94
patterns emerge as common pitfalls. Finally, significant library coverage confirms the
thoroughness of testing.
When comparing soft floating-point libraries with hardware, it is useful to dis-
tinguish between consistency and verification. If tests derived from a library L all
match hardware, then L is consistent with hardware under a symbolic executor: for
every library path there is a test case which matches hardware. When L is consistent
on an operation ◦ it is ◦-consistent. Verification against hardware is stronger than
consistency: all possible inputs for L must match hardware. Consistency without
verification arises when an underspecified program misses edge cases which describe
inconsistent test cases. Consequentially, tests from a library L∗ may induce a mis-
match on a consistent but underspecified library L.
The soft floating-point code is tested in two phases. In the first phase, opera-
tion programs are symbolically executed to produce test cases for each library. To
determine consistency, the symbolic executor is cross-checked with the LLVM JIT’s
machine code through a log replay mechanism that compares intermediate concrete
values (§ 3.3.3). If the emulation is wrong, symbolic interpretation diverges from the
JIT values, potentially causing false positives and negatives with respect to native
execution. In the second phase, to handle underspecification, operations are cross-
tested on a test case pool and checked against an Intel Core2 processor. Further, the
pool tests the JIT, which compiles floating-point LLVM instructions to machine code,
and raises several translation errors.
Figure 4.2 illustrates the process of cross-checking floating-point symbolic inter-
pretation with a JIT and native hardware. To generate test cases, an x86-64 pro-
gram binary is symbolically executed with klee-mc and a soft floating-point bitcode
library. The test’s register log (§ 3.3.1) then replay cross-checks the library results
against the LLVM JIT engine executing native floating-point instructions (Interpreter
× JIT). Test case values are inputs for hardware cross-checking (JIT × Hardware);
the soft floating-point JIT is cross-checked, basic code block by basic block, against
the registers from native execution of the binary program.

CHAPTER 4. OFF-THE-SHELF SYMBOLIC FLOATING-POINT 95
Figure 4.2: Generating program tests and cross-checking soft floating-point
4.4.1 Gathering Test Cases
Each floating-point operation is modeled through a distinct test program binary.
These test programs, which we call operation programs, are compiled from small C
source files into x86-64 Linux programs which read IEEE-754 formatted operands
from the standard input. Only binary programs are evaluated, rather than C source
or LLVM bitcode, to keep any compilation artifacts [97] the same among the symbolic
executor, JIT, and hardware. Likewise, the operation programs test the machine code
interface of the symbolic executor with compiled C, so some functionality is masked or
inaccessible. This masking is particularly noticeable for the remainder (%) program
which must use the math library fmod function because the C language only defines
integer modulus operations.
The operation program reads operands from a symbolic standard input stream
under symbolic execution. When the symbolic executor completes a path, it creates
a test case by selecting a feasible input bit-string which satisfies the path constraints
imposed by the soft floating-point runtime library. Feeding the bit-string into the
operand program reproduces the floating-point library path.
Table 4.2 lists the number of test cases produced by the symbolic executor for each
floating-point library. Test programs are split by precision: 32-bit single-precision
(f32) and 64-bit double-precision (f64). The number of test cases for a completed

CHAPTER 4. OFF-THE-SHELF SYMBOLIC FLOATING-POINT 96
Op. bsdhppa bsdppc linmips softfloat softgunf32 f64 f32 f64 f32 f64 f32 f64 f32 f64
+ 122 1017 1670† 2016† 3741 6523† 99 99 458 868- 122 1017 1615† 1717† 3738 6480† 99 99 458 868* 3700‡ 520†‡ 368†‡ 349†‡ 1945‡ 2235†‡ 51 51 388‡ 582†‡
/ 6109† 6268† 2932† 3520† 4694† 5268† 132‡ 81†‡ 6373† 6639†
% 3247† 3359† 2 3680† 3156† 3397† 2900† 3010† 3057† 3394†
< 28 32 1341† 1661† 91 91 7 7 11 13≤ 34 38 2034† 2353† 91 91 7 7 11 13= 2890 42 1359† 1140† 2905 91 125 14 1061 186= 2890 42 1402† 1413† 2905 91 125 14 1061 18↔ 29 31 29 91 29 22 8 14 28 27→i32 81 67 68 69 65 20 17 12 64 15→i64 142 142 171†‡ 145†‡ 97 82 39 34 201 211←i32 14 6 75 34 51 35 5 4 72 34←i64 118 46 1466† 491 191 89 14 8 477 119√x 3451† 2979† 2583† 4500† 4856† 3819† 32‡ 25‡ 92‡ 1355†‡
Total 20087 15606 17115 23179 28555 28334 3660 3476 13812 14174
Table 4.2: Floating-point operation test cases from symbolic execution.
operation is a strict upper bound on the number of states that will fork on a floating-
point instruction in a symbolically executed program. Operations marked † and
‡ timed out exploring paths and solving queries respectively. Implementation differ-
ences lead to unique test case counts for each operation across libraries; some libraries
fork more (bsdppc) than others (softfloat).
The test case counts wildly vary across libraries but some implementation details
may be surmised from the data. Several patterns from the generated test cases qual-
itatively stand out. Operations are sometimes insensitive to precision; softfloat’s
addition operation and the linmips less-than operation show the same total tests for
both single-precision and double-precision. These equal test counts suggest the oper-
ations use essentially the same code for both precisions, only changing the bit-width.
Libraries which have different test case counts could have additional, but unnecessary
paths, for each precision. Likewise, equal tests across operations suggest very similar
code; the = and 6= operations may perform the same computation, then negate the

CHAPTER 4. OFF-THE-SHELF SYMBOLIC FLOATING-POINT 97
solution if necessary. Single-precision surprisingly can have more paths than double-
precision, such as for = and →i32, which may be due to compilation artifacts or
optimizations inserted by the compiler.
A complete symbolic execution of an operation test program exhausts all paths.
Every feasible path becomes a test input (e.g., pairs of floating-point values for binary
operations) which satisfies the path constraints. Path exhaustion can be costly, how-
ever, so each program runs for a maximum time of one hour with a two minute solver
timeout in order to enforce a reasonable limit on total execution time; most opera-
tions ran to completion. Relatively complicated operations, such as division, timed
out across all libraries. The symbolic executor is sensitive to the branch organization
of the library code so some simpler operations (e.g., + for bsdppc and linmips) time
out from excessive state forking.
4.4.2 Cross-Checking for Consistency: Interpreter × JIT
Symbolically executing an operation ◦ produces a set of test inputs which exercise
distinct paths through the floating-point emulation library. Ideally, the symbolic
interpreter exhausts all paths on ◦, leading to a test case for every possible path on
◦. The test cases are replayed concretely on the LLVM JIT and cross-checked with
the symbolic interpreter’s concrete values to find bugs in the symbolic interpeter.
Testing with cross-checking determines consistency; when all of ◦’s test cases for a
library cross-check as matching, the library is ◦-consistent.
The symbolic interpreter is a custom LLVM interpreter which may diverge from
bitcode semantics. To find divergences, the interpreter’s soft floating-point library
results (in emulated hardware registers) are checked against natively executed LLVM
JIT machine code for bit-equivalence at every dispatched basic block. These checks
replay a test case on the JIT and cross-check with the interpreter’s concrete register
log.
The number of failures for symbolically generated test cases is given in Table 4.3.
There are three reasons for failure to cross-check: 1) the path terminated early (log
runs out), 2) the floating-point library is wrong, or 3) the LLVM JIT engine emits
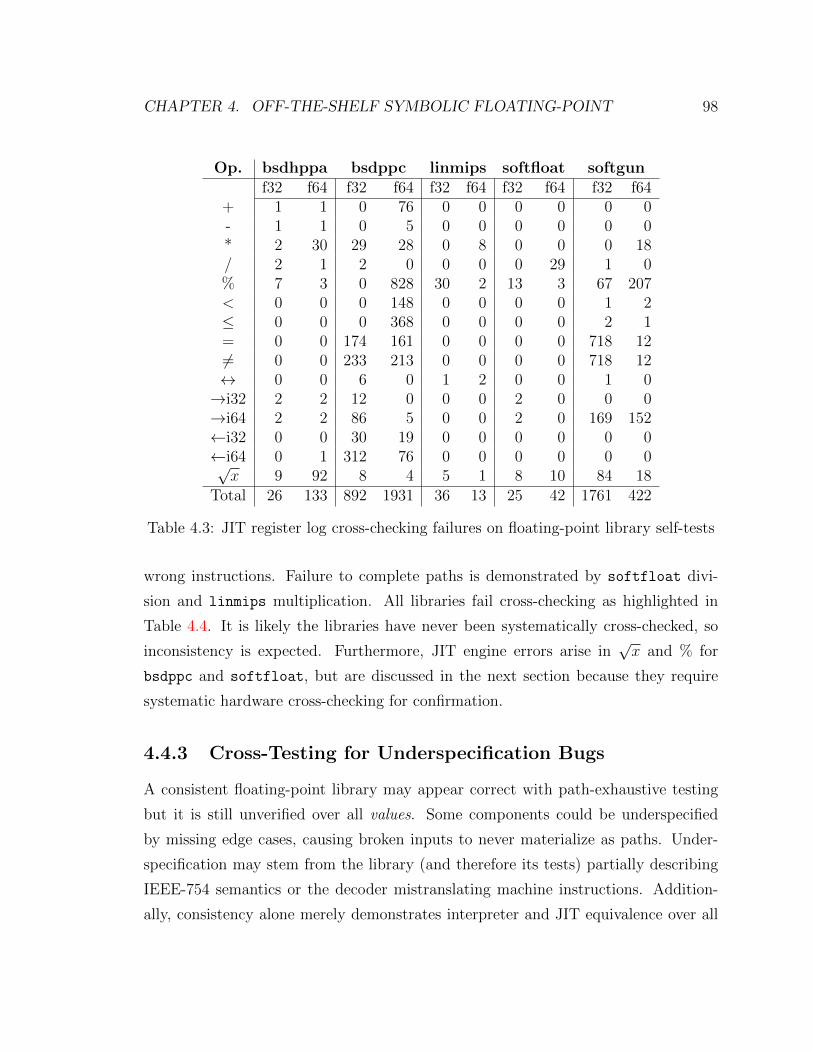
CHAPTER 4. OFF-THE-SHELF SYMBOLIC FLOATING-POINT 98
Op. bsdhppa bsdppc linmips softfloat softgunf32 f64 f32 f64 f32 f64 f32 f64 f32 f64
+ 1 1 0 76 0 0 0 0 0 0- 1 1 0 5 0 0 0 0 0 0* 2 30 29 28 0 8 0 0 0 18/ 2 1 2 0 0 0 0 29 1 0% 7 3 0 828 30 2 13 3 67 207< 0 0 0 148 0 0 0 0 1 2≤ 0 0 0 368 0 0 0 0 2 1= 0 0 174 161 0 0 0 0 718 126= 0 0 233 213 0 0 0 0 718 12↔ 0 0 6 0 1 2 0 0 1 0→i32 2 2 12 0 0 0 2 0 0 0→i64 2 2 86 5 0 0 2 0 169 152←i32 0 0 30 19 0 0 0 0 0 0←i64 0 1 312 76 0 0 0 0 0 0√x 9 92 8 4 5 1 8 10 84 18
Total 26 133 892 1931 36 13 25 42 1761 422
Table 4.3: JIT register log cross-checking failures on floating-point library self-tests
wrong instructions. Failure to complete paths is demonstrated by softfloat divi-
sion and linmips multiplication. All libraries fail cross-checking as highlighted in
Table 4.4. It is likely the libraries have never been systematically cross-checked, so
inconsistency is expected. Furthermore, JIT engine errors arise in√x and % for
bsdppc and softfloat, but are discussed in the next section because they require
systematic hardware cross-checking for confirmation.
4.4.3 Cross-Testing for Underspecification Bugs
A consistent floating-point library may appear correct with path-exhaustive testing
but it is still unverified over all values. Some components could be underspecified
by missing edge cases, causing broken inputs to never materialize as paths. Under-
specification may stem from the library (and therefore its tests) partially describing
IEEE-754 semantics or the decoder mistranslating machine instructions. Addition-
ally, consistency alone merely demonstrates interpreter and JIT equivalence over all

CHAPTER 4. OFF-THE-SHELF SYMBOLIC FLOATING-POINT 99
Library Operation Library Soft FP Hardware FPbsdhppa ∞∗ 0.0 NaN -NaN
bsdppc 1.1125...6e-308 + 1.1125...7e-308 5e-324 2.2250...1e-308linmips 0x7ff0000001000000 (NaN) →f32 0x7fbfffff (NaN) 0x7fc00000 (NaN)softfloat NaN →i32 0x7fffffff 0x80000000
softgun 0.0 / 0.0 0.0 -NaN
Table 4.4: Selected library bugs from soft floating-point library consistency tests
discovered paths; both can still possibly disagree with hardware. Pooling all tests for
all discovered library paths and testing concrete JIT replay against native processes,
on the other hand, finds bugs from underspecification and mistranslation.
Pooled Tests
Cross-checking detects only mismatches on known inputs; the symbolic executor must
provide the input test cases. If a floating-point library is underspecified, then sym-
bolic execution may not generate a test case for a hardware mismatch because no
code necessarily describes the value. An underspecified library is incorrect despite
being consistent. In fact, many operations cross-check as consistent; softfloat and
linmips seem to perfectly convert floating-point to and from integers because the
libraries are {→i32,→i64, ←i32, ←i64}-consistent. However, these consistent oper-
ations are not correct but underspecified; no path describes a bug under all feasible
solutions, despite bugs being present when compared with hardware.
The underspecification problem can be partially mitigated by cross-testing across
libraries. All tests are pooled and hardware cross-checked on all floating-point li-
braries. The test pool is applied to each library to cover values or conditions missed
by underspecification.
Figure 4.3 illustrates the distinct value coverage for each library. The bsdppc
library stands out as flooding comparison operations with unique values, agreeing
with high fork rate in Table 4.2. Similarly, the linmips and bsdhppa libraries dom-
inate the unique values for arithmetic operations. Heavy skewing essentially reflects
implementation quirks. More single-precision values are shared among libraries than
double-precision, possibly because there are fewer possible values for single-precision,

CHAPTER 4. OFF-THE-SHELF SYMBOLIC FLOATING-POINT 100
0102030405060708090
100
+ - * / % <<= = !=<->
>i32 >i64
<i32 <i64
x1/2
% T
ota
l Test C
ases
Single-Precision Operation
Single-Precision Test Cases By FPU
0102030405060708090
100
+ - * / % <<= = != >i32 >i64
<i32 <i64
x1/2
% T
ota
l Test C
ases
Double-Precision Operation
Double-Precision Test Cases By FPU
<->
linmipssoftfloat
softgun bsdppcbsdhppashared
Figure 4.3: Floating-point test case distribution
although there are more single-precision tests (54425) than double-precision (49164).
The unevenness of unique values among libraries and across operations suggests that
no one library produces a complete test suite of values.
There are two ways to account for the uneven test case distribution among the
libraries. One, even if distinct libraries compute the same result, the values for
test cases can differ due to how each implementation structures its code; different
decision trees lead to different partitions of values. Two, given incorrect emulation
of floating-point, the test case values from incorrect code may cover a divergence
between library and hardware floating-point algorithms. Ideally, the test cases would
uncover no divergences because no library would be underspecified.
In total, there were 103624 distinct test cases. The test count is 34 orders of
magnitude smaller than brute force testing ((6(232 +264)+9(264 +2128)) tests) because
there are fewer unique paths than unique inputs. However, so many tests may be
still relatively inefficient; one hand-designed suite [80] for exp(x) uses 2554 tests.
When test count is a concern (e.g., tests are expensive), non-exhaustive execution
can give useful results. We found randomly dropping forked states on hot branches
still covered incorrect values for all libraries with 19560 distinct tests.

CHAPTER 4. OFF-THE-SHELF SYMBOLIC FLOATING-POINT 101
Op. bsdhppa bsdppc linmips softfloat softgun JITf32 f64 f32 f64 f32 f64 f32 f64 f32 f64 f32 f64
+ 603 135 7 8034 45 90 6 12 80 92 0 0- 623 109 47 5354 45 63 6 9 62 81 0 0* 50 53 8 1295 21 23 8 7 23 28 0 0/ 56 52 2 831 32 28 2 4 37 41 0 0% 176 123 134 13 176 58 9 7 4263 4638 35 3< 0 0 0 270 0 0 0 0 52 402 0 0≤ 0 0 0 405 0 0 0 0 72 609 0 0= 0 0 650 7 0 0 0 0 4665 125 0 06= 0 0 669 6 0 0 0 0 4736 204 0 0↔ 5 84 49 19 4 7 0 0 2 4 0 0→i32 40 32 86 38 25 26 40 31 25 26 0 0→i64 153 76 304 121 24 27 47 36 257 264 0 0←i32 147 75 147 75 0 0 0 0 0 0 0 0←i64 1668 650 1671 651 55 0 55 0 55 0 55 0√x 36 6 39 18 36 0 0 0 36 6 36 6
Total 3557 1395 3813 17137 463 322 173 106 14365 6520 126 9
Table 4.5: Hardware cross-check errors from all distinct floating-point tests
Checking JIT × Hardware
Table 4.5 shows cross-checking errors found from cross-testing with a pool of foreign
test cases. The JIT is cross-tested with a ptraced native shadow process; for every
dispatched decoded instruction block, ptrace hardware registers are checked against
the JIT’s emulated registers. A single bit difference is an error for a test case. Con-
sistent operations, such as softfloat’s −, are found to be incorrect, because they do
not match hardware, and underspecified, because only tests from other floating-point
libraries reveal the defect. Some operations under some libraries show fewer errors
for one precision than the other (or none at all); this discrepancy likely owes to these
libraries having fundamentally different implementations for each precision and the
uneven distribution of test values.
Applying the tests to the JIT engine, which is never symbolically executed, and
comparing the registers with hardware execution revealed bugs on interesting edge
cases. For instance,√x on a negative single-precision value returns NaN in the JIT,

CHAPTER 4. OFF-THE-SHELF SYMBOLIC FLOATING-POINT 102
x86-64 Assembly Vex IR
cvtsi2ss %rbx , %xmm2 # i64 −> f 32movd %xmm2, %rcx # get f32
t1 = 64to32 (And64(GET: I64 ( 216 ) ,0x3 : I64 ) ) #roundingt2 = GET: I64 ( 40 ) # get rbxPUT( 288 ) = F64toF32( t1 , I64StoF64 ( t 1 , t 2 ) ) #i64−>f 32PUT( 24 ) = GET: I64 ( 288 ) # f32 −> rcx
Figure 4.4: Mistranslation of the cvtsi2ss instruction in the VexIR
but -NaN for hardware and softfloat. Errors in the JIT from translating machine
code (a known problem for machine code interpreters on integer workloads [60, 92]) to
LLVM bitcode appear across all libraries (e.g., f32←i64). Mismatches which appear
solely for the JIT could be due to instruction selection.
For an in-depth example, Figure 4.4 reproduces the code involved for a f32←i64
conversion error. The operation program begins as x86-64 machine code which is
translated by the VEX decoder into VEX IR, then from VEX IR into LLVM bitcode;
if VEX mistranslates the machine code, the symbolic interpretation will be wrong. In
the case of f32←i64, the x86-64 instruction cvtsi2ss converts a 64-bit signed integer
to a single precision floating-point number. The corresponding VEX IR converts the
signed integer into a double precision number, then to single precision. This induces
rounding errors (confirmed by the VEX maintainer) that cause certain inputs (e.g.,
rbx = 72057598332895233) to evaluate one way natively (7.20576e+16) and another
way through VEX (7.2057594e+16).
4.4.4 Common Pitfalls
Some effort was put into improving the library code’s cross-checking results before
finalizing the data. The softfloat and linmips libraries were intended to be con-
sistent whereas the consistency of bsdhppa and bsdppc was a lower priority. Most
improvements concentrated on a few frequent problems.
Endianness. Architecture byte-order can conflict with the hardware byte-order.
The PA-RISC (bsdhppa), PowerPC (bsdppc), and MIPS (linmips) architectures
are big-endian but the host x86-64 machine is little-endian. MIPS is dual-endian so
linmips has a #define to enable little-endian mode. For bsdhppa, the glue code must
swap double-precision operands and results. bsdppc, evolved from SPARC and m68k

CHAPTER 4. OFF-THE-SHELF SYMBOLIC FLOATING-POINT 103
code bases, is staunchly big-endian. For instance, a 32-bit function for converting
double precision values expects the most significant half of a 64-bit value as its 32-bit
return result, a big-endian convention.
Default NaN. Certain operations, such as division by zero, produce a default
“quiet” NaN. Unfortunately, hardware is free to deterministically choose a QNaN from
223 bit-patterns. Both single and double precision QNaNs differed from the host ma-
chine for every library. The single-precision QNaN was 0x7fffffff, as opposed to
x86-64 hardware which uses 0xffc00000. Manual inspection of the Linux x87 emu-
lator confirmed the values on x86-64 matched the expected QNaN.
NaN operands. The x86-64 floating-point unit encodes extra diagnostic informa-
tion into the mantissa of its NaNs which disagrees with emulation. There are numerous
ways to mishandle a NaN operation so the bits do not match. For operations between
NaNs, a signaling NaN would sometimes be converted into the wrong QNaN. Arithmetic
between a NaN and number would use the default NaN, missing the mantissa bits.
Likewise, operands returning the left-hand NaN in hardware instead used the library
default NaN. Although this extra information is optional, it is still desirable to stay
bit-identical to the host hardware.
4.4.5 Coverage
Operation test cases raise plenty of mismatches but the depth of testing remains
unclear. Code coverage for each library is a simple metric for overall testing quality;
high coverage implies thorough testing. Figure 4.5 shows the coverage of each floating-
point implementation from symbolic execution. The instruction coverage percentages
are calculated from visited functions. The set of instructions is limited to visited
functions because soft floating-point libraries often have additional features which
are inaccessible through the interpreter (e.g., trapped instruction decoding). Total
covered instructions gauges the complexity, although not necessarily the correctness,
of the library implementation.
Between 79%–95% of instructions were covered by test cases for each library,
which leaves 5%–21% of instructions uncovered. There are several justifiable reasons

CHAPTER 4. OFF-THE-SHELF SYMBOLIC FLOATING-POINT 104
0
20
40
60
80
100
bsdhppabsdppc
linmipssoftfloat
softgun 2000
2500
3000
3500
4000
4500
5000
5500%
Covera
ge
Covere
d Instr
uctions
Coverage of Visited Functions
Coverage % Instructions
Figure 4.5: Soft floating-point library code coverage and total covered instructions
for missing instructions. All libraries support all rounding modes but only round-
nearest is tested because it is the default mode. Compiler optimizations mask paths;
when converting x to floating-point, one optimization tests if x is 0 using an integer
comparison to avoid the floating-point instruction, leaving the 0 library path unex-
plored. Finally, compiled-in assertions, such as checking for bad type tags, often
remain uncovered because the code never contradicts the assertion predicate.
4.5 Floating-Point SMT Solvers
This section evaluates the accuracy of floating-point solvers with respect to floating-
point hardware. A floating-point solver decides the satisfiability of formulas over a
theory of floating-point and therefore must at least encode floating-point semantics
like those found in soft floating-point libraries. Prior work [114] suggests testing
floating-point solvers with randomly generated conformance formulas. Unlike ran-
domized conformance queries, test cases derived from soft floating-point target inter-
esting edge cases defined by the emulation code. Despite the importance of accuracy,

CHAPTER 4. OFF-THE-SHELF SYMBOLIC FLOATING-POINT 105
testing a selection of solvers reveals divergent results in every solver. Furthermore,
each floating-point solver has implementation quirks which impede testing with all
operations and values.
Several freely available contemporary floating-point solvers support a theory of
IEEE-754 floating-point. These solvers include mathsat5-2.8 [64], sonolar-2013-05-
15 [106], and Z3 [49] (current stable and unstable FPA versions from the git reposi-
tory). Such specialized floating-point solvers back the only complete symbolic execu-
tion alternative to soft floating-point. However, these solvers only occasionally con-
form to a standard interface, have complicated internals and, despite formal proofs
of correctness, are clearly wrong when compared to hardware in many cases.
SMTLIB2-FPA [115] (a proposed standard) conformance tests [114] provide a
useful baseline test suite for SMTLIB2-FPA compliant solvers (mathsat and Z3). The
conformance tests cover a range of features in SMTLIB2-FPA. These tests exercise the
front-end and floating-point theory for a floating-point solver. A solver implements
SMTLIB2-FPA in its front-end by translating floating-point arithmetic (FPA) theory
primitives into an internal floating-point representation. The tests were generated
from the reference implementation with random floating point numbers for a total of
20320 SMTLIB2-FPA queries.
The automatically generated test cases from soft floating-point libraries are novel
in that they work as semantically derived tests for third-party floating-point solvers.
Each test includes an operation and operands (e.g., (+ a b)) and a scalar result r
computed through hardware. Each solver is tested against the hardware result by
checking that the operation feasibly evaluates to r with a bit-vector equality query
as in Figure 4.6. The library tests are based on the smaller fork-inhibited data set
from Section 4.4.3 to reduce testing overhead. These tests are simple satisfiability
tests on concrete expressions; they neither impose symbolic constraints on operands
nor examine counter-examples.
Table 4.6 lists the test results for the floating-point solvers. Even though the
tests are shallow, every solver fails some test (fail), indicating actual bugs, or gives
no answer after five minutes or refusing certain inputs (unknown). Each row only
has a subset of the tests because the front-end and library interfaces lack particular
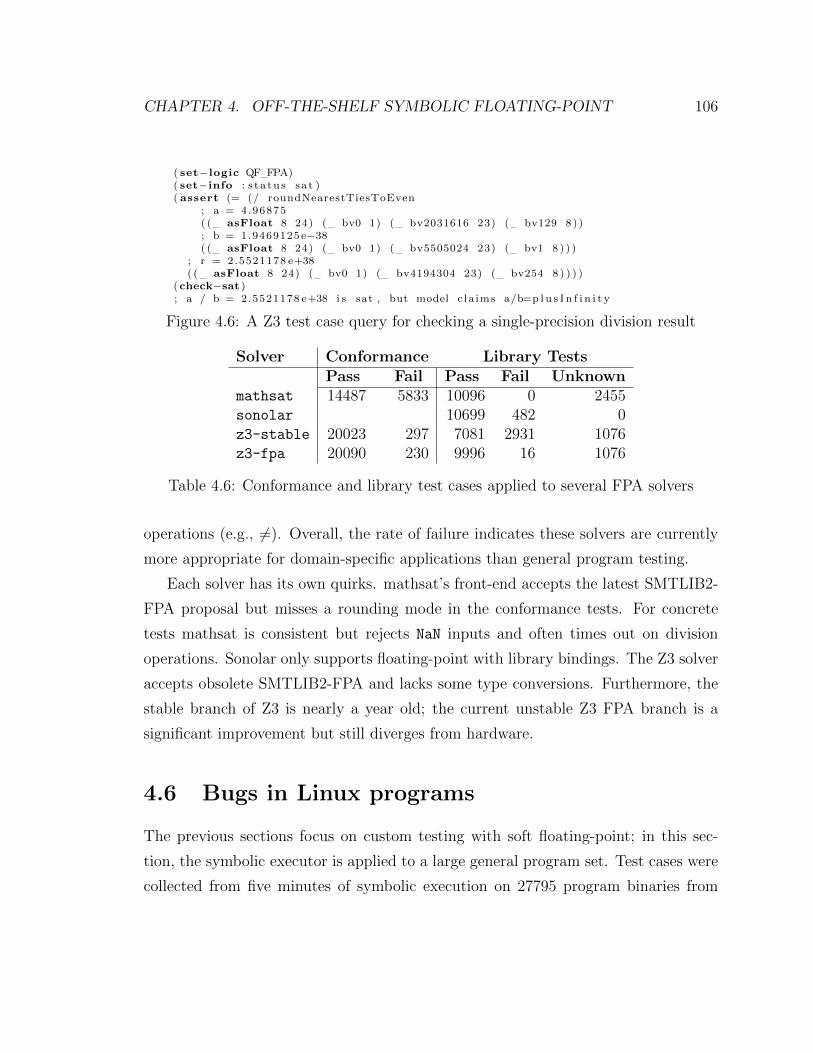
CHAPTER 4. OFF-THE-SHELF SYMBOLIC FLOATING-POINT 106
( set−logic QF FPA)( set−info : s t a t u s sa t )( assert (= (/ roundNearestTiesToEven
; a = 4.96875( ( asFloat 8 24) ( bv0 1) ( bv2031616 23) ( bv129 8) ); b = 1.9469125 e−38( ( asFloat 8 24) ( bv0 1) ( bv5505024 23) ( bv1 8 ) ) )
; r = 2.5521178 e+38( ( asFloat 8 24) ( bv0 1) ( bv4194304 23) ( bv254 8 ) ) ) )
(check−sat ); a / b = 2.5521178 e+38 i s sat , but model c la ims a/b=p l u s I n f i n i t y
Figure 4.6: A Z3 test case query for checking a single-precision division result
Solver Conformance Library TestsPass Fail Pass Fail Unknown
mathsat 14487 5833 10096 0 2455sonolar 10699 482 0z3-stable 20023 297 7081 2931 1076z3-fpa 20090 230 9996 16 1076
Table 4.6: Conformance and library test cases applied to several FPA solvers
operations (e.g., 6=). Overall, the rate of failure indicates these solvers are currently
more appropriate for domain-specific applications than general program testing.
Each solver has its own quirks. mathsat’s front-end accepts the latest SMTLIB2-
FPA proposal but misses a rounding mode in the conformance tests. For concrete
tests mathsat is consistent but rejects NaN inputs and often times out on division
operations. Sonolar only supports floating-point with library bindings. The Z3 solver
accepts obsolete SMTLIB2-FPA and lacks some type conversions. Furthermore, the
stable branch of Z3 is nearly a year old; the current unstable Z3 FPA branch is a
significant improvement but still diverges from hardware.
4.6 Bugs in Linux programs
The previous sections focus on custom testing with soft floating-point; in this sec-
tion, the symbolic executor is applied to a large general program set. Test cases were
collected from five minutes of symbolic execution on 27795 program binaries from
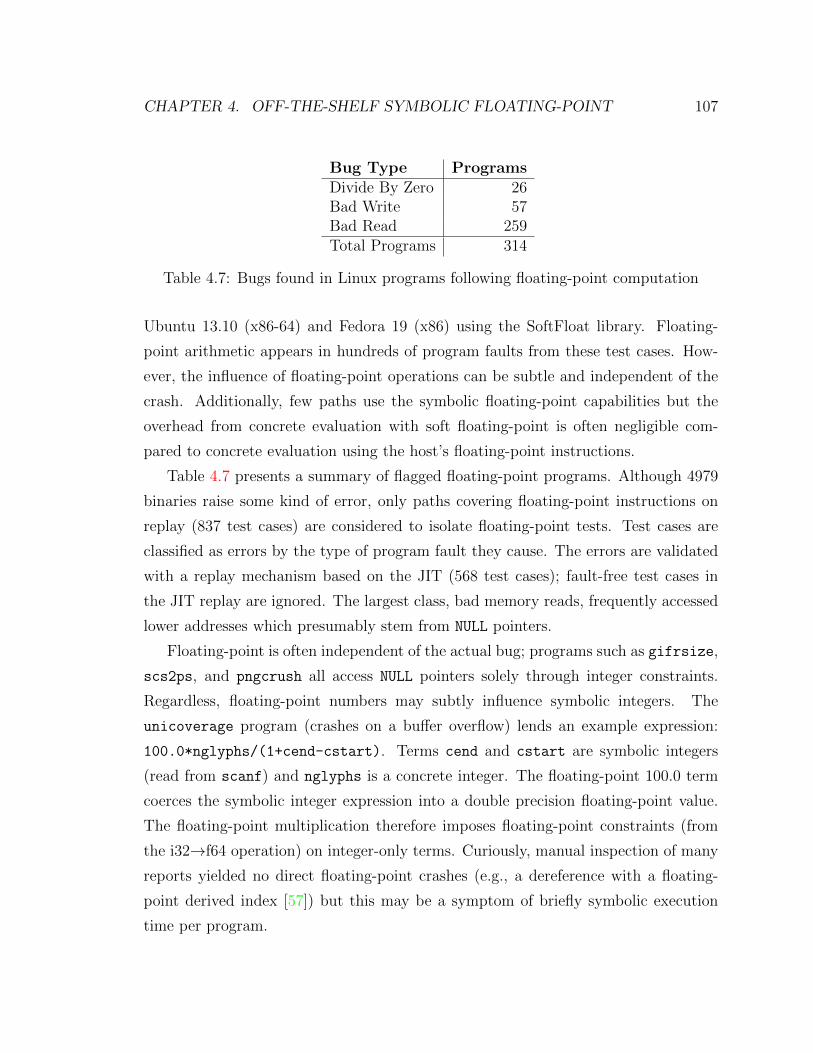
CHAPTER 4. OFF-THE-SHELF SYMBOLIC FLOATING-POINT 107
Bug Type ProgramsDivide By Zero 26Bad Write 57Bad Read 259Total Programs 314
Table 4.7: Bugs found in Linux programs following floating-point computation
Ubuntu 13.10 (x86-64) and Fedora 19 (x86) using the SoftFloat library. Floating-
point arithmetic appears in hundreds of program faults from these test cases. How-
ever, the influence of floating-point operations can be subtle and independent of the
crash. Additionally, few paths use the symbolic floating-point capabilities but the
overhead from concrete evaluation with soft floating-point is often negligible com-
pared to concrete evaluation using the host’s floating-point instructions.
Table 4.7 presents a summary of flagged floating-point programs. Although 4979
binaries raise some kind of error, only paths covering floating-point instructions on
replay (837 test cases) are considered to isolate floating-point tests. Test cases are
classified as errors by the type of program fault they cause. The errors are validated
with a replay mechanism based on the JIT (568 test cases); fault-free test cases in
the JIT replay are ignored. The largest class, bad memory reads, frequently accessed
lower addresses which presumably stem from NULL pointers.
Floating-point is often independent of the actual bug; programs such as gifrsize,
scs2ps, and pngcrush all access NULL pointers solely through integer constraints.
Regardless, floating-point numbers may subtly influence symbolic integers. The
unicoverage program (crashes on a buffer overflow) lends an example expression:
100.0*nglyphs/(1+cend-cstart). Terms cend and cstart are symbolic integers
(read from scanf) and nglyphs is a concrete integer. The floating-point 100.0 term
coerces the symbolic integer expression into a double precision floating-point value.
The floating-point multiplication therefore imposes floating-point constraints (from
the i32→f64 operation) on integer-only terms. Curiously, manual inspection of many
reports yielded no direct floating-point crashes (e.g., a dereference with a floating-
point derived index [57]) but this may be a symptom of briefly symbolic execution
time per program.
CHAPTER 4. OFF-THE-SHELF SYMBOLIC FLOATING-POINT 108
The majority of floating-point test cases rely solely on concrete floating-point data.
Only 94 programs (18%) forked on soft floating-point library code and hence processed
any symbolic floating-point values at all. Programs which process only concrete
floating-point data incur overhead from dispatching extra instructions for floating-
point emulation. The instruction overhead from emulating concrete floating-point
with integer code, compared to the default klee concrete floating-point dispatch,
is negligible. Soft floating-point tests incur 242058 extra instructions on average
(1.04× overhead) with a 135474 instruction standard deviation (1.61× overhead) and
613 instruction median (1.0007× overhead). Floating-point heavy programs skew
the average: a program for processing triangulated meshes, admesh, suffered the
maximum instruction overhead of 6.98×, followed by bristol, an audio synthesizer
emulator, with 2.68× overhead.
4.7 Conclusion
The best software analysis tools must soundly model floating-point. Floating-point
as a runtime library is perhaps the simplest worthwhile way to model high-quality
floating-point semantics in a symbolic binary executor. This quality comes from soft
floating-point being testable within reason through a combination of symbolic execu-
tion and cross-checking against hardware. Integer-only symbolic execution produces
concrete test files with floating-point information which can be directly confirmed
by hardware. If important tests are missed from underspecification, they may be
found by testing with multiple floating-point libraries. Finally, although the library
testing is incomplete in some cases, the results have demonstrated that a symbolic
soft floating-point unit is sufficient for finding many verifiable test cases for bugs in
commodity binary programs.
Chapter 5
Expression Optimization from
Program Paths
5.1 Introduction
Shifting from specialized symbolic interpretation to general binary translation im-
poses a performance challenge. First, compilers target physical machine microarchi-
tectures. Fast code on hardware may be slow to interpret due to expensive constraint
solver queries. Next, resource mismatches from translation incur some overhead. For
instance, register access may map to an intermediate value access plus a read into
memory emulating a register file. Furthermore, type information, control structures,
and other metadata from source code, which is useful for inferring execution traits,
is often unavailable at the binary level. Finally, simple ad-hoc tuning fails to scale to
the variety of programs, compilers, and optimization configurations in the wild.
In practice, solver requests dominate symbolic execution running time. Figure 5.1
illustrates query overhead; of several hundred programs after running five minutes,
80% spend more time solving for satisfiability than dispatching instructions. Hence,
reducing or eliminating queries can be expected to yield gains.
There is ample opportunity to optimize queries. Based on Figure 5.2, the total
number of external calls made to the solver for the same programs from Figure 5.1,
a typical symbolic execution session may submit thousands of queries to the solver.
109

CHAPTER 5. EXPRESSION OPTIMIZATION FROM PROGRAM PATHS 110
0
10
20
30
40
50
60
70
80
90
100
0 200 400 600 800 1000 1200 1400 1600
% Q
ue
ry T
ime
Sorted Program
% Time Spent in Solver
Figure 5.1: Percent time for queries
0
5000
10000
15000
20000
25000
0 200 400 600 800 1000 1200 1400 1600
De
ep
So
lve
r C
alls
Sorted Program
Deep Solver Calls Made By Programs
Figure 5.2: Total external solver calls
These solver calls primarily determine branch satisfiability for symbolic conditionals
(e.g., whether a state should fork) and are inherent to symbolic execution.
The expressions which define queries often have redundancies or unnecessarily
verbose terms suitable for optimizations. As an example, a loop that increments an ex-
pression x every iteration might produce the bulky expression (+ ... (+ (+ x 1) 1) ... 1)
which should fold into a svelte (+ x c). Binary code worsens the problem because
translation artifacts leads to more operations and hence larger expressions.
We present an expression optimizer which learns reduction rules across symbolic
evaluation of large program sets. During the learning phase, expressions produced at
run time are keyed by a hash of samples and stored to a global database. Candidate
rules are constructed by matching the sample hash against the hashes of shorter
expressions in the database. Each candidate rule is verified using the theorem prover,
applied in the interpreter, and saved for future use. Rules are further processed into
generalized rules suitable for matching larger classes of expressions.
We implement and evaluate the expression optimizer in klee-mc. Although this
system uses binary symbolic execution, the optimizer will work for a traditional
source-based symbolic execution system provided such a system scales to support
large and diverse programs sets. The optimizer is evaluated at scale with over two
thousand commodity programs from a stock desktop Linux system. Rules collected
from the programs during a brief learning period are shown to lessen the total num-
ber of queries dispatched during symbolic execution by 18% on average and improve

CHAPTER 5. EXPRESSION OPTIMIZATION FROM PROGRAM PATHS 111
〈expr〉 ::= 〈bit-vec-num〉| (〈unary-op〉 〈expr〉)| (〈binary-op〉 〈expr〉 〈expr〉)| (〈extend-op〉 〈expr〉 〈num〉)| (Select 〈expr〉 〈expr〉 〈expr〉)| (Extract 〈num〉 〈num〉 〈expr〉)| (Read 〈array〉 〈expr〉)| 〈bit-vec-num〉
〈num〉 ::= [0-9]+
〈bit-vec-num〉 :: 〈num〉 w〈num〉
〈array〉 ::= [a-z][a-z0-9]* | (Store 〈array〉 〈expr〉 〈expr〉)
〈unary-op〉 ::= Not | Neg | NotOptimized
〈binary-op〉 ::= 〈arith-op〉 | 〈bit-op〉 | 〈compare-op〉 | Concat
〈arith-op〉 ::= Add | Sub | Mul | UDiv | SDiv | URem | SRem
〈bit-op〉 ::= Shl | LShr | AShr | Or | And | Xor
〈extend-op〉 ::= ZExt | SExt
〈compare-op〉 ::= Eq | Ne | Ult | Ule | Ugt | Uge | Slt | Sle | Sgt | Sge
Figure 5.3: klee Expression Language Grammar
running and solver times by 10% on average.
5.2 Symbolic Execution and Expressions
Recall symbolic expressions are a byproduct of symbolic execution. The symbolic
executor runs a program by marking inputs as symbolic and evaluating the program’s
instructions. This evaluation emits expressions to represent operations on symbolic
data.
The symbolic executor manipulates a mix of concrete values and symbolic expres-
sion data when evaluating LLVM operations. LLVM operations are those defined
by the LLVM IR, such as arithmetic, logical, and memory operations, as well as a
CHAPTER 5. EXPRESSION OPTIMIZATION FROM PROGRAM PATHS 112
handful of specialized LLVM intrinsics. klee maps the results of these operations to
expressions with the grammar in Figure 5.3; this language is isomorphic to a subset
of the SMTLIB [11] language used by the constraint solver. When convenient, oper-
ators will be written in shorthand notation. For instance, the expression to add two
bit-vector expressions a and b is (+ a b).
Large, redundant expressions are expensive. A large expression slows query serial-
ization to the solver and is costly to evaluate into a constant on variable assignment.
Expanded tautologies (e.g., (x ∨ ¬x)), or expressions that evaluate to one value for
all interpretations, pollute solver caches and incur unnecessary calls to the theorem
prover. Worse, a large expression may linger as a path constraint, slowing future
queries that must use the constraint set.
There are common two strategies for shedding expression bloat: expression op-
timization and concretization. Expression optimization applies sound identities to
reduce an expression to fewer terms. For instance, the bit-wise or expression (or 0 x)
is identical to x. The drawback is that vital identities are program-dependent; it is
infeasible to encode all useful reductions by hand. Alternatively, concretizing sym-
bolic terms reduces expressions to constants at the cost of completeness; x becomes
{c} instead of x ⊂ N.
The original klee interpreter uses both expression optimization and concretiza-
tion. A hand-written optimizer folds constants and reduces excess terms from dozens
of common redundancies. For concretization, path constraints are inspected through
implied value concretization (IVC) to find and concretize variables which are constant
for all valid interpretations. For instance, under IVC the constraint (= x 1) replaces
x with 1 in the program state.
We consider the problem of expression node minimization. Given an expression e,
we wish to find a semantically equivalent expression e′ with the fewest possible terms.
Formally, we define expression node minimization as follows: given an expression e
the minimized expression e′ is such that for all tautological expressions (= e ei),
the number of nodes in e′, |e′|, satisfies |e′| ≤ |ei|. It is worth noting e′ is not
unique under this definition. To ensure e′ is unique, first define an ordering operator
on expressions ≤ where ei ≤ ej when there are fewer nodes, |ei| < |ej|, or by lexical

CHAPTER 5. EXPRESSION OPTIMIZATION FROM PROGRAM PATHS 113
comparison, |ei| = |ej| ∧ lex(ei) ≤ lex(ej). Uniqueness is then given by the expression
minimization problem on e when finding e′ where e′ ≤ ei for all ei.
A node minimizing optimizer has several advantages over non-minimizing opti-
mization. Theoretically, it is bounded when greedy; optimization stops once the
expression stops shrinking. If a conditional expression reduces to a constant, a solver
call may be avoided. Contingent conditionals also benefit, such as through better
independence analysis since fewer terms must be analyzed. Furthermore, smaller
expressions improve the likelihood that IVC will discover concretizing implications
because the expressions are simpler. On the other hand, smaller expressions may
lead to slower queries because some operations (e.g., integer division) are slow; how-
ever, we observe performance improvements from our implementation in Section 5.7.
5.3 Rules from Programs
Expression minimization forms a reduction relation, →. Reductions are central to
the theory of contractions, a classic formalization for converting lambda calculus
terms [36]. This theory was further developed in abstract rewriting systems as re-
duction relations under the notion of confluence [70]. We use reduction relations as
a framework for reasoning about properties of the expression rewriting system.
The problem of discovering elements of→ is handled with a database of reduction
rule targets (“reducts”). The database, referred to as the EquivDB, is globally pop-
ulated by expressions made during symbolic execution of binary programs. As the
executor creates expressions, they are matched against the EquivDB with assistance
from a theorem prover to find smaller, but semantically equivalent, expressions. If
equivalent, the expression reduces to the smaller expression and is related under →.
Information about→ is maintained as a set of rewrite rules. Each rule has a from-
pattern and a to-pattern which describe classes of elements in → through expression
templates. Once shown to be sound by the theorem prover, rules are used as the
expression optimization directive format in the symbolic interpreter.
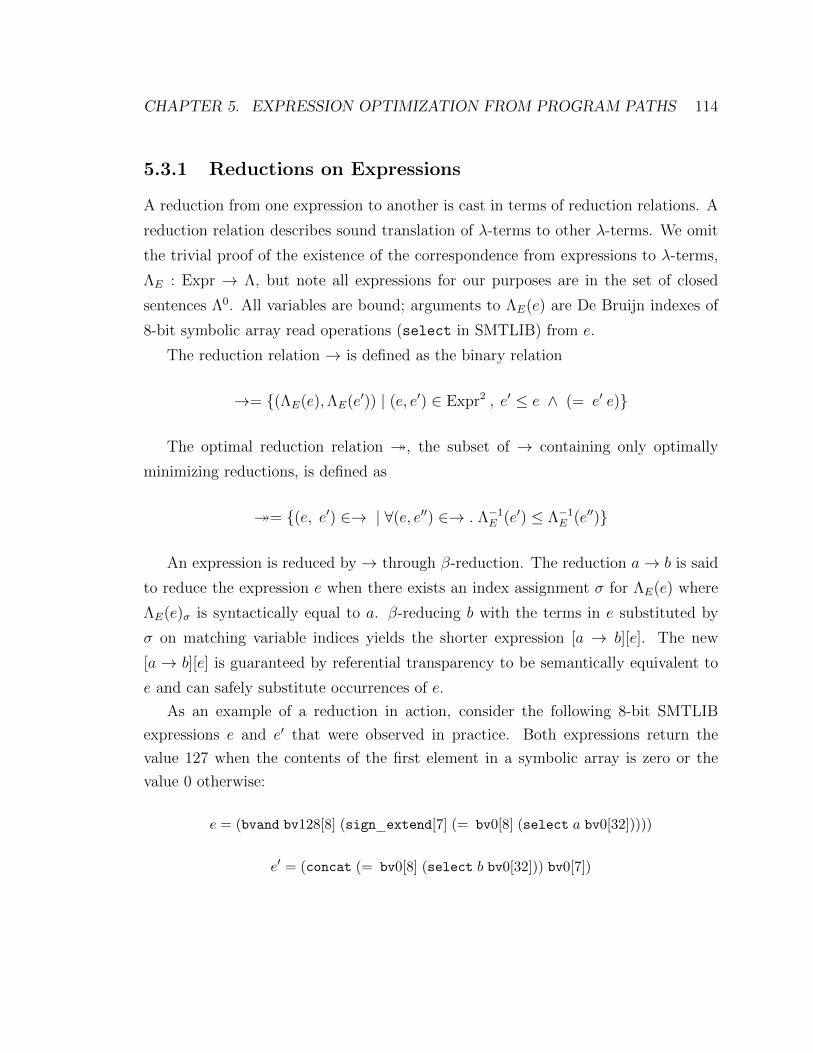
CHAPTER 5. EXPRESSION OPTIMIZATION FROM PROGRAM PATHS 114
5.3.1 Reductions on Expressions
A reduction from one expression to another is cast in terms of reduction relations. A
reduction relation describes sound translation of λ-terms to other λ-terms. We omit
the trivial proof of the existence of the correspondence from expressions to λ-terms,
ΛE : Expr → Λ, but note all expressions for our purposes are in the set of closed
sentences Λ0. All variables are bound; arguments to ΛE(e) are De Bruijn indexes of
8-bit symbolic array read operations (select in SMTLIB) from e.
The reduction relation → is defined as the binary relation
→= {(ΛE(e),ΛE(e′)) | (e, e′) ∈ Expr2 , e′ ≤ e ∧ (= e′ e)}
The optimal reduction relation �, the subset of → containing only optimally
minimizing reductions, is defined as
�= {(e, e′) ∈→ | ∀(e, e′′) ∈→ . Λ−1E (e′) ≤ Λ−1
E (e′′)}
An expression is reduced by → through β-reduction. The reduction a→ b is said
to reduce the expression e when there exists an index assignment σ for ΛE(e) where
ΛE(e)σ is syntactically equal to a. β-reducing b with the terms in e substituted by
σ on matching variable indices yields the shorter expression [a → b][e]. The new
[a → b][e] is guaranteed by referential transparency to be semantically equivalent to
e and can safely substitute occurrences of e.
As an example of a reduction in action, consider the following 8-bit SMTLIB
expressions e and e′ that were observed in practice. Both expressions return the
value 127 when the contents of the first element in a symbolic array is zero or the
value 0 otherwise:
e = (bvand bv128[8] (sign extend[7] (= bv0[8] (select a bv0[32]))))
e′ = (concat (= bv0[8] (select b bv0[32])) bv0[7])
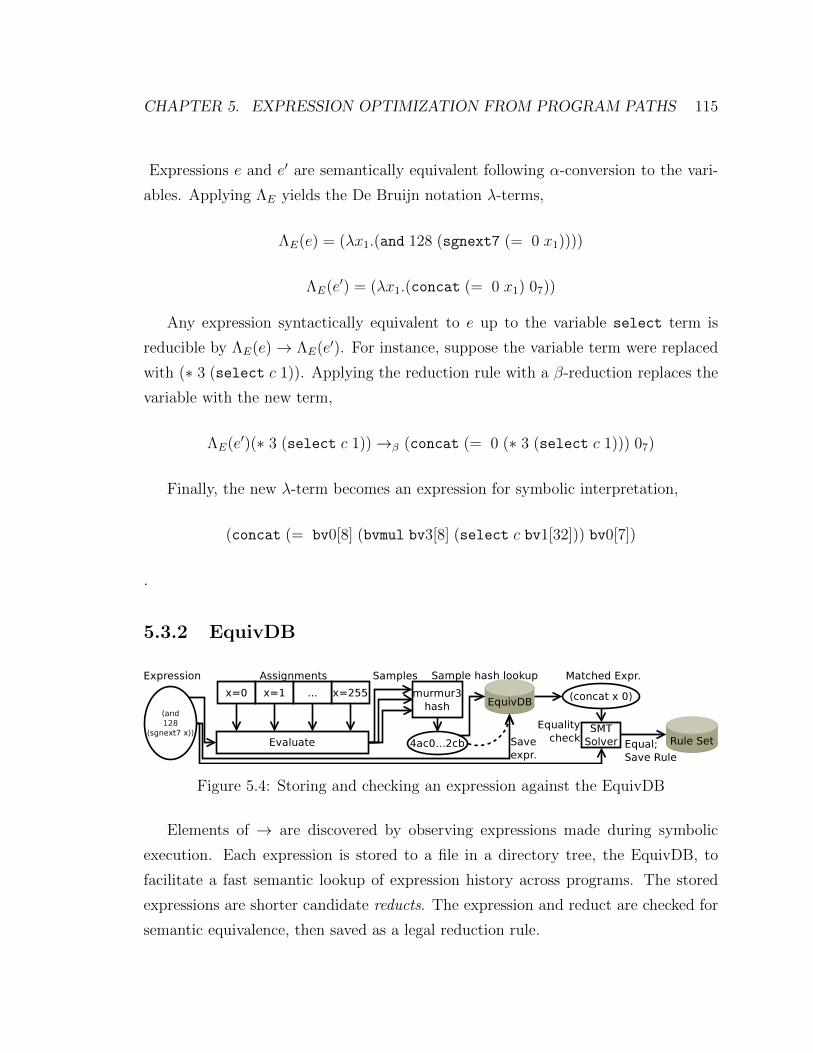
CHAPTER 5. EXPRESSION OPTIMIZATION FROM PROGRAM PATHS 115
Expressions e and e′ are semantically equivalent following α-conversion to the vari-
ables. Applying ΛE yields the De Bruijn notation λ-terms,
ΛE(e) = (λx1.(and 128 (sgnext7 (= 0 x1))))
ΛE(e′) = (λx1.(concat (= 0 x1) 07))
Any expression syntactically equivalent to e up to the variable select term is
reducible by ΛE(e)→ ΛE(e′). For instance, suppose the variable term were replaced
with (∗ 3 (select c 1)). Applying the reduction rule with a β-reduction replaces the
variable with the new term,
ΛE(e′)(∗ 3 (select c 1))→β (concat (= 0 (∗ 3 (select c 1))) 07)
Finally, the new λ-term becomes an expression for symbolic interpretation,
(concat (= bv0[8] (bvmul bv3[8] (select c bv1[32])) bv0[7])
.
5.3.2 EquivDB
Figure 5.4: Storing and checking an expression against the EquivDB
Elements of → are discovered by observing expressions made during symbolic
execution. Each expression is stored to a file in a directory tree, the EquivDB, to
facilitate a fast semantic lookup of expression history across programs. The stored
expressions are shorter candidate reducts. The expression and reduct are checked for
semantic equivalence, then saved as a legal reduction rule.

CHAPTER 5. EXPRESSION OPTIMIZATION FROM PROGRAM PATHS 116
Generating Candidate Reducts
The expressions generated by programs are clues for reduction candidates. The in-
tuition is several programs may share local behavior once a constant specialization
triggers a compiler optimization. Following a path in symbolic execution reintroduces
specializations on general code; terms in expressions are either implicitly concretized
by path constraints or masked by the particular operation sequence from the path.
These (larger) expressions from paths then eventually match (shorter) expressions
generated by shorter instruction sequences.
In the rule learning phase, candidate reducts are collected by the interpreter’s
expression builder and submitted to the EquivDB. Only top-level expressions are
considered to avoid excess overhead from intermediate expressions which are gener-
ated by optimization rewrites during construction. To store an expression into the
EquivDB, it is sampled, the values are hashed, and is written to the file path <bit-
width>/<number of nodes>/<sample hash>. Reduct entries are capped at 64 nodes
maximum to avoid excessive space utilization; Section 5.3.3 addresses how reducts can
exceed this limit to reduce large expressions through pattern matching.
Samples from expressions are computed by assigning constant values to all array
select accesses. The set of array assignments include all 8-bit values (e.g., for 1, all
symbolic bytes are set to 1), non-zero values strided by up to 17 bytes (i.e., > 2×the 64-bit architecture word width to reduce aliasing), and zero strings strided by up
to 17 bytes. The expression is evaluated for each array assignment and the sequence
of samples is combined with a fast hashing algorithm [2]. It is worth noting this
has poor collision properties; for instance, the 32-bit comparisons (= x 12345678)
and (= x 12345679) would have the same sample hashes because neither constant
appears in the assignment set. Presumably, more samples would improve hash hit
rates at the expense of additional computation.
The EquivDB storage and lookup facility is illustrated by Figure 5.4. At the top of
the diagram, an expression from the interpreter is sampled with a set of assignments
and the values are hashed. The expression is looked up by the sample hash in the
EquivDB and saved for future reference. The match from the look up is checked
against the starting expression for semantic equality. Finally, the equality is found
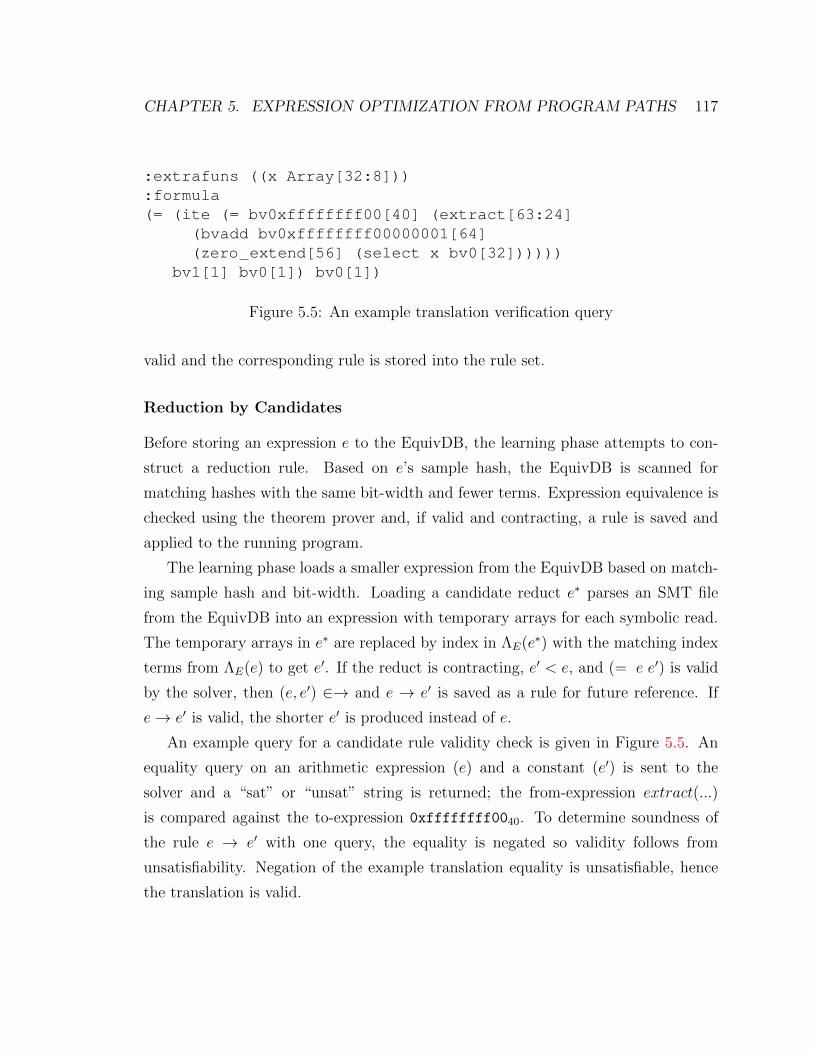
CHAPTER 5. EXPRESSION OPTIMIZATION FROM PROGRAM PATHS 117
:extrafuns ((x Array[32:8])):formula(= (ite (= bv0xffffffff00[40] (extract[63:24]
(bvadd bv0xffffffff00000001[64](zero extend[56] (select x bv0[32])))))
bv1[1] bv0[1]) bv0[1])
Figure 5.5: An example translation verification query
valid and the corresponding rule is stored into the rule set.
Reduction by Candidates
Before storing an expression e to the EquivDB, the learning phase attempts to con-
struct a reduction rule. Based on e’s sample hash, the EquivDB is scanned for
matching hashes with the same bit-width and fewer terms. Expression equivalence is
checked using the theorem prover and, if valid and contracting, a rule is saved and
applied to the running program.
The learning phase loads a smaller expression from the EquivDB based on match-
ing sample hash and bit-width. Loading a candidate reduct e∗ parses an SMT file
from the EquivDB into an expression with temporary arrays for each symbolic read.
The temporary arrays in e∗ are replaced by index in ΛE(e∗) with the matching index
terms from ΛE(e) to get e′. If the reduct is contracting, e′ < e, and (= e e′) is valid
by the solver, then (e, e′) ∈→ and e → e′ is saved as a rule for future reference. If
e→ e′ is valid, the shorter e′ is produced instead of e.
An example query for a candidate rule validity check is given in Figure 5.5. An
equality query on an arithmetic expression (e) and a constant (e′) is sent to the
solver and a “sat” or “unsat” string is returned; the from-expression extract(...)
is compared against the to-expression 0xffffffff0040. To determine soundness of
the rule e → e′ with one query, the equality is negated so validity follows from
unsatisfiability. Negation of the example translation equality is unsatisfiable, hence
the translation is valid.
CHAPTER 5. EXPRESSION OPTIMIZATION FROM PROGRAM PATHS 118
Care is taken to handle several edge cases. Expressions e often reduce to a con-
stant, but storing and accessing constant values from the EquivDB is needless over-
head. Instead, the sample hash predicts e is constant by observing unchanging sample
values c; the constant c serves as a candidate reduct e� c before falling back to the
EquivDB. Whenever the solver code builds an expression, to avoid infinite recursion
from equivalence checks, that expression is queued for rule checking until the inter-
preter dispatches the next program instruction. For reliability, if the solver fails or
takes too long to check a rule’s validity, then the rule is dropped and e is returned
for symbolic interpretation.
5.3.3 Rewrite Rules
Rewrite rules represent sets of reductions in →. Every rewrite rule traces back to
a sound primordial expression equality originating from the EquivDB. Each rewrite
rule covers a class of reductions with expression template patterns that match and
materialize classes of expressions. These rules direct expression optimization and are
managed as a rule set kept on persistent storage.
Every candidate rule built during the learning phase is verified with the solver.
The equivalent expressions e, from the interpreter, and e′, from the EquivDB, are
converted into a from-pattern a and to-pattern b which are combined to make a rule
a→ b. Once a→ b is verified, all future applications of the rule a→ b are conducted
without invoking the solver.
A rule pattern is a flattened expression with extra support for replacement slots.
Figure 5.6 lists the grammar for patterns and rules in general. Symbolic array reads
are labeled as 8-bit slots (〈label〉) which correspond to the variables from the ex-
pression transform ΛE. These slots are used in pattern matching which is described
in Section 5.4 and establish variable correspondence between the from-pattern and
to-pattern. Dummy variables (〈dummy-var〉), which are only matched on expression
width and ignore structure, replace useless subexpressions through subtree elimi-
nation (Section 5.6.1). Likewise, there are constrained slots (〈cconst〉) for constants,
introduced through constant relaxation (Section 5.6.2), which match when a constant

CHAPTER 5. EXPRESSION OPTIMIZATION FROM PROGRAM PATHS 119
〈rule〉 ::= 〈from-pattern〉 → 〈to-pattern〉 〈const-constraints〉
〈from-pattern〉 ::= 〈const〉| 〈unary-op〉 〈from-pattern〉| 〈binary-op〉 〈from-pattern〉 〈from-pattern〉| 〈extend-op〉 〈from-pattern〉 〈const〉| Select 〈from-pattern〉 〈from-pattern〉 〈from-pattern〉| Extract 〈const〉 〈const〉 〈from-pattern〉| 〈label〉 | 〈cconst〉 | 〈dummy-var〉
〈to-pattern〉 ::= 〈const〉| 〈unary-op〉 〈to-pattern〉| 〈binary-op〉 〈to-pattern〉 〈to-pattern〉| 〈extend-op〉 〈to-pattern〉 〈const〉| Select 〈to-pattern〉 〈to-pattern〉 〈to-pattern〉| Extract 〈const〉 〈const〉 〈to-pattern〉| 〈label〉 | 〈cconst〉
〈const-constraints〉 ::= 〈constraint-expr〉 〈const-constraints〉 | ε
〈constraint-expr〉 ::= 〈const〉| 〈unary-op〉 〈constraint-expr〉| 〈binary-op〉 〈constraint-expr〉 〈constraint-expr〉| 〈extend-op〉 〈constraint-expr〉 〈const〉| Select 〈constraint-expr〉 〈constraint-expr〉 〈constraint-expr〉| Extract 〈const〉 〈const〉 〈constraint-expr〉| 〈cconst〉
〈const〉 ::= Constant 〈bit-vec-num〉
〈label〉 ::= l〈num〉
〈dummy-var〉 ::= v〈num〉
〈cconst〉 ::= c〈num〉
Figure 5.6: Expression reduction rule grammar

CHAPTER 5. EXPRESSION OPTIMIZATION FROM PROGRAM PATHS 120
satisfies constraints bundled with the rule (〈const-constraints〉).Rules are written to persistent storage in a binary format, serialized into files, and
read in by the interpreter. Serialization flattens expressions into patterns by a pre-
order traversal of all nodes. On storage, each rule has a header which lets the rule
loader gracefully recover from corrupted rules, specify version features, and ignore
deactivated tombstone rules.
Manipulating rules, such as for generalization or other analysis, often requires
materialization of patterns. A pattern, which represents a class of expressions, is ma-
terialized by building an expression belonging to the class. Rules can be materialized
into a validity check or by individual pattern into expressions. The validity check
is a query which may be sent to the solver to verify that the relation a → b holds.
Each materialized expression uses independent temporary arrays for symbolic data
to avoid assuming properties from state constraint sets.
5.4 Rule-Directed Optimizer
The optimizer applies rules to a target expression to produce smaller, equivalent
expressions. A rule-directed expression builder loads a set of reduction rules from
persistent storage at interpreter initialization. The expression builder applies reduc-
tion rules in two phases. First, efficient pattern matching searches the rule set for a
rule with a from-pattern that matches the target expression. If there is such a rule,
the target expression β-reduces on the rule’s to-pattern to make a smaller expression
which is equivalent to the target.
5.4.1 Pattern Matching
Over the length of a program path, a collection of rules is applied to every observed
expression. The optimizer analyzes every expression seen by the interpreter, so finding
a rule must be fast and never call out to the solver. Furthermore, thousands of rules
may be active at any time, so matching rules must be efficient.
The optimizer has three ways to find a rule r which reduces an expression e. The
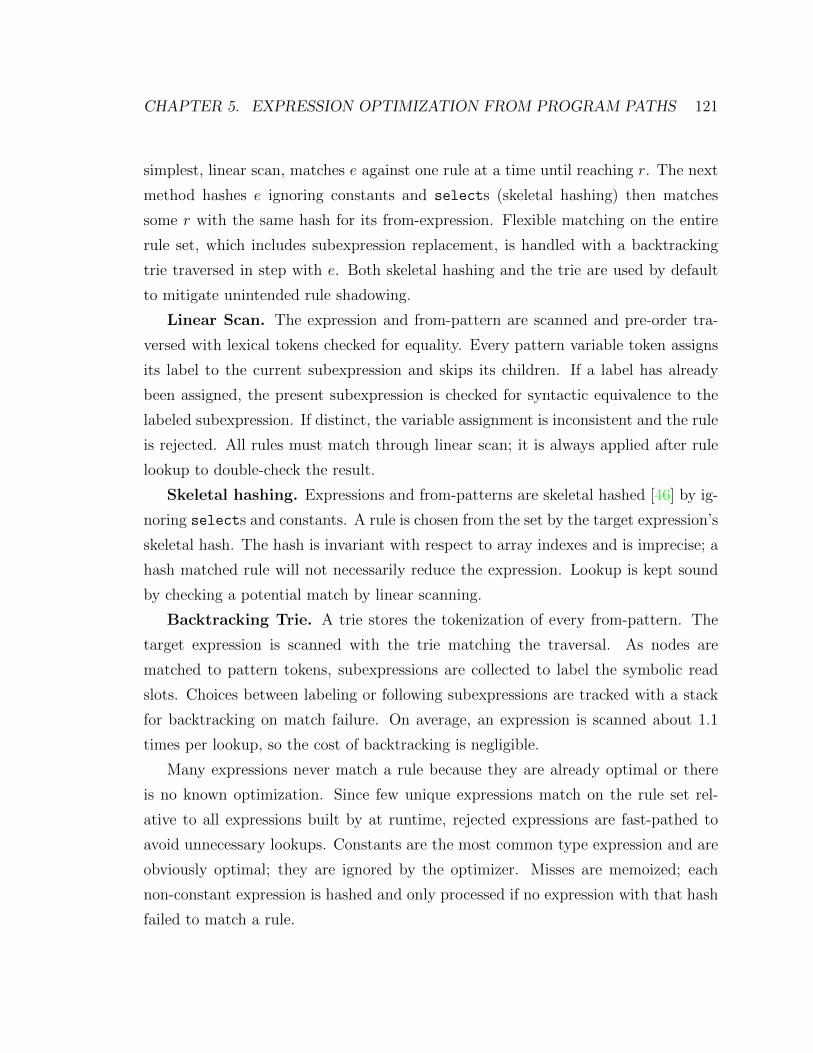
CHAPTER 5. EXPRESSION OPTIMIZATION FROM PROGRAM PATHS 121
simplest, linear scan, matches e against one rule at a time until reaching r. The next
method hashes e ignoring constants and selects (skeletal hashing) then matches
some r with the same hash for its from-expression. Flexible matching on the entire
rule set, which includes subexpression replacement, is handled with a backtracking
trie traversed in step with e. Both skeletal hashing and the trie are used by default
to mitigate unintended rule shadowing.
Linear Scan. The expression and from-pattern are scanned and pre-order tra-
versed with lexical tokens checked for equality. Every pattern variable token assigns
its label to the current subexpression and skips its children. If a label has already
been assigned, the present subexpression is checked for syntactic equivalence to the
labeled subexpression. If distinct, the variable assignment is inconsistent and the rule
is rejected. All rules must match through linear scan; it is always applied after rule
lookup to double-check the result.
Skeletal hashing. Expressions and from-patterns are skeletal hashed [46] by ig-
noring selects and constants. A rule is chosen from the set by the target expression’s
skeletal hash. The hash is invariant with respect to array indexes and is imprecise; a
hash matched rule will not necessarily reduce the expression. Lookup is kept sound
by checking a potential match by linear scanning.
Backtracking Trie. A trie stores the tokenization of every from-pattern. The
target expression is scanned with the trie matching the traversal. As nodes are
matched to pattern tokens, subexpressions are collected to label the symbolic read
slots. Choices between labeling or following subexpressions are tracked with a stack
for backtracking on match failure. On average, an expression is scanned about 1.1
times per lookup, so the cost of backtracking is negligible.
Many expressions never match a rule because they are already optimal or there
is no known optimization. Since few unique expressions match on the rule set rel-
ative to all expressions built by at runtime, rejected expressions are fast-pathed to
avoid unnecessary lookups. Constants are the most common type expression and are
obviously optimal; they are ignored by the optimizer. Misses are memoized; each
non-constant expression is hashed and only processed if no expression with that hash
failed to match a rule.
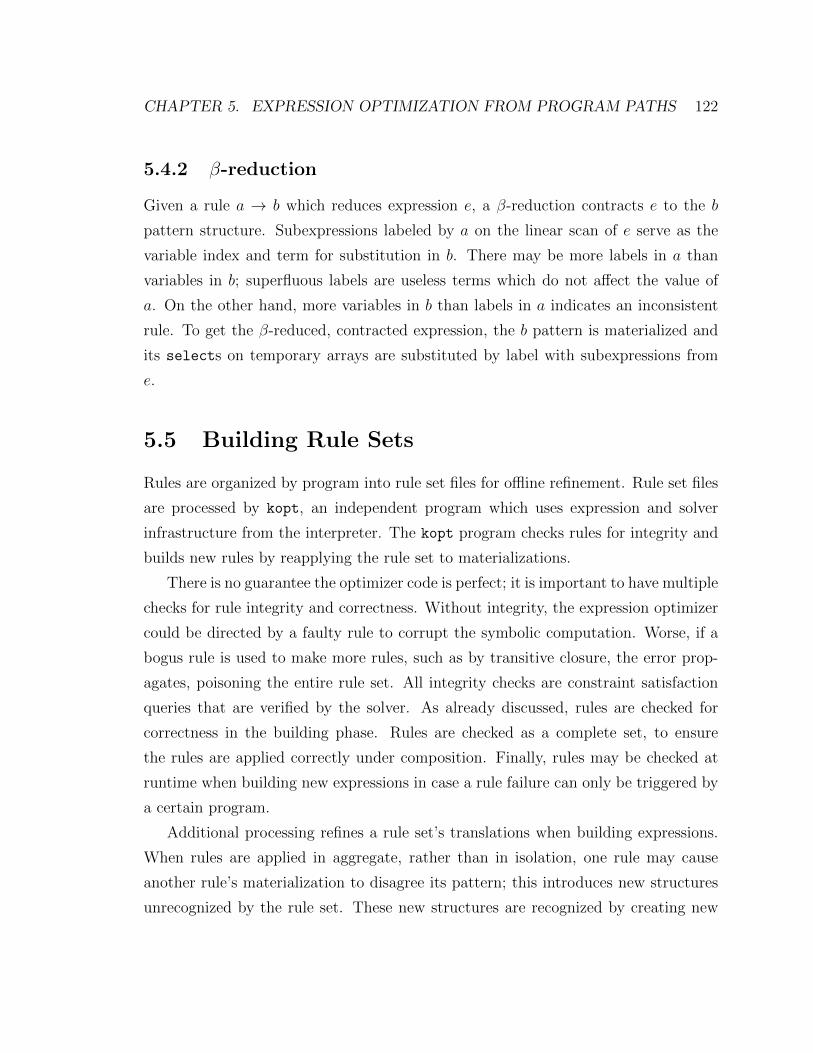
CHAPTER 5. EXPRESSION OPTIMIZATION FROM PROGRAM PATHS 122
5.4.2 β-reduction
Given a rule a → b which reduces expression e, a β-reduction contracts e to the b
pattern structure. Subexpressions labeled by a on the linear scan of e serve as the
variable index and term for substitution in b. There may be more labels in a than
variables in b; superfluous labels are useless terms which do not affect the value of
a. On the other hand, more variables in b than labels in a indicates an inconsistent
rule. To get the β-reduced, contracted expression, the b pattern is materialized and
its selects on temporary arrays are substituted by label with subexpressions from
e.
5.5 Building Rule Sets
Rules are organized by program into rule set files for offline refinement. Rule set files
are processed by kopt, an independent program which uses expression and solver
infrastructure from the interpreter. The kopt program checks rules for integrity and
builds new rules by reapplying the rule set to materializations.
There is no guarantee the optimizer code is perfect; it is important to have multiple
checks for rule integrity and correctness. Without integrity, the expression optimizer
could be directed by a faulty rule to corrupt the symbolic computation. Worse, if a
bogus rule is used to make more rules, such as by transitive closure, the error prop-
agates, poisoning the entire rule set. All integrity checks are constraint satisfaction
queries that are verified by the solver. As already discussed, rules are checked for
correctness in the building phase. Rules are checked as a complete set, to ensure
the rules are applied correctly under composition. Finally, rules may be checked at
runtime when building new expressions in case a rule failure can only be triggered by
a certain program.
Additional processing refines a rule set’s translations when building expressions.
When rules are applied in aggregate, rather than in isolation, one rule may cause
another rule’s materialization to disagree its pattern; this introduces new structures
unrecognized by the rule set. These new structures are recognized by creating new

CHAPTER 5. EXPRESSION OPTIMIZATION FROM PROGRAM PATHS 123
rules to transitively close the rule set. Further, to-patterns are normalized to improve
rule set matching by canonicalizing production templates.
5.5.1 Integrity
Rules are only applied to a program after the solver verifies they are correct. Output
from the learning phase is marked as pending and is verified by the solver indepen-
dently. Rules are further refined past the pending stage into new rules which are
checked as well. At program runtime the rule set translations can be cross-checked
against the baseline builder for testing composition.
Rule sets are processed for correctness. kopt loads a rule set and materializes each
rule into an equivalence query. The external theorem prover verifies the equivalence
is valid. Syntactic tests follow; components of the rule are constructed and analyzed.
If the rule does not reduce its from-pattern when materialized through the optimizer,
the rule is ineffective and thrown away.
A rule must be contracting to make forward progress. When expressions making
up a rule are heavily processed, such as serialization to and from SMT or rebuilding
with several rule sets, the to-expression may eventually have more nodes than the
from-expression. In this case, although the rule is valid, it is non-contracting and
therefore removed. However, the rule can be recovered by swapping the patterns and
checking validity, which is similar to the Knuth-Bendix algorithm [78].
As an end-to-end check, rule integrity is optionally verified at runtime for a pro-
gram under the symbolic interpreter. The rule-directed expression builder is cross-
checked against the default expression builder. Whenever a new expression is created
from an operator ◦ and arguments x, the expression (◦ x) is built under both builders
for e and e′ respectively. If (= e e′) is not valid according to the solver, then one
builder is wrong and the symbolic state is terminated with an error and expression
debugging information. Cross-checking also works with a fuzzer to build random
expressions which trigger broken translations. This testing proved useful when devel-
oping the β-reduction portion of the system; in most cases it is the last resort option
since rule equivalence queries tend to catch problems at the kopt stage.

CHAPTER 5. EXPRESSION OPTIMIZATION FROM PROGRAM PATHS 124
5.5.2 Transitive Closure
Rules for large expressions may be masked by rules from smaller expressions. Once
rules are applied to a program’s expressions, updated rules may be necessary to
optimize the new term arrangement. Fortunately, rules are contracting, and therefore
expression size monotonically decreases; generating more rules through transitivity
converges to a minima.
An example of how bottom-up building masks rules: consider the rules r1 =
[(+ a b) → 1] and r2 = [a → c]. Expressions are built bottom-up, so a in (+a b)
reduces to c by r2, yielding (+ c b). Rule r1 no longer applies since r2 eagerly rewrote
a subexpression. However, all rules are contracting, so |(+ c b)| < |(+ a b)|. Hence,
new rules may be generated by applying known rules, then added to the system with
the expectation of convergence to a fixed point.
A seemingly optimal solution is to embed rules within rules. For instance (+ a b)
could be rewritten as (+ D b) where D is an equivalence class that corresponds to
both a and c. However, a and c may be syntactically different, and a rule can only
match one parse at a time. Embedding rules would needlessly complicate the pattern
matcher because simply adding a new rule already suffices to handle both a and c.
New rules inline new patterns as they are observed. For every instance of pattern
materialization not matching the pattern itself (as above), a new rule is created from
the new from-pattern materialization. Following the example, the rule r1 must now
match (+ c b), so define a new rule r3 = [(+ c b)→ 1].
The EquivDB influences the convergence rate. The database may hold inferior
translations which bubble up into learned rules. Since smaller expressions store to
the database as the rules improve, the database conveniently improves along with the
rules. Hence, a database of rule derived expressions continues to have good reductions
even after discarding the initial rule set.
5.5.3 Normal Form Canonicalization
Expressions of same size may take different forms. Consider, (= 0 a) and (= 0 b)
where a = a1 . . . an and b = an . . . a1. Both are equivalent and have the same number

CHAPTER 5. EXPRESSION OPTIMIZATION FROM PROGRAM PATHS 125
of nodes but will not be reducible under the same rule because of syntactic mismatch.
Instead, a normal form condition is imposed by selecting for the minimum of the
expression ordering operator ≤ on semantic partitions on to-patterns. With normal
forms, fewer rules are necessary because semantically equivalent to-patterns must
materialize to one minimal syntactic representation.
The to-pattern materializations are collected from the rule set and partitioned
by sample hashes. Each partition P of to-expressions is further divided by semantic
equivalence by choosing the minimum expression e⊥ ∈ P , querying for valid equality
over every pair (e⊥, e) where e ∈ P . If the pair is equivalent, the expression e is
added to the semantic partition P (e⊥). Once P (e⊥) is built, a new e′⊥ is chosen from
P\P (e⊥) and the process is repeated until P is exhausted.
Normal forms replace noncanonical rule to-patterns. After partitioning the to-
expressions, the rule set is scanned for noncanonical rules with to-expressions e where
there is some P (e⊥) with e ∈ P (e⊥) where e⊥ 6= e. Every noncanonical rule to-pattern
e is replaced with e⊥ and outdated rules are removed from the rule set file.
5.6 Rule Generalizations
The class of expressions a rule matches may be extended by selectively relaxing from-
pattern terms. The process of generalization goes beyond transitive closure by in-
serting new variables into expressions. Useless subterms are relaxed with dummy
variables, which match and discard any term, by applying subtree elimination to find
terms that have no effect on expression values. Constants with a set of equisatisfiable
values are relaxed by assigning constraints to a constant label.
5.6.1 Subtree Elimination
Subtree elimination marks useless from-expression terms as dummy variables in the
from-pattern. A rule’s from-expression e has its subexpressions post-order replaced
with dummy unconstrained variables. For each new expression e′, the solver finds for
the validity of (= e e′). If e′ is equivalent, the rule’s from-pattern is rewritten with

CHAPTER 5. EXPRESSION OPTIMIZATION FROM PROGRAM PATHS 126
10
20
30
40
50
60
70
80
90
100
1 10 100 1000 10000
% T
ota
l R
ule
s
Rules found in Equivalence Class
Cumulative Equivalence Class Rule Distribution
64-bit constants+ 32-bit+ 16-bit+ 8-bit
+ 8*n-bit
Figure 5.7: Acceptance of constant widths on expression equivalence class hits
e′ so that it has the dummy variable.
For example, let e = (= 0 (or 1023 (concat (select 0 x) (select 1 x)))) be a
from-expression. This expression, observed in practice, tests whether a 16-bit value
bitwise conjoined with 1023 is equal to 0. Since the or term is always non-zero, the
equality never holds, implying e � 0. A good rule should match similar expressions
with any 16-bit subterm rather than the concatenation of two 8-bit reads. Traversal
first marks the 0, or, and 1023 terms as dummy variables but the solver rejects
equivalence. The concat term, however, may take any value so it is marked as a
16-bit dummy variable v16, yielding the pattern (= 0 (or 1023 v16)), which matches
any 16-bit term.
5.6.2 Constant Relaxation
A large class of expressions generalize from a single expression by perturbing the
constants. In a rule, constant slots serve as constraints on the expression. Consider
the 16-bit expression e, (and 0x8000 (or 0x7ffe (ite (x) 0 1)). The values of
the ite if-then-else term never set the 15th bit, so e � 0. By marking 0x8000
as a labeled constant c, this reduction generalizes to the rule (and 0x8000 (or c
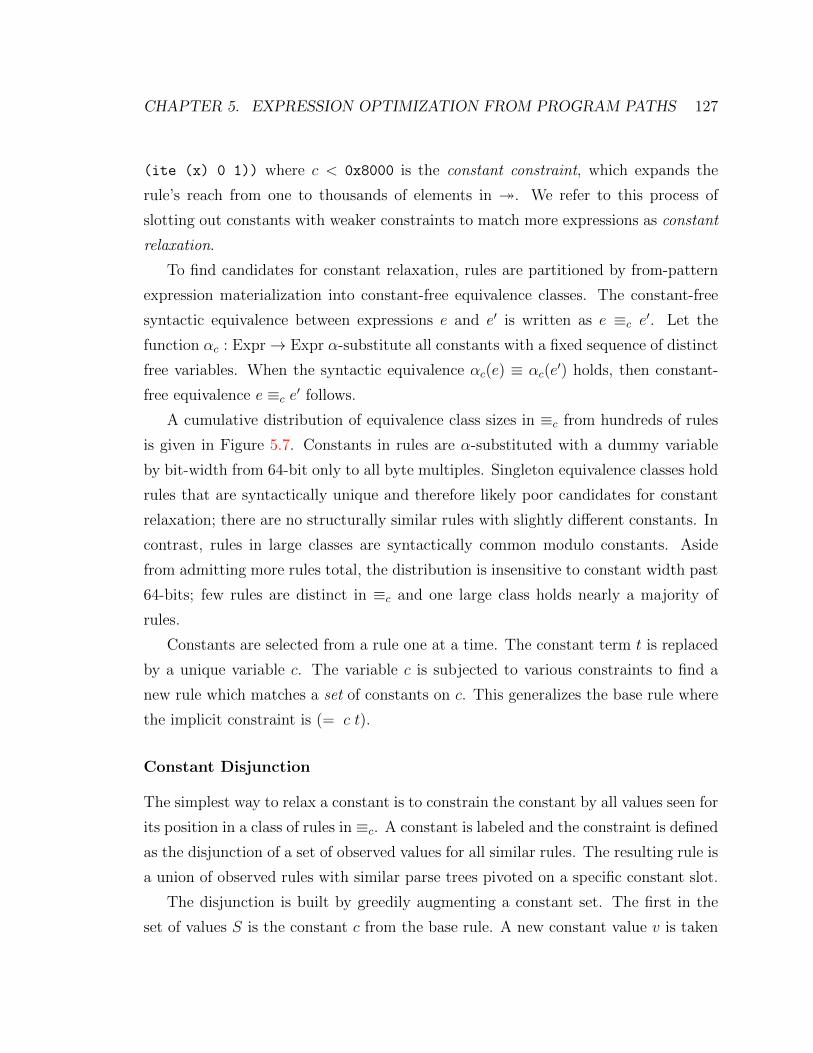
CHAPTER 5. EXPRESSION OPTIMIZATION FROM PROGRAM PATHS 127
(ite (x) 0 1)) where c < 0x8000 is the constant constraint, which expands the
rule’s reach from one to thousands of elements in �. We refer to this process of
slotting out constants with weaker constraints to match more expressions as constant
relaxation.
To find candidates for constant relaxation, rules are partitioned by from-pattern
expression materialization into constant-free equivalence classes. The constant-free
syntactic equivalence between expressions e and e′ is written as e ≡c e′. Let the
function αc : Expr→ Expr α-substitute all constants with a fixed sequence of distinct
free variables. When the syntactic equivalence αc(e) ≡ αc(e′) holds, then constant-
free equivalence e ≡c e′ follows.
A cumulative distribution of equivalence class sizes in ≡c from hundreds of rules
is given in Figure 5.7. Constants in rules are α-substituted with a dummy variable
by bit-width from 64-bit only to all byte multiples. Singleton equivalence classes hold
rules that are syntactically unique and therefore likely poor candidates for constant
relaxation; there are no structurally similar rules with slightly different constants. In
contrast, rules in large classes are syntactically common modulo constants. Aside
from admitting more rules total, the distribution is insensitive to constant width past
64-bits; few rules are distinct in ≡c and one large class holds nearly a majority of
rules.
Constants are selected from a rule one at a time. The constant term t is replaced
by a unique variable c. The variable c is subjected to various constraints to find a
new rule which matches a set of constants on c. This generalizes the base rule where
the implicit constraint is (= c t).
Constant Disjunction
The simplest way to relax a constant is to constrain the constant by all values seen for
its position in a class of rules in ≡c. A constant is labeled and the constraint is defined
as the disjunction of a set of observed values for all similar rules. The resulting rule is
a union of observed rules with similar parse trees pivoted on a specific constant slot.
The disjunction is built by greedily augmenting a constant set. The first in the
set of values S is the constant c from the base rule. A new constant value v is taken

CHAPTER 5. EXPRESSION OPTIMIZATION FROM PROGRAM PATHS 128
from the next rule and a query is sent to the solver to check if v can be substituted
into the base rule over c. If the validity check fails, v is discarded. If v is a valid
substitution, it is added to S. When all candidate values from the rule equivalence
class are exhausted, the constraint on the labeled constant slot c is∨s∈S(= c s).
Constant Ranges
Range constraints restrict a constant to a contiguous region of values. The values for
the range [a, b] on the constant substitution x are computed through binary search in
the solver. The constant c from the base rule is the initial pivot for the search since
c ∈ [a, b]. Starting from c, one binary search finds a from [0, c] and another finds b
from [c, 2n − 1]. The constraint a ≤ x ≤ b is placed on the new rule and the solver
verifies equivalence to the base rule’s from-expression.
Constant Bitmasks
A constant in a rule may only depend on a few bits being set or zeroed, leaving all
other bits unconstrained. Ranges on constants only support contiguous ranges, so
it is necessary to introduce additional constraint analysis. Constant constraints on
a constant x’s bits are found by creating a mask m and value c which is valid for a
predicate of the form x & m = c.
The solver is used to find the mask m bit by bit. Since the base rule is valid, the
rule’s constant value a must satisfy a & m = c. Bit k of the mask is computed by
solving for the validity of (= x (a & 2k)) when x is constrained by the base rule.
Each set bit k implies bit k of x must match bit k of a.
5.7 Evaluation
The expression optimizer is evaluated in terms of performance, effects on queries, and
system characteristics on two thousand programs. Foremost, rules improve running
time and solver performance on average. Total queries are reduced on average from
baseline by the optimizer. The space overhead and expression distribution of the

CHAPTER 5. EXPRESSION OPTIMIZATION FROM PROGRAM PATHS 129
Component Lines of CodeEquivDB/Learning 645Rule Builder 1900kopt 2519Original Builder (Hand-written) 1315
Table 5.1: Lines of code for expression optimization
EquivDB illustrate properties of the learning phase. Rule effectiveness is measured
by number of rules used and rate of sharing.
5.7.1 Implementation
The optimizer system is written for klee-mc as a drop-in replacement for the existing
optimizing expression builder. Table 5.1 shows the lines of C++ code for major
components of the expression handling system. Qualitatively, the code for the new
optimizer represents a modest effort compared to the ad-hoc version. The largest
component is kopt, the offline rule analysis program, where the cost of complexity is
low. The rule builder, which applies the vetted rules as expressions are built inside
the interpreter, is primarily focused on the fast matching trie. The EquivDB learning
builder uses the least code since creating candidate rules is relatively simple.
5.7.2 Test System
Programs
All experiments are performed over a set of approximately 2300 programs. The pro-
grams are from the system binary directories /{usr/,}{sbin,bin} of an up-to-date
x86-64 Gentoo Linux system. Each program is breakpointed at its entry point and
snapshotted. All future accesses to the program reuse the snapshot for reproducibility
purposes; every snapshot contains the full process memory image, including linked
shared libraries, such as the C library glibc.
Programs are set to run under the symbolic interpreter for at most five minutes.
Each program is allocated five minutes on one core of an 8-core desktop chip with

CHAPTER 5. EXPRESSION OPTIMIZATION FROM PROGRAM PATHS 130
16GB of memory. There is minor additional processing and book keeping; overall,
one symbolic run of the program set takes slightly more than a day.
Path Replay
Two sets of runs are taken as a basis of comparison: one with only the ad-hoc
optimizer and the other with the rule-directed optimizer as well. The same paths must
be followed to give an accurate comparison between the baseline symbolic interpreter
and the optimizer. Since paths are known a priori, persistent query caches are disabled
to avoid distorted times.
klee-mc supports two kinds of path replay: concrete tests and branch paths. A
concrete test is a solution to path constraints which replaces symbolic values with
constants to duplicate the path. A branch path is a list of branch decisions.
Each branch path is a log of taken branch indexes (e.g., true, false) for some
completed state. Branch replay reads an entry from the log for every branch decision
and directs the replaying state toward the desired path. As an optimization, if a
branch replay forks off a state with a branch log which is a prefix for another branch
path, the branch path replay begins at the forked state.
Branch path equivalence is not guaranteed between equivalent paths using differ-
ent rule. Mismatched branch paths arise between distinct rule sets when the inter-
preter syntactically checks for constant expressions to avoid extra work; a decision is
elided on a constant for one rule set, but recorded for a non-constant on another set,
so the logs are no longer synchronized. A concrete test, on the other hand, is a value
assignment, and therefore insensitive to expression structure. Concrete tests preserve
paths across rule sets so they are used to rebuild branch paths.
5.7.3 Performance
The effect of rules on running time and solver time is given sorted in Figure 5.9.
Overall, there are significant performance gains made on average with the rule directed
optimizer. Additionally, the correlation between run and solver time is evident by
solver improvements closely following run time gains.
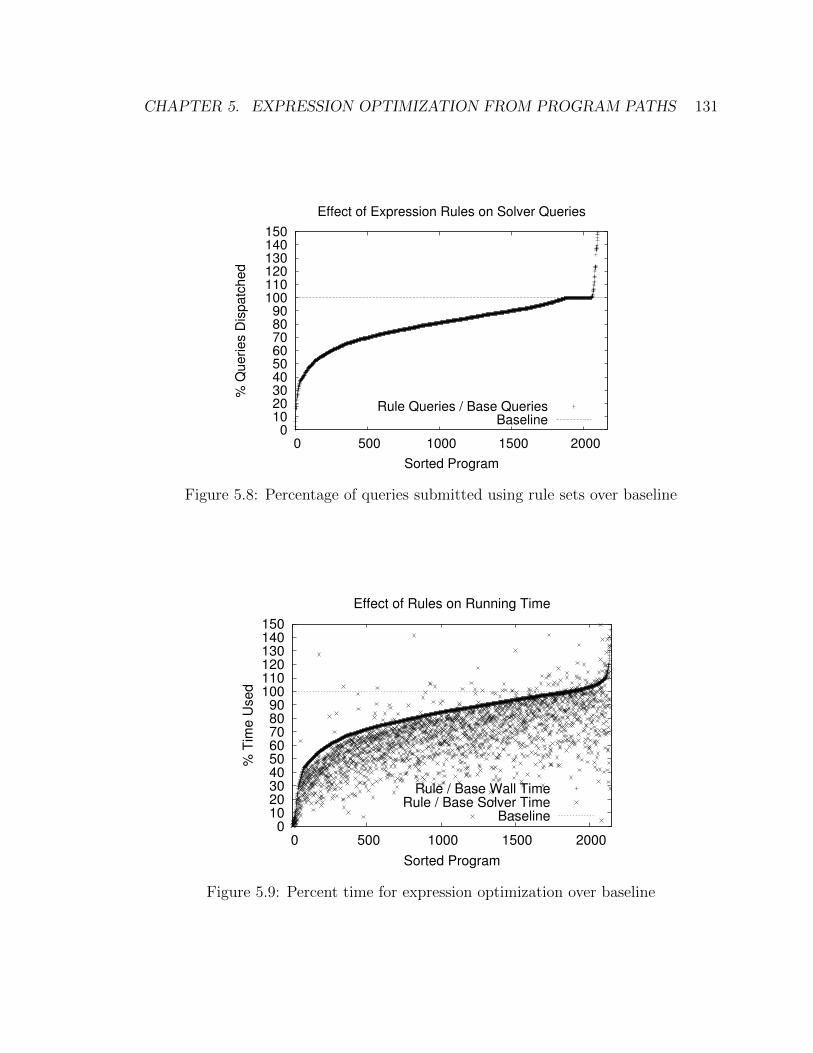
CHAPTER 5. EXPRESSION OPTIMIZATION FROM PROGRAM PATHS 131
0 10 20 30 40 50 60 70 80 90
100 110 120 130 140 150
0 500 1000 1500 2000
% Q
ue
rie
s D
isp
atc
he
d
Sorted Program
Effect of Expression Rules on Solver Queries
Rule Queries / Base QueriesBaseline
Figure 5.8: Percentage of queries submitted using rule sets over baseline
0 10 20 30 40 50 60 70 80 90
100 110 120 130 140 150
0 500 1000 1500 2000
% T
ime U
sed
Sorted Program
Effect of Rules on Running Time
Rule / Base Wall TimeRule / Base Solver Time
Baseline
Figure 5.9: Percent time for expression optimization over baseline
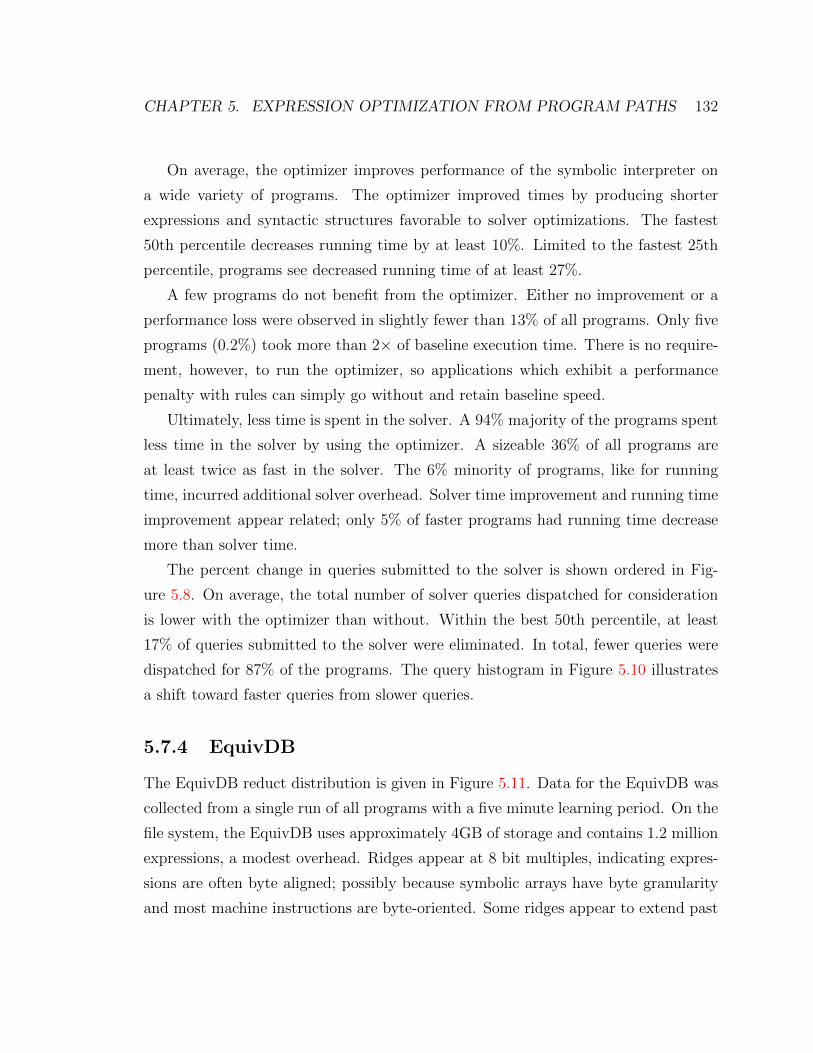
CHAPTER 5. EXPRESSION OPTIMIZATION FROM PROGRAM PATHS 132
On average, the optimizer improves performance of the symbolic interpreter on
a wide variety of programs. The optimizer improved times by producing shorter
expressions and syntactic structures favorable to solver optimizations. The fastest
50th percentile decreases running time by at least 10%. Limited to the fastest 25th
percentile, programs see decreased running time of at least 27%.
A few programs do not benefit from the optimizer. Either no improvement or a
performance loss were observed in slightly fewer than 13% of all programs. Only five
programs (0.2%) took more than 2× of baseline execution time. There is no require-
ment, however, to run the optimizer, so applications which exhibit a performance
penalty with rules can simply go without and retain baseline speed.
Ultimately, less time is spent in the solver. A 94% majority of the programs spent
less time in the solver by using the optimizer. A sizeable 36% of all programs are
at least twice as fast in the solver. The 6% minority of programs, like for running
time, incurred additional solver overhead. Solver time improvement and running time
improvement appear related; only 5% of faster programs had running time decrease
more than solver time.
The percent change in queries submitted to the solver is shown ordered in Fig-
ure 5.8. On average, the total number of solver queries dispatched for consideration
is lower with the optimizer than without. Within the best 50th percentile, at least
17% of queries submitted to the solver were eliminated. In total, fewer queries were
dispatched for 87% of the programs. The query histogram in Figure 5.10 illustrates
a shift toward faster queries from slower queries.
5.7.4 EquivDB
The EquivDB reduct distribution is given in Figure 5.11. Data for the EquivDB was
collected from a single run of all programs with a five minute learning period. On the
file system, the EquivDB uses approximately 4GB of storage and contains 1.2 million
expressions, a modest overhead. Ridges appear at 8 bit multiples, indicating expres-
sions are often byte aligned; possibly because symbolic arrays have byte granularity
and most machine instructions are byte-oriented. Some ridges appear to extend past

CHAPTER 5. EXPRESSION OPTIMIZATION FROM PROGRAM PATHS 133
0e+0
1e+5
2e+5
3e+5
4e+5
5e+5
6e+5
7e+5
8e+5
1e-06
1e-05
0.0001
0.001
0.01 0.1
1 100.0e+0
5.0e+3
1.0e+4
1.5e+4
2.0e+4
2.5e+4
# Q
ue
rie
s
To
tal T
ime
(s)
Time Per Query
Base Query Latency Distribution
Queries Query Times
0e+0
1e+5
2e+5
3e+5
4e+5
5e+5
6e+5
7e+5
1e-06
1e-05
0.0001
0.001
0.01 0.1
1 100.0e+0
2.0e+3
4.0e+3
6.0e+3
8.0e+3
1.0e+4
1.2e+4
1.4e+4
1.6e+4
# Q
ue
rie
s
To
tal T
ime
(s)
Time Per Query
Rule Query Latency Distribution
Queries Query Times
Figure 5.10: Query time distribution for baseline and rule test cases
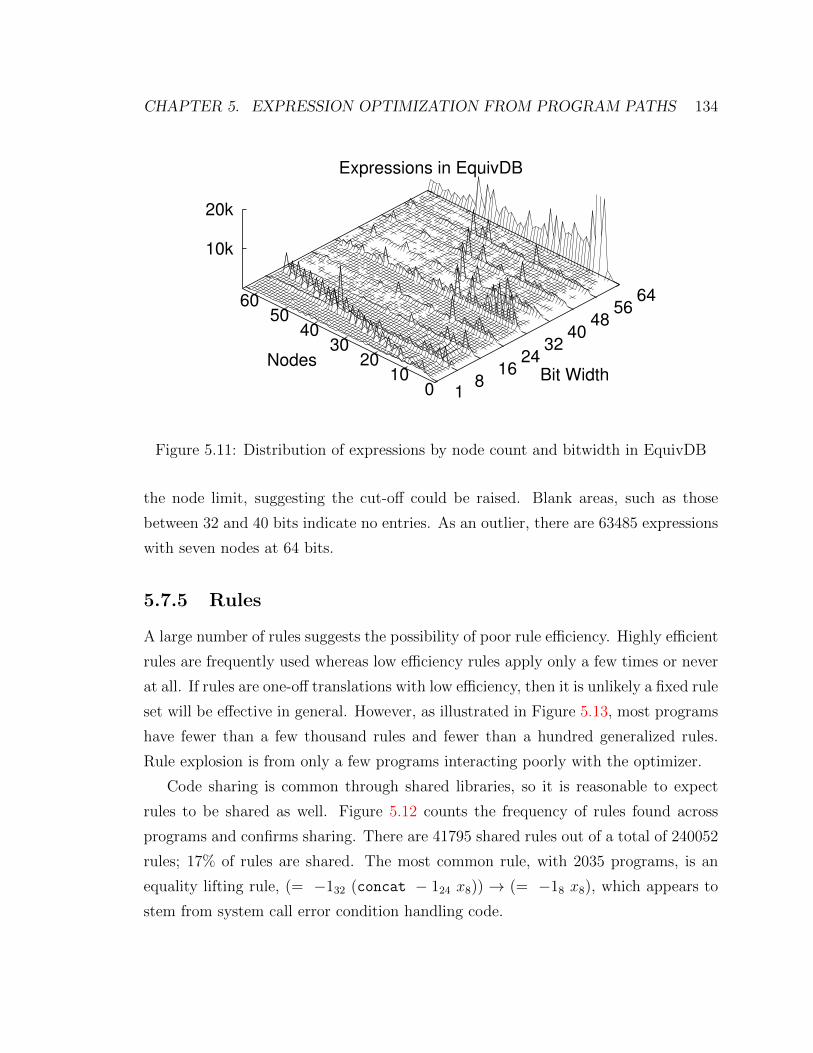
CHAPTER 5. EXPRESSION OPTIMIZATION FROM PROGRAM PATHS 134
1 8
16 24
32 40
48 56
64
0 10
20 30
40 50
60
10k
20k
Expressions in EquivDB
Bit WidthNodes
Figure 5.11: Distribution of expressions by node count and bitwidth in EquivDB
the node limit, suggesting the cut-off could be raised. Blank areas, such as those
between 32 and 40 bits indicate no entries. As an outlier, there are 63485 expressions
with seven nodes at 64 bits.
5.7.5 Rules
A large number of rules suggests the possibility of poor rule efficiency. Highly efficient
rules are frequently used whereas low efficiency rules apply only a few times or never
at all. If rules are one-off translations with low efficiency, then it is unlikely a fixed rule
set will be effective in general. However, as illustrated in Figure 5.13, most programs
have fewer than a few thousand rules and fewer than a hundred generalized rules.
Rule explosion is from only a few programs interacting poorly with the optimizer.
Code sharing is common through shared libraries, so it is reasonable to expect
rules to be shared as well. Figure 5.12 counts the frequency of rules found across
programs and confirms sharing. There are 41795 shared rules out of a total of 240052
rules; 17% of rules are shared. The most common rule, with 2035 programs, is an
equality lifting rule, (= −132 (concat − 124 x8)) → (= −18 x8), which appears to
stem from system call error condition handling code.

CHAPTER 5. EXPRESSION OPTIMIZATION FROM PROGRAM PATHS 135
1
10
100
1000
0 50000 100000 150000 200000
Nu
mb
er
of
Pro
gra
ms w
ith
Ru
le
Rule
Rule Sharing Across Programs
Figure 5.12: Program rule sharing.
1
10
100
1000
10000
100000
0 500 1000 1500 2000
Nu
mb
er
of
Ru
les
Sorted Program
Number of Rules Found Across Programs
Total RulesSubtree-Eliminated Rules
Constant-Constrained Rules
Figure 5.13: Rules for measured programs.
CHAPTER 5. EXPRESSION OPTIMIZATION FROM PROGRAM PATHS 136
5.8 Related Work
Peephole optimizers using a SAT solver to find optimal short instruction sequences
on machine code are well-known [9, 93]. Expression optimization with reduction rules
shares a similar goal by seeking minimal operations. The benefit of applying opti-
mization at the expression level over the instruction level is rules can path-specialize
expressions regardless of the underlying code.
For compilers, HOP [46] automatically generated peephole rules by using a for-
mal specification of the target machine. PO [54] simulates runs of register transfers
symbolically, using primitive abstract interpretation. It speculatively translates the
combined effects back into assembly code. If successful, it replaces the original with
the shorter code segment. HOP improved PO by using skeletal hashes to memoize
the rewrite rules for a faster peephole optimizer.
STOKE [118] randomly mutates instruction sequences for high-performance code
kernels. As in this system, candidate optimizations are sampled as a quick sanity
check, then verified using an SMT solver. Like sampling with the EquivDB, the
approach is incomplete in that does not guarantee an optimal instruction sequence
will be found. However, on account of synthesis and optimization costs, the STOKE
system works best when optimizing a small set of important benchmarks rather than
optimizing a wide classes of expressions as they appear in a symbolic executor.
Prior work on symbolic execution uses rule-based term rewriting for optimizing
solver queries. F-Soft [123] applies a term writing system [40] to expressions generated
through symbolic interpretation of C sources. The term rewriting system is seeded
with a hundreds of handwritten rules from formal systems (e.g., Presburger arith-
metic, equational axiomatization), was applied to a handful of programs, and found
improved solver times. However, from the total rules observed in our system and
comparatively poor performance of hand-written rules in klee, we believe manual
rule entry alone is best suited to carefully selected workloads.

Chapter 6
Symbolically Executed Memory
Management Unit
6.1 Introduction
Generally symbolic executors explore a program by applying the target’s instructions
to a mix of symbolic and concrete data. Symbolically executed instructions manip-
ulate expressions (e.g., 5, (x + 4), (y + z − 1)) as data. These expressions require
semantics beyond a traditional concrete execution model. Notably, an executor must
process memory accesses on both symbolic and concrete pointers.
A memory access is symbolic if its address expression contains a variable. To
illustrate, Figure 6.1 demonstrates some symbolic accesses in the C language. Under
symbolic execution, the function f accesses memory data with two symbolic addresses,
s[w] and s[r], both of which can resolve to any location in the array s; symbolic values
can resolve to multiple values and therefore symbolic pointers can point to multiple
addresses. Initially, s is zeroed by line 1. Assigning 1 to the symbolic s[w] on line
5 makes all values in s depend on w since any element may absorb the symbolic
write. The following symbolic read on line 6, s[r], returns an expression containing
the symbolic read index r and the symbolic write index w. Continuing to build on
s with symbolic accesses creates large expressions which eventually overwhelm the
executor’s satisfiability solver.
137

CHAPTER 6. SYMBOLICALLY EXECUTEDMEMORYMANAGEMENTUNIT138
1 char s [ 2 5 6 ] = {0 , . . . , 0} ;2 char f (void ) {3 int r = sym range (0 , 2 55 ) ;4 int w = sym range (0 , 2 55 ) ;5 s [w] = 1 ;6 return s [ r ] ; }
Line New Expression
1(0, ..., 0)
5((if (= w 0) 1 0), ...,
(if (= w 255) 1 0))
6(read r
((if (= w 0) 1 0), ...,
(if (= w 255) 1 0))
Figure 6.1: Symbolic memory access example code and its intermediate expressions.
A large body of work discusses symbolic execution [28, 30, 34, 58, 59, 77, 92,
119, 131] and related memory access techniques. All symbolic executors must handle
symbolic accesses; an access policy applies constraints, optimizations, or analysis
on the memory access. Such policies are built into the executor and must contend
with complicated low-level details. We claim access policy belongs in a symbolically
executed runtime library.
This chapter presents a symMMU, a runtime memory access dispatcher for sym-
bolic execution. A symMMU reroutes accesses to a runtime library which evaluates
symbolic state in situ. Runtime libraries meet desirable criteria:
• Variety of access policies, such as which addresses are accessed and how those
accesses are structured, and analysis policies, such as heap violation checking
and execution on demand-allocated symbolic buffers.
• Simplicity of implementation. Library code is short, high-level policies are free
of low-level executor details, and core system changes are non-invasive.
• Performance equal to or better than a hard-coded symbolic executor memory
access dispatcher.
This system makes several advances over the current state of the art. At a design
level, it cleanly separates mechanism (library call-out for memory accesses) and policy
(library implementation of access resolution); the symMMU supports six well-known
symbolic access policies with few lines of code. To our knowledge the symMMU’s
profiler, which symbolically tracks address hits, and heap analysis, which finds over

CHAPTER 6. SYMBOLICALLY EXECUTEDMEMORYMANAGEMENTUNIT139
a thousand heap violations, are the first applications of purely symbolically executed
shadow memory. Additionally, it is the first system to test unmodified machine
code libraries with demand allocated symbolic buffers, which we use to find func-
tional differences among several distinct libc implementations. Finally, results are
tested independently of the symMMU to confirm the symbolic execution agrees with
physical hardware; this produces thousands of high-confidence faulting test cases by
automatically pruning false positives.
The rest of this chapter is structured as follows. Section 6.2 discusses background
for memory accesses and symbolic execution. Section 6.3 describes the symMMU
memory access dispatch mechanism in the context of a symbolic executor’s state
memory subsystem. Section 6.4 continues by detailing several policies and analysis
techniques supported by the symMMU system. Section 6.5 evaluates the implementa-
tion of the dispatch and policies with benchmarks and a large set of Linux programs.
Finally, Section 6.6 concludes.
6.2 Background
This section provides background information on handling memory accesses, symbolic
execution systems, and a formal description of symbolic memory accesses.
6.2.1 Related Work
The symMMU touches a wide range of memory access translation topics. At a low
level, address translation in hardware memory management units (MMUs) and op-
erating systems (virtual memory) have software controlled, adjustable policies [3, 53,
128]. For software testing, memory access instrumentation plays an important role
in dynamic analysis [100, 101, 117, 136]. All symbolic executors handle symbolic
accesses but memory subsystems and analysis approaches differ across systems.
The usefulness of software-defined memory translation has long been acknowl-
edged. RISC architectures, such as MIPS and SPARC, provide mechanisms for soft-
ware translation lookaside buffer (TLB) handling; accesses fault into software handlers
CHAPTER 6. SYMBOLICALLY EXECUTEDMEMORYMANAGEMENTUNIT140
which map virtual addresses to physical addresses. Software TLBs have a large design
space and varying performance characteristics [128]. Operating systems designers also
recognize the importance of customization with virtual memory page-faults [3, 53].
The symMMU TLB mechanism (§ 6.3.2) shares a similar interface to software TLBs.
Many dynamic program analysis algorithms rely on custom memory access han-
dling. Metadata for these algorithms is often stored in shadow memory [99, 137]. This
metadata includes lock sets [117], vector clocks [136], heap allocation [100], and in-
formation flow [101]. Section 6.4.2 describes a symbolic extension of shadow memory
for partial heap checking.
The symMMU supports and extends prior work on symbolic execution. Despite
running in a symbolic environment, a natural setting for expressing symbolic poli-
cies, symbolically executed runtime code has primarily only modeled specific system
environments [86, 116], rather than core system functionality. Meanwhile, the sym-
bolic access policies (§ 6.4.1) in contemporary symbolic execution systems are quite
diverse but also hard-coded. These policies include pointer concretization [58, 92],
prioritized concretization [30], symbolic indexing on objects [28, 29, 52], and variable
creation [59, 131]. Another policy tags floating-point expressions to report errors
on dereference [57]. Other systems lazily initialize or demand allocate accesses on
symbolic pointers [75, 110] (§ 6.4.3). Woodpecker [44] can instrument accesses like
a symMMU but only with built-in checkers. Likewise, FIE [45]’s memory smudging
and special memory IO regions could be expressed as symMMU policies, but are built
into the executor.
6.2.2 Symbolic Execution and Memory Accesses
A dynamic symbolic executor dispatches instructions to advance symbolic program
states. Each state has an address space, data memory, and other resources. When
an instruction must dereference state memory for a load or store, the executor issues
a memory access to a software memory management unit that controls the state’s
address space.
A memory access is defined by a 5-tuple (S, s, w, i, v). The access tuple consists

CHAPTER 6. SYMBOLICALLY EXECUTEDMEMORYMANAGEMENTUNIT141
of a state S (including its address space and constraints), a base pointer s, the access
width w in bytes, the access instruction i, and an optional write value v. The access
width w and instruction i are single-valued concrete data. The write value v and
pointer s are expressions which may be symbolic.
Symbolic accesses require formal attention in order to have a precise discussion.
Let a symbolic pointer s be an element of the set of pointer-width expressions on
bit-vectors. Accessing an address space, a set of disjoint address ranges, through s
assumes the constraints of the issuing state S. When s is a symbolic pointer, p ∈ s[S]
denotes p is a feasible concrete value for s (i.e., (= s p) is satisfiable given S with
p ∈ N). If p feasibly maps into S’s address space, then p ∈ S. For a range of pointers
[p, p+n), the subset relation [p, p+n) ⊆ S is shorthand for the existence of a feasible
solution for the conjunction p ∈ S ∧ ... ∧ p+ n− 1 ∈ S.
Any address not mapped in a state S’s address space is a bad address for S.
Typically an access to a bad address is flagged as an error with an accompanying
concrete test case. If the test raises a memory access fault under native execution,
then the test describes a true bug. For our purposes, we ignore access permissions
(e.g., read-only) on particular regions of memory since distinct permissions can be
modeled with multiple address spaces used according to the access type i.
The executor issues solver queries to determine whether a symbolic access is in S.
An access (S, s, w, i, v) belongs to exactly one of three categories:
• Valid. No faults; p ∈ s[S] =⇒ [p, p+ w) ∈ S.
• Invalid. All faults; p ∈ s[S] =⇒ [p, p+ w) 6⊆ S.
• Contingent. Some faults; ∃p1, p2 ∈ s[S] where
[p1, p1 + w) ⊆ S, [p2, p2 + w) 6⊆ S.
Contingent accesses tend to impose the most overhead. A complete symbolic
executor finds all permissible accesses and generates at least one test case for a bad
access. To find non-faulting accesses, a solver call is submitted for every feasible
memory object to check for pointer inclusion. Remaining feasible pointer values
imply a bad access.
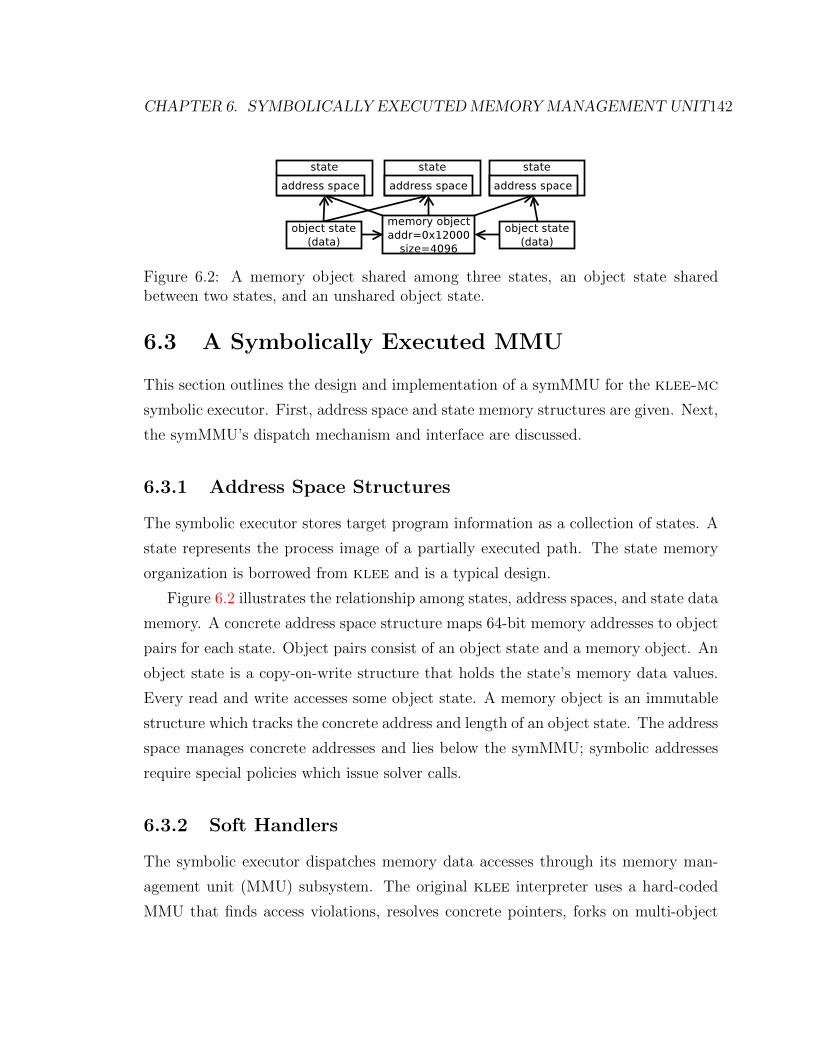
CHAPTER 6. SYMBOLICALLY EXECUTEDMEMORYMANAGEMENTUNIT142
Figure 6.2: A memory object shared among three states, an object state sharedbetween two states, and an unshared object state.
6.3 A Symbolically Executed MMU
This section outlines the design and implementation of a symMMU for the klee-mc
symbolic executor. First, address space and state memory structures are given. Next,
the symMMU’s dispatch mechanism and interface are discussed.
6.3.1 Address Space Structures
The symbolic executor stores target program information as a collection of states. A
state represents the process image of a partially executed path. The state memory
organization is borrowed from klee and is a typical design.
Figure 6.2 illustrates the relationship among states, address spaces, and state data
memory. A concrete address space structure maps 64-bit memory addresses to object
pairs for each state. Object pairs consist of an object state and a memory object. An
object state is a copy-on-write structure that holds the state’s memory data values.
Every read and write accesses some object state. A memory object is an immutable
structure which tracks the concrete address and length of an object state. The address
space manages concrete addresses and lies below the symMMU; symbolic addresses
require special policies which issue solver calls.
6.3.2 Soft Handlers
The symbolic executor dispatches memory data accesses through its memory man-
agement unit (MMU) subsystem. The original klee interpreter uses a hard-coded
MMU that finds access violations, resolves concrete pointers, forks on multi-object
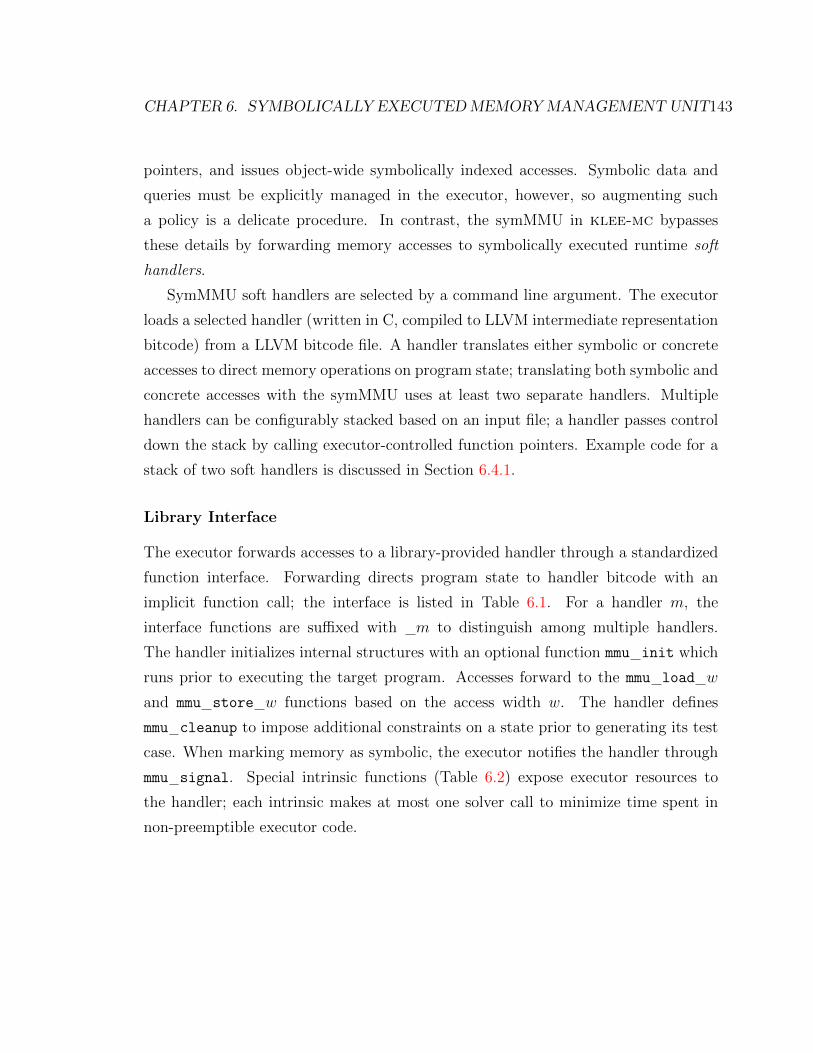
CHAPTER 6. SYMBOLICALLY EXECUTEDMEMORYMANAGEMENTUNIT143
pointers, and issues object-wide symbolically indexed accesses. Symbolic data and
queries must be explicitly managed in the executor, however, so augmenting such
a policy is a delicate procedure. In contrast, the symMMU in klee-mc bypasses
these details by forwarding memory accesses to symbolically executed runtime soft
handlers.
SymMMU soft handlers are selected by a command line argument. The executor
loads a selected handler (written in C, compiled to LLVM intermediate representation
bitcode) from a LLVM bitcode file. A handler translates either symbolic or concrete
accesses to direct memory operations on program state; translating both symbolic and
concrete accesses with the symMMU uses at least two separate handlers. Multiple
handlers can be configurably stacked based on an input file; a handler passes control
down the stack by calling executor-controlled function pointers. Example code for a
stack of two soft handlers is discussed in Section 6.4.1.
Library Interface
The executor forwards accesses to a library-provided handler through a standardized
function interface. Forwarding directs program state to handler bitcode with an
implicit function call; the interface is listed in Table 6.1. For a handler m, the
interface functions are suffixed with m to distinguish among multiple handlers.
The handler initializes internal structures with an optional function mmu init which
runs prior to executing the target program. Accesses forward to the mmu load w
and mmu store w functions based on the access width w. The handler defines
mmu cleanup to impose additional constraints on a state prior to generating its test
case. When marking memory as symbolic, the executor notifies the handler through
mmu signal. Special intrinsic functions (Table 6.2) expose executor resources to
the handler; each intrinsic makes at most one solver call to minimize time spent in
non-preemptible executor code.
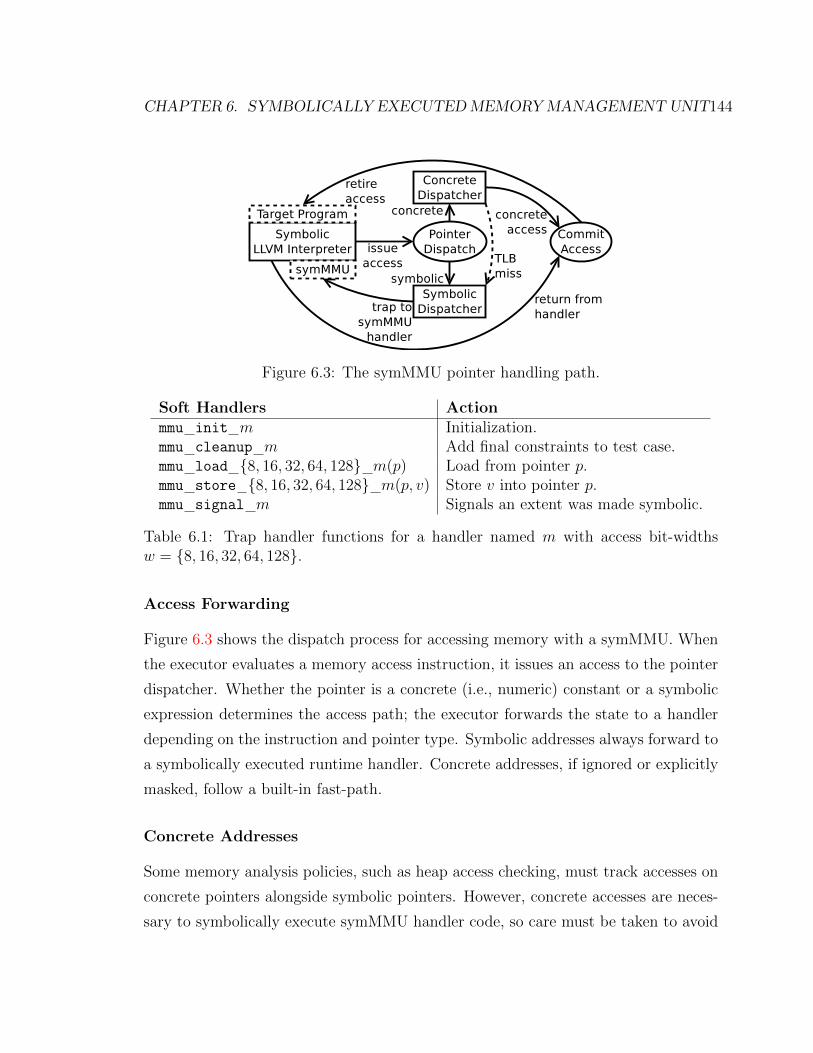
CHAPTER 6. SYMBOLICALLY EXECUTEDMEMORYMANAGEMENTUNIT144
Figure 6.3: The symMMU pointer handling path.
Soft Handlers Actionmmu init m Initialization.mmu cleanup m Add final constraints to test case.mmu load {8, 16, 32, 64, 128} m(p) Load from pointer p.mmu store {8, 16, 32, 64, 128} m(p, v) Store v into pointer p.mmu signal m Signals an extent was made symbolic.
Table 6.1: Trap handler functions for a handler named m with access bit-widthsw = {8, 16, 32, 64, 128}.
Access Forwarding
Figure 6.3 shows the dispatch process for accessing memory with a symMMU. When
the executor evaluates a memory access instruction, it issues an access to the pointer
dispatcher. Whether the pointer is a concrete (i.e., numeric) constant or a symbolic
expression determines the access path; the executor forwards the state to a handler
depending on the instruction and pointer type. Symbolic addresses always forward to
a symbolically executed runtime handler. Concrete addresses, if ignored or explicitly
masked, follow a built-in fast-path.
Concrete Addresses
Some memory analysis policies, such as heap access checking, must track accesses on
concrete pointers alongside symbolic pointers. However, concrete accesses are neces-
sary to symbolically execute symMMU handler code, so care must be taken to avoid
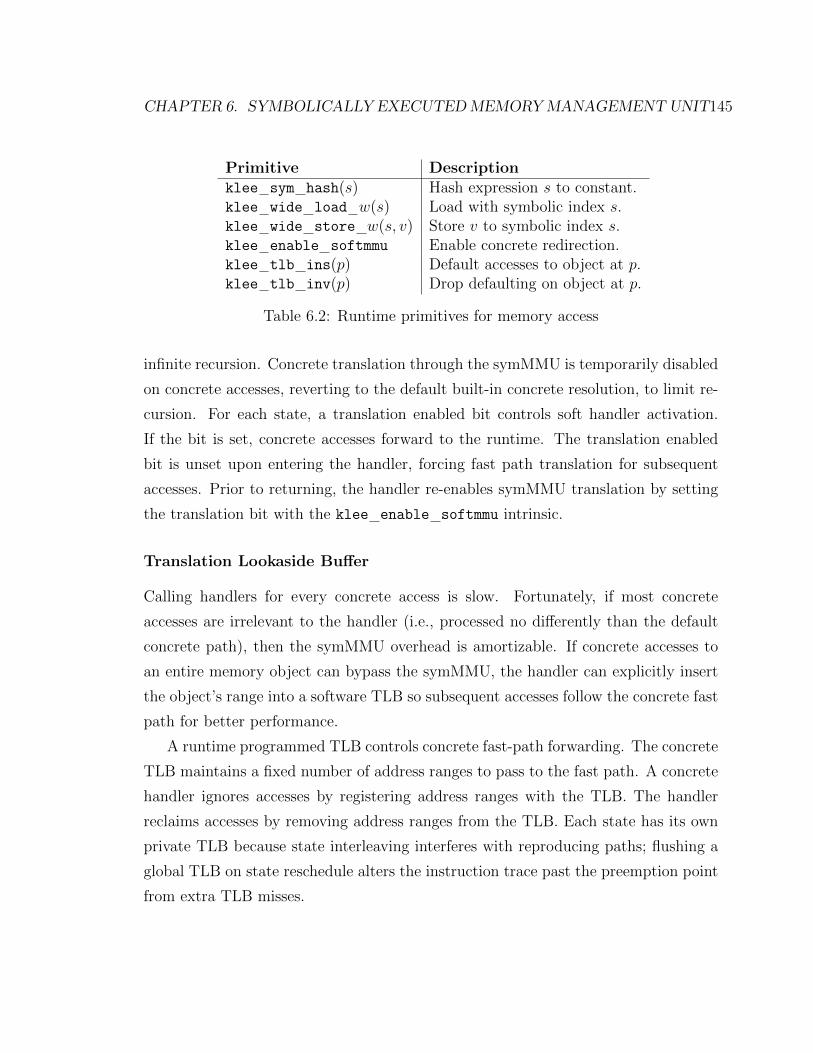
CHAPTER 6. SYMBOLICALLY EXECUTEDMEMORYMANAGEMENTUNIT145
Primitive Descriptionklee sym hash(s) Hash expression s to constant.klee wide load w(s) Load with symbolic index s.klee wide store w(s, v) Store v to symbolic index s.klee enable softmmu Enable concrete redirection.klee tlb ins(p) Default accesses to object at p.klee tlb inv(p) Drop defaulting on object at p.
Table 6.2: Runtime primitives for memory access
infinite recursion. Concrete translation through the symMMU is temporarily disabled
on concrete accesses, reverting to the default built-in concrete resolution, to limit re-
cursion. For each state, a translation enabled bit controls soft handler activation.
If the bit is set, concrete accesses forward to the runtime. The translation enabled
bit is unset upon entering the handler, forcing fast path translation for subsequent
accesses. Prior to returning, the handler re-enables symMMU translation by setting
the translation bit with the klee enable softmmu intrinsic.
Translation Lookaside Buffer
Calling handlers for every concrete access is slow. Fortunately, if most concrete
accesses are irrelevant to the handler (i.e., processed no differently than the default
concrete path), then the symMMU overhead is amortizable. If concrete accesses to
an entire memory object can bypass the symMMU, the handler can explicitly insert
the object’s range into a software TLB so subsequent accesses follow the concrete fast
path for better performance.
A runtime programmed TLB controls concrete fast-path forwarding. The concrete
TLB maintains a fixed number of address ranges to pass to the fast path. A concrete
handler ignores accesses by registering address ranges with the TLB. The handler
reclaims accesses by removing address ranges from the TLB. Each state has its own
private TLB because state interleaving interferes with reproducing paths; flushing a
global TLB on state reschedule alters the instruction trace past the preemption point
from extra TLB misses.

CHAPTER 6. SYMBOLICALLY EXECUTEDMEMORYMANAGEMENTUNIT146
6.4 Access Policies and Analysis
Our symMMU supports a variety of access policies. For symbolic accesses, the choice
of policy affects solver overhead, state dilation, and testing completeness. We use the
symMMU’s capability to observe all accesses to extend the executor with new modes
of analysis on programs. Two new extensions, symbolic access profiling and heap
checking, use shadow memory to track metadata for every access. Another extension,
unconstrained execution, demand allocates memory buffers by access to dynamically
infer argument structure from program function behavior.
6.4.1 Symbolic Access Translation
A symbolic access may resolve to multiple addresses. The choice of access policy
influences the performance and completeness of symbolic accesses. We consider two
types of policies: partial and full. Partial policies transform pointers and check for
properties, but only occasionally dispatch an access and must be stacked. Full policies,
situated at the bottom of a handler stack, always dispatch an access.
Excessive Range Checking
A symbolic pointer s potentially generates many states because it may be unbound.
Following through on every precise address where an unbound pointer access lands is
expensive and usually uninformative; it suffices to know the set of feasible pointers
{p | p ∈ s[S]} is large. Range checking finds excessively stray accesses; if s feasibly
exceeds a sensible distance (we use 256MB) from some p ∈ s[S], then the access is
flagged, otherwise the access continues down the stack.
Figure 6.4 lists a partial symbolic 8-bit load soft-handler, mmu load 8 rangechk,
which checks the range of a symbolic pointer s. First, the handler issues a solver
request in testptr invalid to find a p ∈ s[S], then builds a symbolic range check
for s. When s covers an extreme range, the state forks on the if into an out-of-
range and an in-range state because testptr invalid(s) is feasibly both true and
false. The out-of-range state is assumed to fault and is reported. The in-range state
proceeds down the stack to the next handler via the function pointer mo load 8.

CHAPTER 6. SYMBOLICALLY EXECUTEDMEMORYMANAGEMENTUNIT147
MMUOPS S EXTERN( rangechk ) ; /∗ se tup s t a c k s t r u c t u r e s ∗/#define MAXRANGE (( ptrdiff t )0 x10000000 )
stat ic int t e s t p t r i n va l i d ( intptr t s ) {intptr t p = klee get value ( s ) ;ptrdiff t d = s − p ;return ( s<0x1000 ) | (d > MAXRANGE) | (−d > MAXRANGE) ;
}
uint8 t mmu load 8 rangechk (void∗ s ) {/∗ t e s t f o r e x c e s s i v e range ∗/i f ( t e s t p t r i n va l i d ( ( intptr t ) s ) )
k l ee uer ror ( ”bad range ! ” , ” ptr . e r r ” ) ;/∗ proceed down the s t a c k ∗/return MMUOPS S( rangechk ) . mo next−>mo load 8( s ) ;
}
Figure 6.4: Range checking handler for 8-bit loads.
Constant Symbolic Pointer Resolution
Concrete accesses are cheaper than symbolic. If the state’s path constraints for a
symbolic address to have exactly one solution, every future access can be concrete.
When p1, p2 ∈ s[S] =⇒ p1 = p2, constant symbolic pointer resolution replaces every
s with p1 and dispatches the concrete access.
Create Variable
Relaxing precise memory content can simplify symbolic access complexity with state
overapproximation at the cost of producing false positives. In this case, reading from
a symbolic pointer s returns a fresh symbolic variable v. To reduce overhead, our
implementation keeps a mapping from old symbolic pointers to their variables. Since
this policy is blatantly unsound (suppose ∀p ∈ s[S].v 6= ∗p) klee-mc never uses
it in practice. However, similar strategies appear elsewhere [45, 59, 131], indicating
that some consider it a worthwhile policy, so it is included for completeness and to
demonstrate the symMMU’s flexibility.
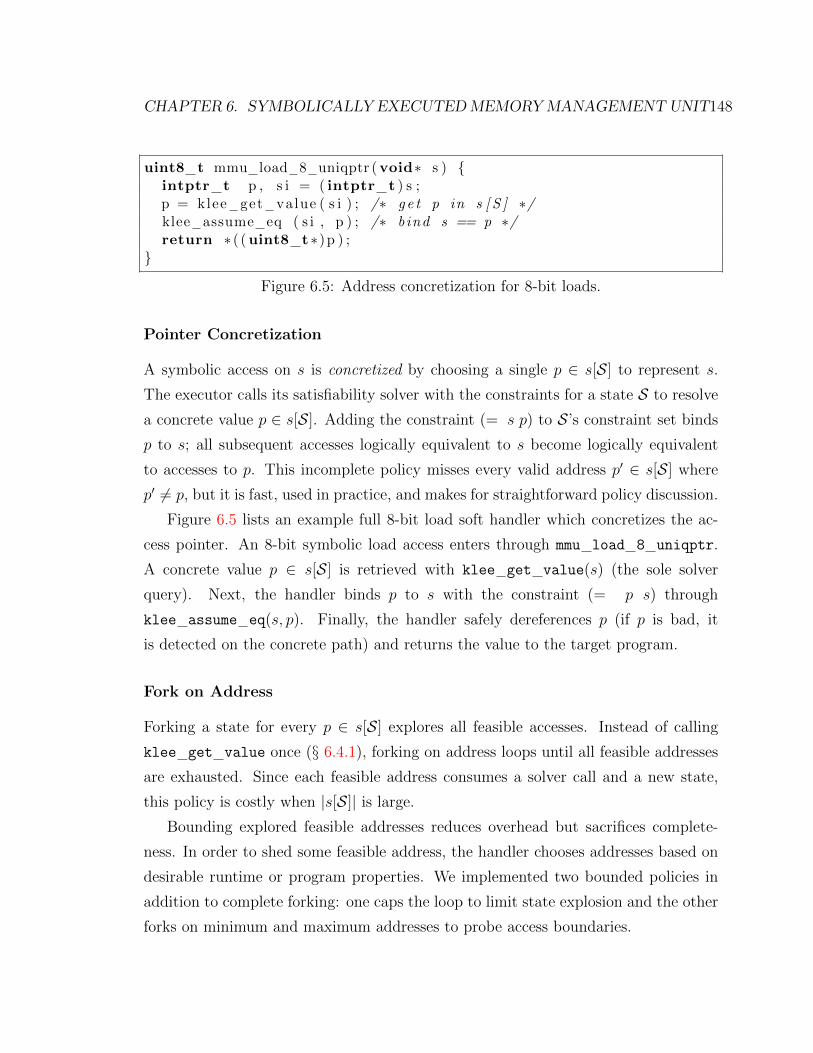
CHAPTER 6. SYMBOLICALLY EXECUTEDMEMORYMANAGEMENTUNIT148
uint8 t mmu load 8 uniqptr (void∗ s ) {intptr t p , s i = ( intptr t ) s ;p = klee get value ( s i ) ; /∗ ge t p in s [ S ] ∗/klee assume eq ( s i , p ) ; /∗ bind s == p ∗/return ∗ ( (uint8 t∗)p ) ;
}
Figure 6.5: Address concretization for 8-bit loads.
Pointer Concretization
A symbolic access on s is concretized by choosing a single p ∈ s[S] to represent s.
The executor calls its satisfiability solver with the constraints for a state S to resolve
a concrete value p ∈ s[S]. Adding the constraint (= s p) to S’s constraint set binds
p to s; all subsequent accesses logically equivalent to s become logically equivalent
to accesses to p. This incomplete policy misses every valid address p′ ∈ s[S] where
p′ 6= p, but it is fast, used in practice, and makes for straightforward policy discussion.
Figure 6.5 lists an example full 8-bit load soft handler which concretizes the ac-
cess pointer. An 8-bit symbolic load access enters through mmu load 8 uniqptr.
A concrete value p ∈ s[S] is retrieved with klee get value(s) (the sole solver
query). Next, the handler binds p to s with the constraint (= p s) through
klee assume eq(s, p). Finally, the handler safely dereferences p (if p is bad, it
is detected on the concrete path) and returns the value to the target program.
Fork on Address
Forking a state for every p ∈ s[S] explores all feasible accesses. Instead of calling
klee get value once (§ 6.4.1), forking on address loops until all feasible addresses
are exhausted. Since each feasible address consumes a solver call and a new state,
this policy is costly when |s[S]| is large.
Bounding explored feasible addresses reduces overhead but sacrifices complete-
ness. In order to shed some feasible address, the handler chooses addresses based on
desirable runtime or program properties. We implemented two bounded policies in
addition to complete forking: one caps the loop to limit state explosion and the other
forks on minimum and maximum addresses to probe access boundaries.

CHAPTER 6. SYMBOLICALLY EXECUTEDMEMORYMANAGEMENTUNIT149
Prioritized Concretization
Blindly concretizing a symbolic read access potentially overconstrains the fetched
value. Prioritized concretization searches for feasible addresses p ∈ s[S] such that the
data that p points to is symbolic. If there is such a p, then s is concretized to p, and
the symbolic value is returned.
Fork on Objects
The default klee policy (and similar policies [30, 52]) forks on feasible memory
objects, issuing object-wide accesses over symbolic arrays. When a symbolic access
falls within a spatially local region (e.g., a page), the access can be efficiently folded
into an expression as in Figure 6.1. Assuming this locality, forking for every feasible
memory object with symbolic indexing reduces the total forked states in exchange for
larger and potentially more expensive queries.
The fork-on-object policy forks a state for every memory object covered by a
symbolic memory access at s. For every memory object, a wide memory access
symbolically indexes the object state. Wide write accesses create large expressions
containing update lists for the object at the time of write. Most memory objects are
page-sized so our implementation uses a faster and simpler forking algorithm than
klee’s binary search. Objects are enumerated by forking on unique page pointers
(p&∼4095) ∈ (s&∼4095)[S]. If a feasible object is smaller than a page, the handler
iterates over objects in order until the next page boundary. Wide accesses on these
objects are explicitly constructed; the handler uses klee wide intrinsics to issue
symbolically indexed accesses. Although the system could conceivably symbolically
index multiple objects per forked state, a distinct policy in its own right, it is unclear
how many objects at once would give the best query performance relative to total
states forked.
If-Then-Else Reads
A symbolic indexed read on an object state leads to unnecessary array overhead in
the solver when the feasible pointer set size |s[S]| is much smaller than the object.
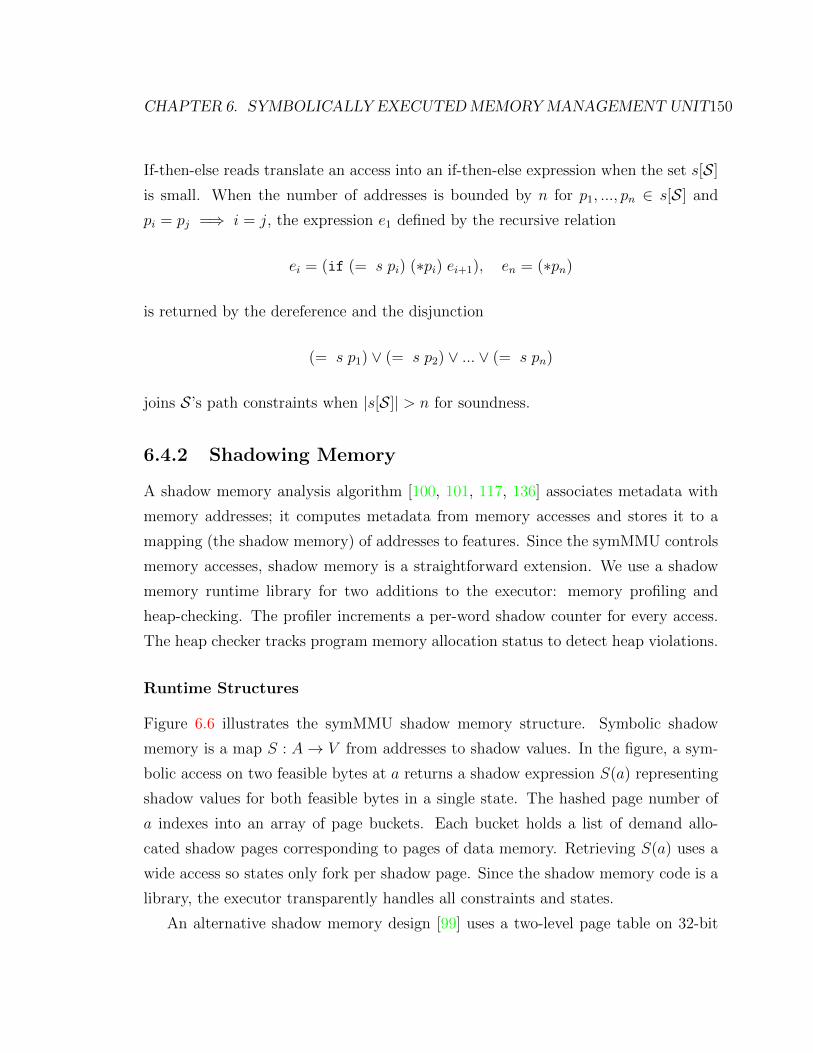
CHAPTER 6. SYMBOLICALLY EXECUTEDMEMORYMANAGEMENTUNIT150
If-then-else reads translate an access into an if-then-else expression when the set s[S]
is small. When the number of addresses is bounded by n for p1, ..., pn ∈ s[S] and
pi = pj =⇒ i = j, the expression e1 defined by the recursive relation
ei = (if (= s pi) (∗pi) ei+1), en = (∗pn)
is returned by the dereference and the disjunction
(= s p1) ∨ (= s p2) ∨ ... ∨ (= s pn)
joins S’s path constraints when |s[S]| > n for soundness.
6.4.2 Shadowing Memory
A shadow memory analysis algorithm [100, 101, 117, 136] associates metadata with
memory addresses; it computes metadata from memory accesses and stores it to a
mapping (the shadow memory) of addresses to features. Since the symMMU controls
memory accesses, shadow memory is a straightforward extension. We use a shadow
memory runtime library for two additions to the executor: memory profiling and
heap-checking. The profiler increments a per-word shadow counter for every access.
The heap checker tracks program memory allocation status to detect heap violations.
Runtime Structures
Figure 6.6 illustrates the symMMU shadow memory structure. Symbolic shadow
memory is a map S : A→ V from addresses to shadow values. In the figure, a sym-
bolic access on two feasible bytes at a returns a shadow expression S(a) representing
shadow values for both feasible bytes in a single state. The hashed page number of
a indexes into an array of page buckets. Each bucket holds a list of demand allo-
cated shadow pages corresponding to pages of data memory. Retrieving S(a) uses a
wide access so states only fork per shadow page. Since the shadow memory code is a
library, the executor transparently handles all constraints and states.
An alternative shadow memory design [99] uses a two-level page table on 32-bit
CHAPTER 6. SYMBOLICALLY EXECUTEDMEMORYMANAGEMENTUNIT151
Figure 6.6: Retrieving a disjunction of shadow values for a symbolic address.
addresses. An address indexes the table through two levels of indirection to retrieve
a shadow page in constant time. In practice, the symMMU shadow memory buckets
remain small so linear time overhead is negligible compared to the extra levels of
indirection or auxiliary tables needed for 64-bit addresses. Likewise, memory objects
are usually page-sized so wide accesses split into multiple states regardless of the data
structure.
Access Profiling
An access profiler can help a programmer find memory hot spots or understand cache
behavior. We developed a profiler to count symbolic accesses on each address. The
profiler keeps shadow counters for memory addresses on every state; every symbolic
access increments a set of feasible counters.
Unlike a traditional profiler, symbolic shadow state influences the profiler results.
For instance, a complete symbolic byte store on s[S] = {p, p+1} touches two memory
locations, p and p+ 1. Storing to two feasible memory locations updates two shadow
counters within a single state; the shadow counters become symbolic via symbolic
write. The profiler is free to choose any feasible counter value. In our implementation,
the profiler greedily increases memory coverage by choosing p ∈ s[S] when S(p) = 0
and assuming S(x) > 0 on path termination (when feasible) for all addresses x.

CHAPTER 6. SYMBOLICALLY EXECUTEDMEMORYMANAGEMENTUNIT152
Profiling also demonstrates the importance of guarding against recursion. A sym-
bolic access leads to a shadow counter update on multiple feasible shadow counters;
the shadow counter address is symbolic. Incrementing the counter through a sym-
bolic pointer triggers another profiling event in the software handler causing an infinite
loop. To prevent hanging, a flag guards against profiler handler reentrance.
Heap Checking
Heap access violations are common errors in system programs. A program accesses
freed or uninitialized heap data with little immediate consequence but eventual state
corruption. Dynamic analysis algorithms [66, 100] detect these errors at the point of
violation with shadow memory. The symMMU extends the memcheck algorithm [100]
to binary symbolic execution with incomplete heap information.
Symbolically processing heap memory accesses exploits pointer reach knowledge
lost to concrete test cases. Although symbolically derived tests are compatible with
traditional heap violation detection algorithms [59], concrete testing alone leads to
false negatives. Consider a read from a buffer b, initialized up to some n, at a symbolic
offset i ≤ n. For a concrete test, i may be chosen such that b[i] is initialized (i < n),
missing the error. Under symbolic analysis b[i] is both initialized and uninitialized so
the error is modeled.
The heap checker models the heap as the program runs. A set of disjoint address
ranges (heap blocks) [a, a+n) ∈ H tracks a state’s current heap H. When a program
allocates a heap block b, the checker adds b to H. If a pointer p ∈ s[S] is in H,
∃b ∈ H. p ∈ b, then s is a feasible heap address.
An access is checked by observing the shadow value for each accessed byte address.
Each byte is assigned two bits of shadow state representing its heap status (similar to
purify [66] and memcheck [100]). Each byte is assigned one of the following shadow
values:
• OK. Access is safe; may be a heap data.
• UNINIT. Heap address with uninitialized data.
• FREE. Former heap address.
Figure 6.7 illustrates the finite state machine which manages the heap status.

CHAPTER 6. SYMBOLICALLY EXECUTEDMEMORYMANAGEMENTUNIT153
Initially, accesses default to OK; the tracked heap is set to empty. To avoid overhead
from repeatedly calling the symMMU, long, contiguous OK ranges are inserted into the
concrete address pass-through TLB. When the program acquires a pointer p through
an allocation function (e.g., malloc(n)), the heap checker intercepts the call, records
the allocated block and marks the shadow memory for [p, p + n) as UNINIT. When
p is deallocated with a call free(p), the heap checker retrieves p’s length n, marks
[p, p+ n) as FREE, and drops the [p, p+ n) record from H.
Figure 6.7: The memcheck shadow state machine.
The heap checker detects three heap violations:
Dangling Accesses. An access to freed heap memory is a dangling access. This
violates the heap discipline because all heap accesses from client code should reference
allocated memory; if a program accesses freed memory, it may corrupt state or retrieve
an unexpected value. A handler reports a dangling access whenever an access can
feasibly resolve to a FREE shadow value.
Uninitialized Reads. The contents of the heap are undefined on allocation.
Reads from freshly allocated uninitialized memory produces undefined behavior. If a
read access pointer feasibly maps to UNINIT, the heap checker produces a test case
for an uninitialized read.
Double Frees. Each heap allocation pairs with at most one deallocation. Fea-
sibly deallocating memory twice consecutively causes the heap checker to terminate
the state and report a double free. Early termination has a performance benefit by
skipping the double-free detection error path in libc.

CHAPTER 6. SYMBOLICALLY EXECUTEDMEMORYMANAGEMENTUNIT154
6.4.3 Unconstrained Pointers
Unconstrained execution [50, 68, 75, 110] tests functions rather than full programs.
Instead of trying to reach a specific function through a path from the beginning of a
program, the symbolic executor jumps directly to the target function, lazily initializ-
ing pointer arguments with symbolic data. These unconstrained pointers initialize on
first access, expand as needed, are relocatable, and require no type information. We
describe handlers written for the symMMU which manage unconstrained pointers.
An unconstrained pointer is a special symbolic pointer defined by the way it is
accessed on a path. Rather than having a concrete address in memory, accessing an
unconstrained pointers maps to a demand allocated buffer. All pointers passed to a
target function for unconstrained execution are unconstrained. To avoid false posi-
tives for memory access faults, the executor optimistically assumes symbolic pointers
are valid. Initially accessing an unconstrained symbolic pointer u demand allocates
unconstrained memory buffers with symbolic data to back u. These buffers have
concrete physical length, associated with the allocated backing buffer, as well as a
symbolic virtual length, based on precise observed range of access, which facilitates
expansion. Subsequent accesses to u retrieve the same data through a consistent
translation map. The translation map routes structurally distinct, but semantically
nearby, unconstrained pointers to the same buffer. Finally, unconstrained pointers
resolve to concrete pointers to generate a test case.
Translation Entries
To make unconstrained accesses optimistic, rather than unbounded and contingent,
the symMMU handlers must translate unconstrained pointers to buffers mapped into
the state’s address space. Figure 6.8 shows the organization of this translation. From
the top, unconstrained pointers map into a translation table by expression hash. The
translation table points to translation entries which each describe an unconstrained
pointer’s demand allocated memory buffer.
The translation table maps unconstrained pointers to translation entries by ad-
dress expression hash. A hash function h : E → {0, 1}64 from expressions to 64-bit

CHAPTER 6. SYMBOLICALLY EXECUTEDMEMORYMANAGEMENTUNIT155
Figure 6.8: Unconstrained pointer structures.
values maps a symbolic address u to the table for solverless lookup. Since u is sym-
bolic, it must have some variable subexpression (e.g., (select i a) reads the sym-
bolic array a at index i). The hash h function relies on the idea that distinct variable
subexpressions imply feasibly distinct pointers. For example, u =(select 0 x) and
u′ =(select 4 x) give h(u) 6= h(u′) because the values are feasibly unrelated. In
contrast, (add 1 (select 0 x)) and (add 2 (select 0 x)) refer to one base sym-
bolic pointer u and therefore hash equally; the difference is a small constant offset.
Theoretically this heuristic is unsound in that two distinct variable subexpressions
may hash equally, but this is never observed in practice.
A translation entry defines a demand allocated buffer for an unconstrained pointer,
maintaining both the buffer bounds and backing memory. The buffer centers around
a pivot u, the unconstrained pointer of the first access. The entry holds the buffer’s
concrete pointer p and its current concrete radius rc. For precise bounds, the entry
tracks the minimum umin and maximum umax access pointers. The difference between
umin and umax defines a symbolic radius r. Taking all entries, the ith entry has a
pivot ui and a symbolic radius ri. Pivots are ordered by entry, u0 < u1 < ... < uk,
when resolving to concrete addresses on path termination.
Demand Allocation
Unconstrained demand allocation has two phases. First, an initial access to a distinct
unconstrained pointer creates a translation entry and buffer around the pointer. Next,
CHAPTER 6. SYMBOLICALLY EXECUTEDMEMORYMANAGEMENTUNIT156
future accesses near the pointer expand the buffer keeping values and constraints from
prior accesses.
Buffer Initialization. An access to a new unconstrained pointer u allocates
space so future accesses are consistent. First, the soft handler determines u is dis-
tinct and distant from previously accessed unconstrained pointers. Next, the handler
creates a translation entry pivoted around u and allocates a buffer centered about u.
Finally, the access is serviced through the buffer and the target program proceeds.
If u has no translation, the runtime allocates an unconstrained buffer. First, a
translation entry keyed by h(u) is inserted into the table. A small initial buffer (16
bytes) filled with unconstrained symbolic data is allocated to a fresh translation entry.
Subsequent accesses around u route to the buffer through the access handlers.
Buffer Expansion Suppose an access to a pointer u′ based on an unconstrained
pointer s exceeds the bounds of the initially allocated buffer. By the optimistic access
policy, the buffer is extended when the distance from the buffer is reasonably short.
There are two cases: the fast case h(u′) = h(u) and the slow case h(u′) 6= h(u). The
fast case h(u′) = h(u) suffices to explain buffer extension; the h(u′) 6= h(u) case is
handled in Section 6.4.3.
When h(u′) = h(u), the runtime uses the translation entry for u. When the
distance between u and u′ is less than the buffer radius, |u−u′| < rc, there is no need
to extend the buffer. Otherwise, the buffer is copied to a new buffer with a radius
of 2rc; the buffer pointer and rc are updated in the translation entry to reflect the
expansion.
Aliasing
Two unconstrained pointers ui and uj may map to the same buffer, |ui − uj| < ri,
but hash unequally, h(ui) 6= h(uj). Having distinct translation entries for ui and uj
potentially assigns multiple values to one address, leading to nonsense paths from
an incoherent memory model. This incoherence is caused by aliasing; we outline our
method for efficiently resolving aliases.
An access to an unconstrained pointer u with an untranslated hash h(u) undergoes
alias resolution before acquiring a translation entry. First, the pointer u is tested for
CHAPTER 6. SYMBOLICALLY EXECUTEDMEMORYMANAGEMENTUNIT157
inclusion in the unconstrained arena [UC MIN, UC MAX) with an and mask; if u is
unconstrained, then UC MIN ≤ u < UC MAX is satisfiable. Next, the runtime tests
translation entry inclusion feasibility to resolve the entry for u. Inclusion testing relies
on the pivot ordering u0 < ... < un and entry ordering [ui−ri, ui+ri) < [uj−rj, uj+rj)when i < j. Hence, k = arg min
i(u′ ≤ ui + ri) implies u′ ∈ [uk − rk, uk + rk). If
k exists, the runtime updates the translation table to point h(u) to the entry for
h(uk). Inclusion testing may accrue additional aliases by forking new states where
ui − ri ≤ u′ < ui + ri for i > k. If there is no feasible entry, h(uk) is assigned its own
translation entry.
Concrete Address Assignment
A dereferenced unconstrained pointer eventually binds to a concrete address. The
runtime postpones address assignment by translating unconstrained pointers to a
backing buffer on the fly. To produce a concrete test case, the runtime uses the solver
to assign concrete addresses to pointers.
Premature address assignment unnecessarily constrains unconstrained pointers,
masking otherwise feasible paths. Consider the memcpy library call which copies
values in memory from a pointer u1 to a non-overlapping location starting at pointer
u2. A naıve memcpy loads a byte from u1, stores it to u2, then increments each
pointer. However, this implementation has needless overhead; multi-byte accesses
reduce the total iterations by at least half. Such multi-byte accesses incur additional
cost for unaligned addresses. Hence a fast memcpy uses distinct code depending on
the alignment (i.e., the lower bits) of u1 and u2. Eagerly assigning concrete addresses
to u1 and u2 drops the unaligned corner cases.
The pivots u0, ..., un are assigned concrete addresses on path termination. The
handlers control assignment by ordering pivots at time of first access and bounding
addresses within the unconstrained arena [UC MIN, UC MAX]. For the base case u0,
the constraints UC MIN ≤ u0 − r0 and u0 + r0 < UC MAX hold. In general, inserting
the kth pivot uk takes the constraints uk−1 + rk−1 < uk − rk and uk + rk < UC MAX.
A cleanup handler minimizes rk to keep buffer sizes small.

CHAPTER 6. SYMBOLICALLY EXECUTEDMEMORYMANAGEMENTUNIT158
MMU Dispatcher LoC.Original Built-in KLEE MMU 373Inst. SymMMU 229Built-in SymMMU 338Shared MMU Infrastructure 368
MMU Policy LoC.Deref. by Concretization 19Deref. by Address Forking 21Deref. by Object Forking 42Shadow Memory 397Access Profiler 65Heap Analysis 371Unconstrained Pointers 251
Table 6.3: Lines of code for MMU components.
6.5 Evaluation
This section evaluates the symMMU against the criteria set in Section 6.1. Simplicity
of the symMMU is quantified in terms of the implementation’s total lines of code.
Dispatch microbenchmarks and a comparison of discovered access faults on Linux
programs demonstrate the symMMU’s performance is competitive with a built-in
hard-coded MMU. Policy microbenchmarks, heap checking on programs, and uncon-
strained execution on libraries show the symMMU flexibly supports a useful variety
of access and analysis policies.
6.5.1 Implementation Complexity
Figure 6.3 shows the amount of code for each MMU to quantify relative implemen-
tation complexity. The line counts were calculated with SLOCcount [132] on the
relevant source files. The table is split between executor code (C++ compiled to bi-
nary) and runtime code (C compiled to LLVM bitcode). Of note, the baseline klee
MMU (373 lines) needs slightly more code than the symMMU (340 lines) implemen-
tation, suggesting the symMMU is simpler to implement.
6.5.2 Dispatch Mechanism
The design of the symMMU dispatch mechanism strongly influences its performance.
We use a microbenchmark to compare the built-in symMMU with instrumentation to
show explicit support for a symMMU is competitive with the baseline klee MMU and
CHAPTER 6. SYMBOLICALLY EXECUTEDMEMORYMANAGEMENTUNIT159
superior to instruction rewriting. Furthermore, we find the concrete TLB improves
symMMU performance on concrete workloads with low overhead.
Access Instrumentation
We compared concrete access overhead among the baseline klee MMU, the inter-
preter symMMU, and an instrumented symMMU to measure the concrete access per-
formance overhead from using a symMMU. The instrumented symMMU replaces all
target program loads and stores with runtime function calls which partition accesses
as concrete or symbolic and forward to the appropriate handler. Each MMU was
benchmarked with strcpy on 4096 bytes, repeated 10,000 times in a program. The
baseline MMU and built-in symMMU issued the same number of LLVM instructions,
since it has a built-in concrete access path, and used equal time. The instrumented
symMMU issued 2.3× as many instructions and took 1.8× longer to complete; calling
a handler on every program memory access is costly. Instrumentation is relatively
slower so we only use the built-in symMMU.
TLB
To measure the cost of concrete symMMU handling, we compared the performance
among the fast path, naıve handling, and TLB assistance using the benchmark from
Section 6.5.2. The concrete symMMU policy passes every concrete address to the
built-in fast path and the TLB is set to 128 entries. Without TLB support, the
benchmark used 1.9× as many instructions and 1.5× as much time as the baseline
MMU without concrete symMMU support. With TLB support, the benchmark dis-
patched 1.2× as many instructions and used 1.1× as much time as the baseline MMU.
6.5.3 Policy Microbenchmarks
A set of access intensive microbenchmarks measure the difference among symMMU
policies and the baseline klee MMU. Each microbenchmark is compiled from C and
symbolically executes one of 23 standard libc string functions for five minutes. Policy
performance is ranked by generated tests over the baseline klee MMU (i.e., test case
CHAPTER 6. SYMBOLICALLY EXECUTEDMEMORYMANAGEMENTUNIT160
speedup); paths naturally vary across policies on account of different code in the
runtime handlers.
The benchmarks frequently access symbolic string buffers, stressing the MMU. A
symbolic buffer b spans two pages in length (8192 bytes) to highlight forking on the
fork by object policy. Two symbolic integers model offsets ∆1 and ∆2 into b, another
symbolic integer models string length (e.g., for strncpy). Two pointers p1 and p2,
with pk = b+(∆k%(k ∗PAGE SIZE)), give two in-bound feasibly overlapping pointers
which are passed into the string function.
Figure 6.9 shows the test results. A majority of benchmarks generate more tests
than baseline (88 more, 48 fewer). Conservatively, most symMMU policies are no
worse at completing paths than the baseline klee policy. One exception is ITE
(§ 6.4.1) which submits many solver queries for feasible addresses before constructing
an ite expression. On the other hand, pointer concretization, which should produce
few tests, sometimes outperforms baseline. To explain, the baseline forks all feasible
states at once for a symbolic access, issuing many queries. By contrast, the symMMU
forks in the runtime so expensive accesses are preempted so that other states may
interrupt the memory operation and run. The inconsistent performance among poli-
cies and functions demonstrates the importance of policy variety since no one simple
policy is best.
6.5.4 Memory Faults in Linux Programs
To judge the effectiveness of the symMMU at scale, we ran 12508 64-bit Linux pro-
grams taken from Fedora 20 for five minutes each under the symbolic executor to
find memory access violation test cases. These test inputs cause access faults in
unmodified third party programs.
Table 6.4 shows the number of programs and test cases found by the symMMU to
have memory errors using the klee policy (§ 6.4.1) binned by stack trace. To be sure
the results were true positives, the table results were confirmed at the binary trans-
lation level through a test replay program based on the LLVM JIT. For comparison,
the standard klee MMU flagged 2252 tests (1751 confirmed by JIT replay) whereas
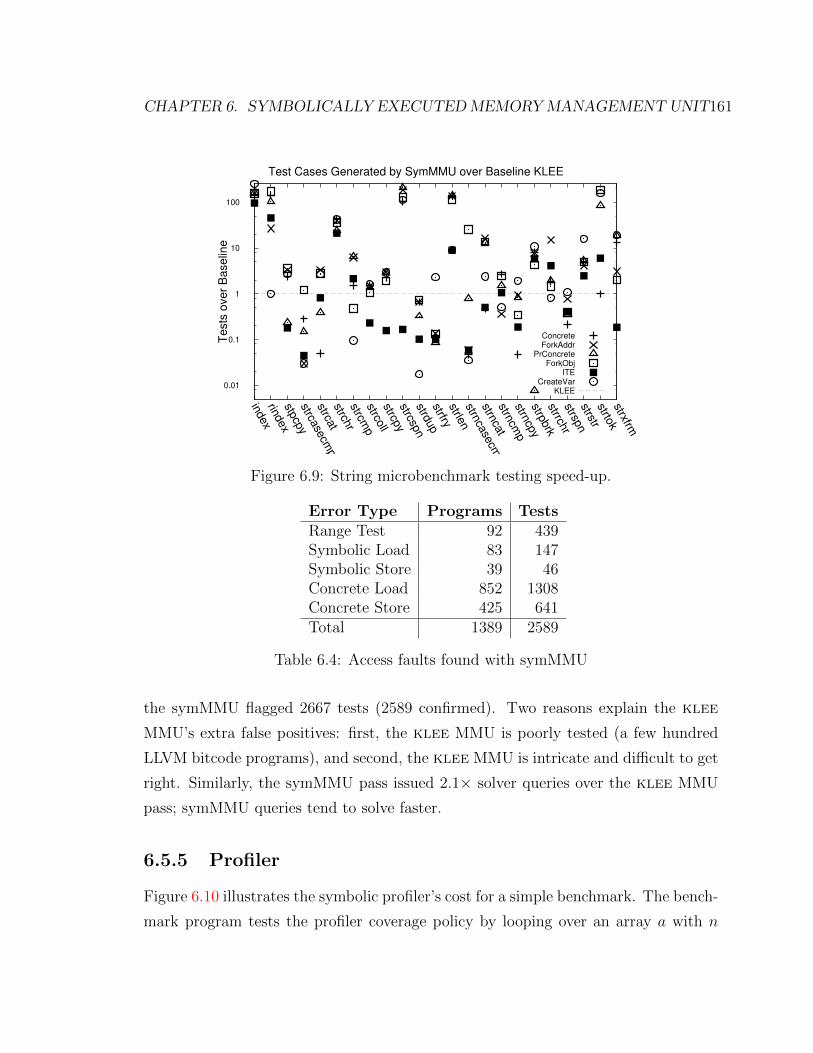
CHAPTER 6. SYMBOLICALLY EXECUTEDMEMORYMANAGEMENTUNIT161
0.01
0.1
1
10
100
index
rindex
stpcp
ystrca
secm
pstrca
tstrch
rstrcm
pstrco
llstrcp
ystrcsp
nstrd
up
strfrystrle
nstrn
case
cmp
strnca
tstrn
cmp
strncp
ystrp
brk
strrchr
strspn
strstrstrto
kstrxfrm
Tests
over
Baselin
e
Test Cases Generated by SymMMU over Baseline KLEE
ConcreteForkAddr
PrConcreteForkObj
ITECreateVar
KLEE
Figure 6.9: String microbenchmark testing speed-up.
Error Type Programs TestsRange Test 92 439Symbolic Load 83 147Symbolic Store 39 46Concrete Load 852 1308Concrete Store 425 641Total 1389 2589
Table 6.4: Access faults found with symMMU
the symMMU flagged 2667 tests (2589 confirmed). Two reasons explain the klee
MMU’s extra false positives: first, the klee MMU is poorly tested (a few hundred
LLVM bitcode programs), and second, the klee MMU is intricate and difficult to get
right. Similarly, the symMMU pass issued 2.1× solver queries over the klee MMU
pass; symMMU queries tend to solve faster.
6.5.5 Profiler
Figure 6.10 illustrates the symbolic profiler’s cost for a simple benchmark. The bench-
mark program tests the profiler coverage policy by looping over an array a with n

CHAPTER 6. SYMBOLICALLY EXECUTEDMEMORYMANAGEMENTUNIT162
0.1
1
10
100
1000
1 4 16 64 256 1024 0
500
1000
1500
2000
2500
3000
3500
Tim
e (
s)
Tota
l Q
ueries
Shadowed Symbolically Accessed Sites
Symbolic Sites versus Time and Queries for Profiler Benchmark
TimeQueries
Figure 6.10: Profiler benchmark performance.
elements, writing 1 to a[s[i]] where s is an array of symbolics; s’s assignment controls
which elements of a are updated. The shadow memory’s granularity is configured
to have a shadow word for each element in a. Complete coverage of a implies s
contains all values between 0 and n − 1; the profiler imposes these constraints on
s. For overhead, total solver queries grows linearly with respect to n. Time for the
benchmark exponentially rises with n, peaking at 338 seconds for 1024 elements; at
2048 elements, solver performance completely deteriorates and the benchmark times
out after 30 minutes.
6.5.6 Heap Violations
The symbolic executor produces a concrete test case for every heap violation it finds.
Since a test could be a false positive (e.g., from bugs in the tool), it is important to
automatically detect true positives. Unlike access faults, heap violations in general
do not trigger specific hardware events. SAGE [59], for instance, has special support
to force crashes on heap violations. To confirm errors without the luxury of faults,
the symMMU heap checker replay system feeds test cases with system call logs into
an unmodified third-party heap analysis tool, valgrind [100] memcheck.

CHAPTER 6. SYMBOLICALLY EXECUTEDMEMORYMANAGEMENTUNIT163
Type Tests Code Sites ProgramsDouble Free 56 43 33Dangling Access 405 147 46Uninitialized Read 1195 94 230Total 1656 240 267
Table 6.5: symMMU-derived Heap Violations
The system uses a combination of ptrace and iterative system call realignment
to replay test cases under valgrind. The test replay process uses ptrace to control a
valgrind process running the target program. The replay process intercepts valgrind’s
system calls; a call is dispatched natively or intercepted and replayed, depending on
whether the program or valgrind invoked the system call. In essence, two system
models must be reconciled: test cases use precise system call logs whereas valgrind
rewrites and inserts system calls. On interception, if the requested system call matches
the head of the system call log, the valgrind process absorbs the log’s side effects.
Otherwise, the call forwards to the operating system. Since there is no clear point
where valgrind calls end and target program calls begin, the system call log initially
synchronizes with valgrind by ignoring the first n system calls. The value n is found
by successively incrementing n to maximize the number of replayed system calls.
We checked 1919 Linux programs from the host machine’s (x86-64 Gentoo) /bin,
/sbin, /usr/bin, and /usr/sbin/ directories, symbolically executed for five min-
utes. Binaries were taken from the host machine because valgrind is sensitive to its
host configuration. Table 6.5 lists valgrind-confirmed heap violations by number of
tests, code sites (to control for faulty libraries), and programs (to control for noisy
programs). In total 14247 violations were flagged in 761 programs; valgrind confirmed
11.6% of these tests. Valgrind and the executor disagree for several reasons: neither
are bug-free, system calls fail to align, and differing memory layouts interfere with
system call replay. Regardless, cross-checking with a third-party tool strengthens
evidence of legitimate bugs.
Figure 6.11 illustrates the complexity of errors found by the heap checker. This
pared-down example from cpio-2.11 spans three source files; it reads a buffer length
(c namesize) from input (short hdr), allocates a buffer c name, passes it around,

CHAPTER 6. SYMBOLICALLY EXECUTEDMEMORYMANAGEMENTUNIT164
tape buffered read (( ( char ∗) short hdr ) + 6 , in des , s izeof ∗ short hdr − 6 ) ;
f i l e hdr−>c namesize = short hdr−>c namesize ;f i l e hdr−>c name = (char ∗) xmalloc ( f i l e hdr−>c namesize ) ;cpio safer name suf f ix ( f i l e hd r . c name , . . . ) ;char ∗p = safer name suf f ix (name , . . . ) ;size t pre f i x l en=FILE SYSTEM PREFIX LEN( fi le name ) ;
Figure 6.11: A tortuous heap read violation in cpio.
then reads the data. If c namesize is 0, prefix len relies on uninitialized data,
leading to undefined behavior.
6.5.7 Unconstrained Pointers
Explicitly modeling data structures for testing function arguments is tedious. Demand
allocation on unconstrained pointers derives argument structure automatically. We
evaluate symMMU unconstrained pointers on bare functions by symbolically gener-
ating test inputs for functions in several compiled libc implementations. These tests
directly translate to C sources which serve as native test fixtures. Replaying the tests
across libraries reveals implementation differences and fundamental bugs.
Generating libc Inputs
Test inputs were derived by symbolically executing C standard library (libc) libraries
with unconstrained pointers. We tested functions from four up-to-date libc imple-
mentations: newlib-2.1.0, musl-1.1.0, uclibc-0.9.33.2, and glibc-2.19. Functions were
symbolically executed by marking the register file symbolic and jumping to the func-
tion; root unconstrained pointers are demand allocated on dereference of a symbolic
register. Each function was allotted a maximum of five minutes of symbolic execution
computation time and 200 test cases. Since we intend to find differences between sup-
posedly equivalent implementations, only functions shared by at least two libraries
were evaluated. In total 667 functions shared among at least two libraries exhibited
unconstrained demand allocations.
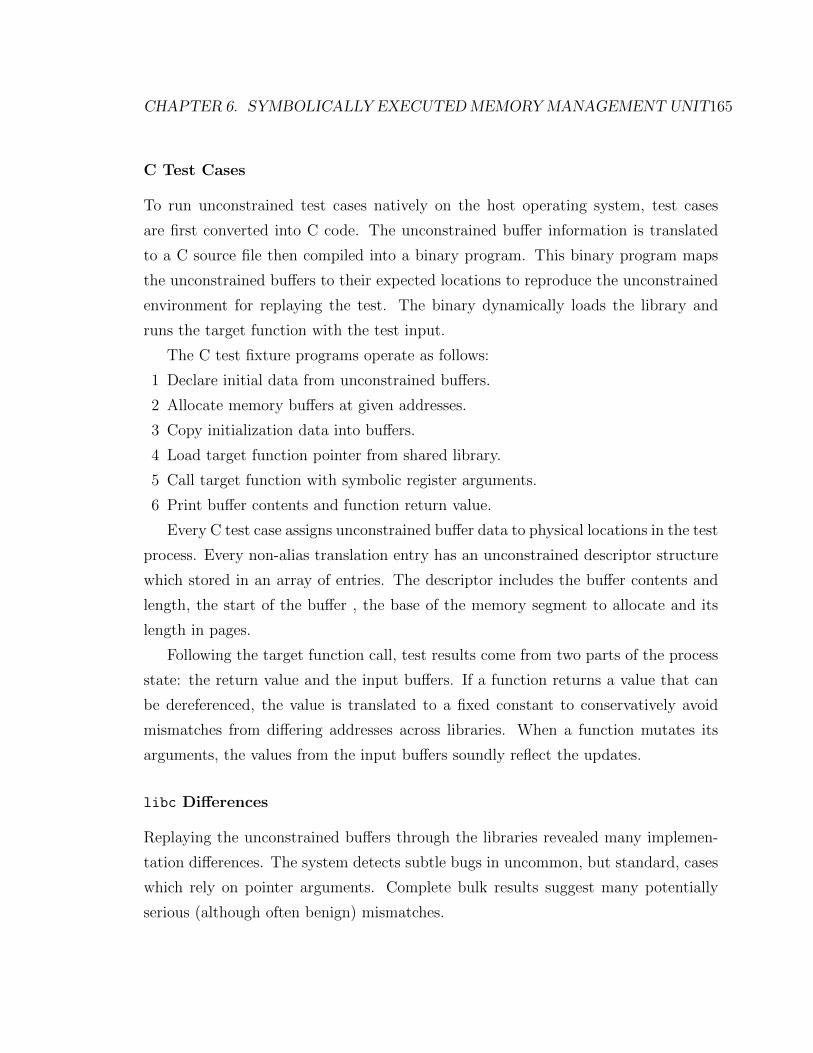
CHAPTER 6. SYMBOLICALLY EXECUTEDMEMORYMANAGEMENTUNIT165
C Test Cases
To run unconstrained test cases natively on the host operating system, test cases
are first converted into C code. The unconstrained buffer information is translated
to a C source file then compiled into a binary program. This binary program maps
the unconstrained buffers to their expected locations to reproduce the unconstrained
environment for replaying the test. The binary dynamically loads the library and
runs the target function with the test input.
The C test fixture programs operate as follows:
1 Declare initial data from unconstrained buffers.
2 Allocate memory buffers at given addresses.
3 Copy initialization data into buffers.
4 Load target function pointer from shared library.
5 Call target function with symbolic register arguments.
6 Print buffer contents and function return value.
Every C test case assigns unconstrained buffer data to physical locations in the test
process. Every non-alias translation entry has an unconstrained descriptor structure
which stored in an array of entries. The descriptor includes the buffer contents and
length, the start of the buffer , the base of the memory segment to allocate and its
length in pages.
Following the target function call, test results come from two parts of the process
state: the return value and the input buffers. If a function returns a value that can
be dereferenced, the value is translated to a fixed constant to conservatively avoid
mismatches from differing addresses across libraries. When a function mutates its
arguments, the values from the input buffers soundly reflect the updates.
libc Differences
Replaying the unconstrained buffers through the libraries revealed many implemen-
tation differences. The system detects subtle bugs in uncommon, but standard, cases
which rely on pointer arguments. Complete bulk results suggest many potentially
serious (although often benign) mismatches.

CHAPTER 6. SYMBOLICALLY EXECUTEDMEMORYMANAGEMENTUNIT166
unsigned long a [ 1 6 ] = {0} ;for ( i = 0 ; i < 4 ; i++) {
a [ i ] = s t r t o u l ( s , &z , 0 ) ;i f ( z==s | | (∗ z && ∗z != ’ . ’ ) | | ! i s d i g i t (∗ s ) )
return −1;i f ( ! ∗ z ) break ;s=z+1;
}
switch ( i ) {case 0 : a [ 1 ] = a [ 0 ] & 0 x f f f f f f ; a [ 0 ] >>= 24 ;case 1 : a [ 2 ] = a [ 1 ] & 0 x f f f f ; a [ 1 ] >>= 16 ;case 2 : a [ 3 ] = a [ 2 ] & 0 x f f ; a [ 2 ] >>= 8 ;
}
for ( i = 0 ; i < 4 ; i++) {i f ( a [ i ] > 255) return −1;( ( char∗)&d ) [ i ] = a [ i ] ;
}
Figure 6.12: Simplified IP address parser from musl.
Figure 6.12 shows an example broken edge case detected with symMMU uncon-
strained pointers. The figure lists a simplified internet host address parser adapted
from the musl library which converts an IPv4 numbers-and-dots notation string (s)
to a network byte order integer address (d). During symbolic execution, the uncon-
strained buffer fills in the contents for s with symbolic values. The code works for four
numeric parts (e.g., 127.0.0.1) but misinterprets other valid addresses. For example,
the class C address “1.1” converts to 0x01000001 instead of the expected address
0x0101.
Table 6.6 summarizes the mismatches with glibc using unconstrained pointers.
We were careful to exclude functions which rely on volatile system state, use struc-
tures with undefined width (e.g., stdio file functions), return no value, or always
crashed. The percentage of mismatching functions is considerable given our conser-
vative analysis. One interesting class of differences reflects arcane specialized con-
figuration details. For instance, glibc’s timezone support causes newlib and musl
to drift several hours when computing mktime (uClibc crashes, lacking /etc/TZ).

CHAPTER 6. SYMBOLICALLY EXECUTEDMEMORYMANAGEMENTUNIT167
Library Mismatched Functions % Total Testedmusl 86 25%newlib 45 30%uclibc 32 8%Total 117 24%
Table 6.6: Mismatches against glibc involving unconstrained pointers
Furthermore, inconsistent locale handling across libraries contributes to mismatched
wide character data.
6.6 Conclusion
This chapter introduced symbolic execution with symbolically executed memory ac-
cesses through a symMMU. By separating memory access policy from the dispatch
mechanism, we have implemented a variety of access policies and memory analysis
algorithms with minimal effort. Microbenchmarks demonstrate the importance of
access policy for symbolic executor performance. Large scale comparative results
indicate the symMMU finds more access faults with fewer false positives than a tradi-
tional built-in access dispatcher. Overall, this work suggests that forwarding memory
accesses to a symbolically executed runtime is a beneficial design choice in a symbolic
executor.

Chapter 7
Conclusion
7.1 Summary of Contributions
Chapter 2 introduced the design and philosophy behind the klee-mc binary sym-
bolic executor. The chapter focused on the modifications and extensions necessary
to adequately support machine code in a mature symbolic execution system. We
demonstrate that klee-mc can analyze huge program sets, finding thousands of
unique program faults. The additional system complexity and flood of data hints
at the increased importance of robustness and correctness when analyzing machine
code, a recurring theme throughout this dissertation.
Chapter 3 described the cross-checking capabilities which ensure high-integrity
test case generation. The cross-checking in klee-mc validates the symbolic interpre-
tation of LLVM code, the translation of machine code, solver stack, and expression
optimization, finding executor bugs that otherwise would go unnoticed due to the
overwhelming amount of test data. Since klee-mc analyzes machine code, cross-
checking works down to the hardware level, both confirming when the symbolic ex-
ecutor models computation on physical hardware and detecting when it does not.
Chapter 4 extended the symbolic executor to support symbolic floating-point op-
erations. The floating-point operations were self-testing by virtue of being runtime
libraries, generating their own test cases. When tested against hardware, similar
to the prior chapter, the tests revealed divergence among the floating-point code,
168
CHAPTER 7. CONCLUSION 169
floating-point solvers, and physical floating-point hardware.
Chapter 5 presented the system’s reduction rule based expression optimizer. The
system discovered expression optimizations from its own programs by searching a
database of observed expressions, building reduction rules, and finally establishing
equivalence with the solver. These rules generalize to match larger classes of ex-
pressions and verify their correctness using the constraint solver. Applying the rules
results in a 17% reduction of total queries and a 10% speedup on average.
Chapter 6 continued extending the system by replacing built-in symbolic memory
handlers with symbolically executed libraries. The library version of the built-in
symbolic pointer policy is both more reliable and better at finding access faults. To
demonstrate the mechanism’s flexibility, new heap analysis and lazily allocated buffer
passes were also implemented as libraries, finding over a thousand heap violations
and over a hundred libc implementation mismatches. The results from these passes
were automatically confirmed outside the symbolic executor with third party tools.
Overall, this dissertation shows a binary symbolic executor should be built in such
a way that it can test itself. Since machine code ultimately has a physical ground
truth in hardware, designing a binary symbolic execution system without test case
validation facilities makes debugging a needless struggle. By establishing a foundation
of precision through fast detection of executor errors, should they arise, it becomes
possible to develop new features, while keeping the old ones, to analyze programs
with little concern over hidden false positives polluting results.
7.2 Future Work
Despite its strong self-checking properties, klee-mc still leaves open a great deal of
research problems and engineering challenges. Generally speaking and as outlined
in the introduction, the primary objective of klee-mc as a binary program analysis
platform is to totally generate complete test suites for all interesting behavior in
arbitrary machine code programs. There are several broad categories of work which
can push the system toward this goal.

CHAPTER 7. CONCLUSION 170
7.2.1 Programs and Modeling
klee-mc targets several architectures running Linux and 32-bit Windows; this is far
from all programs. Acquiring a bulk set of programs, even with snapshotting, can be
involved. Furthermore, even when programs run on the executors, many still need
incredibly precise system modeling to exercise all paths.
As shown in Section 2.5.1, simply running a program on a system should not be
taken for granted. Once a platform has a snapshotter, there tends to be little dif-
ficulty saving process images. On the other hand, merely running a program on its
intended platform, natively constructing the process image, is less straightforward. If
a program relies on an obscure library that is not installed, it will fail to launch; all
dependencies must be resolved for the program to run. In general, no complex oper-
ating system perfectly automatically resolves library dependencies; the best solution
may use virtual machines with all system repository packages installed. On Windows,
programs and their dependencies are often distributed using software packers which
unpack the true executable from a compressed data section following a few mouse
click, therefore demanding an extra stage of extraction that requires some engineer-
ing to automate. Software packages that attempt to decode packed executables are
unreliable in practice; a better method could programmatically fuzz interfaces and
track file creation to retrieve any binaries written out to the file system.
Once a program is loaded, the system model should approximate the platform so
that it behaves in all manners the program could possibly encounter. As discussed
in Section 3.3.2, a poor model weakens the executor’s ability to produce good tests.
Although continuing to develop system model code could lead to an excellent model,
this approach appears rather Sisyphean: on top of carefully symbolically encoding
all operating system behavior, new system interfaces would also need to be closely
followed and supported (e.g., driver-defined ioctls). Ideally, the system model would
be automatically derived from the target platform. This could be done by having a
mechanism which reuses system code or having a method to learn an approximate
model from system call traces.
CHAPTER 7. CONCLUSION 171
7.2.2 Scaling
There are two modes of scaling that are important for a program analysis system.
First, there is breadth: the system should routinely process as many programs as
possible, ideally sharing results. Second, there is depth: the system should be able
to analyze programs of any size with a degree of thoroughness. Both takes on scaling
deserve attention.
A system that can process nearly any binary program yet does not is a waste
of potential. A modern trend in computing is the consolidation of services to huge,
centrally maintained systems; one of these services in the future could be program
checking. This centralization is a stark contrast to the developer tool model where
a each user runs the analysis tool on their own development machine; given the
difficulty of installing symbolic execution tools (a task occasionally relegated to virtual
machines [24, 34]), the myriad of options and failure modes that rely on specialist
knowledge, the substantial and unbounded processing times, the inconvenience of
merely reporting false paths (let alone fixing them), and that binary code is less closely
guarded than source, the author firmly believes focusing on purely local tooling is
remarkably short-sighted for pursuing future trends. The advantages to a consolidated
model include greater opportunities for data sharing, thereby improving performance
in general, and better visibility of system defects. Ultimately, improving breadth of
data sets implies developing interesting tactics for reusing execution data (Chapter 5
is one example) as well as better automated infrastructure for managing bulk program
data.
The resources needed to represent large program states pose a significant chal-
lenge. Arguably, larger programs could be handled by running the analysis on larger
machines, but this quickly becomes unrealistic. The executor may eventually process
larger programs by only considering small pieces of the program at once, to limit path
length and compute time, or only holding a few states in memory at a time, to limit
memory use. Unconstrained execution (§ 6.4.3) could be one solution for processing
smaller components of larger software. A piecewise approach could then be stitched
back together to analyze the program as a whole.

CHAPTER 7. CONCLUSION 172
7.2.3 Coverage
All symbolic executors suffer from poor coverage on large programs, partially because
of the path explosion problem. If an executor fails to cover a significant portion of
a program’s code, its tests will typically be superficial and of little value. Improving
code coverage means addressing the path explosion problem.
If a symbolic executor begins at a program’s entry point, it often becomes lost
in useless states due to following error paths; defensive programming means most
inputs are cause for errors. On the other hand, running a program directly on its
native platform, rather than modeling the platform on the executor, can avoid these
error paths, reaching states a symbolic executor may never find. Hence, starting
symbolic execution from states that are likely on an actual system (i.e., seed states)
but unlikely under symbolic execution due to path explosion could improve coverage.
Pulling snapshot sequences (§ 3.3.1) from a general desktop system with low-overhead
could possibly be a source of useful seed states.
Good coverage can be cast as a search or scheduling problem. In essence, the ex-
ecutor has a set of states from which it must choose one to explore. An optimal state
schedule for coverage selects states in an order that would cover the maximum amount
of code while dispatching the fewest instructions. Although a general scheduler that
always selects an optimal schedule is impossible, there are certainly heuristics which
improve coverage in practice. Choosing the right heuristics is arguably an open prob-
lem, although as it stands, this has been an excuse to leave the executor’s scheduler
as one of the least developed components of the system.
Finally, difficult to reach code can be covered by removal of context. One approach
could use unconstrained execution with lazily allocated buffers to jump to code with-
out a path; the challenge is to demonstrate that the tests are relevant with respect to
the rest of the program. Another approach is to abstract [79] away functions or loops
that cause path explosion, making side-effects symbolic; the challenge here consists
of knowing the appropriate abstraction to apply (i.e, where to place side-effects) as
well as soundly refining the abstraction to produce a legitimate program path.

CHAPTER 7. CONCLUSION 173
7.2.4 Types of Analysis
The meaning of “interesting” behavior is intentionally vague. What precisely con-
stitutes behavior of interest depends on the program semantics, platform semantics,
and threat model. Essentially, behavior worth mentioning corresponds to the types
of analysis applied to the program.
The primary focus of klee-mc has been on bugs that cause program faults lead-
ing to machine exceptions. These bugs are easy to confirm since the hardware de-
tects faults on replay. However, most bugs do not raise exceptions; heap violations
(§ 6.4.2) being one example explored in this work. Such bugs include privilege es-
calation, TOCTOU attacks, and information leaks. Additional functionality to finds
these bugs, or any richer program properties for that matter, could be implemented
through runtime libraries, but confirming any results will require integration with (or
developing) traditional dynamic analysis tools.
Although klee-mc goes through great lengths to reduce system non-determinism
when running programs, there are program behaviors only exposed through non-
deterministic mechanisms. The two most obvious mechanisms are threading and
signals. Naıve methods for handling non-determinism lead to exponential state ex-
plosion, making them impractical without further optimization (FIE [45], for instance,
prunes equivalent states for small programs) or forcing determinism (Cloud9 [37], for
instance, uses cooperative threading). Careful application of program knowledge,
such as analyzing working sets to discover isolation boundaries, might prove more
worthwhile toward finding bugs in non-deterministic code.
Still, this assumes some prior knowledge of what behavior is of interest. Aside
from classes of bugs which may be ignored as an oversight, there are certainly classes
of bugs without names. For instance, it may make sense to mine for idiomatic use
of system features. Alternatively, searching for so-called “divergent” behavior could
reveal new bugs. However, at the binary level, care must be taken to avoid false
alarms since the meaning may be unclear, making analyzing potential bugs by hand
a costly endeavor.

CHAPTER 7. CONCLUSION 174
7.3 Final Thoughts
Binary symbolic execution is both the worst program analysis method and the best.
It’s the worst because it’s expensive to run and hard to get right. One the other
hand, it’s the best way to automatically produce sound test cases on arbitrary soft-
ware. If finding software bugs en masse is the future of program checking, the human
factor must reduced to primarily a supervisory role. Binary symbolic execution can
lead the way toward such aggressively automated program checking by mechanically
generating high-quality reproducible test cases for commodity software.
Appendix A
Glossary
This glossary is defines important terms and acronyms that appear in this disserta-
tion. Some of these terms may be overloaded in the literature but for this dissertation
only have one meaning.
Basic Block – A code sequence with a single entry point. All control flow decisions
exit the sequence.
Binary Program – A computer program, usually compiled from a higher-level lan-
guage, in machine code format.
Binary Symbolic Executor – A symbolic executor that can symbolically execute
binary programs.
Bitcode – Code compiled into the machine format for the LLVM intermediate rep-
resentation.
Branch – A conditional jump in program code guarded by a predicate.
Concrete Data – Data that takes the form of a numeric constant.
Concrete Replay – Reproducing a path, free of symbolic data, with a concrete test
case, usually with the JIT.
Concrete Test – A variable assignment and system call log used by the JIT for the
concrete replay of a path.
Concretize – The process of converting a symbolic value to a concrete value with
respect to a constraint set.
Constraint – A predicate that is an element of a state’s constraint set.
175

APPENDIX A. GLOSSARY 176
Constraint Set – A satisfiable conjunction of constraints associated with a state.
Contingent – The property of a predicate where both it and its negation have a
satisfying assignment assuming the current state’s constraints.
Coverage – A metric for measuring unique instructions executed by a test.
Cross-check – Comparing two similar components for equivalence.
Dynamic Binary Translator – A system to translate basic blocks of machine code
to an intermediate representation on demand
Expression – A well-formed formula over a set of operations and atoms. For symbolic
execution, the set of bitwise and arithmetic operators, arrays, and numeric constants.
Expression Builder – A component of a symbolic executor responsible for con-
structing expressions.
Fault – Program behavior that causes hardware to raise an exception, often leading
to program termination.
Feasible – The property of a predicate which has a satisfying assignment assuming
the current state’s constraints.
Fork – The action of splitting a state into two states where one assumes a predicate p
and the other assumes the negation ¬p. Often brought about by a contingent branch.
Guest – The target program running inside the symbolic executor.
Instrumentation – Code that is inserted into other code for analysis purposes.
Intermediate Representation – A language intended to express code semantics in
a way that is easy to process by compiler-like tools.
Intrinsic – A built-in function in the symbolic executor accessible by runtime li-
braries. Similar to a system call.
IR – See intermediate representation
JIT – A Just-in-Time interpreter that compiles and runs LLVM code as executable
machine code.
klee – An LLVM symbolic executor.
klee-mc – A machine code extension of klee.
Machine Code – The instruction format directly processed by a CPU.
Memory Object – A memory region in a state which represents a single copy-on-
write unit.

APPENDIX A. GLOSSARY 177
MMU – Memory management unit
Overconstrained – A state or model that underapproximates possible program con-
figurations.
Path Constraint – A constraint on a state incurred by following a contingent con-
ditional branch.
Predicate – A boolean expression.
Query – A satisfiable set of constraints and a formula predicate bundled together for
a solver which questions whether their conjunction is satisfiable.
Reduction Rule – A term rewriting template that matches and rewrites a class of
expressions to logically equivalent smaller expressions.
Register Log – A trace of a program’s register states prior to every basic block
dispatched by the symbolic executor.
Replay – The process of reproducing the path described by a test case.
Runtime Library – A symbolically executed collection of bitcode, loaded as part of
every state, which supplies support functions for the executor.
Satisfiable – The property of a predicate which will evaluate to true under some
variable assignment.
SMTLIB – A human-readable language for expressing constraint satisfaction prob-
lems for bit-vectors over arrays.
Snapshot – A point-in-time copy of memory, registers, and other resources for a
running program
Soft Floating-point – An integer code implementation of floating-point operations.
Typically used for emulating floating-point instructions on integer-only processors.
Solver – Software that implements a decision procedure to resolve constraint satis-
faction problems.
Solver Call – A request made by the symbolic executor into a complete decision
procedure to solve a query.
State – The materialization of partially explored path in the symbolic executor. A
machine configuration with symbolic data.
Symbolic Data – Data that includes a variable term. (cf. concrete data)
Symbolic Executor – A complete system for symbolically executing code, including
APPENDIX A. GLOSSARY 178
a solver, expression builder, code translation, and test case generation.
Symbolic Interpreter – The component of the symbolic executor responsible for
dispatching instructions on symbolic data.
System Call – A binary program request for an operating system service.
System Call Log – A log of side effects from the system model when servicing sys-
tem calls for a path.
System Model – A runtime library that emulates an operating system or program
runtime environment.
Test Case – Data which can be used to reproduce a program path.
Unconstrained Pointer – A pointer which maps to a lazily allocated buffer.
Underconstrained – An overapproximation of possible program configurations; po-
tentially infeasible
Valid – The property of a predicate which has no satisfying assignment for its nega-
tion assuming the current state’s constraints.
Validate – To demonstrate correctness of code for a path.
Variable Assignment – A set of arrays of concrete values which concretizes an ex-
pression or set of expressions.
Verify – To prove correctness of code for all paths and values.

Bibliography
[1] Jade Alglave, Alastair F. Donaldson, Daniel Kroening, and Michael Tautschnig.
Making Software Verification Tools Really Work. In Tevfik Bultan and Pao-Ann
Hsiung, editors, Proceedings of the 9th International Conference on Automated
Technology for Verification and Analysis, ATVA’11, pages 28–42, Berlin, Hei-
delberg, 2011. Springer-Verlag.
[2] Austin Appleby. murmurhash3. http://sites.google.com/site/murmurhash, Nov
2012.
[3] M. Aron, Y. Park, T. Jaeger, J. Liedtke, K. Elphinstone, and L. Deller. The
SawMill Framework for Virtual Memory Diversity. In Computer Systems Archi-
tecture Conference, 2001. ACSAC 2001. Proceedings. 6th Australasian, pages
3–10, 2001.
[4] Shay Artzi, Julian Dolby, S.H. Jensen, A. Moller, and Frank Tip. A Framework
for Automated Testing of Javascript Web Applications. In Proceedings of the
33rd International Conference on Software Engineering, ICSE’11, pages 571
–580, May 2011.
[5] Shay Artzi, Adam Kiezun, Julian Dolby, Frank Tip, Danny Dig, Amit Paradkar,
and Michael D. Ernst. Finding Bugs in Web Applications using Dynamic Test
Generation and Explicit State Model Checking. IEEE Transactions on Software
Engineering, 36(4):474–494, July/August 2010.
[6] Roberto Bagnara, Matthieu Carlier, Roberta Gori, and Arnaud Gotlieb. Sym-
bolic Path-Oriented Test Data Generation for Floating-Point Programs. In
179

BIBLIOGRAPHY 180
Proceedings of the 6th IEEE International Conference on Software Testing, Ver-
ification and Validation, ICST’13, pages 1–10, Luxembourg City, Luxembourg,
2013. IEEE Press.
[7] Vasanth Bala, Evelyn Duesterwald, and Sanjeev Banerjia. Dynamo: A Trans-
parent Dynamic Optimization System. In Proceedings of the ACM SIGPLAN
2000 Conference on Programming Language Design and Implementation, PLDI
’00, pages 1–12, 2000.
[8] Gogul Balakrishnan, Radu Gruian, Thomas Reps, and Tim Teitelbaum.
CodeSurfer/x86– A Platform for Analyzing x86 Executables. In Proceedings
of the 14th International Conference on Compiler Construction, CC’05, pages
250–254, Berlin, Heidelberg, 2005. Springer-Verlag.
[9] Sorav Bansal and Alex Aiken. Binary Translation using Peephole Superopti-
mizers. In Proceedings of the 8th USENIX Conference on Operating Systems
Design and Implementation, OSDI’08, pages 177–192, 2008.
[10] Earl T. Barr, Thanh Vo, Vu Le, and Zhendong Su. Automatic Detection of
Floating-Point Exceptions. In Proceedings of the 40th annual ACM SIGPLAN-
SIGACT Symposium on Principles of programming languages, POPL ’13, pages
549–560, New York, NY, USA, 2013. ACM.
[11] Clark Barrett, Leonardo de Moura, and Aaron Stump. Design and results of the
first satisfiability modulo theories competition (SMT-COMP 2005). Journal of
Automated Reasoning, 2006.
[12] Clark Barrett, Aaron Stump, and Cesare Tinelli. The SMT-LIB Standard:
Version 2.0. In A. Gupta and D. Kroening, editors, Proc. of the 8th Int’l
Workshop on Satisfiability Modulo Theories (Edinburgh, England), 2010.
[13] Clark Barrett and Cesare Tinelli. CVC3. In Werner Damm and Holger Her-
manns, editors, Computer Aided Verification, volume 4590 of Lecture Notes in
Computer Science, pages 298–302. Springer Berlin Heidelberg, 2007.

BIBLIOGRAPHY 181
[14] Kent Beck. Test Driven Development: By Example. Addison-Wesley Longman
Publishing Co., Inc., Boston, MA, USA, 2002.
[15] Fabrice Bellard. QEMU, a Fast and Portable Dynamic Translator. In USENIX
2005 Annual Technical Conference, FREENIX Track, pages 41–46.
[16] Mordechai Ben-Ari. The Bug that Destroyed a Rocket. ACM SIGCSE Bulletin,
33(2):58, 2001.
[17] Al Bessey, Ken Block, Ben Chelf, Andy Chou, Bryan Fulton, Seth Hallem,
Charles Henri-Gros, Asya Kamsky, Scott McPeak, and Dawson Engler. A few
billion lines of code later: using static analysis to find bugs in the real world.
Communications of the ACM, 53(2):66–75, 2010.
[18] Sam Blackshear, Bor-Yuh Evan Chang, and Manu Sridharan. Thresher: Precise
Refutations for Heap Reachability. In Proceedings of the ACM SIGPLAN 2013
Conference on Programming Language Design and Implementation, PLDI’13,
pages 275–286, 2013.
[19] B. Blanchet, P. Cousot, R. Cousot, J. Feret, L. Mauborgne, A. Mine, D. Mon-
niaux, and X. Rival. A Static Analyzer for Large Safety-Critical Software. In
Proceedings of the ACM SIGPLAN 2003 Conference on Programming Language
Design and Implementation, PLDI’03, pages 196–207, San Diego, California,
USA, June 7–14 2003. ACM Press.
[20] Bernard Botella, Arnaud Gotlieb, and Claude Michel. Symbolic Execution of
Floating-Point Computations. Software Testing, Verification and Reliability,
16(2):97–121, 2006.
[21] Robert S. Boyer, Bernard Elspas, and Karl N. Levitt. SELECT – A Formal
System for Testing and Debugging Programs by Symbolic Execution. In Pro-
ceedings of the International Conference on Reliable software, pages 234–245,
1975.
BIBLIOGRAPHY 182
[22] Angelo Brillout, Daniel Kroening, and Thomas Wahl. Mixed Abstractions for
Floating-Point Arithmetic. In FMCAD, pages 69–76. IEEE, 2009.
[23] David Brumley, Cody Hartwig, Min Gyung Kang, Zhenkai Liang, James New-
some, Pongsin Poosankam, Dawn Song, and Heng Yin. BitScope: Automati-
cally dissecting malicious binaries. Technical report, In CMU-CS-07-133, 2007.
[24] David Brumley, Ivan Jager, Thanassis Avgerinos, and Edward Schwartz. BAP:
A Binary Analysis Platform. In Ganesh Gopalakrishnan and Shaz Qadeer,
editors, Computer Aided Verification, volume 6806 of LNCS, pages 463–469.
Springer Berlin / Heidelberg, 2011.
[25] Robert Brummayer and Armin Biere. Boolector: An Efficient SMT Solver for
Bit-Vectors and Arrays. In Proceedings of the 15th International Conference on
Tools and Algorithms for the Construction and Analysis of Systems, TACAS
’09, pages 174–177, Berlin, Heidelberg, 2009. Springer-Verlag.
[26] Robert Brummayer and Armin Biere. Fuzzing and Delta-debugging SMT
Solvers. In Proceedings of the 7th International Workshop on Satisfiability Mod-
ulo Theories, SMT ’09, pages 1–5, New York, NY, USA, 2009. ACM.
[27] J. Burnim and K. Sen. Heuristics for Scalable Dynamic Test Generation. In
Proceedings of the 2008 23rd IEEE/ACM International Conference on Auto-
mated Software Engineering, ASE ’08, pages 443–446, Washington, DC, USA,
2008. IEEE Computer Society.
[28] Cristian Cadar, Daniel Dunbar, and Dawson Engler. KLEE: Unassisted and
Automatic Generation of High-coverage Tests for Complex Systems Programs.
In Proceedings of the 8th USENIX Conference on Operating Systems Design
and Implementation, OSDI’08, pages 209–224, 2008.
[29] Cristian Cadar, Vijay Ganesh, Peter M. Pawlowski, David L. Dill, and Daw-
son R. Engler. EXE: Automatically Generating Inputs of Death. In Proceedings
of the 13th ACM Conference on Computer and Communications Security, CCS
’06, pages 322–335, New York, NY, USA, 2006. ACM.
BIBLIOGRAPHY 183
[30] Sang Kil Cha, Thanassis Avgerinos, Alexandre Rebert, and David Brumley.
Unleashing Mayhem on Binary Code. In IEEE Symposium on Security and
Privacy, pages 380–394, 2012.
[31] Avik Chaudhuri and Jeffrey Foster. Symbolic Security Analysis of Ruby-on-
Rails Web Applications. In Proceedings of the 17th ACM Conference on Com-
puter and Communications Security, CCS’10, pages 585–594. ACM, 2010.
[32] Ting Chen, Xiao-song Zhang, Cong Zhu, Xiao-li Ji, Shi-ze Guo, and Yue Wu.
Design and Implementation of a Dynamic Symbolic Execution Tool for Win-
dows Executables. Journal of Software: Evolution and Process, 25(12):1249–
1272, 2013.
[33] Anton Chernoff, Mark Herdeg, Ray Hookway, Chris Reeve, Norman Rubin,
Tony Tye, S. Bharadwaj Yadavalli, and John Yates. FX!32 - A Profile-Directed
Binary Translator. IEEE Micro, 18:56–64, 1998.
[34] Vitaly Chipounov, Volodymyr Kuznetsov, and George Candea. S2E: A Platform
for In-vivo Multi-path Analysis of Software Systems. In Proceedings of the
Sixteenth International Conference on Architectural Support for Programming
Languages and Operating Systems, ASPLOS ’11, pages 265–278, 2011.
[35] Chia Yuan Cho, Domagoj Babic, Pongsin Poosankam, Kevin Zhijie Chen, Ed-
ward XueJun Wu, and Dawn Song. MACE: Model-inference-Assisted Concolic
Exploration for Protocol and Vulnerability Discovery. In Proceedings of the 20th
USENIX Security Symposium, August 2011.
[36] Alonzo Church and J. B. Rosser. Some Properties of Conversion. Transactions
of the American Mathematical Society, 39(3):472–482, 1936.
[37] Liviu Ciortea, Cristian Zamfir, Stefan Bucur, Vitaly Chipounov, and George
Candea. Cloud9: A Software Testing Service. SIGOPS Operating Systems
Review, 43:5–10, January 2010.

BIBLIOGRAPHY 184
[38] Edmund Clarke, Orna Grumberg, Somesh Jha, Yuan Lu, and Helmut Veith.
Counterexample-guided Abstraction Refinement for Symbolic Model Checking.
J. ACM, 50(5):752–794, September 2003.
[39] Lori A. Clarke. A Program Testing System. In Proceedings of the 1976 Annual
Conference, ACM ’76, pages 488–491, 1976.
[40] Manuel Clavel, Francisco Duran, Steven Eker, Patrick Lincoln, Narciso Martı-
Oliet, Jose Meseguer, and Carolyn Talcott. The Maude 2.0 System. In Proceed-
ings of the 14th International Conference on Rewriting Techniques and Appli-
cations, RTA’03, pages 76–87, Berlin, Heidelberg, 2003. Springer-Verlag.
[41] Peter Collingbourne, Cristian Cadar, and Paul H.J. Kelly. Symbolic Crosscheck-
ing of Floating-Point and SIMD Code. In Proceedings of the sixth conference
on Computer systems, EuroSys ’11, pages 315–328, New York, NY, USA, 2011.
ACM.
[42] Sylvain Conchon, Guillaume Melquiond, Cody Roux, and Mohamed Iguer-
nelala. Built-in Treatment of an Axiomatic Floating-Point Theory for SMT
Solvers. In Pascal Fontaine and Amit Goel, editors, SMT 2012, volume 20 of
EPiC Series, pages 12–21. EasyChair, 2013.
[43] Patrick Cousot and Radhia Cousot. Abstract Interpretation: A Unified Lattice
Model for Static Analysis of Programs by Construction or Approximation of
Fixpoints. In Proceedings of the 4th ACM SIGACT-SIGPLAN Symposium on
Principles of Programming Languages, POPL ’77, pages 238–252, New York,
NY, USA, 1977. ACM.
[44] Heming Cui, Gang Hu, Jingyue Wu, and Junfeng Yang. Verifying Systems
Rules using Rule-Directed Symbolic Execution. In Proceedings of the Eighteenth
International Conference on Architectural Support for Programming Languages
and Operating Systems, ASPLOS ’13, 2013.
BIBLIOGRAPHY 185
[45] Drew Davidson, Benjamin Moench, Somesh Jha, and Thomas Ristenpart. FIE
on Firmware: Finding Vulnerabilities in Embedded Systems using Symbolic Ex-
ecution. In USENIX Security, Berkeley, CA, USA, 2013. USENIX Association.
[46] Jack W. Davidson and Christopher W. Fraser. Automatic Generation of Peep-
hole Optimizations. In SIGPLAN Symposium on Compiler Construction, pages
111–116, 1984.
[47] Ernest Davis. Constraint Propagation with Interval Labels. Artificial Intelli-
gence, 32(3):281–331, July 1987.
[48] G. De Michell and R.K. Gupta. Hardware/software co-design. Proceedings of
the IEEE, 85(3):349 –365, March 1997.
[49] Leonardo De Moura and Nikolaj Bjørner. Z3: An Efficient SMT Solver. In
C. R. Ramakrishnan and Jakob Rehof, editors, Proceedings of the Theory and
practice of software, 14th International Conference on Tools and Algorithms
for the Construction and Analysis of Systems, TACAS’08/ETAPS’08, pages
337–340, Berlin, Heidelberg, 2008. Springer-Verlag.
[50] Xianghua Deng, Jooyong Lee, and Robby. Efficient and Formal Generalized
Symbolic Execution. Automated Software Engg., 19(3):233–301, September
2012.
[51] B. Dutertre and L. de Moura. The Yices SMT Solver. Tool paper at
http://yices.csl.sri.com/tool-paper.pdf, August 2006.
[52] Bassem Elkarablieh, Patrice Godefroid, and Michael Y. Levin. Precise Pointer
Reasoning for Dynamic Test Generation. In Proceedings of the Eighteenth In-
ternational Symposium on Software Testing and Analysis, ISSTA ’09, pages
129–140, New York, NY, USA, 2009. ACM.
[53] Dawson R. Engler, Sandeep K. Gupta, and M. Frans Kaashoek. AVM:
Application-level Virtual Memory. In Proceedings of the 5th Workshop on Hot
Topics in Operating Systems, HotOS-V, pages 72–77, May 1995.

BIBLIOGRAPHY 186
[54] Christopher W. Fraser. A compact, machine-independent peephole optimizer.
In Proceedings of the 6th ACM SIGACT-SIGPLAN Symposium on Principles
of Programming Languages, POPL ’79, pages 1–6. ACM, 1979.
[55] Vijay Ganesh and David L. Dill. A Decision Procedure for Bit-Vectors and
Arrays. In Werner Damm and Holger Hermanns, editors, Computer Aided
Verification, Berlin, Germany, July 2007. Springer-Verlag.
[56] D. Gelperin and B. Hetzel. The Growth of Software Testing. Communications
of the ACM, 31(6):687–695, June 1988.
[57] Patrice Godefroid and Johannes Kinder. Proving Memory Safety of Floating-
Point Computations by Combining Static and Dynamic Program Analysis. In
Proceedings of the 19th International Symposium on Software Testing and Anal-
ysis, ISSTA ’10, pages 1–12, New York, NY, USA, 2010. ACM.
[58] Patrice Godefroid, Nils Klarlund, and Koushik Sen. DART: Directed Auto-
mated Random Testing. In Proceedings of the 2005 ACM SIGPLAN Confer-
ence on Programming Language Design and Implementation, PLDI’05, pages
213–223, June 2005.
[59] Patrice Godefroid, Michael Y. Levin, and David Molnar. Automated Whitebox
Fuzz Testing. In Proceedings of the Network and Distributed System Security
Symposium, NDSS ’08. The Internet Society, 2008.
[60] Patrice Godefroid and Ankur Taly. Automated Synthesis of Symbolic Instruc-
tion Encodings from I/O Samples. In Proceedings of the ACM SIGPLAN 2012
conference on Programming language Design and Implementation, PLDI’12,
pages 441–452, 2012.
[61] David Goldberg. What Every Computer Scientist Should Know About Floating-
Point Arithmetic. ACM Computing Surveys, 23:5–48, 1991.
[62] Dan Goodin. Google Confirms Critical Android Crypto Flaw Used in $5,700 Bit-
coin heist. http://arstechnica.com/security/2013/08/google-confirms-

BIBLIOGRAPHY 187
critical-android-crypto-flaw-used-in-5700-bitcoin-heist. August
14, 2013.
[63] Eric Goubault and Sylvie Putot. Static Analysis of Numerical Algorithms. In
Proceedings of the 13th International Conference on Static Analysis, SAS’06,
pages 18–34, Berlin, Heidelberg, 2006. Springer-Verlag.
[64] Leopold Haller, Alberto Griggio, Martin Brain, and Daniel Kroening. Deciding
Floating-Point Logic with Systematic Abstraction. In Gianpiero Cabodi and
Satnam Singh, editors, FMCAD, pages 131–140. IEEE, 2012.
[65] T. Hansen, P. Schachte, and H. Søndergaard. State Joining and Splitting for
the Symbolic Execution of Binaries. In S. Bensalem and D. A. Peled, editors,
Runtime Verification, pages 76–92. Springer, 2009.
[66] Reed Hastings and Bob Joyce. Purify: Fast Detection of Memory Leaks and
Access Errors. In Proc. of the Winter 1992 USENIX Conf., pages 125–138,
1991.
[67] John Hauser. SoftFloat-2b. www.jhauser.us/arithmetic/SoftFloat.html, 2002.
[68] Benjamin Hillery, Eric Mercer, Neha Rungta, and Suzette Person. Towards a
Lazier Symbolic Pathfinder. SIGSOFT Softw. Eng. Notes, 39(1):1–5, February
2014.
[69] W.E. Howden. Symbolic Testing and the DISSECT Symbolic Evaluation Sys-
tem. Software Engineering, IEEE Transactions on, SE-3(4):266 – 278, July
1977.
[70] Gerard Huet. Confluent Reductions: Abstract Properties and Applications to
Term Rewriting Systems. J. ACM, 27(4):797–821, October 1980.
[71] IEEE Task P754. ANSI/IEEE 754-1985, Standard for Binary Floating-Point
Arithmetic. August 1985.

BIBLIOGRAPHY 188
[72] F. Ivancic, M. K. Ganai, S. Sankaranarayanan, and A. Gupta. Software Model
Checking the Precision of Floating-Point Programs. In Proceedings of the 8th
ACM/IEEE International Conference on Formal Methods and Models for Code-
sign, MEMOCODE 2010, pages 49–58. IEEE, 2010.
[73] W. Kahan. Implementation of Algorithms (Lecture Notes by W. S. Haugeland
and D. Hough). Technical Report 20, 1973.
[74] Jochen Karrer. Softgun – The Embedded System Simulator.
http://softgun.sourceforge.net, 2013.
[75] Sarfraz Khurshid, Corina S. Pasareanu, and Willem Visser. Generalized Sym-
bolic Execution for Model Checking and Testing. In Proceedings of the 9th In-
ternational Conference on Tools and Algorithms for the Construction and Anal-
ysis of Systems, TACAS’03, pages 553–568, Berlin, Heidelberg, 2003. Springer-
Verlag.
[76] Moonzoo Kim, Yunho Kim, and G. Rothermel. A Scalable Distributed Con-
colic Testing Approach: An Empirical Evaluation. In IEEE Fifth International
Conference on Software Testing, Verification and Validation, ICST’12, pages
340 –349, april 2012.
[77] James C. King. Symbolic Execution and Program Testing. Communications of
the ACM, 19:385–394, July 1976.
[78] D.E. Knuth and P.B. Bendix. Simple Word Problems in Universal Algebras.
In J. Siekmann and Graham Wrightson, editors, Automation of Reasoning,
Symbolic Computation, pages 342–376. Springer Berlin Heidelberg, 1983.
[79] Daniel Kroening, Alex Groce, and Edmund Clarke. Counterexample Guided
Abstraction Refinement Via Program Execution. In Jim Davies, Wolfram
Schulte, and Mike Barnett, editors, Formal Methods and Software Engineering,
volume 3308 of Lecture Notes in Computer Science, pages 224–238. Springer
Berlin Heidelberg, 2004.
BIBLIOGRAPHY 189
[80] Victor V. Kuliamin. Standardization and Testing of Implementations of Math-
ematical Functions in Floating Point Numbers. Programming and Computer
Software, 33(3):154–173, 2007.
[81] Volodymyr Kuznetsov, Johannes Kinder, Stefan Bucur, and George Candea.
Efficient State Merging in Symbolic Execution. In Proceedings of the 33rd ACM
SIGPLAN Conference on Programming Language Design and Implementation,
PLDI ’12, pages 193–204, New York, NY, USA, 2012. ACM.
[82] Kiran Lakhotia, Nikolai Tillmann, Mark Harman, and Jonathan De Halleux.
FloPSy: Search-based Floating Point Constraint Solving for Symbolic Execu-
tion. In Proceedings of the 22nd IFIP WG 6.1 International Conference on
Testing Software and Systems, ICTSS’10, pages 142–157, Berlin, Heidelberg,
2010. Springer-Verlag.
[83] R. Langner. Stuxnet: Dissecting a Cyberwarfare Weapon. Security Privacy,
IEEE, 9(3):49–51, May 2011.
[84] Xavier Leroy. Formal Verification of a Realistic Compiler. Communications of
the ACM, 52(7):107–115, 2009.
[85] Nancy G Leveson and Clark S Turner. An Investigation of the Therac-25 Ac-
cidents. Computer, 26(7):18–41, 1993.
[86] Guodong Li, Indradeep Ghosh, and Sreeranga P. Rajan. KLOVER: A Symbolic
Execution and Automatic Test Generation Tool for C++ Programs. In Pro-
ceedings of the 23rd International Conference on Computer Aided Verification,
CAV’11, pages 609–615, Berlin, Heidelberg, 2011. Springer-Verlag.
[87] Guodong Li, Peng Li, Geof Sawaya, Ganesh Gopalakrishnan, Indradeep Ghosh,
and Sreeranga P. Rajan. GKLEE: Concolic Verification and Test Generation
for GPUs. In Proceedings of the 17th ACM SIGPLAN Symposium on Principles
and Practice of Parallel Programming, PPoPP ’12, pages 215–224, New York,
NY, USA, 2012. ACM.

BIBLIOGRAPHY 190
[88] LTP. The Linux Test Project. http://ltp.sourceforge.net.
[89] Chi-Keung Luk, Robert Cohn, Robert Muth, Harish Patil, Artur Klauser, Ge-
off Lowney, Steven Wallace, Vijay Janapa Reddi, and Kim Hazelwood. Pin:
Building Customized Program Analysis Tools with Dynamic Instrumentation.
In Proceedings of the 2005 ACM SIGPLAN Conference on Programming Lan-
guage Design and Implementation, PLDI ’05, pages 190–200, 2005.
[90] H. Lycklama and C. Christensen. A Minicomputer Satellite Processor System.
Technical Report 6, July–August 1978.
[91] Paul Dan Marinescu and Cristian Cadar. make test-zesti: A Symbolic Exe-
cution Solution for Improving Regression Testing. In Proceedings of the 2012
International Conference on Software Engineering, ICSE 2012, pages 716–726,
Piscataway, NJ, USA, 2012. IEEE Press.
[92] Lorenzo Martignoni, Stephen McCamant, Pongsin Poosankam, Dawn Song, and
Petros Maniatis. Path-Exploration Lifting: Hi-Fi Tests for Lo-Fi Emulators. In
ASPLOS, ASPLOS ’12, pages 337–348, New York, NY, USA, 2012. ACM.
[93] Henry Massalin. Superoptimizer: A Look at the Smallest Program. In Pro-
ceedings of the second International Conference on Architectual support for Pro-
gramming Languages and Operating Systems, ASPLOS-II, pages 122–126, 1987.
[94] Matthew Maurer and David Brumley. TACHYON: Tandem Execution for Ef-
ficient Live Patch Testing. In Proceedings of the 21st USENIX Conference
on Security Symposium, Security’12, pages 43–43, Berkeley, CA, USA, 2012.
USENIX Association.
[95] Antoine Mine. Relational Abstract Domains for the Detection of Floating-Point
Run-Time Errors. In David A. Schmidt, editor, ESOP, pages 3–17. Springer,
2004.
[96] David Molnar, Xue Cong Li, and David A. Wagner. Dynamic Test Generation
to Find Integer Bugs in x86 Binary Linux Programs. In Proceedings of the 18th
conference on USENIX security Symposium, SSYM’09, pages 67–82, 2009.
BIBLIOGRAPHY 191
[97] David Monniaux. The Pitfalls of Verifying Floating-Point Computations. ACM
Trans. Program. Lang. Syst., 30(3):12:1–12:41, May 2008.
[98] George C. Necula. Translation Validation for an Optimizing Compiler. In
Proceedings of the ACM SIGPLAN 2000 conference on Programming language
Design and Implementation, PLDI ’00, pages 83–94, 2000.
[99] Nicholas Nethercote and Julian Seward. How to Shadow Every Byte of Memory
Used by a Program. In Proceedings of the 3rd International Conference on
Virtual execution environments, VEE ’07, pages 65–74, New York, NY, USA,
2007. ACM.
[100] Nicholas Nethercote and Julian Seward. Valgrind: A Framework for Heavy-
weight Dynamic Binary Instrumentation. In Proceedings of the 2007 ACM
SIGPLAN conference on Programming language Design and Implementation,
PLDI ’07, pages 89–100, 2007.
[101] James Newsome and Dawn Song. Dynamic Taint Analysis for Automatic De-
tection, Analysis, and Signature Generation of Exploits on Commodity Soft-
ware. In Proceedings of the Network and Distributed System Security Sympo-
sium, NDSS’05, 2005.
[102] J. O’Leary, X. Zhao, R. Gerth, and C.-J. H. Seger. Formally Verifying IEEE
Compliance of Floating-Point Hardware. Technical report, Intel Technical Jour-
nal, First quarter 1999.
[103] Roberto Paleari, Lorenzo Martignoni, Giampaolo Fresi Roglia, and Danilo Br-
uschi. N-version Disassembly: Differential Testing of x86 Disassemblers. In Pro-
ceedings of the 19th International Symposium on Software Testing and Analysis,
ISSTA ’10, pages 265–274, 2010.
[104] Roberto Paleari, Lorenzo Martignoni, Giampaolo Fresi Roglia, and Danilo Br-
uschi. A Fistful of Red-pills: How to Automatically Generate Procedures to

BIBLIOGRAPHY 192
Detect CPU Emulators. In Proceedings of the 3rd USENIX Conference on Of-
fensive Technologies, WOOT’09, pages 2–2, Berkeley, CA, USA, 2009. USENIX
Association.
[105] Hristina Palikareva and Cristian Cadar. Multi-solver Support in Symbolic Exe-
cution. In Proceedings of the 25th International Conference on Computer Aided
Verification, CAV’13, pages 53–68, Berlin, Heidelberg, 2013. Springer-Verlag.
[106] Jan Peleska, Elena Vorobev, and Florian Lapschies. Automated Test Case
Generation with SMT-Solving and Abstract Interpretation. In Mihaela Bobaru,
Klaus Havelund, Gerard J. Holzmann, and Rajeev Joshi, editors, NASA Formal
Methods, volume 6617 of Lecture Notes in Computer Science, pages 298–312.
Springer Berlin Heidelberg, 2011.
[107] A. Pnueli, M. Siegel, and E. Singerman. Translation Validation. In Bern-
hard Steffen, editor, Proceedings of the 4th International Conference on Tools
and Algorithms for the Construction and Analysis of Systems, volume 1384 of
TACAS’98, pages 151–166. Springer Berlin / Heidelberg, 1998.
[108] Corina Pasareanu and Willem Visser. A Survey of New Trends in Symbolic
Execution for Software Testing and Analysis. International Journal on Software
Tools for Technology Transfer (STTT), 11:339–353, 2009.
[109] C. V. Ramamoorthy, S. F. Ho, and W. T. Chen. On the Automated Generation
of Program Test Data. In Proceedings of the 2nd International Conference on
Software Engineering, ICSE ’76, pages 293–300, 1976.
[110] David A. Ramos and Dawson R. Engler. Practical, Low-Effort Equivalence
Verification of Real Code. In Proceedings of the 23rd International Conference
on Computer Aided Verification, CAV’11, pages 669–685, 2011.
[111] Henry Gordon Rice. Classes of Recursively Enumerable Sets and their Decision
Problems. Transactions of the American Mathematical Society, pages 358–366,
1953.

BIBLIOGRAPHY 193
[112] Michael Riley. NSA Said to Exploit Heartbleed Bug for Intelligence for Years.
Retrieved from Bloomberg: www.bloomberg.com/news/2014-04-11/nsa-said-to-
have-used-heartbleed-bug-exposing-consumers.html. Accessed July, 7, 2014.
[113] Anthony Romano and Dawson R. Engler. Expression Reduction from Programs
in a Symbolic Binary Executor. In SPIN’13, pages 301–319, 2013.
[114] Philipp Rummer. Preliminary SMT-FPA Conformance Tests, 2010.
[115] Philipp Rummer and Thomas Wahl. An SMT-LIB Theory of Binary Floating-
Point Arithmetic. In Informal proceedings of 8th International Workshop on
Satisfiability Modulo Theories (SMT) at FLoC, Edinburgh, Scotland, 2010.
[116] Raimondas Sasnauskas, Olaf Landsiedel, Muhammad Hamad Alizai, Carsten
Weise, Stefan Kowalewski, and Klaus Wehrle. KleeNet: Discovering Insidious
Interaction Bugs in Wireless Sensor Networks Before Deployment. In Proceed-
ings of the 9th ACM/IEEE International Conference on Information Processing
in Sensor Networks, IPSN’10, Stockholm, Sweden, April 2010.
[117] Stefan Savage, Michael Burrows, Greg Nelson, Patrick Sobalvarro, and Thomas
Anderson. Eraser: A Dynamic Data Race Detector for Multithreaded Programs.
ACM Transactions on Computer Systems, 15(4):391–411, November 1997.
[118] Eric Schkufza, Rahul Sharma, and Alex Aiken. Stochastic Superoptimization.
In Proceedings of the Eighteenth International Conference on Architectural Sup-
port for Programming Languages and Operating Systems, ASPLOS ’13, pages
305–316, New York, NY, USA, 2013. ACM.
[119] Koushik Sen, Darko Marinov, and Gul Agha. CUTE: A Concolic Unit Testing
Engine for C. In Proc. of the 13th ACM SIGSOFT International Symposium
on Foundations of Software Engineering, ESEC/FSE-13, pages 263–272, 2005.
[120] Thomas Sewell, Magnus Myreen, and Gerwin Klein. Translation Validation for
a Verified OS Kernel. In Proceedings of the 2013 ACM-SIGPLAN Conference on
BIBLIOGRAPHY 194
Programming Language Design and Implementation, PLDI’13, page 11, Seattle,
Washington, USA, June 2013. ACM.
[121] J.H. Siddiqui and S. Khurshid. ParSym: Parallel Symbolic Execution. In 2nd
International Conference on Software Technology and Engineering, volume 1 of
ICSTE’10, pages V1–405 –V1–409, October 2010.
[122] Stephen F. Siegel and Timothy K. Zirkel. Automatic Formal Verification of
MPI-based Parallel Programs. In Proceedings of the 16th ACM Symposium on
Principles and Practice of Parallel Programming, PPoPP ’11, pages 309–310,
New York, NY, USA, 2011. ACM.
[123] Nishant Sinha. Symbolic Program Analysis using Term Rewriting and Gen-
eralization. FMCAD ’08, pages 19:1–19:9, Piscataway, NJ, USA, 2008. IEEE
Press.
[124] Dawn Song, David Brumley, Heng Yin, Juan Caballero, Ivan Jager, Min Gyung
Kang, Zhenkai Liang, James Newsome, Pongsin Poosankam, and Prateek Sax-
ena. BitBlaze: A New Approach to Computer Security via Binary Analysis.
ICISS ’08, pages 1–25, Berlin, Heidelberg, 2008.
[125] Amitabh Srivastava and Alan Eustace. ATOM: A System for Building Cus-
tomized Program Analysis Tools. In Proceedings of the ACM SIGPLAN 1994
Conference on Programming Language Design and Implementation, PLDI ’94,
pages 196–205, 1994.
[126] Michael Stepp, Ross Tate, and Sorin Lerner. Equality-based Translation Valida-
tor for LLVM. In Proceedings of the 23rd International Conference on Computer
Aided Verification, CAV’11, pages 737–742, Berlin, Heidelberg, 2011. Springer-
Verlag.
[127] Nikolai Tillmann and Jonathan De Halleux. Pex: White Box Test Generation
for .NET. In Proceedings of the 2nd International Conference on Tests and
Proofs, TAP’08, pages 134–153, Berlin, Heidelberg, 2008. Springer-Verlag.

BIBLIOGRAPHY 195
[128] Richard Uhlig, David Nagle, Tim Stanley, Trevor Mudge, Stuart Sechrest, and
Richard Brown. Design Tradeoffs for Software-Managed TLBs. In ACM Trans-
actions on Computer Systems, pages 27–38, 1993.
[129] Carl A. Waldspurger and William E. Weihl. Lottery Scheduling: Flexible
Proportional-share Resource Management. In Proceedings of the 1st USENIX
Conference on Operating Systems Design and Implementation, OSDI’94, Berke-
ley, CA, USA, 1994. USENIX Association.
[130] Tielei Wang, Tao Wei, Guofei Gu, and Wei Zou. Checksum-Aware Fuzzing
Combined with Dynamic Taint Analysis and Symbolic Execution. ACM Trans.
Inf. Syst. Secur., 14(2):15:1–15:28, September 2011.
[131] Tielei Wang, Tao Wei, Zhiqiang Lin, and Wei Zou. IntScope: Automatically De-
tecting Integer Overflow Vulnerability in x86 Binary using Symbolic Execution.
In NDSS’09, 2009.
[132] David A. Wheeler. SLOCcount, 2009.
[133] Tao Xie, Darko Marinov, Wolfram Schulte, and David Notkin. Symstra: A
Framework for Generating Object-Oriented Unit Tests Using Symbolic Execu-
tion. In Proceedings of the 11th International Conference on Tools and Algo-
rithms for the Construction and Analysis of Systems, TACAS’05, pages 365–
381, Berlin, Heidelberg, 2005. Springer-Verlag.
[134] Ru-Gang Xu, Patrice Godefroid, and Rupak Majumdar. Testing for Buffer
Overflows with Length Abstraction. In Proceedings of the 2008 International
Symposium on Software Testing and Analysis, ISSTA ’08, pages 27–38, New
York, NY, USA, 2008. ACM.
[135] Xuejun Yang, Yang Chen, Eric Eide, and John Regehr. Finding and Under-
standing Bugs in C Compilers. In Proceedings of the 32nd ACM SIGPLAN
conference on Programming language Design and Implementation, PLDI ’11,
pages 283–294, New York, NY, USA, 2011. ACM.

BIBLIOGRAPHY 196
[136] Yuan Yu, Tom Rodeheffer, and Wei Chen. RaceTrack: Efficient Detection of
Data Race Conditions via Adaptive Tracking. In SOSP ’05: Proceedings of the
twentieth ACM Symposium on Operating systems principles, pages 221–234,
New York, NY, USA, 2005. ACM.
[137] Qin Zhao, Derek Bruening, and Saman Amarasinghe. Umbra: Efficient and
Scalable Memory Shadowing. In Proceedings of the 8th annual IEEE/ACM In-
ternational Symposium on Code Generation and Optimization, CGO ’10, pages
22–31, New York, NY, USA, 2010. ACM.