METHODS FOR ASSESSING SOLVENCY IN THE FINANCIAL ...
13
*Corresponding author (Natalia N. Karzaeva) Tel: +7-499-97639-41 Email: [email protected] ©2019 International Transaction Journal of Engineering, Management, & Applied Sciences & Technologies. Volume 10 No.19 ISSN 2228-9860 eISSN 1906- 9642 CODEN: ITJEA8 Paper ID: 10A19I http://TUENGR.COM/V10A/10A19IM.pdf DOI: 10.14456/ITJEMAST.2019.267 1 International Transaction Journal of Engineering, Management, & Applied Sciences & Technologies http://TuEngr.com PAPER ID: 10A19I METHODS FOR ASSESSING SOLVENCY IN THE FINANCIAL DIAGNOSTICS SYSTEM OF AN ECONOMIC ENTITY Natalia N. Karzaeva a* , Ekaterina A. Karzaeva b a Department of Economic Security, Analysis and Audit, Institute of Economics and Management of AIC, Russian State Agrarian University named after K.A. Timiryazev, Timiryazevskaya st., 49, 127550, Moscow, RUSSIA. b LLC "Delta UK", 1-j Magistral'nyj pr., 11, str.5, 123290, Moscow, RUSSIA. A R T I C L E I N F O A B S T R A C T Article history: Received 30 May 2019 Received in revised form 16 September 2019 Accepted 07 October 2019 Available online 25 October 2019 Keywords: Solvency ratio; Future periods, Planning, Cash flows; Deferral of payment; Beaver Ratio. The paper substantiates the need to assess the solvency of an enterprise not in the past, but in the future. The authors substantiate the limited applicability of solvency ratios proposed by other scientists and specialists, as well as the usability of those indicators for future periods. The authors' conclusions are based on the results of studying by them the possibilities of ratio analysis to assess the solvency margin of an economic entity. The paper discloses an approach to building a model for assessing the solvency of a company in a future period; this approach is based on a comparison of predicted cash flows. The authors adhere to the approach based only on cash flows (monetary approach) to assess the solvency of a company in the future. To build cash flows, it is proposed to apply the schemes for the transformation of receivables and payables into cash, taking into account the periods of deferrals provided by the agreements and the risks of default by debtors. The authors have compiled a list of factors that influence the formation of cash flows. The paper presents the procedure for constructing a model for assessing solvency, taking into account factors that influence it. The authors also proposed a model for the conversion of receivables and payables into cash through a deferral indicator. The paper demonstrates the possibility of using the predictive solvency model by both internal and external stakeholders. Disciplinary: Business Management (Accountings/Financial Management). © 2019 INT TRANS J ENG MANAG SCI TECH. 1. INTRODUCTION Financial diagnostics is an integral element of the analytical work to determine the economic condition of an economic entity, the stage of its life cycle, as well as the identification of phenomena that prevent the enterprise under investigation from maintaining a stable position and achieving its goals. The key link in financial diagnostics is the solvency characteristics of the economic entity, the ©2019 International Transaction Journal of Engineering, Management, & Applied Sciences & Technologies
Transcript of METHODS FOR ASSESSING SOLVENCY IN THE FINANCIAL ...
*Corresponding author (Natalia N. Karzaeva) Tel: +7-499-97639-41 Email: [email protected] ©2019 International Transaction Journal of Engineering, Management, & Applied Sciences & Technologies. Volume 10 No.19 ISSN 2228-9860 eISSN 1906-9642 CODEN: ITJEA8 Paper ID: 10A19I http://TUENGR.COM/V10A/10A19IM.pdf DOI: 10.14456/ITJEMAST.2019.267
1
International Transaction Journal of Engineering, Management, & Applied Sciences & Technologies
http://TuEngr.com
PAPER ID: 10A19I
METHODS FOR ASSESSING SOLVENCY IN THE FINANCIAL
DIAGNOSTICS SYSTEM OF AN ECONOMIC ENTITY
Natalia N. Karzaeva a*
, Ekaterina A. Karzaeva b
a Department of Economic Security, Analysis and Audit, Institute of Economics and Management of AIC,
Russian State Agrarian University named after K.A. Timiryazev, Timiryazevskaya st., 49, 127550, Moscow,
RUSSIA. b LLC "Delta UK", 1-j Magistral'nyj pr., 11, str.5, 123290, Moscow, RUSSIA.
A R T I C L E I N F O
A B S T R A C T Article history:
Received 30 May 2019
Received in revised form 16
September 2019
Accepted 07 October 2019
Available online 25 October
2019
Keywords:
Solvency ratio; Future
periods, Planning, Cash
flows; Deferral of
payment; Beaver Ratio.
The paper substantiates the need to assess the solvency of an
enterprise not in the past, but in the future. The authors substantiate the
limited applicability of solvency ratios proposed by other scientists and
specialists, as well as the usability of those indicators for future periods.
The authors' conclusions are based on the results of studying by them the
possibilities of ratio analysis to assess the solvency margin of an
economic entity. The paper discloses an approach to building a model for
assessing the solvency of a company in a future period; this approach is
based on a comparison of predicted cash flows.
The authors adhere to the approach based only on cash flows
(monetary approach) to assess the solvency of a company in the future.
To build cash flows, it is proposed to apply the schemes for the
transformation of receivables and payables into cash, taking into account
the periods of deferrals provided by the agreements and the risks of
default by debtors. The authors have compiled a list of factors that
influence the formation of cash flows. The paper presents the procedure
for constructing a model for assessing solvency, taking into account
factors that influence it. The authors also proposed a model for the
conversion of receivables and payables into cash through a deferral
indicator. The paper demonstrates the possibility of using the predictive
solvency model by both internal and external stakeholders.
Disciplinary: Business Management (Accountings/Financial Management).
© 2019 INT TRANS J ENG MANAG SCI TECH.
1. INTRODUCTION
Financial diagnostics is an integral element of the analytical work to determine the economic
condition of an economic entity, the stage of its life cycle, as well as the identification of phenomena
that prevent the enterprise under investigation from maintaining a stable position and achieving its
goals. The key link in financial diagnostics is the solvency characteristics of the economic entity, the
©2019 International Transaction Journal of Engineering, Management, & Applied Sciences & Technologies

2 Natalia N. Karzaeva, Ekaterina A. Karzaeva
support of which is the basis of the financial health of an enterprise. In the event of insolvency, the
enterprise cannot develop and expand its business. To get out of a crisis state, first of all, it involves
paying off debts to suppliers and creditors and restoring the solvency of the enterprise as a whole.
Thus, the basis of the characteristics of the financial health of an economic entity is the solvency ratio,
the accuracy of which affects the quality of the entire financial diagnosis.
The most common methods of financial diagnostics of enterprises, including solvency
assessment, are analytical procedures, which are based on ratio analysis. These analytical procedures
can be based on individual ratios, a group of indicators united by the target focus of the study,
statistical models with the inclusion of additional factors or weight constants.
The current methodology for assessing the solvency of an economic entity, enshrined in the
regulatory documents of the Russian Federation is based on the calculation of liquidity indicators,
namely, absolute and current liquidity ratios, liquidity ratio of funds, and the degree of solvency for
current liabilities indicator. Many Russian scientists, in particular, Kovalev (2006), Gradov (2007),
Efimova (2010), Krejnina (2010), Savickaya (2000), Sheremet (2009) and others refer to this
solvency assessment methodology and analyze it.
In addition to calculating the system of ratios, Sheremet (2009) finds it appropriate to analyze
the solvency balance, which includes an assessment of the absolute indicators characterizing the size
of non-payments by companies to credit organizations, suppliers, and the budget. Because long-term
solvency characterizes the financial stability of a company, Lukasevich (2010) proposes additionally
to use an autonomy indicator calculated as the ratio of the equity capital to the size of the company
assets to assess solvency. This indicator is called the coefficient of total solvency. Melnik &
Gerasimova (2007) include financial soundness indicators in the solvency assessment procedures.
Instead of solvency ratio, Seleznev & Ionova (2010) use the financial leverage ratio calculated as the
borrowed capital to equity capital ratio. Thus, the difference in the methods of assessing solvency
proposed by Russian scientists lies only in the composition of the ratios used.
More sophisticated solvency assessment models may include rating systems and a weight
component. So, the scoring model for the integrated assessment of the financial soundness of an
economic entity proposed by D. Duran includes three indicators: return on equity, current liquidity
ratios, and financial independence. The scientist attempted to assess solvency not through the
availability of funds allocated for debt repayment, but through an assessment of the possibility to
generate them. The Credit-Men method developed by J. Depalian and used to assess the possibility
to repay obligations by an economic entity has three fundamental differences from the previous
model: different quantitative and qualitative composition of indicators, application of weights to
indicators, and rationing of each indicator.
A solvency assessment for an economic entity is also carried out by applying the Audit Expert
methodology to compare assets systematized by the degree of their liquidity in descending order with
liabilities systematized by their maturity in ascending order. Compliance with the required ratio
allows us to assess the accounting liquidity and, therefore, the solvency margin of the economic
entity. The solvency assessment problem when using the Audit Expert methodology lies in the
ambiguous nature of equity capital and the various structures of the company liabilities. As a rule,
equity capital, regarded as a “safety margin” in assessing solvency, consists of the authorized capital
invested by the owners of an economic entity and the profit generated over the entire existence of the
enterprise. But capital also includes other items, for example, additional or reserve capital, which
*Corresponding author (Natalia N. Karzaeva) Tel: +7-499-97639-41 Email: [email protected] ©2019 International Transaction Journal of Engineering, Management, & Applied Sciences & Technologies. Volume 10 No.19 ISSN 2228-9860 eISSN 1906-9642 CODEN: ITJEA8 Paper ID: 10A19I http://TUENGR.COM/V10A/10A19IM.pdf DOI: 10.14456/ITJEMAST.2019.267
3
cannot be used to pay off liabilities. Therefore, without a detailed analysis of the capital structure,
comparing its entire amount with the company liabilities is unreasonable.
Analysis of solvency assessment methodologies allows us to draw several conclusions. Firstly,
the regulatory acts of the Russian Federation regulate methods for calculating several indicators, with
the help of which it is recommended to analyze solvency. Secondly, among Russian scientists, there
is no unanimous opinion on the solvency ratio. Thirdly, in the foreign practice of solvency analysis,
there is a generally accepted solvency ratio, which goes back to the studies of W. Beaver.
The works by Arens et al. (2012), Jooste (2007), Maverick (2015), Kieso et al. (2014),
recommend to calculate Solvency Ratio indicator using the formula:
Solvency Ratio = (Net After − Tax Income + NonCash Expenses)
ShortTerm Liabilities+ LongTerm Liabilities) (1)
Solvency Ratio calculation for solvency assessment is recommended by International GAAP
2016 (Ernst & Young, 2013).
Beaver Ratio is similar in its meaning and is calculated by the formula (Beaver, 1966):
Beaver Ratio = Operational Cash Flow / Total Debt
= Operational Cash Flow / (Short Term Debt + Long Term Debt) (2)
This indicator reflects the ratio of net cash flow to total liabilities. Operating cash flow is
calculated by adjusting the actual net profit of the period under study for non-monetary items such as
changes in inventories, receivables, and payables from operating activities during the period,
depreciation and expenses that were incurred but not paid in the same period. All these data can be
obtained from the accounting (financial) statements. The Total Debt value is taken from the balance
sheet of the company at the end of the period under study.
The ratio value is compared with critical values, which vary depending on the industry sector of
the enterprise. The amount of net cash flow, being the generated cash for the period, shows the
sufficiency of resources to repay the debt available at the end of the reporting period.
The inclusion in the formula for calculating the solvency ratio of all obligations, and not just the
amount of debt that must be repaid in the period under study, minimizes the level of the ratio, which
characterizes it as more conservative. But the application of this formula can show the adequacy of
net cash flow to cover the currently known amount of debt, but it will not reflect the real situation of
a shortage of funds to cover accounts payable, which will be formed soon.
An important difference between Russian and foreign solvency assessment practices is the use
of liquidity ratios. While the Russian regulations envisage the use of liquidity ratios to characterize
solvency, a foreign practice strictly separates these concepts. A solvent is an enterprise that can fulfill
its obligations in the long term. So, Flynn et al. (2016) describe the solvency ratio as follows: “The
solvency ratio is a key metric used to measure an enterprise’s ability to meet its debt obligations and
is used often by prospective business lenders. The solvency ratio indicates whether a company’s cash
flow is sufficient to meet its short- and long-term liabilities” (Flynn et al., 2016). Therefore, the
concept of solvency in this interpretation is closer to the term financial soundness, which is traditional
for Russian literature.
Liquidity, as the ability of an enterprise to quickly sell its assets to receive cash, is certainly
associated with solvency and is its guarantee. However, these are not identical concepts and it is not

4 Natalia N. Karzaeva, Ekaterina A. Karzaeva
practical to identify solvency with liquidity. In Russian practice, the concept of "liquidity" is more
applicable to the characterization of the provision of short-term liabilities with relevant assets. Earlier,
we determined the limitations of liquidity indicators used to assess the solvency margin:
1) Absence of solvency’s dependence on the length of the period for the transformation of
material values at different stages of the production process into cash with its continuous nature;
2) Liquidity ratios do not reflect the content of the liquidity concept as the ability of assets to
transform into cash, but reflect the ratio of groups of assets and groups of liabilities;
3) The procedure for calculating the quick asset and current liquidity ratios does not take into
account differences in the maturities of liabilities and the period of circulation of individual groups
of assets;
4) Incompatibility of accounts payable and property estimates repayment, excluding cash
(Karzaeva, 2015; Karzaeva & Karzaeva, 2016).
Another example of worthlessness of solvency assessments using traditional ratio analysis tools
are enterprises that are part of a group of companies and often have large amounts of receivables and
payables to other companies in the group or parent company. This is the so-called intragroup debt.
This circumstance requires either an adjustment of liabilities for the amount of intra-group debt or an
assessment of the solvency of the entire group relative to external creditors.
As foreign scientists note, non-financial analytics also plays an important role in assessing
solvency. “Certain events can create a risk to an entity’s solvency. In the case of business, the pending
expiration of a patent may pose risks to solvency as it will allow competitors to produce the product
in question and it results in a loss of associated royalty payments. Further, changes in certain
regulations that directly impact a company’s ability to continue business operations can pose an
additional risk. Both businesses and individuals may experience solvency issues should a large
judgment be ordered against them after a lawsuit” (Rittenberg et al., 2008). Beams et al. (2016)
emphasize the need to make adjustments for industry specifics when analyzing the solvency of an
enterprise: “Companies in debt-heavy industries like utilities and pipelines may have lower solvency
ratios than those in sectors such as technology. To make an apples-to-apples comparison, the solvency
ratio should be compared for all utility companies, for example, to get a true picture of relative
solvency” (Beams et al., 2016). Sandstrom (2016) also notes that the solvency ratio is not always
justified: “Measuring cash flow rather than net income is a better determinant of solvency, especially
for companies that incur large amounts of depreciation on their assets but have low levels of actual
profitability. A company may have a low debt amount, but if its cash management practices are poor
and account payable is surging as a result, its solvency position may not be as solid as would be
indicated by measures that include only debt” (Sandström, 2016).
Thus, the ratio analysis proposed by both Russian and foreign scientists and specialists cannot
ambiguously characterize the solvency of an enterprise without additional analytical procedures.
The main objective of this study was to build a model for assessing the solvency margin of an
economic entity in the future period based on the principle of comparability of the compared
indicators. A model for assessing the solvency level on the basis of comparable cash flows, on the
one hand, of expected cash receipts in a future period under study, and, on the other hand, planned
payments in the same period, will more accurately determine a company's solvency taking into
account operating, financial and investment activities.
Following the purpose of the study, the following tasks were identified as the main ones:
*Corresponding author (Natalia N. Karzaeva) Tel: +7-499-97639-41 Email: [email protected] ©2019 International Transaction Journal of Engineering, Management, & Applied Sciences & Technologies. Volume 10 No.19 ISSN 2228-9860 eISSN 1906-9642 CODEN: ITJEA8 Paper ID: 10A19I http://TUENGR.COM/V10A/10A19IM.pdf DOI: 10.14456/ITJEMAST.2019.267
5
- Identification of factors affecting the formation of cash flows in future periods;
- Development of a model for assessing the solvency margin based on comparable cash flows for
the analyzed period.
2. METHOD
The methodological basis of the study was the fundamental principles of finance and financial
analysis theories. When constructing a model for assessing a solvency margin, the method of
lengthening the classical model was used. The study is based on the analysis of scientific work in the
field of financial analysis, in particular, the development of solvency ratios for companies.
As the factual material of the study, actual information on the results of seven years of the second
decade of the 21st century from 13 enterprises located in Moscow was used.
3. RESULTS
Persons making managerial decisions are interested not so much in information about the
achieved solvency level as in the ability of an economic entity to fulfill its obligations in the future.
Therefore, they need to assess long-term solvency, i.e. maintaining the ability of a company to repay
its debt in the future. Payables should be compared with available cash and future cash flows for a
correct assessment of solvency.
Methods for assessing solvency based on cash flows proposed by Russian scientists and
specialists are based on historical data (Efimova, 2010; Yusubova, 2016; Kogdenko, 2015; Sandulova
& Kotlyar, 2017), which limits the scope of application of the results since positive cash flows in the
past do not guarantee the continuation of such a trend in the future. This approach is due to the desire
of the authors of the developments to give a universal tool both for internal to the enterprise under
study and for external users of this tool. It seems that the solvency of the enterprise in the future can
be assessed only based on the planned performance indicators of the enterprise (revenue, expenses
and, consequently, cash flows). Since the planned indicators are internal and, as a rule, confidential
information contained in budgets, estimates and other similar documents, only employees of this
enterprise can assess solvency in future periods. Therefore, this indicator is intended for internal use
by managers of an economic entity, but this does not exclude the possibility of providing it to external
users as part of integrated reporting. Planned cash flow indicators increase the accuracy of solvency
assessment and increase its reliability.
To determine the predicted solvency, it is necessary to apply comparable data on planned cash
receipts and payments, i.e. attributable to the same future period: year, quarter, and month. Also, a
necessary condition for the correctness of the solvency assessment is the accounting of only cash
flows generated as a result of the implementation of the planned business operations. Solvency ratio
is defined as the ratio of the planned cash inflows and their planned outflows, including all types of
activities: operational, investment, financial. Urgent sale of assets or unscheduled fundraising to repay
liabilities is adverse factors for the enterprise, indicating the crisis situation of the company, which
threatens the continuity of its activities. Given the excess of cash over liabilities to maturity, we can
talk about the solvency of the company in a specific future period.
Solvency ratio based on cash flows was proposed by Efimova (2010):

6 Natalia N. Karzaeva, Ekaterina A. Karzaeva
КSt = CBt+CIt
COt (3)
Where:
КSt - solvency ratio for the period t;
T - the period for which solvency is examined. If solvency is examined for 12 months of the
planned year, then t will take values from 1 to 12;
C Bt - the amount of cash at the beginning of the period under study;
C It - cash flow for the period under study;
C Ot - cash outflow for the period under study.
However, Efimova (2010) used this ratio to assess solvency in previous periods. We propose to
put this model as the basis for building a model to assess the solvency of the company in the future.
When calculating the solvency ratio, all proceeds should be taken into account, including the
company's operating, investment and financial activities in the period under study:
КSt = CBt+COIt+ CIOt+ CFIt
COOt+ CIOt+CFOt (4)
Where:
КSt - solvency ratio for the period t;
t - the period for which solvency is examined;
C OIt - cash inflow from operating activities for the period under study;
C OOt - cash outflow from operating activities for the period under study;
C IIt - cash inflow from investing activities for the period under study;
C IOt - cash outflow from investing activities for the period under study;
C FIt - cash inflow from financing activities for the period under study;
C FOt - cash outflow from financing activities for the period under study.
Data on cash flow from investment and financial activities for the planned year is almost always
known and fixed by contracts. Also, they are not as numerous and regular as proceeds from operating
activities, so information about them should be taken from the relevant budgets. The largest categories
of cash inflows should be distinguished in the proceeds from investment and financial activities:
From investment activities
From the sale of fixed assets and intangible assets;
From the sale of interests in joint ventures, equity and debt instruments of other companies;
From loans received and provided earlier to other companies;
For other reasons characteristic of the given economic entity;
From financial activities
From issuing shares or issuing other equity instruments;
From attracting short-term or long-term debt instruments;
For other reasons characteristic of the given economic entity.
When generating cash outflows from investment and financial activities, the following payments
are taken into account:
On investment activities
Acquisition of fixed assets;
Acquisition of securities of other enterprises and the state;
Providing loans to other companies;
*Corresponding author (Natalia N. Karzaeva) Tel: +7-499-97639-41 Email: [email protected] ©2019 International Transaction Journal of Engineering, Management, & Applied Sciences & Technologies. Volume 10 No.19 ISSN 2228-9860 eISSN 1906-9642 CODEN: ITJEA8 Paper ID: 10A19I http://TUENGR.COM/V10A/10A19IM.pdf DOI: 10.14456/ITJEMAST.2019.267
7
For other reasons characteristic of the given economic entity;
On financial activities
Repayment of long-term bills, bonds, mortgage bonds;
Dividend payment;
Repayment of credits and loan obligations;
For other reasons characteristic of the given economic entity.
The most complex components of the solvency indicator assessment formula (2) are cash inflow
and outflow on operating activities. This is because the revenue recognized for the period under study
does not coincide with the cash inflow. Deviations occur when there are many obligations. Firstly,
the terms of contracts may provide for prepayments and advances. Secondly, the terms of contracts
may also provide for deferred payment. In this case, the deferral period may be different. It is
determined by the financial policy after contracts. Therefore, receivables can be settled before the
revenue recognition period and can be paid in the following periods. Also, quite often debtors violate
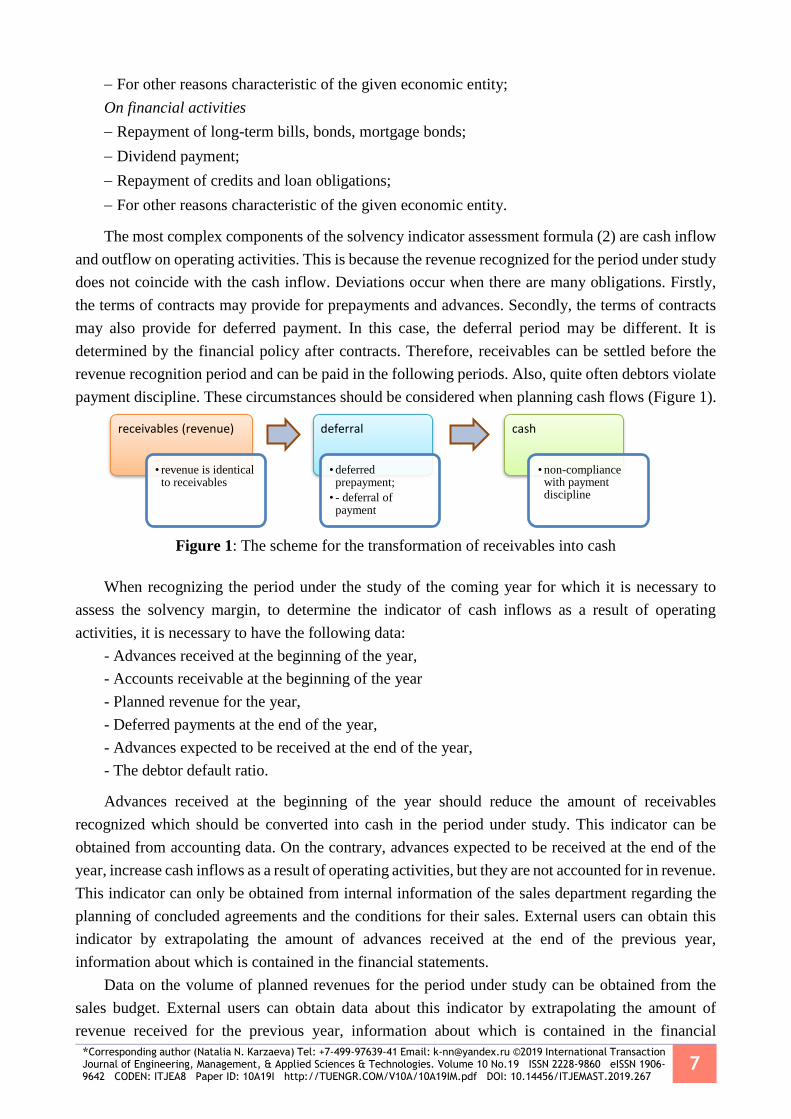
payment discipline. These circumstances should be considered when planning cash flows (Figure 1).
Figure 1: The scheme for the transformation of receivables into cash
When recognizing the period under the study of the coming year for which it is necessary to
assess the solvency margin, to determine the indicator of cash inflows as a result of operating
activities, it is necessary to have the following data:
- Advances received at the beginning of the year,
- Accounts receivable at the beginning of the year
- Planned revenue for the year,
- Deferred payments at the end of the year,
- Advances expected to be received at the end of the year,
- The debtor default ratio.
Advances received at the beginning of the year should reduce the amount of receivables
recognized which should be converted into cash in the period under study. This indicator can be
obtained from accounting data. On the contrary, advances expected to be received at the end of the
year, increase cash inflows as a result of operating activities, but they are not accounted for in revenue.
This indicator can only be obtained from internal information of the sales department regarding the
planning of concluded agreements and the conditions for their sales. External users can obtain this
indicator by extrapolating the amount of advances received at the end of the previous year,
information about which is contained in the financial statements.
Data on the volume of planned revenues for the period under study can be obtained from the
sales budget. External users can obtain data about this indicator by extrapolating the amount of
revenue received for the previous year, information about which is contained in the financial
receivables (revenue)
• revenue is identical to receivables
deferral
• deferred prepayment;
• - deferral of payment
cash
• non-compliance with payment discipline

8 Natalia N. Karzaeva, Ekaterina A. Karzaeva
statements. Of course, the indicators will vary, but the predicted data can also be calculated according
to optimistic and pessimistic scenario options.
Accounts receivable at the beginning of the period under study are included in cash inflows.
However, the receivables should be included in the inflows, taking into account the debtor’s default
rate, which can be calculated for the previous period as the quotient of dividing overdue debt by its
entire volume. The most accurate indicator will be if the values formed for the period (previous year)
are recognized as receivables and overdue receivables. However, the indicator of overdue receivables
for the year is quite difficult to obtain, so we can restrict ourselves to a ratio calculated based on the
amount of receivables and its overdue share at the end of the previous year. These data are contained
in the financial statements.
A deferral period should be set in order to exclude a part of the receivables that will be received
next year. It should be emphasized that the deferral period is not the same for different debtors.
Calculating the deferral period for each sale is a time-consuming task, even if all planned sales are
contracted. The last condition is hypothetical in nature; therefore, at the time of planning it is not
known what deferrals will be granted. In this case, there are several options for setting a deferral
period. The first option recognizes the average value of the deferred payment. For example, in
accordance with the contract policy, deferrals are granted for 15, 30 and 45 days. In this case, the
average value will be 30 days ((15 + 30 + 45) / 3). For the second option, the deferral is tied to the
sales volume. For example, it is statistically established that 50 % of sales are carried out with a
deferred payment of 15 days, 30% - 30 days, 10% - 45 days, and 10% - payment is made immediately
or before the sale.
In the first option, the amount of receivables should be reduced by the revenue of the last month
(30 days). If during planning the amount of revenue for each month is known, then the amount of
receivables decreases by the amount of revenue of the last month. If the value of sales by months has
not been established, then we can recognize it as even (1/12) or taking into account its dynamics for
the previous year, for example, 1/10. In addition, to calculate the deferred receivables determined in
days, we need to know the average daily revenue, which is calculated as the quotient of dividing the
monthly revenue by the number of days in a month (S / d).
For the second option, the calculation of the amount of receivables is more complicated. Firstly,
it is necessary to establish its value for the last two months of the year, which follows from the ability
to provide a deferral of 45 days. Secondly, the value of sales, as in the first embodiment, can be
established in various ways, which is determined by the specifics of the company.
Suppose, that in recent months equal sales of 100 € are planned. For simplicity, we assume that
there are 30 days in each month. In November, deferrals may be granted that will not be repaid in the
year under study, only for a duration of 45 days, while from 10% of revenue. A deferral of 45 days
may be granted for receivables that were recognized in the last 15 days of November, and, therefore,
cash will only be received next year. Therefore, the volume of receivables generated in November
should be reduced by 5 € (15 days x 100 revenue / 30 days x 10%). In December, also with a deferral
of 45 days, the amount of receivables will be 10 € (30 days x 100 revenue / 30 days x 10%), with a
deferral of 30 days - 30 € (30 days x 100/30 x 30%), with a deferral of 15 days - 25 € (15 days x
100/30 x 50%).
The formula for calculating the amount of receivables for which deferred payment is provided
that will be received next year, for the i-th month is as follows:
*Corresponding author (Natalia N. Karzaeva) Tel: +7-499-97639-41 Email: [email protected] ©2019 International Transaction Journal of Engineering, Management, & Applied Sciences & Technologies. Volume 10 No.19 ISSN 2228-9860 eISSN 1906-9642 CODEN: ITJEA8 Paper ID: 10A19I http://TUENGR.COM/V10A/10A19IM.pdf DOI: 10.14456/ITJEMAST.2019.267
9
Di =diDP×Si
di х kd (5)
Where:
Di - the amount of receivables for which deferred payment,
diDP - the number of days of deferred payment in i-th month,
di - the number of days in the i-th month;
Si - revenue of i-th months;
kd - the share of the revenue for which the deferral is given for this number of days.
The formula for calculating the amount of receivables for which deferred payment is provided,
which will be received next year, for all months is as follows (as the summation of Equation (5)):
∑ Di =12𝑖=1 ∑
di ×Si
di ×kd
12𝑖=1 (6)
Then the cash flow from operating activities for the year under study (COIt) can be calculated by
the formula:
COIt = (St − Di)kR − АR0 + АR1 + R0 ∙ kR (7)
or
COIt = (St − (∑di×Si
di х kd)) kR − АR0 + АR1 + R0 ∙ kR (8)
where:
St - revenue in the year under study, t;
Di: amount of receivables for which deferred payment
AR0 - the amount of advances received at the beginning of the year under study, t;
AR1 - the amount of advances planned to be received at the end of the year under study, t;
R0 - the amount of receivables at the beginning of the year under study, t;
kR – the debtor default rate concerning obligations for the year preceding the year under study, t.
The cash outflow from operating activities can be determined from the procurement budget.
However, similarly to the cash inflows and receivables ratio recognized for the period under study of
the acquisition, they do not coincide with cash outflows. These discrepancies are also caused by the
advances or deferred payments stipulated by the agreements. Therefore, accounts payable can be
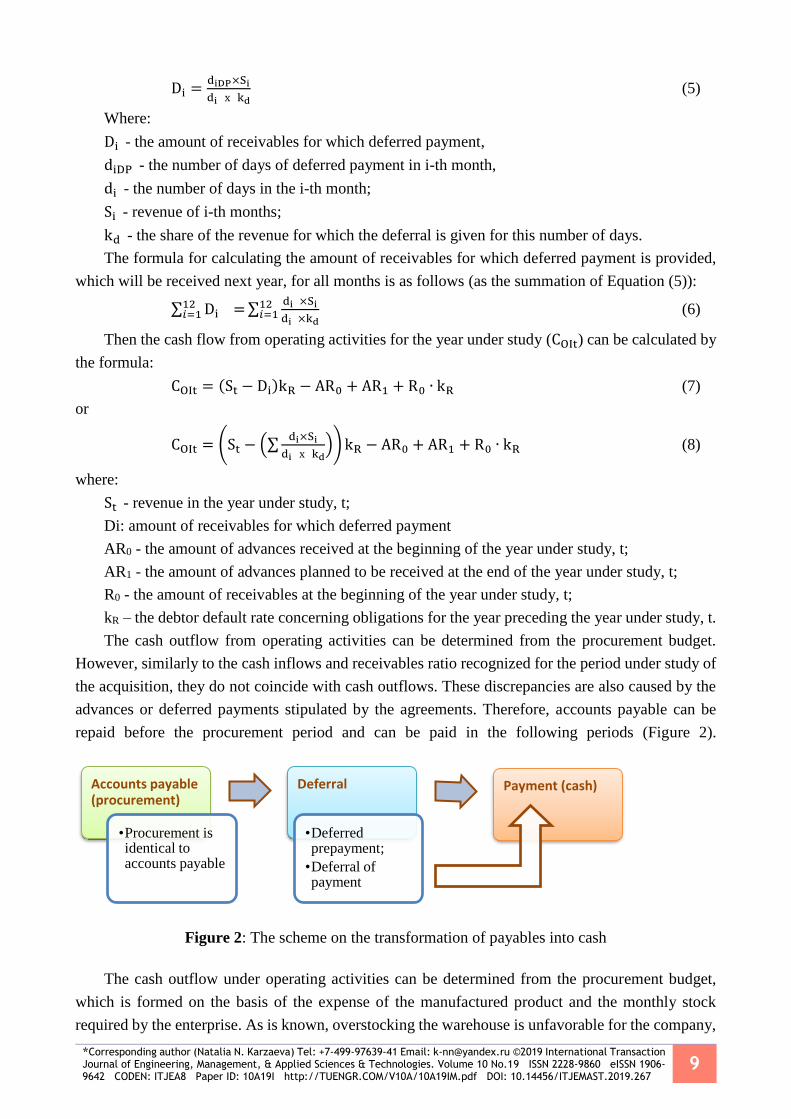
repaid before the procurement period and can be paid in the following periods (Figure 2).
Figure 2: The scheme on the transformation of payables into cash
The cash outflow under operating activities can be determined from the procurement budget,
which is formed on the basis of the expense of the manufactured product and the monthly stock
required by the enterprise. As is known, overstocking the warehouse is unfavorable for the company,
Accounts payable (procurement)
•Procurement is identical to accounts payable
Deferral
•Deferred prepayment;
•Deferral of payment
Payment (cash)

10 Natalia N. Karzaeva, Ekaterina A. Karzaeva
however, the need for a certain stock is due to a number of factors:
Logistic leverage (the longer the batch of goods delivery period, the greater should be its stock
in the warehouse)
Providing a discount to the supplier when purchasing a certain volume of products;
Contractual relationships with customers, assuming the constant availability of a certain
amount of products in stock (with regular shipments to key customers);
Expanding the customer base and increasing sales.
The optimal size of the stock (St) at each enterprise is determined based on the specifics of the
business and is individual. But for calculating the volume of purchases it can be set in proportion to
the amount of material expenses (Cm) for the production of the product (n). To calculate the required
purchase indicator (Cu), we can use the standard balance equation:
St 0.+ Cu - Сm = n Сm (9),
where
St 0 - the value of stocks at the beginning of the month;
Cu - the volume of purchases in a month;
Cm - the value of material expenses for the production of the entire volume of products per
month;
n Сm - the amount of stocks sufficient to ensure a continuous production process.
Then the volume of i-th purchases in one month (Cui) will be
Cui = n St1 − St0 + Cmi (10),
where
i - serial number of the month,
n - the number of cases
St1 - revenue in the year under study;
Cmi - the value of material expenses for month i
The volume of purchases (in a period t) Cut and, therefore, accounts payable per year can be
determined by the formula
Cut = n St1 − St0 + ∑ Cmi12i=1 (11).
The term Cmi is related to the value of material expenses for the i-th production of the entire
volume of products.
The formula for calculating the amount of accounts payable (CI), according to which deferred
payment is provided, and which will be paid next year, for the i-th month:
CIi =diDP×Cui
di х kd (12),
where:
CIi - amount of accounts payable for i-th product,
d iDP - the number of days of deferred payment in i-th month,
d i - the number of days in the i-th month;
Cui - procurement volume in the i-th month;
kd is the share of purchases for which a delay is granted in a given number of days.
The formula for calculating accounts payable for which deferred payment is provided, which will
*Corresponding author (Natalia N. Karzaeva) Tel: +7-499-97639-41 Email: [email protected] ©2019 International Transaction Journal of Engineering, Management, & Applied Sciences & Technologies. Volume 10 No.19 ISSN 2228-9860 eISSN 1906-9642 CODEN: ITJEA8 Paper ID: 10A19I http://TUENGR.COM/V10A/10A19IM.pdf DOI: 10.14456/ITJEMAST.2019.267
11
be received next year, for all months:
∑ CIi =12i=1 ∑
di ×Cui
di ×kd
12i=1 (13)
The value of predicted material expenses for the period under study can be obtained by internal
users from the expense budget. External users can obtain this indicator value by extrapolating the
amount of material expenses received for the previous year; information about it is contained in the
financial statements. However, it is difficult to establish the required volume of stocks, but we can
use the data on stocks of raw materials from financial statements. External users can also calculate
predicted expense data using optimistic and pessimistic options.
The deferred payment is determined similarly to the procedure for its calculation for buyers and
customers. Given the uniform distribution of payments, an adjustment must be made for the number
of days of deferred payments. As with client payments, when calculating payments to suppliers, it is
appropriate to apply a methodology for shifting payments between periods and focusing on the time
of purchase within the same reporting period.
In addition to payments, suppliers of material assets must include in the calculation of cash
outflows the salaries and other payments to employees of the company, contributions to social
insurance funds, and payments for production services provided by counterparties, for example, the
supply of electricity, water and heat, etc., and also paying taxes. This information can be obtained by
internal users from the expense budget. External users can obtain this indicator by extrapolating the
relevant information contained in the financial statements.
Then the cash outflow from operating activities for the year under study (COOt) can be calculated
from
COOt = (Cut − CIi) + (Pt − CIpi) + CL + CIF + T − АI0 + АI1 + CI0 (14),
or
COOt = (Cut − (∑di×Cui
di х kd)) + (Pt − (∑
di×PCi
di х kd)) + CL + CIF + T − АI0 + АI1 + CI0
(15),
where
CIpi - contributions to pay for the i-th product,
Cut - purchases in the year under study, t;
Pt - payables to suppliers and contractors for the services rendered, consumed in the production
process for the year under study, t;
PCi - costs of production services for the year under study, t;
АI0 - the amount of advances issued at the beginning of the year under study, t;
АI1 - the amount of advances planned for payment at the end of the year under study, t;
CI0 - payables at the beginning of the year under study, t;
CL – wages to employees for the year under study, t;
CIF - contributions to insurance funds for the year under study, t;
T - tax payments in the year under study t.
The general formula for predicted solvency, taking into account all the factors that influence it,
will take the form

12 Natalia N. Karzaeva, Ekaterina A. Karzaeva
CBt + CIt + CFit + ((St –∑di×Si
di х kd))kR − АR0 + АR1+ R0 х kR
CIOt + CFOt + (Cut –(∑di×Si
di х kd))+ (Pt – (∑
di×PCidi х kd
))+CL+CIF+T− АI0+ АI1+ CI0
(16)
CFit – cash inflow from financing activities for the period under study;
CFOt – cash outflow from investing activities for the period under study;
CBt –the amount of cash at the beginning of the period under study;
CIOt – cash outflow through the period of t
CL - cash inflow from operating activities for the period under study;
CIF - cash inflow of financial activities;
T- the time period
CIt - cash inflow from investing activities for the period under study;
Si- revenue i-th product under the study
CI0 - cash inflow from investing activities for initial activity;
4. CONCLUSION
This study gives significant results. It was proposed to evaluate the solvency of a company not
on the date of preparation of its accounting (financial) statements, but in the future (next year), taking
into account both the planned cash inflows and obligations arising in the period under study. In
connection with the existing restrictions on the use of existing methods for assessing solvency, an
approach is substantiated to construct a model of predicted solvency based on cash flows (monetary
approach). By lengthening the classical model period, a new model for assessing predicted solvency
based on cash flows has been built by comparing future earnings and upcoming payments of the
enterprise in the future period under study. A model for the conversion of receivables and payables
into cash through a deferral indicator was developed in order to maximize the accuracy of prediction
values and the reliability of the methodology as a whole. The possibility of using the predictive
solvency model not only by company specialists but by external stakeholders is shown.
Based on the model of the predicted annual solvency of a company, it is possible to build
solvency assessment models for shorter periods: six months, a quarter, and a month. This is important
for planning the financial activities of the company and will allow its managers to timely develop
tools to prevent insolvency threats.
5. DATA AND MATERIAL AVAILABILITY Relevant information regarding this study is available by request to the corresponding author.
6. REFERENCES Kovalev V.V. Financial analysis: methods and procedures, - M.: Finansy i statistika, 2006. 559p.
Gradov, A. P. (2007). Economic strategy of the company. SPb.: Special literature, 959p.
Efimova, O. V. (2010). Finansovyi analiz. Sovremennyi instrumentarii dlia priniatiia ekonomicheskikh
reshenii.[Financial analysis. Modern tools for economic decisions]. Moscow. Omega-L Publ.
Krejnina, M. N. (2010). Financial condition of the enterprise. Methods of estimation. M.: IKC "DIS". 224p.
Savickaya, G. V. (2000). Analiz hozyajstvennoj deyatel'nosti predpriya-tiya [Analysis of economic activity of
*Corresponding author (Natalia N. Karzaeva) Tel: +7-499-97639-41 Email: [email protected] ©2019 International Transaction Journal of Engineering, Management, & Applied Sciences & Technologies. Volume 10 No.19 ISSN 2228-9860 eISSN 1906-9642 CODEN: ITJEA8 Paper ID: 10A19I http://TUENGR.COM/V10A/10A19IM.pdf DOI: 10.14456/ITJEMAST.2019.267
13
the enterprise], Minsk, 688 p.
Sheremet, A. D. (2009). Kompleksnyi analiz khozyaistvennoi deyatel’nosti: uchebnik dlya vuzov [A
comprehensive analysis of economic activity: a textbook]. Moscow, INFRA-M Publ.
Lukasevich, I. Y. A. (2010). Financial management: a textbook. M.: Eksmo, 2, 768.
Melnik, M. V., & Gerasimova, E. B. (2007). The analysis of financial and economic activity on the enterprises:
the manual. M.: INFRA-M.
Seleznev, N. N., & Ionova, A. F. (2010). Financial analysis: Textbook. M: UNITY DANA.
Arens, A. A., Elder, R. J., & Mark, B. (2012). Auditing and assurance services: an integrated approach.
Boston: Prentice Hall.
Jooste, L. (2007). An evaluation of the usefulness of cash flow ratios to predict financial distress. Professional
Accountant, 7(1), 1-13.
Maverick, J. B. (2015). Key financial ratios to analyze the mining industry. Investopedia, 08(26), 56-82.
Kieso, D. E., Weygandt, J. J., & Warfield, T. D. (2014). Intermediate Accounting IFRS. Edition (USA: Wiley).
Ernst &. Young. (2013). International GAAP 2013: Generally Accepted Accounting Principles Under
International Financial Reporting Standards. Wiley.
Beaver, W. H. (1966). Financial ratios as predictors of failure. Journal of accounting research, 71-111.
Flynn, D., Koornhof, C., Kleynhans, J. E., Meyer, L. A., Posthumus, L., Arendse, R., & Muriro, E. (2016).
Fundamental Accounting. Juta & Company Ltd, 788p.
Karzaeva, N. N. (2015). The scope of the solvency ratios in evaluating the continuity of the activities of
economic entities. Accounting, Analysis, Audit, 2, 31-36.
Karzaeva, N. N., & Karzaeva, E. A. (2016). Tools to improve the solvency of economic entities. Accounting,
Analysis, Audit, 4, 33-41.
Rittenberg, L. E., Schwieger, B. J., & Johnstone, K. M. (2008). Auditing: A Business Risk Approach 6. bs.
Mason, USA: Thomson South-Western.
Beams, F. A., Anthony, J. H., Bettinghaus, B., & Smith, K. A. (2016). Advanced accounting. Pearson
Education Limited 2018.
Sandström, A. (2016). Handbook of solvency for actuaries and risk managers: theory and practice. Chapman
and Hall/CRC.
Yusubova, G. K. (2016). Evolution of accounting methodology and cash flow analysis. Avtoref. dis. kand.
ekon. nauk: 08.00.10. Sankt-Peterburg, 25p.
Kogdenko, V. K. (2015). Methods of analysis of the consolidated statement of cash flows. Economic analysis:
theory and practice, 32, 335-341.
Sandulova, E. V., & Kotlyar, I. A. (2017). Cash flows in assessing the solvency of the organization. Current
research: from theory to practice proceedings of the International scientific-practical conference under
the General editorship of A. I. Vostretsov. Novosibirsk: Publishing house CRNS. 187-190.
Professor Dr.Natalia N. Karzaeva is Professor and Head of the Department of Economic Analysis and Audit of the RSAU - Moscow Agricultural Academy named after K.A. Timiryazev. She holds a Doctor of Economics degree. She graduated with honors in Economic Cybernetics from the N.A. Leningrad Financial and Economic Institute Voznesensky specializing. She is interested in Accounting, Statistics. Labor Activity.
Ekaterina A. Karzaeva is an Assistant to the Department of Economic Security, Analysis and Audit. She graducated from St. Petersburg State University of Economics and Finance, and Askeri Institute of Professional Managers, ACCA DipFM program. She is interested in Internal Control and Audit of the Group of Companies Reporting, Budgeting, and Management Accounting Methodology.