METHODOLOGY Open Access Global tests of P-values for … · 2017-08-25 · METHODOLOGY Open Access...
17
METHODOLOGY Open Access Global tests of P-values for multifactor dimensionality reduction models in selection of optimal number of target genes Hongying Dai 1* , Madhusudan Bhandary 2 , Mara Becker 3 , J Steven Leeder 3 , Roger Gaedigk 3 and Alison A Motsinger-Reif 4 Abstract Background: Multifactor Dimensionality Reduction (MDR) is a popular and successful data mining method developed to characterize and detect nonlinear complex gene-gene interactions (epistasis) that are associated with disease susceptibility. Because MDR uses a combinatorial search strategy to detect interaction, several filtration techniques have been developed to remove genes (SNPs) that have no interactive effects prior to analysis. However, the cutoff values implemented for these filtration methods are arbitrary, therefore different choices of cutoff values will lead to different selections of genes (SNPs). Methods: We suggest incorporating a global test of p-values to filtration procedures to identify the optimal number of genes/SNPs for further MDR analysis and demonstrate this approach using a ReliefF filter technique. We compare the performance of different global testing procedures in this context, including the Kolmogorov-Smirnov test, the inverse chi-square test, the inverse normal test, the logit test, the Wilcoxon test and Tippett’s test. Additionally we demonstrate the approach on a real data application with a candidate gene study of drug response in Juvenile Idiopathic Arthritis. Results: Extensive simulation of correlated p-values show that the inverse chi-square test is the most appropriate approach to be incorporated with the screening approach to determine the optimal number of SNPs for the final MDR analysis. The Kolmogorov-Smirnov test has high inflation of Type I errors when p-values are highly correlated or when p-values peak near the center of histogram. Tippett’s test has very low power when the effect size of GxG interactions is small. Conclusions: The proposed global tests can serve as a screening approach prior to individual tests to prevent false discovery. Strong power in small sample sizes and well controlled Type I error in absence of GxG interactions make global tests highly recommended in epistasis studies. Keywords: P-value, Global tests, ReliefF, Multifactor dimensionality reduction Background Recent advances in genotyping technology have allowed for the rapid and easy interrogation of large numbers of genetic variants for association with common, complex disease. While there have been a number of successes in association mapping studies, the associations found typic- ally explain very little of the overall heritability of the traits being studied. There are several potential reasons for this “missing heritability”, and one of those potential explana- tions is epistatic interactions (gene-gene interactions). It is hypothesized that such interactions play an important role in the etiology of complex (non-Mendelian) traits, but detecting such interactions presents a number of statistical and computation challenges [1]. In response to these chal- lenges, a number of new data-mining approaches have been developed [2]. Multifactor Dimensionality Reduction (MDR) is a popu- lar and highly successful statistical method developed to * Correspondence: [email protected] 1 Department of Medical Research, Children’s Mercy Hospital, 2401 Gillham Road, Kansas City, MO 64108, USA Full list of author information is available at the end of the article BioData Mining © 2012 Dai et al.; licensee BioMed Central Ltd. This is an Open Access article distributed under the terms of the Creative Commons Attribution License (http://creativecommons.org/licenses/by/2.0), which permits unrestricted use, distribution, and reproduction in any medium, provided the original work is properly cited. Dai et al. BioData Mining 2012, 5:3 http://www.biodatamining.org/content/5/1/3
Transcript of METHODOLOGY Open Access Global tests of P-values for … · 2017-08-25 · METHODOLOGY Open Access...
BioData MiningDai et al. BioData Mining 2012, 5:3http://www.biodatamining.org/content/5/1/3
METHODOLOGY Open Access
Global tests of P-values for multifactordimensionality reduction models in selectionof optimal number of target genesHongying Dai1*, Madhusudan Bhandary2, Mara Becker3, J Steven Leeder3, Roger Gaedigk3
and Alison A Motsinger-Reif4
Abstract
Background: Multifactor Dimensionality Reduction (MDR) is a popular and successful data mining methoddeveloped to characterize and detect nonlinear complex gene-gene interactions (epistasis) that are associated withdisease susceptibility. Because MDR uses a combinatorial search strategy to detect interaction, several filtrationtechniques have been developed to remove genes (SNPs) that have no interactive effects prior to analysis.However, the cutoff values implemented for these filtration methods are arbitrary, therefore different choices ofcutoff values will lead to different selections of genes (SNPs).
Methods: We suggest incorporating a global test of p-values to filtration procedures to identify the optimalnumber of genes/SNPs for further MDR analysis and demonstrate this approach using a ReliefF filter technique. Wecompare the performance of different global testing procedures in this context, including the Kolmogorov-Smirnovtest, the inverse chi-square test, the inverse normal test, the logit test, the Wilcoxon test and Tippett’s test.Additionally we demonstrate the approach on a real data application with a candidate gene study of drugresponse in Juvenile Idiopathic Arthritis.
Results: Extensive simulation of correlated p-values show that the inverse chi-square test is the most appropriateapproach to be incorporated with the screening approach to determine the optimal number of SNPs for the finalMDR analysis. The Kolmogorov-Smirnov test has high inflation of Type I errors when p-values are highly correlatedor when p-values peak near the center of histogram. Tippett’s test has very low power when the effect size of GxGinteractions is small.
Conclusions: The proposed global tests can serve as a screening approach prior to individual tests to prevent falsediscovery. Strong power in small sample sizes and well controlled Type I error in absence of GxG interactions makeglobal tests highly recommended in epistasis studies.
Keywords: P-value, Global tests, ReliefF, Multifactor dimensionality reduction
BackgroundRecent advances in genotyping technology have allowedfor the rapid and easy interrogation of large numbers ofgenetic variants for association with common, complexdisease. While there have been a number of successes inassociation mapping studies, the associations found typic-ally explain very little of the overall heritability of the traits
* Correspondence: [email protected] of Medical Research, Children’s Mercy Hospital, 2401 GillhamRoad, Kansas City, MO 64108, USAFull list of author information is available at the end of the article
© 2012 Dai et al.; licensee BioMed Central LtdAttribution License (http://creativecommons.oany medium, provided the original work is pr
being studied. There are several potential reasons for this“missing heritability”, and one of those potential explana-tions is epistatic interactions (gene-gene interactions). It ishypothesized that such interactions play an important rolein the etiology of complex (non-Mendelian) traits, butdetecting such interactions presents a number of statisticaland computation challenges [1]. In response to these chal-lenges, a number of new data-mining approaches havebeen developed [2].Multifactor Dimensionality Reduction (MDR) is a popu-
lar and highly successful statistical method developed to
. This is an Open Access article distributed under the terms of the Creative Commonsrg/licenses/by/2.0), which permits unrestricted use, distribution, and reproduction inoperly cited.

Dai et al. BioData Mining 2012, 5:3 Page 2 of 17http://www.biodatamining.org/content/5/1/3
detect and characterize nonlinear complex gene-gene orgene-environment interactions (epistasis) that could beassociated with disease susceptibility. The method was firstproposed by Ritchie et al. [3] to detect estrogen-metabolismgene interactions associated with sporadic breast cancer.MDR has several advantages over more traditional statisticalapproaches such as logistic regression modeling: 1) MDR isa non-parametric approach with no requirement to the dis-tribution of data. 2) MDR can analyze non-linear associa-tions in genotypic combinations. 3) MDR has improvedpower to detect gene-gene interaction in small to moderatesample sizes. Since the introduction of the original MDRimplementation, many works have been published to im-prove modeling and prediction accuracy with the MDRmethod. For more information on the history and develop-ment of the method, please refer to the comprehensive re-view of the MDR and its extended methods by Moore [4].While the MDR approach is widely used, to make
this paper self-contained, we give a brief descriptionof the method. MDR is often applied to genotypicdata to detect gene-gene (GxG) interactions amongsingle nucleotide polymorphism (SNP) and the ori-ginal implementation of this method can be extendedto detect the interactions in other types of data whenthe explanatory variables are categorical variables andthe outcome variable is binary. As the scale of associ-ation studies has expanded (with larger numbers ofSNPs), a filtration step is often implemented in thefirst step of MDR analysis to remove noisy SNPs. Inthis step, a subset of genes that are unlikely to inter-act with others is removed by filtration methods suchas SURF [5], TuRF [6] etc. ReliefF [7], has become acommonly applied filter, and we will focus on this fil-ter in the current study. After this step, the remainingSNPs are used for the dimensionality reduction andmodel selection steps of the MDR algorithm. In thisstep, all variable combinations are considered for k-way (k = 2, 3, 4 . . .) interactions. For each multi-locuscombination, the ratio of cases to controls within eachcontingency table cell is calculated, and then each cellis assigned a status of high-risk or low-risk by com-paring this ratio to the ratio of cases: controls in theoverall dataset. Cells with a ratio greater than the overallratio are assigned “high-risk” status, and those with a ratiolower than the overall ratio are assigned “low-risk” status.Subsequently, a balanced classification accuracy is calcu-lated for each multi-locus combination, and the optimalmodel is selected based on the highest balanced accuracy.This model selection approach is performed in concert witha cross-validation procedure, usually 10-fold, which ran-domly divides the whole data set into a training set and avalidation set. The testing accuracy is the balanced accuracywhen the classification rule developed from the trainingdata set is applied to the testing data set. The cross
validation count (CVC) summarizes the number of times amodel is the top model in each of the cross-validation splitsof the data. The optimal k-way (k=2, 3, 4 . . .) interactionmodel with the highest training accuracy and the highestCVC is then selected as the winner model. Finally, the sig-nificance of the selected optimal model is assessed by per-mutation testing (comparing the testing/predictionaccuracy against the empirical distribution built by at least1000 permutations). MDR can be performed by an opensource software mdr2.0 and model goodness-of-fit and sig-nificance can be assessed using software mdrpt1.0 [8] or inthe MDR.R R software package [9].In this work, we seek to address two existing issues in the
current MDR analysis. First, current filtration approachesdo not evaluate the significance of the SNPs considered (orprovide p-value for their measures) and there is no clearguideline for the cutoff point of such filtration measures.This leads inconsistency in the optimal number of SNPsremaining for the final MDR analysis.Second, as there is a growing appreciation that the eti-
ology of human diseases is extremely complex, many inves-tigators are using MDR to evaluate many potentialinteractive effects, and not just a single final best model[10]. In this type of approach, not one but numerous testscan be performed in search of an optimal model in the k-way interaction, as the number of partitions for k-way inter-
action over m loci ismk
� �¼ m!
k! m�kð Þ! . For instance, if an
investigator is interested to detect significant 2-wayinteractions among 50 SNPs, 1225 tests will be performedwhich will inflate the family-wise Type I error rate
to 1� 1� αð Þmk
� �¼ 1� 1� 0:05ð Þ1225 � 1, where
α ¼ 0:05 is the nominal error rate for an individual testwithout proper control.
False discoveries and losing power to detect the signalafter the multiplicity adjustment are two concurrent issuesin analyzing high dimensional data. Instead of replacing allthe existing methods to control the false discovery, wepropose to add the global tests to the current MDR frame-work as an ad-hoc screening process to prevent false dis-coveries. We will explain the rationale and utility of globaltests in Section Global tests.
Incorporating global tests within the filtration proce-dures can reveal a trend of gene interactive patternswhen noisy genes (SNPs) are removed step by step usingReliefF or other filtration techniques. In the currentstudy, we demonstrate this approach in a candidate genestudy of drug response in Juvenile Idiopathic Arthritis,using the ReleifF filter. Additionally, we perform a simu-lation study comparing several different global testingapproaches for a range of genetic etiologies to comparethe power of different approaches.
Dai et al. BioData Mining 2012, 5:3 Page 3 of 17http://www.biodatamining.org/content/5/1/3
MethodsGlobal testsThe idea of global testing is to assess the patterns ofp-values from multiple testing of k way interactions among
m loci (n ¼ mk
� �¼ m!
k! m�kð Þ!tests). Under the null hypoth-
esis of no GxG interactions, the p-values will follow uni-form (0, 1). To see this, let T be the test statistic with thecumulative distribution function (CDF) F0(t) and the inverseCDF F�1
0 tð Þ for t 2 R under H0. Let P be the p-valuecorresponding to the test statistic T. Under H0, we havePr P ≤ pð Þ ¼ Pr F�1
0 Pð Þ ≤ F�10 pð Þ� � ¼ F0 F�1
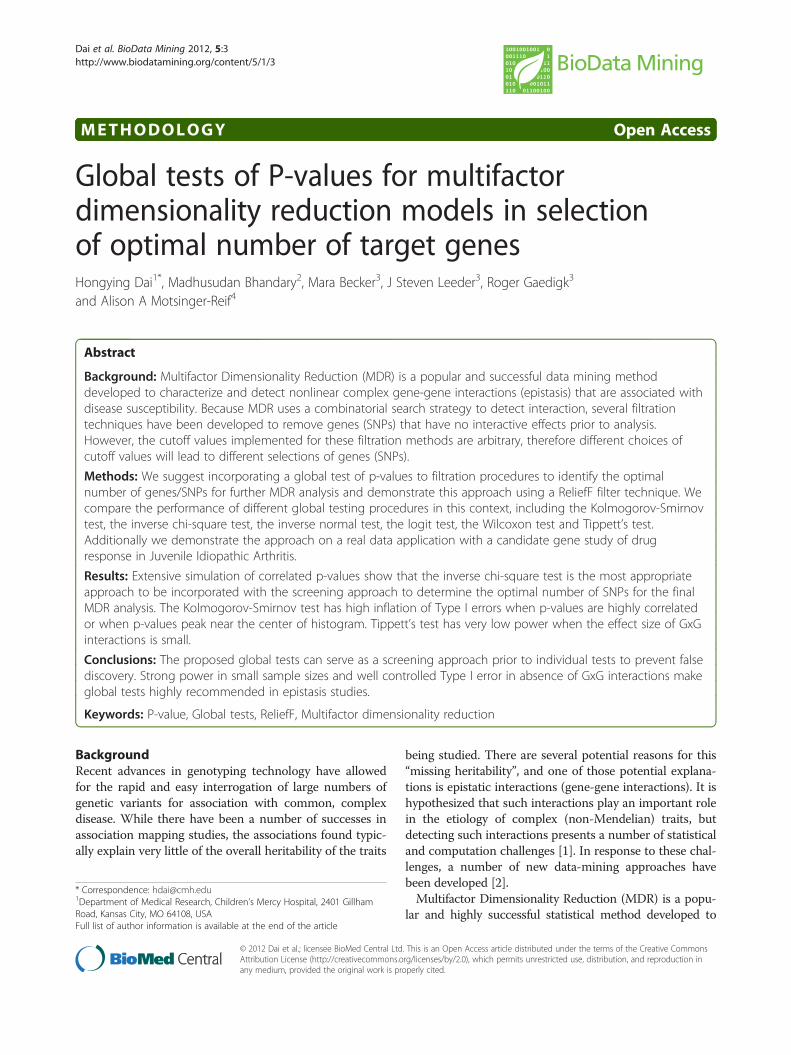
0 pð Þ� � ¼ p forp 2 0;1ð Þ (Pattern 1 in Figure 1).When a proportion of m loci have k-way interactions
(Hα), it is expected to observe the p-values shifting towards 0.To see this, let F(t) be the CDF under Hα and F tð Þ >F0 tð Þ for t 2 R, then Pr P≤pð Þ ¼ Pr F�1
0 Pð Þ� �≤F�1
0 pð ÞÞ ¼F F�1
0 pð Þ� �> p for p 2 0;1ð Þ (Pattern 2 in Figure 1). Due
to correlations/linkage disequilibrium among SNPs and theredundancy of SNPs in high order models, sometimes p-values shift toward 1, i.e. Pr P≤pð Þ < p for p 2 0;1ð Þ(Pattern 3 in Figure 1). When p-values are correlated, theymight peak near center of histogram (Pattern 4 in Figure 1).Patterns 3 and 4 are deviated from uniformity but they donot indicate potential k-way interactions among m loci.
Pattern 1− Uniform(0,1) (no GxG)
P−value (min p= 0.000111 )
Fre
quen
cy
0.0 0.2 0.4 0.6 0.8 1.0
040
80
Fre
quen
cy
Pattern 3 − shift to 1 (no GxG)
P−value (min p= 0.00617 )
Fre
quen
cy
0.0 0.2 0.4 0.6 0.8 1.0
050
100
150
P
Fre
quen
cy
Figure 1 Four patterns of p-values.
The rationale of global testing is to ensure p-values arenot randomly and uniformly distributed (Pattern 1) beforewe investigate each single p-value. Correlated p-valueswithout significant effects (H0) might even shift toward 1or peak near the center (Patterns 3 and 4). The goals areto rule out Patterns 1, 3 and 4 and only move forward tothe final MDR analysis when p-values are in Pattern 2.If the entire set of p-value follows a uniform distribu-
tion, then it is very likely for a small p-value to be a falsediscovery by chance. As shown in Figure 1, the entire setof p-values might have four different Patterns: uniform,shifting to 0, shifting to 1 or peak near the center. In allfour cases, we notice that the minimum p-values are lessthan 0.05 (0.0001111 in Pattern 1, 2.65e-6 in Pattern 2,0.00617 in Pattern 3 and 0.003734 in Pattern 4). If wetake the distribution of the entire set of p-values into ac-count, then the minimum p-values in Patterns 1, 3 and 4are false discoveries by chance.
Combined global testing and filtration techniqueA global test will serve as an ad-hoc diagnostic tool to examall p-values from k-way interactions among m genes inMDR-analysis. These p-values come from empirical distri-butions generated through permutation testing. LetP ¼ pi i ¼ 1;2;⋯;nð Þ be identical and independently
Pattern 2 − shift to 0 (GxG)
P−value (min p= 2.65e−06 )
0.0 0.2 0.4 0.6 0.8 1.0
010
020
030
0
attern 4 − peak near center (no GxG)
P−value (min p= 0.003734 )
0.0 0.2 0.4 0.6 0.8 1.0
050
100
150
Dai et al. BioData Mining 2012, 5:3 Page 4 of 17http://www.biodatamining.org/content/5/1/3
distributed (i.i.d.) p-values from the MDR analysis of k–way
interactions among m–loci (n ¼ mk
� �¼ m!
k! m�kð Þ!). We will
consider a one-sided test to compare
H0 : PeUniform 0; 1ð ÞversusHa : Pr P ≤ pð Þ > p for p 2 0; 1ð Þ
8<: ð1Þ
Rejecting H0 indicates significant GxG interactions insome target genes.We propose incorporating global testing of p-values with
ReliefF [7] gene filtration technique to detect the patternsof k-way GxG interaction among m genes (SNPs) and re-move noisy genes (SNPs) with little interactive effects todetermine the optimal number of SNPs for the final MDRanalysis. The ReliefF algorithm estimates weights to meas-ure the potential accuracy of attributes in prediction ofphenotype. The redundant attribute will be assigned alower score. When applied in gene-gene interactions, ahigher ReliefF score indicates a stronger interactive effectfor the corresponding gene (SNP). ReliefF algorithm firstuses x- nearest neighborhood approach x ¼ 1;2;⋯;mð Þ tomatch a selected subject with x subjects in neighborhood(with shortest distances across all SNPs) from the controlgroup and from test group respectively. An attribute (SNP)will be assigned score 1 (−1) if the attribute from theselected subject matches (mismatches) one of x nearestsubjects from the same phenotype group. Similarly, an at-tribute will be assigned score −1 (1) if the attribute fromthe selected subject matches (mismatches) one of the near-est subjects from the different phenotype group. The scorewill be aggregated for all subjects and normalized (divided)by the total number of subjects and neighbors. Detailed de-scription of ReliefF algorithm for filtering genotyping datacan be found in Section 3 of [4].The flow chart of the testing procedure is presented in
Figure 2. Starting with a set of m candidate SNPs, per-form the ReliefF algorithm on m SNPs and sort SNPs byReliefF scores in an ascending order. Generate p-valuesfor the exhaustive search of k-way interactions among atotal of m SNPs using the original or extended MDRmethods. For each k-way interaction, one p-value of MDRanalysis is generated by permutation test. Let m1 be thenumber of remaining SNPs. Perform the global testing onm1
k
� �p-values. Remove one SNP that has the lowest
ReliefF score and all interactions corresponding to thisSNP. Perform the global testing about hypothesis testing(1) on the p-values of the k-way interactions of theremaining SNPs. Continue to remove SNPs with the lowestReliefF score one by one and perform global testing aftereach removal of a SNP. One can stop the process when theremaining SNPs reach a predetermined minimum number.
Choose the optimal number of SNPs for the final MDRanalysis as the largest number of SNPs with global testingp-value< α. Often we set α ¼ 0:05. To be more rigorousof controlling family-wise Type I error, one can apply FDRalgorithm on the global testing p-values and the first p-value with FDR< 0.05 will determine the optimal numberof SNPs.
Global tests of P-valuesHere we introduce 6 global tests that can be applied totest hypothesis (1). These six tests are based on differentapproaches to detect deviation from uniformity. We willsurvey these methods and compare their power using acase study and Monte-Carlo simulations.
Test 1 one sided Kolmogorov-Smirnov test [KS]KS test is a non-parametric test that can be appliedto compare the distance between an empirical distribu-tion of i.i.d. p-values and Uniform(0, 1). For hypoth-esis test (1), define the one-sided KS statistic as
Dþn ¼ supp
1n
Pi¼1
nI pi≤pf g � p
!, where I pi≤pf g is an indicator
function which equals 1 if pi≤pand 0 if pi > p . Accordingto [11], the p-value of one-sided KS test follows
n 1� tð Þ½ � is the largest integer not greater than n 1� tð Þand t 2 0;1ð Þ.
Test 2 one-sided inverse chi-square test [inverse chi]
Test 3 one sided inverse normal test [inverse norm]Transform p-value to normal z score by lettingzi ¼ Φ�1 pið Þ where Φ�1 is inverse cumulative normal
distribution. Under H0, Z ¼ Pi¼1
nzi
!=ffiffiffin
p e N 0;1ð Þ . For
one sided test (1), reject H0 if Z<Zα where Zα isα � 100% percentile of the standard normal distribution.
Test 4 one sided logit test [logit]
Logit transform p-value by letting L ¼Pi¼1
nln pi= 1� pið Þð Þ.
[13] shows that under H0, the distribution of L can be
Fisher [12] shows that if pii:i:d:e Uniform 0; 1ð Þ for
i ¼ 1;2;⋯;n , then �2Pi¼1
nln pið Þ e χ22n where χ22n is chi-
square distribution with 2n degrees of freedom. For a one
sided test (1), reject H0 if �2Pi¼1
nln pið Þ > χ22n;1�α where
χ22n;1�α is 1� αð Þ � 100% percentile of χ22n.
Pr Dþn > t
� � ¼ tPi¼0
n 1�tð Þ½ � ni
� �1�t�i=nð Þn�i tþi=nð Þi�1 where

Start with a total of SNPs.
Perform the ReliefF algorithm on SNPs. Sort SNPs by ReliefF scores in an ascending order.
Let be the number of remaining SNPs. At the beginning, = .
Perform the global test on p-values
regarding all -way interactions among remaining SNPs.
Test: ~ (0,1) vs.: Pr( ) > for (0,1).
If the global test fails to reject , thenremove one SNP with the lowest ReliefF score;let = 1;let = .
If the global test rejects , thenp-values shift towards 0 (Pattern 2 in Figure 1).the optimal number of SNPs for the final MDR analysis is .
Perform the final MDR analysis on the remaining SNPs.
Generate p-values for the exhaustive search of -way interactions among a total of SNPs using the original or extended MDR methods.
Figure 2 Flow chart of global testing of p-values in conjunction with filtration process.
Dai et al. BioData Mining 2012, 5:3 Page 5 of 17http://www.biodatamining.org/content/5/1/3
closely approximated by Student’s t-distribution with 5nþ 4
degrees of freedom, namely L� ¼ Lffiffiffiffiffiffiffiffiffiffiffiffiffiffiffiffi3 5nþ4ð Þ
π2n 5nþ2ð Þq
� t5nþ4 .
Therefore, for one-sided test (1), we can reject H0
if L� < t5nþ4;αwhere t5nþ4;α is α � 100% percentile of thet-distribution.
Test 5 one sided Wilcoxon test [Wilcoxon]Order n p-values from MDR testing along with n2 obser-vations randomly drawn from Uniform(0,1) from leastto greatest and denote them by S1;S2;⋯;SN withN ¼ nþ n2. Let W be the sum of the ranks correspondingto n p-values from MDR testing. For one-sided test (1), wecan reject H0 if W≤n N þ 1ð Þ � ωαwhere the constant ωα
is chosen to make the Type I error probability equal α.Values of ωα are given in Table A6 by [14]. For large
sample sizes, i.e. min(n,n2) going to infinity, one can applynormal approximation on the standardizedW.
Test 6 Tippett and Wilkinson’s test [Tippett]Tippett’s Test [15] is based on the property of the min-imal p-value in multiple testing. Let p 1ð Þ;p 2ð Þ;⋯;p nð Þ bethe ordered p-values in an ascending order. Whenp-values identically and independently follow Uniform(0,1) distribution, Tippett’s test will reject H0 if
p 1ð Þ < 1� 1� αð Þ1=n. The p-value of Tippett’s test equals1� 1� p 1ð Þ
� �n. Tippett’s test is very easy to perform but
it only takes the smallest p-value into account.Wilkinson [16] extended Tippett’s procedure to the rth
smallest p-values where r ¼ 1;2;⋯;n. By expandingαþ 1� αð Þð Þn , Wilkinson tabulated the probability,
Table 1 List of 25 SNPs from 17 candidate genes in thefolate pathway
SNP RS # MAF*
ABCG2 C> T rs7699188 0.13
ABCG2 15846 A>C no rs [35] 0.01
ABCG2 G> A rs35252139 0.13
ABCG2 A>G rs35229708 0.13
ABCG2 C> T 55930652 0.27
Dai et al. BioData Mining 2012, 5:3 Page 6 of 17http://www.biodatamining.org/content/5/1/3
denoted by Cγ,α of obtaining r significant statistics bychance in a group of n tests. Suppose there are r testswith p-values less than α, Wilkinson’s test rejects H0 ifcr;α < α [17]. Because P(r) has been distributed with para-meters r and n-r + 1, tables of the incomplete beta func-tion can be used to obtain critical values of P(r) directly.In our work, we will not include Wilkinson’s test in casestudy and power simulation because this method doesnot provide p-value for the testing results.
ATIC C> T rs12995526 0.3
BHMT A>G rs3733890 0.33
DHFR A>T rs7387 0.3
GGH C> T rs3758149 0.27
MTHFD2 indel rs71391718 0.31
MTHFR C> T rs1801133 0.3
MTHFR A>C rs1801131 0.33
MTHFR G> A rs2274976 0.06
MTR A>G rs1805087 0.19
MTRR A>G rs1801394 0.57
SHMT1 C> T rs1979277 0.37
TYMS *2/*3 rs34743033 0.49
TYMS indel rs11280056 0.32
FOLH1 C> T rs61886492 0.03
GART A>G rs8788 0.21
GART A>G rs8971 0.19
SLC25A32 G> A rs17803441 0.07
ADORA2a C> T rs2298383 0.61
ITPA T>C rs2295553 0.52
SLCO1B1 T>C rs4149056 0.12*Minor Allele Frequency.
Case studyWe used a real dataset to illustrate how to apply our pro-posed global testing to prevent false discovery and to deter-mine the optimal number of SNPs for the final MDRanalysis. Juvenile Idiopathic Arthritis (JIA) is one of themost common chronic diseases of childhood, affecting anestimated 300,000 children in the U.S. alone, and is an im-portant cause of morbidity and disability in children [18].Although methotrexate (MTX) is the most commonly usedsecond-line agent used to treat JIA worldwide, this antifo-late drug has shown considerable inter-individual variabilityin clinical response and adverse reactions [19]. The polyglu-tamation of methotrexate (MTXglu) is an intracellularmechanism that retains the drug and enhances target en-zyme inhibition within the folate pathway [20], and highconcentrations of “long chain”methotrexate polyglutamates(MTXglu3-5) have been associated with improved responseto the drug in adults with rheumatoid arthritis [21]. Studieshave reported the extensive variability in intracellularMTXglu concentrations in JIA, and an association of longchain MTXglu with toxicity (but not efficacy) in children[22]. Due to the complexity of the folate cycle as well as theextensive variability in response to the drug in clinical prac-tice, it is hypothesized that genetic factors may contributeto differences seen in distinct patterns of MTXglu concen-trations intracellularly, which might further impact patients’responses to MTX.In this case study, we analyzed 25 SNPs from 17 can-
didate genes in the folate pathway (Table 1). MTXgluwas measured in all patients after at least 3 months onstable MTX therapy and a range of 1 to 5 glutamate moi-eties were reported as a percentage of the total polygluta-mate concentration (MTXglun%). Hierarchical clusteringwas performed to identify patterns of MTXglun%
, and twoclusters were determined based on the hierarchical cluster-ing of normalized MTXglu1-5%. Subjects in cluster 1 hadlower concentration of short chain polyglutamates(MTXglu1-2%) and higher concentration of long chainpolyglutamates (MTXglu3-5%) as compared to subjects incluster 2 (p< 0.05). These clusters reflected distinctpatterns in the proportion of MTXglu concentrations.There were 30 subjects in Cluster 1 and 74 subjects in
Cluster 2. The MTXglu clustering phenotype was coded 1
and 0 for MDR analysis. Genotypes, coded 0 for commonhomozygote, 1 for heterozygote and 2 for rare homozygotefor 25 SNPs, were measured. The overall goal of the ana-lysis was to assess whether interactions among SNPs areassociated with MTXglu clustering. While the scale of thisstudy is not so large that an exhaustive search of all SNPsis computationally limited, this data is used to demonstratethe proposed approach.For illustrative purposes, we will focus on 2-way inter-
actions among 25 SNPs and will determine the optimalnumber of targeted SNPs for testing 2-way interactions.We first applied the ReliefF algorithm to 25 SNPs. Asshown in Table 2, ReliefF scores ranged from −0.0308 to0.1163. Although a higher score indicates stronger inter-action with other SNPs, there is no clear cutoff point forReliefF scores.To circumvent this limitation, we incorporated global
testing of p-values and ReliefF algorithm using themethod proposed in Section Combined global testingand filtration technique. We first generated p-values for

Table 2 FDR adjusted P-value in global testing
# SNPs Remaining SNP ReliefF P-values of global testing
Removed SNP (GxG) Removed Score KS Inverse chi Inversenorm Logit Wilcoxon Tippett
0 25(300) 0.29121 0.22008 1.00000 1.00000 0.80991 0.33927
1 24(276) rs35252139 −0.0308 0.21644 0.12424 1.00000 1.00000 0.55397 0.33340
2 23(253) rs35229708 −0.0308 0.16697 0.06603 1.00000 1.00000 0.43198 0.32718
3 22(231) rs2298383 −0.0279 0.13417 0.03087 1.00000 1.00000 0.25182 0.32062
4 21(210) rs12995526 −0.0250 0.16987 0.05667 1.00000 1.00000 0.45717 0.31374
5 20(190) rs7699188 −0.0202 0.11033 0.01793 1.00000 1.00000 0.31680 0.30658
6 19(171) rs1805087 −0.0183 0.03887 0.00320 1.00000 1.00000 0.18665 0.29916
7 18(153) rs4149056 −0.0067 0.02048 0.00106 1.00000 1.00000 0.09019 0.29154
8 17(136) 55930652 −0.0038 0.01051 0.00080 1.00000 1.00000 0.10254 0.28376
9 16(120) * no rs [35] −0.0029 0.00455 0.00016 1.00000 1.00000 0.02642 0.27592
10 15(105) rs17803441 0.0010 0.00312 0.00011 1.00000 1.00000 0.00567 0.26811
11 14(91) rs34743033 0.0087 0.00022 0.00001 1.00000 1.00000 0.00015 0.26049
12 13(78) rs61886492 0.0096 0.00022 0.00000 0.00001 0.00000 0.00006 0.25328
13 12(66) rs71391718 0.0183 0.00008 0.00000 0.00000 0.00000 0.00001 0.25328
14 11(55) rs3758149 0.0192 0.00008 0.00000 0.00000 0.00000 0.00006 0.25328
15 10(45) rs1801131 0.0240 0.00026 0.00004 0.00004 0.00004 0.00016 0.25328
16 9(36) rs1801394 0.0365 0.00022 0.00004 0.00003 0.00003 0.00015 0.25328
17 8(28) rs8788 0.0375 0.00008 0.00003 0.00002 0.00002 0.00015 0.25328
18 7(21) rs7387 0.0452 0.01051 0.00255 0.00547 0.00442 0.00799 0.25328
19 6(15) rs1801133 0.0481 0.05212 0.06679 0.10791 0.12185 0.05337 0.25328
20 5(10) rs8971 0.0481
21 4(6) rs2274976 0.0644
22 3(3) rs1979277 0.0673
23 2(1) rs11280056 0.0702
24 rs3733890 0.0750
25 rs3733890 0.1163
Optimal number of SNPs removed 5 4 11 11 8 Not Found
Dai et al. BioData Mining 2012, 5:3 Page 7 of 17http://www.biodatamining.org/content/5/1/3
all 2-way interactions among 25 SNPs through per-mutation testing. Then we applied global testing, in-cluding KS test, Inverse chi test, Inverse norm test,Logit test, Wilcoxon test and Tippett’s tests on252
� �¼ 300 p-values of 2-way interactions among 25
SNPs. The global tests were performed to evaluate whetherthe distribution of p-values deviated from uniformity (nullhypothesis) and shifted towards 0 (alternative hypothesis -Pattern 2 in Figure 1). Then we removed one SNP with thelowest ReliefF score step by step and repeated the globaltesting process until only 5 SNPs were remained. Westopped the global testing procedure at 5 SNPs because it isnot meaningful or necessary to perform global testing whenthe number of SNPs is less than 5 in any case study.The entire procedure of filtration and global testing of
p-values are summarized in Table 2. The optimal numberof SNPs is the largest number of SNPs with global testing
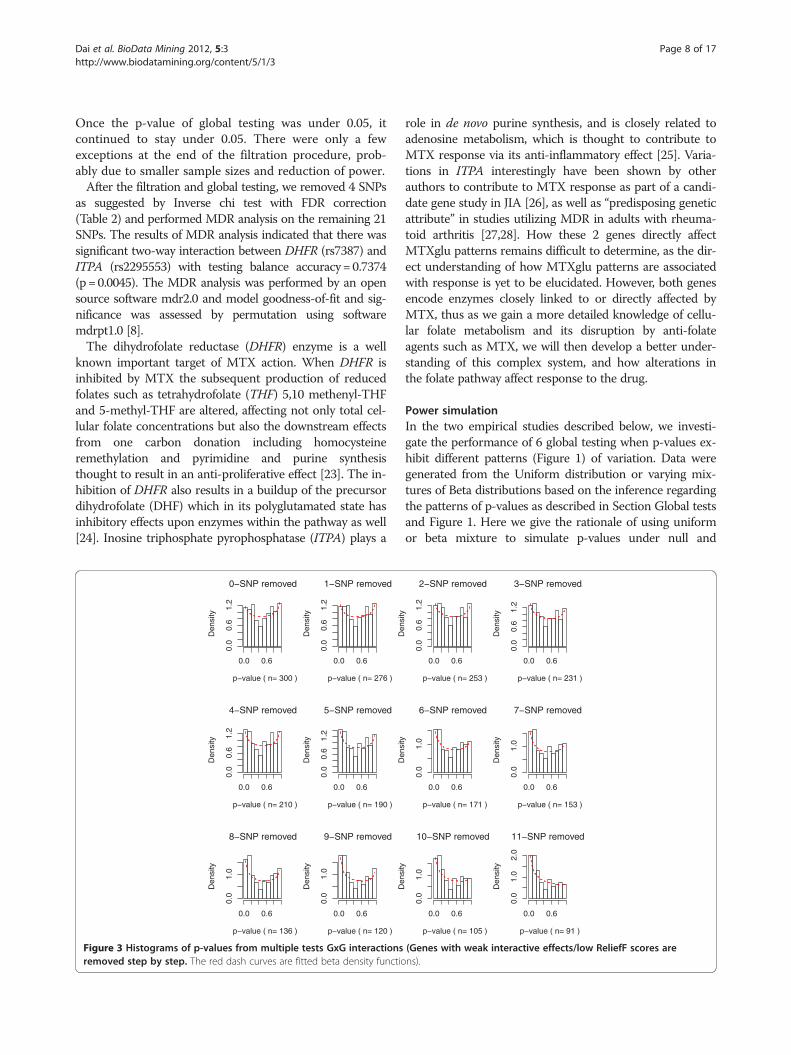
p-value <0.05. In this case study, KS test and Inverse chitest were more sensitive to deviation from uniformity asthe tests became significant after 5 and 4 SNPs removedrespectively (Table 2). Inverse norm test and Logit test weremore conservative, suggesting removal of 11 SNPs. Wilcoxontest, removing 8 SNPs, was moderate as compared to theother tests. Tippett’s test failed to detect significant GxGinteractions with all FDR corrected p-values> 0.05. Our fur-ther simulation studies (discussed in Section Power simula-tion) indicate that Tippett’s test, which only takes thesmallest p-value into account, might not be appropriate forglobal testing of p-values.Figure 3 and 4 both revealed strong patterns of transi-
tion when noisy SNPs were removed. In Figure 3, asSNPs with low ReliefF scores were removed sequentially,the histogram of p-values started to shift toward 0. Alsoin Figure 4, the global test p-values were in decreasingtrends when noisy SNPs were removed one by one.
Dai et al. BioData Mining 2012, 5:3 Page 8 of 17http://www.biodatamining.org/content/5/1/3
Once the p-value of global testing was under 0.05, itcontinued to stay under 0.05. There were only a fewexceptions at the end of the filtration procedure, prob-ably due to smaller sample sizes and reduction of power.After the filtration and global testing, we removed 4 SNPs
as suggested by Inverse chi test with FDR correction(Table 2) and performed MDR analysis on the remaining 21SNPs. The results of MDR analysis indicated that there wassignificant two-way interaction between DHFR (rs7387) andITPA (rs2295553) with testing balance accuracy=0.7374(p=0.0045). The MDR analysis was performed by an opensource software mdr2.0 and model goodness-of-fit and sig-nificance was assessed by permutation using softwaremdrpt1.0 [8].The dihydrofolate reductase (DHFR) enzyme is a well
known important target of MTX action. When DHFR isinhibited by MTX the subsequent production of reducedfolates such as tetrahydrofolate (THF) 5,10 methenyl-THFand 5-methyl-THF are altered, affecting not only total cel-lular folate concentrations but also the downstream effectsfrom one carbon donation including homocysteineremethylation and pyrimidine and purine synthesisthought to result in an anti-proliferative effect [23]. The in-hibition of DHFR also results in a buildup of the precursordihydrofolate (DHF) which in its polyglutamated state hasinhibitory effects upon enzymes within the pathway as well[24]. Inosine triphosphate pyrophosphatase (ITPA) plays a
0−SNP removed
p−value ( n= 300 )
Den
sity
0.0 0.6
0.0
0.6
1.2
1−SNP removed
p−value ( n= 276 )
Den
sity
0.0 0.6
0.0
0.6
1.2
4−SNP removed
p−value ( n= 210 )
Den
sity
0.0 0.6
0.0
0.6
1.2
5−SNP removed
p−value ( n= 190 )
Den
sity
0.0 0.6
0.0
0.6
1.2
8−SNP removed
p−value ( n= 136 )
Den
sity
0.0 0.6
0.0
1.0
9−SNP removed
p−value ( n= 120 )
Den
sity
0.0 0.6
0.0
1.0
Figure 3 Histograms of p-values from multiple tests GxG interactionsremoved step by step. The red dash curves are fitted beta density functio
role in de novo purine synthesis, and is closely related toadenosine metabolism, which is thought to contribute toMTX response via its anti-inflammatory effect [25]. Varia-tions in ITPA interestingly have been shown by otherauthors to contribute to MTX response as part of a candi-date gene study in JIA [26], as well as “predisposing geneticattribute” in studies utilizing MDR in adults with rheuma-toid arthritis [27,28]. How these 2 genes directly affectMTXglu patterns remains difficult to determine, as the dir-ect understanding of how MTXglu patterns are associatedwith response is yet to be elucidated. However, both genesencode enzymes closely linked to or directly affected byMTX, thus as we gain a more detailed knowledge of cellu-lar folate metabolism and its disruption by anti-folateagents such as MTX, we will then develop a better under-standing of this complex system, and how alterations inthe folate pathway affect response to the drug.
Power simulationIn the two empirical studies described below, we investi-gate the performance of 6 global testing when p-values ex-hibit different patterns (Figure 1) of variation. Data weregenerated from the Uniform distribution or varying mix-tures of Beta distributions based on the inference regardingthe patterns of p-values as described in Section Global testsand Figure 1. Here we give the rationale of using uniformor beta mixture to simulate p-values under null and
2−SNP removed
p−value ( n= 253 )
Den
sity
0.0 0.6
0.0
0.6
1.2
3−SNP removed
p−value ( n= 231 )
Den
sity
0.0 0.6
0.0
0.6
1.2
6−SNP removed
p−value ( n= 171 )
Den
sity
0.0 0.6
0.0
1.0
7−SNP removed
p−value ( n= 153 )
Den
sity
0.0 0.6
0.0
1.0
10−SNP removed
p−value ( n= 105 )
Den
sity
0.0 0.6
0.0
1.0
11−SNP removed
p−value ( n= 91 )
Den
sity
0.0 0.6
0.0
1.0
2.0
(Genes with weak interactive effects/low ReliefF scores arens).

10 15
0.0
0.4
0.8
KS Test
Number of SNPs Removed
P−
valu
e10 15
0.0
0.4
0.8
Inverse Chi Test
Number of SNPs Removed
P−
valu
e
10 15
0.0
0.4
0.8
Inverse Norm Test
Number of SNPs Removed
P−
valu
e
10 15
0.0
0.4
0.8
Logit Test
Number of SNPs Removed
P−
valu
e
10 15
0.0
0.4
0.8
Wilcoxon Test
Number of SNPs Removed
P−
valu
e0 5 0 5
0 5 0 5
0 5 0 5 10 15
0.0
0.4
0.8
Tippett Test
Number of SNPs Removed
P−
valu
e
Figure 4 Global Testing of p-values combined with filtration technique (The red line is at nominal rate 0.05. The optimal number ofgenes is determined when the global test first has p-value< 0.05).
ITPA
rs2
2955
53
DHFR rs7387
Figure 5 Gene to gene interaction detected by MDR after filtering out 6 SNPs according to the one sided inverse chi-square test.(The distribution of MTXglu clustering among genotypic combinations between DHFR-rs7387 and ITPA-rs2295553 is listed. The genotype forDHFR-rs7387 and ITPA-rs2295553 is coded as 0-homozygote, 1-heterozygote and 2-rare homozygote. In each cell, the first column stands for thenumber of subjects in cluster 1 (low concentration of MTXglu1-2% and high concentration of MTXglu3-4%) and the second column stands for thenumber of subjects in cluster 2(high concentration of MTXglu1-2% and low concentration of MTXglu3-5%. Genotypic combinations in relativelyhigh (low) likelihood of cluster 1 are displayed in darkly (lightly) shaded cells).
Dai et al. BioData Mining 2012, 5:3 Page 9 of 17http://www.biodatamining.org/content/5/1/3
Dai et al. BioData Mining 2012, 5:3 Page 10 of 17http://www.biodatamining.org/content/5/1/3
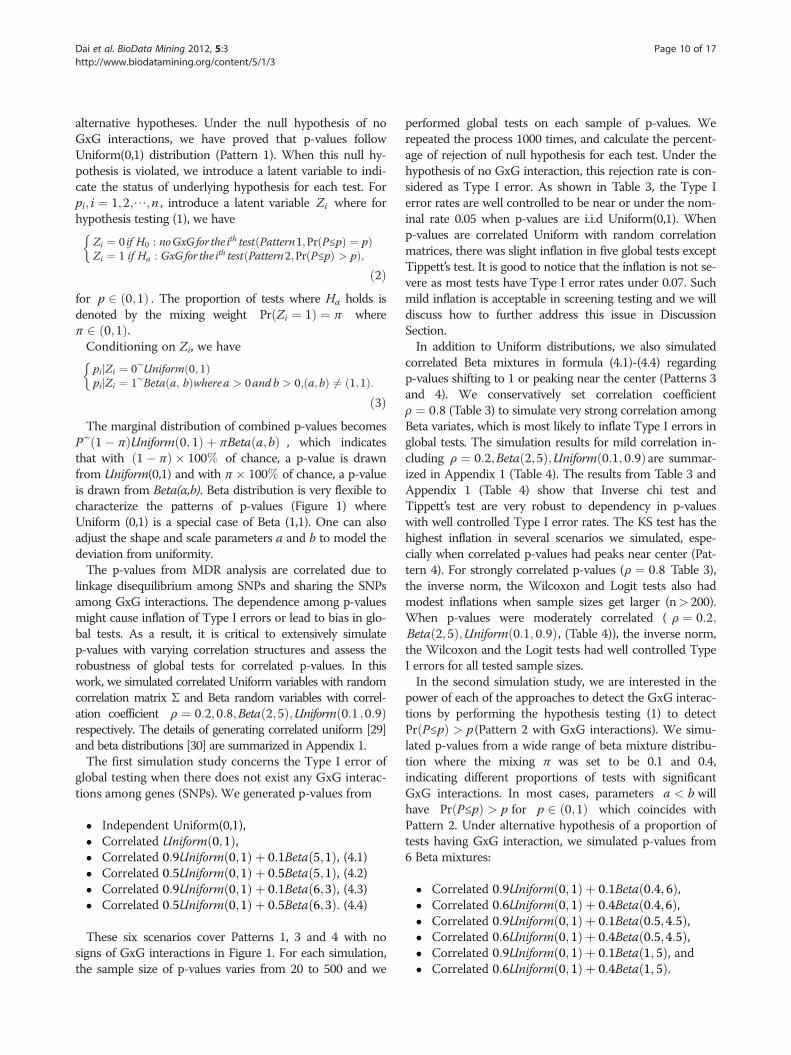
alternative hypotheses. Under the null hypothesis of noGxG interactions, we have proved that p-values followUniform(0,1) distribution (Pattern 1). When this null hy-pothesis is violated, we introduce a latent variable to indi-cate the status of underlying hypothesis for each test. Forpi; i ¼ 1;2;⋯;n , introduce a latent variable Zi where forhypothesis testing (1), we have
Zi ¼ 0 if H0 : noGxG for the ith test Pattern1;Pr P≤pð Þ ¼ pð ÞZi ¼ 1 if Ha : GxG for the ith test Pattern2;Pr P≤pð Þ > pð Þ;
�ð2Þ
for p 2 0;1ð Þ . The proportion of tests where Hα holds isdenoted by the mixing weight Pr Zi ¼ 1ð Þ ¼ π whereπ 2 0;1ð Þ.Conditioning on Zi, we have
pijZi ¼ 0eUniform 0; 1ð ÞpijZi ¼ 1eBeta a; bð Þwherea > 0andb > 0; a;bð Þ 6¼ 1;1ð Þ:
�ð3Þ
The marginal distribution of combined p-values becomesPe 1� πð ÞUniform 0; 1ð Þ þ πBeta a;bð Þ , which indicatesthat with 1� πð Þ � 100% of chance, a p-value is drawnfrom Uniform(0,1) and with π � 100% of chance, a p-valueis drawn from Beta(α,b). Beta distribution is very flexible tocharacterize the patterns of p-values (Figure 1) whereUniform (0,1) is a special case of Beta (1,1). One can alsoadjust the shape and scale parameters a and b to model thedeviation from uniformity.The p-values from MDR analysis are correlated due to
linkage disequilibrium among SNPs and sharing the SNPsamong GxG interactions. The dependence among p-valuesmight cause inflation of Type I errors or lead to bias in glo-bal tests. As a result, it is critical to extensively simulatep-values with varying correlation structures and assess therobustness of global tests for correlated p-values. In thiswork, we simulated correlated Uniform variables with randomcorrelation matrix Σ and Beta random variables with correl-ation coefficient ρ ¼ 0:2;0:8;Beta 2;5ð Þ;Uniform 0:1 ;0:9ð Þrespectively. The details of generating correlated uniform [29]and beta distributions [30] are summarized in Appendix 1.The first simulation study concerns the Type I error of
global testing when there does not exist any GxG interac-tions among genes (SNPs). We generated p-values from
� Independent Uniform(0,1),� Correlated Uniform 0;1ð Þ,� Correlated 0:9Uniform 0;1ð Þ þ 0:1Beta 5;1ð Þ, (4.1)� Correlated 0:5Uniform 0;1ð Þ þ 0:5Beta 5;1ð Þ, (4.2)� Correlated 0:9Uniform 0;1ð Þ þ 0:1Beta 6;3ð Þ, (4.3)� Correlated 0:5Uniform 0;1ð Þ þ 0:5Beta 6;3ð Þ. (4.4)
These six scenarios cover Patterns 1, 3 and 4 with nosigns of GxG interactions in Figure 1. For each simulation,the sample size of p-values varies from 20 to 500 and we
performed global tests on each sample of p-values. Werepeated the process 1000 times, and calculate the percent-age of rejection of null hypothesis for each test. Under thehypothesis of no GxG interaction, this rejection rate is con-sidered as Type I error. As shown in Table 3, the Type Ierror rates are well controlled to be near or under the nom-inal rate 0.05 when p-values are i.i.d Uniform(0,1). Whenp-values are correlated Uniform with random correlationmatrices, there was slight inflation in five global tests exceptTippett’s test. It is good to notice that the inflation is not se-vere as most tests have Type I error rates under 0.07. Suchmild inflation is acceptable in screening testing and we willdiscuss how to further address this issue in DiscussionSection.In addition to Uniform distributions, we also simulated
correlated Beta mixtures in formula (4.1)-(4.4) regardingp-values shifting to 1 or peaking near the center (Patterns 3and 4). We conservatively set correlation coefficientρ ¼ 0:8 (Table 3) to simulate very strong correlation amongBeta variates, which is most likely to inflate Type I errors inglobal tests. The simulation results for mild correlation in-cluding ρ ¼ 0:2;Beta 2;5ð Þ;Uniform 0:1; 0:9ð Þare summar-ized in Appendix 1 (Table 4). The results from Table 3 andAppendix 1 (Table 4) show that Inverse chi test andTippett’s test are very robust to dependency in p-valueswith well controlled Type I error rates. The KS test has thehighest inflation in several scenarios we simulated, espe-cially when correlated p-values had peaks near center (Pat-tern 4). For strongly correlated p-values (ρ ¼ 0:8 Table 3),the inverse norm, the Wilcoxon and Logit tests also hadmodest inflations when sample sizes get larger (n> 200).When p-values were moderately correlated ( ρ ¼ 0:2;Beta 2;5ð Þ;Uniform 0:1; 0:9ð Þ, (Table 4)), the inverse norm,the Wilcoxon and the Logit tests had well controlled TypeI errors for all tested sample sizes.In the second simulation study, we are interested in the
power of each of the approaches to detect the GxG interac-tions by performing the hypothesis testing (1) to detectPr P≤pð Þ > p(Pattern 2 with GxG interactions). We simu-lated p-values from a wide range of beta mixture distribu-tion where the mixing π was set to be 0.1 and 0.4,indicating different proportions of tests with significantGxG interactions. In most cases, parameters a < b willhave Pr P≤pð Þ > p for p 2 0;1ð Þ which coincides withPattern 2. Under alternative hypothesis of a proportion oftests having GxG interaction, we simulated p-values from6 Beta mixtures:
� Correlated 0:9Uniform 0; 1ð Þ þ 0:1Beta 0:4; 6ð Þ,� Correlated 0:6Uniform 0; 1ð Þ þ 0:4Beta 0:4;6ð Þ,� Correlated 0:9Uniform 0; 1ð Þ þ 0:1Beta 0:5;4:5ð Þ,� Correlated 0:6Uniform 0; 1ð Þ þ 0:4Beta 0:5;4:5ð Þ,� Correlated 0:9Uniform 0; 1ð Þ þ 0:1Beta 1; 5ð Þ, and� Correlated 0:6Uniform 0; 1ð Þ þ 0:4Beta 1; 5ð Þ.
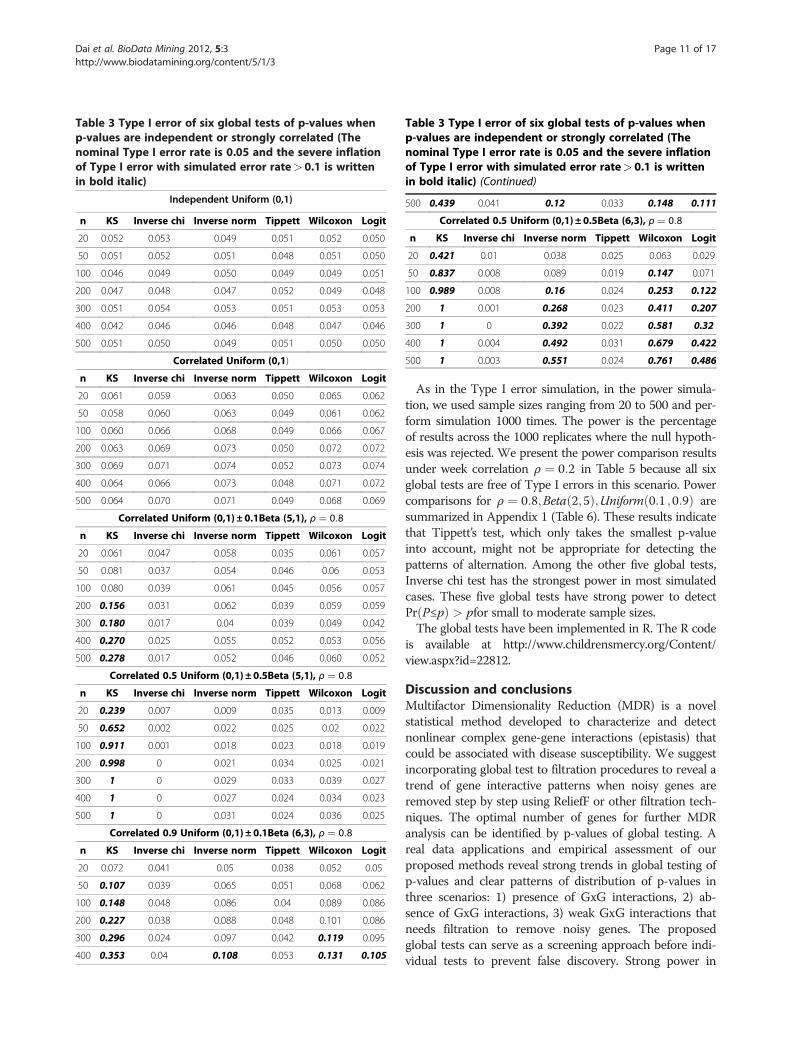
Table 3 Type I error of six global tests of p-values whenp-values are independent or strongly correlated (Thenominal Type I error rate is 0.05 and the severe inflationof Type I error with simulated error rate> 0.1 is writtenin bold italic)
Independent Uniform (0,1)
n KS Inverse chi Inverse norm Tippett Wilcoxon Logit
20 0.052 0.053 0.049 0.051 0.052 0.050
50 0.051 0.052 0.051 0.048 0.051 0.050
100 0.046 0.049 0.050 0.049 0.049 0.051
200 0.047 0.048 0.047 0.052 0.049 0.048
300 0.051 0.054 0.053 0.051 0.053 0.053
400 0.042 0.046 0.046 0.048 0.047 0.046
500 0.051 0.050 0.049 0.051 0.050 0.050
Correlated Uniform (0,1)
n KS Inverse chi Inverse norm Tippett Wilcoxon Logit
20 0.061 0.059 0.063 0.050 0.065 0.062
50 0.058 0.060 0.063 0.049 0.061 0.062
100 0.060 0.066 0.068 0.049 0.066 0.067
200 0.063 0.069 0.073 0.050 0.072 0.072
300 0.069 0.071 0.074 0.052 0.073 0.074
400 0.064 0.066 0.073 0.048 0.071 0.072
500 0.064 0.070 0.071 0.049 0.068 0.069
Correlated Uniform (0,1) ± 0.1Beta (5,1), ρ ¼ 0:8
n KS Inverse chi Inverse norm Tippett Wilcoxon Logit
20 0.061 0.047 0.058 0.035 0.061 0.057
50 0.081 0.037 0.054 0.046 0.06 0.053
100 0.080 0.039 0.061 0.045 0.056 0.057
200 0.156 0.031 0.062 0.039 0.059 0.059
300 0.180 0.017 0.04 0.039 0.049 0.042
400 0.270 0.025 0.055 0.052 0.053 0.056
500 0.278 0.017 0.052 0.046 0.060 0.052
Correlated 0.5 Uniform (0,1) ± 0.5Beta (5,1), ρ ¼ 0:8
n KS Inverse chi Inverse norm Tippett Wilcoxon Logit
20 0.239 0.007 0.009 0.035 0.013 0.009
50 0.652 0.002 0.022 0.025 0.02 0.022
100 0.911 0.001 0.018 0.023 0.018 0.019
200 0.998 0 0.021 0.034 0.025 0.021
300 1 0 0.029 0.033 0.039 0.027
400 1 0 0.027 0.024 0.034 0.023
500 1 0 0.031 0.024 0.036 0.025
Correlated 0.9 Uniform (0,1) ± 0.1Beta (6,3), ρ ¼ 0:8
n KS Inverse chi Inverse norm Tippett Wilcoxon Logit
20 0.072 0.041 0.05 0.038 0.052 0.05
50 0.107 0.039 0.065 0.051 0.068 0.062
100 0.148 0.048 0.086 0.04 0.089 0.086
200 0.227 0.038 0.088 0.048 0.101 0.086
300 0.296 0.024 0.097 0.042 0.119 0.095
400 0.353 0.04 0.108 0.053 0.131 0.105
Table 3 Type I error of six global tests of p-values whenp-values are independent or strongly correlated (Thenominal Type I error rate is 0.05 and the severe inflationof Type I error with simulated error rate> 0.1 is writtenin bold italic) (Continued)
500 0.439 0.041 0.12 0.033 0.148 0.111
Correlated 0.5 Uniform (0,1) ± 0.5Beta (6,3), ρ ¼ 0:8
n KS Inverse chi Inverse norm Tippett Wilcoxon Logit
20 0.421 0.01 0.038 0.025 0.063 0.029
50 0.837 0.008 0.089 0.019 0.147 0.071
100 0.989 0.008 0.16 0.024 0.253 0.122
200 1 0.001 0.268 0.023 0.411 0.207
300 1 0 0.392 0.022 0.581 0.32
400 1 0.004 0.492 0.031 0.679 0.422
500 1 0.003 0.551 0.024 0.761 0.486
Dai et al. BioData Mining 2012, 5:3 Page 11 of 17http://www.biodatamining.org/content/5/1/3
As in the Type I error simulation, in the power simula-tion, we used sample sizes ranging from 20 to 500 and per-form simulation 1000 times. The power is the percentageof results across the 1000 replicates where the null hypoth-esis was rejected. We present the power comparison resultsunder week correlation ρ ¼ 0:2 in Table 5 because all sixglobal tests are free of Type I errors in this scenario. Powercomparisons for ρ ¼ 0:8;Beta 2;5ð Þ;Uniform 0:1 ;0:9ð Þ aresummarized in Appendix 1 (Table 6). These results indicatethat Tippett’s test, which only takes the smallest p-valueinto account, might not be appropriate for detecting thepatterns of alternation. Among the other five global tests,Inverse chi test has the strongest power in most simulatedcases. These five global tests have strong power to detectPr P≤pð Þ > pfor small to moderate sample sizes.The global tests have been implemented in R. The R code
is available at http://www.childrensmercy.org/Content/view.aspx?id=22812.
Discussion and conclusionsMultifactor Dimensionality Reduction (MDR) is a novelstatistical method developed to characterize and detectnonlinear complex gene-gene interactions (epistasis) thatcould be associated with disease susceptibility. We suggestincorporating global test to filtration procedures to reveal atrend of gene interactive patterns when noisy genes areremoved step by step using ReliefF or other filtration tech-niques. The optimal number of genes for further MDRanalysis can be identified by p-values of global testing. Areal data applications and empirical assessment of ourproposed methods reveal strong trends in global testing ofp-values and clear patterns of distribution of p-values inthree scenarios: 1) presence of GxG interactions, 2) ab-sence of GxG interactions, 3) weak GxG interactions thatneeds filtration to remove noisy genes. The proposedglobal tests can serve as a screening approach before indi-vidual tests to prevent false discovery. Strong power in

Table 4 Type I error of six global tests of p-values whenp-values are moderately correlated (The nominal Type Ierror rate is 0.05 and the severe inflation of Type I errorwith simulated error rate> 0.1 is written in bold italic)
Correlated Uniform (0,1) ± 0.1Beta (5,1), ρ ¼ 0:2
n KS Inverse chi Inverse norm Tippett Wilcoxon Logit
20 0.018 0.031 0.022 0.048 0.021 0.026
50 0.014 0.019 0.008 0.046 0.01 0.013
100 0.014 0.014 0.013 0.05 0.014 0.014
200 0.003 0.01 0.006 0.044 0.004 0.007
300 0.002 0.005 0.002 0.05 0.001 0.002
400 0.001 0.003 0 0.045 0 0
500 0.002 0.002 0.003 0.042 0.001 0.003
Correlated 0.5 Uniform (0,1) ± 0.5Beta (5,1), ρ ¼ 0:2
n KS Inverse chi Inverse norm Tippett Wilcoxon Logit
20 0 0 0 0.023 0 0
50 0 0 0 0.023 0 0
100 0 0 0 0.029 0 0
200 0 0 0 0.025 0 0
300 0 0 0 0.024 0 0
400 0 0 0 0.021 0 0
500 0 0 0 0.024 0 0
Correlated 0.9 Uniform (0,1) ± 0.1Beta (6,3), ρ ¼ 0:2
n KS Inverse chi Inverse norm Tippett Wilcoxon Logit
20 0.041 0.051 0.047 0.047 0.042 0.049
50 0.032 0.049 0.043 0.042 0.034 0.048
100 0.033 0.032 0.035 0.043 0.035 0.036
200 0.017 0.009 0.023 0.052 0.017 0.024
300 0.017 0.016 0.015 0.039 0.011 0.016
400 0.028 0.006 0.014 0.044 0.01 0.017
500 0.021 0.007 0.013 0.048 0.009 0.015
Correlated 0.5 Uniform (0,1) ± 0.5Beta (6,3), ρ ¼ 0:2
n KS Inverse chi Inverse norm Tippett Wilcoxon Logit
20 0.008 0.004 0.003 0.025 0.001 0.003
50 0.021 0.002 0.001 0.024 0.001 0.002
100 0.046 0.001 0.001 0.028 0 0.001
200 0.165 0 0 0.023 0 0
300 0.337 0 0 0.025 0 0
400 0.558 0 0 0.017 0 0
500 0.66 0 0 0.018 0 0
Correlated Uniform (0,1) ± 0.1Beta (5,1), ρ ¼ Beta 2;5ð Þn KS Inverse chi Inverse norm Tippett Wilcoxon Logit
20 0.034 0.043 0.036 0.047 0.034 0.04
50 0.019 0.022 0.02 0.05 0.018 0.021
100 0.012 0.018 0.011 0.038 0.008 0.012
200 0.002 0.008 0.006 0.045 0.006 0.006
300 0.005 0.009 0.005 0.037 0.004 0.007
400 0.004 0.005 0.002 0.038 0.002 0.002
500 0 0.003 0.001 0.05 0 0.002
Table 4 Type I error of six global tests of p-values whenp-values are moderately correlated (The nominal Type Ierror rate is 0.05 and the severe inflation of Type I errorwith simulated error rate> 0.1 is written in bold italic)(Continued)
Correlated 0.5 Uniform (0,1) ± 0.5Beta (5,1), ρ ¼ Beta 2;5ð Þn KS Inverse chi Inverse norm Tippett Wilcoxon Logit
20 0.001 0.002 0.001 0.021 0 0.001
50 0 0 0 0.026 0 0
100 0 0 0 0.016 0 0
200 0 0 0 0.02 0 0
300 0 0 0 0.031 0 0
400 0.002 0 0 0.02 0 0
500 0.001 0 0 0.028 0 0
Correlated 0.9 Uniform (0,1) ± 0.1Beta (6,3), ρ ¼ Beta 2;5ð Þn KS Inverse chi Inverse norm Tippett Wilcoxon Logit
20 0.049 0.046 0.054 0.044 0.055 0.05
50 0.039 0.031 0.042 0.042 0.036 0.043
100 0.027 0.027 0.036 0.05 0.033 0.037
200 0.033 0.023 0.03 0.041 0.025 0.032
300 0.042 0.018 0.029 0.038 0.023 0.032
400 0.041 0.012 0.02 0.046 0.017 0.021
500 0.053 0.013 0.026 0.054 0.02 0.028
Correlated 0.5 Uniform (0,1) ± 0.5Beta (6,3), ρ ¼ Beta 2;5ð Þn KS Inverse chi Inverse norm Tippett Wilcoxon Logit
20 0.02 0.006 0.008 0.03 0.006 0.009
50 0.051 0 0 0.031 0 0
100 0.123 0 0.003 0.023 0.001 0.004
200 0.271 0 0 0.021 0 0
300 0.414 0 0 0.033 0 0
400 0.552 0 0 0.024 0 0
500 0.663 0 0 0.028 0 0
Correlated Uniform (0,1) ± 0.1Beta (5,1), ρ ¼ Uniform 0:1; 0:9ð Þn KS Inverse chi Inverse norm Tippett Wilcoxon Logit
20 0.036 0.041 0.034 0.048 0.031 0.038
50 0.042 0.039 0.043 0.054 0.039 0.048
100 0.028 0.03 0.029 0.054 0.028 0.029
200 0.037 0.018 0.023 0.045 0.021 0.025
300 0.016 0.012 0.013 0.025 0.015 0.014
400 0.034 0.008 0.017 0.045 0.015 0.019
500 0.031 0.006 0.014 0.046 0.005 0.016
Correlated 0.5 Uniform (0,1) ± 0.5Beta (5,1), ρ ¼ Uniform 0:1; 0:9ð Þn KS Inverse chi Inverse norm Tippett Wilcoxon Logit
20 0.011 0.005 0.002 0.017 0.001 0.002
50 0.029 0.002 0.003 0.022 0.001 0.003
100 0.048 0 0 0.023 0.001 0.001
200 0.099 0 0 0.023 0.000 0
300 0.161 0 0 0.026 0.000 0
400 0.176 0 0 0.016 0.000 0
Dai et al. BioData Mining 2012, 5:3 Page 12 of 17http://www.biodatamining.org/content/5/1/3

Table 4 Type I error of six global tests of p-values whenp-values are moderately correlated (The nominal Type Ierror rate is 0.05 and the severe inflation of Type I errorwith simulated error rate> 0.1 is written in bold italic)(Continued)
500 0.218 0 0 0.024 0.001 0
Correlated 0.9 Uniform (0,1) ± 0.1Beta (6,3), ρ ¼ Uniform 0:1; 0:9ð Þn KS Inverse chi Inverse norm Tippett Wilcoxon Logit
20 0.05 0.036 0.038 0.033 0.044 0.039
50 0.054 0.031 0.047 0.043 0.045 0.044
100 0.044 0.031 0.048 0.05 0.045 0.056
200 0.091 0.034 0.057 0.047 0.058 0.058
300 0.117 0.024 0.054 0.049 0.054 0.05 s8
400 0.097 0.022 0.048 0.048 0.048 0.05
500 0.116 0.014 0.042 0.035 0.043 0.043
Correlated 0.5 Uniform (0,1) ± 0.5Beta (5,1), ρ ¼ Uniform 0:1; 0:9ð Þn KS Inverse chi Inverse norm Tippett Wilcoxon Logit
20 0.108 0.009 0.016 0.027 0.017 0.016
50 0.298 0.002 0.014 0.025 0.013 0.014
100 0.459 0.002 0.014 0.024 0.016 0.014
200 0.774 0 0.016 0.017 0.022 0.017
300 0.908 0 0.016 0.023 0.023 0.015
400 0.933 0 0.024 0.024 0.029 0.019
500 0.975 0 0.016 0.02 0.032 0.013Uniform distributions have random correlation matrices. The nominal Type Ierror rate is 0.05 and the severe inflation of Type I error with simulated errorrate> 0.1 is written in bold italic).
Table 5 Power of six global tests of correlated P-values(The correlation coefficient for Beta random variables isρ. Uniform distributions have random correlationmatrices)
Correlated 0.9Uniform (0,1) ± 0.1Beta (0.4,6), ρ ¼ 0:2
n KS Inverse chi Inverse norm Tippett Wilcoxon Logit
20 0.176 0.359 0.259 0.332 0.191 0.294
50 0.27 0.576 0.418 0.505 0.303 0.464
100 0.407 0.824 0.599 0.652 0.456 0.672
200 0.645 0.967 0.827 0.791 0.657 0.877
300 0.808 0.995 0.92 0.861 0.785 0.941
400 0.896 0.997 0.966 0.896 0.861 0.979
500 0.949 0.999 0.984 0.933 0.926 0.993
Correlated 0.6 Uniform (0,1) ± 0.4Beta (0.4,6), ρ ¼ 0:2
n KS Inverse chi Inverse norm Tippett Wilcoxon Logit
20 0.797 0.957 0.896 0.784 0.815 0.918
50 0.987 1 0.997 0.939 0.983 1
100 1 1 1 0.972 1 1
200 1 1 1 0.998 1 1
300 1 1 1 1 1 1
400 1 1 1 0.999 1 1
500 1 1 1 0.999 1 1
Correlated 0.9 Uniform (0,1) ± 0.1Beta (0.5,4.5), ρ ¼ 0:2
n KS Inverse chi Inverse norm Tippett Wilcoxon Logit
20 0.151 0.266 0.207 0.225 0.183 0.221
50 0.227 0.466 0.336 0.326 0.264 0.369
100 0.343 0.664 0.493 0.437 0.397 0.534
200 0.545 0.863 0.709 0.537 0.595 0.757
300 0.706 0.944 0.832 0.587 0.719 0.863
400 0.811 0.982 0.913 0.632 0.81 0.933
500 0.89 0.992 0.951 0.695 0.887 0.966
Correlated 0.6 Uniform (0,1) ± 0.4Beta (0.5,4.5), ρ ¼ 0:2
n KS Inverse chi Inverse norm Tippett Wilcoxon Logit
20 0.161 0.291 0.212 0.225 0.173 0.237
50 0.251 0.475 0.362 0.302 0.292 0.385
100 0.322 0.64 0.504 0.397 0.39 0.528
200 0.517 0.882 0.701 0.527 0.58 0.743
300 0.726 0.952 0.845 0.568 0.731 0.873
400 0.806 0.976 0.894 0.607 0.805 0.917
500 0.895 0.998 0.95 0.676 0.883 0.965
Correlated 0.9 Uniform (0,1) ± 0.1Beta (1,5), ρ ¼ 0:2
n KS Inverse chi Inverse norm Tippett Wilcoxon Logit
20 0.127 0.118 0.139 0.056 0.144 0.136
50 0.203 0.199 0.211 0.063 0.235 0.206
100 0.248 0.272 0.28 0.064 0.271 0.269
200 0.406 0.448 0.453 0.06 0.446 0.438
300 0.535 0.559 0.541 0.073 0.542 0.535
400 0.619 0.657 0.649 0.07 0.657 0.631
500 0.725 0.743 0.729 0.071 0.731 0.715
Dai et al. BioData Mining 2012, 5:3 Page 13 of 17http://www.biodatamining.org/content/5/1/3
small sample sizes and well controlled Type I error in ab-sence of GxG interactions makes these tests highly recom-mended in epistasis studies.Global testing has not been implemented in MDR ana-
lyses in the literature we have reviewed. Currently, research-ers rely on adjustment of individual p-values such as falsediscovery rate (FDR) as suggested by [31]. Due to highdimensionality in genetic interactions, the FDR and othermultiple testing adjustments often lose power in MDR ana-lyses. Some MDR studies [27] have utilized the false positivereport probability proposed by [32] but this method hasbeen pointed out by [33] to be heuristic and wrong in for-mulation. In contrast, the global tests proposed by this paperare based on rigorous statistical theories and inferences.Through extensive simulation on correlated p-values,
our study shows that the Inverse chi test is the mostpowerful approach to be incorporated with the filtrationtechniques to determine the optimal number of SNPs forthe final MDR analysis. The KS test might have high infla-tion of Type I errors when p-values are highly correlatedor when p-values peak near the center of histogram(Pattern 4). The Tippett’s test has very low powerwhen the effect size of Pattern 2 is small.We observe mild inflation of Type I error (<0.07) when
p-values are Uniform with a random correlation matrix.

Table 5 Power of six global tests of correlated P-values(The correlation coefficient for Beta random variables isρ. Uniform distributions have random correlationmatrices) (Continued)
Correlated 0.6 Uniform (0,1) ± 0.4Beta (1,5), ρ ¼ 0:2
n KS Inverse chi Inverse norm Tippett Wilcoxon Logit
20 0.572 0.56 0.599 0.117 0.611 0.587
50 0.893 0.864 0.904 0.104 0.917 0.891
100 0.991 0.981 0.986 0.114 0.991 0.981
200 1 1 0.999 0.091 1 0.999
300 1 1 1 0.109 1 1
400 1 1 1 0.111 1 1
500 1 1 1 0.085 1 1
Table 6 Power of six global tests of correlated P-values(The correlation coefficient for Beta random variables isρ Uniform distributions have random correlationmatrices)
Correlated 0.9 Uniform (0,1) ± 0.1Beta (0.4,6), ρ ¼ 0:8
n KS Inverse chi Inverse norm Tippett Wilcoxon Logit
20 0.19 0.402 0.285 0.329 0.204 0.323
50 0.293 0.654 0.458 0.547 0.324 0.514
100 0.41 0.833 0.644 0.665 0.48 0.7
200 0.705 0.963 0.856 0.785 0.693 0.901
300 0.864 0.989 0.943 0.861 0.834 0.956
400 0.934 0.996 0.967 0.878 0.862 0.978
500 0.962 0.999 0.989 0.914 0.928 0.994
Correlated 0.6 Uniform (0,1) ± 0.4Beta (0.4,6), ρ ¼ 0:8
n KS Inverse chi Inverse norm Tippett Wilcoxon Logit
20 0.848 0.968 0.913 0.787 0.837 0.924
50 0.994 0.999 0.998 0.922 0.989 0.998
100 1 1 0.999 0.956 0.999 0.999
200 1 1 1 0.987 1 1
300 1 1 1 0.993 1 1
400 1 1 1 0.992 1 1
500 1 1 1 0.994 1 1
Correlated 0.9 Uniform (0,1) ± 0.1Beta (0.5,4.5), ρ ¼ 0:8
n KS Inverse chi Inverse norm Tippett Wilcoxon Logit
20 0.145 0.282 0.199 0.243 0.158 0.237
50 0.281 0.491 0.376 0.345 0.296 0.409
100 0.374 0.686 0.532 0.425 0.418 0.573
200 0.598 0.874 0.734 0.531 0.627 0.771
300 0.774 0.951 0.866 0.579 0.767 0.89
400 0.855 0.975 0.914 0.641 0.836 0.936
500 0.938 0.993 0.962 0.635 0.91 0.977
Correlated 0.6 Uniform (0,1) ± 0.4Beta (0.5,4.5), ρ ¼ 0:8
n KS Inverse chi Inverse norm Tippett Wilcoxon Logit
20 0.149 0.287 0.221 0.217 0.178 0.242
50 0.265 0.518 0.4 0.334 0.323 0.438
100 0.421 0.693 0.539 0.434 0.438 0.575
200 0.604 0.856 0.726 0.485 0.644 0.754
300 0.778 0.951 0.858 0.582 0.761 0.886
400 0.871 0.978 0.931 0.612 0.858 0.942
500 0.921 0.981 0.948 0.658 0.901 0.957
Correlated 0.9 Uniform (0,1) ± 0.1Beta (1,5), ρ ¼ 0:8
n KS Inverse chi Inverse norm Tippett Wilcoxon Logit
20 0.157 0.147 0.158 0.066 0.154 0.154
50 0.192 0.234 0.231 0.069 0.222 0.22
100 0.32 0.355 0.347 0.064 0.344 0.34
200 0.491 0.521 0.501 0.061 0.502 0.488
300 0.655 0.698 0.663 0.068 0.651 0.652
400 0.776 0.784 0.754 0.068 0.751 0.741
500 0.847 0.844 0.82 0.072 0.823 0.802
Dai et al. BioData Mining 2012, 5:3 Page 14 of 17http://www.biodatamining.org/content/5/1/3
Our global tests are implemented for screening SNPs andinvestigators can continue to use multiplicity adjustmentalgorithms such as FDR to adjust individual p-values in thefinal MDR analysis to prevent false discoveries. As a result,slight inflation in Type I error (<0.07) is acceptable in prac-tice. Moreover, in our case study, we show that one canutilize the decreasing trend of global test results (Figure 4)to facilitate decision making. If global tests provided falsediscoveries, then the trend of global tests results would ran-domly fluctuate up and down. Figure 4 with a decreasingtrend for global testing results as well Figure 3 with histo-grams systematically switching to Pattern 2 can also serveas diagnostic tools to prevent false discoveries or selectionbias in global tests.It is worthwhile to point out the proposed global tests
can effectively prevent false discovery without losing thepower to detect significant GxG interactions. To preventthe false discovery, current MDR applications typicallychoose one optimal model for each k-way interaction.This method has two major drawbacks: firstly, the falsepositive discovery is not reduced by choosing one opti-mal model; secondly, choosing one optimal models mayoverlook other potential GxG interactions that also con-tributes to the disease susceptibility.The major contribution of our manuscript is to in-
corporate global testing procedures to MDR framework.Our proposed global tests will provide p-values to helppractitioners determine the appropriate number of SNPsto be remained in the final analysis. The current filtra-tion process does not provide p-values. Therefore, usingarbitrary cutoff value in the current process might leadto over-filtering or under-filtering of SNPs.All 6 global tests are based on statistical inference instead
of permutation. These 6 tests run very fast in a single com-puter. The major computational challenges are in the gen-eration of p-values for MDR through permutation tests butthis is not the major focus of our work. Several works havebeen devoted to improve the efficiency and shorten thecomputing time in MDR analysis in high-throughput data.
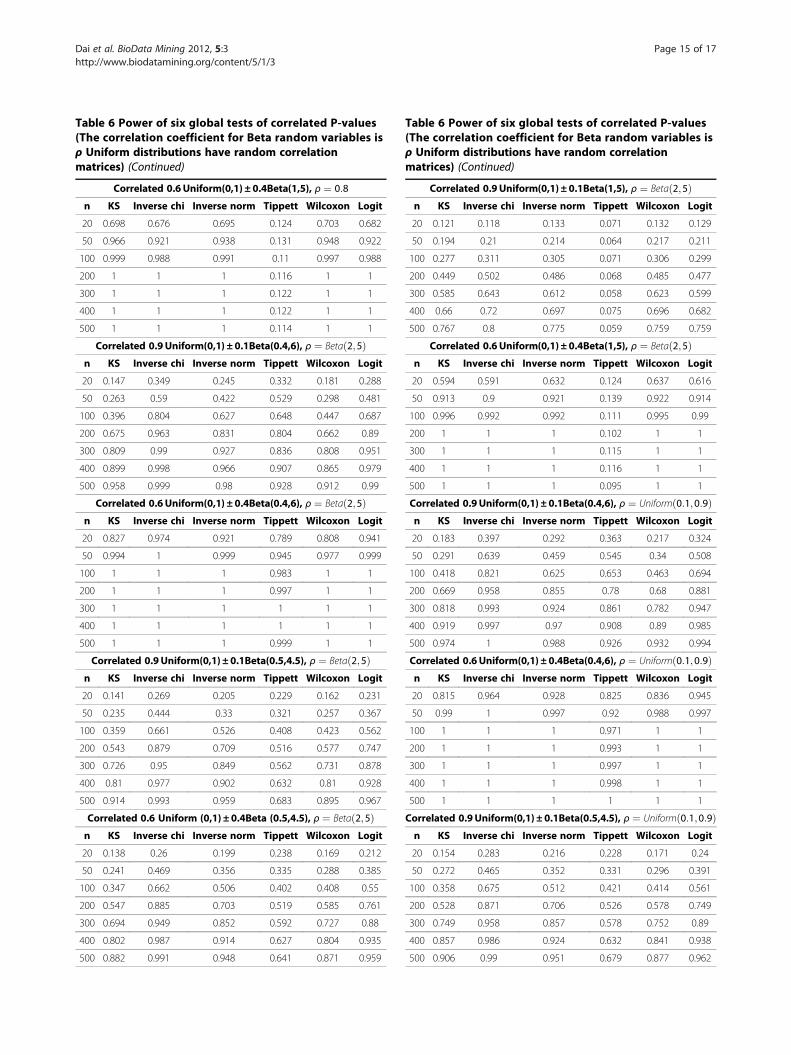
Table 6 Power of six global tests of correlated P-values(The correlation coefficient for Beta random variables isρ Uniform distributions have random correlationmatrices) (Continued)
Correlated 0.6Uniform(0,1) ± 0.4Beta(1,5), ρ ¼ 0:8
n KS Inverse chi Inverse norm Tippett Wilcoxon Logit
20 0.698 0.676 0.695 0.124 0.703 0.682
50 0.966 0.921 0.938 0.131 0.948 0.922
100 0.999 0.988 0.991 0.11 0.997 0.988
200 1 1 1 0.116 1 1
300 1 1 1 0.122 1 1
400 1 1 1 0.122 1 1
500 1 1 1 0.114 1 1
Correlated 0.9Uniform(0,1) ± 0.1Beta(0.4,6), ρ ¼ Beta 2;5ð Þn KS Inverse chi Inverse norm Tippett Wilcoxon Logit
20 0.147 0.349 0.245 0.332 0.181 0.288
50 0.263 0.59 0.422 0.529 0.298 0.481
100 0.396 0.804 0.627 0.648 0.447 0.687
200 0.675 0.963 0.831 0.804 0.662 0.89
300 0.809 0.99 0.927 0.836 0.808 0.951
400 0.899 0.998 0.966 0.907 0.865 0.979
500 0.958 0.999 0.98 0.928 0.912 0.99
Correlated 0.6Uniform(0,1) ± 0.4Beta(0.4,6), ρ ¼ Beta 2;5ð Þn KS Inverse chi Inverse norm Tippett Wilcoxon Logit
20 0.827 0.974 0.921 0.789 0.808 0.941
50 0.994 1 0.999 0.945 0.977 0.999
100 1 1 1 0.983 1 1
200 1 1 1 0.997 1 1
300 1 1 1 1 1 1
400 1 1 1 1 1 1
500 1 1 1 0.999 1 1
Correlated 0.9Uniform(0,1) ± 0.1Beta(0.5,4.5), ρ ¼ Beta 2;5ð Þn KS Inverse chi Inverse norm Tippett Wilcoxon Logit
20 0.141 0.269 0.205 0.229 0.162 0.231
50 0.235 0.444 0.33 0.321 0.257 0.367
100 0.359 0.661 0.526 0.408 0.423 0.562
200 0.543 0.879 0.709 0.516 0.577 0.747
300 0.726 0.95 0.849 0.562 0.731 0.878
400 0.81 0.977 0.902 0.632 0.81 0.928
500 0.914 0.993 0.959 0.683 0.895 0.967
Correlated 0.6 Uniform (0,1) ± 0.4Beta (0.5,4.5), ρ ¼ Beta 2;5ð Þn KS Inverse chi Inverse norm Tippett Wilcoxon Logit
20 0.138 0.26 0.199 0.238 0.169 0.212
50 0.241 0.469 0.356 0.335 0.288 0.385
100 0.347 0.662 0.506 0.402 0.408 0.55
200 0.547 0.885 0.703 0.519 0.585 0.761
300 0.694 0.949 0.852 0.592 0.727 0.88
400 0.802 0.987 0.914 0.627 0.804 0.935
500 0.882 0.991 0.948 0.641 0.871 0.959
Table 6 Power of six global tests of correlated P-values(The correlation coefficient for Beta random variables isρ Uniform distributions have random correlationmatrices) (Continued)
Correlated 0.9Uniform(0,1) ± 0.1Beta(1,5), ρ ¼ Beta 2;5ð Þn KS Inverse chi Inverse norm Tippett Wilcoxon Logit
20 0.121 0.118 0.133 0.071 0.132 0.129
50 0.194 0.21 0.214 0.064 0.217 0.211
100 0.277 0.311 0.305 0.071 0.306 0.299
200 0.449 0.502 0.486 0.068 0.485 0.477
300 0.585 0.643 0.612 0.058 0.623 0.599
400 0.66 0.72 0.697 0.075 0.696 0.682
500 0.767 0.8 0.775 0.059 0.759 0.759
Correlated 0.6Uniform(0,1) ± 0.4Beta(1,5), ρ ¼ Beta 2;5ð Þn KS Inverse chi Inverse norm Tippett Wilcoxon Logit
20 0.594 0.591 0.632 0.124 0.637 0.616
50 0.913 0.9 0.921 0.139 0.922 0.914
100 0.996 0.992 0.992 0.111 0.995 0.99
200 1 1 1 0.102 1 1
300 1 1 1 0.115 1 1
400 1 1 1 0.116 1 1
500 1 1 1 0.095 1 1
Correlated 0.9Uniform(0,1) ± 0.1Beta(0.4,6), ρ ¼ Uniform 0:1;0:9ð Þn KS Inverse chi Inverse norm Tippett Wilcoxon Logit
20 0.183 0.397 0.292 0.363 0.217 0.324
50 0.291 0.639 0.459 0.545 0.34 0.508
100 0.418 0.821 0.625 0.653 0.463 0.694
200 0.669 0.958 0.855 0.78 0.68 0.881
300 0.818 0.993 0.924 0.861 0.782 0.947
400 0.919 0.997 0.97 0.908 0.89 0.985
500 0.974 1 0.988 0.926 0.932 0.994
Correlated 0.6Uniform(0,1) ± 0.4Beta(0.4,6), ρ ¼ Uniform 0:1;0:9ð Þn KS Inverse chi Inverse norm Tippett Wilcoxon Logit
20 0.815 0.964 0.928 0.825 0.836 0.945
50 0.99 1 0.997 0.92 0.988 0.997
100 1 1 1 0.971 1 1
200 1 1 1 0.993 1 1
300 1 1 1 0.997 1 1
400 1 1 1 0.998 1 1
500 1 1 1 1 1 1
Correlated 0.9Uniform(0,1) ± 0.1Beta(0.5,4.5), ρ ¼ Uniform 0:1;0:9ð Þn KS Inverse chi Inverse norm Tippett Wilcoxon Logit
20 0.154 0.283 0.216 0.228 0.171 0.24
50 0.272 0.465 0.352 0.331 0.296 0.391
100 0.358 0.675 0.512 0.421 0.414 0.561
200 0.528 0.871 0.706 0.526 0.578 0.749
300 0.749 0.958 0.857 0.578 0.752 0.89
400 0.857 0.986 0.924 0.632 0.841 0.938
500 0.906 0.99 0.951 0.679 0.877 0.962
Dai et al. BioData Mining 2012, 5:3 Page 15 of 17http://www.biodatamining.org/content/5/1/3

Table 6 Power of six global tests of correlated P-values(The correlation coefficient for Beta random variables isρ Uniform distributions have random correlationmatrices) (Continued)
Correlated 0.6Uniform(0,1) ± 0.4Beta(0.5,4.5), ρ ¼ Uniform 0:1;0:9ð Þn KS Inverse chi Inverse norm Tippett Wilcoxon Logit
20 0.137 0.282 0.2 0.228 0.159 0.234
50 0.237 0.484 0.359 0.306 0.293 0.392
100 0.345 0.679 0.503 0.411 0.416 0.544
200 0.577 0.858 0.719 0.512 0.6 0.757
300 0.725 0.946 0.848 0.584 0.743 0.873
400 0.868 0.981 0.92 0.621 0.85 0.931
500 0.9 0.989 0.947 0.676 0.869 0.959
Correlated 0.9Uniform(0,1) ± 0.1Beta(1,5), ρ ¼ Uniform 0:1;0:9ð Þn KS Inverse chi Inverse norm Tippett Wilcoxon Logit
20 0.141 0.166 0.16 0.078 0.155 0.155
50 0.213 0.224 0.235 0.054 0.251 0.232
100 0.318 0.362 0.364 0.073 0.365 0.362
200 0.477 0.525 0.498 0.047 0.503 0.485
300 0.621 0.651 0.637 0.071 0.622 0.621
400 0.718 0.747 0.721 0.071 0.708 0.707
500 0.804 0.818 0.794 0.075 0.785 0.78
Correlated 0.6Uniform(0,1) ± 0.4Beta(1,5), ρ ¼ Uniform 0:1;0:9ð Þn KS Inverse chi Inverse norm Tippett Wilcoxon Logit
20 0.694 0.656 0.705 0.109 0.721 0.685
50 0.938 0.901 0.929 0.125 0.94 0.915
100 0.994 0.989 0.991 0.114 0.995 0.99
200 1 1 1 0.143 1 1
300 1 0.999 1 0.113 1 1
400 1 1 1 0.122 1 1
500 1 1 1 0.119 1 1
Uniform distributions have random correlation matrices).
Dai et al. BioData Mining 2012, 5:3 Page 16 of 17http://www.biodatamining.org/content/5/1/3
We will defer interested readers to the corresponding cita-tions for computing issues in high-throughput MDR ana-lysis. These computational limitations make our strategyappropriate in large scale candidate gene studies, but maybe limited in application to genome-wide association stud-ies until further improvements in computing speed are rea-lized or very large-scale computing resources are available.MDR permutation computing time is largely dependent
on the dimension of data sets. In other words, the comput-ing time increases as the number of SNPs and/or the num-ber of subjects increases. Interestingly, the dimension ofdata does little impact on the computing time of globaltests. The computing time for global tests of 1000 p-valuesis very close to tests of 10 p-values. Several filtrationapproaches have been proposed and some (ReliefF, SURFand TuRF etc.) have been implemented in the MDR soft-ware (http://www.epistasis.org). In this work, we utilizeReliefF for filtration. There have been other filtration
techniques proposed in literature. For instance, [34] intro-duced entropy-based information gain to search and evalu-ate interactions among risk factors. The current MDRsoftware [8] provides ReliefF, entropy, chi-square test, etc.about 10 filtration methods. The global tests could be inte-grated in the workflow with other filtration techniques, al-though the comparison and evaluation of all filtrationtechnique requires more research attention.
Appendix 1Simulation of correlated p-valuesWe generate correlated Beta variables using the method
proposed by [30]. According to Bayesian theory, randomvariables from a Beta prior and a Beta-Binomial conjugatefunction will yield correlated random deviates whose mar-ginal distribution is also Beta. Firstly, randomly generate avariable K from K e Beta� Binomial v;α;βð Þ where α andβ are the shape parameters. Conditioning on K ¼ k , gener-ate P deviates from Beta αþ k;vþ β� 1ð Þ . By integratingon K, the P deviates have unconditional marginal distribu-tion as Beta α;βð Þ and the correlation coefficient among Pdeviates is ρ ¼ v= vþ αþ βð Þ . In this paper, we simulateddifferent correlation coefficient with constant ρ ¼ 0:2;08or ρ as a random variable from ρ e Beta 2;5ð Þ andρ eUniform 0:1;0:9ð Þ respectively.In the above method, ρ ¼ v= vþ αþ βð Þ can be written
as v ¼ αþ βð Þρ= 1� ρð Þ but algorithm to generate Beta-Binomial with non-integer v is not widely available. As aresult, we use an alternative method to generate correlateduniform distributions . In essence, correlated uniform vari-ables, U, with a random correlation matrix Σ can be gener-ated by transforming multivariate normal variables X usingformula U ¼ F Xð Þ where F is the CDF of the standardnormal distribution. First, we generated a positive definitecovariance matrix, Σ0 with randomly selected eigenvaluesand randomly generated orthogonal matrix as eigenvectors(R clusterGeneration package). Let σij be the component inΣ0. We can convert the covariance matrix, Σ0 to correl-ation matrix Σ with components rij ¼ σ ijffiffiffiffiffiffiffi
σ iiσ jjp . To ensure the
correlation is invariant to transformation, we need to ad-
just correlation matrix Σ intoPadj ¼ 2 sin π
P=6ð Þ . Per-
form Choleski factorization to generate C ¼ Padj� 1
2.
Generate a vector of i.i.d. standard normal variables, X0.Let X ¼ X0∗C and U ¼ F Xð Þ. As a result, the variables Uare correlated uniform variables with correlation matrix Σ.
Competing interestsThere are no competing interests to this work.
Authors’ contributionsHD and MB conceived of the study. AMR aided in study design and MDRmethod. HD and AMR performed the simulations and data analysis. MB, RG,and SL performed the clinical data collection, genotyping and interpretation
Dai et al. BioData Mining 2012, 5:3 Page 17 of 17http://www.biodatamining.org/content/5/1/3
of case study findings. All authors contributed to the manuscript writing. Allauthors read and approved the final manuscript.
AcknowledgementsThis work is supported for collaboration between HD and AMR by BursaryAward of the 1st Short Course on Statistical Genetics and Genomics fromUniversity of Alabama at Birmingham from the National Institute of HealthR25GM093044 (PI: Tiwari). We are grateful to two reviewers whosecomments have helped us improve the manuscript.
Author details1Department of Medical Research, Children’s Mercy Hospital, 2401 GillhamRoad, Kansas City, MO 64108, USA. 2Department of Mathematics, ColumbusState University, 4225 University Avenue, Columbus, GA 31907, USA. 3Divisionof Clinical Pharmacology and Medical Toxicology, Department of Pediatrics,Children’s Mercy Hospital, 2401 Gillham Road, Kansas City, MO 64108, USA.4Bioinformatics Research Center, Department of Statistics, North CarolinaState University, 1 Lampe Dr, Raleigh, NC 27695-7566, USA.
Received: 17 January 2012 Accepted: 19 April 2012Published: 22 May 2012
References1. Moore JH, Williams SM: Traversing the conceptual divide between
biological and statistical epistasis: systems biology and a more modernsynthesis. Bioessays 2005, 27(6):637–646.
2. Motsinger AA, Ritchie MD, Reif DM: Novel methods for detecting epistasisin pharmacogenomics studies. Pharmacogenomics 2007, 8(9):1229–1241.
3. Ritchie MD, Hahn LW, Roodi N, Bailey LR, Dupont WD, Parl FF, Moore JH:Multifactor-dimensionality reduction reveals high-order interactionsamong estrogen-metabolism genes in sporadic breast cancer. Am J HumGenet 2001, 69(1):138–147.
4. Moore JH: Detecting, characterizing, and interpreting nonlinear gene-gene interactions using multifactor dimensionality reduction. Adv Genet2010, 72:101–116.
5. Greene CS, Penrod NM, Kiralis J, Moore JH: Spatially uniform relieff (SURF)for computationally-efficient filtering of gene-gene interactions. BioDataMin 2009, 2(1):5.
6. Moore JH, White BC: Tuning relieff for genome-wide genetic analysis.Lecture Notes in Computer Science 2007, 4447:166–175.
7. Robnik-Sikonja, Igor K: Theoretical and empirical analysis of ReliefF andRReliefF. Machine Learning Journal 2003, 53:23–69.
8. Hahn LW, Ritchie MD, Moore JH: Multifactor dimensionality reductionsoftware for detecting gene-gene and gene-environment interactions.Bioinformatics 2003, 19(3):376–382.
9. Winham SJ, Motsinger-Reif AA: An R package implementation ofmultifactor dimensionality reduction. BioData Min 2011, 4(1):24.
10. Oki N, Motsinger-Reif A: Multifactor dimensionality reduction as a filterbased approach for genome wide association studies. Frontiers in Genetics2011, 2:80.
11. Birnbaum ZW, Tingey FH: One-sided confidence contours for probabilitydistribution functions. The Annals of Mathematical Statistics 1951,22(4):592–596.
12. Fisher RA: Statistical methods for research workers. London: Oliver & Boyd; 1932.13. Mudholkar GS, George EO: The logit statistic for combining
probabilities - an overview. In Optimizing Methods in Statistics 1979,Ed.J.S. Rustagi:345–365.
14. Myles H, Wolfe DA: Nonparametric statistical methods. 2nd edition. NewYork: Wiley; 1999.
15. Tippett L: The methods of statistics. London: Williams & Norgate; 1931.16. Wilkinson B: A statistical consideration in psychological research.
Psychological Bulletin 1951, 48:156–158.17. Sakoda JM, Cohen BH, Beall G: Test of significance for a series of statistical
tests. Psychological Bulletin 1954, 51(2):172–175.18. Helmick CG, Felson DT, Lawrence RC, Gabriel S, Hirsch R, Kwoh CK, Liang
MH, Kremers HM, Mayes MD, Merkel PA, et al: Estimates of the prevalenceof arthritis and other rheumatic conditions in the United States. Part I.Arthritis Rheum 2008, 58(1):15–25.
19. Becker ML, Rose CD, Cron RQ, Sherry DD, Bilker WB, Lautenbach E:Effectiveness and toxicity of methotrexate in juvenile idiopathic arthritis:comparison of 2 initial dosing regimens. J Rheumatol 2010, 37(4):870–875.
20. Chabner BA, Allegra CJ, Curt GA, Clendeninn NJ, Baram J, Koizumi S, DrakeJC, Jolivet J: Polyglutamation of methotrexate. Is methotrexate aprodrug? J Clin Invest 1985, 76(3):907–912.
21. Stamp LK, Barclay ML, O'Donnell JL, Zhang M, Drake J, Frampton C,Chapman PT: Effects of changing from oral to subcutaneousmethotrexate on red blood cell methotrexate polyglutamateconcentrations and disease activity in patients with rheumatoid arthritis.J Rheumatol 2011, 38(12):2540–2547.
22. Dolezalova P, Krijt J, Chladek J, Nemcova D, Hoza J: Adenosine andmethotrexate polyglutamate concentrations in patients with juvenilearthritis. Rheumatology (Oxford) 2005, 44(1):74–79.
23. Allegra CJ, Chabner BA, Drake JC, Lutz R, Rodbard D, Jolivet J: Enhancedinhibition of thymidylate synthase by methotrexate polyglutamates.J Biol Chem 1985, 260(17):9720–9726.
24. Baggott JE, Vaughn WH, Hudson BB: Inhibition of 5-aminoimidazole-4-carboxamide ribotide transformylase, adenosine deaminase and5'-adenylate deaminase by polyglutamates of methotrexate andoxidized folates and by 5-aminoimidazole-4-carboxamide ribosideand ribotide. Biochem J 1986, 236(1):193–200.
25. Cronstein BN, Naime D, Ostad E: The antiinflammatory mechanism ofmethotrexate. Increased adenosine release at inflamed sites diminishesleukocyte accumulation in an in vivo model of inflammation. J Clin Invest1993, 92(6):2675–2682.
26. Hinks A, Moncrieffe H, Martin P, Ursu S, Lal S, Kassoumeri L, Weiler T, GlassDN, Thompson SD, Wedderburn LR, et al: Association of the5-aminoimidazole-4-carboxamide ribonucleotide transformylase genewith response to methotrexate in juvenile idiopathic arthritis. Ann RheumDis 2011, 70(8):1395–1400.
27. Dervieux T, Wessels JA, van der Straaten T, Penrod N, Moore JH, GuchelaarHJ, Kremer JM: Gene-gene interactions in folate and adenosinebiosynthesis pathways affect methotrexate efficacy and tolerability inrheumatoid arthritis. Pharmacogenet Genomics 2009, 19(12):935–944.
28. Dervieux T, Wessels JA, Kremer JM, Padyukov L, Seddighzadeh M,Saevarsdottir S, van Vollenhoven RF, Klareskog L, Huizinga TW, Guchelaar HJ:Patterns of interaction between genetic and nongenetic attributes andmethotrexate efficacy in rheumatoid arthritis. Pharmacogenet Genomics2012, 22(1):1–9.
29. Hotelling H, Pabst MR: Rank correlation and tests of significance involvingno assumption of normality. Annals of Mathematical Statistics 1936,7:29–43.
30. Minhajuddin ATM, Harris IR, Schucany WR: Simulating multivariatedistributions with specific correlations. Journal of Statistical Computationand Simulation 2004, 74(8):599–607.
31. Benjamini Y, Hochberg Y: Controlling the false discovery rate: a practicaland powerful approach to multiple testing. J Roy Stat Soc Ser B 1995,57:289–833.
32. Wacholder S, Chanock S, Garcia-Closas M, El Ghormli L, Rothman N:Assessing the probability that a positive report is false: an approach formolecular epidemiology studies. J Natl Cancer Inst 2004, 96(6):434–442.
33. Lucke JF: A critique of the false-positive report probability. Geneticepidemiology 2009, 33(2):145–150.
34. Moore JH, Gilbert JC, Tsai CT, Chiang FT, Holden T, Barney N, White BC: Aflexible computational framework for detecting, characterizing, andinterpreting statistical patterns of epistasis in genetic studies of humandisease susceptibility. J Theor Biol 2006, 241(2):252–261.
35. Poonkuzhali B, Lamba J, Storm S, Sparreboom A, Thummel K, Watkins P,Schuetz E: Association of breast cancer resistance protein/ABCG2phenotypes and novel promoter and intron 1 single nucleotidepolymorphisms. Drug metab Dispos 2008, 36(4):780–795.
doi:10.1186/1756-0381-5-3Cite this article as: Dai et al.: Global tests of P-values for multifactordimensionality reduction models in selection of optimal number oftarget genes. BioData Mining 2012 5:3.